Embed Size (px)
Citation preview

Does Firm Innovation Affect Corporate Social Responsibility?
Rui Shen Yi Tang Ying Zhang
Working Paper 16-096
Working Paper 16-096
Copyright © 2016 by Rui Shen, Yi Tang, and Ying Zhang
Working papers are in draft form. This working paper is distributed for purposes of comment and discussion only. It may not be reproduced without permission of the copyright holder. Copies of working papers are available from the author.
Does Firm Innovation Affect Corporate Social Responsibility?
Rui Shen Nanyang Technological University
Yi Tang Hong Kong Polytechnic University
Ying Zhang Harvard Business School

1
Does Firm Innovation Affect Corporate Social Responsibility?*
Rui Shen Division of Accountancy
Nanyang Technological University Singapore
Yi Tang Department of Management and Marketing
Hong Kong Polytechnic University Hung Hom, Kowloon
Hong Kong [email protected]
Ying Zhang Harvard Business School
Boston, USA
Rotterdam School of Management, Erasmus University Rotterdam, the Netherlands
* The authors contributed equally and the authorship was listed alphabetically.
2
Does Firm Innovation Affect Corporate Social Responsibility?
Abstract
This study examines the relationship between firm innovation and CSR. Stakeholders’ concern
over transaction-specific investments exacerbates when firms engage heavily in innovation
activities. To secure stakeholders’ support, firms adopt CSR effectively as an ex ante signal of
sustainability and goodwill. As CSR is endogenous to a firm’s innovation activities, we rely on
an instrumental variable (IV) approach to test our hypothesis. Using a sample of 3,315 U.S.
publicly-listed firms from 2001 through 2011, we find that more innovative firms also engage
more in CSR activities. This effect is stronger for firms of higher risk and/or operating in a less
munificent environment. Additionally, firms with higher innovation reap greater financial
benefits from their CSR activities.
Keywords: Corporate social responsibility, Firm innovation, Transaction-specific investments,
Firm risk, Environmental munificence
3
INTRODUCTION
Strategic management research has been giving increasing thoughts to the role of corporate
social responsibility (CSR) in a firm’s long-term competitive advantage (e.g. Berman et al.,
1999; Choi and Wang, 2009; Du, Bhattacharya, and Sen, 2011; Flammer, 2014; Waddock and
Graves, 1997; Wang and Qian, 2011). CSR reflects the extent to which a firm actively engages
in social initiatives in response to a diverse set of stakeholder interests (Carroll, 1979; Mattingly
and Berman, 2006; McWilliams and Siegel, 2001; Wood, 1991). Given the broad influence of
CSR in a firm’s strategy and performance, it is important to understand what factors drive a
firm’s engagement in CSR (Brammer and Millington, 2008). Research has shown that firms use
CSR to enhance their reputation and social image (Godfrey, 2005) so as to effectively
differentiate themselves from other firms (McWilliams and Siegel, 2001). However, the potential
connection between CSR and other business strategy has not been thoroughly investigated. To
better understand this link, we examine whether a firm’s innovation may affect its engagement in
CSR.
Innovation has been considered as a key factor determining a firm’s ability to sustain its
competitive advantages nowadays (Brown and Eisenhardt, 1995; Miller, Fern, and Cardinal,
2007; Wadhwa and Kotha, 2006). A firm’s capability to innovate helps the firm better respond to
the fast and abrupt environmental changes (Daft, 1982; Eisenhardt and Brown, 1998; Grossman
and Helpman, 1994; Schumpeter, 1942). Although abundant attention has been paid to the
antecedents of firm innovation (Makri, Lane, and Gomez-Mejia, 2006; Miller and Toulouse,
1986; Yadav, Prabhu, and Chandy, 2007; Young, Charns, and Shortell, 2001), limited efforts
have been devoted to examining whether or not innovation may influence a firm’s other strategic
choice. Indeed innovation can be a help as well as a hamper for the firm. We propose that the
4
same characteristics of innovation that often enable firms to have competitive advantage in
markets (Miller et al., 2007) may also lead to a severe problem of information asymmetry among
firms and stakeholders.
Innovation is inherently highly risky (Drucker, 1985) and requires a lot of firm-specific
investments (Helfat, 1994). Stakeholders that closely deal with firms of high innovation also
need to invest in transaction-specific assets whose return is very uncertain. In addition, firms’
innovation activities are highly complex in nature, and stakeholders may have very little control
of the process. Information asymmetry between firms and stakeholders exacerbates when firms
engage more in innovation activities. In this regard, stakeholders may develop a strong concern
over any transaction-specific investment with the focal firm. Therefore, ex ante contracting with
a highly innovative firm, potential stakeholders such as employees and suppliers will consider
whether transaction-specific investments including human capital, skills/technology, equipment
and facilities can generate enough returns for them. Due to their transaction-specific investments,
it is simply too costly for stakeholders to terminate a contract once established with the firm
(Hart and Moore, 1988). If a firm is not sustainable, any transaction-specific investment will be
wasted in a long run, theoretically, in which case the stakeholders would rather not engage with
the firm in the first place. Therefore, stakeholders face a severe information asymmetry problem
when they are dealing with a highly innovative firm. This concern may not be serious for
stakeholders of firms not engaging in innovation because they would not be asked to make
transaction-specific investments in the first place.
We argue that potential stakeholders’ concern over transaction-specific investments in
innovative firms will motivate firms to engage more in CSR. CSR can reduce information
asymmetry between the firm and its stakeholders by serving as a credible signal of firm
5
sustainability ex ante contracting. Stakeholders’ concern over transaction-specific investments
can be relieved as CSR can signal the firm’s sustainability.
With a sample of 3,315 U.S. publicly-listed firms during the period from 2001 to 2011, we
provide evidence that firms featuring greater innovation record a higher level of CSR. Our
results are robust to controlling for the potential endogeneity issue and to alternative measures of
innovation and CSR. We also find that the relationship becomes stronger when the internal or
external environment causes information asymmetry to worsen, such as when the firm’s risk
level is higher or when the firm is operating in a less munificent market. We further show that
CSR brings more financial benefits to firms exhibiting greater innovation.
This study makes significant contributions to the existing literature. First, the existing
research on the drivers of CSR has mostly paid attention to leadership (Briscoe, Chin, and
Hambrick, 2014; Chin, Hambrick, and Trevino, 2013; Marquis and Lee, 2013; Tang et al., 2015),
firm internal resources (Johnson and Greening, 1999; McWilliams and Siegel, 2000; Waddock
and Graves, 1997), and external environment factors (Flammer, 2014; Marquis, Davis and
Glynn, 2013; Tilcsik and Marquis, 2013). Little is known about whether and if yes, how firm
innovation would affect CSR. We complement the existing literature by showing that a firm’s
innovation may significantly determine its CSR participation. Therefore this study establishes a
direct link between CSR research and the literature on firm innovation.
Second, we contribute to the stakeholder management research by offering refreshing
evidence on the signalling role of CSR in better managing firm–stakeholder relationships.
Previous research has highlighted CSR’s instrumental role in gaining support from stakeholders
(Freeman, 1984), or as an insurance against potential threats (Godfrey, Merrill, and Hansen,
2009; Koh et al., 2013), or in signalling a firm’s product quality (Fisman, Heal, and Nair, 2008;

6
Servaes and Tamayo, 2013). Scant attention has been paid to such a question as whether CSR
can help reduce information asymmetry among innovative firms and stakeholders. Our study
suggests that CSR can be a signal received and interpreted by stakeholders before contracting,
which can help relieve stakeholders’ concerns over transaction-specific investments in the firm.
Lastly, we also add important knowledge to the firm innovation literature by exploring the
potential costs imposed on stakeholders by a firm’s innovation activities. Innovation can afford
competitive advantage to the firm (Eisenhardt and Brown, 1998; Wadhwa and Kotha, 2006), yet
it can also make stakeholders who make transaction-specific investments to bear costs. Our
results suggest that firms that give a strategic priority to innovation can employ CSR as an
effective means to reduce information asymmetry among themselves and stakeholders, thus
easing the latter’s concerns. In a sense, the linkage between firm innovation and CSR suggests
that CSR is unlikely an independent strategy, but instead can interact with other strategic actions
to form a cohesive whole. In addition, our findings also help reconcile the mixed finding on the
relationship between CSR and firm financial performance (for a review, see Margolis and Walsh,
2003; Orlitzky et al., 2003). It seems that those firms with a higher level of innovation can reap
more financial benefits from their CSR engagements.
THEORY AND HYPOTHESES
Firm Innovation and CSR
According to the knowledge-based view (Grant, 1996; Kogut and Zander, 1992), differences in
innovative capabilities determine differences in firm performance. Innovation in the form of a
unique and superior combination of firm resources may bring considerable benefits to the focal
firm (Schumpeter, 1934). However, the same characteristics of innovation that help firms obtain
competitive advantages in markets (Wadhwa and Kotha, 2006) may also exacerbate information

7
asymmetry among firms and their stakeholders. This is largely due to the fact that stakeholders
who closely deal with a firm of greater innovation have to make more transaction-specific
investments.
Helfat (1994) has insightfully pointed out that innovation requires firm-specific
investments. First, innovation involves a significant portion of tacit knowledge, which cannot be
communicated precisely using words, numbers, or pictures, and which therefore is difficult to
codify. Over time, these communication codes and coordination processes will evolve into
“dynamic routines” (Dosi et al., 1992), which largely contribute to the firm-specificity of
innovation. Second, innovation involves learning, which is cumulative and path-dependent
(Cohen and Levinthal, 1990; Dosi et al., 1992). As a result, the direction of innovation depends
on the nature of the accumulated knowledge base, reinforcing the firm-specificity of innovation
(Helfat, 1994). Therefore, firm innovation demands a lot of firm-specific assets.
Stakeholders that closely deal with a firm of great innovation may have to cope with
investing in complementary firm-specific assets, which imply a lot of transaction-specific
investments. Transaction-specific investments involve investments in human, physical, and
technical capital that cannot be redeployed without losing productive value (Williamson, 1975,
1981). Because transaction-specific investments limited economic value in alternative settings,
stakeholders whose investments have a substantial transaction-specific component are
constrained in their transactions with the focal firm (Williamson, 1981). Moreover, writing and
enforcing contracts associated with transaction-specific investments is generally difficult (Hart,
1995). As a result, stakeholders’ investment in transaction-specific assets demanded by
innovation likely leaves them vulnerable to opportunistic behavior by the firm of great
innovation (Klein, Crawford, and Alchian, 1978; Williamson, 1981). For example, in 1970, Intel
8
planned to invest in developing the first semiconductor DRAM (dynamic random access
memory), the 1 kilobit ‘1103’, which was no doubt a significant piece of innovation. However,
Intel’s engineers were seriously concerned about the potential negative consequences of
developing knowledge and skills specific to DRAM technology. ‘There was a lot of resistance to
semiconductor technology on the part of the core memory engineers. The engineers didn’t
embrace the 1103 until they realized that it wouldn’t make their skills irrelevant’ (Cogan and
Burgelman, 1989: 2-3). Similarly, the suppliers and distributors need to invest in specialized
equipment and facilities that may be less useful for other products; customers will find it difficult
to accept an alternative product once they have purchased a highly innovative product. The Intel
example shows while innovation can generate competitive advantage for firms, it is also likely to
give rise to stakeholders’ reluctance to invest in the necessary transaction-specific assets because
such investment can put them in a potentially vulnerable position. Once stakeholders make
transaction-specific investments, it is difficult for them to use such investments for other
purposes. Therefore, stakeholder must be convinced the firm with whom they are contracting is
sustainable and of goodwill. Without sufficient trust in a firm’s sustainability and goodwill,
stakeholders will be reluctant to commit to such transaction-specific investments and so will be
their support to focal firm.
Firms of great innovation can relieve their stakeholders’ concerns and obtain their support
by signalling their sustainability and goodwill. According to the signalling theory, effective
signals must meet two interrelated criteria: first, they must be observable; second, they must be
sufficiently costly so that only the truly sustainable firms can afford to give them (Spence, 1974;
Stiglitz, 1985; Bergh and Gibbons, 2011).
9
We propose that CSR can meet these two criteria and function effectively as a credible
signal. First, firms with a good CSR record are able to establish a good social image in the eyes
of stakeholders through accumulating moral capital (Godfrey, 2005). A good social image can in
turn help identify emerging problems, prevent fraud, preserve corporate reputation, and minimize
any penalty when transgression occurs (Francis and Armstrong, 2003). Accumulating moral
capital through CSR engagement can attract more positive attention from all kinds of
stakeholders (Godfrey et al., 2009). Therefore, CSR as a signal is highly observable to
stakeholders. Second, CSR can effectively separate firms having different levels of
sustainability. CSR is costly and requires a lot of firm resources (Freeman, 1984) and it may be a
while before it would generate any financial benefits for the firm (Berman et al., 1999; Hillman
and Keim, 2001). Indeed some existing findings suggest that CSR may actually hurt a firm’s
short-term market value (e.g., Di Giuli and Kostovetsky, 2014). Therefore CSR could be a very
costly and unrewarding investment for unsustainable firms. By contrast, a sustainable firm would
find CSR less costly because the benefits from CSR in the long run should outweigh the short-
term cost. So CSR as a signal can effectively separate sustainable firms from unsustainable ones.
Once the firm has initiated a transaction with a stakeholder, CSR can help further reduce
stakeholders’ concern over transaction-specific investments as expropriating this stakeholder
would damage the firm’s social image. As it takes time to build up a good social image through
engagement in CSR and any CSR engagement can be very costly, it would make little business
sense for firms to ruin a good social image by acting irresponsibly toward their stakeholders.
In sum, innovation exposes stakeholders to potential risks arising from information
asymmetry among themselves and firms of high innovation. Stakeholders want to make sure that
the firms they are doing business with are sustainable and responsible. In order to relieve

10
stakeholders’ concerns over their transaction-specific investments, firms of high innovation are
motivated to signal their sustainability and take their responsibility seriously through actively
engaging in CSR. This reasoning leads to our Hypothesis 1.
Hypothesis 1: Firm innovation has a positive effect on CSR.
Moderating effects of firm risk and market munificence
Identifying the boundary condition of the aforementioned relationship would lend greater
credence to the proposed information asymmetry mechanism. As explained earlier, firms of high
innovation engage in CSR activities to ease the information asymmetry among firms and the
stakeholders. Therefore those internal and external factors that influence the information
asymmetry should moderate the main effect. An innovative firm’s incentives to participate in
CSR activities should be stronger if information asymmetry among firms and stakeholders
exacerbates. We conjecture that stakeholders have more concerns when they are investing in
firms with higher financial risk and firms operating in a less munificent industry (hence greater
environmental risk).
Firm financial risk
We measure firm financial risk by a firm’s financial leverage, which reflects its ratio of debt to
total equity. Since a greater debt ratio implies lower borrowing ability, firms with high financial
leverage are more likely to default or go bankrupt (Bromiley, 1991). Naturally stakeholders will
have more concerns over the sustainability of such firms. In addition, higher leverage can induce
greater moral hazard problems such as risk shifting (e.g., managers may take on low-value but
risky projects because of limited liability) (Jensen and Meckling, 1976) and debt overhanging
(e.g., managers may stop making an effort because of liquidation threat) (Myers, 1977). Thus the
risk is greater for stakeholders who invest in firms with higher financial leverage because of
11
exacerbated information asymmetry. In such a situation, the benefits of CSR as a way to reduce
information asymmetry for firms of high innovation are stronger as is their motivation to engage
in CSR. Therefore we predict that:
Hypothesis 2: The positive effect of firm innovation on CSR is stronger for firms having a higher financial leverage.
Market munificence
Market munificence measures a firm’s task environment’s capacity to support sustained growth
(Dess and Beard, 1984). A munificent market provides more opportunities to firms (Hambrick
and Finkelstein, 1987). Information asymmetry among firms and stakeholders becomes more
severe in a less munificent market. For instance, in an adverse market, it is very difficult for
stakeholders to predict a firm’s sustainability and to build accurate and verifiable performance
measures for the firm. Meanwhile, because of the adversity in the operating environment, the
firm may have more leeway to expropriate the stakeholders. Thus stakeholders have reason to
worry even more about the potential risks of their transaction-specific investments. In such a
situation, CSR can benefit firms of high innovation by reducing information asymmetry. In
contrast, when the market is munificent, stakeholders’ concern will be significantly reduced.
Thus these firms have weaker motivation to engage in CSR when market munificence is higher.
Therefore we predict that:
Hypothesis 3: The positive effect of firm innovation on CSR is weaker when market munificence is higher.
METHOD
Sample
We obtain CSR information from Kinder, Lydenberg, Domini & Co., Inc. (KLD) for the period
from 2001 to 2011. KLD data are considered to be among the best data available to construct a
12
comprehensive measure of CSR (e.g., Choi and Wang, 2009; Hillman and Keim, 2001; Waddock
and Graves, 1997). We merge the KLD data with Compustat data to extract more financial
information of the sampled firms. We include only firms with industry classification information
(SIC code). We exclude firms in the financial industry (SIC codes: 6000-6999) and the regulated
utilities industry (SIC codes: 4900-4999) because their products/services are not comparable to
those provided by firms in other industries. We further exclude penny firms (share price less than
1 dollar). We make sure to include only firms that have valid data for all key variables and
control variables. Our final sample contains 18,912 firm-year observations involving 3,315
unique firms.
Measures
Corporate social responsibility (CSR)
There are 13 categories of CSR activities in the KLD database. Following Servaes and Tamayo
(2013), we remove the corporate governance dimension from our CSR measure because
corporate governance is mainly concerned with how shareholders discipline or reward their
managers. We also exclude categories related to a specific product and industry as we are trying
to examine how product strategy affects CSR and firms cannot easily alter their industry or
products given their product strategy. Therefore, our CSR measure at year t is based on five
dimensions from the KLD data: community, diversity, employee relations, environment, and
human rights (Servaes and Tamayo, 2013).
As each of the five dimensions involves a number of strengths and concerns, the total
number of concerns is subtracted from the total number of strengths to arrive at a net score for
each dimension. One methodological challenge is that in the KLD ratings, the evaluation criteria
vary across the five dimensions and over the years. For instance, for the community dimension, a
13
firm’s strengths are evaluated on seven aspects, while the concerns are assessed on four aspects.
We follow Servaes and Tamayo (2013) and address this challenge as follows: for each firm year,
we scale the strengths (concerns) by the maximum possible number of strengths (concerns)
applicable in each category-year.1 This procedure gives us an index of strengths (concerns)
between 0 and 1 for each firm-year. We then take the difference between the strength index and
the concern index to obtain our net CSR measure.2
Firm innovation
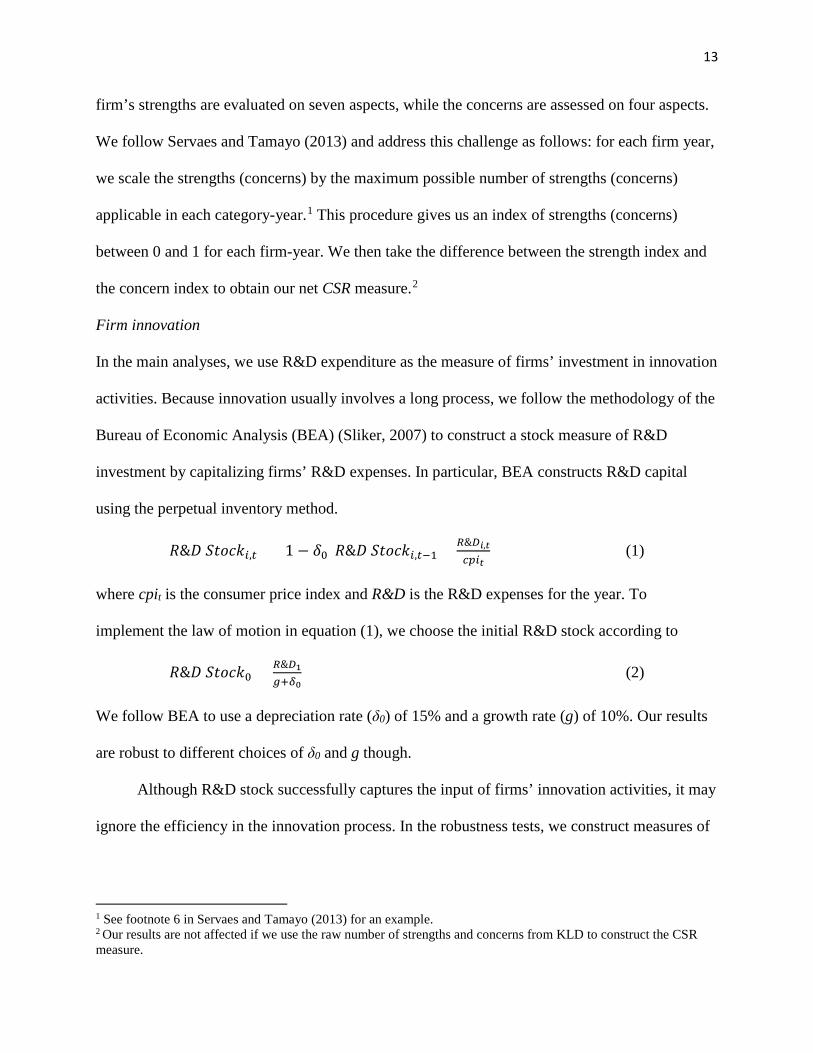
In the main analyses, we use R&D expenditure as the measure of firms’ investment in innovation
activities. Because innovation usually involves a long process, we follow the methodology of the
Bureau of Economic Analysis (BEA) (Sliker, 2007) to construct a stock measure of R&D
investment by capitalizing firms’ R&D expenses. In particular, BEA constructs R&D capital
using the perpetual inventory method.
𝑅𝑅&𝐷𝐷 𝑆𝑆𝑆𝑆𝑆𝑆𝑆𝑆𝑆𝑆𝑖𝑖,𝑡𝑡 = (1 − 𝛿𝛿0)𝑅𝑅&𝐷𝐷 𝑆𝑆𝑆𝑆𝑆𝑆𝑆𝑆𝑆𝑆𝑖𝑖,𝑡𝑡−1 + 𝑅𝑅&𝐷𝐷𝑖𝑖,𝑡𝑡𝑐𝑐𝑐𝑐𝑖𝑖𝑡𝑡
(1)
where cpit is the consumer price index and R&D is the R&D expenses for the year. To
implement the law of motion in equation (1), we choose the initial R&D stock according to
𝑅𝑅&𝐷𝐷 𝑆𝑆𝑆𝑆𝑆𝑆𝑆𝑆𝑆𝑆0 = 𝑅𝑅&𝐷𝐷1𝑔𝑔+𝛿𝛿0
(2)
We follow BEA to use a depreciation rate (δ0) of 15% and a growth rate (g) of 10%. Our results
are robust to different choices of δ0 and g though.
Although R&D stock successfully captures the input of firms’ innovation activities, it may
ignore the efficiency in the innovation process. In the robustness tests, we construct measures of
1 See footnote 6 in Servaes and Tamayo (2013) for an example. 2 Our results are not affected if we use the raw number of strengths and concerns from KLD to construct the CSR measure.
14
firms’ innovation activities by focusing on innovation outputs, i.e. the number of patents granted
to the firm or the number of citations received by the firm. Our conclusions are not affected.
Moderating variables
Firm financial leverage is measured by the firm’s ratio of total debt to total assets. The higher
the leverage, the more likely is the firm to default or go bankrupt. Market munificence is
measured by the industry mean of the Tobin’s Q (Q). Q is the market value of equity plus the
book value of liabilities divided by total assets and is a popular measure of firms’ growth
opportunities (see Stein 2003 for an example). A higher value indicates more growth
opportunities available in the industry in which the firm operates.
Control variables
We control for firm characteristics such as performance, age, and size, because these factors can
affect a firm’s engagement in social activities (Adams and Hardwick, 1998; Waddock and
Graves, 1997). Firms with better financial performance are more likely to invest in social
activities because they have more resources at their disposal. We include ROA (return on assets)
the measure of firm financial performance and Q (Tobin’s Q) as the measure of firm’s growth
oppotunities. Firm age is measured by the natural logarithm of one plus the number of years
since the firm appeared in the Compustat database for the first time. Firm size is measured by the
natural logarithm of the firm’s total assets. We also control for analyst coverage (LnCoverage) to
capture the firm’s public exposure and the amount of attention it has received (Shen, Tang, and
Chen, 2014). Analyst coverage is measured as the number of analysts who have issued at least
one earnings forecast for the firm in year t-1. Finally, we control for industry (SIC two-digit) and
year fixed effects. We calculate the robust standard errors clustered by firm. The variable

15
definitions are summarized in Appendix A. All continuous variables are winsorized at 1% and
99% to reduce the influence of outliers (Servaes and Tamayo, 2013).
Endogeneity and the instrumental variable (IV) approach
Endogeneity may be an issue with our research design. First, a firm’s CSR policy and firms’
innovation activities can be jointly determined. Although we have controlled for the observable
firm characteristics, the unobservable determinants can result in an omitted variables problem.
Second, firms engaging in social activities may choose to engage in more innovation activities.
This will lead to a reverse causality problem.
A typical way to address the endogeneity concerns is to use an instrumental variable (IV)
approach (Kennedy, 2006; Wooldridge, 2002). The IV approach requires instruments that are
related to a firm’s innovation but independent of its CSR activities. In this study, we use the
education level of the state where the firm’s headquarter is located as a valid instrument variable
for firms innovation activities. Innovation requires more sophisticated knowledge on the part of
producers, distributers and consumers respectively (Porter, 1980; Li and Calantone, 1998;
Carlile, 2002). Those having a better education would possess more sophisticated knowledge,
but it may or may not increase their tendency to engage in socially responsible activities. The
education level of a state is defined as the share of its population having a bachelor’s degree or
above. The education data obtained are from the U.S. Census Bureau, which conducts a survey
every five years. To mitigate the possibility that the development of the state economy increases
the share of the population who are educated, we rank all 51 states by their education level in
1970 and use this rank as our instrument variable. Our conclusions are not affected if we rank the
states by their education level in 2000 which is the year right before our sample starts. A firm’s
education rank is the education rank of the state where the firm’s headquarter is located.

16
RESULTS
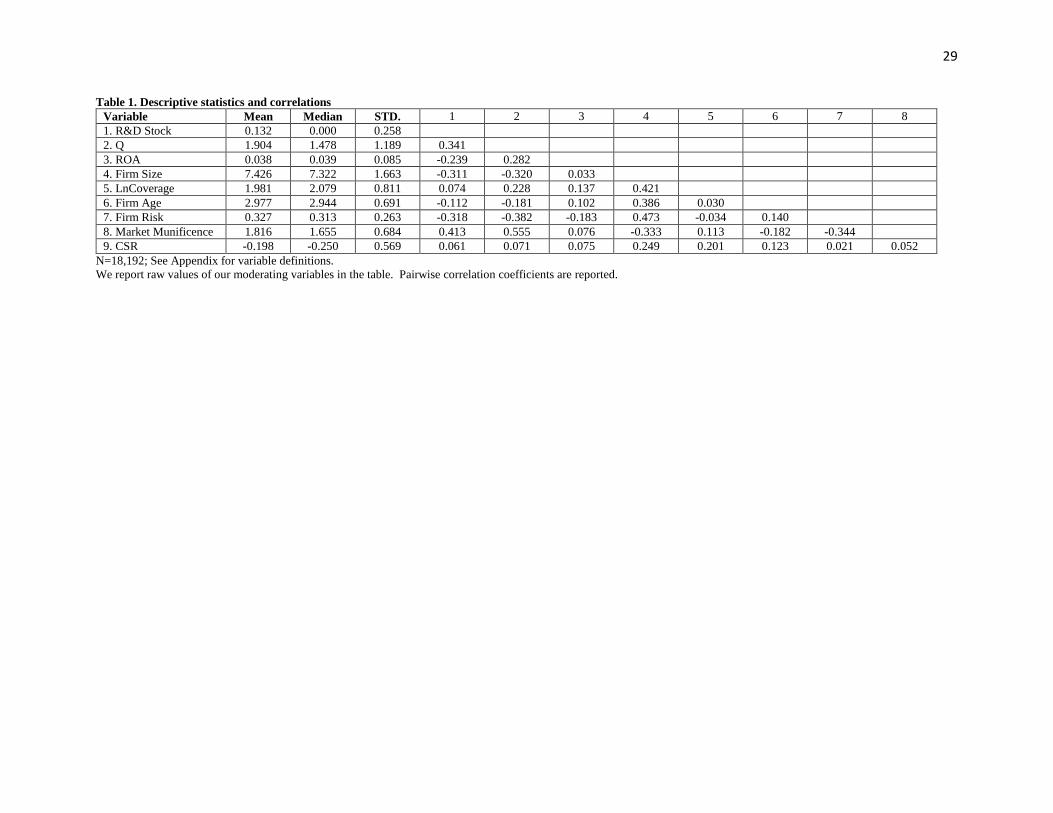
Table 1 presents the descriptive statistics and correlations for the studied variables. The pairwise
correlations among the independent variables are not particularly high. The highest correlation is
found between firm Q and market munificence (0.55), which is not surprising because firm-level
growth opportunities are correlated with industry-level growth opportunities. Further
investigation does not reveal any serious multicollinearity problem: the variance inflation factor
of the variables is acceptable with a maximum of 2.37 and a mean of 1.65 (Cohen et al., 2003).
-----Insert Table 1 about here-----
We also perform univariate test to examine how CSR varies across firms with different
innovative activities. The mean CSR score for firms in bottom tercile of R&D Stock is -0.23 and
the mean CSR score for firms in top tercile of R&D Stock is -0.11 suggesting a 0.12 difference in
CSR score across these two groups. The p-value of this difference is less than 0.001. In addition,
the effect size (Cohen’s d) of this difference is 0.23 with a 95% confidence interval of (0.20,
0.26).
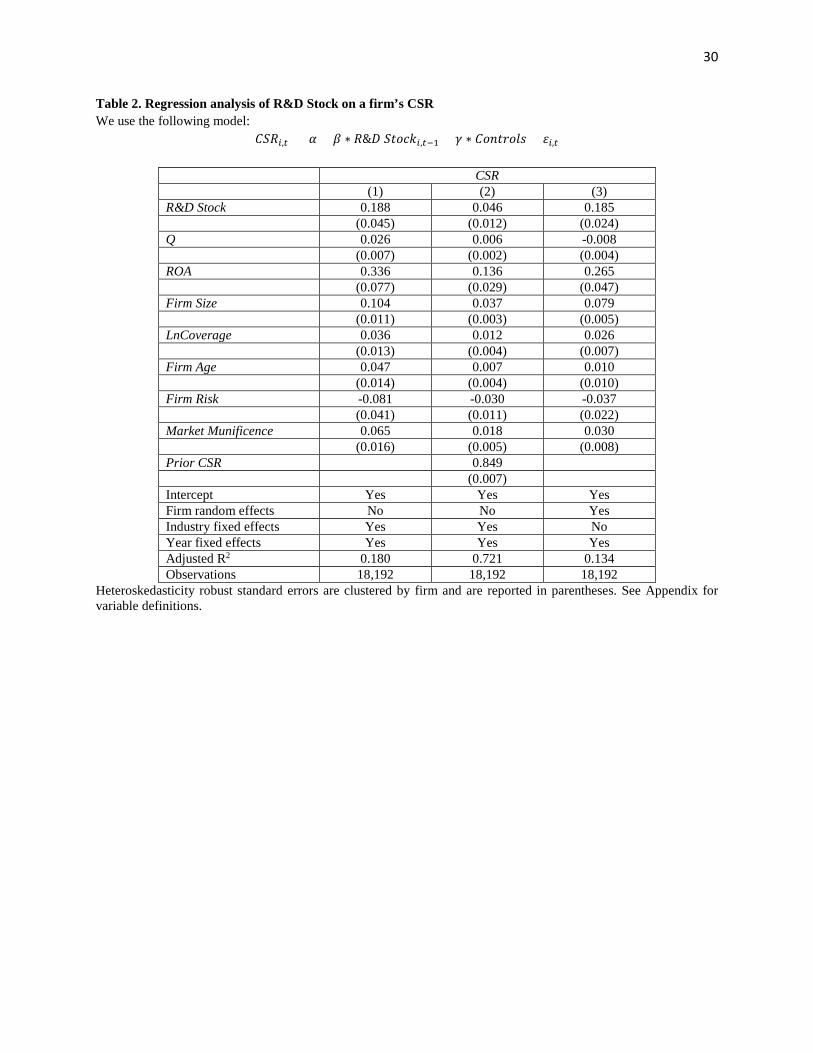
Do firms engaging in more innovation embrace CSR more actively?
Our Hypothesis 1 suggests that firms engaging in more innovation activities have a higher level
of CSR. In this section, we use the following empirical model to test this hypothesis:
𝐶𝐶𝑆𝑆𝑅𝑅𝑖𝑖,𝑡𝑡 = 𝛼𝛼 + 𝛽𝛽 ∗ 𝑅𝑅&𝐷𝐷 𝑆𝑆𝑆𝑆𝑆𝑆𝑆𝑆𝑆𝑆𝑖𝑖,𝑡𝑡−1 + 𝛾𝛾 ∗ 𝐶𝐶𝑆𝑆𝐶𝐶𝑆𝑆𝐶𝐶𝑆𝑆𝐶𝐶𝐶𝐶 + 𝜀𝜀𝑖𝑖,𝑡𝑡 (3)
where CSR, R&D Stock and control variables are as defined in the previous section. Standard
errors are controlled for and clustered at the firm level.
The results are presented in Table 2. In Model (1), we include industry and year fixed
effects. In addition, it is necessary to control for unobserved firm heterogeneity which may affect
both firms’ innovation and CSR. As we use a stock measure of R&D input which tends to be
17
stable over years, it may not be appropriate to add firm fixed effects in the models. We address
this issue in two ways. In Model (2), we control for firm’s lagged CSR to study whether or not
firms’ innovation has a significant impact on the dynamics of CSR performance. In addition, we
control for firm random effects in Model (3). The coefficient of R&D Stock is positive and with
very low p-values in all three regressions (p-value <0.001 in all three regressions). The
coefficient of R&D Stock in Model (2) is smaller because of controlling for the lagged CSR
performance. Using the coefficient in Model (1), we calculate the average effect of R&D Stock
on CSR. A change of one standard deviation in R&D Stock will lead to a change of 0.049 in CSR,
which is more than 8.5% of the standard deviation of CSR itself.3 We thus conclude that the
effect of a firm’s innovation is not only statistically significant, but also economically important.
These results render strong support to Hypothesis 1.
-----Insert Table 2 about here-----
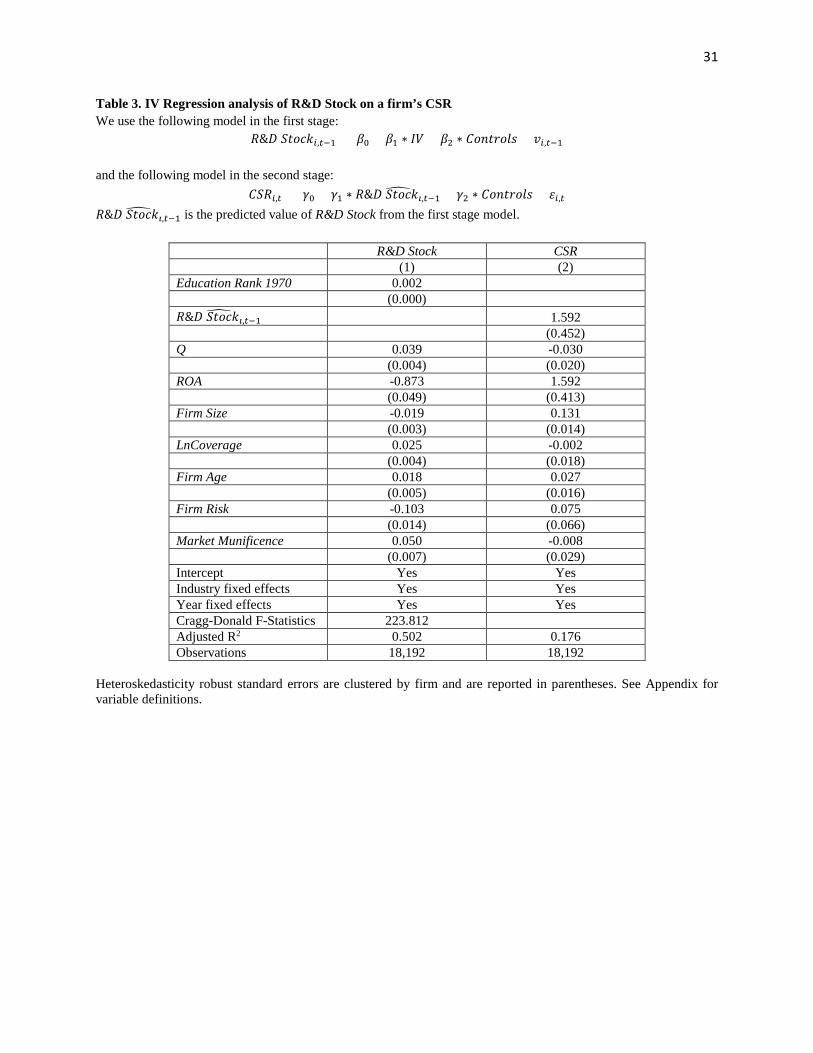
Our IV results are presented in Table 3. Column (1) of Table 3 reports the first-stage
results. Education ranks in 1970 are highly correlated with Firm Innovation in the expected
direction. The Cragg-Donald (1993) F tests (F-stats is 223.812) reject the null hypothesis of a
weak instrument. The second-stage results are reported in Column (2) of Table 3. We include
both industry and year fixed effects in the model. The coefficients obtained via the IV approach
are larger than those reported in Table 2 (corresponding to the same specifications) which is not
surprising because the two-stage estimator is inefficient but consistent (Wooldridge, 2006).
Overall, our results are unlikely affected by endogeneity problems.
-----Insert Table 3 about here-----
Moderating effects
3 0.188*0.258/0.569=8.52%
18
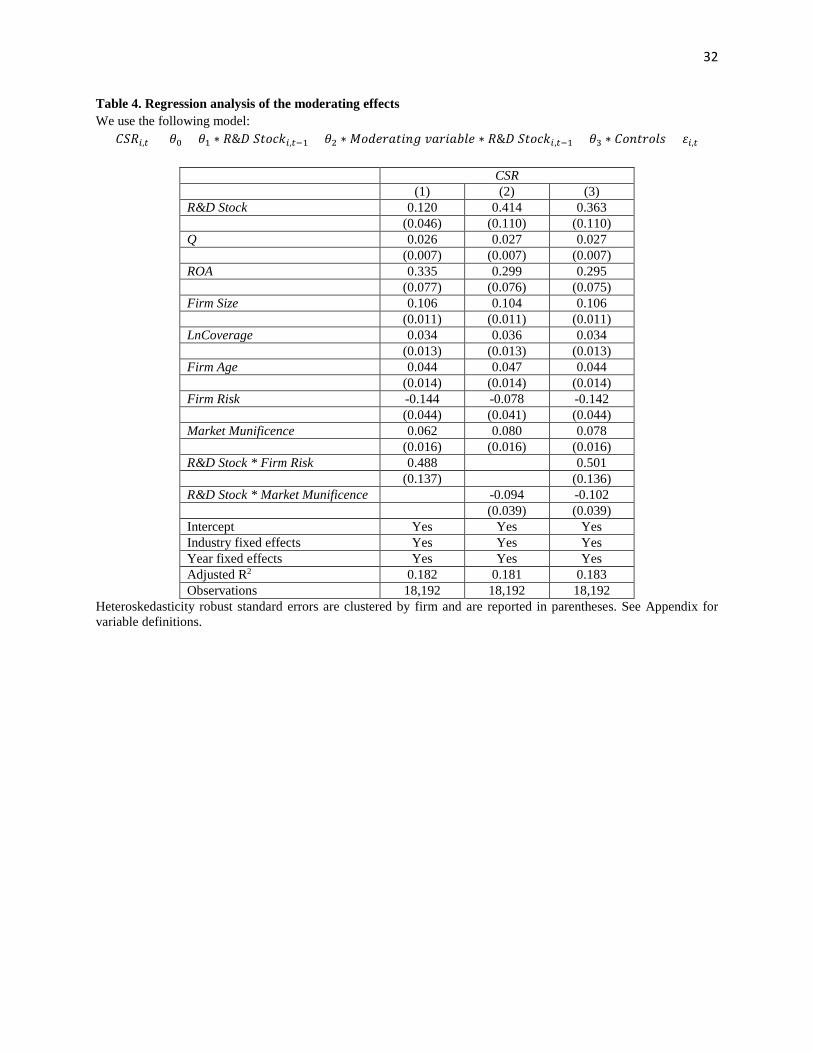
The results from testing Hypotheses 2 and 3 are reported in Table 4. We include industry and
year fixed effects from Models (1) to (3). In Models (1) and (2) we include interactions one by
one. In Model (3), we include both interactions and our results are unaffected. Both the
interaction between R&D Stock and Firm Risk and that between R&D Stock and Market
Munificence are positive and with low p-values (p < 0.001 and p = 0.009, respectively),
suggesting that the relationship between firms’ innovation and CSR is strengthened when firm
financial leverage is high or market munificence is low. Therefore Hypotheses 2 and 3 are
supported.
-----Insert Table 4 about here-----
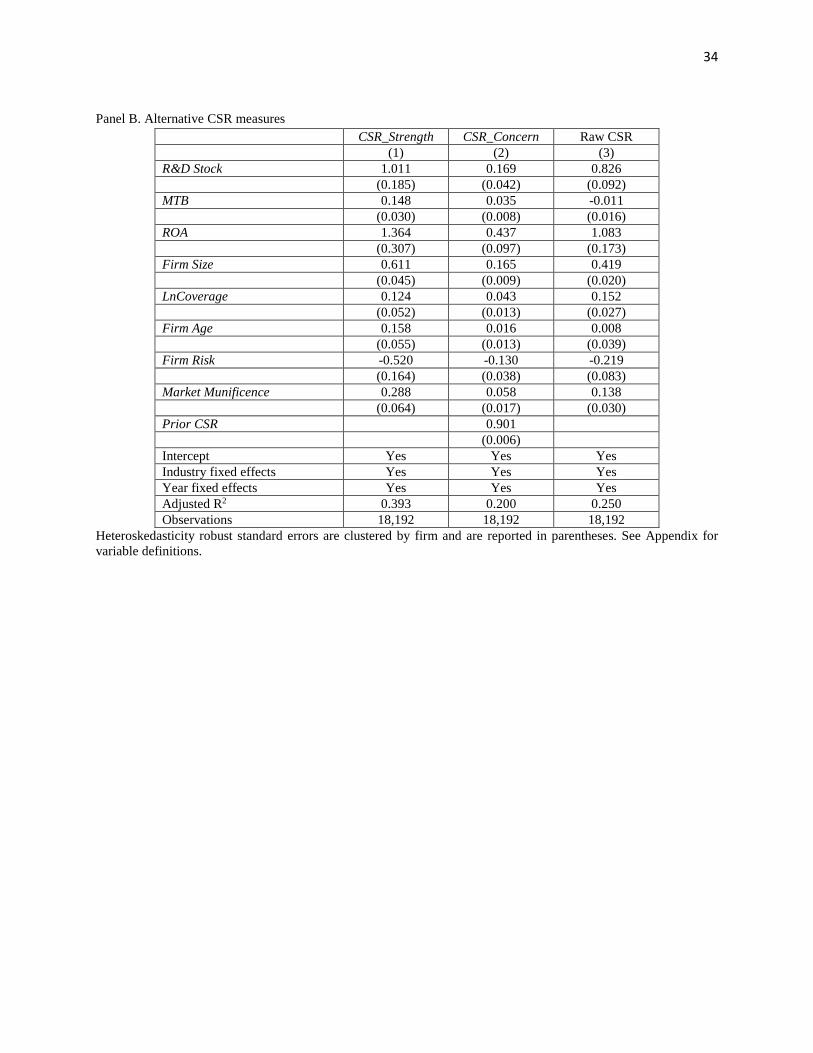
Robustness tests with alternative measures of firm innovation
When constructing our key measure of firm innovation R&D Stock, we replace missing R&D
expenses with zero. However, Koh and Reeb (2015) find that some firms with missing R&D still
file patents. Their evidence suggests that replacing missing R&D with zero may not be
appropriate for all cases. To address this concern, we use three alternative ways to deal with the
missing R&D problem. In the Model (1) of Table 5, we construct R&D Stock KR by excluding
all firms which do not report R&D expense but file patents. In the Model (2) of Table 5, we
construct R&D Stock non-missing by excluding all firms with missing R&D. Lastly, in Model (3)
of Table 5, we use the decile rank of R&D Stock (R&D Stock Rank) instead of R&D Stock itself
as the measure of firm innovation to mitigate the potential measurement errors. As indicated by
the results in Table 5, our results are robust with all these alternative measures.
R&D Stock captures the firms’ cumulative inputs in innovation activities. However, it
ignores the outcomes of firms’ innovation activities. To assure the robustness of our results, we
also construct two measures based on the output of firms’ innovation activities: LnNum_Patent
19
and LnNum_Cites. LnNum_Patent is the natural log of number of patents that the firm has filed
and eventually granted in year t-1. LnNum_Cites is the natural log of number of citations that the
firm has received from the patents in year t-1. The number of patents which represents the total
outputs of innovation activities, and the number of citations which represents both the quantity
and the quality of the outputs of innovation activities are commonly accepted measures of the
innovation outputs of firms (e.g., He and Tian 2013). The data are extracted from U.S. Patent and
Trademark Office (PTO) and cover the period from 2001 to 2009. Kogan et al. (2015) provide a
detail explanation of the data construction.4 The results based on these two output-based
innovation measures are reported in column (4) and (5) in Table 5. Again, our results are robust
to these alternative measures.
----Insert Table 5 about here----
Revisiting the CSR-corporate financial performance relationship
As a supplementary analysis, we explore the relationship between CSR and subsequent corporate
financial performance. The existing research on the association between CSR and corporate
financial performance presents mixed findings (e.g., Orlitzky et al., 2003; Wright and Ferris,
1997; Flammer, 2014). We suspect this inconsistency may be due to the failure to take into
account certain firm-level characteristics (such as firm innovation) as the boundary conditions in
previous research. Indeed, CSR may help some firms more than others (cf. Servaes and Tamayo,
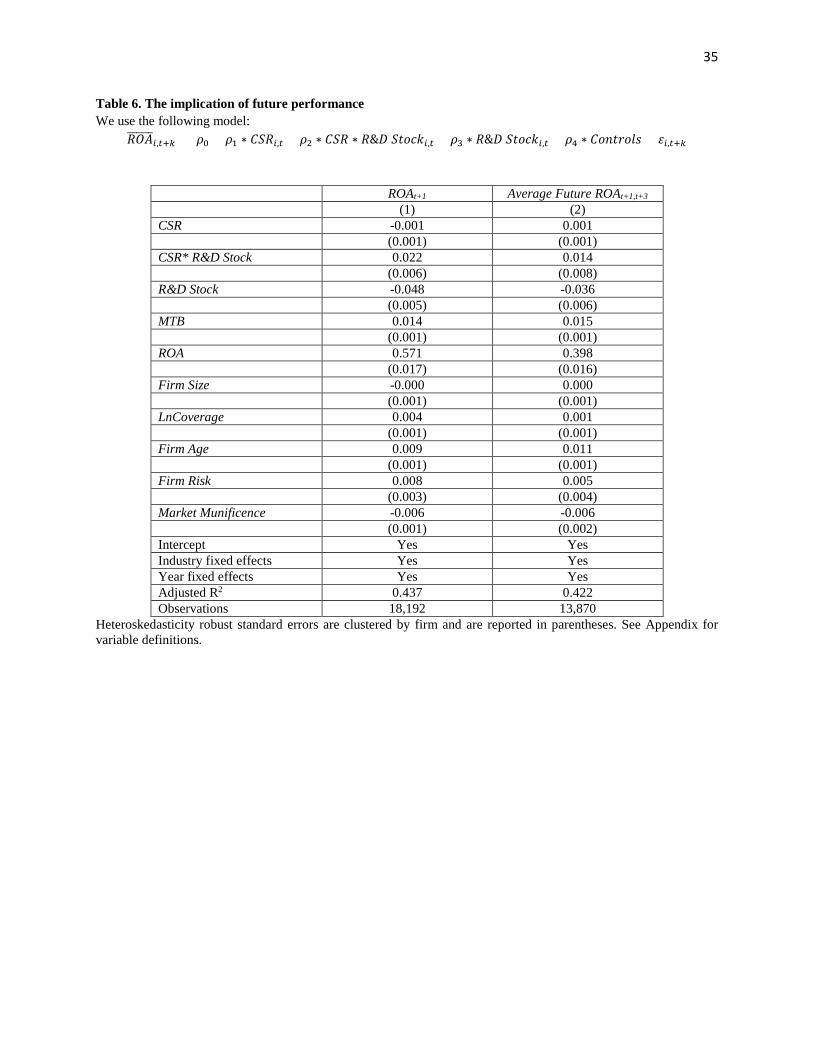
2013). Therefore, in Table 6, we examine the relationship between CSR and corporate financial
performance when firm innovation serves as a moderator. In Models (1), the dependent variable
is ROA in year t and in Model (2), the dependent variable is the three-year average ROA from
years t through t+2 while all independent variables are measured at year t-1.
4 The patent data are available at https://iu.app.box.com/patents.
20
Our main interest is the interaction terms between R&D Stock and CSR (i.e., CSR × R&D
Stock). The interaction effect on firm future performance is positive and with low p-values for
both one year ahead ROA and 3-year average future ROA (p-values are less than 0.001 and
0.069, respectively). This finding suggests that for firms of high innovation, CSR can contribute
more to corporate financial performance.
----Insert Table 6 about here----
DISCUSSION
Conclusions and implications
Studying CSR has important strategic implications for firms, as “investments made in enhancing
social responsibility are best focused on building primary stakeholder relationships that are not
easily replicated by competitors” (Ramchander, Schwebach, and Staking, 2012: 312). As such,
researchers have been eager to identify the drivers of CSR. While some research has attended to
the firm-level factors influencing the role of corporate executives in CSR (e.g., Kang, 2013), the
question of how other business strategies such as innovation affects a firm’s CSR engagement
remains under-explored to the best of our knowledge. This study directly links the two streams of
research on firm innovation and CSR.
By explicitly testing the relationship between firm innovation and CSR, our study
contributes to the strategic CSR literature in particular and the strategic management research in
general in several ways. First, we look inside the firm from a new angle and examine whether or
not firm innovation affects its CSR engagement. Our evidence on the association between firm
innovation and CSR demonstrates that CSR is unlikely an independent strategy, but instead
interacts with other business initiatives to form a cohesive whole.
21
Second, we provide evidence on the signalling role of CSR in reducing information
asymmetry between firms and stakeholders. Stakeholders have serious concerns over
transaction-specific investments when they deal with firms of high innovation. Our study
suggests that CSR can work as a signal to reduce information asymmetry, especially for firms of
high innovation.
Third, this study reveals the boundary condition of the relationship between firm
innovation and CSR by studying the moderating role played by internal and external risks. Our
findings suggest that the relationship strengthens with increasing firm risk and market
uncertainty. Our study thus enriches the understanding of what drives a firm’s CSR engagement
and may inspire future research to broaden this scope by investigating other potential moderating
factors at the individual manager, firm, and contextual levels.
In addition, by acknowledging that firm innovation generates a competitive advantage for
firms but at the same time creates an unexpected level of risk for stakeholders, our study offers
evidence that firms of high innovation can use CSR as an effective tool to offset the costs of
certain business strategies and increase the chances of reaping the financial benefits. Indeed our
supplementary analysis renders support to a contingent perspective of the CSR-corporate
financial performance relationship: for firms of high innovation, CSR can help them more in
terms of financial performance. This resonates with the recent call for more investigations on the
boundary conditions of the influence of CSR on firms (e.g., Barnett and Salomon, 2012; Ioannou
and Serafeim, 2015).
Limitations and future research
Our study can be improved in the following ways. First, although we have implicitly used
stakeholder theory to explain the mechanism linking firm innovation and CSR, we have not
22
directly measured the resources or support provided by particular stakeholder groups. The
contributions would have been even sharper if we were able to directly measure stakeholders’
resources or support and how stakeholders actually perceive firms of different levels of
innovation via surveys for examples. Future research should consider this possibility and try to
confirm the theoretical propositions in this study.
Second, this study takes a strategic CSR view and highlights the instrumental role of CSR
in reducing information asymmetry between firms and stakeholders. But a firm may engage in
CSR for other social reasons. For example, the cultural setting or the regulatory environment
may oblige a firm to commit to CSR. Therefore, future research could well benefit from
integrating an instrumental view with a social or ethical view of CSR motivation.
On a final note, our findings apply to public firms but do not necessarily can be extended to
private firms, because usually private firms face a different set of constraints and objectives and
may also deal with a different group of stakeholders. In addition, firms with different ownership
structures and embedded in different institutional contexts may prefer different innovation
strategies. So it would be meaningful to extend our predictions to other social and cultural
contexts. Margolis and Walsh (2003: 278) encouraged CSR research to “stress the importance of
developing models that incorporate omitted variables, testing mediating mechanisms and
contextual conditions”. Therefore, we urge future research to validate our conclusions for firms
with different ownership structures and embedded in different social contexts (cf. Wiersema and
Bird, 1996). We believe that such explorations would provide insights into Jensen’s (2002)
“enlightened” stakeholder theory, which postulates that an appropriate objective function of a
firm should consider all types of stakeholders of the firm.

23
REFERENCES Adams M, Hardwick P. 1998. An analysis of corporate donations: United Kingdom evidence.
Journal of Management Studies 35: 641–654.
Bergh DD, Gibbons P. 2011. The stock market reaction to the hiring of management consultants: a signaling theory approach. Journal of Management Studies 48: 544–567.
Berman SL, Wicks AC, Kotha S, Jones TM. 1999. Does stakeholder orientation matter? The relationship between stakeholder mangement models and firm financial performance. Academy of Management Journal 42: 488–506.
Brammer S, Millington A. 2008. Does it pay to be different? An analysis of the relationship between corporate social and financial performance. Strategic Management Journal 29: 1325–1343.
Briscoe F, Chin MK, Hambrick D. 2014. CEO ideology as an element of the corporate opportunity structure for social activists. Academy of Management Journal (Forthcoming).
Bromiley P. 1991. Testing a causal model of corporate risk taking and performance. Academy of Management Journal 34: 37–59.
Brown SL, Eisenhardt KM. 1995. Product development: past research, present findings, and future directions. Academy of Management Review 20: 343-378.
Carlile PR. 2002. A pragmatic view of knowledge and boundaries: boundary objects in new product development. Organization science 13(4): 442-455.
Carroll A. 1979. A three dimensional model of corporate performance. Academy of Management Review 4: 497–505.
Chin MK, Hambrick DC, Trevino LK. 2013. Political ideologies of CEOs: illustrative evidence of the influence of executive values on corporate social responsibility. Administrative Science Quarterly 58: 197–232.
Choi J, Wang H. 2009. Stakeholder relations and the persistence of corporate financial performance. Strategic Management Journal 30: 895–907.
Cogan GW, Burgelman RA. 1989. Intel Corporation (A): the DRAM decision. Graduate School of Business, Stanford University: Palo Alto, CA.
Cohen J, Cohen P, West SG, Aiken LS (3rd ed). 2003. Applied Multiple Regression/Correlation Analysis for the Behavioral Sciences. Erlbaum: London, UK.
Cragg JG, Donald SG. 1993. Testing identifiability and specification in instrumental variable models. Econometric Theory 9: 222–240.
Daft R. 1982. Bureaucratic versus nonbureaucratic structure and the process of innovation and change. In S. B. Bacharach (ed), Research in the Sociology of Organizations (Vol. 1). JAI Press: Greenwich, CT; 129-166.
Di Giuli A, Kostovetsky L. 2014. Are red or blue companies more likely to go green? Politics and corporate social responsibility. Journal of Financial Economics 111: 158–180.
Dosi G, Giannetti R, Toninelli P. 1992. Technology and Enterprise in a Historical Perspective. Oxford University Press: Oxford.
24
Drucker PF. 1985. Innovative and Entrepreneurship: Practice and Principles. Harper & Row: New York.
Du S, Bhattacharya CB, Sen S. 2011. Corporate social responsibility and competitive advantage: overcoming the trust barrier. Management Science 57: 1528–1545.
Eisenhardt KM, Brown SL. 1998. Patching: restitching business portfolios in dynamic markets. Harvard Business Review 77: 72-82.
Fisman R, Heal G, Nair VB. 2008. A model of corporate philanthropy. Working paper, Columbia University, New York.
Flammer C. 2014. Does corporate social responsibility lead to superior financial performance? A regression discontinuity approach. Management Science (Forthcoming).
Francis R, Armstrong A. 2003. Ethics as a risk management strategy: the Australian experience. Journal of Business Ethics 45: 375–385.
Freeman RE. 1984. Strategic Management: A Stakeholder Approach. Pitman: Boston.
Godfrey PC. 2005. The relationship between corporate philanthropy and shareholder wealth: a risk management perspective. Academy of Management Review 30: 777–798.
Godfrey PC, Merrill CB, Hansen JM. 2009. The relationship between corporate social responsibility and shareholder value: an empirical test of the risk management hypothesis. Strategic Management Journal 30: 425–445.
Grant RM. 1996. Toward a knowledge-based theory of the firm. Strategic Management Journal 17: 109-122.
Grossman G, Helpman E. 1994. Electoral Competition and Special Interest Politics. NBER working paper, Cambridge, MA.
Hambrick D, Finkelstein S. 1987. Managerial discretion: a bridge between polar views of organizational outcomes. In Staw B, Cummings L (eds), Research in Organizational Behavior (Vol. 9). JAI Press: Greenwich, CT; 369-406.
Hart O. 1995. Firms, Contracts, and Financial Structure. Oxford University Press: Oxford.
Hart O, Moore J. 1988. Incomplete contracts and renegotiation. Econometrica 56: 755–785.
He J, Tian X. 2013. The dark side of analyst coverage: the case of innovation, Journal of Financial Economics 109: 856–878.
Helfat CE. 1994. Firm-specificity in corporate applied R&D. Organization Science 5: 173-184.
Hillman A, Keim G. 2001. Stakeholder value, stakeholder management, and social issues: what’s the bottom line? Strategic Management Journal 22: 125–139.
Ioannou I, Serafeim G. 2015. The impact of corporate social responsibility on investment recommendations: analysts’ perceptions and shifting institutional logics. Strategic Management Journal 36:1053-1081.
Jensen M. 2002. Value maximization, stakeholder theory, and the corporate objective function. Business Ethics Quarterly 12: 235–256.

25
Jensen M, Meckling WH. 1976. Theory of the firm: managerial behavior, agency costs and ownership structure. Journal of Financial Economics 3: 305–360.
Johnson R, Greening D. 1999. The effects of corporate governance and institutional ownership types on corporate social performance. Academy of Management Journal 42(5): 564-576.
Kang J. 2013. The relationship between corporate diversification and corporate social performance. Strategic Management Journal 34: 94–109.
Kennedy P (5th ed). 2006. A Guide to Econometrics. MIT Press: Cambridge, MA.
Klein B, Crawford RG, Alchian AA. 1978. Vertical integration, appropriable rents, and the competitive contracting process. Journal of Law and Economics 21: 297-326.
Kogan L, Papanikolaou D, Seru A, Stoffman N. 2015. Technological Innovation, Resource Allocation, and Growth. Working paper, Sloan School of Management, MIT.
Kogut B, Zander U. 1992. Knowledge of the firm, combinative capabilities, and the replication of technology. Organization Science 3: 383-397.
Koh PS, Qian C, Wang H. 2014. Firm litigation risk and the insurance value of corporate social performance. Strategic Management Journal 35: 1464-1482.
Koh PS, Reeb DM. 2015. Missing R&D. Journal of Accounting and Economics 60: 73-94.
Li T, Calantone R. 1998. The impact of market knowledge competence on new product advantage: conceptualization and empirical examination. Journal of Marketing 62: 13-29.
Makri M, Lane P, Gomez-Mejia L. 2006. CEO incentives, innovation, and performance in technology-intensive firms: A reconciliation of outcome and behavior-based incentive schemes. Strategic Management Journal 27: 1057-1080.
Marquis C, Lee M. 2013. Who is governing whom? Executives, governance and the structure of generosity in large US firms. Strategic Management Journal 34: 483–497.
Marquis C, Davis GF, Glynn MA. 2013. Golfing alone? Corporations, elites and nonprofit growth in 100 American communities. Organization Science 24: 39–57.
Margolis JD, Walsh JP. 2003. Misery loves companies: rethinking social initiatives by business. Administrative Science Quarterly 48: 268–305.
Mattingly J, Berman S. 2006. Measurement of corporate social action: discovering taxonomy in the Kinder Lydenburg Domini ratings data. Business & Society 45: 20–46.
McWilliams A, Siegel D. 2000. Corporate social responsibility and financial performance: correlation or misspecification? Strategic Management Journal 21(5): 603-609.
McWilliams A, Siegel D. 2001. Corporate social responsibility: a theory of the firm perspective. Academy of Management Review 26: 117–127.
Miller D, Toulouse J. 1986. Chief executive personality and corporate strategy and structure in small firms. Management Science 32: 1389-1409.
Miller D, Fern M, Cardinal L. 2007. The use of knowledge for technological innovation within diversified firms. Academy of Management Journal 50: 308–326.

26
Myers S. 1977. Determinants of corporate borrowing. Journal of Financial Economics 5: 147–175.
Orlitzky M, Schmidt L, Rynes S. 2003. Corporate social and financial performance: a meta-analysis. Organization Studies 24: 403–441.
Porter ME. 1980. Competitive Strategy: Techniques for Analyzing Industries and Competitors. Free Press: New York, NY.
Ramchander S, Schwebach R, Staking K. 2012. The information relevance of corporate social responsibility: evidence from DS400 index reconstitutions. Strategic Management Journal 33: 303–314.
Schumpeter JA. 1934. The Theory of Economic Development: An Inquiry into Profits, Capital, Credit, Interest, and the Business Cycle. Transaction Publishers: New Brunswick, NJ.
Servaes H, Tamayo A. 2013. The impact of corporate social responsibility on firm value. Management Science 59: 1045–1061.
Shen R, Tang Y, Chen G. 2014. When the role fits: how firm status differentials affect corporate takeovers. Strategic Management Journal 35: 2012-2030.
Sliker BK. 2007. R&D satellite account methodologies: R&D capital stocks and net rates of return. Technical report, Bureau of Economic Analysis/National Science Foundation: Washington, DC.
Spence M. 1974. Market Signaling: Informational Transfer in Hiring and Related Screening Processes. Harvard University Press: Cambridge.
Stein J. 2003. Agency, information and corporate investment. In Handbook of the Economics of Finance, Constantinides G, Harris M, Stulz R (eds). North Holland: Amsterdam; 111-165.
Stiglitz JE. 1985. Equilibrium wage distribution. The Economic Journal 95: 595–618.
Tang Y, Qian C, Chen G, Shen R. 2015. How CEO hubris affects corporate social (ir)responsibility. Strategic Management Journal 36: 1338-1357.
Tilcsik A, Marquis C. 2013. Punctuated generosity: how mega-events and natural disasters affect corporate philanthropy in U.S. communities. Administrative Science Quarterly 58: 111–148.
Waddock SA, Graves SB. 1997. The corporate social performance-financial performance link. Strategic Management Journal 18: 303–319.
Wadhwa A, Kotha S. 2006. Knowledge creation through external venturing: evidence from the telecommunications equipment manufacturing industry. Academy of Management Journal 49: 819–835.
Wang H, Qian C. 2011. Corporate philanthropy and financial performance of Chinese firms: the roles of social expectations and political access. Academy of Management Journal 54: 1159–1181.
Wiersema M, Bird A. 1996. Universalizing upper echelon theory: contrasting U.S. theory with Japanese firm performance. Journal of Asian Business 12: 1–30.
Williamson OE. 1975. Markets and Hierarchies. Free Press: New York.
27
Williamson OE. 1981. The economics of organization: the transaction cost approach. American Journal of Sociology 87: 548-577.
Wood DJ. 1991. Corporate social performance revisited. Academy of Management Review 16: 691–718.
Wooldridge J. 2002. Econometric Analysis of Cross Section and Panel Data. MIT Press: Cambridge, MA.
Wooldridge, J., 2006. Introductory Econometrics: A Modern Approach, 3rd Edition. South-Western: Cincinnati, OH.
Wright P, Ferris S. 1997. Agency conflict and corporate strategy: the effect of divestment on corporate value. Strategic Management Journal 18: 77–83.
Yadav M, Prabhu J, Chandy R. 2007. Managing the future: CEO attention and innovation outcomes. Journal of Marketing 71: 84–101.
Young G, Charns M, Shortell S. 2001. Top manager and network effects on the adoption of innovative management practices: a study of TQM in a public hospital system. Strategic Management Journal 22: 935-951.
28
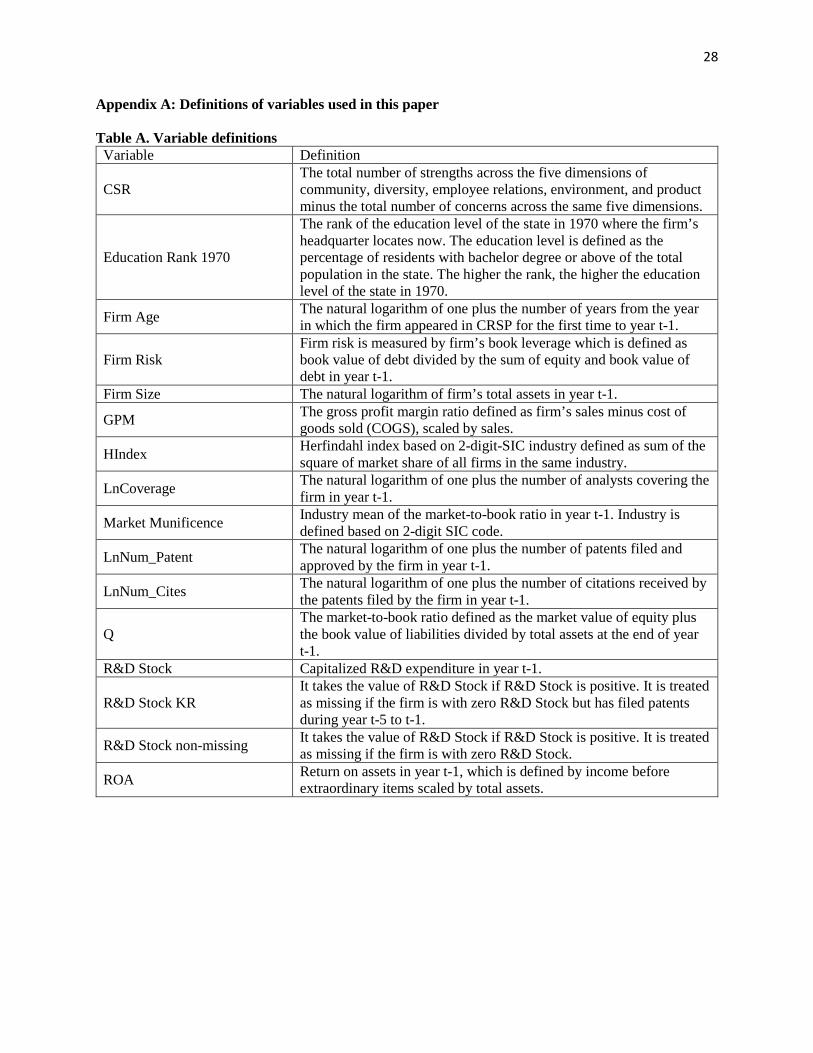
Appendix A: Definitions of variables used in this paper Table A. Variable definitions
Variable Definition
CSR The total number of strengths across the five dimensions of community, diversity, employee relations, environment, and product minus the total number of concerns across the same five dimensions.
Education Rank 1970
The rank of the education level of the state in 1970 where the firm’s headquarter locates now. The education level is defined as the percentage of residents with bachelor degree or above of the total population in the state. The higher the rank, the higher the education level of the state in 1970.
Firm Age The natural logarithm of one plus the number of years from the year in which the firm appeared in CRSP for the first time to year t-1.
Firm Risk Firm risk is measured by firm’s book leverage which is defined as book value of debt divided by the sum of equity and book value of debt in year t-1.
Firm Size The natural logarithm of firm’s total assets in year t-1.
GPM The gross profit margin ratio defined as firm’s sales minus cost of goods sold (COGS), scaled by sales.
HIndex Herfindahl index based on 2-digit-SIC industry defined as sum of the square of market share of all firms in the same industry.
LnCoverage The natural logarithm of one plus the number of analysts covering the firm in year t-1.
Market Munificence Industry mean of the market-to-book ratio in year t-1. Industry is defined based on 2-digit SIC code.
LnNum_Patent The natural logarithm of one plus the number of patents filed and approved by the firm in year t-1.
LnNum_Cites The natural logarithm of one plus the number of citations received by the patents filed by the firm in year t-1.
Q The market-to-book ratio defined as the market value of equity plus the book value of liabilities divided by total assets at the end of year t-1.
R&D Stock Capitalized R&D expenditure in year t-1.
R&D Stock KR It takes the value of R&D Stock if R&D Stock is positive. It is treated as missing if the firm is with zero R&D Stock but has filed patents during year t-5 to t-1.
R&D Stock non-missing It takes the value of R&D Stock if R&D Stock is positive. It is treated as missing if the firm is with zero R&D Stock.
ROA Return on assets in year t-1, which is defined by income before extraordinary items scaled by total assets.
29
Table 1. Descriptive statistics and correlations Variable Mean Median STD. 1 2 3 4 5 6 7 8 1. R&D Stock 0.132 0.000 0.258 2. Q 1.904 1.478 1.189 0.341 3. ROA 0.038 0.039 0.085 -0.239 0.282 4. Firm Size 7.426 7.322 1.663 -0.311 -0.320 0.033 5. LnCoverage 1.981 2.079 0.811 0.074 0.228 0.137 0.421 6. Firm Age 2.977 2.944 0.691 -0.112 -0.181 0.102 0.386 0.030 7. Firm Risk 0.327 0.313 0.263 -0.318 -0.382 -0.183 0.473 -0.034 0.140 8. Market Munificence 1.816 1.655 0.684 0.413 0.555 0.076 -0.333 0.113 -0.182 -0.344 9. CSR -0.198 -0.250 0.569 0.061 0.071 0.075 0.249 0.201 0.123 0.021 0.052
N=18,192; See Appendix for variable definitions. We report raw values of our moderating variables in the table. Pairwise correlation coefficients are reported.
30
Table 2. Regression analysis of R&D Stock on a firm’s CSR We use the following model:
𝐶𝐶𝑆𝑆𝑅𝑅𝑖𝑖,𝑡𝑡 = 𝛼𝛼 + 𝛽𝛽 ∗ 𝑅𝑅&𝐷𝐷 𝑆𝑆𝑆𝑆𝑆𝑆𝑆𝑆𝑆𝑆𝑖𝑖,𝑡𝑡−1 + 𝛾𝛾 ∗ 𝐶𝐶𝑆𝑆𝐶𝐶𝑆𝑆𝐶𝐶𝑆𝑆𝐶𝐶𝐶𝐶 + 𝜀𝜀𝑖𝑖,𝑡𝑡
CSR (1) (2) (3) R&D Stock 0.188 0.046 0.185 (0.045) (0.012) (0.024) Q 0.026 0.006 -0.008 (0.007) (0.002) (0.004) ROA 0.336 0.136 0.265 (0.077) (0.029) (0.047) Firm Size 0.104 0.037 0.079 (0.011) (0.003) (0.005) LnCoverage 0.036 0.012 0.026 (0.013) (0.004) (0.007) Firm Age 0.047 0.007 0.010 (0.014) (0.004) (0.010) Firm Risk -0.081 -0.030 -0.037 (0.041) (0.011) (0.022) Market Munificence 0.065 0.018 0.030 (0.016) (0.005) (0.008) Prior CSR 0.849 (0.007) Intercept Yes Yes Yes Firm random effects No No Yes Industry fixed effects Yes Yes No Year fixed effects Yes Yes Yes Adjusted R2 0.180 0.721 0.134 Observations 18,192 18,192 18,192
Heteroskedasticity robust standard errors are clustered by firm and are reported in parentheses. See Appendix for variable definitions.
31
Table 3. IV Regression analysis of R&D Stock on a firm’s CSR We use the following model in the first stage:
𝑅𝑅&𝐷𝐷 𝑆𝑆𝑆𝑆𝑆𝑆𝑆𝑆𝑆𝑆𝑖𝑖,𝑡𝑡−1 = 𝛽𝛽0 + 𝛽𝛽1 ∗ 𝐼𝐼𝐼𝐼 + 𝛽𝛽2 ∗ 𝐶𝐶𝑆𝑆𝐶𝐶𝑆𝑆𝐶𝐶𝑆𝑆𝐶𝐶𝐶𝐶 + 𝑣𝑣𝑖𝑖,𝑡𝑡−1 and the following model in the second stage:
𝐶𝐶𝑆𝑆𝑅𝑅𝑖𝑖,𝑡𝑡 = 𝛾𝛾0 + 𝛾𝛾1 ∗ 𝑅𝑅&𝐷𝐷 𝑆𝑆𝑆𝑆𝑆𝑆𝑆𝑆𝑆𝑆𝚤𝚤,𝑡𝑡−1� + 𝛾𝛾2 ∗ 𝐶𝐶𝑆𝑆𝐶𝐶𝑆𝑆𝐶𝐶𝑆𝑆𝐶𝐶𝐶𝐶 + 𝜀𝜀𝑖𝑖,𝑡𝑡 𝑅𝑅&𝐷𝐷 𝑆𝑆𝑆𝑆𝑆𝑆𝑆𝑆𝑆𝑆𝚤𝚤,𝑡𝑡−1� is the predicted value of R&D Stock from the first stage model.
R&D Stock CSR (1) (2) Education Rank 1970 0.002 (0.000) 𝑅𝑅&𝐷𝐷 𝑆𝑆𝑆𝑆𝑆𝑆𝑆𝑆𝑆𝑆𝚤𝚤,𝑡𝑡−1� 1.592 (0.452) Q 0.039 -0.030 (0.004) (0.020) ROA -0.873 1.592 (0.049) (0.413) Firm Size -0.019 0.131 (0.003) (0.014) LnCoverage 0.025 -0.002 (0.004) (0.018) Firm Age 0.018 0.027 (0.005) (0.016) Firm Risk -0.103 0.075 (0.014) (0.066) Market Munificence 0.050 -0.008 (0.007) (0.029) Intercept Yes Yes Industry fixed effects Yes Yes Year fixed effects Yes Yes Cragg-Donald F-Statistics 223.812 Adjusted R2 0.502 0.176 Observations 18,192 18,192
Heteroskedasticity robust standard errors are clustered by firm and are reported in parentheses. See Appendix for variable definitions.
32
Table 4. Regression analysis of the moderating effects We use the following model:
𝐶𝐶𝑆𝑆𝑅𝑅𝑖𝑖,𝑡𝑡 = 𝜃𝜃0 + 𝜃𝜃1 ∗ 𝑅𝑅&𝐷𝐷 𝑆𝑆𝑆𝑆𝑆𝑆𝑆𝑆𝑆𝑆𝑖𝑖,𝑡𝑡−1 + 𝜃𝜃2 ∗ 𝑀𝑀𝑆𝑆𝑀𝑀𝑀𝑀𝐶𝐶𝑀𝑀𝑆𝑆𝑀𝑀𝐶𝐶𝑀𝑀 𝑣𝑣𝑀𝑀𝐶𝐶𝑀𝑀𝑀𝑀𝑣𝑣𝐶𝐶𝑀𝑀 ∗ 𝑅𝑅&𝐷𝐷 𝑆𝑆𝑆𝑆𝑆𝑆𝑆𝑆𝑆𝑆𝑖𝑖 ,𝑡𝑡−1 + 𝜃𝜃3 ∗ 𝐶𝐶𝑆𝑆𝐶𝐶𝑆𝑆𝐶𝐶𝑆𝑆𝐶𝐶𝐶𝐶 + 𝜀𝜀𝑖𝑖,𝑡𝑡
CSR (1) (2) (3) R&D Stock 0.120 0.414 0.363 (0.046) (0.110) (0.110) Q 0.026 0.027 0.027 (0.007) (0.007) (0.007) ROA 0.335 0.299 0.295 (0.077) (0.076) (0.075) Firm Size 0.106 0.104 0.106 (0.011) (0.011) (0.011) LnCoverage 0.034 0.036 0.034 (0.013) (0.013) (0.013) Firm Age 0.044 0.047 0.044 (0.014) (0.014) (0.014) Firm Risk -0.144 -0.078 -0.142 (0.044) (0.041) (0.044) Market Munificence 0.062 0.080 0.078 (0.016) (0.016) (0.016) R&D Stock * Firm Risk 0.488 0.501 (0.137) (0.136) R&D Stock * Market Munificence -0.094 -0.102 (0.039) (0.039) Intercept Yes Yes Yes Industry fixed effects Yes Yes Yes Year fixed effects Yes Yes Yes Adjusted R2 0.182 0.181 0.183 Observations 18,192 18,192 18,192
Heteroskedasticity robust standard errors are clustered by firm and are reported in parentheses. See Appendix for variable definitions.

33
Table 5. Robustness check: using alternative measures of innovation activities Panel A. Alternative product specificity measures
(1) (2) (3) (4) (5) R&D Stock KR 0.193 (0.045) R&D Stock non-missing 0.208 (0.048) R&D Stock Rank 0.019 (0.005) LnNum_Patent 0.061 (0.011) LnNum_Cites 0.036 (0.007) MTB 0.026 0.029 0.029 0.020 0.021 (0.007) (0.009) (0.007) (0.008) (0.008) ROA 0.345 0.416 0.238 0.296 0.284 (0.078) (0.093) (0.068) (0.085) (0.085) Firm Size 0.108 0.148 0.102 0.045 0.052 (0.011) (0.018) (0.011) (0.011) (0.011) LnCoverage 0.033 0.022 0.037 0.020 0.021 (0.013) (0.021) (0.013) (0.014) (0.014) Firm Age 0.045 0.053 0.045 0.043 0.046 (0.014) (0.023) (0.014) (0.015) (0.015) Firm Risk -0.070 -0.102 -0.086 -0.057 -0.069 (0.042) (0.067) (0.041) (0.046) (0.046) Market Munificence 0.066 0.095 0.066 0.062 0.063 (0.017) (0.025) (0.016) (0.017) (0.017) Intercept Yes Yes Yes Yes Yes Industry fixed effects Yes Yes Yes Yes Yes Year fixed effects Yes Yes Yes Yes Yes Adjusted R2 0.181 0.237 0.179 0.179 0.174 Observations 16,884 8,191 18,192 11,893 11,893
34
Panel B. Alternative CSR measures
CSR_Strength CSR_Concern Raw CSR (1) (2) (3) R&D Stock 1.011 0.169 0.826 (0.185) (0.042) (0.092) MTB 0.148 0.035 -0.011 (0.030) (0.008) (0.016) ROA 1.364 0.437 1.083 (0.307) (0.097) (0.173) Firm Size 0.611 0.165 0.419 (0.045) (0.009) (0.020) LnCoverage 0.124 0.043 0.152 (0.052) (0.013) (0.027) Firm Age 0.158 0.016 0.008 (0.055) (0.013) (0.039) Firm Risk -0.520 -0.130 -0.219 (0.164) (0.038) (0.083) Market Munificence 0.288 0.058 0.138 (0.064) (0.017) (0.030) Prior CSR 0.901 (0.006) Intercept Yes Yes Yes Industry fixed effects Yes Yes Yes Year fixed effects Yes Yes Yes Adjusted R2 0.393 0.200 0.250 Observations 18,192 18,192 18,192
Heteroskedasticity robust standard errors are clustered by firm and are reported in parentheses. See Appendix for variable definitions.
35
Table 6. The implication of future performance We use the following model:
𝑅𝑅𝑅𝑅𝑅𝑅������𝑖𝑖,𝑡𝑡+𝑘𝑘 = 𝜌𝜌0 + 𝜌𝜌1 ∗ 𝐶𝐶𝑆𝑆𝑅𝑅𝑖𝑖,𝑡𝑡 + 𝜌𝜌2 ∗ 𝐶𝐶𝑆𝑆𝑅𝑅 ∗ 𝑅𝑅&𝐷𝐷 𝑆𝑆𝑆𝑆𝑆𝑆𝑆𝑆𝑆𝑆𝑖𝑖,𝑡𝑡 + 𝜌𝜌3 ∗ 𝑅𝑅&𝐷𝐷 𝑆𝑆𝑆𝑆𝑆𝑆𝑆𝑆𝑆𝑆𝑖𝑖,𝑡𝑡 + 𝜌𝜌4 ∗ 𝐶𝐶𝑆𝑆𝐶𝐶𝑆𝑆𝐶𝐶𝑆𝑆𝐶𝐶𝐶𝐶 + 𝜀𝜀𝑖𝑖,𝑡𝑡+𝑘𝑘
ROAt+1 Average Future ROAt+1,t+3 (1) (2) CSR -0.001 0.001 (0.001) (0.001) CSR* R&D Stock 0.022 0.014 (0.006) (0.008) R&D Stock -0.048 -0.036 (0.005) (0.006) MTB 0.014 0.015 (0.001) (0.001) ROA 0.571 0.398 (0.017) (0.016) Firm Size -0.000 0.000 (0.001) (0.001) LnCoverage 0.004 0.001 (0.001) (0.001) Firm Age 0.009 0.011 (0.001) (0.001) Firm Risk 0.008 0.005 (0.003) (0.004) Market Munificence -0.006 -0.006 (0.001) (0.002) Intercept Yes Yes Industry fixed effects Yes Yes Year fixed effects Yes Yes Adjusted R2 0.437 0.422 Observations 18,192 13,870
Heteroskedasticity robust standard errors are clustered by firm and are reported in parentheses. See Appendix for variable definitions.