Embed Size (px)
Citation preview

IZA DP No. 1708
Do Women in Top ManagementAffect Firm Performance?A Panel Study of 2500 Danish Firms
Nina SmithValdemar SmithMette Verner
DI
SC
US
SI
ON
PA
PE
R S
ER
IE
S
Forschungsinstitutzur Zukunft der ArbeitInstitute for the Studyof Labor
August 2005
Do Women in Top Management
Affect Firm Performance? A Panel Study of 2500 Danish Firms
Nina Smith Aarhus School of Business, CIM
and IZA Bonn
Valdemar Smith Aarhus School of Business
and University of Copenhagen
Mette Verner Aarhus School of Business and CIM
Discussion Paper No. 1708 August 2005
IZA
P.O. Box 7240 53072 Bonn
Germany
Phone: +49-228-3894-0 Fax: +49-228-3894-180
Email: [email protected]
Any opinions expressed here are those of the author(s) and not those of the institute. Research disseminated by IZA may include views on policy, but the institute itself takes no institutional policy positions. The Institute for the Study of Labor (IZA) in Bonn is a local and virtual international research center and a place of communication between science, politics and business. IZA is an independent nonprofit company supported by Deutsche Post World Net. The center is associated with the University of Bonn and offers a stimulating research environment through its research networks, research support, and visitors and doctoral programs. IZA engages in (i) original and internationally competitive research in all fields of labor economics, (ii) development of policy concepts, and (iii) dissemination of research results and concepts to the interested public. IZA Discussion Papers often represent preliminary work and are circulated to encourage discussion. Citation of such a paper should account for its provisional character. A revised version may be available directly from the author.
IZA Discussion Paper No. 1708 August 2005
ABSTRACT
Do Women in Top Management Affect Firm Performance? A Panel Study of 2500 Danish Firms∗
Corporate governance literature argues that board diversity is potentially positively related to firm performance. This study examines the relationship in the case of women in top executive jobs and on boards of directors. We use data for the 2500 largest Danish firms observed during the period 1993-2001 and find that the proportion of women in top management jobs tends to have positive effects on firm performance, even after controlling for numerous characteristics of the firm and direction of causality. The results show that the positive effects of women in top management depend on the qualifications of female top managers. JEL Classification: G38, J16, M14 Keywords: firm performance, female CEOs, board diversity, gender diversity Corresponding author: Nina Smith Aarhus School of Business Department of Economics Prismet, Silkeborgvej 2 DK 8000 Aarhus C Denmark Email: [email protected] ∗ An earlier version of the paper was presented at the 6th Workshop on Corporate Governance and Investment held in Palma de Mallorca, February 2005. We wish to thank Anna Kossowska for competent assistance in collecting the data and computation work. We also thank Laura Rondi, CERIS-CNR, Torino, and the other participants at the workshop for helpful comments.

1. Introduction
During the latest decade, there has been an increasing focus on the gender of top
executives and boards of directors of firms. The proportion of women reaching top positions
is still very low in most countries, though it has been increasing in for instance the US and in
some European countries. Some governments, like in Sweden and Norway, have even
introduced regulations of the gender composition of the boards of directors of private firms in
order to improve equal opportunities. In Norway, the government has decided that for large
Norwegian firms at least 40% of the members of the boards of directors must be women in
2005. This seems to have had a major impact on the recruitment practices for Norwegian
board members, see Hoel (2005). According to Hoel, the proportion of women in Norwegian
listed firms increased from about 6% in 2000 to 22% in 2005.
Parallel to this discussion, focus has been on good corporate governance in many
countries (see for instance for the US TIAA-CREF (2004) and for Denmark Nørby Johansen
et al. (2001)). One of the aspects of good corporate governance is diversity management. If it
is actually the case that more women (or minority groups) as top executives or members of
boards of directors have a positive effect on shareholder value and firm performance, this
may be a strong argument for having more women in top management.
In this study, we analyse whether female top executives and women on boards of
directors have any significant effect on firm performance measured by alternative
performance measures. The study examines the relationship between management diversity
and firm performance for the 2500 largest Danish firms observed during the period 1992–
2001. Management diversity is defined as the proportion of women among the highest
ranking CEOs in firms and on boards of directors. We estimate various panel data models of

2
firm performance and control for factors that are traditionally found to affect firm
performance e.g. firms’ age, size, sector, export orientation. We find that after controlling for
these observed factors, the proportion of women among top executives and on boards of
directors tends to have a significantly positive effect on firm performance. A large part of this
effect is attributed to the female managers with the best qualifications in terms of education,
and for the female board members it appears that the ones representing the staff have the
largest positive impact on firm performance. However, when controlling for unobserved
firm-specific factors, the effect often turns insignificant. This may reflect that until now very
few Danish firms have had women at the CEO level, and thus panel estimates of the
performance effects of female CEOs are determined with a large statistical uncertainty. An
alternative explanation may be, that the relatively few firms who hire women at the top level
of their organization are firms which are also doing well on a number of other unmeasured
characteristics (for instance good working conditions and work environment, a more
focussed recruitment policy etc.). Another crucial issue is the direction of causality (i.e. do
women on boards really affect firm performance or is it actually the case that better
performing firms are more likely to hire women?). Therefore, tests for causality between the
gender proportion on boards of directors and firm performance are performed. We find that
the positive relationship is due to board diversity affecting firm performance, not the
opposite.
2. Theoretical considerations and earlier findings
There are a number of arguments in favour of diversity of board members to be found
in the previous literature, see for instance Bantel and Jackson (1989) and Murray (1989).

3
Carter et al. (2003) list 5 positive arguments from a ‘business case perspective’ and also
discuss diversity management in a principal agent framework. Among the arguments pro
diversity management is that a more diverse board of directors (or executive board) is able to
make decisions based on the evaluation of more alternatives compared to a more
homogenous board. A heterogenous board compared to a homogenous board is able to have a
better understanding of the market place of the firm, and furthermore diversity increases
creativity and innovation. Diversity management may also improve the image of the firm and
in this way have positive effects on firm performance and shareholder value if the positive
image has positive effects on customers’ behaviour. Beside the arguments listed in Carter et
al. (2003), another argument for aiming at a more diverse composition of board members is
that if only male individuals are potential candidates for the boards, the selection of board
members will take place from only this selected distribution of qualifications, and on average
this implies a much lower quality than if the candidates are selected among the best from the
distribution of both men and women (or include minority groups).
However, there may also be arguments against diversity management. If a
heterogenous board produces more opinions and more critical questions, this may be time-
consuming and may not be as effective as a more homogenous board of directors, especially
if the firm is operating in a highly competitive environment where the ability to react quickly
to market shocks is an important issue. A culturally, ethnically or gender diverse board may
experience more conflicts, and even though the decisions may have a better quality in the
end, this may not balance the negative effects of a more slow decision-making process if the
market place of the firm demands quick responses, see Hambrick et al. (1996). Thus, based
on theory, the answer concerning the financial effects of diversity management and women

4
on boards is undetermined a priori. Predictions from the previous empirical evidence are
ambiguous. Most of the empirical studies have been based on US data,1 and most of the
studies include only the largest firms. Shrader et al. (1997) analyse the 200 largest US firms
and they are unable to find any significantly positive relationship between the percentage of
female board members and firm performance (measured by ROA and ROE). They even find
significantly negative relations in some cases. Kochan et al. (2003) also find no positive
relations between gender diversity in management and firm performance for US companies.
Contrary to these findings, Catalyst (2004) and Adler (2001) find positive correlations
between ‘female-friendly’ US Fortune 500 firms and the performance of these firms. Carter
et al. (2003) also find a significantly positive effect of the percentage of women and
minorities on boards of directors and firm value after controlling for a number of other
factors which may affect firm value. The study by Carter et al. (2003) also controls for the
direction of causality by estimating an IV-model, see below. A recent study by Bell (2005)
based on a large sample of US firms find that women in top management (female top CEO or
board members) have a positive effect on the payment of the executives of the firms, and
further, these firms also tend to have a higher proportion of women at lower management
levels.
Only very few studies from outside the US exist on this topic. Du Rietz and
Henrekson (2000) analyse firm performance and women on boards for a sample of Swedish
firms. They find that if not controlling for firm size and sectors, firms with women on the
board seem to under-perform. However, when controlling for these factors, the under-
performance hypothesis could not be confirmed. For Denmark, a recent study by Rose (2004)
1 Carter et al. (2003) give a survey of the empirical results for the US.

5
did not find any significant relationship between the percentage of women on the boards of
directors of the largest listed Danish firms and firm performance (measured by Tobin’s Q).
Thus, the conclusion from the previous empirical studies is ambiguous. Besides the
ambiguous theoretical predictions, the diverse empirical evidence may be due to different
estimation methods. In some studies, no controls for other factors are included. For instance
size and age of the firm (which are factors known to affect firm performance) may correlate
with the percentage of females on boards, and thus it may blur the picture if not controlled
for. Further, there may be a number of other unobserved factors which are important for firm
performance, but which will perhaps never be observable for the researcher. Therefore, panel
data where the same firms are observed in a number of years may give a more reliable
picture than cross-section studies based on only one year of observation.
A further problem with many of the existing studies is that the samples used are
typically only based on the largest (listed) firms for which it is possible to get reliable
information. Therefore, the results may not be representative for all firms in a given country.
Finally, the direction of causation is important to control for. If well-performing firms decide
to employ more women (or minorities) because they decide on a more risky strategy with
respect to recruiting board members, the observed relationship between diversity
management and firm performance will tend to become positive. If this is the case, causality
may run from performance to diversity management and not the reverse.
3. Data
In this study, we aim at overcoming a number of the weaknesses in some of the
earlier studies by using a rather unique data set based on the 2500 largest Danish firms

6
observed during the period 1993-2001. The data set is an unbalanced panel which includes
extensive information on the firms and the characteristics of the board members and thus
allows us to use panel estimators and control for causality. The data set contains register
information from Statistics Denmark who collects information for all Danish firms on a
number of firm characteristics for administrative purposes. The information on firms is
merged with individual information on the employees of the firm, including information on
background characteristics of the CEOs and their spouses. However, since Statistics
Denmark does not collect information on for instance board memberships, the information
from administrative registers has been merged with information from a private Danish data
register KOB (Købmandsstandens Oplysningsbureau). KOB collects information on
economic performance, board members of the firms etc. based on annual company reports to
the authorities. These reports are publicly available. KOB collects and harmonises this
information.
The sample is selected from the administrative registers as the 3000 largest Danish
firms, defined by gross turnover of the firms during each of the years 1993–2001. We
exclude companies with extreme values, defined as either a negative value of net capital or
an extreme relationship between firm’s revenue and employment in order to get rid of
holding companies etc. This means that the effective sample is reduced to about 2300-2500
firms for each of the years. For some of the variables, for instance membership of board of
directors, information is only available for the latest part of the period (1996–2001). The
sample is unbalanced, i.e. firms which are close to the cut-off criterion of being among the
3000 largest Danish firms may drop out of the sample in some years.2 The sample consists of
2 A potential problem using unbalanced panel data is that firms are entering and leaving the data set and that these changes are likely not to be random. Firm exits depend on performance, which potentially may depend on

7
listed as well as non-listed firms. In Denmark, there are approximately 300 listed firms. The
selection criterium implies that most of these firms are selected into the sample. However,
most of the firms included in the data are not listed firms. Consequently, this data set is much
broader and more representative compared to the samples used in many other studies of
women in management.
Four alternative measures on firm performance are available in the data. We use all
four alternative measures in the analyses in order to test the robustness of our results:
1. Gross value added/net turnover 2. Profit on ordinary operations/net turnover 3. Ordinary result/net assets 4. Net result after tax/net assets
Gross value added and profit on ordinary operations are both approximations of the
firms’ markup. Gross value added is measured by net turnover minus input expenses (raw
materials etc.). Profit on ordinary operations is defined as gross values added minus variable
costs of capacity (wages, costs of running machines etc.). Consequently, both measures relate
to the firms’ basic activities. The ordinary result is defined as the net result of the firm taking
into account deductions and financial payments, but not inclusive extraordinary revenues and
expenses.
In Denmark, the management of private firms is organized as a two tier system. The
board of directors which is chosen by the stockholders typically consists of external board
members (except for staff members representing the employees of the firm, see below). The
chairman of the board (president) is also usually an external member, i.e. the CEOs are
the gender composition of the board. In order to analyse this potential problem, we have calculated the sample proportion of women in top management for exit and entry firms and tested whether this proportion was higher for exit and entry firms than for firms who stayed in the sample during all years. We did not find any significant differences in the female proportion for entry and exit firms compared to firms who stayed in the sample.

8
usually not formally members of the board of directors. In family owned firms, the
organization of the management is often different. Here, the top CEO (often member of the
owners’ families) may also be chairman of the board of directors. Further, it is very common
that the board of directors consists of mainly members of the owners’ families.
In order to measure gender diversity in management, we apply a number of alternative
measures of gender diversity in management. The most restrictive definition includes only
the proportion of women among the top CEOs in the firm.3 However, as a large proportion of
Danish firms have only one top CEO, we also introduce a broader definition of management
including vice-directors.
Further, we have information on the proportion of women on the boards of directors.
According to Danish law, a number of board members are selected among the staff in firms
with more than 35 employees. The number of staff representatives depends on the size of the
board. Traditionally, the proportion of women among the board members who represent the
staff is larger than among other board members. In some of the estimations, we distinguish
between the two types of board members.
In order to control for other factors, which may affect firm performance, a number of
other variables are included in the analysis. Firm size is measured by the number of
employees, i.e. performance is expected to be positively related to firm size, because larger
firms normally have more market power, Bain (1951), Smirlock et al. (1984). Younger firms
are expected to have smaller earnings than older ones, because they have less experience in
the market, are in a phase of building up their market position, and they normally have
3 The measure which includes only top CEOs is defined as Disco 1, 12, 121 according to the occupational codes applied by Statistics Denmark, while the category ‘top CEOs plus vice-directors’ also includes Disco 122 and 123.
9
relatively higher capital costs as compared to older firms.4 However, older firms may become
more lax or be at a point on their product life cycle with declining earnings. Thus, it may be
argued that the effect of firm age is an inverse U-shape. We also control for the export
orientation of the firm. Firms that are heavily engaged at export markets (high
export/turnover rate) operate in potentially larger markets, and this is expected to affect their
profits positively. In line with other studies, we control for potential effects on profit due to
entry barriers for the concerned industry by using a measure of the minimum efficient scale
(MES) to the market (industry) size, where MES is approximated by the first quartile firm’s
turnover within the particular industry (measured at the 4-digit level).5
Table 1 shows mean statistics for the variables included in the data set. Note that due
to missing information, the number of observations varies for each variable. The reported
number of observations is the maximum number for the sample. The data is divided into two
groups: Firms with at least one female top CEO and firms without any female top CEOs.
(Table 1 about here)
From the table it is seen that firms having at least one female top CEO also have a
higher fraction of women in the lower ranks and also in the boards of directors. Thus, there
seems to be firms that are more “female-friendly” than others. Considering the means of the
four performance measures, there is a tendency of firms with female top CEOs doing worse
than firms with no female top CEOs in 2001. There is substantial variation in the proportion
of female managers across industries. Some industries (primary sector, energy and water)
4 See e.g. Lipczinsky & Wilson (2001) p. 144. 5 MES is calculated by using the total sample of Danish firms which is approximately 25000 firms.

10
have no firms with a woman among their top CEOs or vice-directors, while other industries
are more ‘female-friendly’ like private service and retail, hotel and restaurants. This clearly
indicates substantial industry differences and that this is likely to affect the estimation results.
From Table 1 it appears that mainly older firms and firms with more employees tend
to have female managers. However, strong conclusions should not be drawn from these
simple descriptive statistics, since other characteristics are not controlled for.
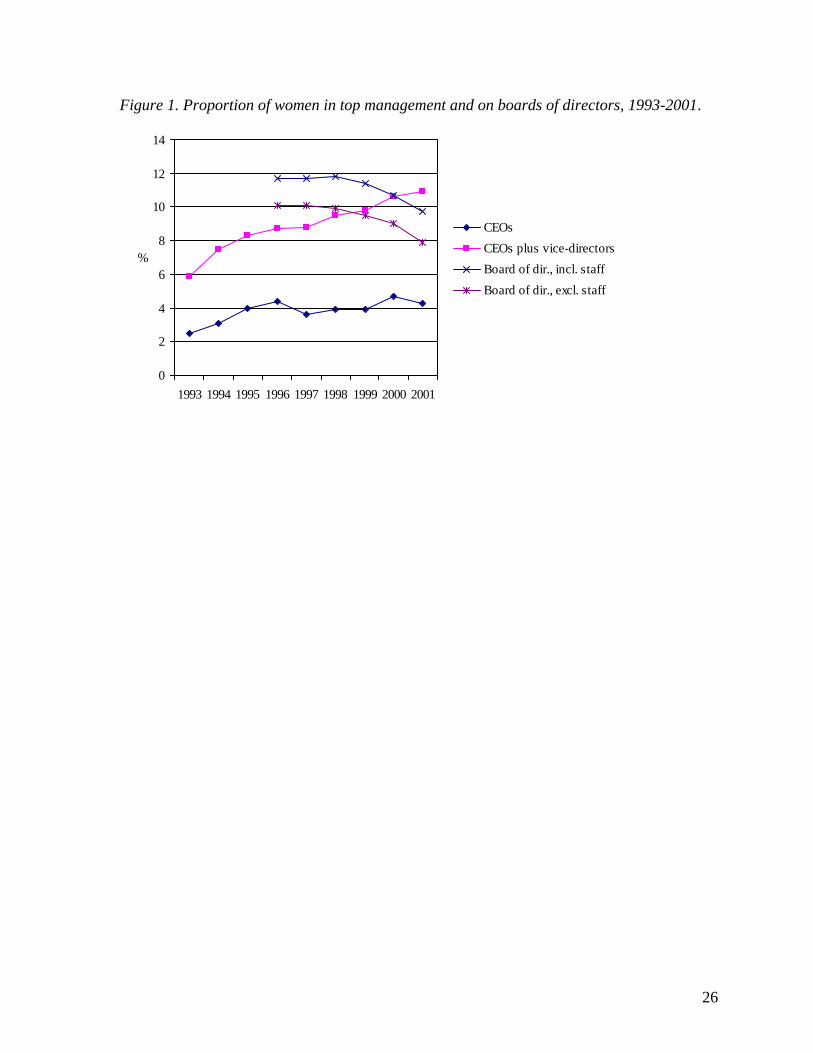
Figure 1 shows the development during the period 1993–2001 in the proportion of
women among top CEOs and on boards of directors for all the firms included in this study. In
2001, 4.3% of the top CEOs in the largest Danish firms were women. When extending the
top management category to include vice-directors, this figure increases to 10.9%. The
proportion of women on boards of directors was 9.7% when including staff representatives
and 7.9% when excluding staff representatives.
(Figure 1 about here)
The female proportion among CEOs has been slightly increasing during the 1990s
from 2.5% in 1993 to 4.3% in 2001. When including vice-directors, the proportion of women
in management has almost doubled, from about 6% in 1993 to 11% in 2001. However, the
female proportion on boards of directors has declined. It decreased from about 12% in 1996
to less than 10% in 2001. The decline is mainly due to a relative reduction of female
members of boards of directors who are not representing the staff. One explanation may be
that due to the ethics of good corporate performance, still fewer family members are

11
members of boards of directors, and this may have reduced the proportion of women. Our
data does not allow us to test this hypothesis.
It is difficult to compare with other countries because of different definitions of top
management and variations in the samples selected. But the figures above seem to be
relatively low, see Table 2. The Danish figures based on the sample used in this study include
many relatively small firms. According to Table 1, the average firm size in the Danish
sample was 219 employees (2001). If only the 113 largest firms in the sample are considered,
the proportion of females among top CEOs was slightly higher (5.9%) in 2005, see Table 2.
However, this is still much lower than in the US Fortune 500 firms where 10.2% of the top
CEOs were women in 2000. In Norway, the proportion of women in boards of directors has
risen dramatically the latest years, clearly as a reaction to government regulations in Norway,
see Hoel (2005).
4. Estimation
4.1 Basic estimations
In general, the statistical model of firm performance can be written as,
(1) 1 2 3_ _it it it it itP X W CEO W boardβ β β ε= + + +
where i refers to the firm, and t is time. itP is a performance measure. As described in the
data section, four performance measures are applied: Gross value added/net turnover, profit
on ordinary operations/net turnover, ordinary result/net assets and net result after tax/net
assets. _ itW CEO and _ itW board are the key variables of this study, i.e. the proportion of
women in management, measured as (1) Top CEOs, (2) Top CEOs plus vice-directors, (3)
Members of boards of directors . Hence 2β and 3β are the parameters of primary interest. itX
12
is a vector of other explanatory variables typically assumed to affect firm performance, i.e.
firm size (number of employees), firm age (years since establishment, potential market size
(measured by the export-intensity of the firm))6 and an indicator of entry barriers (minimum
efficient scale). In addition, we add controls for industry and year of estimation in order to
deal with changing business conditions. εit is an error component, assumed to be Nid(0,σε2).
Since we have a panel of firms, we are able to control for time-constant unobserved
heterogeneity which may bias the results from cross-section studies if these unobserved
factors correlate with the proportion of female CEOs. Thus, we also present random and
fixed effects models of Pit. The panel version of equation (1) is:
(2) 1 2 3_ _ ( )it it it it i itP X W CEO W boardβ β β α ε= + + + +
where αi is the unobserved heterogeneity term, assumed to be firm-specific and time-
invariant. The random effects estimator is only valid if αi is uncorrelated with the explanatory
variables. We test the validity of the random effects estimator by a Hausman test. As shown
below, the Hausman test tends to reject the random effects estimator and thus the fixed
effects results are preferred.
The fixed effects estimator is consistent, but it does not give any estimates on
variables which are time constant. Further, for variables with a small variation, the estimates
are imprecise (has a large variation) and therefore results tend to become insignificant due to
small variation across time. The key variable in this study, the proportion of women in
management, suffers from this problem. Therefore, we first present estimation results from
pooled estimations of (1), see Table 3, where selected key results of pooled OLS regressions
based on the sample of firms observed during the period 1993 (or 1996 for board of directors
6 The estimation forms allow for non-linearity by including squared expressions for firm size and age, see the theoretical discussion above.
13
estimations) to 2002 are presented.7 For each of the four performance measures, we have
estimated four alternative models, including a number of explanatory control variables as
described above (firm size, firm age etc.) plus the proportions of women in top management
and the share of women on boards of directors.8 In the first row of Table 3, the effect of a
female top CEO is shown, the second row of results shows the coefficients of the female
proportion among top CEOs and vice-directors, the third row shows the coefficients
including the variable proportion of women on boards of directors.
(Table 3 about here)
The first group of results concerns the effect of female top CEOs. In general, the
estimated coefficients are positive, but except for column 1 (gross value added/turnover) no
significant effects are found. However, extending the definition of top management to
include vice-directors, the estimated coefficients turn significant for three out of four firm
performance measures. Thus, when controlling for firm size, sector, age of firm etc., we find
that there is a positive performance effect of female CEOs for Danish firms.
Turning to the female representation on boards of directors, the results are more
mixed. When including a variable measuring the proportion of women among all board
members, there is only one positive and significant coefficient found (profit on primary
7 Due to space considerations we do not show the full estimation results for all the models in this paper. The full estimation results are available from the authors upon request. 8 For different reasons, we do not include both W_CEO and W_board in the same regressions but estimate their effects in separate regressions. Firstly, W_board is only observed for a sub-period, i.e. the years 1996-2001. Second, we are not able to instrument both variables when controlling for reverse causality, and thirdly, the two variables are correlated, i.e. we have problems of multicollinarity. Thus, the ‘total effect’ of women in top management is not the sum of the two estimated effects.

14
operations/turnover) while the coefficient for some performance measures is negative,
though insignificant.
In order to control for unobserved time-constant heterogeneity, which may affect firm
performance, we have also estimated alternative panel data models, where we exploit the fact
that the same firms are observed several times. Table A1 in the Appendix shows the results
from fixed effects and random effects estimation the model. The reported Hausman tests
reject the random effects model in all cases; i.e. the random effects parameters are likely to
be biased from correlation between the firm-specific effects and the explanatory variables.
Therefore, the preferred panel data specification is the fixed effect model. As expected, the
level of significance drops considerably when moving from the pooled OLS to the fixed
effect estimation. This may be the result of a very small variation in the explanatory
variables, including the key variables on female proportions in top management or
measurement errors which reinforce the problems of getting significant coefficients.
We have experimented with including additional explanatory variables in order to test
for these effects. For instance, we have information on the R&D intensity of the particular
industry which the firm belongs to. It may be an indicator for willingness to take risks and
the level of risk of the environment in which the firm operates. The motivation for
introducing such variables is that women are often seen as risk adverse, and therefore a
higher proportion of female managers may affect the degree of risk taken by the firm and
consequently its performance. On the other hand, R&D may determine diversity, i.e. female
managers may be less likely to be found as top CEOs in high-risk industries. In order to
control for risk industries, the firms included in our data were classified according to the
R&D intensity and the well-known Pavitt-taxonomy was introduced instead of using

15
traditional industry dummy variables. However, including R&D or Pavitt-dummies in the
performance equation has no notable influence on the estimation results shown above.
4.2 Direction of causality.
The direction of causality between firm performance and the proportion of women in
management has been widely discussed. Thus, according to this discussion some firms may
be observed to have a high proportion of female CEOs because these firms are currently
doing well and may be able ‘to take the risk’ of employing a female CEO. If this is the case,
the direction of causality is the reverse in relation (1)–(2), i.e. profitable firms have relatively
more female managers than less profitable firms. In order to deal with problems of potential
endogeneity in Equation (1)–(2), we estimate the models by the use of an instrument variable
approach. The proportion of women in management in the firm is then estimated by the
following equation:
(3) 1 2_ it it it itW CEO X Zα α ν= + +
where Xit is a vector of firm characteristics inclusive firm performance, itZ are the
instruments, i.e. factors affecting the proportion of women in management, which at the same
time do not affect firm performance, and νit is an error component, assumed to be Nid(0,σν2).
Since _ itW CEO is a proportion, 0≤ _ itW CEO ≤1, a linear specification of (2) is inappropriate.
Therefore, (3) is estimated by a tobit estimator which takes into account the upper and lower
limits of the dependent variable, _ itW CEO .
It is a well-known problem to find valid instruments, i.e. Z-variables. In this study,
we have individual information on all CEOs employed in the selected firms and the spouses
of these CEOs. We use the average length of education of the spouses of the other CEOs in
the firm as an instrument. Our hypothesis is that CEOs who are married to well-educated
16
spouses (in most cases these are wives) are supposed to be more positive and have a less
traditional view on the competences of female CEOs, implying that they are more willing to
hire and accept a woman in their own firm as compared to other CEOs who are married to
lower educated spouses. Furthermore, the education of the spouse is assumed not to affect the
firm performance, which seems plausible. However, we are only able to apply an IV-
estimator in the models analysing the effects of female CEOs. We do not have individual
information on board members since the information on board members does not stem from
Statistic Denmark’s administrative registers. Thus, we do not have valid instruments for the
regressions where _ itW board enters.
In Table 4, the estimates for panel versions of the IV-models are presented. As the
previous results show that the fixed effect model is strictly preferred to the random effects
model, only models in which the second step is estimated as pooled OLS and fixed effects
estimation are presented.
(Table 4 about here)
The results in Table 4 confirm the results presented previously. The estimates from
IV-pooled OLS show positive, significant relationships between female CEOs and
comparing to the results of Table 3 (pooled OLS, no IV) the introduction of IV to the pooled
OLS generates larger and more significant positive effects of women in management.
However, the results from IV-fixed effects models are again insignificant.9 Thus, our results
9The first step results of these models (not presented here) show that the instrument, the average length of education of male CEOs, is strongly related to the proportion of female managers in a firm. Formal testing procedures also show that the instrument is valid (i.e. the average length of education of male CEOs does not affect firm performance).

17
document, that when controlling for causality, there is still a positive effect of female top
CEOs and vice-directors. As in Table 3, the size of the effect is larger for the broader group
including vice-directors comparing to the effect observed for only top CEOs. One
explanation of this evidence may be that the relatively large increase in Denmark during the
period 1993-2001 in female proportion of vice-directors reflects that still more highly
educated women are now potential candidates for being promoted into top-management due
to their qualifications and professional skills. Older female top CEOs may to a larger extent
have been selected due to family ties to the owners’ families. We will pursue this hypothesis
below.
Though we are able to reject a hypothesis of reverse causality in our study, it is
important to stress that the interpretation of our results is not as straightforward as it might
seem in first instance. Since we find significantly positive coefficients in the pooled OLS
estimations, but insignificant panel estimates (fixed or random effects), this may reflect that
the firms who have succeeded in hiring female top managers (or who have a large proportion
of women as staff members on the board of directors) are the firms with the most
ambitious/progressive/active characteristics in general. If there exist unobserved
characteristics of this type in the firm, which are (almost) time constant during our
observation period, this may at the same time explain that more women are hired in top
management. For instance firms with an explicit diversity management policy or, in general,
a more ambitious recruitment policy may also in other respects have characteristics not
observed (good working environment, high degree of team spirit etc.) which explain firm
performance and profits.

18
4.3. Qualification effects
In the previous analysis, we have not looked at the qualifications of female managers,
i.e. the estimated effects are average effects for all women in top management. However, the
estimated effects potentially conceal variations in effects of qualifications of the female
managers. The hypothesis is that the positive effect of women in top management is larger,
the more qualified the female managers are. If many of the women who are observed as top
managers in our sample were mainly selected back in time because they were widows or
daughters of the owner(s) and not because of their formal qualifications relevant for a
position as a top manager, the estimated coefficients above may not give an adequate picture
of the potential for a future policy of diversity management and hiring (formally qualified)
women as top managers.
In Table 5, the educational distribution of the CEOs is presented. In 1993, 74% of all
female top CEOs in the sample did not have a theoretical education, while this was only the
case for 59% of the male top CEOs. These figures change considerably during the 1990s, and
in 2001 only 46% of female and 44% of male top CEOs had no theoretical education. The
proportion of female top CEOs holding a university degree almost doubled, from 17% in
1993 to 32% in 2001, while the same figures for male top CEOs were 30% and 36%,
respectively. Thus, the educational level of female top CEOs has increased much faster than
that of male CEOs, and the educational gap has narrowed considerably during the period.
When including vice-directors, the picture changes. Female CEOs at the level just below the
top CEO are on average as well educated as their male peers. Since the broader category of
CEOs including vice-directors is younger than the group of top CEOs on average, this

19
indicates a development over the period 1993-2001 where Danish female CEOs have become
still more qualified and have almost closed the qualification gap to their male colleagues.
(Table 5 about here)
In order to test whether the differences in formal competences matter for the
estimated performance effects of women in top management, we split the variable W_CEO
into three variables which measure the proportion of females among the group of CEOs at
different educational levels
(4) _ _ _ & _it it it itW CEO W long W M S W EDU= + +
where W_longit is the proportion of women among the group of CEOs having at least an
education at the master level, W_M&Sit is the proportion of women among the group of
CEOs having an education at the BA-level or slightly shorter , W_EDUit is the proportion of
women among the group of CEOs having no education or another education, i.e. non
academic education. Consequently, we estimate the form:
(1a) 1 2 3 4_ _ & _it it it it it itP X W long W M S W Otherβ β β β ε= + + + +
Since there are few females in the group of top CEOs, we only estimate (4) for the
group of CEOs including vice-directors. The results of these estimations (see Table 6) are
striking, in the sense that they show that a large part of the performance gain from female
managers can be attributed to the highest educated women for whom the estimated
performance effects tend to be much larger than for women with a short or medium theoretic
education (except for Column 2, Profit on primary operations). For women with no

20
theoretical education, i.e. women who are either unskilled or have a vocational education, the
performance effect is larger than for women with a short or medium theoretical education.10
(Table 6 about here)
Among the board members, similar mechanisms may play a role. However, in our
data only limited information about the board members is available. We do have information
on the board member status of the individual, i.e. whether the board member is a staff
representative or not. From Table 7 it is seen that the proportion of females among staff
board members is substantially higher than among other board members, and furthermore it
appears that, contrary to the general negative trend of women in the Danish boards, the
female share among the staff members has increased slightly over the observation period.
(Table 7 about here)
If we assume that women who are selected into the board of directors are as qualified
as their male colleagues who are staff representatives on the board of directors, and if a
proportion of female non-staff board members have family ties to the owners, we will expect
that a potential positive effect of females on boards is larger for female staff members than
for female non-staff members.11
10 This result may be explained by the fact that short and medium long theoretical educations in Denmark to a large extent are educations related to service and education jobs in the public sector (nurses, teachers, care workers etc.). 11 We do not have direct information on family ties in our sample. But for the 100 largest Danish firms more than two thirds of all female supervisory board members (excl. staff representatives) have family ties to the owners.

21
In Table 8, this hypothesis is tested. The first row of estimates corresponds to the
estimates for the female board member effects presented in Table 3 where only one small
positive significant effect was found. When we split the female board member effects, i.e.
estimates two separate performance effects for the female proportion on the board, an
interesting picture emerges: 7 out of 8 estimates are now significant and for the staff
members of the board the four coefficients are positive and very significant. On the other
hand, for female non-staff members of the board the effects are significantly negative and
rather large in two out of four cases.
(Table 8 about here)
Thus, female non-staff members of boards of directors seem to have a less positive or
even negative effect on firm performance compared to staff members. This finding may
indicate that firms who employ family members on their board of directors seem to be less
successful with respect to performance compared to firms who do not.12
5. Conclusion
The purpose of this paper is to evaluate the influence of the proportion of women in
management on firm performance. There is a theoretical as well as an empirical motivation
for dealing with this issue of corporate governance. In the theoretical section of the paper, we
argue that board diversity affects the performance of the firm. However, according to the
existing theory the influence can be positive as well as negative. The empirical motivation
12 This corresponds to the results of Bennedsen et al. (2005) who find for a sample of Danish firms that family successions in CEO positions have a negative impact on performance compared to non-family successions.

22
comes from the increasing focus on the gender composition of top executives and boards of
directors of firms. The proportion of women who reach top positions in the business sector is
still very low in most countries, though it has been increasing in some countries. In some
countries, like Sweden and Norway, it is even considered to regulate the gender composition
of the boards of directors of private firms in order to improve equal opportunities. If it can be
shown statistically that more female top executives (or other minority groups) or women on
boards of directors have positive effects on firm performance, this may be a strong argument
for having more women on boards.
Using a sample of the 2500 largest Danish firms over the period 1993-2001, we
analyse empirically whether the proportion of female top CEOs or members of boards of
directors really affects firm performance. The conclusion is ambiguous and depends both on
the measure of performance and the measure of the proportion of women in management.
The effect on firm performance of a higher fraction of female top CEOs varies from none to
positive. Performance measures which approximate the mark-up, e.g. gross value added, are
affected more positively and more significantly than the other performance measures, e.g. net
result/assets. Furthermore, the results show that the positive performance effects are mainly
related to female managers with a university degree while female CEOs who do not hold a
university degree have a much smaller or insignificant effect on firm performance.
Next, female members of boards of directors elected by the staff seem to have
positive effects on firm performance. However, this positive effect does not carry over to
other female board members, where the effect is negative - a result, which may be explained
by the fact that a significant part of the women on boards have family ties to the owners.
23
References
Adler, R.D. (2001), Women in the Executive Suite Correlate to High Profits, Harvard Business Review. Bain J.S. (1951), Relation of profit rate to industry concentration: American manufacturing, 1936-1940, Quarterly Journal of Economics, 65, 293-324. Bantel, K.A. and S.E. Jackson (1989), Top Management and Innovations in Banking: Does the composition of the Top Team Make a Difference?, Strategic Management Journal, vol. 10, (Special Issue), 107-124. Bell, L. A. (2005), Women-Led Firms and the Gender Gap in Top Executive Jobs, IZA discussion paper 1689, IZA, Bonn. Bennedsen, M., K. Nielsen and D. Wolfenzon (2005): The Family behind the Family Firm: Evidence from CEO Transitions, CEBRWorking Paper 2005-14, Department of Economics, Copenhagen Business School. Bennedsen, M., K. Nielsen, F Pérez-González and D. Wolfenzon (2005): Inside the Family Firm: The Role of Families in Succession Decisions and Performance, Discussion Paper 2005-14, Centre for Economic and Business Research, Copenhagen Business School. Carter, D.A., B.J. Simkins and W.G. Simpson (2003), Corporate Governance, Board Diversity, and Firm Value, The Financial Review, vol 38, 33-53. Catalyst (2003), Women in US Corporate Leadership: 2003’, www.catalystwomen.org Catalyst (2004), The Bottom Line: Connecting Corporate Performance and Gender Diversity, www.catalystwomen.org Cotta, M. (2000), Rapport Presenté´du nom de la section du travail, Le Conceil Économique et Social, Paris. Du Rietz, A and M. Henrekson (2000), Testing the Female Underperformance Hypothesis, Small Business Economics, vol 14(1), 1-10. Hambrick, D.C., T.S. Cho and M.J. Chen (1996), The influence of top management team heterogeneity on firms’ competitive moves, Administrative Science Quarterly, vol. 41, 659-684. Henrekson, M. (2004), Vägar till ökad jämställdhet i svenskt näringsliv, SNS forlag, Stockholm. Hoel, M. (2004), Kvinner i styrer og ledelse i norsk næringsliv. Kartlegging av ASA-selskapene 2004, CCD/Ledelse Likestilling Mangfold, Oslo.

24
Hoel, M. (2005), Kvinner i styrer og ledelse i norsk næringsliv. Kartlegging av ASA-selskapene 2005, CCD/Ledelse Likestilling Mangfold, Oslo. Kochan, T., K. Bezrukova, R. Ely, S. Jackson, A. Joshi, K. Jehn, J. Leonard, D. Levine and D. Thomas (2003), The Effects of Diversity on Business Performance: Report of the Diversity Network, Human Resource Management, vol 42 (1), 3-21. Likestillingssenteret (2001), Likestilingsbarometret 2001, Oslo. Lipczinsky, J. & J. Wilson (2001): Industrial organisation – An Analysis of Competive Markets, Prentice Hall, 2001. Murray, A.I. (1989), Top Management Group Performance and Firm Performance, Strategic Management Journal, Vol 10 (Special Issue, Summer 1989), 125-141. Nørby-Johansen, L., J. Lindegaard, W. Schmidt and M. Øvlisen (2001), Nørby udvalgets anbefalinger om corporate governance I Danmark, Erhvervs- og Selskabsstyrelsen, Copenhagen. Rose, C. (2004), Bestyrelsessammensætning og finansiel performance i danske børsnoterde virksomheder – Er Nørby Rapportens anbefalinger til gavn for aktionærerne? WP 2004-2, Institut for Finansiering, Handelshøjskolen i København. Shrader, C.B., V.B. Blackburn and P. Iles (1997), Women in Management and firm financial performance: an explorative study, Journal of Managerial Issues, fall 1997, vol. 9 (3), 355-372. Smirlock, M., Gilligan T.W. & W. Marshall (1984), Tobins q and the structure performance relationship, American Economic Review, 74, 1051-60. TIAA-CREF (2004), Policy Statement on Corporate Governance: http://www.tiaa-cref.org/pubs/html/governance_policy/board_directors.html Vinnicombe, S. and V. Singh (2003), Locks and Keys to the Board-room: A Comparison of UK Male and Female Directors, Women in Management Review.

25
Table 1. Sample means and standard deviations, 1993 and 2001. 2001 1993 Firms with
at least one female top
CEO
Firms with no female top CEO
Firms with at least one
female top CEO
Firms with no female top CEO
Female Proportion: CEOs 0.499
(0.300) 0.567
(0.293)
CEOs and vice-directors 0.292 (0.204)
0.063 (0.154)
0.357 (0.269)
0.036 (0.114)
Board of directors, excl. staff 0.139 (0.184)
0.067 (0.138)
Board of directors, staff only 0.133 (0.251)
0.061 (0.180)
Firm Performance: Gross value added/net turnover 0.353
(0.189) 0.305
(0.213) 0.398
(0.200) 0.325
(0.208) Profit ordinary operations/net turnover 0.036
(0.101) 0.045
(0.106) 0.042
(0.058) 0.045
(0.078) Ordinary result/net assets 0.210
(0.433) 0.234
(0.601) 0.707
(1.150) Net result after tax/net assets 0.151
(0.345) 0.160
(0.357) 0.178
(0.459) 0.176
(0.355) Sector: Primary 0.0151
(0.122) 0.015
(0.122) Manufacturing 0.343
(0.477) 0.300
(0.459) 0.348
(0.481) 0.321
(0.467) Energy and water 0.021
(0.142) 0.006
(0.078) Building and construction 0.051
(0.220) 0.045
(0.208) 0.055
(0.227) Retail, hotel and restaurants 0.374
(0.486) 0.402
(0.490) 0.391
(0.493) 0.384
(0.486) Transportation, telecommunication etc. 0.040
(0.198) 0.050
(0.219) 0.043
(0.206) 0.044
(0.205) Private service 0.192
(0.396) 0.166
(0.373) 0.217
(0.417) 0.175
(0.380) Age of firm (year) 40.040
(37.482) 32.693
(32.981) 43.690
(25.886) 38.415
(32.802) Number of employees 626.061
(1644.250) 201.498
(609.022) 352.175
(684.714) 154.332
(427.710) Export: Low (less than 10% of turnover) 0.242
(0.431) 0.324
(0.468) 0.413
(0.498) 0.555
(0.497) High (more than 50% of turnover) 0.737
(0.442) 0.659
(0.474) 0.261
(0.444) 0.203
(0.402) Min. efficient scale relative to market size (MES = quartile turnover in industry, 4-digit)
8.433 (1.334)
8.566 (1.351)
7.873 (0.914)
7.925 (0.962)
Number of firms 99 2,380 46 2,108 The number of observations included in the last row is the maximum number of firms in the year concerned. For some of the variables there may be fewer observations than this number.
26
Figure 1. Proportion of women in top management and on boards of directors, 1993-2001.
0
2
4
6
8
10
12
14
1993 1994 1995 1996 1997 1998 1999 2000 2001
%
CEOsCEOs plus vice-directorsBoard of dir., incl. staffBoard of dir., excl. staff

27
Table 2. Proportion of women in top management (CEO) and on boards of directors, selected countries.
Country
CEO
Board of directors US, Fortune 500 firms, 2000 (CEO)/2002 (board of
directors )
10.2%1) 13.6%
UK, FTSE 100 firms, 2002 1.0% 8.6%
France, 2000 2.9% 7.4%
Sweden, 2002, large firms (sales > SEK 50 million)
Sweden 2005 (178 largest firms)
5.2%
15.0%
12.0%
18.7%
Norway, 2001, firms > 250 employees (CEO) and
listed firms (board of directors )
Norway, 2005 (97 largest firms)
4.5%
12.4%
6%
21.6%
Denmark, 2001, 2500 largest firms (sales), this study
Denmark, 2005 (113 largest firms)
4.3%
5.9%
9.7% (incl. staff)
7.9% (excl. staff)
11.7%
1) A broader definition of top CEO is used than the one used for Denmark. 2) Weighted average calculated on the basis of 380 and 109 firms who had, respectively had not, answered a survey on board membership. Information based on Hoel (2004, p. 13). Source: US, Catalyst (2003, 2004), UK, Vinnicombe and Singh (2003), France, Cotta (2000), Sweden, Henrekson (2004) and Hoel (2005), Norway, Likestillingssenteret (2001) and Hoel (2004, 2005), Denmark, Hoel (2005).

28
Table 3. Estimated coefficients of alternative variables reflecting proportion of women in management (β2 and β3). Pooled OLS, 1993-20011).
Dependent variable: Firm performance
Gross value added/turnover
Profit on primary operations/turnover
Ordinary result/net assets
Net result after tax/net assets
Top CEOs 1993-2001
0.063* (0.012)
0.162
18,862
0.006 (0.004)
0.034
18,862
0.051 (0.034)
0.022
14,554
0.032 (0.022)
0.019
18,862
Top CEOs and Vice-directors 1993-2001
0.094* (0.009)
0.170
18,862
0.003 (0.003)
0.034
18,862
0.092* (0.027)
0.024
14,554
0.072* (0.016)
0.020
18,862
Board of directors 1996-2001
0.011 (0.011)
0.160
12,085
0.012* (0.004)
0.034
12,085
-0.051 (0.031)
0.022
12,080
-0.032 (0.021)
0.018
12,085 * denotes that the estimated parameter is statistically different from 0 at the 1% level of significance. 1) Values in parentheses are standard errors of the estimated parameters, Adj R2 is reported in row 3, and row 4 includes the number of observations in each regression analysis.

29
Table 4. Estimated coefficients of alternative variables reflecting proportion of women in management (β2). IV-estimations, 2nd step: pooled OLS and fixed effect estimations, 1993-2001. Instrument: mean educational level of managers’ wives1).
Dependent variable: Firm performance
Gross value added/
turnover
Profit on primary operations/turnover
Ordinary result/net assets
Net result after tax/net assets
Pooled OLS
FE Pooled OLS
FE Pooled OLS
FE Pooled OLS
FE
Top CEOs 1993-2001
0.088* (0.008)
0.157
-0.005 (0.006)
0.038
0.013* (0.003)
0.035
-0.003 (0.003)
0.019
0.074* (0 .023)
0.021
-0.051 (0.035)
0.024
0.043* (0 .014)
0.017
-0.043 (0.023)
0.014
Top CEOs and Vice-directors 1993-2001
0.365* (0.032)
0.157
-0.019 (0.024)
0.038
0.053* (0.012)
0.035
-0.014 (0.015)
0.017
0.306* (0.095)
0.021
-0.210 (0.143)
0.024
0.177* (0.059)
0.017
-0.178 (0.094)
0.014
No. of obs. 17,105 17,105 17,105 17,105 17,105 17,105 17,105 17,105
* denotes that the estimated parameter is statistically different from 0 at the 1% level of significance. 1) Values in parentheses are standard errors of the estimated parameters, Adj R2 is reported in row 3, and row 4 includes the number of observations in each regression analysis.

30
Table 5. Educational level among female and male CEOs. 1993 and 2001. 1993 2001 1993 2001 Top CEOs Top CEOs and Vice-directors
Women Men Women Men Women Men Women Men
Long higher education (University)
0.174 0.298 0.315 0.358 0.239 0.228 0.289 0.309
Medium or short higher education
0.087 0.113 0.226 0.206 0.094 0.049 0.159 0.136
No higher education/no info. on educ .
0.739 0.589 0.459 0.436 0.667 0.723 0.552 0.556
All 1.000 1.000 1.000 1.000 1.000 1.000 1.000 1.000 No. of obs. 46 1020 99 1142 345 1322 641 1408

31
Table 6. Estimated coefficients on effects of proportion of women in management, top CEOs and vice-directors (β2). Pooled OLS, 1993-20011).
Dependent variable: Firm performance
Proportion of female CEO with:
Gross value added/turnover
Profit on primary operations/turnover
Ordinary result/net assets
Net result after tax/net assets
Long higher education (University)
0.284* (0.028)
0.012
(0.010)
0.152** (0.076)
0.123** (0.051)
Medium or short higher education
0.017* (0.006)
0.0004 (0.002)
0.033*** (0.017)
0.021** (0.011)
No higher education/no info. on educ.
0.061* (0.010)
0.008** (0.004)
0.125* (0.027)
0.091* (0.018)
Nr. of observations
12,911
12,911
9,910
12,911
* denotes that the estimated parameter is statistically different from 0 at the 1% level of significance. 1) Values in parentheses are standard errors of the estimated parameters, Adj R2 is reported in row 3, and row 4 includes the number of observations in each regression analysis.

32
Table 7. Proportion of women among members of boards of directors including and excluding staff members. 1996 and 2001 1996 2001 Board of directors, all 0.117 0.099
Board of directors, excl. staff 0.101 0.080
Board of directors, staff only 0.194 0.207

33
Table 8. Estimated coefficients of effects of proportion of women among members of boards of directors (β3). Pooled OLS, 1996-20011).
Dependent variable: Firm performance
Gross value added/turnover
Profit on primary operations/turnover
Ordinary result/net assets
Net result after tax/net assets
Board of directors, all 1996-2001
0.011 (0.011) 0.160
0.012* (0.004) 0.034
-0.051 (0.031) 0.022
-0.032 (0.021) 0.018
Board of directors, excl. staff 1996-2001
-0.009 (0.011) 0.171
0.007*** (0.005) 0.038
-0.079** (0.031) 0.029
-0.061*** (0.021) 0.026
Board of directors, staff only 1996-2001
0.038* (0.010) 0.171
0.014* (0.004) 0.038
0.065** (0.028) 0.029
0.063* (0.019) 0.026
No. of obs. 12,085 12,085 12,080 12,085
* denotes that the estimated parameter is statistically different from 0 at the 1% level of significance. 1) Values in parentheses are standard errors of the estimated parameters, Adj R2 is reported in row 3, and row 4 includes the number of observations in each regression analysis.

34
Appendix Table A1. Estimated coefficients of alternative variables reflecting proportion of women in management (β2 and β3). Fixed- and random effect estimations, 1993-20011).
Dependent variable: Firm performance
Gross value
added/turnover
Profit on primary operations/turnover
Ordinary result/net assets
Net result after tax/net assets
FE RE FE RE FE RE FE RE
Top CEOs 1993-2001
0.020* (0.006)
0.036 18,862
0.023* (0.006)
0.029
18,862 1417.5
-0.002 (0.004)
0.017
18,862
-0.001 (0.004)
0.015
18,862 97.2
-0.022 (0.039)
0.023
14,554
0.005 (0.035)
0.022
14,554 45.6
-0.026 (0.024)
0.014
18,862
-0.005 (0.022)
0.013
18,862 68.5
Top CEOs and Vice-directors 1993-2001
-0.002 (0.005)
0.036 18,862
0.005 (0.005)
0.028
18,862 2677.1
-0.004 (0.003)
0.017
18,862
-0.003 (0.003)
0.015
18,862 100.4
-0.019 (0.034)
0.023
14,554
0.022 (0.023)
0.021
14,554 48.2
-0.013 (0.020)
0.013
18,862
0.017 (0.017)
0.012
18,862 75.1
Board of directors, all 1996-2001
-0.029* (0.010)
0.062 12,085
-0.024* (0.009)
0.050
12,085 565.4
0.002 (0.006)
0.018
12,085
0.003 (0.005)
0.015
12,085 60.0
0.015 (0.053)
0.021
12,080
-0.017 (0.039)
0.019
12,080 39.1
-0.009 (0.037)
0.017
12,085
-0.014 (0.026)
0.015
12,085 39.7
* denotes that the estimated parameter is statistically different from 0 at the 1% level of significance. 1) Values in brackets are standard errors of the estimated parameters, Adj. R2 is reported in row 3, and row 4 includes the number of observations in each regression analysis. The values reported in row 5 are Hausman Chi-square test for systematic differences in estimated coefficients.