Embed Size (px)
Citation preview
Does Corporate Governance Affect Firm Value? Evidence from Korea†
BERNARD S. BLACK*
Stanford Law School
HASUNG JANG**
Korea University Business School
WOOCHAN KIM***
KDI School of Public Policy and Management
First draft: May 8, 2002
This draft: February 2003
† Earlier versions of this paper were presented at the Second Asian Conference on Corporate Governance
(2002), 8th Mitsui Life Symposium on Global Financial Markets (2002), International Monetary Fund (2003), KAEA (Korea America Economic Association) annual meeting (2003), Korea Fair Trade Commission (2002), Korea Association of Industrial Organization (2002), KDI School of Public Policy and Management (2002), Korean Financial Association (2002), and [to come]. We thank Stephen Bainbridge, Harold Demsetz, John Donohue, Miyajima Hideaki, Ji-Sang Jang, Simon Johnson, E. Han Kim, Florencio Lopez-de-Silanes, Jun Qian, Hyun-Han Shin, and [to come] for comments.
* Professor of Law, Stanford Law School, Stanford, California U.S.A. 94305. Tel: (+1) 650-725-9845, fax (+1) 650-725-0684, e-mail: [email protected]
** Professor of Finance, Korea University Business School, Anam-Dong, Sungbuk-Ku, Seoul, Korea 136-701. Tel: (+82-2) 3290-1929, fax: (+82-2) 929-3405, e-mail: [email protected]
*** Professor of Finance, KDI School of Public Policy and Management, Chongyangri-Dong Dongdaemun-Ku, Seoul, Korea 130-868. Tel: (+82-2) 3299-1030, fax: (+82-2) 968-5072, e-mail: [email protected]
1
Abstract
We report evidence that corporate governance is an important factor in explaining the market value of Korean public companies. We construct a corporate governance index (0~100) for 526 companies based primarily on responses to a Spring 2001 survey of all listed companies by the Korea Stock Exchange. The index is based on six subindices for shareholder rights, board of directors in general, outside directors, audit committee and internal auditor, disclosure to investors, and ownership parity. A moderate 10 point increase in the corporate governance index predicts a 5% increase in Tobin’s q and a 14% increase in market/book ratioin ordinary least squares (OLS) regressions. A worst-to-best change in the index predicts a 38% increase in Tobin's q and a 105% increase in market/book ratio. This effect is statistically strong and robust to choice of performance variable (Tobin's q, market/book, and market/sales) and to specification of the corporate governance index. Each subindex is an individually significant or marginally significant predictor of higher Tobin's q (and other performance variables).
Unique features of Korea's corporate governance rules allow us to use an instrumental variables approach to address two alternate explanations for these results: signaling (firms signal high quality by adopting good governance rules) and endogeneity (firms with high Tobin’s q choose good governance rules). Some important Korean governance rules apply only to firms with assets over 2 trillion Korean won. If the portion of the corporate governance index that is due to these rules predicts higher Tobin’s q (or other measures of firm value), this cannot be due to signaling or endogeneity. We use both a two-stage (2SLS) and a three-stage (3SLS) least squares approach, using as an instrument a dummy variable for assets over 2 trillion won, with a separate control for ln(assets). The 2SLS and 3SLS coefficients are larger than the OLS coefficients and are highly significant. This is consistent with causation running from the exogenous component of governance rules to higher Tobin’s q (and other performance variables).
Key words: Korea, corporate governance, firm valuation JEL classification: G300

1
I. Introduction
How do a country’s corporate governance rules, or the corporate governance practices of individual firms within a country, affect overall firm value and performance? A well-known line of research that begins with a series of papers by La Porta, Lopez-de-Silanes, Shleifer and Vishny provides evidence that countries with stronger legal protections of minority shareholders have larger securities markets, less concentrated share ownership, and a higher value for minority shares.1
A separate question is whether variation within a single country in the corporate governance practices of individual firms predicts these firms' market values. This question is central when individual firms – which can change their own practices, but not their country’s rules – must decide whether and how to change their corporate governance practices. To what extent can a firm improve its market value by upgrading its corporate governance practices? Conversely, to what extent is it tied to its home country’s overall reputation?
This second question is cent ral to the usefulness to investors of the new private sector corporate governance rankings. In 2001, Credit Lyonnais Securities Asia (CLSA) published a corporate governance ranking of 495 companies in 25 emerging markets (CLSA, 2001; Gill, 2002). Also in 2001, Standard & Poor’s published a “corporate governance” ranking (based only on disclosure), covering 859 companies in 27 countries (Standard & Poor’s, 2001). In 2000, Deminor published a governance ranking of the 300 European companies in the FTSE-300 index (Deminor, 2000; Coppieters, 2001). Institutional Shareholder Services launched in 2002 a governance ranking for the 3000 U.S. companies in the Russell 3000 index (McGurn, 2002).
If within-country, across-firm governance practices correlate with firm market value, a third question arises: Do good corporate governance practices cause investors to value firms more highly? An alternate explanation is that firms adopt good governance rules to signal that the firm’s insiders intend to behave well; but the signal, not the firm’s practices, affects firm value. A second alternate explanation involves endogeneity – firms with high market values adopt good governance practices, rather than vice versa.
This paper is one of several contemporaneous papers that explore how within-country variation in governance practices affect firm value, primarily in emerging markets. For related research, see Black, 2001 (Russian firms); Durnev and Kim, 2002 (using CLSA and
1 La Porta et al. (1997, 1998, 1999, 2000, 2002). For selected criticisms of this approach, see Coffee
(2001); Berkowitz, Pistor & Richard (2003).

2
Standard & Poor’s rankings); Klapper and Love, 2002 (using CLSA rankings); Gompers, Ishii and Metrick, 2003 (studying United States firms). Our paper differs from this related research in several ways.
First, we study a full cross-section of all listed Korean firms, both large and small. The other papers on emerging markets either use a small single-country sample (Black) or multicountry samples that contain only the largest firms in each country (Durnev and Kim; Klapper and Love).
Second, our focus on a single important emerging market also allows us to use a more complete set of control variables than are available in a multicountry study.
Third, we use a broad corporate governance index that is based on responses to objective questions. In contrast, the S&P rankings are based only on disclosure; the CLSA rankings are based in significant part on the subjective views of analysts, whose opinions could be influenced by their knowledge of firm performance; and the Gompers et. al rankings are based primarily on takeover defenses. However, disclosure quality correlates strongly with other aspects of corporate governance (see this paper and Black (2001)). Thus, the correlation between firm value and a disclosure ranking such as S&P could largely reflect the effect of omitted corporate governance variables.
Fourth, Korea's corporate governance rules uniquely let us use an instrumental variables approach to address signalling and endogeneity explanations. Some important rules apply only to firms that have assets of at least 2 trillion won (roughly US$2 billion). Below, we refer to these firms as "large" and firms with assets less than 2 trillion won as "small." The variation in exogenously imposed legal rules lets us construct an instrument (an asset size dummy at 2 trillion won) for our corporate governance index, using a separate control variable (ln(assets)) to control for firm size. The asset size dummy variable correlates with our corporate governance index (r = 0.57) and should be a respectable instrument as long as ln(assets) captures most of the variation in Tobin's q based on firm size. Other studies of within-country, across-firm variation in corporate governance lack plausible instruments. Our results are similar in OLS, 2SLS, and 3SLS specifications, with larger coefficients in the simultaneous equations results. These results strengthen our confidence in the OLS results, are consistent with causation running from good governance to higher firm value, and do not support either the signaling hypothesis or the hypothesis that more highly valued firms adopt better governance rules.
Our corporate governance data is taken from a detailed survey of all companies listed on the Korea Stock Exchange (KSE), conducted by the KSE in Spring 2001. The KSE’s sponsorship of the survey ensures a high response rate (540 of 560 surveyed companies), and

3
enhances the credibility of the responses, because the KSE has regulatory authority over listed companies. We use the survey responses to construct a corporate governance index (0~100). The index is composed of six subindices, for shareholder rights (subindex A), board of directors in general (subindex B), outside directors (subindex C), audit committee and internal auditor (subindex D), disclosure to investors (subindex E) , and ownership parity (subindex P). Ownership parity is a measure of the lack of a pyramidal or circular ownership structure (Joh, 2003, uses a similar corporate governance measure). The subindices are based on a total of 39 separate elements (38 survey questions plus the ownership parity measure).2
Our results are statistically strong and economically important. Our OLS results imply that a moderate 10-point increase in the corporate governance index, predicts an increase in Tobin’s q of 5% percent of the company’s book asset value or 14% of the company’s book value of common stock. A worst-to-best improvement in corporate governance predicts a 38% increase in Tobin's q and a 105% increase in market/book ratio. Our 2SLS and 3SLS results predict effects that are roughly three times larger: Turning from the overall index to the subindices, each of the six subindices separately predicts higher firm value. However, much of this effect is because the subindices are positively correlated with each other. The subindices that remain significant in regressions including the remainder of the index are disclosure to investors and ownership parity.
In addition to addressing the general question of whether improved governance can pay off in greater firm value, our results are important for the debate within Korea on the need for corporate governance reforms. Prior to the 1997-1998 financial crisis, Korean corporate governance practices were weak by international standards. Self -dealing by controlling shareholders was common, firms had few outside directors, and audit committees were almost nonexistent. Since the financial crisis, the Korean government has aggressive ly changed its governance rules. A minimum number of outside directors became mandatory (25% for all public companies, 50% for banks and large companies). Audit and nomination committees were introduced and made mandatory for banks and large companies. Chaebol-affiliated firms must disclose consolidated financial statements and obtain board-of-directors approval for self-dealing transactions. The number of shares a shareholder must hold to file a derivative suit or inspect a company’s financial records has been sharply reduced. Accounting rules have been strengthened. The list goes on. However, Korea’s economy has been strong for several years. Chaebol managers oppose further reforms and are seeking to reverse some
2 The survey contains both objective and subjective questions. In this paper, we construct and study an objective corporate governance index based on responses to the objective questions. We plan to construct and study a subjective corporate governance index in separate research.

4
of the post-crisis reforms. They portray corporate governance regulations as choking off their freedom and creativity, and question the link between corporate governance and firm performance. This paper offers evidence that stronger governance can pay off in higher market values.3
This paper is organized as follows. Part II reviews the literature on the relationship between corporate governance and firm value. Part III describes our data set and how we construct our corporate governance index. Parts IV and V discuss results from ordinary least squares (OLS) and simultaneous equations (two-stage (2SLS) and three-stage (3SLS) least squares) regressions, respectively. Part VI discusses various robustness checks on our results, and Part VII concludes.
II. Related Literature
A. The Effect of Country-Level Variation in Corporate Governance
There is substantial evidence that variation in country level rules predicts various measures of capital market strength, including larger securities markets relative to Gross Domestic Product (GDP), frequency of initial public offerings, less concentrated share ownership, and a higher value for minority shares (LLSV, 1997, 1998, 1999; La Porta, Lopez-de-Silanes and Shleifer, 2002). Consistent with this research, Nenova (2003) and Dyck and Zingales (2001) find evidence of systematic variation across countries in the value of control rights. Modigliani and Perotti (2000) find that a large premium on high-voting shares (suggesting weak protection of minority investors) and the level of corruption both predict a smaller stock market; Levine (1998, 1999) find that the quality of accounting disclosure predicts stock market size. Nenova (2001), in a case study of Brazil, finds evidence that change in the legal protection of minority shareholders can affect the value of control rights .
Lopez-de-Silanes, Shleifer and Vishny (2002) and Durnev and Kim (2002) find evidence that country-level variation in rules affects the market value of individual firms. Klapper and Love (2002) find, however, that this result is not robust in their study.
3 On the politics of Korean corporate governance reform, see Black, Metzger, O'Brien and Shin (2001).
On Korea's recent reforms, see Kim (2002).

5
B. The Effect of Within-Country, Across-Firm Variation in Corporate Governance There is as yet much more limited evidence that variation in corporate governance practices across firms but within a single country importantly affects firm value. In developed countries, even careful studies often fail to find statistically significant effects of corporate governance on firm value or performance. When significant results are found, they are often economically small (Gompers, Ishii and Metrick, 2003, is a recent exception). However, developing countries may offer more fertile ground for study. Black (2001), argues that larger effects are likely to be found in developing countries, because these countries often have weaker rules and larger variations between firms in corporate governance practices; Durnev and Kim (2002) report supporting evidence.
Most of the empirical literature studying the link between corporate governance and firm performance concentrates on particular aspects of governance, such as board composition, shareholder activism, executive compensation, antitakeover provisions, or particular investor protections. To name a few, Millstein and MacAvoy (1998) and Bhagat and Black (2002) investigate the relationship between board characteristics and firm performance. Karpoff, Malatesta, and Walking (1996) and Carleton, Nelson, and Weisbach (1998) link firm performance with shareholder activism. Bhagat, Carey, and Elson (1999) look at the relationship between outside director pay and firm performance. Sundaramurthy, Mahoney, and Mahoney (1997) link firm performance with antitakeover provisions. Gompers, Ishii and Metrick (2003) link firm performance to a corporate governance index based largely on takeover defenses.
In emerging markets, Black (2001) reports a powerful correlation between the market value and corporate governance of Russian firms. A worst-to-best improvement in governance predicts a 700-fold (70,000%) increase in the market value of a Russian firm as a percentage of theoretical Western market value. However, his sample is small (21 firms), and he does not control for endogeneity. Durnev and Kim (2002) find that higher scores on both the CLSA corporate governance index and the S&P disclosure and transparency index predict higher firm value for a sample of 859 large firms in 27 countries, Klapper and Love (2002) find similar results for the CLSA index for a sample of 495 large firms in 25 countries. We discuss in the Introduction the principal differences between our paper and this related research.
A related body of research studies the effect of decisions by firms in emerging markets to cross- list their shares on major world exchanges. Cross- listing generally predicts an increase in share price. An important driver of this increase appears to be compliance by cross-listed

6
companies with stricter disclosure and other corporate governance rules (e.g., Lang, Lins and Miller, 2003; Doidge, Karolyi and Stulz, 2002; Coffee, 2002).
III. Data and Construction of Corporate Governance Index A. Data Sources
We construct a corporate governance index based primarily on a 2001 survey by the Korea Stock Exchange (KSE). The KSE sent an extensive survey of corporate governance practices and attitudes to the disclosure officers of all listed companies. The survey was completed between March and July 2001. The response rate was very high: 540 out of the 560 surveyed companies responded. We exclude 5 banks that were wholly owned by the government, leaving a sample of 535 firms.4
We take balance sheet and income statement data from the TS2000 database, maintained by the Korea Listed Companies Association. We take stock market and share ownership data from a KSE database. Share ownership data is available for 526 companies. We take the list of top-30 chaebol companies from press releases by the Korean Fair Trade Commission. Table 3, Panels B and C show summary statistics and a correlation matrix for selected variables used in this paper. B. Construction of the Corporate Governance Index We extract 123 variables from the survey questions. We exclude questions that are subjective (they ask for management's opinions and future plans); lack clear relevance to corporate governance; are ambiguous as to which answer indicates better governance; had minimal variation between firms; overlap highly with another variable; or had very few responses.5 This leaves us with a usable set of 38 elements for our corporate governance index.
We classify these variables into five subindices: (i) shareholder right s (subindex A); (ii) board of directors in general (subindex B); (iii) outside directors (subindex C); (iv) audit committee and internal auditor (subindex D); and (v) disclosure to investors (subindex E). We
4 At the time of the survey, the KSE had 699 listed companies. It did not survey 139 companies that
were on a watch list for possible delisting. Consistent with our agreement with the KSE, we do not discuss individual companies in this paper.
5 An English translation of the survey and an explanation of our reasons for excluding variables are available from the authors on request.
7
add a sixth one-element subindex for "ownership parity", which measures the extent to which the largest shareholder uses a pyramidal or cross-holding structure to control more votes than the shareholder directly owns (subindex P). These structures increase the incentives and ability of controlling shareholders to engage in self-dealing (Bebchuk, Kraakman, and Triantis, 2000). Ownership parity is defined as 1 - ownership disparity, with ownership disparity defined as ownership by all affiliated shareholders - ownership by the largest shareholder.6 Table 1 describes the variables used in constructing each subindex and provides summary statistics for these variables.
We combine the subindices into an overall corporate governance index as follows. We standardize each subindex to have a value between 0 and 20. Our principal overall corporate governance index (CG1) is constructed as follows:
( ) PEDCBACG +++++= 21 -----------------------------------------------------------(1)
Here, we combine the related B and C subindices into a single board of directors subindex. Thus, the overall corporate governance index has a value between 0 and 100, with better-governed firms having higher scores.
Each element in each subindex is constructed to have a value between 0 and 1. To obtain a subindex, we compute a simple sum over the elements of the subindex and divide by the number of ‘non-missing’ elements.7 We multiply this ratio by 20 so that the subindex takes a value between 0 and 20. C. Description of the Index
Figure 1 shows a histogram of the overall corporate governance index CG1. A normal distribution curve is superimposed. The distribution of corporate governance index is slightly skewed to the right (long tail to the right).8 Table 3, Panel A provides summary statistics for
6 We use the definition of largest shareholder in the Securities and Exchange Act. According to the Act,
the largest shareholder is the shareholder, together with its related parties, that holds the largest number of shares outstanding. Related parties include relatives, affiliated firms, and company directors. Using this definition, the largest shareholder can be either an individual or a firm.
7 Since we compute a ratio based only on nonmissing values , we do not have to worry directly about missing values. However, because mean scores differ across elements, , a firm could score higher or lower under our approach than under an alternate approach where we first normalized the responses to each element and then used the normalized responses to compute the subindices.
8 Skewness is computed to be 0.7804. The median is 37.72.
8
the overall CG1 index and each subindex. The index mean (median) is 38.35 (37.72); the minimum is 12.93, and the maximum is 85.85. Table 3, Panel D provides a correlation matrix for CG1 and each subindex. D. Comparison with Other Corporate Governance Indices The CLSA corporate governance index (relied on by Durnev and Kim, 2002, and Klapper and Love, 2002) includes 19 firms that are also in our sample. The S&P disclosure index (relied on by Durnev and Kim, 2002) includes 33 overlapping firms. This overlap lets us examine the correlation between our index and these other indices. Table 3, Panel A provides simple statistics on these indices [discussion to come]. Table 3, Panel D shows the correlation between our index and these alternate indices. The correlation is surprising modest, especially for the S&P index. The correlation between CG1 and the CLSA index is 0.32; the correlation between CG1 and the S&P index is only 0.06. Surprisingly, the correlation between the S&P disclosure index and our disclosure subindex (subindex E) is only 0.02. Because of small sample size, we cannot say much about the power of the CLSA and S&P indices for our sample, although we conduct some crude checks in Part IV.D below.
IV. Corporate Governance and Firm Value: OLS Results
This part presents our OLS results. In all regressions, we identify outliers and drop them from the sample. We treat observations as outliers if a studentized residual obtained by regressing Tobin’s q on CG1 and intercept (without other control variables) is greater than 1.96 or smaller than –1.96.9 This method identifies 29 outliers. Elimination of outliers plus data availability for the control variables described in Section B reduces the number of firms in our regressions from 526 to 489. A. Whole Sample Scatter Plots Figures 2, 3, and 4 show scatter plots for ordinary least squares regressions of our corporate governance index, CG1, against three measures of firm performance: Tobin's q (market value
9 A studentized residual of observation i is a residual obtained from a fitted regression line estimated
without observation i divided by the standard deviation of residuals computed without observation i. In the robustness checks in Part VI, we follow the same procedure to identify and exclude outliers for other performance variables (market/book and market/sales).

9
of assets/book value of assets), market/book (market value of common stock/book value of common stock) and market/sales (market value of assets/sales). In each figure, there is a visually obvious correlation. We confirm below that these correlations survive, essentially unchanged, when we add a battery of control variables and perform various robustness checks. B. Whole Sample OLS Results and Control Variables An important strength of an in-depth study of corporate governance in a single country, compared to a multi-country study, is data availability that lets us develop a reasonably thorough set of control variables. This reduces the likelihood that omission of relevant variables will produce a spurious correlation between corporate governance index and firm value. In Table 4, Panel A, regression (1), we regress Tobin's q against corporate governance index, CG1.. We then progressively add an extensive set of control variables , showing selected results with a partial set of control variables in regressions (2)-(4), and results with a full set of control variables in regression (5).
CG1 is highly significant in each of these regressions. 10 Adding control variables scarcely changes the coefficient on CG1. The t-statistic remains strong in all regressions. Regression (5) implies that an increase in corporate governance index by 10 points results in an increase of market capitalization by 10 × 0.0052 = 0.052 (5.2%) of the company’s book asset value. A worst-to-best change in corporate governance, from CG1 = 12.93 to 85.85, predicts a 38% increase in Tobin's q. These are economically important differences.
Our control variables, their rationale, and results from regression (5), with a full set of control variables, are described below. In the regressions described later in this paper, we use the same set of control variables, but to simplify the tables, we often omit coefficients and t-statistics for some variables (generally the insignificant variables).
• We follow the common practice of using ln(assets) to control for firm size (see, e.g., Shin and Stulz, 2000, Durnev and Kim, 2002).11 Ln(assets) is negative and highly significant. We consider the functional form for the dependence of Tobin's q on firm size with more care in Part VI.C because of its importance for our instrumental variable.
10 In this paper, we refer to results as marginally significant if they are different from zero at the 90%
confidence level, significant if they are different from zero at the 5% level, and highly significant if if they are different from zero at a 99% or higher level, in each case using a two-tail test.
11 Our results are similar if we use ln(sales) instead of ln(assets) as a control for firm size. This is not surprising due to the high correlation (r = 0.91) between the two measures.

10
• We control for firm age using ln(years of listing) as a control variable.12 We expect a negative coefficient because more recently listed firms are likely to be faster-growing, and perhaps more intangible asset- intensive. This variable is negative and significant.
• We include a control variable for debt/equity ratio (when we use market/book as a dependent variable, we use debt/assets as a control variable). This control is positive and significant.
• We control for industry with dummy variables based on 2-digit Korea Standard Industrial Classification) (KSIC) codes to capture industry effects. We find similar full-sample results with 4-digit industries.13
• Tobin's q is positively related to a firm's growth prospects and to intangible assets. We control for these effects with control variables for sales growth over the last 5 years, R&D expense/sales, and advertising expense/sales. Sales growth is not significant. R&D/sales and advertising/sales positive and significant, though less so if we use 4-digit industry controls. However, only advertising/sales remains significant in our 2SLS and 3SLS regressions.
• The firm's market share within its industry, as well as overall industry concentration, may affect profitability. We therefore include control variables for market share (the firm's share of sales in its 4-digit industry) and market concentration (the Herfindahl Hirschman index for the firm's 4-digit industry). Market share is (surprisingly)
12 Compare Shin and Stulz (2000), who use a ln(firm age) control. We expect similar results for
ln(years listed) and ln(firm age); we use ln(years listed) because of easier data availability. 13 For full sample regressions, coefficients on CG1 were generally similar and t-statistics were
moderately higher with 4-digit industry controls. Coefficients and t-statistics for CG1 were sometimes weaker with 4-digit industry controls for regressions using smaller subsamples (under 100 firms), perhaps due to loss of degrees of freedom. Summary information on each 2-digit industry with at least one firm in our sample follows.
Code Industry No. of firms
Mean value of CG1
Mean value of Tobin's q
4 manufacturing 376 36.5 0.83 11 financial institutions and insurance 65 47.3 0.93 7 wholesale/retail trade 32 39.2 0.83 6 construction 26 36.8 0.82 9 transportation 13 39.1 0.82 5 electric, gas, water supply 10 39.4 0.77 13 services 7 45.2 1.16 2 fishing 4 27.4 0.51 10 post and telecommunications 3 63.0 1.48 3 mining 2 32.9 0.86 8 hotels and restaurants 1 37.4 0.84 17 recreation, culture, sports 1 25.1 1.84
Whole sample -- 526 38.2 0.85

11
insignificant. Market concentration is positive and significant, but loses significance in the 2SLS and 3SLS regressions in Table 9.
• The market value of common stock may be higher for firms with more easily traded shares. We control for ease of trading with a measure of share turnover, defined as turnover = total shares traded/(shares held by public shareholders). Turnover is positive and significant. It weakens and becomes only marginally significant in 2SLS and insignificant in 3SLS.
• We include a control variable for membership in the top 30 chaebol, because other studies report evidence that chaebol firms behave differently than non-chaebol firms (Joh, 2003; Cho and Kang, 2002; Ferris, Kim and Kitsabunnarat, 2003). Chaebol30 is positive and significant, but loses significance in 2SLS and 3SLS, and also in OLS regressions with 4-digit industries. These neutral-to-positive results contrast with Joh (2003), who finds lower profitability of chaebol- firms prior to the 1997-1998 financial crisis, and Cho and Kang (2002), who find lower market/book for chaebol firms in the post-crisis period from 1998-2000.14
• We include share ownership by the largest shareholder. Other studies find that high insider share ownership predicts higher value for Korean firms (Joh (2003) and Cho and Kang (2002)). In contrast, we find that the coefficient on sole ownership is close to zero. A possible explanation could be that our corporate governance index includes an ownership parity subindex (subindex P), and ownership parity is positively correlated with sole ownership (see Table 4, Panel B, regression (7)). 15 However, this explanation is not supported by our data. Sole ownership remains small, insignificant, and of varying sign in regressions of Tobin's q on subindices A through E in Table 4, Panels B and C.
• We control for the existence of level 1, or level 2 or 3 ADRs. Firms with level 2 and 3 ADRs must comply with many of the disclosure rules of the stock exchange and country where they are cross- listed. In contrast, firms with level 1 ADRs are generally not subject to additional disclosure requirements. Other studies report that firms with level 2 or 3 ADRs, have higher Tobin's q (Doidge, Karolyi and Stulz, 2002; Coffee,
14 Ferris, Kim and Kitsabunnarat (2003) also find lower "excess value" (closely related to Tobin's q) for
chaebol. firms . However, their results are suspect because chaebol firms are much larger than non-chaebol firms, on average, larger Korean firms have lower Tobin's q (see this paper and Cho and Kang, 2002), and they do not control for firm size.
15 The logic is that omitting a control for ownership parity, which correlates positively with both Tobin's q (r = 0.27) and sole ownership (r = 0.31), could produce a higher coefficient on ownership in these other studies.

12
2002). Only 10 firms in our sample have level 1 ADRs, and only 6 firms have level 2 or 3 ADRs. These small numbers make it unlikely that the coefficients on these variables will be significant. In fact, the coefficients on both ADR variables are small and insigificant. in OLS, and turn negative in 2SLS and 3SLS. However, the coefficient on level 2 or 3 ADRs is positive and marginally significant in regressions with CG1 (rather than Tobin's q) as a dependent variable (see Table 9, Panel A, regression (2)).
• We use a dummy variable to control for inclusion in the Morgan Stanley Capital International (MSCI) Index. Inclusion in this index may proxy for foreign investor interest. The MSCI dummy variable is positive and significant. One might surmise that firms in the MSCI Index will have better corporate governance, either due to pressure from foreign investors or perhaps because better governance affects the chance that a firm will be included in this index. This surmise is not confirmed. The MSCI Index dummy is small and insignificant as a predictor of CG1 (see Table 9, Panel A, regression (1)).
• We include a bank dummy variable because banks may behave or be valued differently than other firms. There are only 12 banks in our sample. The coefficient on the bank dummy is small and insignificant. In contrast, the bank dummy is positive and highly significant as a predictor of CG1 (see Table 10, Panel A, regression (1)).
Table 2 provides a more detailed description of each control variable.
C. Subindices
In Table 4 Panel B, we regress Tobin’s q on corporate governance index CG1 (reproducing Panel A, regression (7)), and the six subindices that comprise CG1: A (shareholder rights), B (board of directors in general), C (outside directors), D (audit committee and internal auditor), E (disclosure to investors), and P (ownership parity). Each regression uses the control variables developed in Panel A. Each subindex ranges from 0 to 20.
Each individual subindex is statistically significant at the 1% or 5% level. The strongest results are for subindices P (ownership parity), E (disclosure to investors), and A (shareholder rights), in that order. 16 The coefficient of 0.0042 on subindex D, for example,
16 Joh (2003) reports a negative and often (though not always) significant relationship between
ownership disparity and firm profitability.
13
implies that an improvement in corporate governance practice concerning the audit committee and internal auditor D, by 10 points predicts a 4.2% of the company’s book asset value.
Since each subindex is significant, we expect that any weighting scheme will produce an overall index that is statistically significant in explaining the variation of Tobin's q. The coefficients are all similar in magnitude, ranging from a low of .0042 (for subindex D, audit committee and internal auditor) to a high of 0.0167 (for subindex P, ownership parity). Thus, the weighting of the subindices in the overall index is unlikely to greatly affect the coefficient or significance of the overall index. We confirm this intuition in Part VI, where robustness checks show that a number of alternative corporate governance indices produce similar results.
In Table 4 Panel C, Tobin’s q is regressed on each of the individual subindices with an additional control variable that captures the remainder of the index. That is, when regressing Tobin’s q on subindex A, we include the sum of the remaining subindices (B+C+D+E+P) as an additional control variable. Once we do this, only ownership parity (subindex P), disclosure to investors (subindex E), aned shareholder rights (subindex A) remain significant. This is consistent with all subindices being positively correlated (see Table 3, Panel D), and having a cumulative effect on Tobin's q.
D. Comparison with and Other Corporate Governance Indices
To test the power of the CLSA and S&P indices, we rerun our OLS regressions
substituting these indices for CG1. Because of the small sample size (19 firms for CLSA; 33 firms for S&P), we try both regressions with all control variables and simpler regressions that use fewer control variables but preserve more degrees of freedom. The CLSA index is positive but insignificant in specifications that omit industry controls, and becomes slightly negative when we add industry controls. In a simple regression of Tobin's q on CLSA index plus constant term, the coefficient is .0074 (r = 0.13; t = 0.66), and is insignificant.
The S&P index is stronger. The coefficient for a simple regression of Tobin's q on S&P index plus constant term is .077 (r = 0.35; t = 2.72), compared to .006 (r = 0.22; t = 6.97) for the CG1 index. The coefficient on the S&P index declines to .054 and becomes only marginally significant when we add a full set of control variables other than industry controls, and declines again to .038 and becomes insignificant (t = 0.73) when we add 2-digit industry controls.
From this partial evidence, the S&P index would likely have predictive value for our full sample. It is possible, though far from certain, that the CLSA index would also have predictive value for our full sample.

14
E. Individual Corporate Governance Elements
Table 5, Panel A, shows results when Tobin’s q is regressed on each individual element
of the corporate governance index. Each regression includes the same sample firms and control variables as in Table 4 Panels B and C. Almost all (35/38) of the coefficients on individual corporate governance elements are positive, and the three negative coefficients are insignificant. At the same time, only 8 out of 38 individual elements are significant at the 5% level. This implies that the elements of the corporate governance index have more predictive power when aggregated into an index than individually.
The individual elements that are positive and significant are summarized in Table 5, Panel B. Some these elements relate to plausibly important governance elements. This conclusion applies to element C1 (firm has at least 50% outside directors); element D1 (firm has an audit committee); element D3 (bylaws governing audit committee or internal auditor exist); element D10 (audit committee or internal auditor meets with the external auditor), and element P (ownership parity, described above). The other three significant elements appear to address less central elements of corporate governance. It is not apparent why these elements were significant, while other elements were not. These elements are A4 (firm discloses director candidates to shareholders in advance of shareholder meeting), E1 (firm conducted investor relations activity in 2000), and E2 (firm website includes resumes of board members). A posssible explanation is that all three elements involve some form of disclosure (even though we include element A4 in the shareholder rights subindex, rather than the disclosure subindex). They likely correlate with and proxy for other measures of disclosure quality. The KSE survey did not ask many questions about disclosure, so we cannot verify this suspicion.
The single strongest coefficient is for element C1 (at least 50% outside directors), which has a coefficient of 0.1679 and a t-statistic of 5.03. The coefficient implies that a firm with 50% outside directors has a higher market capitalization by 17% of book asset value (albeit without controlling for the correlation of this element with other corporate governance elements). This result is in sharp contrast to the weak results found in the United States and other developed countries, where no one has yet found a reliable correlation between board composition and overall firm value or performance, despite many efforts. See Bhagat and Black (2002), and the surveys in Bhagat and Black (1999) and Weisbach and Hermalin (2002). This suggests that board independence is more important in a country where other constraints on insiders are weak. Independent directors could then play a larger role in, for example, controlling self-dealing transactions. An interesting question for future research is whether
15
the level of self-dealing (investments in or other transactions with affiliated firms, transactions between firms and their controlling shareholders, issuance of shares or convertible bonds to insiders) is in fact lower for firms with 50% (element C1) or more than 50% (element C2) outside directors (which has a positive but insignificant coefficient in Table 5, Panel A).
F. Subsample Results The governance structure of Korean firms is in significant part determined by legal requirements. Legal requirements, in turn, depend in part on three factors: book asset value, affiliation to banking industry, and membership in one of the top 30 chaebol.
The Securities and Exchange Act sets the minimum ratio and number of outside directors, requires the establishment of audit and nomination committees, and sets the minimum ratio of outside directors in the audit committee. Such minimum ratios and requirements, however, vary according to the company’s book asset value. Listed companies with assets greater than 2 trillion won must have at least three outside directors and at least 50% outside directors. Those below the 2 trillion-won threshold need only to have 25% outside directors. Also, listed companies with assets greater than 2 trillion won must establish audit and nomination committees. When the audit committee is required, two third of its members must be outside directors and the chairperson must be an outside director. Thus, book value of assets is an important determinant of corporate governance in Korea.17
The Banking Act shapes the governance structure of commercial and merchant banks. Most of the requirements in the Securities and Exchange Act that apply to companies with assets greater than 2 trillion won also apply to commercial and merchant banks, regardless of their size. Thus, membership in the banking industry is another factor affecting corporate governance in Korea.18
The Monopoly Regulation and Fair Trade Act shapes the governance structure of firms that belong to one of the top 30 chaebol. For these companies, the Act requires board approval for related-party transactions if transaction size is greater than 10% of equity capital or 10 billion won. This requirement was not in effect for non-chaebol firms when the survey
17 The correlation coefficient between corporate governance index CG1 and asset size dummy (=1 if
book value of assets > 2 trillion won) in our sample is 0.57 and statistically different from zero at 1% significance level.
18 The correlation coefficient between corporate governance index and banking dummy (=1 if a commercial bank or a merchant bank) in our sample is 0.3993 and statistically different from zero at 1% significance level.

16
was conducted.19 Thus, membership in the top 30 chaebol is a third factor influencing corporate governance in Korea.20
The fact that corporate governance is positively correlated with book asset value, membership in the banking industry, and membership in the top 30 chaebol raises a concern that the positive correlation in Table 4 Panel A between corporate governance and firm value may be spurious. For instance, if asset size, (or bank membership or top 30 chaebol membership) is correlated both with firm value (Tobin’s q) and with our corporate governance index (CG1) because of the way Korean law is written, one would expect to find a positive correlation between CG1 and Tobin’s q even when there is no direct link between the two. The spurious relationship, however, can be checked by running the same regression as in Table 4 Panel A on the following six subsamples: banks (commercial and merchant) versus non-banks; firms belonging to the top 30 chaebol versus firms not so belonging; and firms with assets greater than 2 trillion won versus firms with assets less than 2 trillion won. If we find a positive link between corporate governance and firm value within the subsamples, this is evidence that the relationship is not spurious.
Table 6 shows the results. Notice that corporate governance index, CG1, is still an important factor explaining the variation of firm value in five out of six subsamples. The coefficient on corporate governance is not significant in the bank subsample, but this subsample has only 12 firms. The explanatory power of corporate governance is particularly high for the chaebol subsample. When explaining Tobin’s q, the coefficient on corporate governance index is higher for the chaebol subsample than for the non-chaebol subsample (0.0094 versus 0.0045). This difference is significant (t-test for difference = 3.15)
19 With the amendment of the Securities & Exchange Act in March 28, 2001, all listed companies with
book asset value greater than 2 trillion won must obtain board approval for related party transactions if the size is greater than 1% of book asset value or 1% of total sales. Such amendment, however, was not in effect at the time when the survey was conducted.
20 The correlation coefficient between corporate governance index and chaebol dummy (=1 if affiliated to a chaebol) in our sample is 0.2776 and statistically different from zero at 1% significance level.

17
V. Corporate Governance and Firm Value: Simultaneous Equations Results A. Endogeneity and the Effect of Mandatory Versus Voluntary Governance Choices Two recurring issues in this and other studies of firm-level corporate governance are the potential for our results to be explained by signalling (firms signal high quality by adopting good
governance rules, and it is the signal, not the governance rules, that affects firm value); and endogeneity
(firms with high market value choose good governance rules, so that causation runs from our dependent
variable (firm value) to corporate governance, rather than vice-versa). Firms with high market values could choose better governance structures for several reasons. They could choose better governance structures because (i) the firm's insiders believe that these structures will further raise firm value; (ii) firms with high Tobin's q (or other measure of firm value) benefit from improved governance structures more than other firms; or (iii) the firm's insiders believe that doing so will signal management quality even if the signal (the governance structure) does not in fact affect firm va lue. In the first case (partial reverse causation), there will be a causal connection between corporate governance and firm value, but the OLS coefficient will overstate the connection. In the second case (different firms need different governance structures), there will be a causal connection, but the OLS coefficient will overstate the connection and the causal connection for some firms will not imply that other firms can improve their market values by improvimg their governance. In the third case (signalling), there will be no causal connection at all.
There is evidence of endogeneity in other corporate governance studies. For example, Bhagat and Black (2002) report evidence from OLS regressions of a negative correlation between board independence and measures of firm performance. However, they also find evidence that firms that perform poorly increase the independence of their boards of directors. After controlling for this endogenous effect of performance on board composition, the negative correlation between board independence and firm performance weakens and is not reliably significant. Weisbach and Hermalin (2001) discuss endogeneity issues in board composition studies. Durnev and Kim (2002) develop a simple model in which a firm's choice of corporate governance is endogenously related to its investment opportunities, desire for external financing, and ownership by the controlling shareholder.
One way to assess the robustness of our results in the face of possible endogeneity is to see if they are present for subsamples. We have already confirmed robustness for several plausible subsamples in Table 6.

18
To test for the endogeneity of corporate governance, we follow the two-step procedure suggested by Wooldridge (2000). First, the possibly endogenous variable (corporate governance index) is regressed on all exogenous variables including the variable proposed to be used as an instrument for the potentially endogenous variable. The residual from this first-stage regression is the portion of the corporate governance index that is not predicted by the instrument or the other control variables, and thus is potentially endogenous. Second, the residual is added to the original equation and OLS is estimated. A significant coefficient on the residual is consistent with corporate governance being endogenous. A positive (negative) residual implies that the dependent variable (firm value) predicts a higher (lower) corporate governance score, and therefore that the OLS regression coefficients are upward (downward) biased.
Table 7 reports our results, using an asset size dummy as the instrument for corporate governance. We explain this choice of instrument below in Section B. The endogenous component of corporate governance is negatively correlated with the error term for Tobin's q. This suggests that the coefficients estimated by OLS in Tables 4, 5, and 6 are downward biased, and once endogeneity is addressed, the coefficient on corporate governance should increase. We in fact observe higher coefficients in the regressions in Table 7, where the coefficient on CG1 (and subindices C and D) can be interpreted as the coefficient on the exogenous component of this variable, and in the 2SLS and 3SLS regressions reported below 21
The negative coefficients on the residuals in Table 7 have several possible interpretations, but none are satisfactory. One interpretation is that more highly valued firms choose worse corporate governance rules, perhaps because they face less investor pressure to improve their governance. (Compare the evidence in Bhagat and Black (2002) that worse-performing firms increase the independence of their boards of directors.) This interpretation, however, is not confirmed by the 3SLS regressions in Table 9, where Tobin's q takes a positive, albeit insignificant coefficient in regressions with CG1 as the nominally dependent variable.
A second interpretation is that only mandatory corporate governance rules predict higher firm value, while voluntarily chosen rules have the opposite effect. This seems implausible -- why would these rules reduce firm value, and if they did, why would firms choose these rules? This explanation is also inconsistent with the positive, albeit insignificant coefficient on Tobin's q in the 3SLS regressions with CG1 as the nominally dependent variable. Lacking a good explanation, we leave this question as a puzzle that deserves future research.
21 By construction of the Wooldridge endogeneity test, the coefficients on corporate governance index
and subindices in Table 7 are identical to those reported in Table 9 using 2SLS and 3SLS.
19
B. Instrument Specification
Standard econometric techniques for addressing possible endogeneity require identifying a good instrument. The instrument should ideally be exogenous and not likely to be influenced by the dependent variable of interest (here firm value, measured by Tobin’s q or, in our robustness checks, market/book, or market/sales). The instrument should be correlated, preferably strongly, with the independent variable of interest (corporate governance index) but otherwise uncorrelated with the dependent variable of interest (firm value). That is, the instrument should predict the dependent variable only indirectly, through its effect on the independent variable. For a recent survey of techniques for addressing endogeneity, see Angrist and Krueger, 2001.
To address endogeneity, we use an asset size dummy variable (defined to equal 1 if book value of assets is greater than 2 trillion won; and 0 otherwise) as the exogenous instrumental variable that is correlated with corporate governance, but hopefully does not directly predict Tobin's q (or other measures of firm value).22 We use ln(assets) as a separate control for firm size that hopefully captures most of the way in which firm size directly influences Tobin's q. We use both two-stage (2SLS) and three-stage (3SLS) least squares regressions to estimate the coefficients.23
We do not expect the asset size dummy to be a va lid instrument for banks (which must have an audit committee and at least 50% outside directors regardless of size) or for subindices A, B, E, or P (which do not include rules for which the 2 trillion won size cutoff is relevant). Thus, in our endogeneity tests in Table 7 and in the 2SLS and 3SLS regressions discussed below, we exclude 12 banks from the sample, leaving a non-bank subsample of 477 firms. When we examine subindices, we study only subindices C and D.
We believe that the asset size dummy is an appropriate instrumental variable for the following reasons. First, as explained above in Part IV. E, the Securities and Exchange Act
22 Other corporate governance rules apply only to banks or only to firms that are part of one of the 30
largest chaebol groups. However, dummy variables for bank or membership in the top 30 chaebol are not satisfactory instrumental variables for corporate governance because they are likely to correlate with Tobin's q for reasons other than the quality of governance. This is obvious for banks, since industry is likely to affect Tobin's q. Firms that belong to a major chaebol group may be different than other firms in various ways, including political connections, access to financing (Shin & Park, 1999), or degree of diversification (Ferris, Kim & Kitsabunnarat, 2003).
23 3SLS , unlike 2SLS , makes use of the covariance matrix computed from the two disturbance terms in the 3SLS simultaneous equations framework. If the regression equations are just identified, the coefficients on 2SLS and 3SLS will be identical. However, the standard errors (and thus the t-statistics) will be different.

20
makes asset size an important determinant of corporate governance. Korean firms with assets greater than 2 trillion won must have an audit committee, an outside director nomination committee, and at leaset 50% outside directors. The effect of these legal requirements on corporate governance can be safely said to be exogenous.24
Second, once we control for the direct effect of asset size on Tobin's q through a control variable for ln(assets), it seems likely that the asset size dummy predicts firm value primarily indirectly, through its effect on corporate governance. We return in Part VI.C to the qeustion of whether ln(assets) is a reasonable functional form for the direct effect of firm size on Tobin's q.
Third, we confirm in Table 8 that the asset size dummy at 2 trillion won has predictive power for CG1 and subindices C and D precisely where it should based on the relevant legal rules, and that asset size dummies at other sizes lack similar power. In Table 8, Panel A, we regress the overall corporate governance index (CG1) and each subindex (A, B, C, D, E, and P) on our usual control variables, including ln(assets),plus a family of asset size dummy variables, defined as follows:
Asset size dummy 1 = 1 if ln(assets) > 3.6 (assets > 37 billion won); 0 otherwise Asset size dummy 2 = 1 if ln(assets) > 4.6 (assets > 99 billion won); 0 otherwise Asset size dummy 3 = 1 if ln(assets) > 5.6 (assets > 270 billion won); 0 otherwise Asset size dummy 4 = 1 if ln(assets) > 6.6 (assets > 735 billion won); 0 otherwise Asset size dummy 5 = 1 if ln(assets) > 7.6 (assets > 2 trillion won); 0 otherwise (this is our instrumental variable)
Asset size dummy 6 = 1 if ln(assets) > 8.6 (assets > 5.4 trillion won); 0 otherwise Asset size dummy 7 = 1 if ln(assets) > 9.6 (assets > 14.8 trillion won); 0 otherwise
If the legal rules that apply to firms with assets greater than 2 trillion won cause these firms to have higher corporate governance scores, we should observe a significant coefficient on asset size dummy 5 for CG1, and the subindices to which the relevant legal rules apply -- C (outside directors) and D (audit committee and internal auditor). We expect other asset size dummies to show no consistent effect on CG1 or any of the subindices, and we expect asset size dummy 5 to have no significant effect on subindices A, B, E, and P.
24 Some firms with assets close to 2 trillion won might manage their assets to avoid being subject to these legal requirements. We are not aware of anecdotes suggesting such behavior, and the corporate governance rules are mild enough so that this is unlikely. Only a few firms have assets close enough to 2 trillion won to make this manipulation plausible. Three firms in our sample have assets between 1.9 and 2 trillion won, compared to 2 firms with assets between 2.0 and 2.1 trillion won. This difference is obviously not significant. For broader ranges of asset size (1.8-2.0 vs. 2.0-2.2 and 1.5-2.0 vs. 2.0-2.5 trillion won), there is again no significant difference between the number of firms in the lower size range and the number in the upper size range. Thus, any manipulation of asset size appears to be de minimus.

21
This is exactly what we observe. For asset size dummy 5 the coefficients are large, positive and highly significant for the regressions with CG1 and subindices C and D as dependent variables, and insignificant for other subindices. For the other asset size dummy variable, the coefficients are insignificant for the CG1 regression, and vary in sign and are mostly insignificant. The two significant coefficients (one negative, one positive) on subindices show no apparent pattern. Thus, Table 8, Panel A offers strong evidence that our asset size dummy is an exogenous predictor of corporate governance. We further confirm that the asset size dummy predicts a change in firm behavior in Table 8, Panel B. Here, we focus on the specific rules that apply to firms with assets greater than 2 trillion won: governance elements C1 (firm has at least 50% outside directors) and D1 (firm has an audit committee). The differences are dramatic. Ninety-seven percent of firms above this threshold have at least 50% outside directors, compared to 4% of firms below the threshold. Similarly, 91% of firms above the threshold have an audit committee, compared to 7% of firms below the threshold.25 For the three stage least-squares regressions, we also need an instrumental variable for Tobin's q. We choose ln(years of listing) as a variable that is highly correlated with Tobin’s q (see Table 4, Panel B), but does not appear in the corporate governance equation. Once again, to have a valid instrument, the instrument (here ln(years of listing)) should predict the dependent variable (here corporate governance index) only indirectly, through the instrumented variable (here Tobin's q) and not directly. There is no theoretical reason to expect that years of listing directly affects corporate governance, and there is no significant relationship between the two in our sample (see the first stage regressions of CG1, treated as a dependent variable, in Table 9, Panel A). With this choice of instruments, 3SLS estimates the following system of simultaneous equations:
Tobin’s q = f (CG1, ln(years of listing), other exogenous variables) + ε ---------------- (2) CG1 = g (Tobin’s q, asset size dummy, other exogenous variables) + η -------------- (3)
C. 2SLS and 3SLS Results
25 The principal reason for noncompliance by firms above the 2 trillion won threshold are (i) the firm
recently crossed the threshold and has not yet adjusted the composition of its board of directors or created an audit committee; and (ii) three utilities that are majority state-owned (Korea Telecom, Korea Electric Power, Korea Gas Corporation) are exempt from the audit committee requirement.
22
Table 9 shows the 2SLS and 3SLS results for the overall index CG1, and subindices C and D. The other subindices are not regressed since there is no obvious reason to believe that asset size dummy is a good instrument. We exclude banks from the sample since we have theoretical reasons to believe that our instrument is not valid for banks. The coefficients on CG1 and on subindices C and D the indices are larger than those estimated by OLS and reported in Table 4. This is consistent with the endogeneity test in Table 7, which found a negative correlation between the corporate governance indices and the error term. The coefficient of 0.0194 on CG1 in regression (2) of Table 9 is statistically significant at the 1% level and almost three times larger than the OLS estimate in Table 4. The coefficient implies that an increase in the overall corporate governance by 10 points results in an increase of market capitalization by 19.4% of the company’s book asset value. Notice that our instrumental variable, asset size dummy, is highly significant in the first-stage regression (1).26
The coefficient of 0.0423 on subindex C in equation (6) suggests that a 10-point improvement in outside director practice predicts an increase in market capitalization of 42.3% of the company’s book asset value. The coefficient of 0.0487 on subindex D in equation (10) suggests that an improvement of audit committee and inside auditor practice by 10 points predicts an increase in market capitalization of by 48.7% of the company’s book asset value. The coefficients on Tobin’s q in 3SLS for CG1, C, and D are not statistically significant, suggesting that the causality goes primarily from corporate governance to firm value, not the other way around (regressions 3, 7, and 11).
Our results imply that mandatory rules can have a real effect on firm behavior, specifically the rules requiring firms with 2 trillion won in assets to have 50% outside directors and an audit committee. A competing hypothesis can be called the "lackey effect": Mandatory rules will have little effect because company insiders who do not want more outsiders on their boards, or do not want an audit committee, will put lackeys on the board or audit committee, and the firm's behavior will not change. There may be a lackey effect at some firms, but our results suggest that these rules can affect firm behavior, or so investors believe.
D. Chaebol Versus Non-Chaebol Subsamples
26 Also notice that 2SLS and 3SLS coefficients are identical. This is because the system is just
identified.

23
Table 10 shows 2SLS and 3SLS results for the overall CG1 index for the whole sample and the subsamples of chaebols, and non-chaebols. We do not analyze the bank subsample due to its small size (12 firms). We do not analyze subsamples divided by asset value because we are using asset size dummy as an instrument. The results show that corporate governance affect firm value for both chaebol firms and non-chaebol firms. The coefficient on CG1 on CG1 is 0.0178 for chaebol firms and is significant in 3SLS and marginally significant in 2SLS. The coefficient for non-chaebol firms is .0109 and is highly significant in both 2SLS and 3SLS. Our results are likely weaker for chaebol firms primarily because of the smaller size of the chaebol subsample (104 firms).
VI. Robustness Checks
In this section, we describe a number of checks on the robustness of our results and the reliability of our asset size dummy as an instrument for corporate governance. First, we assess how using different weighting schemes to combine our corporate governance subindices into an overall corporate governance index affects our results. Second, we consider how using other measures of firm value affects our results. Third, we address some issues involving instrument reliability. A. Alternate Specifications of the Corporate Governance Index
We construst five alternative corporate governance indices, as follows. Recall that our basic CG1 index combines subindex B (board of directors in general) and subindex C (outside directors) into an overall board of directors subindex. We then equally weight this overall board subindex and the other four subindices (A (shareholder rights), D (audit committee and internal audit), E (disclosure to investors), and P (ownership parity)), giving each a weight of 20 points toward an overall total of 100 points.
CG2 splits subindices B (board of directors in general) and C (outside directors), and thus gives more weight to these subindices, at the cost of possibly overweighting board of directors variables in the overall index. CG3 drops subindex C (outside directors), and thus give zero weight on C (outside directors) and a greater weight on B (board of directors).27 Each index is scaled to have a value between 0 and 100
27 The reason, such as it is, for this alternate specification is that in Table 4, Panel C , where we run OLS
regressions for each subindex, using the sum of the remaining subindices as a separate independent variable,
24
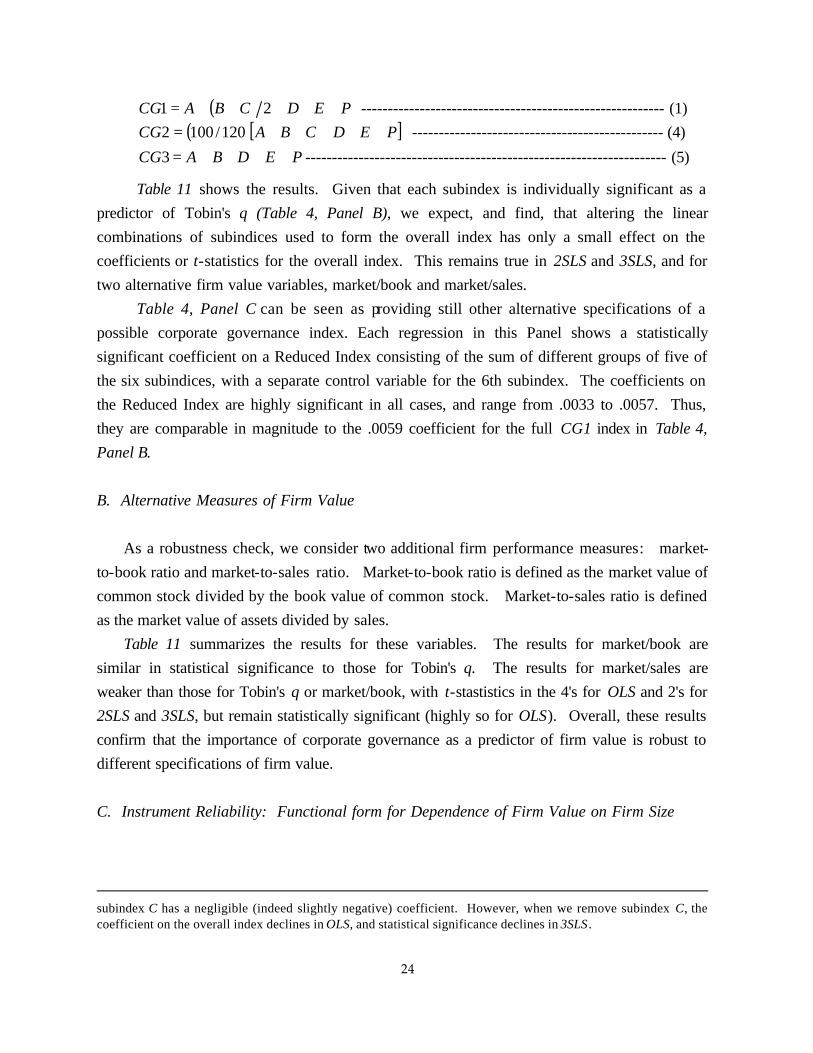
( ) PEDCBACG +++++= 21 --------------------------------------------------------- (1) ( )[ ]PEDCBACG +++++= 120/1002 ----------------------------------------------- (4)
PEDBACG ++++=3 -------------------------------------------------------------------- (5)
Table 11 shows the results. Given that each subindex is individually significant as a predictor of Tobin's q (Table 4, Panel B), we expect, and find, that altering the linear combinations of subindices used to form the overall index has only a small effect on the coefficients or t-statistics for the overall index. This remains true in 2SLS and 3SLS, and for two alternative firm value variables, market/book and market/sales.
Table 4, Panel C can be seen as providing still other alternative specifications of a possible corporate governance index. Each regression in this Panel shows a statistically significant coefficient on a Reduced Index consisting of the sum of different groups of five of the six subindices, with a separate control variable for the 6th subindex. The coefficients on the Reduced Index are highly significant in all cases, and range from .0033 to .0057. Thus, they are comparable in magnitude to the .0059 coefficient for the full CG1 index in Table 4, Panel B.
B. Alternative Measures of Firm Value As a robustness check, we consider two additional firm performance measures: market-to-book ratio and market-to-sales ratio. Market-to-book ratio is defined as the market value of common stock divided by the book value of common stock. Market-to-sales ratio is defined as the market value of assets divided by sales. Table 11 summarizes the results for these variables. The results for market/book are similar in statistical significance to those for Tobin's q. The results for market/sales are weaker than those for Tobin's q or market/book, with t-stastistics in the 4's for OLS and 2's for 2SLS and 3SLS, but remain statistically significant (highly so for OLS). Overall, these results confirm that the importance of corporate governance as a predictor of firm value is robust to different specifications of firm value. C. Instrument Reliability: Functional form for Dependence of Firm Value on Firm Size
subindex C has a negligible (indeed slightly negative) coefficient. However, when we remove subindex C, the coefficient on the overall index declines in OLS, and statistical significance declines in 3SLS .

25
In the 2SLS and 3SLS regressions above, we assume that ln(assets) is the correct functional form for the direct effect of firm size on Tobin's q, and that our asset size dummy affects Tobin's q only indirectly, through its effect on CG1. Ln(assets) is a commonly used size control, but there is no theoretical reason to believe that it (or any other particular functional form) is correct. We therefore investigate here the available evidence on whether this is a sensible choice.
We begin by observing, from our basic OLS regression in Table 4, Panel A, regression (5), that ln(assets has a significant negative direct effect on Tobin's q. This suggests that the positive effect of asset size dummy on Tobin's q, which underlies our 2SLS and 3SLS results, reflects the effect of the asset size dummy on the corporate governance index rather than a possible direct effect of the asset size dummy on Tobin's q.
Regressions (6) and (7) in Table 4, Panel A reinforce this inference In regression (6), we omit CG1 as an independent variable and substitute our asset size dummy. The asset size dummy takes a significant positive coefficient, while ln(assets) remains significant and negative. Ln(assets) is also negative and significant in our 2SLS and 3SLS regressions (see Table 9). In regression (7), we substitute two asset size variables, ln(assets)-small and ln(assets)- large, for the single ln(assets) variable in regression (5). These variables are defined as:
ln(assets)-small = ln(assets) for firms with assets < 2 trillion won; and 0 otherwise ln(assets)- large = ln(assets) for firms with assets > 2 trillion won; and 0 otherwise
In regression (7), both variables take significant negative coefficients. This suggests that there is not a shift around 2 trillion won in the overall negative relationship between firm size and Tobin's q that could explain why ln(assets) is significant and negative, while asset size dummy is significant and positive.
It would stretch coincidence beyond the bounds of plausibility for asset size to have a negative direct effect on firm value for firms with assets less than 2 trillion won, suddenly and sharply reverse sign at precisely the point (2 trillion won) where stronger corporate governance rules kick in, and be again negative for firms with assets above 2 trillion won.
We illustrate this point visually in Figures (5) and (6). Figure 5 presents a scatter plot of the correlation between ln(assets) and CG1. It includes a simple regression line that we allow to "jump" at asset size of 2 trillion won, but not to change slope. A jump is observed, corresponding to the legal requirements that apply to firms over the 2 trillion won threshold. Figure 6 considers the relationship between Tobin's q and asset size. We run a piecewise linear regressionof Tobin's q against ln(assets), separately for small firms (assets < 2 trillion won) and large firms (asserts > 2 trillion won). We observe an overall negative relationship

26
between Tobin's q and ln(assets), with a jump at 2 trillion won. Above this size threshold, there is a slight positive slope to the regression line, but this is not sigificant, and changes sign in a full regression (see Table 4, Panel A, regression (7)). The full piecewise regression line is shown as a dotten line in Figure 6. An important question for instrument reliability is whether asset size dummy predicts Tobin's q primarily (ideally, exclusively) through its effect on corporate governance, rather than directly. The underlying problem is that firm size (proxied by firm assets) can plausibly have a direct effect on firm value. Neither theory nor prior research provides guidance on what functional form for asset size one should expect this direct effect to take. If we do not allow for this possible direct dependence, we could wrongly ascribe the predictive value of the asset size dummy for firm value to its effect on corporate governance, when some or all of this effect is due to the direct effect of the asset size dummy on firm value. There are a number of reasons why we think this theoretical concern is not a major practical concern for this study. First, our results for the coefficients on corporate governance index are strong and comparable in magnitude across OLS, 2SLS, and 3SLS regressions. Second, they are robust. They appear for each subindex individually, for alternate specifications of corporate governance index, for alternate specifications of control variables, and for alternate specifications of firm value. Third, we have strong theoretical and empirical reason to choose the asset size dummy instrument: Corporate governance rules in fact change at this size threshold, and this change affects our corporate governance index in precisely the ways we would expect (see Table 8). Fourth, all of our regressions control for the possible direct effect of asset size on firm value through a separate ln(assets) variable. This functional form is commonly used in other corporate governance studies, including the most relevant comparison studies (Durnev and Kim, 2002, and Gompers, Ishii and Metrick, 2003)28 Fifth, the coefficient on ln(assets) variable has the opposite sign from corporate governance index (directly or instrumented). This is true for the whole sample and for subsamples of small firms assets less than 2 trillion won) and large firms (assets greater than 2 trillion won). Nonetheless, we assess in this section how sensitive our results are to the assumed functional form for the direct effect of asset size on Tobin's q. We begin by discussing some theoretical background. There is a strong positive correlation between ln(assets) and
28 See also, for example, Shin and Stulz (2000), Joh (2003); [other representative citations to come].
Klapper and Love (2002) use ln(sales) to control for firm size.
27
corporate governance index CG1 (r = 0.58), and between ln(assets) and asset size dummy (r = 0.74). The positive slope in Figure 5 could reflect a tendency for larger firms to adopt stronger governance measures, due to greater investor and public pressure, or due to these firms' greater interest in raising external capital. Conversely, firms that adopt stronger corporate governance could have an easier time raising capital, and therefore grow larger. Suppose then that we include ln(assets) as a control variable in an OLS regression of Tobin's q on corporate governance index (CG1) and other control variables. If asset size and corporate governance index are correlated but independent, the correlation will increase estimation error and reduce the t-statistics for both variables, but will not bias the coefficients. If asset size and corporate governance index are causally related, the coefficient estimates on each can be biased as well. We can crudely assess the importance of this interaction effect in OLS by running regressions that include different functional forms for asset size: none, ln(assets), both ln(assets) and ln(assets)2, and then incrementally adding ln(assets)3 and ln(assets)4. The results are shown in Table 12, Panel A Changing the form of the control for asset size has only a modest effect on the coefficient and t-statistic on CG1. As a second check for the importance of the functional form of asset size, we investigate what happens to the coefficient on asset size dummy in the first stage of 2SLS, where we use asset size dummy plus other control variables to predict CG1, if we progressively add powers of ln(assets) to this regression, thus increasing the flexibility of the functional form of asset size. The results for a family of first-stage regressions are shown in Table 12, Panel B. We expect inclusion of ln(assets), which correlates highly with asset size dummy, to increase estimation error; this effect should get stronger as we increase functional form flexibility. In addition, a flexible functional form for ln(assets) will partly mimic the asset size dummy, and thereby reduce the expected coefficient and t-statistic on the asset size dummy. Thus, the greater the flexibility of the functional form for asset size, the weaker the asset size dummy will be as an instrument for corporate governance. We confirm this intuition in Table 12, Panel B. As we add powers of ln(assets), the coefficient on asset size dummy in the first stage regression declines and the t-statistic progressively weakens, becoming insignificant by the time we include ln(assets)3 in the regression. Yet the coefficients on higher powers of ln(assets) are insignificant, so there is no reason to believe that these higher powers directly predict CG1. Putting this evidence together, we believe that our choice of ln(assets) as a control variable is a reasonable compromise between competing concerns: ensuring, on the one hand, that we

28
control for the possible direct effect of asset size on Tobins' q; and on the other hand, not adopting a highly flexible functional form that will rob power from from a valid instrument.
VII. Conclusion
In this paper, we report evidence that corporate governance is an important factor in explaining the market value of Korean public companies. We construct a corporate governance index (0~100) for 531 of the 560 companies listed on the Korea Stock Exchange, relying primarily on responses to a survey conducted by the KSE during the first half of 2001. We find a strong positive correlation between the overall corporate governance index and firm value, which is robust across OLS, 2SLS and 3SLS regressions, in subsamples, in alternate specifications of the corporate governance index, and with alternate measures of firm value.
To address the possible endogeneity of corporate governance, we treat corporate governance as an endogenous variable and estimate 2SLS and 3SLS using, as an instrument for corporate governance, an asset size dummy variable, which takes a value of 1 form firms with assets greater than 2 trillion won. This instrument is appropriate because important Korean corporate governance rules apply only to firms with assets greater than 2 trillion won. We separately control for ln(assets), to make it more likely that the asset size dummy predicts firm value primarily indirectly, through its effect on corporate governance, rather than directly.
When endogeneity is controlled for, a moderate improvement in corporate governance, say an increase of 10 points in the corporate governance index predicts a 18% increase in Tobin’s q and a 43% increase in market/book ratio. A worst to best increase in corporate governance predicts a 130% increase in Tobi's' q and a 311% increase in market/book ratio. These results are highly statistically significant, are robust to alternate measures of firm value, and to alternate specifications of the corporate governance index, and are also found for each of the six subindices that comprise the overall corporate governance index.
The instrumental variables approach we adopt provides evidence for a causal link between the exogenous component of corporate governance and firm value, and against two alternate explanations for the correlation between corporate governance and firm value : signaling (firms signal quality by adopting good governance rules) and reverse causality (firms with high Tobin’s q choose good governance rules). There is some weak evidence from our 3SLS results that firms with high Tobin's q choose better governance rules, but a much stronger implication that better governed firms have higher Tobin's q.
29
REFERENCES Angrist, Joshua D., and Alan B. Krueger (2001), "Instrumental Variables and the Search for Identification: From
Supply and Demand to Natural Experiments," Journal of Economic Perspectives Vol. 15:4, pp. 69-85. Bebchuk, Lucian Arye, Reinier Kraakman, and George Triantis (2001), "Stock Pyramids, Cross-Ownership, and
Dual Class Equity: The Creation and Agency Costs of Separating Control from Cash Flow Rights," in Randall K. Morck, ed., Concentrated Corporate Ownership, pp. 295-318.
Berkowitz, Daniel, Katharina Pistor, and Jean-Francois Richard (2003), "Economic Development, Legality, and
the Transplant Effect," European Economic Review, forthcoming Bhagat, Sanja i and Bernard Black (1999), “The Uncertain Relationship Between Board Composition and Firm
Performance, “ Business Lawyer Vol. 54, pp. 921-963. Bhagat, Sanjai and Bernard Black (2002), “The Non-Correlation Between Board Independence and Long-Term
Firm Performance, “ Journal of Corporation Law Vol. 27, pp. 231-273. Bhagat, Sanjai, Dennis Carey, and Charles Elson (1999), “Director Ownership, Corporate Performance, and
Management Turnover,” Business Lawyer Vol. 54, pp. 885-9yy. Black, Bernard, Barry Metzger, Timothy O'Brien & Young Moo Shin, (2001), "Corporate Governance in Korea at
the Millennium: Enhancing International Competitiveness" (Report to the Korean Ministry of Justice, May 2000), Journal of Corporation Law Vol. 26, pp. 537-609.
Black, Bernard (2001), “The Corporate Governance Behavior and Market Value of Russian Firms ,” Emerging
Markets Review, Vol. 2, pp. 89-108. (An earlier version of this paper was published as “Does Corporate Governance Matter? A Crude Test Using Russian Data,” University of Pennsylvania Law Review, Vol. 149, pp. 2131-2150 (2001).)
Brennan, Michael, Tarun Chrodia, and Avanidhar Subrahmanyam (1998), “Alternative Factor Specifications,
Security Characteristics, and the Cross-Section of Expected Stock Returns,” Journal of Financial Economics Vol. 49, pp. 345-375.
Carleton, Willard, James Nelson, and Michaels Weisbach (1998), “The Influence of Institutions on Corporate
Governance through Private Negotiations: Evidence from TIAA-CREF,” The Journal of Finance Vol.53 No.4 pp 1335-1362
Cho, Sungbin, and Kenneth H. Kang (2002), Firm Level Analysis of the Korean Corporate Sector: 1996-2000",
in International Monetary Fund, Republic of Korea: Selected Issues (2002), IMF Country Report No. 02/20. Coffee, John C., Jr. (2001), "Do Norms Matter: A Cross-Country Evaluation," University of Pennsylvania Law
Review, Vol. 149, pp. 2151-2177. Coffee, John C., Jr. (2002), Racing Towards the Top?: The Impact of Cross-Listings and Stock Market
Competitition on International Corporate Governance, working paper. Coppetiers, Eric (2001), “Governance Ratings in Europe,” Corporate Governance International, January, pp. 31-
38. Credit Lyonnais Securities Asia (2001), CG Watch: Corporate Governance in Emerging Markets, April. Deminor (2000), Corporate Governance Rating Service (Press Release, Dec. 12).

30
Doidge, Craig, G. Andrew Karolyi and Rene M. Stulz (2002), "Why Are Foreign Firms Listed in the U.S. Worth More?," working paper., available at http://ssrn.com/abstract=285337 Durnev, Artyom, and E. Han Kim (2002), “To Steal or Not to Steal: Firm Attributes, Legal Environment, and
Valuation," Working Paper, available at http://ssrn.com/abstracxt=318719 (Social Science Research Network). Dyck, Alexander, and Luigi Zingales (2001), "Private Benefits of Control: An International
Comparison," Wrking Paper, available at http://ssrn.com/abstract=296107 (Social Science Research Network.
Ferris, Stephen P., Kenneth A. Kim and Pattanaport Kitsabunnarat (2003), "The Costs (and Benefits?) of
Diversified Business Groups: The Case of Korean Chaebols," Journal of Banking and Finance, Vol. 27, pp. 251-273.
Gill, Amar, (2002) "Corporate Governance and Performance," Corporate Governance International, pp. 28-49
(Sept.). Gompers, Paul, Joy Ishii, and Andrew Metrick (2003), “Corporate Governance and Equity Prices,” Quarternly
Journal of Economics, forthcoming. Joh, Sung Wook (2003), "Corporate Governance and Firm Profitability: Evidence from Korea Before the
Economic Crisis", Journal of Financial Economics, vol. xx (forthcoming 2003) Karpoff, Jonathan, Paul Malatesta, and Ralph Walkling (1996), “Corporate Governance and Shareholder
Initiatives: Empirical Evidence,” Journal of Financial Economics, Vol. 42, pp. 365-395. Kim, Hwa-Jin (2002), "Toward the 'Best Practice' Model in a Globalizing Market: Recent Developments in
Korean Corporate Governance", Journal of Corporate Law Studies, vol. 2, pp. 345-366. Klapper, Leora F. and Inessa Love (2002), “Corporate Governance, Investor Protection and Performance in
Emerging Markets,” World Bank Working Paper. La Porta, Rafael, Florencio Lopez-de-Silanes, Andrei Shleifer and Robert Vishny (1997), “Legal Determinants of
External Finance”, Journal of Finance, vol. 52, pp. 1131-1150. La Porta, Rafael, Florencio Lopez-de-Silanes, Andrei Shleifer and Robert Vishny (1998), “Law and Finance”,
Journal of Political Economy , vol. 106, pp. 1113-1155. La Porta, Rafael, Florencio Lopez-de-Silanes and Andrei Shleifer (1999), “Corporate Ownership Around the
World”, Journal of Finance, vol. 54, pp. 471-517. La Porta, Rafael, Florencio Lopez-de-Silanes, Andrei Shleifer and Robert Vishny (2000), “Agency Problems and
Dividend Policies Around the World”, Journal of Finance, vol. 55, pp. 1-33. La Porta, Rafael, Florencio Lopez de-Silanes, Andrei Shleifer, and Robert Vishny (2002), “Investor Protection and
Corporate Valuation,” Journal of Finance (forthcoming) La Porta, Rafael, Florencio Lopez de-Silanes, and Andrei Shleifer (2002), “What Works in Securities Laws,”
Working Paper. Lang, Mark H., Karl V. Lins and Darius P. Miller, (2003) "ADRs, Analysts and Accuracy: Does Cross Listing in
the U.S. Improve a Firm's Information Environment and Increase Market Value?" Journal of Accounting Research, forthcoming.
Levine, Ross (1998), "The Legal Environment, Banks, and Long-Run Economic Growth," Journal of Money,
31
Credit and Banking, Vol. 30, pp. 596 620. Levine, Ross (1999), " Law, Finance, and Economic Growth," Journal of Financial Intermediation, vol. 8, PP 8-35. McGurn, Patrick S. (2002), "Keeping Score: Rating Governance in the Post-Enron World," Corporate
Goverance Advisor 27-29 (Sept./Oct.). Millstein, Ira and Paul MacAvoy (1998), “Active Board of Directors and Performance of the Large Publicly
Traded Corporation,” Columbia Law Review, vol. 98, pp. 1283-1321. Modigliani, Franco & Enrico Perotti (2000), "Security Versus Bank Finance: The Importance of a Proper
Enforcement of Legal Rules," International Review of Finance, Vol. 1, pp. 81-96. Nenova, Tatiana (2001), "Control Values and Changes in Corporate Law in Brazil" (World Bank
working paper), available at http://ssrn.com/abstract=294064 (Social Science Research Network). Nenova, Tatiana (2003), "The Value of Corporate Votes and Control Benefits: A Cross-Country
Analysis," Journal of Financial Economics , forthcoming, available at http://ssrn. com/abstract=237809 (Social Science Research Network).
Shin, Hyun-Han. and Young S. Park (1999), "Financing Constraints and Internal Capital Markets: Evidence from
Korean 'Chaebols'," Journal of Corporate Finance, vol. 5, pp. 169-191.
Shin, Hyun-Han and Rene Stulz (2000), “Firm Value, Risk, and Growth Opportunities,” National Bureau of Economic Research Working Paper No. W7808, available at http://ssrn.com/abstract=234344 (Social Science Research Network).
Standard & Poor’s (2001), [title to come]. Sundaramurthy, Chamu, James Mahoney, and Joseph Mahoney, “Board Structure, Anti-takeover Provisions, and
Stockholder Wealth,” Strategic Management Journal Vol.18:3, pp. xxx-yyy. Weisbach, Michael, and Benjamin Hermalin (2001), "Boards of Directors As an Endogenously Determined
Institution: A Survey of the Economic Literature," National Bureau of Economic Research Working Paper No. W8161, available at http://ssrn.com/abstract=262721 (Social Science Research Network).
Wooldridge, Jeffrey (2000), Introductory Econometrics: A Modern Approach (South-Western College Publishing)

32
Figure 1. Distribution of Corporate Governance Index, CG1
Histogram of distribution of corporate governance index (CG1) scores for the 526 firms for which we have data on CG1 .
Fra
ctio
n
cg112.93 85.85
0
.077213
Figure 2. Corporate Governance and Tobin’s q Scatter plot of corporate governance index (CG1) versus Tobin's q. The fitted line is estimated using all 525 observations for which we have data on CG1 and Tobin's q. Extreme values (highest and lowest 5% of values for Tobin's q) are suppressed in the scatter plot for better visual presentation.
cg1
tq Fitted values
12.93 85.85
.493743
1.30201

33
Figure 3: Corporate Governance and Market-to-Book Ratio Scatter plot of corporate governance index (CG1) versus market/book ratio. The fitted line is estimated using all 525 observations for which we have data on CG1 and market/book ratio. Extreme values (highest and lowest 5% of values for market/book ratio ) are suppressed in the scatter plot for better visual presentation.
cg1
mbr Fitted values
12.93 85.85
.146738
1.93113
Figure 4: Corporate Governance and Market-to-Sales Ratio Scatter plot of corporate governance index (CG1) versus market/sales ratio. The fitted line is estimated using all 525 observations for which we have data on CG1 and market/sales ratio. Extreme values (highest and lowest 5% of values for market/sales ratio) are suppressed in the scatter plot for better visual presentation.
cg1
ms Fitted values
12.93 73.91
.046571
3.41273

34
Figure 5: Asset Size and Corporate Governance
Scatter plot of ln(assets) versus corporate governance index (CG1). Two fitted lines are provided. The fitted lines are constrained to have a common slope, but can have have different intercepts. The slope is estimated using all 526 observations for which we have data on CG1 and book asset value. The intercepts are separately estimated for two sub-samples: firms with book asset value below 2 trillion won and those with book asset value above 2 trillion won. The vertical line indicates 2 trillion won in assets .
ln_a
cg1 yhatlow_cg1 yhathigh_cg1
2.3281 11.3086
12.93
85.85
Figure 6: Tobin’s Q and Asset Size
Scatter plot of ln(assets) versus tobin’s q. Two sets fitted lines are provided: one with solid lines and the other with dotted lines. The solid lines are fitted lines for the scatter plot. The dotted lines are partial regression lines drawn from Table 4, Panel A, regression (8). The x- and y-axes for the partial regression lines are shown at the top and right hand edge of the figure, respectively. The x-axis for the partial regression linesis the residual from a regression of ln(assets) on all the regressors except for ln(assets). The y-axis for the partial regression line is the residual from a regression of tobin’s q on all the regressors except for ln(assets). Both sets of fitted lines are estimated for two subgroups: small and large firms. The vertical line indicates 2 trillion won in assets . The horizontal line indicates zero residual for the partial regression lines. Extreme values (highest and lowest 5% of values for Tobin's q) are suppressed in the scatter plot for better visual presentation.
e(ln_a | X)
ln_a
e(tq
| X
)
2.66478 11.3086
.493743
1.29471

35
Table 1. Corporate Governance Index: Elements and Summary Statistics
Description, including source and applicable legal requirement, if any, and summary statistics for the 39 elements included within our overall Corporate Governance Index
A. Shareholder Rights Subindex
Variable Summary of the Variable (yes = 1, no = 0) Responses No. of “1” Responses Mean
A.1 Firm uses cumulative voting for election of directors. Cumulative voting is the default rule under the Commercial Code, but companies can opt out by majority shareholder vote. Under the Securities and Exchange Act, for annual meetings beginning in 2002, companies can opt out of cumulative voting only with a 2/3 of shareholder vote. For companies with assets greater than 2 trillion won, the controlling shareholder can vote a maximum of 3% of the outstanding shares on this issue. This rule will make opting out very hard, but does not affect companies that have already opted out. Survey question I-1-(1).
535 31 0.06
A.2 Firm permits voting by mail. Survey question I-1-(2).29 535 68 0.13 A.3 Firm chooses shareholder meeting date to not overlap with
other firms in same industry, or chooses meeting location to encourage attendance. Survey question I-7-2.30
504 88 0.17
A.4 Firm discloses director candidates to shareholders in advance of shareholder meeting. Under the Securities and Exchange Act, disclosure of this information is required for annual meetings beginning in 2002. Survey question II-5-(3).
535 95 0.18
A.5 Board approval is required for related party transactions. For companies that belong to the top-30 chaebol, the Monopoly Regulation and Fair Trade Act requires this approval if transaction size is greater than 10% of equity capital or 10 billion won. 58 of the 111 firms in our sample that belong to top-30 chaebol (52%) answered yes, as did 123 of the remaining 429 firms (29%). For top-30 chaebol firms that answered no, the responding officer may not have known about this legal requirement (in force only since 1999). Since March 28, 2001, companies with assets greater than 2 trillion won must obtain board approval for a related-party transaction involving more than 1% of book asset value or total sales. The regulations to implement this requirement were adopted in July 2001, after the period when the survey was conducted. Survey question II-5-(5).
535 179 0.33
29 For firms that allow voting by mail, the average participation in voting by public shareholders is 28.0%, versus 23.5% at other firms (p = .069). 30 Almost all respondents treated the four possible responses for question I-7-2 as mutually exclusive. Only 8 respondents checked more than one response. No respondent checked both of the responses that we count as “positive” responses. Firms that set their meeting date or location to encourage attendance have lower participation in voting by public shareholders than other firms (17.5% versus 25.0%; p = .0XX). This could reflect firms with low voting turnout making stronger efforts than other firms to encourage turnout.

36
B. Board of Directors in General Subindex
Variable Summary of the Variable (yes = 1, no = 0) Responses No. of “1” Responses Mean
B.1 Directors attend at least 75% of meetings, on average. Survey question II-2.
478 262 0.55
B.2 Directors’ positions on board meeting agenda items are recorded in board minutes. Survey question II-5-(6)
535 221 0.41
B.3 CEO and board chairman are different people. Banks were more likely than other firms to do so (3/12 banks (25%), versus 23/500 other firms (5%). Survey question II-5-(7).
535 26 0.05
B.4 A system for evaluating directors exists. Survey question II-5-(8).
535 34 0.06
B.5 A bylaw to govern board meetings exists. There is no legal require ment for such a bylaw, but companies must disclose in their annual report whether they have one or not. Survey question II-6.
535 376 0.70
B.6 Firm holds four or more regular board meetings per year. Survey question II-5-(1).
353 257 0.73
C. Outside Directors Subindex
Variable Summary of the Variable (yes = 1, no = 0) Responses No. of “1” Responses
Mean
C.1 Firm has at least 50% outside directors. Under the Securities and Exchange Act and the Banking Act, all listed companies must have at least 25% outside directors; banks (regardless of size) and companies with assets greater than 2 trillion won must have at least 50% outside directors and at least 3 outside directors. Survey questions II-1 and III-1.
522 81 0.16
C.2 Firm has more than 50% outside directors. Survey questions II-1 and III-1.
522 28 0.05
C.3 Firm has one or more foreign outside directors. Survey question II-1-2.
535 37 0.07
C.4 Firm has outside director nominating committee. This committee is required by the Banking Act and the Securities and Exchange Act for banks (regardless of size) and firms with assets greater than 2 trillion won. Survey question III-3-9.
535 74 0.14
C.5 Outside directors do not receive retirement pay. Survey question III-4-3-(3)
317 278 0.88
C.6 Outside directors can obtain advice from outside experts at the company’s expense. The Securities and Exchange Act was revised on March 28 2001 to require this for listed firms. We infer that such revision was not fully incorporated in each company at the time of the survey. Survey question III-4-3-(5).
317 77 0.24
C.7 Firm has a system for evaluating outside directors or plans to have one. This question potentially overlaps with question B.4 (firm has a system for evaluating directors), but the correlation coefficient between the two questions was only 0.14. Survey question III-4-5.
505 152 0.30
C.8 Shareholders approve outside directors’ aggregate pay at shareholder meeting (separate from shareholder approval of all directors' aggregate pay). Question III-4-7.
478 48 0.10
C.9 Outside directors attend at least 75% of meetings, on average. Survey question III-5.
460 193 0.42
C.10 Firm has code of conduct for outside directors. Survey question III-9-(1).
535 41 0.08
C.11 Firm has designated a contact person to support outside directors. Survey question III-9-(2).
535 272 0.51

37
C.12 A board meeting exclusively for outside directors exists . Survey question III-9-(3) and III-9-1.
535 22 0.04
C.13 Firm has not lent outside directors funds to purchas e unsubscribed shares from the company. Survey questions III-4-9, III-4-10. In Korea, unsubscribed shares are often sold to directors at a discounted price. 27 firms sold unsubscribed shares to outside directors, of these 8 lent directors funds to buy the shares.
535 527 0.99
D. Audit Committee and Internal Auditor Subindex
Variable Summary of the Variable (yes = 1, no = 0) Responses No. of “1”
Responses31 Mean
D.1 Audit committee of the board of directors exists . The Banking Act and the Securities and Exchange Act require banks (regardless of size) and listed firms with assets greater than 2 trillion won to have an audit committee, consisting of at least 2/3 outside directors, with an outside director as chair. Other firms may have either an audit committee or an internal auditor. Survey question IV-1-5.32
535 93 0.17
D.2 Ratio of outside directors in audit committee: 1 if ratio is more than 2/3 (the legal minimum for companies that must have an audit committee); 0 otherwise. Survey question IV-1-5.
92 56 0.61
D.3 Bylaws governing audit committee (or internal auditor) exists. Survey question IV-1-1.
485 317 0.65
D.4 Audit committee includes someone with expertise in accounting. Survey question IV-1-3.
91 69 0.76
D.5 Audit committee (or internal auditor) recommends the external auditor at the annual shareholder meeting. Survey question IV-1-6.
491 365 0.74
D.6 Audit committee (or internal auditor) approves the appointment of the internal audit head. Survey question IV-2-1.
400 188 0.47
D.7 Minutes written for each audit committee (internal auditor) meeting. Survey question IV-2-2.
263 160 0.61
D.8 Report on audit committee’s (or internal auditor’s) activities at the annual shareholder meeting. Survey question IV-2-4.
469 418 0.89
D.9 Audit committee members attend at least 75% of meetings, on average. Survey question IV-7.
67 64 0.96
D.10 Audit committee (or internal auditor) meets with external auditor to review financial statements. Survey question IV-1-5.
488 328 0.67
D.11 Audit committee meets two or more times per year. Survey question IV-7.
72 57 0.79
31 The small sample size for questions D.4, D.9, and D.11 is because these questions apply only to companies with an audit committee.
32 Due to the phrasing of the survey, respondents could not answer "yes" or "no" to a direct question about whether they had an audit committee, but instead had to provide information on the composition of the committee. This led 21 firms not to answer this question, either because they had no committee (20 firms) or (we infer) because the respondent did not know the composition of the committee (1 firm). To avoid loss of sample size, we determined directly from the KSE whether these 22 firms had audit committees.

38
E. Disclosure to Investors Subindex
Variable Summary of the Variable (yes = 1, no = 0) Responses No. of “1” Responses Mean
E.1 Firm conducted investor relations activity in year 2000. Survey question I-8.
535 20 0.04
E.2 Firm website includes resumes of board members. Survey question II-5-(4).
535 47 0.09
E.3 English disclosure exists. Survey question V-7. 495 24 0.05
P. Ownership Parity Subindex
Variable Summary of the Variable (continuous between 0 and 1; in our sample, minimum = 0.32; maximum = 1)
Sample Size
Number of “1” Responses Mean
Parity This variable measures the lack of disparity between total voting control and direct ownership by the largest shareholder. Parity = 1 - ownership disparity, where ownership disparity = ownership by all affiliated shareholders - ownership by largest shareholder.
526 not applicable 0.83

39
Table 2. Other Variables A brief description, including definition and source, for the other dependent and independent variables used in this paper. Sales, book value of assets, and other accounting data are measured for the fiscal year (for balance sheet data, at the end of the fiscal year) ending between July 2000 and June 2001, most often Dec. 26, 2000). If more than one fiscal year ends during the period, we use the most recent fiscal year for balance sheet data and the most recent fiscal year that covers a full year for income statement data. Source for accounting data: Korea Listed Companies Association.
Variables Descriptions Tobin’s q
We estimate Tobin's q as market value of assets/book value of assets. We estimate market value of assets as [book value of debt + book value of preferred stock + market value of common stock]. Korean accounting rules require reasonably frequent updating of book values to reflect market values, so book value of assets should not differ markedly from their current replacement cost.
Market-to-Book Ratio Market value of common stock divided by book value of common stock Market-to-Sales Ratio Market value of common stock divided by sales. Book Value of Debt Book value of total liabilities in billion won. Book Value of Assets Book value of assets in billion won. Book Value of (Common) Stock
Book value of assets - book value of debt - book value of preferred stock.
Debt/Equity Ratio Book value of debt divided by market value of common stock Market Value of Common Stock
Market value of common stock in billion won, measured at June 29, 2001. If a company is delisted before June 29, 2001, the most recent figure is used. [Source: Korea Stock Exchange]
Years of Listing Number of years since original listing [Source: Korea Listed Companies Association].
Sales Growth
Average growth rate of sales during the 5 fiscal years from 1996 through 2000. If sales figures are available for less than five years, we compute the average growth rate during the period for which data is available
R&D/Sales Ratio of research and development (R&D) expense to sales. We assume that this ratio is zero for the 137 firms in our sample with missing data for R&D expense.
Advertising/Sales Ratio of advertising expense to sales. We assume that this ratio is zero for the 65 firms in our sample with missing data for advertising expense.
Turnover Common shares traded during 2000 divided by common shares held by public shareholders, where common shares held by public shareholders = common shares outstanding x (1 -Total Affiliated Ownership) [Source: Korea Stock Exchange].
Market Share Firm sales divided by total sales of all firms in the same 4-digit industry. Company universe includes all companies listed on KSE or registered on KOSDAQ.
Market Concentration Herfindahl Hirschman Index of concentration for 4-digit industry to which firm belongs
Sole Ownership Percentage share ownership by largest shareholder. A largest shareholder is a shareholder, together with its related parties, that holds the largest number of shares outstanding. Related parties include relatives, affiliated firms, and company directors. Ownership for this and other variables is measured at year-end 2000. [Source of ownership data: Korea Stock Exchange]
ADR (Level 1) Dummy 1 if firm has issued level 1 American Depository Receipts (ADRs); 0 otherwis e ADR (Level 2 or 3) Dummy
1 if firm has issued level 2 or level 3 ADRs; 0 otherwise
MSCI Index Dummy 1 if firm is included in Morgan Stanley Capital International Index; 0 otherwise Total Affiliated Ownership
Percentage share ownership by all affiliated shareholders.
Ownership Parity 1 - ownership disparity, where ownership disparity = total affiliated ownership - sole ownership
Asset Size Dummy 1 if book value of assets is greater than 2 trillion won; 0 otherwise. Bank Dummy 1 if the firm is a commercial bank or a merchant bank; 0 otherwise.
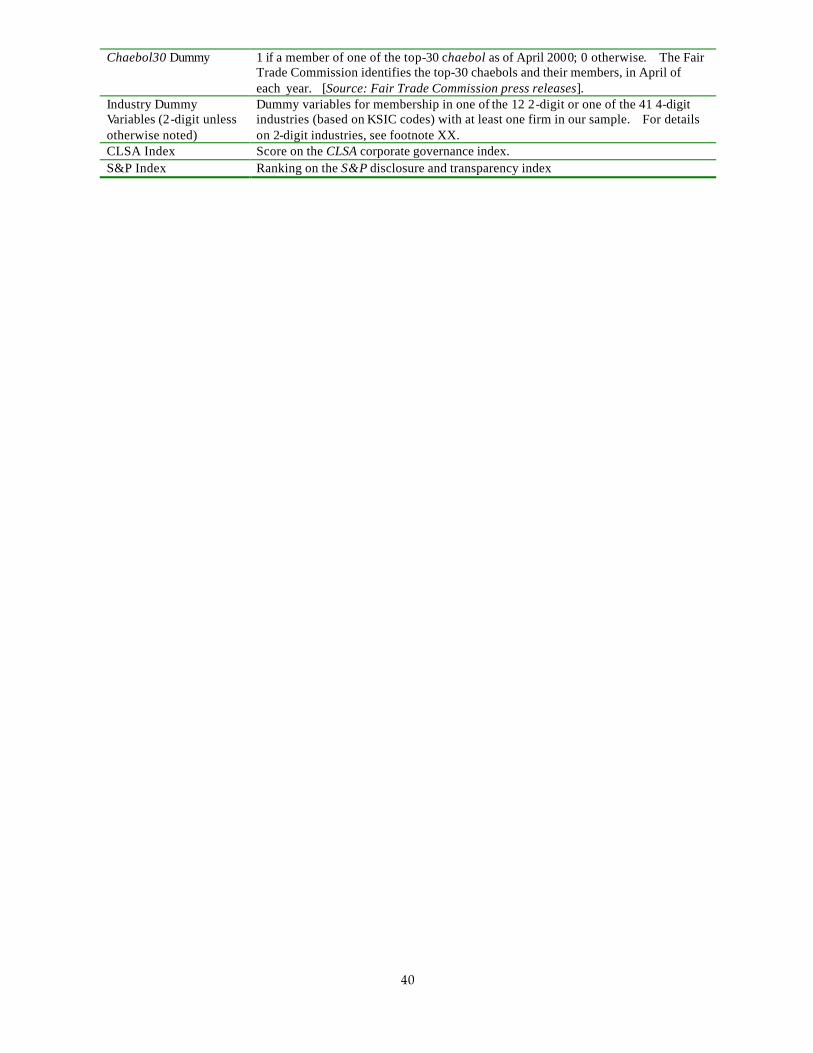
40
Chaebol30 Dummy 1 if a member of one of the top-30 chaebol as of April 2000; 0 otherwise. The Fair Trade Commission identifies the top-30 chaebols and their members, in April of each year. [Source: Fair Trade Commission press releases].
Industry Dummy Variables (2-digit unless otherwise noted)
Dummy variables for membership in one of the 12 2-digit or one of the 41 4-digit industries (based on KSIC codes) with at least one firm in our sample. For details on 2-digit industries, see footnote XX.
CLSA Index Score on the CLSA corporate governance index. S&P Index Ranking on the S&P disclosure and transparency index

41
Table 3. Descriptive Statistics
Descriptive statistics for the overall corporate governance indices and subindices and other variables used in this study.
A. Corporate Governance Indices
Code No. of Obs. Mean
Stand. Dev. Min. Max.
Shareholder Rights A 535 3.46 3.65 0.00 16.00 Board of Directors in General B 535 7.75 4.31 0.00 20.00 Outside Directors C 535 4.29 3.23 0.00 16.40 Audit Committee and Internal Auditor D 535 10.97 5.23 0.00 20.00 Disclosure to Investors E 535 1.17 3.13 0.00 20.00 Ownership Parity P 526 16.59 2.81 6.40 20.00
CG1 526 38.18 11.25 12.93 85.85 CG2 526 36.81 11.46 10.78 85.30 Overall Corporate Governance Indices CG3 526 39.91 11.55 12.57 86.00
B. Other Variables
Number of Obs.
No. of "1" values (for dummy variables)
Mean Median Standard Deviation. Minimum Maximum
Tobin’s q 533 -- 0.85 0.81 0.28 0.32 3.04 Market-to-Book Ratio 533 -- 0.79 0.49 1.64 -7.55 21.61 Market-to-Sales Ratio 533 -- 1.73 1.01 6.68 0.02 149.92 Market Value of Common Stock 534 -- 359 41 1869 2.01 29038.07 Book Value of Common Stock 534 -- 437 87 1798 -121.37 31834.55 Book Value of Debt 534 -- 1305 112 6064 1.23 77265.05 Book Value of Assets 534 -- 1747 229 7017 10.26 81521.57 Debt/Equity Ratio 533 -- 6.34 2.47 11.93 0.05 95.52 Years of Listing 535 -- 15.67 13.00 9.35 0 45 Sales Growth 512 -- 0.14 0.09 0.31 -0.29 5.85 R&D/Sales 535 -- 0.01 0.002 0.06 0.00 1.32 Advertising/Sales 535 -- 0.01 0.0007 0.02 0.00 0.13 Market Share 534 -- 0.05 0.01 0.13 0.0003 1 Market Concentration 535 -- 0.15 0.12 0.13 0.05 1 Turnover 525 -- 10.01 5.86 14.70 0.23 238.79 ADR (Level I) Dummy 535 10 0.02 0 0.14 0 1 ADR (Level II and III) Dummy 535 6 0.01 0 0.11 0 1 MSCI Index Dummy 535 65 0.12 0 0.33 0 1 Asset Size Dummy 534 67 0.13 0 0.33 0 1 Bank Dummy 535 12 0.02 0 0.15 0 1 Chaebol 30 Dummy 535 111 0.21 0 0.41 0 1 Sole Ownership 526 -- 19.64 15.94 14.42 0.14 89.76 CLSA Index 19 -- 46.26 44.1 5.61 38 57.9 S&P Index 33 -- 4.97 5 1.40 1 7
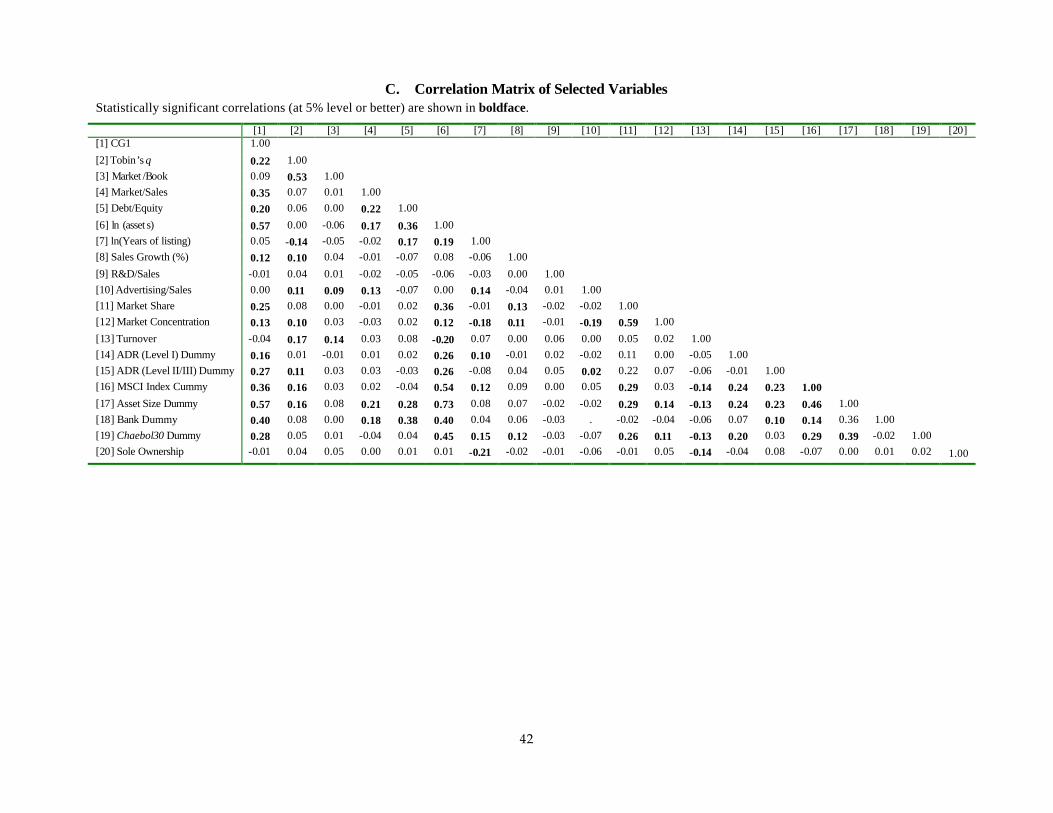
42
C. Correlation Matrix of Selected Variables Statistically significant correlations (at 5% level or better) are shown in boldface.
[1] [2] [3] [4] [5] [6] [7] [8] [9] [10] [11] [12] [13] [14] [15] [16] [17] [18] [19] [20] [1] CG1 1.00 [2] Tobin’s q 0.22 1.00 [3] Market /Book 0.09 0.53 1.00 [4] Market/Sales 0.35 0.07 0.01 1.00 [5] Debt/Equity 0.20 0.06 0.00 0.22 1.00 [6] ln (asset s) 0.57 0.00 -0.06 0.17 0.36 1.00 [7] ln(Years of listing) 0.05 -0.14 -0.05 -0.02 0.17 0.19 1.00 [8] Sales Growth (%) 0.12 0.10 0.04 -0.01 -0.07 0.08 -0.06 1.00 [9] R&D/Sales -0.01 0.04 0.01 -0.02 -0.05 -0.06 -0.03 0.00 1.00 [10] Advertising/Sales 0.00 0.11 0.09 0.13 -0.07 0.00 0.14 -0.04 0.01 1.00 [11] Market Share 0.25 0.08 0.00 -0.01 0.02 0.36 -0.01 0.13 -0.02 -0.02 1.00 [12] Market Concentration 0.13 0.10 0.03 -0.03 0.02 0.12 -0.18 0.11 -0.01 -0.19 0.59 1.00 [13] Turnover -0.04 0.17 0.14 0.03 0.08 -0.20 0.07 0.00 0.06 0.00 0.05 0.02 1.00 [14] ADR (Level I) Dummy 0.16 0.01 -0.01 0.01 0.02 0.26 0.10 -0.01 0.02 -0.02 0.11 0.00 -0.05 1.00 [15] ADR (Level II/III) Dummy 0.27 0.11 0.03 0.03 -0.03 0.26 -0.08 0.04 0.05 0.02 0.22 0.07 -0.06 -0.01 1.00 [16] MSCI Index Cummy 0.36 0.16 0.03 0.02 -0.04 0.54 0.12 0.09 0.00 0.05 0.29 0.03 -0.14 0.24 0.23 1.00 [17] Asset Size Dummy 0.57 0.16 0.08 0.21 0.28 0.73 0.08 0.07 -0.02 -0.02 0.29 0.14 -0.13 0.24 0.23 0.46 1.00 [18] Bank Dummy 0.40 0.08 0.00 0.18 0.38 0.40 0.04 0.06 -0.03 . -0.02 -0.04 -0.06 0.07 0.10 0.14 0.36 1.00 [19] Chaebol30 Dummy 0.28 0.05 0.01 -0.04 0.04 0.45 0.15 0.12 -0.03 -0.07 0.26 0.11 -0.13 0.20 0.03 0.29 0.39 -0.02 1.00 [20] Sole Ownership -0.01 0.04 0.05 0.00 0.01 0.01 -0.21 -0.02 -0.01 -0.06 -0.01 0.05 -0.14 -0.04 0.08 -0.07 0.00 0.01 0.02 1.00
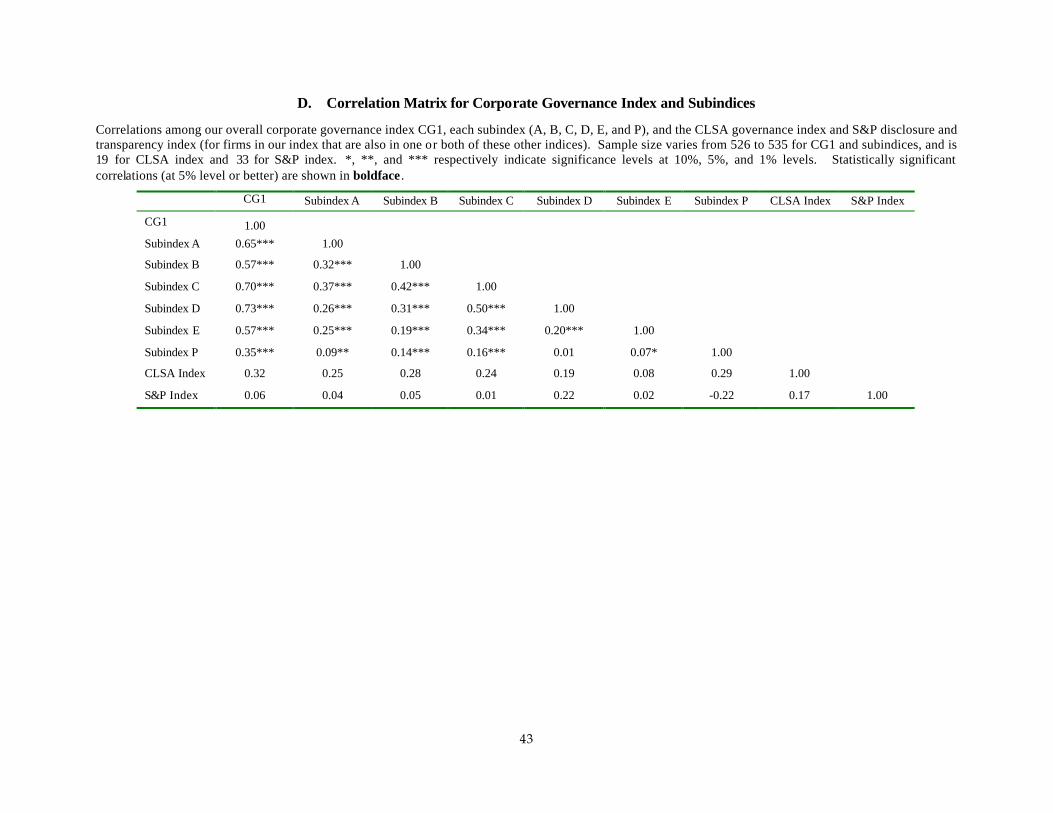
43
D. Correlation Matrix for Corporate Governance Index and Subindices
Correlations among our overall corporate governance index CG1, each subindex (A, B, C, D, E, and P), and the CLSA governance index and S&P disclosure and transparency index (for firms in our index that are also in one or both of these other indices). Sample size varies from 526 to 535 for CG1 and subindices, and is 19 for CLSA index and 33 for S&P index. *, **, and *** respectively indicate significance levels at 10%, 5%, and 1% levels. Statistically significant correlations (at 5% level or better) are shown in boldface .
CG1 Subindex A Subindex B Subindex C Subindex D Subindex E Subindex P CLSA Index S&P Index
CG1 1.00
Subindex A 0.65*** 1.00
Subindex B 0.57*** 0.32*** 1.00
Subindex C 0.70*** 0.37*** 0.42*** 1.00
Subindex D 0.73*** 0.26*** 0.31*** 0.50*** 1.00
Subindex E 0.57*** 0.25*** 0.19*** 0.34*** 0.20*** 1.00
Subindex P 0.35*** 0.09** 0.14*** 0.16*** 0.01 0.07* 1.00
CLSA Index 0.32 0.25 0.28 0.24 0.19 0.08 0.29 1.00
S&P Index 0.06 0.04 0.05 0.01 0.22 0.02 -0.22 0.17 1.00
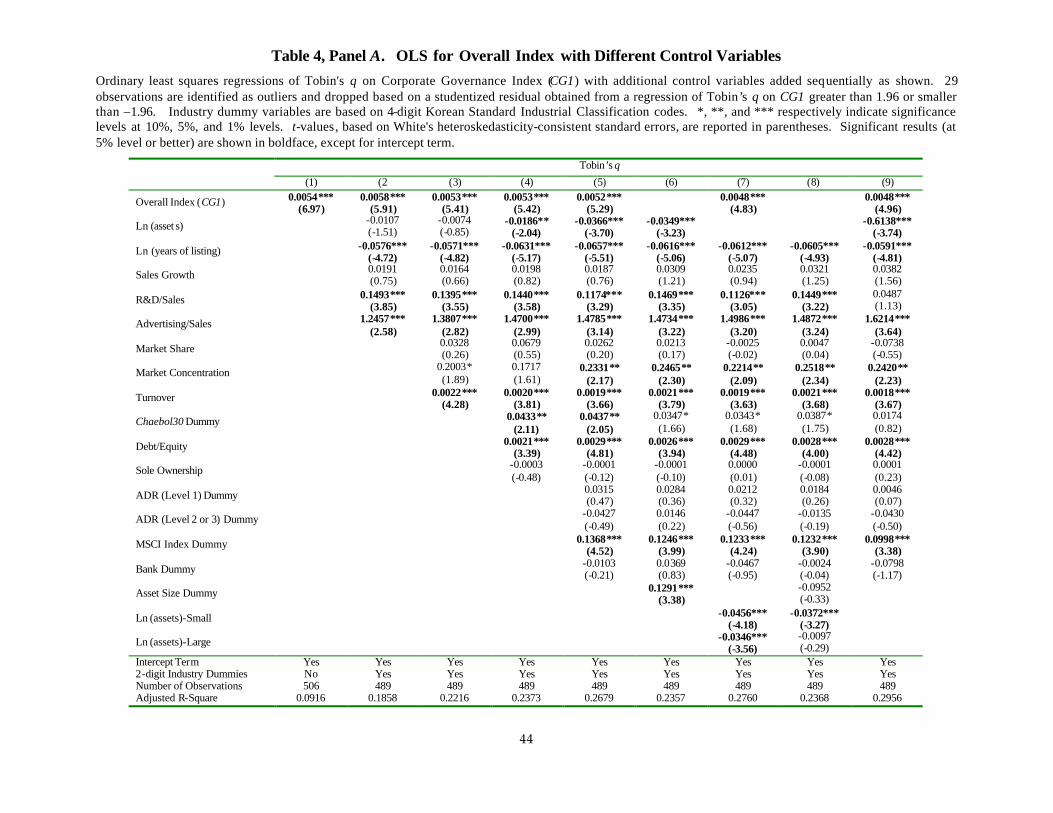
44
Table 4, Panel A. OLS for Overall Index with Different Control Variables Ordinary least squares regressions of Tobin's q on Corporate Governance Index (CG1) with additional control variables added sequentially as shown. 29 observations are identified as outliers and dropped based on a studentized residual obtained from a regression of Tobin’s q on CG1 greater than 1.96 or smaller than –1.96. Industry dummy variables are based on 4-digit Korean Standard Industrial Classification codes. *, **, and *** respectively indicate significance levels at 10%, 5%, and 1% levels. t-values, based on White's heteroskedasticity-consistent standard errors, are reported in parentheses. Significant results (at 5% level or better) are shown in boldface, except for intercept term.
Tobin’s q
(1) (2 (3) (4) (5) (6) (7) (8) (9)
Overall Index (CG1) 0.0054*** (6.97)
0.0058*** (5.91)
0.0053*** (5.41)
0.0053*** (5.42)
0.0052*** (5.29)
0.0048*** (4.83)
0.0048*** (4.96)
Ln (asset s) -0.0107 (-1.51)
-0.0074 (-0.85)
-0.0186** (-2.04)
-0.0366*** (-3.70)
-0.0349*** (-3.23)
-0.6138*** (-3.74)
Ln (years of listing) -0.0576*** (-4.72)
-0.0571*** (-4.82)
-0.0631*** (-5.17)
-0.0657*** (-5.51)
-0.0616*** (-5.06)
-0.0612*** (-5.07)
-0.0605*** (-4.93)
-0.0591*** (-4.81)
Sales Growth 0.0191 (0.75)
0.0164 (0.66)
0.0198 (0.82)
0.0187 (0.76)
0.0309 (1.21)
0.0235 (0.94)
0.0321 (1.25)
0.0382 (1.56)
R&D/Sales 0.1493*** (3.85)
0.1395*** (3.55)
0.1440*** (3.58)
0.1174*** (3.29)
0.1469*** (3.35)
0.1126*** (3.05)
0.1449*** (3.22)
0.0487 (1.13)
Advertising/Sales 1.2457*** (2.58)
1.3807*** (2.82)
1.4700*** (2.99)
1.4785*** (3.14)
1.4734*** (3.22)
1.4986*** (3.20)
1.4872*** (3.24)
1.6214*** (3.64)
Market Share 0.0328 (0.26)
0.0679 (0.55)
0.0262 (0.20)
0.0213 (0.17)
-0.0025 (-0.02)
0.0047 (0.04)
-0.0738 (-0.55)
Market Concentration 0.2003* (1.89)
0.1717 (1.61)
0.2331** (2.17)
0.2465** (2.30)
0.2214** (2.09)
0.2518** (2.34)
0.2420** (2.23)
Turnover 0.0022*** (4.28)
0.0020*** (3.81)
0.0019*** (3.66)
0.0021*** (3.79)
0.0019*** (3.63)
0.0021*** (3.68)
0.0018*** (3.67)
Chaebol30 Dummy 0.0433** (2.11)
0.0437** (2.05)
0.0347* (1.66)
0.0343* (1.68)
0.0387* (1.75)
0.0174 (0.82)
Debt/Equity 0.0021*** (3.39)
0.0029*** (4.81)
0.0026*** (3.94)
0.0029*** (4.48)
0.0028*** (4.00)
0.0028*** (4.42)
Sole Ownership -0.0003 (-0.48)
-0.0001 (-0.12)
-0.0001 (-0.10)
0.0000 (0.01)
-0.0001 (-0.08)
0.0001 (0.23)
ADR (Level 1) Dummy 0.0315 (0.47)
0.0284 (0.36)
0.0212 (0.32)
0.0184 (0.26)
0.0046 (0.07)
ADR (Level 2 or 3) Dummy -0.0427 (-0.49)
0.0146 (0.22)
-0.0447 (-0.56)
-0.0135 (-0.19)
-0.0430 (-0.50)
MSCI Index Dummy 0.1368*** (4.52)
0.1246*** (3.99)
0.1233*** (4.24)
0.1232*** (3.90)
0.0998*** (3.38)
Bank Dummy -0.0103 (-0.21)
0.0369 (0.83)
-0.0467 (-0.95)
-0.0024 (-0.04)
-0.0798 (-1.17)
Asset Size Dummy 0.1291*** (3.38)
-0.0952 (-0.33)
Ln (assets)-Small -0.0456*** (-4.18)
-0.0372*** (-3.27)
Ln (assets)-Large -0.0346*** (-3.56)
-0.0097 (-0.29)
Intercept Term Yes Yes Yes Yes Yes Yes Yes Yes Yes 2-digit Industry Dummies No Yes Yes Yes Yes Yes Yes Yes Yes Number of Observations 506 489 489 489 489 489 489 489 489 Adjusted R-Square 0.0916 0.1858 0.2216 0.2373 0.2679 0.2357 0.2760 0.2368 0.2956
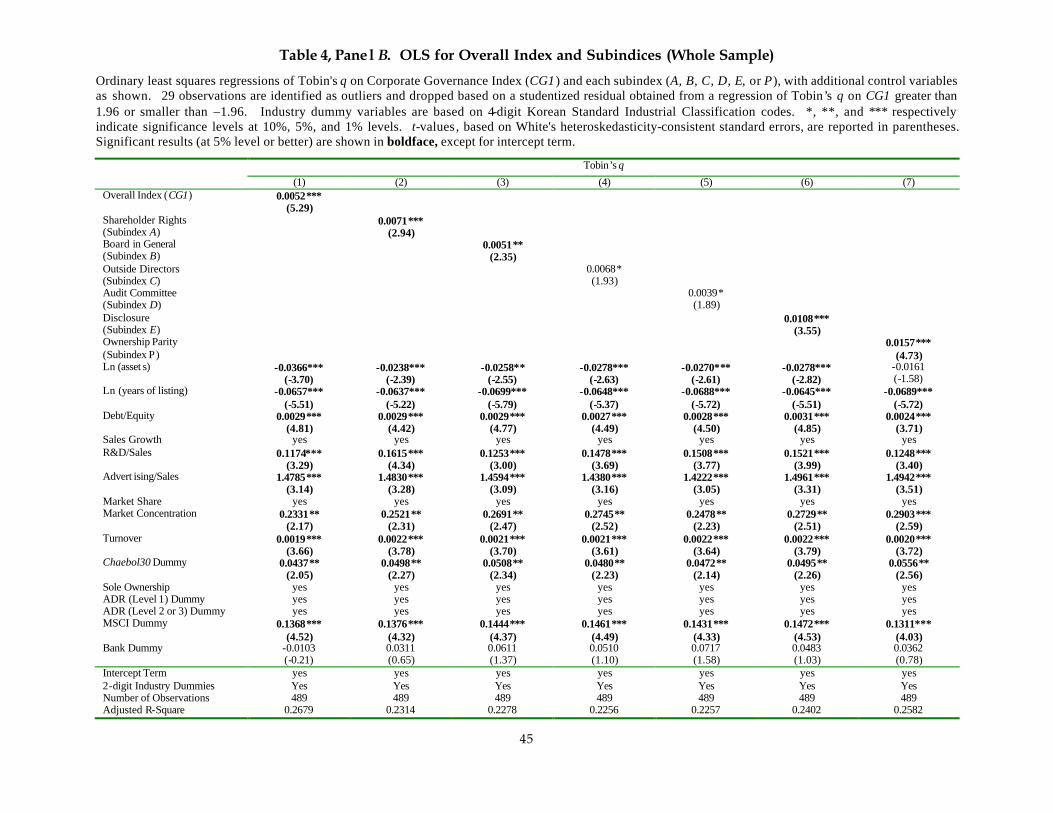
45
Table 4, Panel B. OLS for Overall Index and Subindices (Whole Sample)
Ordinary least squares regressions of Tobin's q on Corporate Governance Index (CG1) and each subindex (A, B, C, D, E, or P), with additional control variables as shown. 29 observations are identified as outliers and dropped based on a studentized residual obtained from a regression of Tobin’s q on CG1 greater than 1.96 or smaller than –1.96. Industry dummy variables are based on 4-digit Korean Standard Industrial Classification codes. *, **, and *** respectively indicate significance levels at 10%, 5%, and 1% levels. t-values , based on White's heteroskedasticity-consistent standard errors, are reported in parentheses. Significant results (at 5% level or better) are shown in boldface, except for intercept term.
Tobin’s q
(1) (2) (3) (4) (5) (6) (7) Overall Index (CG1) 0.0052***
(5.29)
Shareholder Rights (Subindex A)
0.0071*** (2.94)
Board in General (Subindex B)
0.0051** (2.35)
Outside Directors (Subindex C)
0.0068* (1.93)
Audit Committee (Subindex D)
0.0039* (1.89)
Disclosure (Subindex E)
0.0108*** (3.55)
Ownership Parity (Subindex P)
0.0157*** (4.73)
Ln (asset s) -0.0366*** (-3.70)
-0.0238*** (-2.39)
-0.0258** (-2.55)
-0.0278*** (-2.63)
-0.0270*** (-2.61)
-0.0278*** (-2.82)
-0.0161 (-1.58)
Ln (years of listing) -0.0657*** (-5.51)
-0.0637*** (-5.22)
-0.0699*** (-5.79)
-0.0648*** (-5.37)
-0.0688*** (-5.72)
-0.0645*** (-5.51)
-0.0689*** (-5.72)
Debt/Equity 0.0029*** (4.81)
0.0029*** (4.42)
0.0029*** (4.77)
0.0027*** (4.49)
0.0028*** (4.50)
0.0031*** (4.85)
0.0024*** (3.71)
Sales Growth yes yes yes yes yes yes yes R&D/Sales 0.1174***
(3.29) 0.1615***
(4.34) 0.1253***
(3.00) 0.1478***
(3.69) 0.1508***
(3.77) 0.1521***
(3.99) 0.1248***
(3.40) Advert ising/Sales 1.4785***
(3.14) 1.4830***
(3.28) 1.4594***
(3.09) 1.4380***
(3.16) 1.4222***
(3.05) 1.4961***
(3.31) 1.4942***
(3.51) Market Share yes yes yes yes yes yes yes Market Concentration 0.2331**
(2.17) 0.2521**
(2.31) 0.2691**
(2.47) 0.2745**
(2.52) 0.2478**
(2.23) 0.2729**
(2.51) 0.2903***
(2.59) Turnover 0.0019***
(3.66) 0.0022***
(3.78) 0.0021***
(3.70) 0.0021***
(3.61) 0.0022***
(3.64) 0.0022***
(3.79) 0.0020***
(3.72) Chaebol30 Dummy 0.0437**
(2.05) 0.0498**
(2.27) 0.0508**
(2.34) 0.0480**
(2.23) 0.0472**
(2.14) 0.0495**
(2.26) 0.0556**
(2.56) Sole Ownership yes yes yes yes yes yes yes ADR (Level 1) Dummy yes yes yes yes yes yes yes ADR (Level 2 or 3) Dummy yes yes yes yes yes yes yes MSCI Dummy 0.1368***
(4.52) 0.1376***
(4.32) 0.1444***
(4.37) 0.1461***
(4.49) 0.1431***
(4.33) 0.1472***
(4.53) 0.1311***
(4.03) Bank Dummy -0.0103
(-0.21) 0.0311 (0.65)
0.0611 (1.37)
0.0510 (1.10)
0.0717 (1.58)
0.0483 (1.03)
0.0362 (0.78)
Intercept Term yes yes yes yes yes yes yes 2-digit Industry Dummies Yes Yes Yes Yes Yes Yes Yes Number of Observations 489 489 489 489 489 489 489 Adjusted R-Square 0.2679 0.2314 0.2278 0.2256 0.2257 0.2402 0.2582
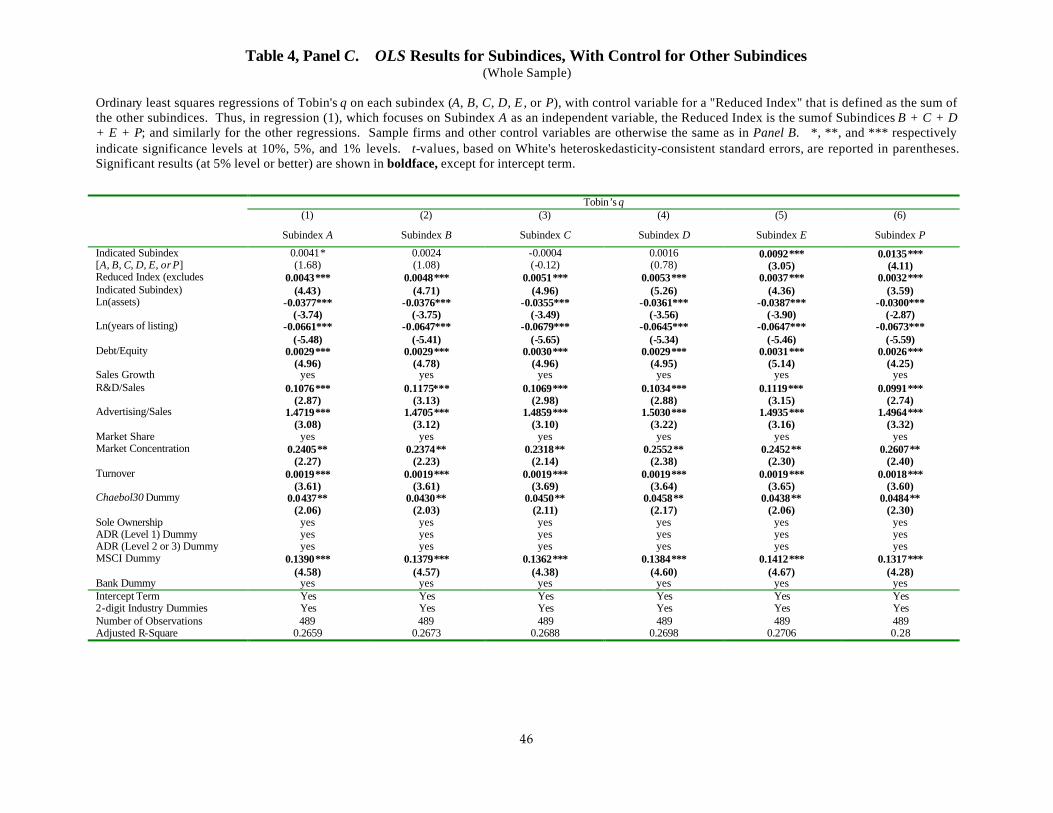
46
Table 4, Panel C. OLS Results for Subindices, With Control for Other Subindices (Whole Sample)
Ordinary least squares regressions of Tobin's q on each subindex (A, B, C, D, E , or P), with control variable for a "Reduced Index" that is defined as the sum of the other subindices. Thus, in regression (1), which focuses on Subindex A as an independent variable, the Reduced Index is the sumof Subindices B + C + D + E + P; and similarly for the other regressions. Sample firms and other control variables are otherwise the same as in Panel B. *, **, and *** respectively indicate significance levels at 10%, 5%, and 1% levels. t-values, based on White's heteroskedasticity-consistent standard errors, are reported in parentheses. Significant results (at 5% level or better) are shown in boldface, except for intercept term.
Tobin’s q (1)
Subindex A
(2)
Subindex B
(3)
Subindex C
(4)
Subindex D
(5)
Subindex E
(6)
Subindex P
Indicated Subindex [A, B, C, D, E, or P]
0.0041* (1.68)
0.0024 (1.08)
-0.0004 (-0.12)
0.0016 (0.78)
0.0092*** (3.05)
0.0135*** (4.11)
Reduced Index (excludes Indicated Subindex)
0.0043*** (4.43)
0.0048*** (4.71)
0.0051*** (4.96)
0.0053*** (5.26)
0.0037*** (4.36)
0.0032*** (3.59)
Ln(assets) -0.0377*** (-3.74)
-0.0376*** (-3.75)
-0.0355*** (-3.49)
-0.0361*** (-3.56)
-0.0387*** (-3.90)
-0.0300*** (-2.87)
Ln(years of listing) -0.0661*** (-5.48)
-0.0647*** (-5.41)
-0.0679*** (-5.65)
-0.0645*** (-5.34)
-0.0647*** (-5.46)
-0.0673*** (-5.59)
Debt/Equity 0.0029*** (4.96)
0.0029*** (4.78)
0.0030*** (4.96)
0.0029*** (4.95)
0.0031*** (5.14)
0.0026*** (4.25)
Sales Growth yes yes yes yes yes yes R&D/Sales 0.1076***
(2.87) 0.1175***
(3.13) 0.1069***
(2.98) 0.1034***
(2.88) 0.1119***
(3.15) 0.0991***
(2.74) Advertising/Sales 1.4719***
(3.08) 1.4705***
(3.12) 1.4859***
(3.10) 1.5030***
(3.22) 1.4935***
(3.16) 1.4964***
(3.32) Market Share yes yes yes yes yes yes Market Concentration 0.2405**
(2.27) 0.2374**
(2.23) 0.2318**
(2.14) 0.2552**
(2.38) 0.2452**
(2.30) 0.2607**
(2.40) Turnover 0.0019***
(3.61) 0.0019***
(3.61) 0.0019***
(3.69) 0.0019***
(3.64) 0.0019***
(3.65) 0.0018***
(3.60) Chaebol30 Dummy 0.0437**
(2.06) 0.0430**
(2.03) 0.0450**
(2.11) 0.0458**
(2.17) 0.0438**
(2.06) 0.0484**
(2.30) Sole Ownership yes yes yes yes yes yes ADR (Level 1) Dummy yes yes yes yes yes yes ADR (Level 2 or 3) Dummy yes yes yes yes yes yes MSCI Dummy 0.1390***
(4.58) 0.1379***
(4.57) 0.1362***
(4.38) 0.1384***
(4.60) 0.1412***
(4.67) 0.1317***
(4.28) Bank Dummy yes yes yes yes yes yes Intercept Term Yes Yes Yes Yes Yes Yes 2-digit Industry Dummies Yes Yes Yes Yes Yes Yes Number of Observations 489 489 489 489 489 489 Adjusted R-Square 0.2659 0.2673 0.2688 0.2698 0.2706 0.28
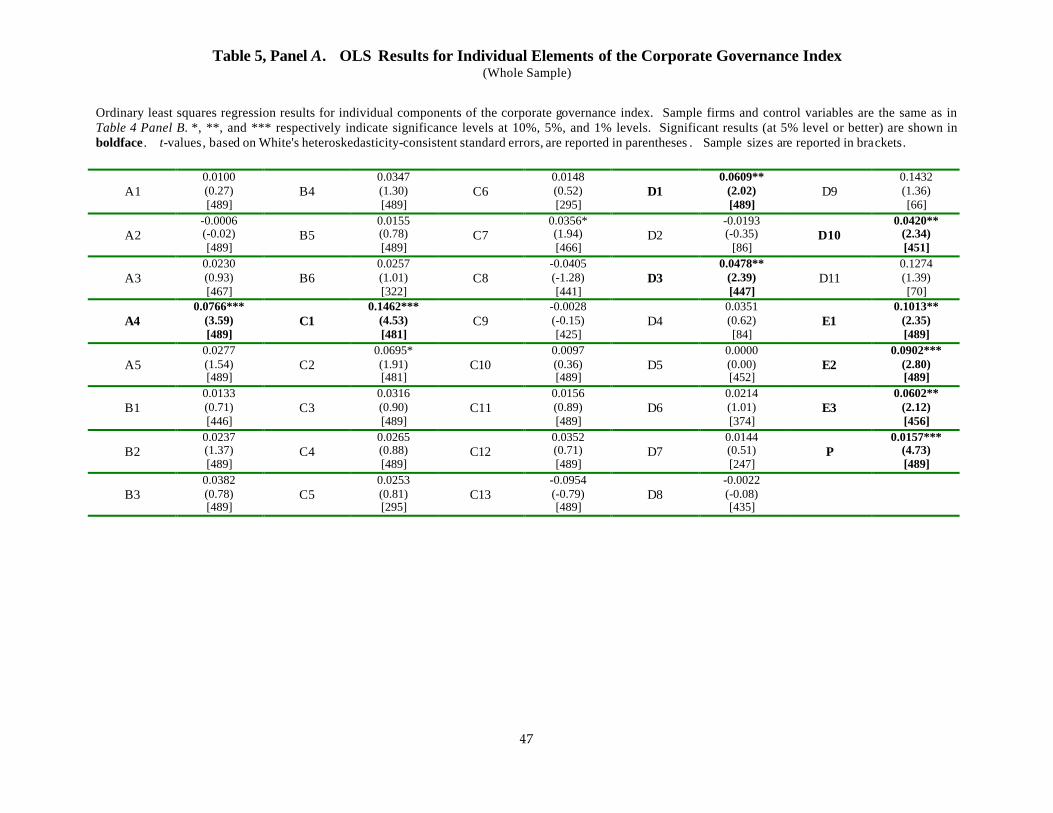
47
Table 5, Panel A. OLS Results for Individual Elements of the Corporate Governance Index (Whole Sample)
Ordinary least squares regression results for individual components of the corporate governance index. Sample firms and control variables are the same as in Table 4 Panel B. *, **, and *** respectively indicate significance levels at 10%, 5%, and 1% levels. Significant results (at 5% level or better) are shown in boldface . t-values, based on White's heteroskedasticity-consistent standard errors, are reported in parentheses . Sample sizes are reported in brackets.
A1 0.0100 (0.27) [489]
B4 0.0347 (1.30) [489]
C6 0.0148 (0.52) [295]
D1 0.0609**
(2.02) [489]
D9 0.1432 (1.36) [66]
A2 -0.0006 (-0.02) [489]
B5 0.0155 (0.78) [489]
C7 0.0356* (1.94) [466]
D2 -0.0193 (-0.35)
[86] D10
0.0420** (2.34) [451]
A3 0.0230 (0.93) [467]
B6 0.0257 (1.01) [322]
C8 -0.0405 (-1.28) [441]
D3 0.0478**
(2.39) [447]
D11 0.1274 (1.39) [70]
A4 0.0766***
(3.59) [489]
C1 0.1462***
(4.53) [481]
C9 -0.0028 (-0.15) [425]
D4 0.0351 (0.62) [84]
E1 0.1013**
(2.35) [489]
A5 0.0277 (1.54) [489]
C2 0.0695* (1.91) [481]
C10 0.0097 (0.36) [489]
D5 0.0000 (0.00) [452]
E2 0.0902***
(2.80) [489]
B1 0.0133 (0.71) [446]
C3 0.0316 (0.90) [489]
C11 0.0156 (0.89) [489]
D6 0.0214 (1.01) [374]
E3 0.0602**
(2.12) [456]
B2 0.0237 (1.37) [489]
C4 0.0265 (0.88) [489]
C12 0.0352 (0.71) [489]
D7 0.0144 (0.51) [247]
P 0.0157***
(4.73) [489]
B3 0.0382 (0.78) [489]
C5 0.0253 (0.81) [295]
C13 -0.0954 (-0.79) [489]
D8 -0.0022 (-0.08) [435]

48
Table 5, Panel B: Details for Significant Elements of Corporate Governance Index
This panel provides additional detail for the eight individual corporate governance elements that are statistically significant in Panel A. *, **, and *** respectively indicate significance levels at 10%, 5%, and 1% levels. t-values, based on White's heteroskedasticity-consistent standard errors, are reported in parentheses.
Element Description Regression Results
(from Panel A) A4 Firm discloses director candidates to shareholders in advance of shareholder meeting. 0.0766***
(3.59) [489]
C1 Firm has at least 50% outside directors (legally required for banks and firms with assets > 2 trillion won).
0.1462*** (4.53) [481]
D1 An audit committee of the board of directors exists (legally required for banks and firms with assets > 2 trillion won).
0.0609** (2.02) [489]
D3 Bylaws governing audit committee (or internal auditor) exists . 0.0478** (2.39) [447]
D10 Audit committee (or internal auditor) meets with external auditor to review financial statements
0.0420** (2.34) [451]
E1 Firm conducted investor relations activity in year 2000. 0.1013** (2.35) [489]
E2 Firm website includes resumes of board members. 0.0902*** (2.80) [489]
E3 English disclosure exists. 0.0602** (2.12) [456]
P Parity = 1 - ownership disparity, where ownership disparity = ownership by all affiliated shareholders - ownership by largest shareholder.
0.0157*** (4.73) [489]

49
Table 6. OLS Results for Subsamples
Ordinary least squares regressions of Tobin's q (computed as [book value of debt + book value of preferred stock + market value of common stock], divided by book value of assets) on Corporate Governance Index (CG1) for various subsamples of the 489 firms included in the regressions in Table 4. The overall sample is divided in three ways: bank versus non-banks; top-30 chaebol affiliated firms versus non-chaebol firms; and firms with book value of assets greater than 2 trillion won, versus firms with book value of assets less than 2 trillion won. Other control variables are the same as in Table 4, Panel B, except that regressions (3) and (4) do not include Chaebol 30 dummy as a right hand side variable. *, **, and *** respectively indicate significance levels at 10%, 5%, and 1% levels. t-values, based on White's heteroskedasticity-consistent standard errors, are reported in parentheses. Significant results (at 5% level or better) are shown in boldface, except for intercept term.
Tobin’s q
(1) (2) (3) (4) (5) (6)
Banks Non-Banks Chaebols Non-Chaebols Assets > 2 trillion won Assets < 2 trillion won Corporate Governance Index (CG1) 0.0053***
(5.29) 0.0086***
(3.40) 0.0044***
(4.13) 0.0100**
(2.56) 0.0042***
(4.16) Ln (asset s) -0.0383***
(-3.71) -0.0166 (-0.96)
-0.0402*** (-3.05)
-0.0462 (-0.95)
-0.0442*** (-3.41)
Ln (years of listing) -0.0687*** (-5.61)
-0.0536* (-1.91)
-0.0691*** (-5.03)
-0.0490 (-1.56)
-0.0688*** (-4.70)
Debt/Equity 0.0033*** (4.91)
0.0020 (1.20)
0.0033*** (4.10)
0.0009 (0.81)
0.0044*** (4.44)
Sales Growth 0.0168 (0.67)
0.0392* (1.82)
0.0231 (0.25)
0.2464 (1.37)
0.0219 (0.81)
R&D/Sales 0.1134*** (3.19)
1.1582 (0.92)
0.1245*** (3.35)
0.7478 (0.38)
0.1356*** (3.15)
Advertising/Sales 1.4942*** (3.16)
5.7035*** (3.96)
1.3773*** (2.81)
3.7557 (1.15)
1.5581*** (3.24)
Market Share 0.0019*** (3.65)
-0.0028 (-1.64)
0.0021*** (3.58)
-0.0049 (-1.53)
0.0019*** (3.43)
Market Concentration 0.0175 (0.13)
-0.1781 (-0.70)
0.0402 (0.26)
-0.0945 (-0.34)
0.0138 (0.08)
Turnover 0.2353** (2.18)
0.5288* (1.83)
0.1893* (1.65)
0.4210 (1.55)
0.1984* (1.68)
Chaebol 30 Dummy 0.0442* (1.94)
0.0885 (1.03)
0.0371 (1.56)
Sole Ownership -0.0002 (-0.34)
0.0016 (0.83)
-0.0001 (-0.11)
0.0018 (1.47)
-0.0001 (-0.21)
ADR (Level 1) Dummy 0.0276 (0.37)
-0.0026 (-0.03)
-0.0186 (-0.33)
0.0632 (0.69)
-0.0147 (-0.30)
ADR (Level 2 or 3) Dummy -0.0216 (-0.20)
0.1742*** (3.00)
-0.1331** (-2.00)
0.0872 (0.58)
-0.2246*** (-5.23)
MSCI Dummy 0.1469*** (4.70)
0.1102** (2.19)
0.1343*** (3.19)
0.0585 (0.94)
0.1197*** (3.19)
Bank Dummy -0.1022 (-1.35)
0.0515 (0.80)
-0.1797 (-1.49)
0.0260 (0.69)
Intercept Term Yes Yes Yes Yes Yes Yes 2-digit Industry Dummies No Yes Yes Yes Yes Yes Number of Observations 12 477 104 385 62 427 Adjusted R-Square 0.2585 0.4701 0.2574 0.4891 0.2379

50
Table 7. Test of Endogeneity We conduct Wooldridge's (2000) test for endogeneity of the Corporate Governance Index (CG1) and subindices C (outside directors) and D (audit committee and internal auditor), using asset size dummy as an instrumental variable in the first stage regressions. We do not test for endogeneity of subindices A, B, E, and P, and also exclude banks from the sample, because we have no theoretical reason to believe that asset size dummy is a valid instrument for banks or for these subindices. Industry dummy variables are based on 4-digit Korean Standard Industrial Classification codes. *, **, and *** respectively indicate significance levels at 10%, 5%, and 1% levels. t-values, based on White's heteroskedasticity-consistent standard errors, are reported in parentheses. Significant results (at 5% level or better) are shown in boldface, except for intercept term.
Tobin’s q
(1) (2) (3)
Corporate Governance Index (CG1) 0.0154*** (3.39)
Outside Directors (Subindex C) 0.0294*** (3.27)
Audit Committee (Subindex D) 0.0330*** (3.25)
Residual from first-stage regression -0.0105** (2.28)
-0.0261*** (-2.72)
-0.0300*** (-2.89)
Ln (asset s) -0.0653*** (-3.94)
-0.0502*** (-3.70)
-0.0728*** (-3.86)
Ln (years of listing) -0.0655*** (-5.29)
-0.0574*** (-4.37)
-0.0804*** (-6.40)
Debt/Equity 0.0038*** (5.22)
0.0028*** (3.91)
0.0036*** (4.93)
Sales Growth 0.0034 (0.13)
0.0179 (0.69)
0.0020 (0.07)
R&D/Sales 0.0391 (0.75)
0.1126** (2.50)
0.0975** (2.07)
Advertising/Sales 1.5448*** (3.27)
1.4152*** (3.09)
1.2384*** (2.62)
Market Share -0.0462 (-0.34)
-0.0097 (-0.08)
0.1960 (1.59)
Market Concentration 0.1597 (1.43)
0.2879*** (2.65)
0.0746 (0.62)
Turnover 0.0013** (2.36)
0.0018*** (3.14)
0.0016*** (2.84)
Chaebol 30 Dummy 0.0250 (1.12)
0.0365 (1.62)
0.0228 (0.98)
Sole Ownership -0.0001 (-0.12)
0.0000 (-0.05)
0.0006 (0.79)
ADR (Level 1) Dummy -0.0049 (-0.06)
0.0310 (0.35)
0.0990 (1.11)
ADR (Level 2 or 3) Dummy -0.1093 (-1.02)
-0.0395 (-0.48)
-0.1153 (-1.24)
MSCI Dummy 0.1313*** (4.39)
0.1583*** (4.77)
0.1479*** (4.53)
Intercept Term Yes Yes Yes 2-digit Industry Dummies Yes Yes Yes Number of Observations 477 477 477 Adjusted R-Square 0.2659 0.2258 0.2285

51
Table 8. Instrument Reliability:
Panel A: Asset Size Dummies and Corporate Governance To test the reliability of the 2-trillion-won asset size dummy variable as an instrument, we run selected regressions using a family of asset size dummy variables, defined so Asset Size Dummy 1 = 1 if ln(assets) > 3.6 and 0 otherwise; Asset Size Dummy 2 = 1 if ln(assets) >4.6 and 0 otherwise, and so on. The column for "number of firms in size range" indicates the number of firms with a "1" value for the indicated asset size dummy but not the next larger asset size dummy. The residual category of small firms (ln assets < 3.6) contains 22 firms. We exclude banks from the sample since we have no theoretical reason to believe that Asset Size Dummy 5 is a valid instrument for banks. If the relationship between corporate governance and asset size is due to a general relationship between firm size and corporate governance plus the impact of legal rules that apply to companies with assets > 2 trillion won, we expect significance for Asset Size Dummy 5 (row shown in italics), for overall Corporate Governance Index (CG1), and subindices C and D, which capture the areas (independent directors and audit committees) where the relevant legal rules apply, but no pattern for other asset size dummy variables. *, **, and *** respectively indicate significance levels at 10%, 5%, and 1% levels. t-values, based on White's heteroskedasticity-consistent standard errors, are reported in parentheses. Significant results (at 5% level or better) are in boldface, except for intercept term.
Variable No of firms in size range
(1)
CG1
(2)
Subindex A
(3)
Subindex B
(4)
Subindex C
(5)
Subindex D
(6)
Subindex E
(7)
Subindex P Asset Size Dummy 1 (>37 billion won)
114 -2.5722 (-1.16)
0.0785 (0.08)
-1.6194* (-1.72)
-0.0317 (-0.06)
-0.6479 (-0.46)
-0.5835 (-0.95)
-0.3581 (-0.52)
Asset Size Dummy 2 (> 99 billion won)
160 1.1537 (0.68)
0.6568 (0.91)
1.0050 (1.26)
0.0527 (0.11)
0.2888 (0.30)
-0.2672 (-0.50)
-0.0320 (-0.06)
Asset Size Dummy 3 (> 270 billion won)
107 -0.8924 (-0.53)
0.1307 (0.21)
-0.0611 (-0.07)
-0.3484 (-0.76)
-0.5261 (-0.59)
-0.8893* (-1.94)
0.7965 (1.53)
Asset Size Dummy 4 (> 735 billion won)
64 -2.8681 (-1.33)
0.0636 (0.08)
0.0656 (0.07)
-0.1318 (-0.20)
-2.4055** (-2.09)
-0.4169 (-0.75)
0.0934 (0.13)
Asset Size Dummy 5 (> 2.00 trillion won)
41 8.5518*** (3.44)
0.8077 (0.84)
0.1881 (0.16)
4.1671*** (5.45)
4.2073*** (3.94)
1.0636 (1.14)
0.4756 (0.65)
Asset Size Dummy 6 (> 5.43 trillion won)
12 -1.4934 (-0.36)
-0.3259 (-0.24)
0.3512 (0.33)
1.1320 (1.38)
-2.1419 (-1.49)
-0.5568 (-0.32)
0.9018 (0.95)
Asset Size Dummy 7 (> 14.77 trillion won)
14 0.7560 (0.14)
-2.6980 (-1.38)
-1.7561 (-1.30)
-2.8198* (-1.81)
-0.7122 (-0.39)
5.0331 (1.47)
1.6177* (1.68)
Ln (asset s) -- 2.5086* (1.72)
-0.0656 (-0.11)
0.5722 (0.87)
0.5980 (1.48)
1.7411** (2.28)
0.8020* (1.76)
-0.7028 (-1.51)
Ln (years of listing) -- -0.0161 (-0.02)
-0.5173* (-1.93)
0.3478 (1.09)
-0.1966 (-1.18)
0.3994 (1.21)
-0.1912 (-0.77)
0.2009 (0.95)
Debt/Equity -- -0.0498 (-1.35)
-0.0194 (-1.39)
-0.0250 (-1.29)
0.0033 (0.22)
-0.0212 (-1.37)
-0.0281*** (-2.84)
0.0291*** (2.64)
Sales Growth -- 1.3987 (1.33)
-0.1683 (-0.40)
0.2835 (0.70)
0.3924 (1.46)
0.5494 (0.98)
-0.3463 (-0.95)
1.0113*** (3.34)
R&D/Sales -- 5.8003 (1.49)
-0.5742 (-0.34)
5.3431*** (5.26)
1.2163* (1.75)
1.5225 (1.25)
0.0985 (0.11)
1.5135 (1.58)
Advertising/Sales -- yes yes yes yes yes yes yes Market Share -- 4.9274
(0.82) 4.9378**
(2.08) 2.0119 (0.93)
1.0252 (0.68)
-4.2948 (-1.39)
2.1973 (0.92)
0.5652 (0.28)
Market Concentration -- 5.7003 (1.13)
2.5425 (1.17)
0.2337 (0.10)
-1.3331 (-0.97)
5.1152* (1.95)
-0.4819 (-0.28)
-0.9056 (-0.53)
Turnover -- 0.0521** (2.06)
0.0099 (0.94)
0.0166 (1.59)
0.0122* (1.91)
0.0175 (1.15)
-0.0006 (-0.09)
0.0114 (0.62)
Chaebol 30 Dummy -- yes yes yes yes yes yes yes Sole Ownership -- -0.0124
(-0.44) -0.0309***
(-2.91) -0.0097 (-0.74)
-0.0058 (-0.68)
-0.0282* (-1.82)
-0.0062 (-0.65)
0.0656*** (8.80)
ADR (Level 1) Dummy -- 2.7245 (0.73)
0.8782 (0.98)
-0.0507 (-0.04)
0.2138 (0.32)
-1.4049 (-0.96)
1.4029 (0.76)
1.7524** (2.42)
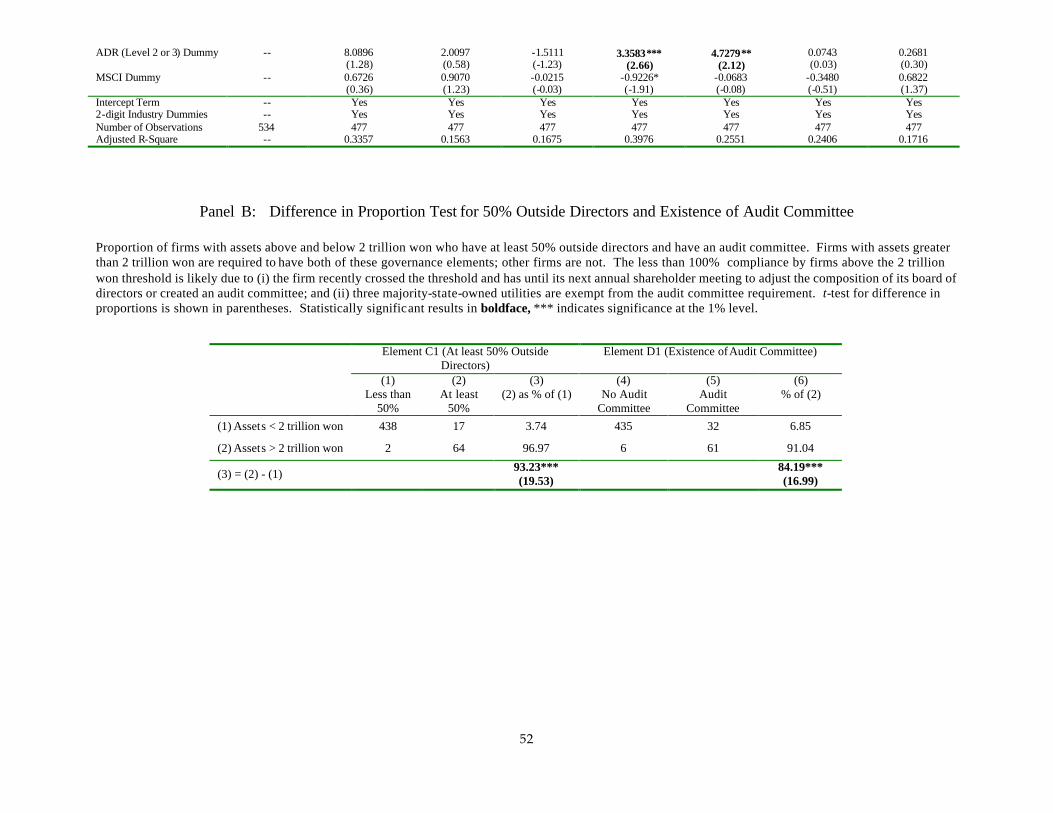
52
ADR (Level 2 or 3) Dummy -- 8.0896 (1.28)
2.0097 (0.58)
-1.5111 (-1.23)
3.3583*** (2.66)
4.7279** (2.12)
0.0743 (0.03)
0.2681 (0.30)
MSCI Dummy -- 0.6726 (0.36)
0.9070 (1.23)
-0.0215 (-0.03)
-0.9226* (-1.91)
-0.0683 (-0.08)
-0.3480 (-0.51)
0.6822 (1.37)
Intercept Term -- Yes Yes Yes Yes Yes Yes Yes 2-digit Industry Dummies -- Yes Yes Yes Yes Yes Yes Yes Number of Observations 534 477 477 477 477 477 477 477 Adjusted R-Square -- 0.3357 0.1563 0.1675 0.3976 0.2551 0.2406 0.1716
Panel B: Difference in Proportion Test for 50% Outside Directors and Existence of Audit Committee
Proportion of firms with assets above and below 2 trillion won who have at least 50% outside directors and have an audit committee. Firms with assets greater than 2 trillion won are required to have both of these governance elements; other firms are not. The less than 100% compliance by firms above the 2 trillion won threshold is likely due to (i) the firm recently crossed the threshold and has until its next annual shareholder meeting to adjust the composition of its board of directors or created an audit committee; and (ii) three majority-state-owned utilities are exempt from the audit committee requirement. t-test for difference in proportions is shown in parentheses. Statistically significant results in boldface, *** indicates significance at the 1% level.
Element C1 (At least 50% Outside
Directors) Element D1 (Existence of Audit Committee)
(1) Less than
50%
(2) At least
50%
(3) (2) as % of (1)
(4) No Audit
Committee
(5) Audit
Committee
(6) % of (2)
(1) Assets < 2 trillion won 438 17 3.74 435 32 6.85
(2) Assets > 2 trillion won 2 64 96.97 6 61 91.04
(3) = (2) - (1) 93.23*** (19.53)
84.19*** (16.99)

53
Table 9. 2SLS / 3SLS for Overall Index and Subindices C and D Panel A. Overall Corporate Governance Index (CG1)
The regression of Tobin's q on CG1 is estimated using two-stage (2SLS) and three-stage (3SLS) least-squares regressions. We exclude banks from the sample since we have theoretical reasons to believe that our instrument is not valid for banks. Asset size dummy (=1 if book value of assets > 2 trillion won, and 0 otherwise) is assumed to be an exogenous variable that is correlated with the corporate governance index but does not appear in the equation for Tobin's q. Equation (1) regresses corporate governance index on asset size dummy plus all other exogenous variables. Equation (2) is estimated with ordinary least-squares, using the fitted value for CG1 from equation (1). Equations (3) and (4) are estimated using 3SLS, with ln (years of listing) treated as an instrumental variable for Tobin's q and suppressed in estimating CG1. Coefficients are omitted for industry dummies, intercept term, and control variables that are insignificant in all regressions. *, **, and *** respectively indicate significance levels at 10%, 5%, and 1% levels. t-values, based on White's heteroskedasticity-consistent standard errors, are reported in parentheses. Significant results (at 5% level or better) are in boldface, except for intercept term.
Two-Stage Least Squares (2SLS ) Three-Stage Least Squares (3SLS ) (1)
CG1 (2)
Tobin’s q (3)
CG1 (4)
Tobin’s q
CG1 0.0154*** (3.25)
0.0154*** (2.93)
Tobin’s q -2.0504 (-0.21)
Ln (asset s) 1.8337*** (3.45)
-0.0653*** (-3.85)
1.7579** (2.48)
-0.0653*** (-3.58)
Ln (years of listing) 0.1302 (0.18)
-0.0655*** (-5.25)
-0.0655*** (-4.58)
Debt/Equity -0.0522 (-1.49)
0.0038*** (5.02)
-0.0461 (-0.96)
0.0038*** (3.87)
Sales Growth 1.7453* (1.75)
0.0034 (0.13)
1.8075 (1.31)
0.0034 (0.11)
R&D/Sales 6.7775* (1.75)
0.0391 (0.67)
7.0723 (1.09)
0.0391 (0.26)
Advertising/Sales -3.7675 (-0.16)
1.5448*** (3.36)
-0.7194 (-0.03)
1.5448*** (3.29)
Market Share yes yes yes yes
Market Concentration 5.8622 (1.17)
0.1597 (1.44)
6.3754 (1.09)
0.1597 (1.31)
Turnover 0.0515** (2.10)
0.0013** (2.18)
0.0558* (1.67)
0.0013* (1.80)
Chaebol 30 Dummy yes yes yes yes Sole Ownership yes yes yes yes
ADR (Level 1) Dummy 2.4939 (0.65)
-0.0049 (-0.06)
2.5629 (0.84)
-0.0049 (-0.07)
ADR (Level 2 or 3) Dummy 8.8899* (1.64)
-0.1093 (-1.23)
8.9473* (1.80)
-0.1093 (-0.89)
MSCI Dummy 0.1380 (0.08)
0.1313*** (4.06)
0.4116 (0.21)
0.1313*** (3.56)
Asset Size Dummy 8.3408*** (3.96)
8.6049*** (3.49)
Intercept Term Yes Yes Yes Yes 2-digit Industry Dummies Yes Yes Yes Yes Number of Observations 477 477 477 477 Adjusted R-Square 0.3280 0.2244

54
Panel B. Subindices C (Outside Directors) and D (Audit Committee and Internal Audit)
The regression of Tobin's q on Subindex C (Outside Directors) and Subindex D (Audit Committee and Internal Audit) is estimated using 2SLS and 3SLS regressions. Sample size and control variables are the same as in Panel A. Asset size dummy is assumed to be an exogenous variable that is correlated with Subindex C and D but does not appear in the equation for Tobin's q. We do not present results for subindices A, B , E, or P because asset size dummy is not an appropriate instrument for these subindices. Equations (5) and (9) regress Subindex C or D on asset size dummy plus all other exogenous variables. Equations (6) and (10) are estimated with ordinary least-squares, using the fitted value for Subindex C or D from the first stage regression. Equations (7-8) and (11-12) are estimated using 3SLS using ln (years of listing) as an instrumental variable for Tobin's q, which is suppressed in estimating Subindex C or D. For the 2SLS regressions , the t-statistics on CG1 (equation (2)), Subindex C (equation (6)) and Subindex D (equation (10)) are identical, because they reflect the ppower of the instrument (asset size dummy), not the instrumented variable. Coefficients are omitted for industry dummies, intercept term, and control variables that are insignificant in all regressions. *, **, and *** respectively indicate significance levels at 10%, 5%, and 1% levels. t-values, based on White's heteroskedasticity-consistent standard errors, are reported in parentheses. Significant results (at 5% level or better) are in boldface, except for intercept term.
2SLS 3SLS 2SLS 3SLS (5)
Subindex C (6)
Tobin’s q (7)
Subindex C (8)
Tobin’s q (9)
Subindex D (10)
Tobin’s q (11)
Subindex D (12)
Tobin’s q Subindex C or D 0.0294***
(3.25) 0.0294***
(3.03) 0.0330***
(3.25) 0.0330***
(2.57) Tobin’s q 3.2667
(1.19) -8.1046
(-1.47)
Ln (asset s) 0.4501*** (2.90)
-0.0502*** (-3.71)
0.5708*** (2.90)
-0.0502*** (-3.55)
1.0859*** (3.84)
-0.0728*** (-3.86)
0.7864** (1.99)
-0.0728*** (-.3.16)
Ln (years of listing) -0.2074 (-1.27)
-0.0574*** (-4.37)
-0.0574*** (-3.99)
0.5145 (1.59)
-0.0804*** (-6.40)
-0.0804*** (-4.85)
Debt/Equity 0.0044 (0.29)
0.0028*** (3.82)
-0.0053 (-0.40)
0.0028*** (3.10)
-0.0206 (-1.44)
0.0036*** (4.90)
0.0034 (0.13)
0.0036*** (3.32)
Sales Growth yes yes yes yes yes yes yes yes R&D/Sales 1.0607*
(1.79) 0.1126***
(2.46) 0.5910 (0.33)
0.1126 (0.81)
1.4031 (1.49)
0.0975** (2.04)
2.5685 (0.71)
0.0975 (0.59)
Advertising/Sales 2.4272 (0.35)
1.4152*** (3.09)
-2.4291 (-0.37)
1.4152*** (3.12)
7.5263 (0.51)
1.2384*** (2.67)
19.5750 (1.47)
1.2384** (2.29)
Market Share 0.8643 (0.59)
-0.0097 (-0.08)
0.8128 (0.56)
-0.0097 (-0.08)
-5.4634* (-1.83)
0.1960 (1.60)
-5.3357* (-1.84)
0.1960 (1.34)
Market Concentration -1.2771 (-0.92)
0.2879*** (2.63)
-2.0946 (-1.29)
0.2879*** (2.58)
5.3266** (2.04)
0.0746 (0.62)
7.3548** (2.25)
0.0746 (0.49)
Turnover 0.0112* (1.83)
0.0018*** (3.14)
0.0044 (0.47)
0.0018*** (2.71)
0.0146 (0.93)
0.0016*** (2.83)
0.0317* (1.70)
0.0016** (2.07)
Chaebol 30 Dummy yes yes yes yes yes yes yes yes Sole Ownership yes yes yes yes yes yes yes yes ADR (Level 1) Dummy yes yes yes yes yes yes yes yes ADR (Level 2 or 3) Dummy 2.2949***
(3.26) -0.0395 (-0.48)
2.2035 (1.60)
-0.0395 (-0.35)
4.3453** (2.05)
-0.1153 (-1.29)
4.5723* (1.65)
-0.1153 (-0.82)
MSCI Dummy -0.8439* (-1.79)
0.1583*** (4.72)
-1.2799** (-2.33)
0.1583*** (4.55)
-0.4369 (-0.54)
0.1479*** (4.51)
0.6448 (0.58)
0.1479*** (3.60)
Asset Size Dummy 4.3763*** (6.93)
3.9555*** (5.76)
3.9052*** (4.57)
4.9491*** (3.60)
Intercept Term Yes Yes Yes Yes Yes Yes Yes Yes 2-digit Industry Dummies Yes Yes Yes Yes Yes Yes Yes Yes Number of Observations 477 477 477 477 477 477 477 477 Adjusted R-Square 0.3910 0.2244 0.2406 0.2244

55
Table 10. Robustness Check: 2SLS / 3SLS for Whole Sample and Other Sub-Samples Two-stage (2SLS) and three-stage (3SLS) least squares regressions of Tobin's q on Corporate Governance Index (CG1) for the whole sample of 489 firms and sub-samples of top-30 chaebol affiliated firms versus non-chaebol firms . Control variables are the same as in Table 9 . *, **, and *** respectively indicate significance levels at 10%, 5%, and 1% levels. t-values , based on White's heteroskedasticity-consistent standard errors, are reported in parentheses. Significant results (at 5% level or better) are shown in boldface, except for intercept term.
Panel A. Whole Sample (Including Banks)
Two-Stage Least Squares (2SLS ) Three-Stage Least Squares (3SLS )
(1) CG1
(2) Tobin’s q
(3) CG1
(4) Tobin’s q
CG1 0.0154*** (3.38)
0.0154*** (3.02)
Tobin’s q -0.4742 (-0.05)
Ln (asset s) 2.0205*** (3.87)
-0.0661*** (-3.87)
2.0039*** (2.96)
-0.0661*** (-3.57)
Ln (years of listing) 0.0292 (0.04)
-0.0620*** (-5.11)
-0.0620*** (-4.44)
Debt/Equity -0.0406 (-1.24)
0.0033*** (4.91)
-0.0394 (-0.89)
0.0033*** (3.61)
Sole Ownership -0.0102 (-0.38)
0.0001 (0.16)
-0.0103 (-0.36)
0.0001 (0.15)
R&D/Sales 6.9707* (1.81)
0.0392 (0.67)
7.0404 (1.10)
0.0392 (0.26)
Advertising/Sales -4.0378 (-0.17)
1.5358*** (3.35)
-3.3390 (-0.14)
1.5358*** (3.28)
Market Share 3.4938 (0.61)
-0.0327 (-0.25)
3.5038 (0.68)
-0.0327 (-0.27)
Market Concentration 5.6460 (1.14)
0.1594 (1.45)
5.7629 (0.99)
0.1594 (1.33)
Turnover 0.0530** (2.13)
0.0013** (2.18)
0.0540 (1.62)
0.0013* (1.83)
Chaebol 30 Dummy 0.3801 (0.30)
0.0288 (1.37)
0.3966 (0.33)
0.0288 (1.04)
Sole Ownership -0.0102 (-0.38)
0.0001 (0.16)
-0.0103 (-0.36)
0.0001 (0.15)
ADR (Level 1) Dummy 0.6527 (0.17)
0.0183 (0.23)
0.6661 (0.23)
0.0183 (0.28)
ADR (Level 2 or 3) Dummy 10.0266** (2.25)
-0.1402* (-1.85)
10.0335** (2.31)
-0.1402 (-1.26)
MSCI Dummy 0.0978 (0.06)
0.1230*** (3.95)
0.1569 (0.08)
0.1230*** (3.45)
Bank Dummy 14.0666*** (4.43)
-0.1804** (-2.11)
14.0841*** (4.47)
-0.1804 (-1.63)
Asset Size Dummy 8.3569*** (4.10)
8.4181*** (3.52)
Intercept Term Yes Yes Yes Yes 2-digit Industry Dummies Yes Yes Yes Yes Number of Observations 489 489 489 489 Adjusted R-Square 0.4449 0.2357

56
Panel B. Chaebols and Non-Chaebols
Chaebol Firms Non-Chaebol Firms
2SLS 3SLS 2SLS 3SLS (5)
CG1 (6)
Tobin’s q (7)
CG1 (8)
Tobin’s q (9)
CG1 (10)
Tobin’s q (11) CG1
(12) Tobin’s q
CG1 0.0112 (1.10)
0.0112 (1.25)
0.0144*** (2.88)
0.0144** (2.51)
Tobin’s q -44.3478 (-0.72)
0.8251 (0.08)
Ln (asset s) 1.9717 (1.48)
-0.0256 (-0.60)
1.8214 (0.98)
-0.0256 (-0.73)
1.9123*** (3.17)
-0.0659*** (-3.46)
1.9439** (2.40)
-0.0659*** (-3.23)
Ln (years of listing) 1.7125 (0.91)
-0.0579 (-1.64)
-0.0579* (-1.85)
-0.0534 (-0.07)
-0.0639*** (-4.49)
-0.0639*** (-4.06)
Debt/Equity -0.1594** (-2.22)
0.0024 (0.91)
-0.1345 (-1.01)
0.0024 (1.17)
-0.0073 (-0.21)
0.0034*** (4.00)
-0.0100 (-0.19)
0.0034*** (3.30)
Sales Growth 1.8091** (2.02)
0.0334 (1.14)
4.1928 (0.99)
0.0334 (0.98)
4.6393* (1.71)
-0.0079 (-0.08)
4.5907 (1.63)
-0.0079 (-0.12)
R&D/Sales 1.3527 (0.02)
1.1863 (0.72)
54.6378 (0.42)
1.1863 (1.04)
6.3432** (1.99)
0.0556 (0.96)
6.2219 (1.00)
0.0556 (0.37)
Advertising/Sales -259.8894*** (-2.46)
6.4020* (1.99)
-105.5273 (-0.44)
6.4020** (2.23)
9.1348 (0.38)
1.3051*** (2.71)
7.9494 (0.33)
1.3051*** (2.68)
Market Share 1.4762 (0.13)
-0.1795 (-0.62)
-5.7465 (-0.31)
-0.1795 (-0.97)
4.4842 (0.58)
-0.0465 (-0.31)
4.4693 (0.75)
-0.0465 (-0.31)
Market Concentration 18.7692 (1.20)
0.4670 (1.20)
48.8369 (0.99)
0.4670 (1.51)
3.4292 (0.66)
0.1524 (1.32)
3.2627 (0.56)
0.1524 (1.19)
Turnover -0.0114 (-0.12)
-0.0028 (-1.53)
-0.1401 (-0.56)
-0.0028 (-1.25)
0.0563** (2.15)
0.0015** (2.34)
0.0544 (1.57)
0.0015** (2.01)
Sole Ownership 0.0264 (0.49)
0.0015 (0.86)
0.1050 (0.71)
0.0015 (1.32)
-0.0207 (-0.64)
0.0001 (0.21)
-0.0206 (-0.65)
0.0001 (0.19)
ADR (Level 1) Dummy 5.4173 (1.31)
-0.0162 (-0.12)
7.3982 (1.31)
-0.0162 (-0.21)
-14.5021*** (-5.67)
0.1303*** (2.95)
-14.4372** (-2.40)
0.1303 (0.79)
ADR (Level 2 or 3) Dummy -1.2874 (-0.40)
0.1801** (2.50)
6.0573 (0.36)
0.1801 (1.17)
13.1743*** (4.71)
-0.2752 (-1.38)
13.2448** (2.56)
-0.2752* (-1.86)
MSCI Dummy 0.1038 (0.04)
0.1065** (1.99)
4.8798 (0.69)
0.1065** (2.39)
-0.0334 (-0.01)
0.1316*** (2.95)
-0.1415 (-0.06)
0.1316*** (2.76)
Bank Dummy 4.3287 (0.67)
-0.1139 (-1.31)
1.4355 (0.14)
-0.1139 (-0.93)
13.3152*** (4.03)
-0.1658 (-1.38)
13.2937*** (3.27)
-0.1658 (-1.10)
Asset Size Dummy 5.6643* (1.80)
8.4879 (1.42)
13.2802*** (3.91)
13.1223*** (3.28)
Intercept Term Yes Yes Yes Yes Yes Yes Yes Yes 2-digit Industry Dummies Yes Yes Yes Yes Yes Yes Yes Yes Number of Observations 104 104 104 104 385 385 385 385 Adjusted R-Square 0.4860 0.3576 0.4431 0.2400

57
Table 11. Robustness Check: Different Corporate Governance and Firm Performance Variables
Coefficients on different corporate governance indices (CG1-CG3) in ordinary least squares (OLS), two-stage (2SLS) and three-stage (3SLS) regressions of Tobin's q, market/book ratio, and market/sales ratio. The OLS regressions use the same additional control variables as in Table 4. The 2SLS and 3SLS regressions use the same instrument (asset size dummy at 2 trillion won) and control variables as in Table 9. When estimating 2SLS and 3SLS, we exclude banks from the sample since we have theoretical reasons to believe that our instrument is not valid for banks. Observations are identified as outliers if a studentized residual obtained from a regression of the dependent variable (Tobin ’s q, market/book, or market/sales) on the corporate governance index is greater than 1.96 or smaller than –1.96. *, **, and *** respectively indicate significance levels at 10%, 5%, and 1% levels. t-values, based on White's heteroskedasticity-consistent standard errors, are reported in parentheses. Sample size is reported in brackets. Significant results (at 5% level or better) are shown in boldface.
Ordinary Least Squares (OLS) Two-Stage Least Squares (2SLS) Three-Stage Least Squares (3SLS)
Tobin’s q Market/Book Market/Sales Tobin’s q Market/Book Market/Sales Tobin’s q Market/Book Market/Sales
CG1 0.0052***
(5.29) [489]
0.0121*** (4.72) [489]
0.0094*** (3.64) [488]
0.0154*** (3.25) [477]
0.0349*** (2.78) [486]
0.0336** (2.33) [486]
0.0154*** (2.93) [477]
0.0349*** (2.64) [486]
0.0336** (2.43) [486]
CG2 0.0050***
(5.10) [488]
0.0117*** (4.50) [498]
0.0094*** (3.65) [488]
0.0149*** (3.30) [476]
0.0332*** (2.78) [486]
0.0325** (2.33) [486]
0.0149*** (3.00) [476]
0.0332*** (2.66) [486]
0.0325** (2.45) [486]
CG3 0.0049***
(5.22) [488]
0.0106*** (4.61) [497]
0.0091*** (3.72) [488]
0.0213*** (3.30) [476]
0.0443*** (2.60) [485]
0.0466** (2.33) [486]
0.0213** (2.54) [476]
0.0443** (2.23) [485]
0.0466** (2.15) [486]
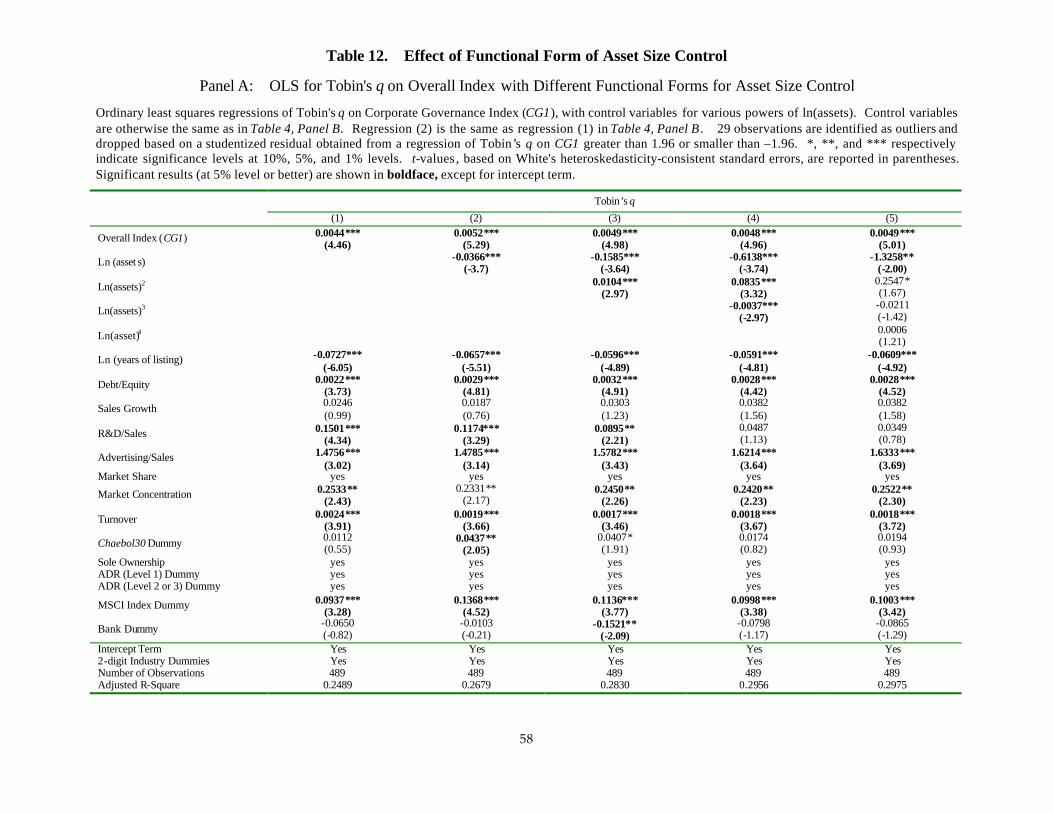
58
Table 12. Effect of Functional Form of Asset Size Control
Panel A: OLS for Tobin's q on Overall Index with Different Functional Forms for Asset Size Control
Ordinary least squares regressions of Tobin's q on Corporate Governance Index (CG1), with control variables for various powers of ln(assets). Control variables are otherwise the same as in Table 4, Panel B. Regression (2) is the same as regression (1) in Table 4, Panel B . 29 observations are identified as outliers and dropped based on a studentized residual obtained from a regression of Tobin’s q on CG1 greater than 1.96 or smaller than –1.96. *, **, and *** respectively indicate significance levels at 10%, 5%, and 1% levels. t-values , based on White's heteroskedasticity-consistent standard errors, are reported in parentheses. Significant results (at 5% level or better) are shown in boldface, except for intercept term.
Tobin’s q
(1) (2) (3) (4) (5)
Overall Index (CG1) 0.0044*** (4.46)
0.0052*** (5.29)
0.0049*** (4.98)
0.0048*** (4.96)
0.0049*** (5.01)
Ln (asset s) -0.0366*** (-3.7)
-0.1585*** (-3.64)
-0.6138*** (-3.74)
-1.3258** (-2.00)
Ln(assets)2 0.0104*** (2.97)
0.0835*** (3.32)
0.2547* (1.67)
Ln(assets)3 -0.0037*** (-2.97)
-0.0211 (-1.42)
Ln(asset)4 0.0006 (1.21)
Ln (years of listing) -0.0727*** (-6.05)
-0.0657*** (-5.51)
-0.0596*** (-4.89)
-0.0591*** (-4.81)
-0.0609*** (-4.92)
Debt/Equity 0.0022*** (3.73)
0.0029*** (4.81)
0.0032*** (4.91)
0.0028*** (4.42)
0.0028*** (4.52)
Sales Growth 0.0246 (0.99)
0.0187 (0.76)
0.0303 (1.23)
0.0382 (1.56)
0.0382 (1.58)
R&D/Sales 0.1501*** (4.34)
0.1174*** (3.29)
0.0895** (2.21)
0.0487 (1.13)
0.0349 (0.78)
Advertising/Sales 1.4756*** (3.02)
1.4785*** (3.14)
1.5782*** (3.43)
1.6214*** (3.64)
1.6333*** (3.69)
Market Share yes yes yes yes yes
Market Concentration 0.2533** (2.43)
0.2331** (2.17)
0.2450** (2.26)
0.2420** (2.23)
0.2522** (2.30)
Turnover 0.0024*** (3.91)
0.0019*** (3.66)
0.0017*** (3.46)
0.0018*** (3.67)
0.0018*** (3.72)
Chaebol30 Dummy 0.0112 (0.55)
0.0437** (2.05)
0.0407* (1.91)
0.0174 (0.82)
0.0194 (0.93)
Sole Ownership yes yes yes yes yes ADR (Level 1) Dummy yes yes yes yes yes ADR (Level 2 or 3) Dummy yes yes yes yes yes
MSCI Index Dummy 0.0937*** (3.28)
0.1368*** (4.52)
0.1136*** (3.77)
0.0998*** (3.38)
0.1003*** (3.42)
Bank Dummy -0.0650 (-0.82)
-0.0103 (-0.21)
-0.1521** (-2.09)
-0.0798 (-1.17)
-0.0865 (-1.29)
Intercept Term Yes Yes Yes Yes Yes 2-digit Industry Dummies Yes Yes Yes Yes Yes Number of Observations 489 489 489 489 489 Adjusted R-Square 0.2489 0.2679 0.2830 0.2956 0.2975

59
Panel B: OLS for CG1 with Different Functional Forms for Asset Size Control
Ordinary least squares regressions of Corporate Governance Index (CG1) on asset size dummy, with control variables for various powers of ln(assets). Control variables are otherwise the same as in Table 4, Panel B. We exclude banks from the sample because we have no theoretical reason to believe that asset size dummy is a valid instrument for banks. Regression (2) is the same as regression (1) in Table 9, Panel A. 29 observations are identified as outliers and dropped based on a studentized residual obtained from a regression of Tobin’s q on CG1 greater than 1.96 or smaller than –1.96. *, **, and *** respectively indicate significance levels at 10%, 5%, and 1% levels. t -values, based on White's heteroskedasticity-consistent standard errors, are reported in parentheses. Significant results (at 5% level or better) are shown in boldface, except for intercept term.
Corporate Governance Index (CG1)
(1) (2) (3) (4) (5)
Asset Size Dummy 10.6669*** (4.98)
8.3408*** (3.96)
8.2722*** (3.19)
8.4859*** (3.26)
10.5154*** (3.52)
Ln (asset s) 1.8337*** (3.45)
1.7117 (0.66)
9.7727 (0.96)
-48.8978 (-1.29)
Ln(assets)2 0.0113 (0.05)
-1.3155 (-0.80)
13.4476 (1.41)
Ln(assets)3 0.0686 (0.81)
-1.5053 (-1.46)
Ln(assets)4 0.0598 (1.52)
Ln (years of listing) 0.5541 (0.77)
0.1302 (0.18)
0.1325 (0.19)
0.1268 (0.18)
-0.0307 (-0.04)
Debt/Equity -0.0183 (-0.51)
-0.0522 (-1.49)
-0.0520 (-1.47)
-0.0489 (-1.37)
-0.0517 (-1.43)
Sales Growth 1.5913 (1.42)
1.7453* (1.75)
1.7566* (1.71)
1.6943 (1.64)
1.6366 (1.54)
R&D/Sales 5.3847 (1.23)
6.7775* (1.75)
6.7519* (1.71)
7.3783* (1.84)
6.6424 (1.64)
Advertising/Sales yes yes yes yes yes
Market Share 9.7231* (1.70)
4.0107 (0.69)
3.9360 (0.66)
3.8062 (0.63)
3.8497 (0.63)
Market Concentration 4.9102 (0.96)
5.8622 (1.17)
5.8794 (1.18)
5.8570 (1.17)
6.4609 (1.28)
Turnover 0.0297 (1.37)
0.0515** (2.10)
0.0514** (2.09)
0.0508** (2.02)
0.0525** (2.10)
Chaebol30 Dummy 2.1243* (1.71)
0.7464 (0.57)
0.7412 (0.56)
0.9674 (0.71)
1.1316 (0.81)
Sole Ownership -0.0009 (-0.03)
-0.0076 (-0.27)
-0.0075 (-0.27)
-0.0086 (-0.30)
-0.0139 (-0.49)
ADR (Level 1) Dummy yes yes yes yes yes
ADR (Level 2 or 3) Dummy 10.6855* (1.95)
8.8899 (1.64)
8.7873 (1.41)
6.9360 (0.95)
4.9299 (0.64)
MSCI Index Dummy 1.7484 (1.01)
0.1380 (0.08)
0.1251 (0.07)
0.3459 (0.19)
0.5863 (0.31)
Intercept term Yes Yes Yes Yes Yes 2-digit Industry Dummies Yes Yes Yes Yes Yes Number of Observations 477 477 477 477 477 Adjusted R-Square 0.3113 0.328 0.328 0.3291 0.3322

60
Panel C: 2SLS with Different Functional Forms for Asset Size Control
Second-stage of two stage least squares (2SLS) regressions, similar to Table 9, Panel A, except for variation in the control variables for powers of ln(assets). Control variables and sample are otherwise the same as in Table 9, Panel A Regression (2) is the same as Table 9, Panel A, regression (1). Coefficients are omitted for industry dummies, intercept term, and control variables that are insignificant in all regressions. *, **, and *** respectively indicate significance levels at 10%, 5%, and 1% levels. t -values, based on White's heteroskedasticity-consistent standard errors, are reported in parentheses. Significant results (at 5% level or better) are shown in boldface, except for intercept term.
Tobin’s q
(1) (2) (3) (4) (5) IV (asset size dummy) for Overall Index (CG1)
0.0077** (2.09)
0.0154*** (3.10)
0.0057 (0.92)
0.0043 (0.71)
0.0078 (1.39)
Ln (asset s) -0.0653*** (-3.80)
-0.1925*** (-3.85)
-0.6198*** (-3.07)
-1.5187* (-1.91)
Ln(assets)2 0.0134*** (2.70)
0.0841*** (2.57)
0.3063 (1.59)
Ln(assets)3 -0.0037** (-2.14)
-0.0271 (-1.35)
Ln(assets)4 0.0009 (1.16)
Ln (years of listing) -0.0763*** (-5.70)
-0.0655*** (-4.86)
-0.0614*** (-4.56)
-0.0610*** (-4.54)
-0.0637*** (-4.67)
Debt/Equity 0.0024*** (2.80)
0.0038*** (4.10)
0.0034*** (3.71)
0.0032*** (3.46)
0.0033*** (3.63)
Advertising/Sales 1.4949*** (3.34)
1.5448*** (3.48)
1.6007*** (3.63)
1.6300*** (3.71)
1.6496*** (3.76)
Market Concentration 0.2317** (2.06)
0.1597*** (3.48)
0.2376** (2.01)
0.2468** (2.11)
0.2351** (2.03)
Turnover 0.0023*** (3.73)
0.0013* (1.91)
0.0017** (2.40)
0.0018*** (2.56)
0.0016*** (2.38)
MSCI Index Dummy 0.0876** (2.42)
0.1313*** (3.77)
0.1174*** (3.36)
0.1058*** (2.99)
0.1081*** (3.05)
Sales Growth yes yes yes yes yes R&D/Sales yes yes yes yes yes Market Share yes yes yes yes yes Chaebol30 Dummy yes yes yes yes yes Sole Ownership yes yes yes yes yes ADR (Level 1) Dummy yes yes yes yes yes ADR (Level 2 or 3) Dummy yes yes yes yes yes Intercept term Yes Yes Yes Yes Yes 2-digit Industry Dummies Yes Yes Yes Yes Yes Number of Observations 477 477 477 477 477 Adjusted R-Square 0.1631 0.1795 0.1912 0.1964 0.1989