Embed Size (px)
Citation preview

The Regents of the University of Colorado, a body corporate, contracting on behalfof the University of Colorado at Boulder for the benefit of INSTAAR
Distribution of Selected Chemical Elements in Even-Aged Alder (Alnus) Ecosystems nearFairbanks, AlaskaAuthor(s): Keith Van Cleve and Leslie A. ViereckSource: Arctic and Alpine Research, Vol. 4, No. 3 (Summer, 1972), pp. 239-255Published by: INSTAAR, University of ColoradoStable URL: http://www.jstor.org/stable/1550226 .
Accessed: 12/06/2014 20:21
Your use of the JSTOR archive indicates your acceptance of the Terms & Conditions of Use, available at .http://www.jstor.org/page/info/about/policies/terms.jsp
.JSTOR is a not-for-profit service that helps scholars, researchers, and students discover, use, and build upon a wide range ofcontent in a trusted digital archive. We use information technology and tools to increase productivity and facilitate new formsof scholarship. For more information about JSTOR, please contact [email protected].
.
INSTAAR, University of Colorado and The Regents of the University of Colorado, a body corporate,contracting on behalf of the University of Colorado at Boulder for the benefit of INSTAAR are collaboratingwith JSTOR to digitize, preserve and extend access to Arctic and Alpine Research.
http://www.jstor.org
This content downloaded from 185.2.32.73 on Thu, 12 Jun 2014 20:21:55 PMAll use subject to JSTOR Terms and Conditions

Arctic and Alpine Research Vol. 4, No. 3, 1972, pp. 239-255
DISTRIBUTION OF SELECTED CHEMICAL ELEMENTS IN EVEN-AGED ALDER (ALNUS) ECOSYSTEMS
NEAR FAIRBANKS, ALASKA
KEITH VAN CLEVE* AND LESLIE A. VIERECKt
ABSTRACT
This study reports the distribution of selected nutrient elements in portions of 5-, 15- and 20-year-old alder ecosystems developing on the Tanana River floodplain in central Alaska. Distribution of elements is shown for foliage, branches, boles, litter, roots, and soil by per- centage and on a kilogram per hectare basis. The most obvious change in nutrient distribu- tion with time between soil and plant material was found for potassium. The proportion of available ecosystem soil K decreased from 100% at time zero to 60.9% at 20 years, while the proportion of K in plant material
increased from 0% to 39.1% over the 20-year period of system development. The change in distribution of nutrient elements within the plant components as a function of time primarily reflects change in biomass distribu- tion. Regression equations were developed relating biomass and mass of nutrient elements in aboveground alder tree components to tree basal diameter. For the 5- to 20-year period in ecosystem development the gross average annual nutrient uptake by the vegetation expressed as kg ha-' is 2.6 for P, 11.4 for K, 33.7 for Ca, 8.5 for Mg, and 0.2 for Mn.
INTRODUCTION
Numerous studies have been conducted in different geographic regions of the world as- sessing the mass and distribution of nutrient elements in various forest ecosystems. Much of this work has been summarized by Ovington (1962) and Rodin and Bazilevich (1965). Ovington (1962) emphasized the value of the ecosystem concept in improving forestry practice as providing a sound basis for investi- gations designed to elucidate the functional processes of woodlands and to show the bearing of these processes on forest productivity and
*Forest Soils Laboratory, University of Alaska, College, Alaska 99701.
tInstitute of Northern Forestry, U.S. Forest Service, College, Alaska 99701.
the possibilities for improving productivity on a long-term basis.
In the boreal forest zone of Alaska, the opportunity exists to examine functional processes in relation to the productivity of the various forest types at a time when forest resources have not been extensively utilized. The present study provides data on the mass and distribution of selected nutrient elements in even-aged stands of alder (Alnus incana (L.) Moench spp. tenuifolia (Nutt.) Brietung) growing on the Tanana River floodplain near Fairbanks, Alaska. Alder is an important early phase in forest sucession.
The accumulation rates of biomass and nitrogen in these stands have been reported in a previous paper (Van Cleve et al., 1971).
K. VAN CLEVE AND L. A. VIERECK/239
I
This content downloaded from 185.2.32.73 on Thu, 12 Jun 2014 20:21:55 PMAll use subject to JSTOR Terms and Conditions

METHODS
FIELD METHODS The criteria used in selecting sample sites
were (1) stands should be of sufficient size to allow location of study plots free from edge effects, (2) stands should have uniform age structure, and (3) site should have ready access to river water for hydraulic root wash- ing. Difficulties encountered in meeting these criteria have been described earlier (Van Cleve et al., 1971).
A 0.01-ha plot was established in each of the three sample sites and all vegetation destruc- tively sampled within this area. The above ground parts of eight alders, representing a cross section of diameters, were sampled in- tensively in order to establish the distribution of weight and nutrient elements between vari- ous plan components. Foliage with small twigs, and live and dead branches were removed from each tree and the field weights determined. Boles were sectioned into 1-m lengths, weighed in the field, each length subsampled, and the field weights of the subsamples determined. The remaining vegeta- tion was felled, separated into foliage, live and dead branches, and live and dead boles, and their field weights determined. Other tree and shrub species, numerically subordinate to alder, were treated in the same manner, although the number of intensively sampled trees was less in some cases due to lower frequency of occurrence.
Equisetum, occurring in dense stands on the forest floor in all plots, was sampled in three randomly located 1-m-square quadrats. Samples of the litter layer were obtained from each of these quadrats following removal of the Equisetum. Bulk soil samples for nutrient ana- lysis and volumetric soil samples for bulk density determinations were obtained from duplicate pits which extended to the water table at each site.
Soil profiles were sampled by horizon in an attempt to separate alluvial material deposited by more recent floding from older alluvium. Considerable variability existed in thickness and depth of the various strata from location to location at each site. Changing river currents at time of flooding probably resulted in the local variations in soil texture.
Following sampling of the aboveground biomass, an area approximately 3-m-square was excavated by hydraulic power in order to obtain root samples. Excavation extended
below the rooting zone. Three random meter square samples were obtained of the exposed root systems. No effort was made to separate live roots from dead roots, or to separate roots by species.
Soil samples were obtained from three sand bars recently exposed by low river water level and devoid of vegetation in order to establish the nutrient content of a "time zero" ecosystem.
LABORATORY METHODS The entire weighed crown (foliage and
branches) and bole subsamples from each intensively sampled tree were brought to the laboratory where foliage, male and female cone, and branch separations were completed, and the components (including bole sub- samples) oven dried at 65?C to a constant weight. Root system subsamples were oven dried in a similar manner. On the basis of the oven-dry weight, the average proportions of foliage, branches, male cones, female cones, and bole of each tree were determined. These ratios were used to calculate the oven-dry proportion of each plant component from the field weights of the remaining material removed from each plot. Organic matter samples were ground to pass a 1-mm Wiley mill screen. Soil samples were air dried and then passed through a 2-mm sieve in preparation for analysis.
Concentrations of nutrient elements in vege- tation and litter samples were determined from aliquots of a perchloric-acid digestion of the material. Phosphorus was determined by the molybdenum blue method using an amino- naphtol-sulfonic acid reducing agent (Jackson, 1958). Cations (K, Ca, Mg, and Mn) were determined using an atomic absorption spectro- photometer. Strontium chloride was added to the Ca and Mg aliquots to suppress anion interference. Total elemental concentrations were expressed as percentage of the total in the ecosystem components which were analyzed or kilograms per hectare of the element on a dry weight basis.
Soil pH was determined on a saturation paste using a glass electrode pH meter. Soil particle size was determined by the hydrometer method (Black, 1965). Exchangeable base status and cation exchange capacity of the soil were determined by the ammonium acetate method at pH 7 (Black, 1965). The concentration of exchangeable cations was determined on aliquots of the ammonium acetate extract
240/ARCTIC AND ALPINE RESEARCH
This content downloaded from 185.2.32.73 on Thu, 12 Jun 2014 20:21:55 PMAll use subject to JSTOR Terms and Conditions

using the same analytical procedure described for plant tissue. Percentage of organic matter was determined by the Walkley-Black method (Jackson, 1958). Total phosphorus was de- termined on an aliquot of a perchloric acid digest of the soil, using the same colorimetric technique employed in plant tissue analysis. Exchange capacity and exchangeable base concentrations were expressed as milliequiva- lents per one hundred grams oven dry soil. Ash content of the plant material was deter- mined by a dry ashing technique (Jackson, 1958). For ecosystem totals the data for exchangeable bases and total phosphorus were expressed as kilograms element per hectare. These figures were based on the volume weight of successive levels of the soil profile as determined by bulk density samples. Rock content of all profiles was negligible.
The total soil P determinations conducted in this study represented the P contained in soil organic matter and some small, unknown amount of P which may occur in mineral form. Exchangeable base determinations repre- sented the concentrations of nutrients consid- ered to be generally available to plants but represented only a small fraction of total elements found in the soil.
Multiple range tests (Tukey's w test) were conducted to establish the statistical significance of differences in mean values for soil profile chemical properties between different aged ecosystems. The significance of differences in mean values for chemical properties between duplicate soil profiles for each ecosystem was determined with a t test. These tests were conducted at the 5% level of probability.
RESULTS
CHEMICAL PROPERTIES OF
ECOSYSTEM SOILS
Soil pH decreased significantly between time zero and 5, 15, and 20 years (Tables 1 and 2). The mean soil profile pH continued to decrease
by 0.3 of a pH unit from 5 to 20 years. Significant differences in pH did not occur between replicate soil profiles within any of the ecosystems sampled.
Cation exchange capacity was significantly
Chemical properties for
TABLE 1 soil profiles in alder ecosystemsa
Exchangeable Bases Sample area Depth
(cm)
0-15 15-30 30-46 46-61 61-69 0-10
10-25 25-41 41-56 56-69
0-10 10-25 25-41 41-56 56-69 0-10
10-25 25-41 41-56 56-69
pH CEC
8.0 8.0 7.9 8.0 7.8 7.6 7.4 7.5 7.3 7.5 7.2 7.2 7.4 7.4 7.4 6.9 7.3 7.4 7.2 7.3
3.8 3.2 3.6 3.9 2.5 4.4 8.5 5.4 4.3 3.9 7.1
14.6 7.5 5.3 6.3
13.1 7.2 6.1 5.6 6.3
K Ca Mg (meq 100 g-1)
0.07 0.08 0.08 0.04 0.03 0.11 0.07 0.10 0.10 0.09 0.10 0.10 0.09 0.08 0.09 0.16 0.15 0.15 0.10 0.11
2.21 2.47 2.60 0.78 0.12 7.29 7.88 7.38 5.96 5.50 7.45 8.62 5.32 5.91 6.13 6.10 4.54 6.57 7.76 7.30
0.14 0.16 0.17 0.07 0.05 0.43 0.56 0.46 0.27 0.30 0.59 0.36 0.30 0.77 0.56 0.73 0.20 0.20 0.27 0.18
Mn %P %OM
0.05 0.05 0.07 0.02 0.02 0.12 0.10 0.07 0.06 0.05 0.15 0.13 0.07 0.06 0.06 0.13 0.08 0.09 0.08 0.07
0.04 0.05 0.05 0.03 0.03 0.07 0.07 0.07 0.07 0.07 0.07 0.06 0.05 0.07 0.07 0.06 0.06 0.07 0.07 0.07
0.02 0.02 0.02 0.01
<0.01 0.11 0.15 0.06 0.03 0.03 0.13 0.26 0.14 0.07 0.07 0.16 0.08 0.06 0.07 0.08
aAnalysis for each depth is average of analysis conducted on two soil profiles in and three profiles for time zero.
each ecosystem
K. VAN CLEVE AND L. A. VIERECK/241
Time 0
5 Year
15 Year
20 Year
This content downloaded from 185.2.32.73 on Thu, 12 Jun 2014 20:21:55 PMAll use subject to JSTOR Terms and Conditions

TABLE 2 Multiple range tests for means of chemical properties by soil profile (Turkey's w test)
0
7.9 3.4 0.06 1.64
0.12
0.04
0.04
0.02
Ecosystem age (years) 5
7.5 5.3 0.09 6.80
0.41
0.08
0.07
0.08
15
7.3 8.2 0.09 6.69
0.52
20
7.2a 7.7 0.13 6.45
0.32
0.09
0.06
0.13
0.09
0.07
0.09
aValues connected by line significantly different at 5% level. IbCEC and nutrient elements meq 100 g-1.
lowest for the time zero soil (range: 2.5 to 3.9 meq 100 g-1, Table 1) and progressively higher with increasing ecosystem age (range: 3.9 to 8.5 meq 100 g-1, 5.3 to 14.6 meq 100 g-1 and 5.6 to 13.1 meq 100 g-1 at 5, 15, and 20 years (Table 2). Significant differences in CEC existed between replicate time zero soil profiles while variability between replicate profiles was insignificant at 5, 15, and 20 years.
Soil organic matter depth distribution and difference over time were similar to those for CEC (Table 1). A significant increase in or- ganic matter content occurred between time zero and 5, 15, and 20 years followed by a marked decrease (0.04%) between 15 and 20 years (Table 2). Significant variability in organic matter content existed between repli- cate time zero profiles but not between replicate profiles sampled in the other eco- systems.
Percentage total phosphorus was significant- ly lowest at time zero (range: 0.03% to 0.05%, Table 1) and for 5-, 15- and 20-year- old ecosystems ranged from 0.05% (15-year- old ecosystem subsoil) to 0.07%. No significant changes in soil phosphorus content occurred between 15 and 20 years (Table 2). Significant differences existed between replicate soil profiles at time zero and at 5 years. No marked increasing or decreasing trends with depth occurred.
Exchangeable nutrient concentrations were significantly lowest at time zero (Table 2). With the exception of K and Mg, little change occurred after 5 years. Potassium increased
while Mg decreased significantly between 15 and 20 years. Greatest variability (significant at 5% level) in exchangeable nutrients be- tween replicate profiles occurred at time zero. Significant variability between profiles occur- red for K at 5 and 15 years, Ca at 5 and 20 years, and Mn at 15 and 20 years.
DISTRIBUTION OF NUTRIENTS IN ALDER ECOSYSTEMS
The nutrient totals considered in this paper are composed only of the components mention- ed in Tables 3 and 4. For the ecosystem compartments examined, the greatest propor- tion of nutrient elements occurred on the exchange complex of all four ecosystems. More than 95% of the Ca and Mn and more than 60% of the K and Mg were found on the soil exchange complex (Table 4). More than 95% of the total P was found in the soil. A decreasing proportion of ecosystem K occurred on the soil exchange complex with increasing ecosystem age (100% at time zero to 60.9% at 20 years, Table 4). Only very slight de- creases in percentage of total P and of exchangeable Ca and Mn occurred with increasing age of ecosystems (Table 4). The lowest proportion of exchangeable Mg in soils occurred at 20 years. However, the proportion of exchangeable Mg in the 15-year-old eco- system soil was greater than that of the 5-year- old ecosystem soil (Table 4).
The exchange complex of the 5-, 15-, and 20-year-old ecosystem soils contained more available nutrients than time zero soils (Table
242/ARCTIC AND ALPINE RESEARCH
Property
pH CECl' KI> Ca
Mg Mn
%OM
This content downloaded from 185.2.32.73 on Thu, 12 Jun 2014 20:21:55 PMAll use subject to JSTOR Terms and Conditions

4). Of the elements detected, maximum nu- trient mass in time zero soils occurred for total P, while minimum nutrient mass occurred for Mn (Table 4). On the exchange complex of 5-, 15-, and 20-year-old ecosystem soils, Ca constituted the greatest mass and Mn consti- tuted the minimum mass. Ranking the element mass for the time zero ecosystem soils gives total P > Ca > K > Mg > Mn (Table 4). For 5-, 15-, and 20-year-old ecosystem soils the ranking generally is Ca > total P > Mg > K > Mn.
300-
250-
Mass of nutrient elements in ecosystem plant material was generally greater at 20 years than 5 or 15 years (Table 4, Figure 1). Of all the nutrients in the vegetation, Ca constituted the greatest mass (514.4 kg ha-1, 20-year-old ecosystem, Table 4), while Mn constituted the smallest mass (1.5 kg ha-1, 5-year-old eco- system, Table 4, Figure 2). Ranking of nutrient mass was generally Ca > K > Mg > P > Mn. Mass of ash varied from about 3,796 kg ha-1 at 5 years to 4,722 kg ha-1 at 15 years (Table 4, Figure 2).
20 Yr /0 Yr Co
.7
200-
5Yr
150 - Ca
100
50
P
50 -
100-
150-
K
l// I~ I
K
I P
0 L
Cl
I
i
I
a
Mg
I E Green Parts
Perennial Above Ground Ports
[]D Dead Branches and Boles
Litter
I Roots
FIGURE 1. Mass of selected nutrient elements in components of alder ecosystems.
K. VAN CLEVE AND L. A. VIERECK/243
350
4)
\I
Cr)
(J)
(;)
20
l- 4 i ml- II
[) i t-N v
This content downloaded from 185.2.32.73 on Thu, 12 Jun 2014 20:21:55 PMAll use subject to JSTOR Terms and Conditions

TABLE 3 Distribution of chemical elements for various species and components in alder ecosystemsa
P 5 yr 15 yr
A nus foliage Alnus branches A lnus boles A lnus $ cones Alnus 9 cones Alnis dead boles and branches Salix alaxensis foliage Salix alaxensis branches Salix alaxensis boles Salix brachycarpa foliage Salix brachycarpa branches Salix interior foliage Salix interior branches Salix novae-angliae foliage Salix novae-angliae branches Populus balsamifera foliage Populus balsamifera branches Betula papyrifera foliage Betula papyrifera branches Picea glauca foliage Picea glauca branches Equisetum variegatum Equisetum pratense Calamagrostis canadensis
2.03 1.25 0.80 2.62 2.17 3.24
0.07 0.08 1.78
0.01 0.36 0.01 0.37
0.51 0.15 0.19 0.06 0.08 0.06 0.06 2.28 1.45 0.05 0.05 0.07 0.06 0.01 0.03
20 yr
4.13 5.31
11.93 0.07 0.02 5.94 0.07 0.15 1.25
0.48 2.04 0.94
K 5 yr 15 yr
17.38 11.57 4.43 11.05 9.50 19.01
0.26 0.49
12.56 0.14 3.65 0.08 3.05
5.99 1.12 1.12 0.58 0.49 0.54 0.39 1.51 1.32 0.34 0.33 0.26 0.37 0.10 1.25
Ca 20 yr 5 yr 15 yr
23.82 23.46 37.06 0.19 0.10
30.50 0.57 0.96 7.82
14.50 60.96 0.96
21.89 16.40 7.43 31.22
16.23 74.24 0.30 0.45
46.04 0.17 10.23 0.14 9.36
18.37 1.31 1.77 0.90 0.11 0.72 0.80 2.24 2.64 0.65 0.76 0.78 0.36 0.13 0.77
20 yr
18.83 40.13
103.01 0.08 0.05
69.42 0.52 2.34
15.26
Sample
14.49 22.71 0.25
This content downloaded from 185.2.32.73 on Thu, 12 Jun 2014 20:21:55 PMAll use subject to JSTOR Terms and Conditions

TABLE 3 (cont.)
Sample Mg 5 yr 15 yr 20 yr
Alnus foliage Alnus branches Alnus boles Alnus $ cones Alnus 9 cones Alnus dead boles and branches Salix alaxensis foliage Salix alaxensis branches Salix alaxensis boles Salix brachycarpa foliage Salix brachycarpa branches Salix interior foliage Salix interior branches Salix novae-angliae foliage Salix novae-angliae branches Populus balsamifera foliage Populus balsamifera branches Betula papyri/era foliage Betula papyrifera branches Picea glauca foliage Picea glauca branches Equisetum variegatum Equisetum pratense Calamagrostis canadensis
2.00 2.49 0.64 1.86 1.41 3.84
9.06 0.07 8.79
0.05 1.22 0.01 0.39
0.80 0.23 0.25 0.26 0.10 0.19 0.06 0.51 0.24 0.23 0.06 0.38 0.09 0.01 0.08
3.47 3.02 6.28 0.03 0.01 5.94 0.10 0.11 1.01
2.15 6.73 0.02
aData given in kg ha-1 oven dry basis. bNot determined.
Mn 5 yr 15 yr 20 yr Syr iSyr 20yr Syr iSyr 2Oyr 0.05 0.08 0.03 0.15 0.04 0.16
0.00 0.00 0.07
0.00 0.03 0.00 0.02
0.30 0.00 0.01 0.00 0.00 0.00 0.00 0.00 0.00 0.00 0.00 0.01 0.00 0.00 0.00
0.08 0.09 0.13 0.00 0.00 0.07 0.00 0.00 0.00
0.01 0.02 0.00
Ash content 5 yr 15 yr 20 yr
99.04 66.35 24.00 98.84 65.14 208.35
1.24 6.85
453.85 1.16 23.65 0.71 34.81
36.73 6.25
11.49 4.30 4.69 2.87 3.92
10.67 12.18 2.46 2.34
13.40 4.58 1.92 9.51
113.21 157.60 307.78
0.70 0.34
2.73 7.14
46.08
92.13 256.03 b
This content downloaded from 185.2.32.73 on Thu, 12 Jun 2014 20:21:55 PMAll use subject to JSTOR Terms and Conditions

TABLE 4
Summary of chemical elements in alder ecosystemsa
Sample P K Ca 0 yr 5 yr 15 yr 20 yr 0 yr 5 yr 15 yr 20 yr 0 yr 5 yr 15 yr 20 yr
Alnus spp. 5.1 7.2 21.5 31.3 42.4 84.6 45.6 122.6 162.1 % of Total 0.1 0.2 0.4 8.6 10.7 12.3 0.4 1.2 1.5 Salix spp. 0.6 1.2 1.5 4.5 12.7 9.4 5.9 38.0 18.1 % of Total 0.0 0.0 0.0 1.2 3.2 1.4 0.0 0.4 0.2 Other 4.0 --4.1 7.4 % of Total 0.1 0.0 0.0 1.1 - -0.1 - Total for Trees 9.7 8.4 23.0 39.9 55.1 94.0 58.9 160.6 180.2 % (above ground parts) 0.2 0.2 0.4 10.9 13.9 13.7 0.5 1.5 1.7 Roots 3.7 6.4 22.8 13.5 33.2 72.2 88.3 188.6 181.0 % of Total 0.1 0.1 0.4 3.7 8.4 10.5 0.8 1.8 1.7 Equisetum spp. 0.0 0.5 2.0 1.4 14.5 61.0 0.9 14.5 22.7 % of Total 0.0 0.0 0.0 0.4 3.7 8.9 0.0 0.2 1.7 Dead boles + branches - 1.8 5.9 12.6 30.5 46.0 69.4 % of Total 0.0 0.0 0.1 3.2 4.4 0.4 0.7 Litter 4.7 2.9 4.8 8.3 8.1 11.8 69.3 68.2 61.1 % of Total 0.1 0.1 0.1 2.3 2.0 1.6 0.6 0.6 0.6 Total Plant Material 18.1 20.0 58.5 63.1 123.8 269.5 217.4 477.9 514.4 % of Total 0.4 0.4 1.1 17.3 31.2 39.1 1.9 4.5 4.9 Soil Nutrients 3702.5 5585.8 4952.6 5243.6 218.4 301.5 273.0 418.9 3215.1 11,077.4 10,123.1 10,014.0 % of Total 100.0 99.6 99.6 98.9 100.0 82.7 68.8 60.9 100.0 98.1 95.5 95.1 Total for Ecosystem 3702.5 5603.9 4972.6 5302.1 218.4 364.6 396.8 688.4 3215.1 11,294.8 10,601.0 10,528.4 % 100.0 100.0 100.0 100.0 100.0 100.0 100.0 100.0 100.0 100.0 100.0 100.0
This content downloaded from 185.2.32.73 on Thu, 12 Jun 2014 20:21:55 PMAll use subject to JSTOR Terms and Conditions

TABLE 4 (cont.)
Mg Mn Ash Content 0 yr 5 yr 15 yr 20yr r 5 yr 5 yr 2yr r yr r yr r 15 yr 20 yr
Alnus spp. % of Total Salix spp. % of Total Other % of Total Total for Trees % (above ground parts) Roots % of Total Equisetum spp. % of Total Dead boles + branches % of Total Litter % of Total Total Plant Material % of Total Soil Nutrients % of Total Total for Ecosystem
4.1 8.3 12.8 0.1 0.4 0.3 0.9 1.4 4.0 0.1 0.2 0.2 1.2 2.4 1.2 0.0 0.4 0.0 0.2 0.4 0.4 0.0 0.2 0.0 1.5 -0.0 -
0.3 - - 0.0 6.8 10.7 14.0 0.1 0.8 0.3 1.4 1.9 4.4 0.1 0.4 0.2
28.4 28.3 30.9 0.5 1.6 1.3 5.9 4.9 9.8 0.3 0.8 0.7 0.1 2.2 6.7 0.0 0.0 0.0 0.0 0.4 2.1 0.0 0.0 0.0
8.8 5.9 - 0.1 0.1 1.5 1.9 0.0 0.0
53.9 10.6 15.4 0.9 0.6 1.5 11.3 1.8 4.9 0.5 0.3 0.8 89.2 60.6 72.9 1.5 3.1 3.2 18.6 10.5 23.1 0.9 1.5 1.7
137.7 389.5 516.6 243.1 107.9 173.1 201.5 183.5 100.0 81.4 89.5 76.9 100.0 99.1 98.5 98.3 137.7 478.7 577.2 316.0 107.9 174.6 204.6 186.7 100.0 100.0 100.0 100.0 100.0 100.0 100.0 100.0
188.2 381.6 579.6 5.0 8.1 12.9
35.4 95.2 56.0 0.9 2.0 1.2
45.6 -
1.2- 269.2 476.8 635.6
7.1 10.1 14.1 1,277.7 2,450.3 1,456.6
33.6 51.9 32.4 9.5 92.1 256.0 0.3 2.0 5.7
453.9 270.4 9.6 6.0
2,239.4 1,248.5 1,876.3 59.0 26.4 41.8
3,795.8 4,721.6 4,494.9 100.0 100.0 100.0
aData given in kg ha-' oven dry basis.
Sample
This content downloaded from 185.2.32.73 on Thu, 12 Jun 2014 20:21:55 PMAll use subject to JSTOR Terms and Conditions
5Kr /5Yr 20Y'r
z c -_
Mn
ml
Mn
Mn
I-
I Green Parts F'3 Perennial Above El Ground Parts
mI Dead Bronches I
* Litter
[ Roots
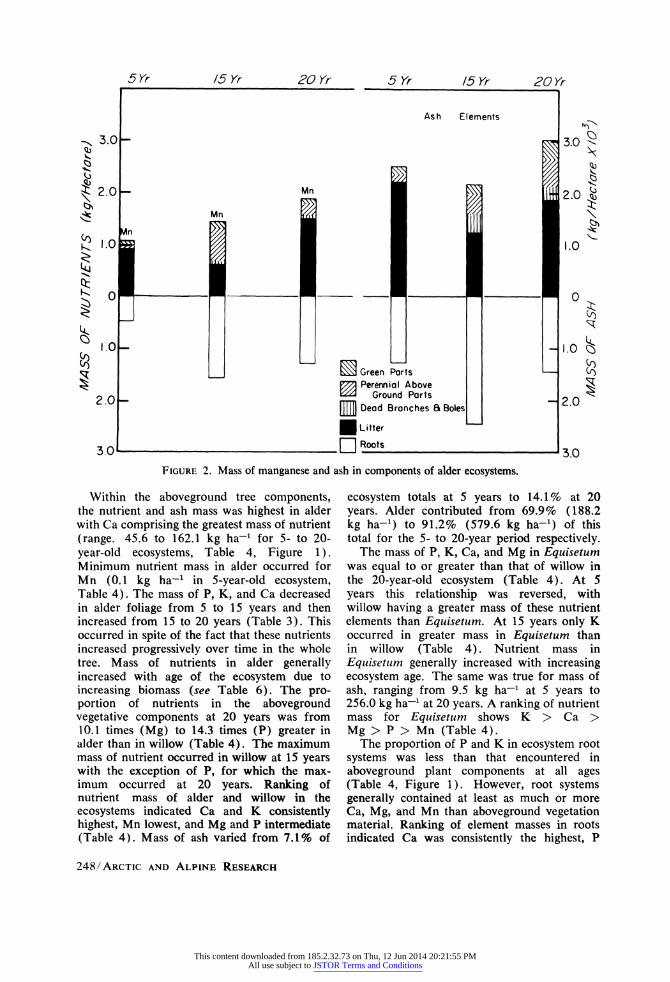
FIGURE 2. Mass of manganese and ash in components of alder ecosystems.
Within the aboveground tree components, the nutrient and ash mass was highest in alder with Ca comprising the greatest mass of nutrient (range. 45.6 to 162.1 kg ha-1 for 5- to 20- year-old ecosystems, Table 4, Figure 1). Minimum nutrient mass in alder occurred for Mn (0.1 kg ha-1 in 5-year-old ecosystem, Table 4). The mass of P, K, and Ca decreased in alder foliage from 5 to 15 years and then increased from 15 to 20 years (Table 3). This occurred in spite of the fact that these nutrients increased progressively over time in the whole tree. Mass of nutrients in alder generally increased with age of the ecosystem due to increasing biomass (see Table 6). The pro- portion of nutrients in the aboveground vegetative components at 20 years was from 10.1 times (Mg) to 14.3 times (P) greater in alder than in willow (Table 4). The maximum mass of nutrient occurred in willow at 15 years with the exception of P, for which the max- imum occurred at 20 years. Ranking of nutrient mass of alder and willow in the ecosystems indicated Ca and K consistently highest, Mn lowest, and Mg and P intermediate (Table 4). Mass of ash varied from 7.1% of
ecosystem totals at 5 years to 14.1% at 20 years. Alder contributed from 69.9% (188.2 kg ha-1) to 91.2% (579.6 kg ha-1) of this total for the 5- to 20-year period respectively.
The mass of P, K, Ca, and Mg in Equisetum was equal to or greater than that of willow in the 20-year-old ecosystem (Table 4). At 5 years this relationship was reversed, with willow having a greater mass of these nutrient elements than Equisetum. At 15 years only K occurred in greater mass in Equisetum than in willow (Table 4). Nutrient mass in Equisetum generally increased with increasing ecosystem age. The same was true for mass of ash, ranging from 9.5 kg ha-1 at 5 years to 256.0 kg ha-' at 20 years. A ranking of nutrient mass for Equisetum shows K > Ca > Mg > P > Mn (Table 4).
The proportion of P and K in ecosystem root systems was less than that encountered in aboveground plant components at all ages (Table 4, Figure 1). However, root systems generally contained at least as much or more Ca, Mg, and Mn than aboveground vegetation material. Ranking of element masses in roots indicated Ca was consistently the highest, P
248/ARCTIC AND ALPINE RESEARCH
Q 2.0 OV
q)
k% 1.0
2.O
1.0
2.0
3IO 2.0
(.)
1%,
rz
-k
(f) Q-)
I 1 NO
5 Yr /5 Yr 20 Yr
I -
-
This content downloaded from 185.2.32.73 on Thu, 12 Jun 2014 20:21:55 PMAll use subject to JSTOR Terms and Conditions

and Mn the lowest, with K and Mg intermediate between Ca and P (Table 4). Increasing mass of P, K, and Mg occurred with increasing ecosystem age. However, greatest mass of Ca, Mn, and ash occurred at 15 years (Table 4).
The ranking of nutrient mass in the dead bole and branch categories was generally Ca > K > Mg - P > Mn. Elemental mass at 20 years was greater than at 15 years, except
for Mg and ash, for which the reverse occurred. The mass of nutrients and ash in the litter
at 5 years was equal to or greater than that encountered at 15 and 20 years (Table 4) except that K at 20 years was greater than at 5 years. Ranking of element masses was gener- ally Ca > Mg > K > P > Mn (Table 4, Figures 1 and 2).
DISCUSSION
NUTRIENT CONTENT OF
ALDER ECOSYSTEM SOILS
Discussion of changes in soil chemical prop- erties in the alder ecosystems is complicated by the fact that all soils were highly stratified. Futhermore, all sites experienced infrequent flooding, which undoubtedly resulted in some addition of nutrient elements to these ecosys- tems. Assessment of these additions would be difficult since they would consist of elements in soluble and exchangeable forms plus that which might be added by subsequent mineral weathering. Also, leaching of elements out of deposited alluvium and into the previously
Io
16
14
I 12
10
8
r 6
4
2
U 0
_ i
_ i
_ : ** 11111
*
*
*
I..d. I" I I I I I I I I I
"~~~~~~~~~~~~~~~~~ I *
2 4 6 8 10
BASAL DIAMETER (cm)
FIGURE 3. Scattergram showing relationship mass of alder trees and tree basal diameter.
established soil profile has undoubtedly occurred. Hence any attempt to adjust for additions of nutrients to 5-, 15-, and 20-year- old ecosystem soils through measurement of their concentrations in newly deposited alluvium (time zero soils) would be meaning- less. Therefore, the values for soil nutrient element concentrations reflect the influence of the physical and chemical composition of the original deposit, subsequent depositions by infrequent flooding, physical and chemical weathering of the soil, and the impact of revegetation. Changes in soil nutrient concen- tration as a function of age of the alder ecosystems are undoubtedly masked to some extent by soil variability discussed earlier. However, the variability is not enough to mask significant changes in soil chemical properties between the earliest stage and the later stages of plant succession.
It is felt that the marked differences in soil chemical properties noted for 5-, 15-, and 20-year-old ecosystems, compared with the time zero ecosystem, primarily reflect the influence of the vegetative component and variation in soil texture. Evidence exists in the literature concerning the ability of plant roots to utilize selected primary soil minerals as sources of nutrient elements (Barshad, 1964; Drake, 1964; Voigt, 1965). These authors emphasize the ability of plant roots to utilize K combined in nonexchangeable forms in micaceous min- erals and to solubilize relatively insoluble soil and rock phosphates. Barshad (1964) and Kononova (1966) further emphasize the role of soil organic matter in development of profiles of soil properties and in weathering of primary soil minerals. Crocker and Major (1955), working at Glacier Bay, Alaska, and Crocker and Dickson (1957), working on the Herbert and Mendenhall glaciers near Juneau, Alaska, noted decreasing soil pH in glacial moraine sequences with onset of vegetation.
K. VAN CLEVE AND L. A. VIERECK/249
I
I .. I R s s X X E # [ A
This content downloaded from 185.2.32.73 on Thu, 12 Jun 2014 20:21:55 PMAll use subject to JSTOR Terms and Conditions

A trend of generally increasing exchangeable hydrogen (decreasing pH) and cation exchange capacity with time for approximately 1-m soil profiles was determined by Dickson and Crocker (1954) for the Mt. Shasta soil chronosequence. The exchange capacity-time curves especially reflected some of the major changes in vegetation, in particular the de- velopment of an organic matter profile. The authors state that decrease in exchangeable base saturation was probably related to the acid nature of decomposing surface litter. Although the time sequence involved in the present study encompasses only 20 years, a definite decrease in soil pH is evident after 5 years of site occupancy by alder (Tables 1 and 2). The significant pH decrease noted between 5 and 20 years is attributed to the deposition of leaf litter on the soil surface, to additions of organic matter to the subsoil from tree and shrub root systems, and to associated organic matter decomposition processes and leaching.
Increase in cation exchange capacity with onset of revegetation showed a closer relation- ship to increase in percentage organic matter (r = 0.91) than increase in sand, silt, clay, or silt plus clay percentages (r = 0.43, 0.41, 0.53, and 0.43 respectively, Table 5). An indication of the variability in river bottom soils is evident in the time zero ecosystems. Of the three time zero river bars sampled, two had less than 4% silt and clay throughout the profiles while the other had 32 to 65% silt and clay in the profile. The latter soil had CEC values and organic matter contents similar to those in the lower depths of 5-, 15-, and 20- year-old ecosystem profiles (range in CEC: 5.3 to 6.1 meq 100 g-1, range in percentage
TABLE 5
Correlation coefficients of the relationship between cation exchange capacity (CEC)
and selected soil properties
Regression equation r Sy xb
CECa - 40.17(% O.M.) + 2.85 CEC = 0.05(% Sa) + 8.86 CEC = 0.05(% Si) + 3.93 CEC = 0.90(% Cl) + 2.17 CEC = 0.05(% Si + % Cl) + 3.69
0.91 0.43 0.41 0.53 0.43
"O.M. = organic matter; Sa = sand; Si = silt; C1 - Clay.
bStandard error of estimate.
organic mater: 0.04% to 0.06%). Differences between coarse and fine textured profiles were significant at the 5% level. No significant difference existed between the sand and silt plus clay content of replicate profiles at 5, 15, and 20 years.
The distribution of total P in ecosystem soils was generally related to organic matter distri- bution. The lower percentage in time zero soils is associated with lower percentage organic matter. Increased total P contents in 5-, 15-, and 20-year-old ecosystem soils generally reflect higher soil organic matter content.
Exchangeable nutrient distribution in eco- system soils was associated with both texture and the influence of vegetation in increasing soil organic matter content. Two of the three time zero soils tended to have coarser texture and lower organic matter contents than the third, showing the variability that exists in alluvial deposits at the time of initial plant colonization. The trend for all older ecosystem soils (5-, 15-, and 20-year-old ecosystems) was generally finer texture and higher organic matter content. The finer texture and higher organic matter content were associated with higher exchangeable nutrient contents as noted for 5-, 15-, and 20-year-old ecosystem soils compared with time zero soils (Tables 1 and 2).
MASS OF NUTRIENTS IN ALDER ECOSYSTEMS
While the increase in mass of all exchange- able soil nutrients examined in the 5-, 15- and 20-year-old ecosystems over that encount- ered at time zero is felt primarily to reflect the influence of vegetation, increases in nutrient mass in the vegetative component of each ecosystem primarily reflect increase in
plant biomass. Biomass increased from 20,388 kg ha-l at 5 years to 94,789 kg ha-1 at 20
years (Table 6). The dominant position of alder in these ecosystems with increasing age (to 20 years) is reflected in both the increase in biomass (8,751 kg ha-1 at 5 years to 42,741 kg ha-' at 20 years, Table 6) of the living aboveground vegetative component and increase in content of all nutrients measured in this component. Willow (live, aboveground portion) contributed no more than 8.7% to ecosystem biomass in the age sequence studied (Table 6).
Total aboveground plant biomass, varying from 10,098 kg ha-1 at 5 years to 47,904 kg ha-1 at 20 years was intermediate in magnitude
250/ARCTIC AND ALPINE RESEARCH
This content downloaded from 185.2.32.73 on Thu, 12 Jun 2014 20:21:55 PMAll use subject to JSTOR Terms and Conditions

TABLE 6 Distribution of biomass for
alder ecosystms of different agesa
Sample
A lnus spp. % of Total
Salix spp. % of Total
Other % of Total
Total for trees % (aboveground parts)
Roots % of Total
Equisetum spp. % of Total
Dead boles and branches % of Total
Litter %
Total Plant Material %
5 yr 15 yr 20 yr
8,750.7 42.9
663.3 3.2
684.3 3.4
10,098.3
49.5 5,901.6
29.0 48.3
0.2
4,340.0 21.3
20,388.0 100.0
27,801.4 43.5
5,584.1 8.7
33,385.5
52.2 15,210.0
23.8 673.0
1.1 10,464.1
16.4 4,134.0
6.4 63,866.6
100.0
42,740.6 45.1
5,127.4 5.4
36.0 0.04
47,904.0
50.5 24,730.0
26.1 1,276.0
1.4 16,489.0
17.4 4,390.0
4.6 94,789.0
100.0
akg ha-1 oven dry basis.
when compared with the range in biomass encompassed by 6- to 24-year-old Betula verrucosa stands in England (1,900 and 122,900 kg ha-' respectively; Ovington and
Madgwick, 1959a). Stand density in the latter case was 10,450 stems ha-1 at 6 years and 4,990 stems ha-l at 24 years. In the present study, stand density was 104,458 stems ha-' at 5 years and 7,241 stems ha-' at 20 years (Table 7).
While it is difficult to conclude whether absolute increases or decreases in mass of nutrient elements examined in this study oc- curred on the soil exchange complex as a function of time, the proportion of elements in plant material and on the soil exchange complex did change. For potassium, the decreasing portion of element on the soil exchange complex with increasing ecosystem age to 20 years most likely reflects the redistribution of part of the ecosystem nutrient capital to the vegetative component. Similar fluctuations in nutrient distribution are noted for P, Ca, Mg, and Mn, but are not of as great a magnitude or as consistent (as in case of Mg).
Within the ecosystem plant components, change in distribution of nutrient elements as a function of time reflects change in biomass distribution. The increasing mass with age of most nutrients in root systems reflects an increase in root system biomass from 5,902 kg ha-1 at 5 years to 24,730 kg ha-1 at 20 years (Tables 4 and 6). Similar relationships occurred, in general, for the nutrient content of aboveground components of alder and willow (Table 4) although the mass of willow decreased from 5,584 kg ha-' at 15 years to 5,127 kg ha-1 at 20 years (Table 6).
The percentage distribution of biomass and nutrient elements within the ecosystems did not always reflect the absolute amounts of these components present. In the case of litter, the biomass of this component was relatively constant from 5 to 20 years, being approxi- mately 100 kg ha-1 less at 15 years than at other ages. However, the percentage distribu- tion of litter biomass decreased from 21.3% to
TABLE 7
Vegetation parameters for alder ecosystems of different ages
Age of Ecosystem 5 yr 15 yr
Alder stems hectare-l Ave. dia. alder stems (cm) Willow stems hectare-' Ave. dia. willow stems (cm) Total alder and willow
stems hectare-l Basal area (m2 ha-l)
0 49,699 2.0
0 54,768 <1
0 104,458 0 15.4a
4,563 6.6
1,091 9.0
5,654 19.6b
7,142 7.1 99 7.4
7,241 28.9b
aAlders only. bAlders and willows.
K. VAN CLEVE AND L. A. VIERECK/251
Parameter 0 20 yr
This content downloaded from 185.2.32.73 on Thu, 12 Jun 2014 20:21:55 PMAll use subject to JSTOR Terms and Conditions

4.6% from 5 to 20 years, respectively. The portion of Mg in litter generally followed the trend in proportionate distribution of biomass showing reduced percentage contribution to ecosystem totals with increasing system age. In the case of Ca, litter contributed such a small portion to total ecosystem Ca that the decrease of 8.2 kg ha-l in this nutrient between 5 to 20 years was not reflected in the percentage distribution. These trends reflect the increasing portion of mass and nutrients encountered in tree boles, branches, foliage, and root systems with increasing ecosystem age.
The predominance of P and K in living, aboveground ecosystem components and Ca, Mg, and Mn in root systems may reflect the influence of dead root material in these comparisons since no effort was made to separate living roots from dead roots. Ovington and Madgwick (1959b) measured greater mass of P, K, Ca, and Mg in the living, above- ground tree components in a 24-year-old Betiila verrucosa forest. Greater mass of P and Mg occurred in roots than tops, while the opposite situation occurred for Ca and K in a 22-year-old oak forest in Voronezh Province, USSR (Rodin and Bazilevich, 1965). Ovington and Madgwick (1959b) encountered the greatest mass of P, K, Ca, and Mg in the living, aboveground tree components in a 33-year-old Pinls sylvestris plantation in southern Scotland.
An additional factor that should be con- sidered in these comparisons is the relative dis- tribution of biomass between tops and roots. Root systems contributed approximately 10 and 20% to tree biomass in the oak and Scots pine forests, respectively. In the present study the contribution of root systems to tree and shrub biomass was 37%, 31%, and 34% at 5, 15, and 20 years, respectively.
The percentage nutrient composition of the organic matter is another factor to consider in interpretation of nutrient distribution in eco- system studies. Increasing mass of nutrients with ecosystem age, or redistribution of nutrients between ecosystem compartments, may be a reflection of marked changes in the percentage nutrient content of a given con- stituent as well as a change in its biomass. For the age classes studied, a comparison of the average composition of root tissue with alder and willow branch and bole tissue for Ca, Mg, and Mn showed that root tissue contains higher percentage concentrations of these elements than branch and bole tissue. The average percentage compositions for root
tissue were Ca, 1.11%; Mg, 0.30%; and Mn, 0.008%. The average percent compositions for the branch and bole tissues were Ca, 0.65%; Mg, 0.05%; and Mn, 0.004%. Although branch and bole material contributed a greater portion to ecosystem biomass (45% to 64% in 5- to 20-year-old ecosystems) than root material, the higher percentage elemental compositions for root material resulted in greater mass of Ca, Mg and Mn in the root component. Alder contributed 83% to 89% of the ecosystem biomass for branches and boles, the remainder being comprised principally of willow.
Nutrient mass of the entire aboveground vegetative component (living and dead) was greater in all cases than root system nutrient masses. The percentage contributions to total ecosystem nutrient mass for the two compo- nents varied from nearly equal (Mg and Mn at 15 years) to approximately a four-fold greater percentage of K in the aboveground vegetative component than in root systems (Table 4). Considerable effort was expended to wash root systems with tap and distilled water prior to drying and analysis but the relatively large ash content of litter (maximum of 2,239 kg ha-' at 5 years, Table 4) and roots (maximum of 2,450 kg ha-' at 15 years, Table 4) may be an indication of soil particle con- tamination.
A comparison of the nutrient contents of the aboveground portion of the 20-year-old Tanana River alder ecosystem with the same portion of Ovington's 22-year-old West Toft's Alnus incana ecosystem (1962) shows greater nu- trient content for P, Ca, and Mg in the West Toft's ecosystem (P: 65 kg ha-' vs 36 kg ha-I; Ca: 702 kg ha-1 vs 333 kg ha-1; Mg: 46 kg ha-1 vs 42 kg ha-', respectively). One contri- buting factor to this difference is the greater biomass in the West Toft's ecosystem compared with the Tanana River ecosystem (118,600 kg ha-1 compared with 47,905 kg ha-1, respectively).
A similar comparison between the above- ground nutrient content of the 20-year-old Tanana River alder ecosystem and a 24-year- old Betula verrucosa ecosystem in central England (Ovington, 1962) shows greater nutrient content for P, K, Ca, and Mg in the Tanana River ecosystem (P: 36 kg ha-1 vs 20 kg ha-1; K: 197 kg ha-' vs 94 kg ha-1; Ca: 333 kg ha-1 vs 321 kg ha-1; Mg: 42 kg ha-1 vs 29 kg ha-1). Biomass of the Betula verrucosa ecosystem is about 1,311 kg
252/ARCTIC AND ALPINE RESEARCH
This content downloaded from 185.2.32.73 on Thu, 12 Jun 2014 20:21:55 PMAll use subject to JSTOR Terms and Conditions

ha-1 greater than the alder ecosystem. These differences may be attributed to greater percentage concentration of the respective nutrient elements in organic matter from the Tanana River ecosystems.
One difficulty encountered in these com- parisons is the lack of nutrient and biomass data for root systems in the West Toft's alder ecosystem and litter in the Betula verrucosa ecosystem. The addition of nutrients in these components to system totals would probably result in considerably greater nutrient mass in the organic component of these ecosystems than in the Tanana River ecosystem.
Because of lack of plot replication within each ecosystem, no attempt was made to develop regression equations relating ecosys- tem biomass or mass of nutrients within each ecosystem to system age. However, regression equations were developed relating basal diameter of the eight sample alder trees in each age class to biomass of component tree parts and total mass of nutrients per tree. The analysis for tree biomass and nutrient contents for the three ecosystems is summarized in Table 8 and Figures 3 and 4. This approach provides an assessment of variability of the data and may suggest alterations in field sampling techniques which would improve reliability of the predictions.
Significant regressions were obtained for
diameter-mass relationships in all cases (Table 8, Figure 3). Standard errors of the estimate and percentage standard error (% SE) were quite large, however, probably reflecting the small sample size within each age class. Errors were largest for the foliage and branch cate- gories. Using equations developed separately for each age class and the average diameter for the age class, mass of an average alder at 15 years was approximately 20 times greater than the mass of an average alder tree at 5 years. Mass of foliage, branches, and boles for the average alder tree at 15 years was approxi- mately 4-, 27-, and 22-fold greater, respective- ly, than mass of these components at 5 years. Another interesting feature of the regression analysis is that while the basal diameter of an average 20-year-old tree was 0.5 cm larger than the basal diameter of an average 15-year-old tree, total tree mass was approximately the same for both age classes, 4.7 kg per tree. This may have been due to differences in site quality between the two ecosystems and influence of such stand characteristics as stem density in relation to competition for moisture, light, and nutrients between individual trees. Total stem density and basal area were approximately 1.3- and 1.5-fold greater, respectively, at 20 years than 15 years (Table 7).
Significant regressions were obtained relating basal diameter of alder trees to total mass of
TABLE 8
Regression equations for mass of selected nutrients and biomass of component parts of alder trees in different aged ecosystems as a function of basal diameter
Regression equation r SE % SE xa y (cm)a (g)
log (mass foliage)b = 1.73 log D- 1.97 0.96**c 0.1621 45.70 5.23 0.19 log (mass branches) = 2.79 log D- 2.38 0.97** 0.2044 60.00 5.23 0.43 log (mass boles) = 2.57 log D - 1.65 0.99** 0.1200 31.80 5.23 1.59 log (mass tree) = 2.53 log D - 1.46 0.99** 0.1009 26.20 5.23 2.29 log Pd = 2.26 log De - 1.66 0.98** 0.1489 40.90 5.23 0.91 log K = 2.83 log D - 1.08 0.92** 0.3854 142.70 5.23 8.90 log Ca = 2.41 log D - 0.74 0.99** 0.1161 30.60 5.23 9.77 log Mg = 2.29 log D - 1.75 0.99** 0.0866 22.10 5.23 0.79 log Mn = 2.20 log D - 3.23 0.93** 0.2803 90.50 5.23 0.02 log ash = 2.29 log D - 0.09 0.99** 0.1240 33.10 5.23 36.30
aAverage based on 24 trees. blog10 mass of the components in kg. c** significant at 1% level. dlog1o mass of nutrient in g. eD = basal diameter in cm.
K. VAN CLEVE AND L. A. VIERECK/253
This content downloaded from 185.2.32.73 on Thu, 12 Jun 2014 20:21:55 PMAll use subject to JSTOR Terms and Conditions

320
280
0:
KL- 0k
(10
Kn Kn
240 -
200
160
120
80-
40
0 O I I I I I I i. I, I I I I I I I I I
0 2 4 6 8 10
BASAL DIAMETEFR (cm)
12
FIGURE 4. Scattergram showing relationship between ash mass of alder trees and tree basal diameter.
nutrients in the aboveground component of the trees (Table 8, Figure 4). Potassium in the pooled age class equation showed considerable error. Minimum error was obtained for Mg. While the mass of Mn (average tree) was consistently small in each ecosystem, errors for Mn were sometimes lower than errors for other elements present in larger concentrations. Larger errors in the nutrient equations may be
related to small concentrations of the nutrient in question in the trees but more likely to sample variability.
In general, correlations between basal diameter, biomass, and mass of nutrients in alder tree components and associated errors are of the same magnitude as those determined by Dice (1969) for second growth Douglas fir in western Washington. Increased sample replication within age classes and obtaining replicate plot samples would probably reduce errors. However, these approaches must be weighed against the problem of processing large numbers of samples.
As pointed out by Ovington and Madgwick (1959b), the gross nutrient content of tree stock does not represent the gross uptake of nutrients by the tree since some trees will have died and some of the nutrients taken up by the surviving trees will have been returned to the soil in various ways such as foliage leaching and leaf and branch fall. However, gross uptake of nutrients by vegetation can be estimated from total dry-matter production. Calculating the combined average of the mean annual uptakes of the respective nutrients for the three ecosystems in kg ha-1 year-1 shows 2.6 for P, 11.4 for K, 33.7 for Ca, 8.5 for Mg, and 0.2 for Mn.
Values obtained by Ovington and Madgwick (1959b) for the 6- to 55-year period in stand development of Betula verrucosa are 4.1, 28.0, 44.0, and 5.6 for P, K, Ca, and Mg, respective- ly. The rankings in terms of gross nutrient uptake for both ecosystems (alder and birch) show Ca > K > Mg> P.
SUMMARY
By an analysis of selected nutrients in newly formed sand bars and in alder stands of 5, 15, and 20 years, it was found that there were a number of significant changes in the distribu- tion of these elements within the ecosystem. In the soil there was a general decrease in pH in the older stands whereas cation exchange capacity and soil organic matter showed general increases. These changes showed a close relationship to increases in percentage of organic matter. Exchangeable nutrients were lowest in the time zero soils, showed a marked increase in the 5-year stage, but showed no consistent further increase in the older stands. Their distribution was related to both texture and soil organic matter content. Sixty to 90% of the ecosystem nutrient elements occurred on the exchange complex of the soil.
In the ecosystem vegetation the mass of nutrient elements was related to plant biomass and increased with ecosystem age. Ca showed the greatest mass, 514.4 kg ha-1 at 20 years. Ranking of the nutrient mass was generally Ca > K > Mg > P > Mn. Alder contributed from 69.9 to 91.2% of the mass of ash for the 5- and 20-year stands respectively. In the herbaceous layer the amount of nutrient mass was relatively constant with age, but the per- centage distribution of biomass decreased from 21.3% to 4.6% from 5 to 20 years. In the root system there was an increasing mass of P, K, and Mg with age whereas Ca, Mn, and ash had highest amounts in the 15-year stand and less at 20 years. Regression equations were developed to show the relationship between basal diameter, biomass of component tree
254/ARCTIC AND ALPINE RESEARCH
This content downloaded from 185.2.32.73 on Thu, 12 Jun 2014 20:21:55 PMAll use subject to JSTOR Terms and Conditions

parts, and total mass of nutrients per tree. The biomass of an average alder at 15 years was approximately 20 times greater than that of an average alder at 5 years. Gross uptake of nutrients in kg ha-' year-' by the vegetation calculated from total dry matter production
was 33.7 for Ca, 11.4 for K, 8.5 for Mg, 2.6 for P, and 0.2 for Mn. While periodic flooding complicates determination of exact amounts of nutrient change with time, the influence of vegetation with time on the nutrient balance of even-aged alder ecosystems has been shown.
ACKNOWLEDGMENTS
The authors wish to thank the following people for critically reviewing the manuscript: Dr. Jack Major, Botany Department, University of California, Davis; Dr. Paul J. Zinke, School
REFERENCES
Barshad, Isaac 1964 : Chemistry of Soil Development. In
Bear, Firman E. (ed.), Chemistry of the Soil. Amer. Chem. Soc. Monogr. 160. Reinhold, New York, 1-63.
Black, C. A. (ed.) 1965 : Methods of Soil Analysis. Agron-
omy Ser. 9. Amer. Soc. Agron., Madi- son, Wisc., Vol. 1 & 2, 562-567.
Crocker, R. L. and Dickson, B. A. 1957 : Soil development in recessional mo-
raines of the Herbert and Mendenhall glaciers, southeastern Alaska. J. Ecol., 45: 169-185.
Crocker, Robert L. and Major, Jack 1955 : Soil development in relation to vegeta-
tion and surface age at Glacier Bay, Alaska. J. Ecol., 43: 427-448.
Dice, Steven Farnham 1969 : The biomass and nutrient flux in a
second growth Douglas-fir ecosystem (A study in quantitative ecology). Ph.D. thesis, University of Washington, Seattle. 165 pp.
Dickson, B. A. and Crocker, R. L. 1954 : A chronosequence of soils and vegeta-
tion near Mt. Shasta, California, III. Some properties of the mineral soils. J. Soil Sci., 5: 173-185.
Drake, Mack 1964 :
of Forestry, University of California, Berkeley; Dr. G. K. Voigt, School of Forestry, Yale University, New Haven, Connecticut.
Ovington, J. D. and Madgwick, H. A. I. 1959a: The growth and composition of natural
stands of birch. 1. Dry matter produc- tion. Plant and Soil, X: 271-283.
1959b: The growth and composition of natural stands of birch. 2. The uptake of min- eral nutrients. Plant and Soil, X: 389- 400.
1959c: Distribution of organic matter and plant nutrients in a plantation of Scots pine. Forest Sci., 5: 344-355.
Ovington, J. D. 1962 : Quantitative ecology and the woodland
ecosystem concept. In Craig, J. B. (ed.), Advances in Ecological Re- search. Academic Press, New York, 103-192.
Rodin, L. E. and Bazilevich, N. I. 1965 : Production and Mineral Cycling in Ter-
restrial Vegetation. English translation, Fogg, G. E. (ed.), Oliver and Boyd, Edinburgh and London. 1967. 788 pp.
Van Cleve, Keith, Viereck, Leslie A., and Schlentner, Robert L.
1971 : Accumulation of nitrogen in alder (Al- nus) ecosystems near Fairbanks, Alas- ka. Arc. Alp. Res., 3: 101-114.
Voigt, G. K. 1965 :
Soil chemistry and plant nutrition. In Bear, Firman E. (ed.), Chemistry of the Soil. Amer. Chem. Soc. Monogr. 160. Reinhold, New York, 395-439.
Jackson, M. L. 1958 : Soil Chemical Analysis. Prentice-Hall,
Englewood Cliffs, N.J. 498 pp. Kononova, M. M.
1966 : Soil Organic Matter. Pergammon Press, Oxford. 544 pp.
Biological mobilization of potassium from primary minerals. In Youngburg, Chester T. (ed.), Forest soil relation- ships in North America. Oregon State University Press, Corvallis, 33-46.
Ms submitted January 1971 Revised Ms submitted October 1971
K. VAN CLEVE AND L. A. VIERECK/255
This content downloaded from 185.2.32.73 on Thu, 12 Jun 2014 20:21:55 PMAll use subject to JSTOR Terms and Conditions