Embed Size (px)
Citation preview

DIPLOMARBEIT
Titel der Diplomarbeit
“Joint Venture and State-owned Enterprise
In The Copper Industry”:
The case of Oyu-Tolgoi LLC (Mongolia) and Codelco (Chile)
Verfasser
Bayanmunh Janshin
angestrebter akademischer Grad
Magister der Sozial- und Wirtschaftswissenschaften (Mag. rer. soc. oec.)
Wien, 2012
Studienkennzahl lt. Studienblatt: A 157 Studienrichtung lt. Studienblatt: Diplomstudium Internationale Betriebswirtschaft Betreuer / Betreuerin: ao. Univ.-Prof. Mag. Dr. Josef Windsperger

ii

iii
Eidesstaatlicher Erklärung
Ich erkläre hiermit an Eides statt, dass ich die vorliegende Arbeit selbstständig und
ohne Benutzung anderer als der angegebenen Hilfsmittel angefertigt habe. Die aus
fremden Quellen direkt oder indirekt übernommenen Gedanken sind als solche
kenntlich gemacht.
Die Arbeit wurde bisher in gleicher oder ähnlicher Form keiner anderen
Prüfungsbehörde vorgelegt und auch noch nicht veröffentlicht.
Wien, am 10. September 2012
(Bayanmunh Janshin)

iv
Danksagung
Hiermit möchte ich mich herzlichst bei all den Menschen bedanken,
die mich durch meine Studienzeit begleitet und unterstützt haben.

v
Abstract
The copper industry has experienced significant changes in the last decade. Enormous
Chinese economic progress has made a substantial contribution to this development. The
concentration of the copper market shifted from developed countries to developing and less
developed countries. New players rose to the top of the copper market. Thus, it is time to
update the whole copper industry.
For the economies of copper exporting countries, such as Chile and Mongolia, the last decade
was a successful time. The most important copper company in each country - Codelco in
Chile and Oyu-Tolgoi LLC in Mongolia - is essential to the economy of the country it
represents. However, these companies are completely different. While Codelco is a fully
state-owned company, Oyu-Tolgoi LLC is a joint venture.
This paper compares the different structures and different management systems of these two
companies with regard to their competitiveness and profitability.
Keywords:
State-owned enterprise, Joint Venture, Copper industry, Codelco, Oyu-Tolgoi LLC,
vi
Table of Contents
Abstract ...................................................................................................................................... v
Table of Contents ...................................................................................................................... vi
List of Figures ......................................................................................................................... viii
List of Tables .......................................................................................................................... viii
Acronyms ................................................................................................................................... x
1 Introduction ..................................................................................................................... 1
2 Copper ............................................................................................................................. 3
2.1 World Copper Market ................................................................................................. 4
2.1.1. History .................................................................................................................. 4
2.1.2. Present .................................................................................................................. 6
2.1.2.1. Introduction .................................................................................................. 6
2.1.2.2. World Copper Production ............................................................................. 7
2.1.2.3. World Copper Demand and Consumption ................................................. 14
2.1.2.4. World Copper Trade ................................................................................... 16
2.1.2.5. Copper Price and Speculation on Copper Price17 ....................................... 18
2.1.3. Future ................................................................................................................. 20
2.1.3.1. Chance ........................................................................................................ 20
2.1.3.2. Risks ........................................................................................................... 21
2.2 Chile .......................................................................................................................... 22
2.2.1. Overview ............................................................................................................ 22
2.2.2. Copper in Chile .................................................................................................. 26
2.2.3. Codelco .............................................................................................................. 29
2.3 Mongolia ................................................................................................................... 31
2.3.1. Overview ............................................................................................................ 31
2.3.2. Challenges: ......................................................................................................... 33
2.3.3. Chances .............................................................................................................. 36
2.3.4. Copper in Mongolia ........................................................................................... 37

vii
2.3.5. Oyu-Tolgoi LLC ................................................................................................. 38
3 Joint Venture and State-owned Enterprise, The Case of Oyu-Tolgoi LLC and Codelco
40
3.1 Joint Venture and The Case of Oyu-Tolgoi LLC ...................................................... 40
3.1.1. (International) Joint Venture .............................................................................. 40
3.1.1.1. Introduction ................................................................................................. 40
3.1.1.2. Definition of Joint Ventures and International Joint Ventures ................... 42
3.1.1.3. Types of Joint Ventures .............................................................................. 42
3.1.1.4. Motives for Joint Ventures .......................................................................... 43
3.1.1.5. Risks ............................................................................................................ 45
3.1.1.6. Culture in International Joint Ventures ....................................................... 46
3.1.2. The Case of Oyu-Tolgoi LLC ............................................................................ 46
3.1.2.1. Formation of the Joint Venture ................................................................... 46
3.1.2.2. Management Structure ................................................................................ 47
3.1.2.3. Motives for Oyu-Tolgoi LLC ...................................................................... 48
3.1.2.4. Risks of Oyu-Tolgoi LLC ........................................................................... 48
3.1.2.5. Cultural differences of Oyu-Tolgoi LLC .................................................... 49
3.2 State-owned Enterprise and The Case of Codelco ..................................................... 50
3.2.1. State-owned Enterprise (SOE)............................................................................ 50
3.2.1.1. Introduction ................................................................................................. 50
3.2.1.2. Definition .................................................................................................... 51
3.2.1.3. Motives ........................................................................................................ 51
3.2.1.4. The Performances of State Owned Enterprises ........................................... 53
3.2.2. The Case of Codelco........................................................................................... 55
3.2.2.1. Introduction ................................................................................................. 55
3.2.2.2. Motives for building Codelco ..................................................................... 56
3.2.2.3. The Performance of Codelco....................................................................... 56
4 Conclusion ..................................................................................................................... 58
References: ............................................................................................................................... 62
viii
List of Figures
Figure 1: Copper price development in US $ ........................................................................... 6
Figure 2: Leading Exporters and Importers of Semi-Fabricated, Copper Products in thousand
metric tons, 2009 ...................................................................................................................... 17
Figure 3: Copper price development, LME $/t, From March 2006 to March 2012 ............... 18
Figure 4: Inflation Chile (historical) ....................................................................................... 23
Figure 5: Government Budget of Chile, (Percentage of the GDP) ......................................... 27
Figure 6: GDP-Mongolia, (In billions US$) ........................................................................... 32
Figure 7: Mongolia Government Budget, Percentage of the GDP ......................................... 33
Figure 8: Mongolia Inflation Rate .......................................................................................... 35
Figure 9: Major Copper-Gold Projects in Development ......................................................... 38
ix
List of Tables
Table 1: Copper Mine Production by Countries: Top 20 Lists in 000 metric tons ................... 8
Table 2: Top 20 Copper Mines by Capacity, 2010 .................................................................... 9
Table 3: Leading copper producers 2011 by company ............................................................ 10
Table 4: Top 20 refined copper production lists by country ................................................... 12
Table 5: Top 20 Copper Refineries by Capacity, 2010 ........................................................... 13
Table 6: Global refined copper consumption 2010, Top 20 Lists ........................................... 14
Table 7: World Trade of Copper Ores and Concentrates, Top 10 Lists, 2010 ........................ 16
Table 8: World Refined Copper Trade, Top 10 Lists .............................................................. 17
Table 9: Contribution of Copper Companies to The Chilean Public Treasury, (In mill. US$)
.................................................................................................................................................. 26
Table 10: Copper production of Chile by company, 2010 ...................................................... 28
Table 11: Codelco in numbers, (in Mill. US$) ........................................................................ 30
Table 12: Employment ............................................................................................................ 30
Table 13: Erdenet in Numbers, (In Mill. US$) ........................................................................ 37

x
Acronyms
CIPEC: Intergovernmental Council of Copper Exporting Countries
BRIC States: Brazil, Russia, India and China
CIEPLAN: La Corporacion de Investigaciones Economicas para Latinoamerica
COCHILCO: Comision Chilena del Cobre, Chilean Copper Commission
CODELCO: The National Copper Corporation of Chile
FDI: Foreign Direct Investment
MPRP: Mongolian People’s Revolutionary Party
JV: Joint Venture
IJV: International Joint Venture
OPEC: Organization of the Petroleum Exporting Countries
UNEP: United Nations Environmental Programme

1 Introduction 1
1 Introduction
It seems today that the world economy acts completely within a free market system.
Throughout the world, economists, scholars and politicians talk about the advantages of this
system. These people, furthermore, recommend the neo-liberal economic system, which is a
further development of a free market economy. Neo-liberalists support the intensification of
the role of private sectors and recommend the deregulation of national companies. However,
even within these economically neo-liberal-oriented countries, there are sectors, where the
privatization of national companies does not work. State-owned enterprises still play
important roles in the respective economies of these countries.
On the other hand, the globalized world economy of today forces countries and companies to
cooperate internationally. Here, one of the most used methods is the joint venture cooperation.
Many countries in the world practice this kind of cooperation. Especially in the commodity
market, it is a very commonly used method.
It is very interesting to compare such different companies. Here, the author chose the Chilean
state-owned copper giant Codelco and the Mongolian copper JV, Oyu-Tolgoi LLC. While
Codelco is a 100% state-owned company, Oyu-Tolgoi LLC is a cooperation between the
British-Australian commodity giant Rio-Tinto, the Canadian commodity company Ivanhoe
Mines Ltd and the Mongolian government. These two companies act in the globally
competitive copper market and the question is as follows:
How do these different companies’ structures and management systems influence the
company’s profitability and competitiveness?
Clearly, it is difficult to understand the results of these two companies without knowledge of
the copper market. Thus, the first chapter of this paper summarizes and updates the copper
market in general. It is a market, which mirrors the world economic development of the last
decade. The copper industry, especially, demonstrates the highly visible shift of world
economic power from North America and Europe to Southeast Asia and South America in the
last decade. Particularly, Southeast Asia and China enormously caught up with North
1 Introduction 2
American and European countries. The importance of China for the copper industry is today
remarkable.
Many countries have profited from the enormous Chinese economic development. Especially,
commodity-exporting countries, which are mainly less developed, profited greatly from
Chinese development. Mongolia is one of those countries.
Indeed, Mongolia and Chile are economically very similar. Both are oriented towards the
exportation of commodities and, according to their population, are relatively small in their
respective regions. Copper plays an important role in both countries’ economies. To
understand better the current economic situation of these countries, the author also
summarized these countries’ economies, histories and their copper industries in this paper.

2 Copper 3
2 Copper
People were already familiar with copper 10,000 years ago and used it for their
everyday life. However, the real beginning of mass production was in the industrialization
era, from the end of the19th to the beginning of 20th century, when the mining of copper had
risen by 10 times what it had been in the past.1
Everywhere within the earth’s crust there exists some portion of copper - in some place more
and in other places less. The difficulty of the extraction of copper is that it requires the mining
of a lot of earth to get only a little bit copper. On average, in a ton of earth’s crust, there is
55gram copper.2
Copper is a reddish-orange metal with the chemical element Cu. Thanks to its physical
and chemical characteristics, copper is today one of the most used metal. Pure copper is
malleable and has very high thermal and electrical conductivity. As well, copper does not lose
any quality by recycling, which makes it very environmentally beneficial.
Copper also has the quality of being antimicrobial, which means some copper alloys are
strongly resistant against bacteria. This characteristic is widely used, especially in hospitals, to
decrease the transportation of diseases between human.
Another very important property of copper is the so-called “Antibiofouling” (=Anti
biological fouling) characteristic, which means that bacteria does not grow on a copper
surface, making copper highly corrosive resistant and very useful for marine and agricultural
equipment.
Today, 60% of all copper production in the world is used for electrical wires, 20% for roofing
and plumbing, 15% for industrial machinery and 5% as a component for metal alloys.3
1“Kupfer-Werkstoff und Anwendung.” Österreichische Kupferinstitute. http://www.kupferinfo.at/ July.10.2012 2 ibid. 3 Ibid.
2 Copper 4
2.1 World Copper Market
2.1.1. History
In the copper market, as like in many other commodity markets, there has always been two
different sides with two different goals. On the one side, the less developed or developing
countries, as suppliers of copper, who want to receive foreign exchanges and, on the other
side, the developed countries as consumers, with the desire to secure their access to raw
materials.4 For countries like Chile, Peru, Zambia, Indonesia and Mongolia, copper is an
essential product. Throughout history, these countries have been strongly dependent on this
metal and the income generated by copper has played a prominent role in their respective
economies. As well, developed countries were also concerned with the copper stock of their
manufacturing companies and tried to gain control of the copper producing countries.
At the beginning of 20th century, the world demand for copper was around a half million tons.
Due to increased wealth in cities and the two world wars, the demand for this metal
skyrocketed. Additionally, Perkins invented the so-called chemical floatation method for the
commodity industry in 1921, which allowed for the mining of copper from areas, which, up
until that point, could not be explored.
However, in the 50’s and 60’s, the long running decline in the relative price of primary
commodities, with respect to the prices of manufactures, led to the promotion of aggressive
policies of industrialization in Latin America.5
On the one side, through improved mining technology, copper was more accessible, but on
the other side, the consumption was not equal to production, which caused falling prices and
led to the organization of the copper producing countries. In 1967, through an initialization of
Rio Tinto and after the model of the Organization of the Petroleum Exporting Countries
(OPEC), the main copper producing countries, Chile, Peru, Zambia and Democratic Republic
Congo, established the so-called Intergovernmental Council of Copper Exporting Countries
(CIPEC).
4 cf. Joaquin (1988), p.1 5 ibid.

2 Copper 5
This organization was designed to help these countries coordinate their export capacity in
order to improve their income from the copper business.
In the late 60’s, the stage of nationalization began in Chile and Zambia. The main companies
of these countries were nationalized in order to have better control and revenues from the
mines. However, the outcome was unsuccessful. The foreign direct investment (FDI) fell,
thus, also the foreign exchange rates, which caused the financial possibility of investing in the
mines to no longer be an option.
In 1974, CIPEC decreased the production of copper in order to fight against the falling copper
prices at that time. However, the results were small. The coordination of the members did not
work well and the market of copper was not dependent on this alliance. The high inventories,
the growth of the new mines and the political change in Chile led to a decrease in the activity
of the organization, which then completely dissolved in the 90’s.

2 Copper 6
2.1.2. Present
2.1.2.1. Introduction
The world copper market experienced turbulent times in the last decade. One factor
was the seemingly unstoppable economic growth from 2001 to 2008, which was intensified
through the enormous development of emerging markets like China and India. This expansion
increased the demand for copper in a way never before seen. However, the production of
copper, even in time of economic boom, is limited in comparison to the demand.
Copper is a metal, which is broadly used in many sectors and when an economic boom
occurs, the demand for copper remains high through all these sectors.
Therefore, the demand for copper grew enormously and pushed up the price of this metal to a
historic level.
Figure 1: Copper price development in US $
Source: Handelsblatt.
http://finanzen.handelsblatt.com/kurse_einzelkurs_uebersicht.htn?chart_zeit=100000&i=354331 August.6.2012
As the chart above shows, the price of copper jumped up from around $1,700 per ton in
August 2003 to almost $9,000 per ton in June 2006.
China is the biggest importer of copper and, in 2007, as the economy of China grew to
11,4 percent, the price of copper also reached just under the $9,000 (per ton) mark. However,
the Chinese economy slowed a bit over the following years and so also the price of copper.
In September 2009, the economic crisis began, starting with the filing of bankruptcy
by Lehmann Brothers. The crisis rapidly pushed the copper price down.
2 Copper 7
Nevertheless, as the Chinese economy began to grow after just two years, the decrease in the
price of copper reversed and again started to rise. In February 2011, the price reached the
historical high $10,000/t label.
With the beginning of the European debt crisis in 2011, the world economy slowed in general
and so also the Chinese economy. The price of copper came down to $8000/t level.
Copper price development is a commonly used forecasting method for the general economic
trends of the future.
The endless growing demands of emerging markets are not the only explanation for this price
jump. It is also that the copper market has become an area for speculators seeking out a new,
stable investment sector after the US housing market bubble burst.
2.1.2.2. World Copper Production
The increase of copper production worldwide has been relatively constant in the last
years to the amount of 16 millions tons in the year 2010.6 In general, as mentioned before, the
production amount of copper is “relatively” stable. Although there are sources of copper
almost everywhere on earth, the cost and energy to gain this metal remains enormously high.
Every country is attempting to receive the best possible production amounts in a time when
the price and demand are historically high.
The production of such metals could be increased significantly through the invention of new,
easy and cost-effective methods or through new mines. Today, even if there are several new
mining projects, the amount of copper production can not be increased in such amounts such
as the demand for copper during the world economy boom, which was experienced during the
last decade.
The two main kinds of mining are surface- and underground mining. Open-pit mining
is the most used method of surface mining in the copper and molybdenum industry.7 This
method is much cheaper than underground mining because open-pit mining does not require
high-cost dewatering, ventilation and transportation systems and, furthermore, it creates the
6
Cochilco. (2010) p. 136 7 “Types of Mining”. Detroit Salt Company. 7 http://www.detroitsalt.com/types-of-mining.html 11 Oct. 2012.
2 Copper 8
possibility to explore relative low-grade ores.8 The advantage of underground mining is to
explore more selective areas with high-grade concentrates.
Generally, copper will be obtained through so-called primary- and secondary
production. The first involves copper being extracted through the smelting and refining of
mineral ores and the second, which is today very common in industrialized countries, is
recycling.
With regard to primary-production, one has to differentiate between the end products. The
mine-, smelter- and refining productions differ throughout the copper producing countries.
When it comes to copper mine production, Chile is by far the biggest producer in the world
with one-third of the world’s production -. Between 2001 and 2010, Chile increased its
production around 679,900 kMT.
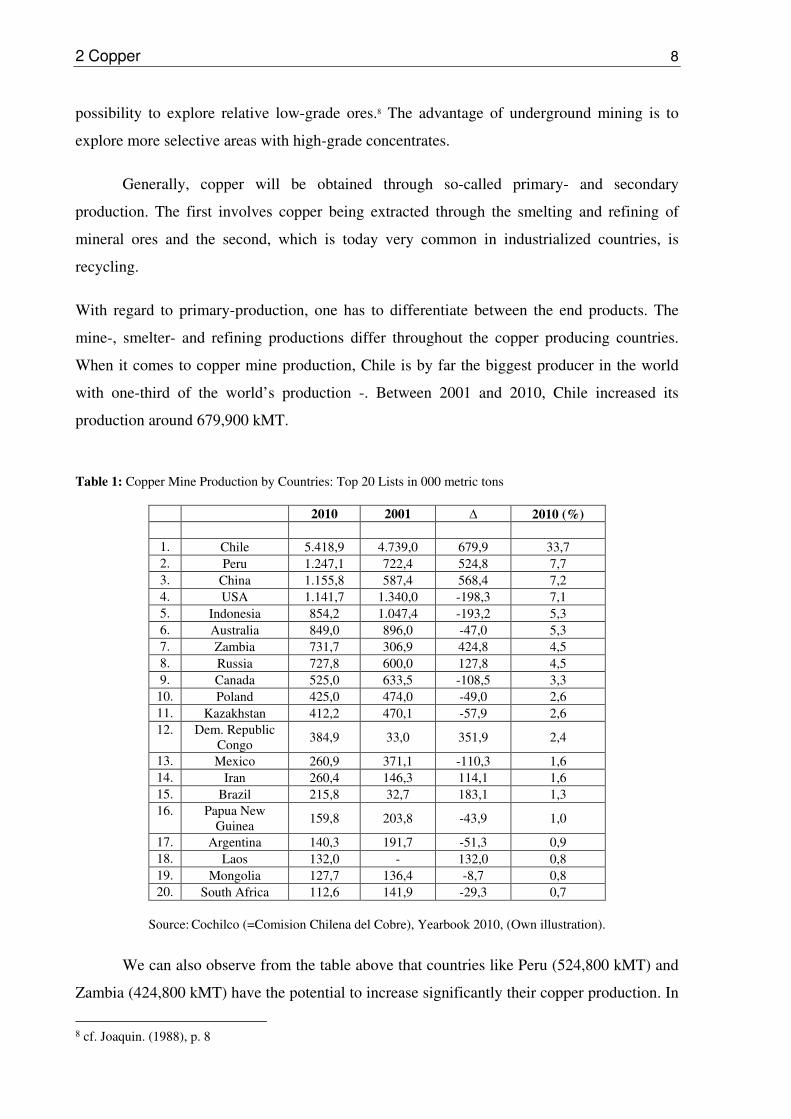
Table 1: Copper Mine Production by Countries: Top 20 Lists in 000 metric tons
2010 2001 ∆ 2010 (%)
1. Chile 5.418,9 4.739,0 679,9 33,7 2. Peru 1.247,1 722,4 524,8 7,7 3. China 1.155,8 587,4 568,4 7,2 4. USA 1.141,7 1.340,0 -198,3 7,1 5. Indonesia 854,2 1.047,4 -193,2 5,3 6. Australia 849,0 896,0 -47,0 5,3 7. Zambia 731,7 306,9 424,8 4,5 8. Russia 727,8 600,0 127,8 4,5 9. Canada 525,0 633,5 -108,5 3,3
10. Poland 425,0 474,0 -49,0 2,6 11. Kazakhstan 412,2 470,1 -57,9 2,6 12. Dem. Republic
Congo 384,9 33,0 351,9 2,4
13. Mexico 260,9 371,1 -110,3 1,6 14. Iran 260,4 146,3 114,1 1,6 15. Brazil 215,8 32,7 183,1 1,3 16. Papua New
Guinea 159,8 203,8 -43,9 1,0
17. Argentina 140,3 191,7 -51,3 0,9 18. Laos 132,0 - 132,0 0,8 19. Mongolia 127,7 136,4 -8,7 0,8 20. South Africa 112,6 141,9 -29,3 0,7
Source: Cochilco (=Comision Chilena del Cobre), Yearbook 2010, (Own illustration).
We can also observe from the table above that countries like Peru (524,800 kMT) and
Zambia (424,800 kMT) have the potential to increase significantly their copper production. In
8 cf. Joaquin. (1988), p. 8

2 Copper 9
the10 years represented by the graph, Peru jumped from being the 8th biggest producer to the
2nd biggest copper producer in the world. However, this is opposite from North American,
where copper mine production decreased in these years. In 2010, the USA produced 198,300
tons, Canada 108,500 tons and Mexico 110,300 tons less copper in comparison to 2001.
Interestingly, the so-called BRIC states (Brazil, Russia, India and China), which are
called the coming industry nations, could also increase their copper production. Russia, Brazil
and China could increase their productions with 127,800 tons, 183,100 tons and 568,400 tons
in these 10 years, respectively.
Even India, which does not have its own big copper mines, doubled their smelting- and
refined copper amount.
Despite economic and political problems, countries like Iran and the Democratic Republic
Congo also have the potential to increase copper production.
Logically, most of the biggest mines belong to the biggest producer in the world,
Chile. Escondida, located in Northern Chile, is the privately owned mine of the metal Giants
BHP/Billiton, Rio Tinto and Japan Escondida and is ruling this rank followed by Codelco
North of the state-owned Chilean copper giant Codelco, which will be illustrated more
precisely later.
Table 2: Top 20 Copper Mines by Capacity, 2010
Source: ”World Copper Factbook 2010”. International Copper Study Group

2 Copper 10
The 3rd biggest mine in the world is the Grasberg mine of P.T. Freeport Indonesia Co. and Rio
Tinto in West Papua, Indonesia. It should be mentioned that the local people have voiced
enormous criticism in terms of environmental issues caused by this specific mining operation.
Nevertheless, the company is the biggest taxpayer in Indonesia and enjoys a high confidence,
especially by the government.
The biggest copper producing company in the world is the Chilean copper giant Codelco,
followed by the US American Freeport McMoran and British Australian BHP/Billiton, which
in 2011, was the 4th biggest company in the world.9
Table 3: Leading copper producers 2011 by company
Company Copper Production
(000 Metric Tons)
1 Codelco 1,757
2 Freeport-McMoran 1,441
3 BHP Billiton 1,135
4 Xstrata 907
5 Rio Tinto 701
6 Anglo 645
7 Grupo Mexico 598
8 Glencore 512
9 SCC 407
10 KGHM 426
Source: National Mining Association, 2012 http://www.nma.org/pdf/m_copper.pdf
Generally, the multinational commodity giants the British-Australian companies,
BHP/Billiton and Rio Tinto, the Swiss companies, Glencore and Xstrata, and the US
company, Anglo American, are all represented on the top 10 list. With the exception of
Chilean Codelco and polish KGHM, the companies are all acting in different foreign
countries and so they are confronted with any possible local political and social problems.
Glencore, the Swiss commodity giant, which only came on the stock exchange as of May of
last year, is intending on absorbing Xstrata. If this acquisition occurs successfully, then there
is a new giant in the commodity market.
9 cf. Eckert and Zschäpitz. “Rohstoff-Firmen verdrängen Finanzkonzerne”. Welt-online. 7. Feb. 2011. 9
http://www.welt.de/wirtschaft/article12472099/Rohstoff-Firmen-verdraengen-Finanzkonzerne.html 26.Aug. 2012
2 Copper 11
Many less developed countries do not have the possibility and know-how to produce
refined copper from mineral ores. Especially for countries, which have a lesser amount of
yearly copper production, the exportation of their mineral ores directly to developed countries
or to China and India, where most of the smelter and refining companies are domiciled, is a
better expenditure of time and energy.
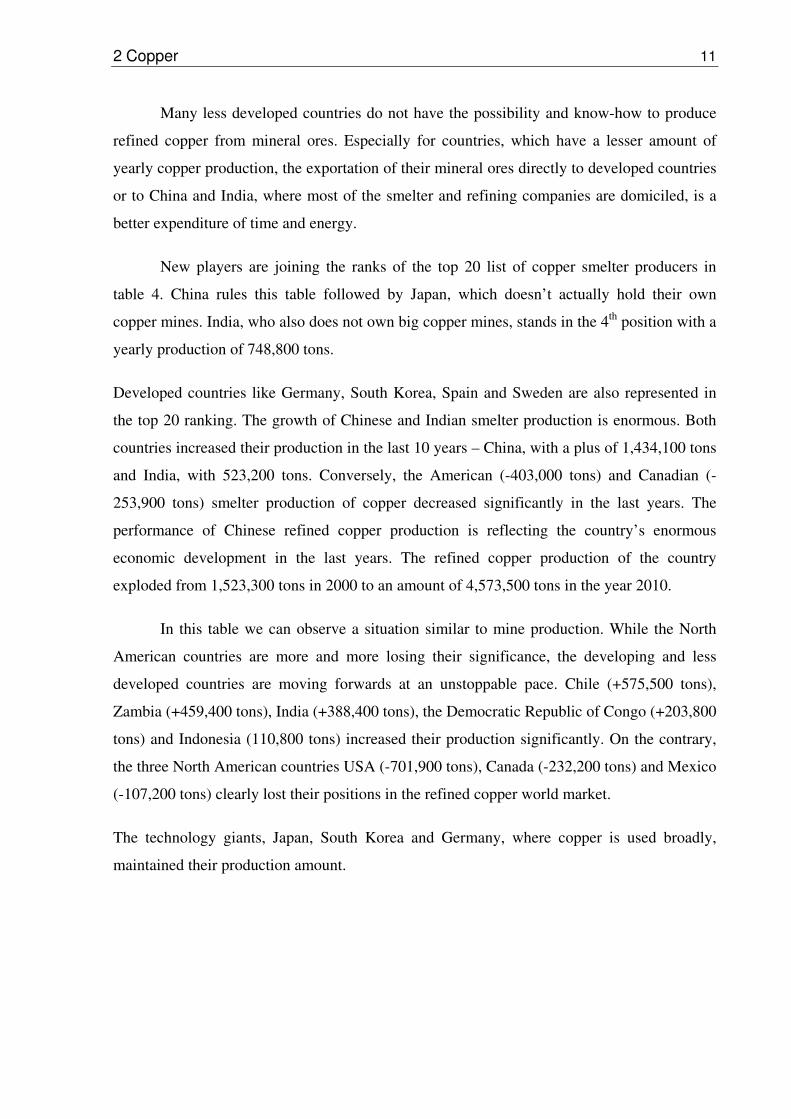
New players are joining the ranks of the top 20 list of copper smelter producers in
table 4. China rules this table followed by Japan, which doesn’t actually hold their own
copper mines. India, who also does not own big copper mines, stands in the 4th position with a
yearly production of 748,800 tons.
Developed countries like Germany, South Korea, Spain and Sweden are also represented in
the top 20 ranking. The growth of Chinese and Indian smelter production is enormous. Both
countries increased their production in the last 10 years – China, with a plus of 1,434,100 tons
and India, with 523,200 tons. Conversely, the American (-403,000 tons) and Canadian (-
253,900 tons) smelter production of copper decreased significantly in the last years. The
performance of Chinese refined copper production is reflecting the country’s enormous
economic development in the last years. The refined copper production of the country
exploded from 1,523,300 tons in 2000 to an amount of 4,573,500 tons in the year 2010.
In this table we can observe a situation similar to mine production. While the North
American countries are more and more losing their significance, the developing and less
developed countries are moving forwards at an unstoppable pace. Chile (+575,500 tons),
Zambia (+459,400 tons), India (+388,400 tons), the Democratic Republic of Congo (+203,800
tons) and Indonesia (110,800 tons) increased their production significantly. On the contrary,
the three North American countries USA (-701,900 tons), Canada (-232,200 tons) and Mexico
(-107,200 tons) clearly lost their positions in the refined copper world market.
The technology giants, Japan, South Korea and Germany, where copper is used broadly,
maintained their production amount.

2 Copper 12
Table 4: Top 20 refined copper production lists by country
2010 2000 ∆
1. China 4.537,5 1.371,1 3.166,4 2. Chile 3.243,9 2.668,3 575,6 3. Japan 1.548,7 1.437,4 111,3 4. USA 1.100,2 1.802,1 -701,9 5. Russia 864,0 824,0 40,0 6. Germany 708,9 709,5 -0,6 7. Zambia 685,6 226,2 459,4 8. India 647,5 259,1 388,4 9. South Korea 550,0 470,5 79,5
10. Poland 547,0 486,0 61,0 11. Australia 417,0 484,0 -67,0 12. Peru 393,6 451,7 -58,1 13. Belgium 388,8 423,0 -34,2 14. Spain 339,9 315,8 24,1 15. Kazakhstan 324,9 394,7 -69,8 16. Canada 319,2 551,4 -232,2 17. Mexico 291,9 399,1 -107,2 18. Indonesia 269,2 158,4 110,8 19. Brazil 260,5 184,6 75,9 20. Dem. Republic
Congo 232,8
29,0
203,8
Source: Cochilco, Yearbook 2010, (Own illustration).
The list of the top 20 copper refineries below reflects the refined copper production table
above. The biggest companies are domiciled in China, followed by Chilean copper giant,
Codelco, and Indian copper supplier, Birla Group. Technology oriented countries like USA,
Japan, South Korea and Germany are also represented. Most of these companies are also on
the top 20 smelter production lists.
Nevertheless, the trend in this sector is clear. The coming developing countries, India
and China, with their low-wage labours, are becoming more and more important. China
especially, with its domiciled developed countries’ high-tech production plants, is taking over
superiority. The concern of technology-oriented nations to secure their resources is now
crucial. Just two years ago, China shocked the industry with its export limitation of rare earth
metals, of which they hold 97% of world production. January this year, Germany’s industry
elites started an alliance to secure their resources in the future.10
10 cf. Deutsche Industrie. “Allianz zur Rohstoffsicherung nimmt Form an”. Handelsblatt.30. Jan. 2012
http://www.handelsblatt.com/finanzen/rohstoffe-devisen/rohstoffe/deutsche-industrie-allianz-zur-rohstoffsicherung-nimmt-form-an/6128006.html 13. July. 2012

2 Copper 13
Table 5: Top 20 Copper Refineries by Capacity, 2010
Source: ”World Copper Factbook 2010”. International Copper Study Group
A very upcoming and increasing part of copper production is recycling. Copper is
metal, which does not lose quality when recycled and, therefore, is today the most recycled
metal after iron and aluminium.
However, the differences between developed and less developed countries are enormous.
According to United Nations Environmental Programme’s (UNEP) Metal Stocks in Society
(2010), copper kg per capita is 140-300 for developed countries and 30-40 kg per capita for
less developed countries.11 The US copper scrap in 2010 was 1,793,000 tons, thereof,
1,021,000 tons were exported and the rest went to home consumption.
11 cf. UNEP. Metal Stocks in Society (2010)

2 Copper 14
2.1.2.3. World Copper Demand and Consumption
The enormous boom in the Chinese economy boosted the demand for copper. So it is
no surprising that China is by far the biggest consumer of this metal. The increasing wealth in
a country of 1,3 billion people requires a huge amount of copper to meet the immense demand
needed for building, construction and transportation needs. China had to renew existing
buildings and also had to construct new buildings to meet the rising demand by the people for
a high living standard. The huge development of China’s big cities reflects this trend.
Also, many foreign consumer electronic and industrial machinery and equipment
companies are settled in this low-wage country with enormous growing potential, which also
intensifies the necessity for copper.
Table 6: Global refined copper consumption 2010, Top 20 Lists
2010 2001 ∆
1. China 7.418,6 2.307,3 5.111,3 2. USA 1.785,0 2.619,0 -834,0 3. Germany 1.316,8 1.119,6 197,2 4. Japan 1.060,3 1.144,7 -84,3 5. South Korea 850,1 848,5 1,6 6. Italy 618,8 676,0 -57,3 7. Taiwan 532,4 540,0 -7,6 8. India 477,5 292,6 184,9 9. Brazil 468,4 345,0 123,5
10. Russia 420,5 223,8 196,8 11. Turkey 369,2 194,2 175,0 12. Spain 335,7 299,1 36,6 13. Mexico 318,5 436,8 -118,3 14. Poland 259,6 271,9 -12,3 15. Belgium 246,2 312,0 -65,8 16. Thailand 243,8 166,5 77,2 17. Indonesia 209,9 104,3 105,6 18. Malaysia 196,8 159,9 36,9 19. France 193,5 537,7 -344,2 20. Vietnam 172,3 25,2 147,1
Source: Cochilco, Yearbook 2010, (Own illustration).
The Chinese government is trying to maintain their increasing economy and has made
several supporting policies. One these policies was the premium for environmentally friendly
cars, which raised the sales market of a car to an amount of 1,22 million in August 2010 in

2 Copper 15
comparison to August 2009.12 That is a rise of 56% and if we think that a new car normally
contains around 25kg of copper and a hybrid car 75kg, then a huge need for this metal exists.13
With a consumption increase of 5,111,000 metric tons between 2001 and 2010, China is
directly in charge of the copper boom. Already, they are consuming 38,6% of the world’s
copper.14
Generally, the table above reflects the development of the world economy in previous
years. The so-called BRIC states, Brazil, Russia, India and China, increased their
consumption significantly. In opposition, the USA lost significantly. Many US companies
changed their production plants in the low-wage countries. In addition, the country has
experienced a big economic crisis in the previous years. However, the USA is not the only
country with a contraction in copper demand - the EU countries have also experienced an
enormous decrease. France (-344,200 tons), Italy (-57,300 tons) and Belgium (-65,800 tons)
all experienced diminishing copper demands.
The only one, which was able to resist this trend in Europe, is Germany. The export
giant with its big car- and industry machinery/equipment companies increased its
consumption of copper between 2001 and 2010 around 197,200 tons. The country is also a
pioneer in wind-energy engineering and in 2011 decided to no longer consider nuclear energy
in the future. When we consider that a 5 MW offshore wind complex requires 30 tons of
copper,15 the demand of copper will probably not diminish within Germany anytime soon.
Vietnam, Thailand and Indonesia, the populous South Asian countries, which have
experienced good, constant economic growth in the last years, could also increase their copper
consumption.
As is generally known, Turkey also had good economic performances in the last years and
could raise consumption of copper to around 175,000 tons in 10 years.
12 cf. “China: “Umweltprämie bringt Autoboom”. Klimaretter. 2.Sep.2010
http://www.klimaretter.info/mobilitaet/nachricht/6731-china-qumweltpraemieq-bringt-autoboom 14.July.2012 13 cf. Bauchmüller. “Rot ist die Hoffnung”. Süddeutsche. 8.Apr.2010
http://www.sueddeutsche.de/wirtschaft/kupfer-fund-in-der-lausitz-rot-ist-die-hoffnung-1.11533 14.July.2012 14 Cochilco, Yearbook (2010), p. 149 15 cf. “Kupfer in Windkraftanlagen”. Metalle pro Klima. http://www.metalleproklima.de/bestpractice/kupfer-in-
windkraftanlagen 11.July.2012
2 Copper 16
2.1.2.4. World Copper Trade
The international trade of copper is highly diverse. There are several kind of products,
which could be exported or imported. The first, which could be traded, are copper ores and
concentrates. As mentioned before, many of the less developed countries or countries with
lower amounts of copper ore production are exporting their concentrates directly to other
countries where the smelting and refining companies are domiciled (e.g. Mongolia). On the
other side, the developed countries, which invest directly in mine projects to secure their
resources (e.g. Japanese companies) or, further, they have the manufacturing plants within
their own country. Japan, South Korea and Germany, all of which have big car-, consumer
electronic and industry machinery/equipment companies, are securing in this way their copper
resources.
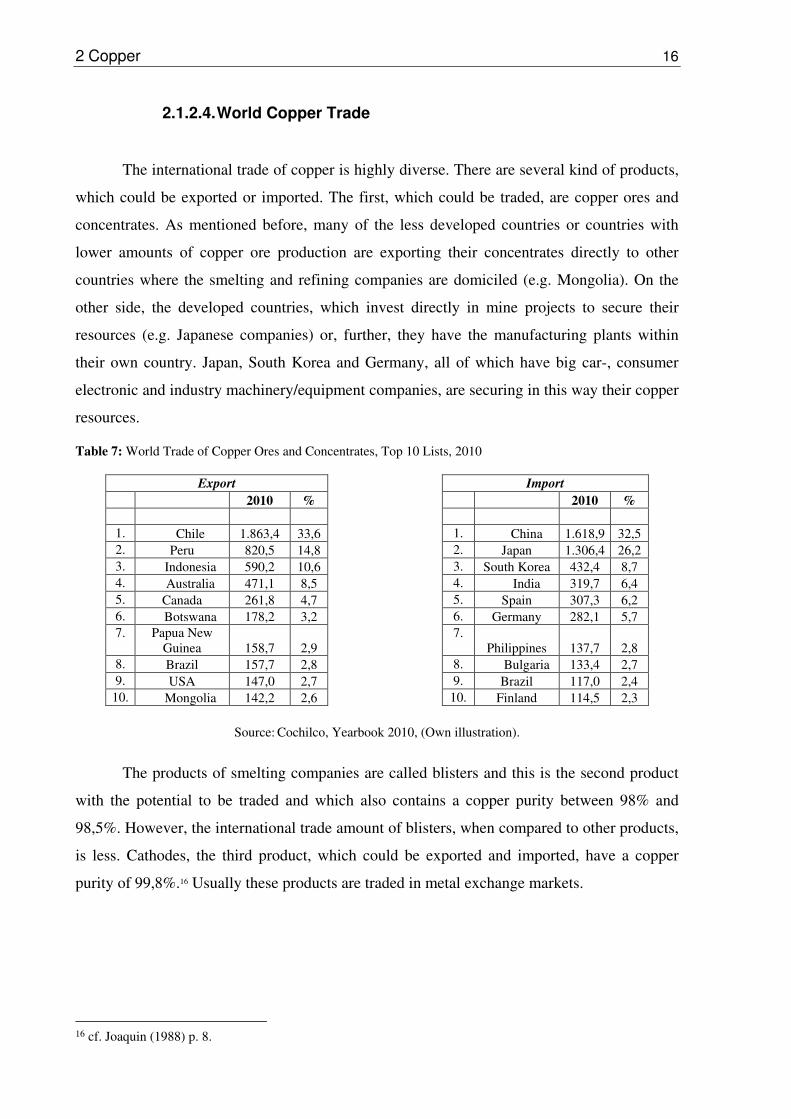
Table 7: World Trade of Copper Ores and Concentrates, Top 10 Lists, 2010
Export Import
2010 % 2010 %
1. Chile 1.863,4 33,6 1. China 1.618,9 32,5 2. Peru 820,5 14,8 2. Japan 1.306,4 26,2 3. Indonesia 590,2 10,6 3. South Korea 432,4 8,7 4. Australia 471,1 8,5 4. India 319,7 6,4 5. Canada 261,8 4,7 5. Spain 307,3 6,2 6. Botswana 178,2 3,2 6. Germany 282,1 5,7 7. Papua New
Guinea 158,7 2,9 7.
Philippines 137,7 2,8 8. Brazil 157,7 2,8 8. Bulgaria 133,4 2,7 9. USA 147,0 2,7 9. Brazil 117,0 2,4
10. Mongolia 142,2 2,6 10. Finland 114,5 2,3
Source: Cochilco, Yearbook 2010, (Own illustration).
The products of smelting companies are called blisters and this is the second product
with the potential to be traded and which also contains a copper purity between 98% and
98,5%. However, the international trade amount of blisters, when compared to other products,
is less. Cathodes, the third product, which could be exported and imported, have a copper
purity of 99,8%.16 Usually these products are traded in metal exchange markets.
16 cf. Joaquin (1988) p. 8.
2 Copper 17
Table 8: World Refined Copper Trade, Top 10 Lists
Export Import
2010 % 2010 %
1. Chile 3.160,2 39,3 1. China 2.920,4 37,6 2. Zambia 753,2 9,4 2. Germany 743,9 9,6 3. Japan 528,4 6,6 3. Italy 627,8 8,1 4. Russia 443,6 5,5 4. USA 582,9 7,5 5. Peru 364,1 4,5 5. Taiwan 535,5 6,9 6. Australia 315,3 3,9 6. South Korea 413,9 5,3 7. Poland 288,2 3,6 7. Brazil 253,4 3,3 8. Kazakhstan 272,3 3,4 8. Thailand 243,8 3,1 9. Canada 184,3 2,3 9. Turkey 332,5 4,3
10. Belgium 177,4 2,2 10. France 227,2 2,9
Source: Cochilco, Yearbook 2010, (Own illustration)
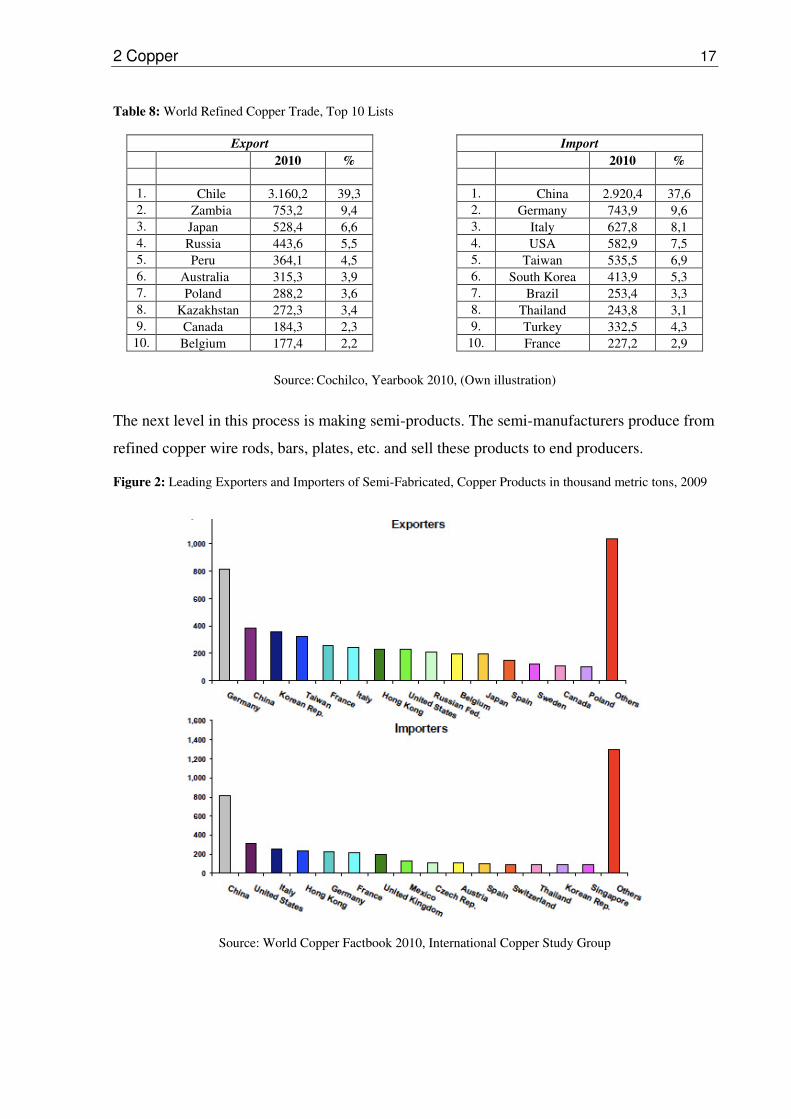
The next level in this process is making semi-products. The semi-manufacturers produce from
refined copper wire rods, bars, plates, etc. and sell these products to end producers.
Figure 2: Leading Exporters and Importers of Semi-Fabricated, Copper Products in thousand metric tons, 2009
Source: World Copper Factbook 2010, International Copper Study Group

2 Copper 18
2.1.2.5. Copper Price and Speculation on Copper Price17
The copper price experienced a turbulent time in last half decade. It held a relative
constant price around 2,000 USD/t point. Then, with the beginning of the Chinese economic
boom in the first half of 2006, it boosted to a historical level until in 14 February 2011, when
the price of a ton copper was 10,157 USD.
Important to be considered with copper price is the so-called settlement price for the
present (spot price) or future day. The settlement price will be fixed based on the perception
of future supply and demand in Exchange Markets mainly in the London Metal Exchange
(LME), Commodity Exchange, New-York (COMEX) and the Shanghai Metal Exchange
(SHME).
The increasing price also raised the volatility, which caused the rising uncertainty. If we
consider the last five years, the price first experienced a steep rise and then for the next three
years, roughly, was generally stable, before experience a fall of 3,000 USD points in February
of 2009. Just after a few months, the price grew and reached the historical 10,000 USD point
in February 2010 and then fell below 6,000 USD areas. The price is moving this year around
7,500 USD points.
Figure 3: Copper price development, LME $/t, From March 2006 to March 2012
Source: London Metal Exchange. http://www.lme.com/copper_graphs.asp 1.Aug.2012
In the exchange markets there is also the possibility to secure with future and option contracts
price variations in the future, which gives opportunity for speculators.
17 cf. Jung, A. and Schultz, T. (2010). Spielwiese für Spekulanten, Spiegel, edition 42, 2010 p. 92-99

2 Copper 19
After the new economy crises in the USA and the following European debt crisis,
there was big uncertainty in the market. The confidence on stock and bond markets was
shrinking and the investors were looking for stabile investments. Especially for private
investors, the commodity market was something easily understood and accessible.
As the big institutional investors also discovered the copper market, too many investors
resided in this small market. They moved the price in order to make profits and so the
volatility of the price of copper was rising and the real copper industry began to suffer under
this development.
The price went up and down, so the investments, for example, in new mine projects
became incalculable. Also, for construction-, automobile-, electronic- and industry
machinery/equipment companies, business became difficult because they could not foresee
how the price of this essential metal would develop.
Even today, the commodity market experts cannot predict the future development of the
market. The fundamental data, which they normally use for their prognoses, is not the only
important determinant - the mood of speculators is also highly influential on the price
development of copper. In 2009, in the big metal exchange markets, copper futures were
traded at 1,13 billion USD, which is 71 times more than the yearly global production of
copper.
The mining companies have to secure their projects with expensive hedges and further give
the increasing prices on the next processing steps and, in the end, the consumers have to carry
this price increase. As opposed to the real copper industry and consumers, the banks are
profiting double from this development. First they make profits from speculations and then
from the hedging contracts.

2 Copper 20
2.1.3. Future
2.1.3.1. Chance
The perspective of the copper market depends mainly on world economic
development. When the progress in China and India goes without rough problems, then there
is enormous potential in this area. The economic boom and the increasing living standard of
these two populous countries require an immense need for copper.
In addition to China and India the growing populous South Asian countries - Indonesia,
Vietnam and Thailand - could also increase the demand for copper.
There are also other countries and regions, which had positive developments. Russia and
some African (South Africa, Nigeria, Ghana) and South American (Peru, Argentina) countries
have had a good growing economy and all have enormous needs in order to be able to catch
up and reach a high living standard.
The growing technology standard means rising consumerism. The people, especially
in developed countries, depend more and more on smart phones and tablet PCs. Therefore, the
consumer electronic sector will also need a lot of copper in the future.
As mentioned before, as a result of the rising economy boom, an increase in living standards
has also occurred. The car industry in China is booming more and more, but not everyone has
a car in the most populous country of the world.
Beside all these perspectives, climate change and nature catastrophes, like the tsunami,
which occurred in Japan in 2011, force us to rethink and renew our energy sector. Solar and
wind energy seems to play a central role in our future.
All these require copper, but do we have enough copper?
This question is difficult to answer. On the one side, more and more new mines are
being discovered and also, through the high copper price, even the mines with high costs are
today profitable. Another positive aspect is that recycling gains more importance. The mining
industry develops their technology and can nowadays recover copper from difficult areas,
which they could not before.
All these give positive hope for the future.

2 Copper 21
2.1.3.2. Risks
Among the above-mentioned positive aspects, there are also dangers.
A big concern of copper mining companies and countries is a substitution for copper. Up until
today, there is no sign of such material. However, Chile once lost their main export income,
saltpetre, because a synthetic cheap material as a substitution was discovered. There are
already today several substitutions for copper products (E.g. PVC and other plastic pipes in
construction sector and fibre optics in telecommunication).
Technology improves further. Today especially, due to the trend of consumer products
becoming smaller and smaller - know as miniaturisation –the demand for copper is less.
The economic crises in the USA and Europe has influenced the world’s economic
development and slowed the emerging market’s progress and, as well, the demand for copper.
As mentioned before, the speculation of commodities in financial markets brings, on the one
side, liquidity in this sector, but on the other side, creates unrealistic prices and, thus, damages
the real copper industry.
Of course, in the end, even today we find new mines. The reserves will be depleted one day
and then we will be confronted with the depletion of copper.

2 Copper 22
2.2 Chile
2.2.1. Overview
Chile is a long, narrow country with different climate zones. Through its diverse climate
areas, it has various natural wealth. Though the country, with its 17 million people, is not the
biggest country in South America, the economic power of Chile is one of the strongest and
open. With a GDP of 281 billion USD in 2011, Chile’s economy grew 6.5%, which was the
second biggest growth in South America in this year. With a GDP per capita of $16,100 Chile
is the most prosperous country in South America and since 2010, the only South American
member in OECD.18
Besides having strong financial institutions with good reputations, Chile is highly
oriented towards foreign trade. The country has 59 trade agreements with different countries
and regions (not all of them is full free trade), which is unrivalled in the world.19 The FDI in
Chile in 2010 reached over 15 billion USD after 12,874 billion USD in 2009, which is an
increase of 17,3%.20
The economic history of the country is changing. From the end of the 19th century to
the world economic crisis in 1930, saltpetre was the main export product. Since then, copper
has taken over this role. After the world economic crisis in 1930, Chile tried to support their
industry sector through so-called import-substituting industrialization (ISI), which means
through political and economical influences to replace import products with own industrial
goods.
During the second half of 20th century, the country experienced turbulent times
through ideology-oriented governments. In 1970, under socialist Salvador Allende, an era of
nationalization of industries and social politics began. Allende tried to make Chile more
independent from other countries, especially from the USA. After the nationalization of
several big companies and banks, Allende’s government took over the copper mines, which
were mainly owned by private US investors.
18 cf. “Chile”. CIA Factbook. https://www.cia.gov/library/publications/the-world-factbook/geos/ci.html
20.Aug.2012 19 cf. ibid 20 cf. Foreign Investment Committee Chile.
http://www.foreigninvestment.cl/index.php?option=com_content&view=article&id=229:noticia-principal-17&catid=38:noticias&Itemid=106 6.Aug.2012

2 Copper 23
In September 1973 came Augusto Pinochet through a US supported military coup to
power. This completely changed the economic system of the country. At the beginning of the
Pinochet government, the economy stayed weak and the inflation, which was beginning to
gallop under Allende government, grew to a historical level.
Figure 4: Inflation Chile (historical)
Source: Global-rates. http://www.global-rates.com/economic-indicators/inflation/consumer-prices/cpi/chile.aspx
1.Aug.2012
At the beginning of the Pinochet era, the main ministers were staffed by military
generals. Towards the end of 1974, these positions were filled by so called Chicago Boys - a
group of former University of Chicago students, who were convinced of liberal free market
oriented policy. Chicago Boys changed the protection and industry-oriented policy to a
deregulated, privatized and strong foreign trade oriented one.
Most of the companies, which were nationalized under Allende, were again privatized and the
Pinochet government again opened the Chilean market, which meant the end of import-
substituting industrialization policy. The result was the diminishing of the secondary industry
sector, but also a growing export sector.
In 1979, Pinochet fixed the Chilean peso on US Dollar, which caused the peso to be
overvalued. The industry sector shrunk again and the unemployment rate increased to a
historical high. In 1982, Chile faced a deep economic crisis caused by a high foreign debt in
its bank sector. The government invested 6 billion USD in order to save the banks from
collapse, which was about one third of Chilean GDP in 1983.21
21 cf. “Wirtschaft Chiles”. Wikipedia. http://de.wikipedia.org/wiki/Wirtschaft_Chiles 4.Aug.2012
2 Copper 24
Pinochet was deselected in 1990 and followed by the first democratically elected president
since 1971, Patricio Aylwin.
Today, the economy of the country is broadly diversified. Copper still plays an
important role in the Chilean economy, but there are also other sectors, which have been
developed significantly in the last decades.
Wood and wood based companies, which export products like paper and cellulose,
experienced enormous growth. With 4 billion USD in 2004, the forestry industry contributed
3,1% to Chilean GDP. In 2005, this sector made up 13% of the total export of the country22.
The fish industry was a typical example of Chilean economic growth and the result of
economic diversification. This sector had enormous development until 2008, but,
unfortunately, a virus named infectious salmon anaemia (ISA) was found in 2007 and the
sector broke down. At its peak, Chilean fish exportation was 650,000 tons in 2008 and in
2009, the sector was predicted to have reached between 250,000-300,000. As well, the
workforce previously consisted of 55,000 direct or indirect workers during the boom time, but
since then has remained at 25,00023. The industry is recovering slowly from this hit.
Chile is also a growing wine country. Though the country has a long tradition of wine,
since the mid 80’s, the industry has begun to boom due to political stabilization and
increasing quality relationships with foreign investors, especially with the Spanish and
French.
The wine industry feared problems due to phylloxera louses and downy mildew, which were
damaging the wine industry worldwide. Luckily, thanks to the geographical isolation of the
country, these problems never came to Chile. The total export of the country in 2011 was 1.69
billion USD, which makes Chile, with 8% of the world total wine export, the 5th biggest wine
exporter globally24.
The finance and tourism sector also play an important role in the Chilean economy.
As well, the worldwide economic crisis of 2009 hardly affected the Chilean economy.
However, the country has the so -called sovereign wealth fund, which was built during the 22 cf. “Forestry Industry”. Chilean-American Chamber of Commerce.
www.amchamchile.cl/UserFiles/File/Forestry%20Industry.pdf 12.Aug.2012. 23 Estrada. “Chile: Salmonindustry won’t give up”. Inter Press Service 15.Aug.2010
http://www.ipsnews.net/2010/08/chile-salmon-industry-wont-give-up/ 16.Aug.2012 24 Ramos. “With record exports of wine in 2011, Chile wraps up successful participation in prowein”.
13.Mar.2012 http://www.prnewswire.com/news-releases/with-record-exports-of-wine-in-2011-chile-wraps-up-successful-participation-in-prowein-142462285.html 17.Aug.2012
2 Copper 25
high copper price era and was to be used in case of need. In 2009, the government was able to
pick from this fund in order to stimulate the struggling economy.
Through its highly foreign investment and foreign trade oriented policy, the main
Chilean economic sectors are more concentrated, which means that only a few big companies
are ruling those sectors. Japanese and Norwegian fish companies are dominating the fish
industry, just as the French and Spanish the wine sector.
Historically, the Chilean economy was dominated by so-called “Grupos económicos“, which
are a group of people, who own several big companies and who have enormous economic and
political power in the country.
Through its economic growth and stabile development, Chile remains one of the
countries with the highest inequality. Through the Gini index, which measures the national
income distribution, the country has a value of 52,1% in 200925, which is much more higher
than the average OECD level of 0,314%26.
This social inequality of the country received attention worldwide through mass student
protests in 2011.
Beside social problems, Chile also has to fight with natural hazards. The country is in an
earthquake active area. In February 2010, one of strongest earthquakes in the history of Chile
occurred and a tsunami followed. Due to this natural catastrophe, 700 people lost their lives
and it left damage equalling 30 billion USD.27
25 “Gini index”. World Bank. http://data.worldbank.org/indicator/SI.POV.GINI/ 18.Aug.2012 26 “Income Distribution”. OECD. http://stats.oecd.org/Index.aspx?QueryId=26068 18.Aug.2012 27 “Erdbeben in Chile 2010”. Spiegel online 16.Mar.2010 http://www.spiegel.de/panorama/bilanz-der-
katastrophe-von-chile-700-menschen-starben-bei-erdbeben-und-tsunami-a-684001.html 18.Aug.2012

2 Copper 26
2.2.2. Copper in Chile
A very important part of the Chilean economy is in the driest desert in the world -
Atacama. Here, in northern Chile, exist several essential copper mines, including, among
others, the Chuquicamata mine, which is the biggest copper mine in the world. Since Salpetre
has lost its position the as most important export product of Chile in the1930’s, Copper has
taken over this position and has been, throughout the years, an important pillar in the
country’s economy.
While during the 1950’s, US investors mainly owned Chilean copper companies, the situation
changed in 1964 with the government of Eduardo Frei Montalvo. Frei accused US Investors
of not investing enough in the Chilean copper industry and, instead, nationalized 51% of those
mines. Historically, this became known as the “Chileanization of Copper”. As mentioned
previously, the nationalization of copper was finalized under Allende in 1971. In that time,
copper made up about 75% of the Chilean export.28
Table 9: Contribution of Copper Companies to The Chilean Public Treasury, (In mill. US$)
1991 1992 1993 1994 1995 1996 1997 1998 1999 2000
Contribution29 880,8 900,6 446,6 995,9 1.953,5 1.301,7 1.569,8 549,5 383,7 916,1
Total Fiscal
Revenue 8.494,1 10.337,8 10.771,0 12.137,1 15.501,7 16.512,7 17.874,1 16.735,9 14.880,0 15.918,0
Share of total
fiscal revenue 10,4% 8,7% 4,1% 8,2% 12,6% 7,9% 8,8% 3,3% 2,6% 5,8% 2001 2002 2003 2004 2005 2006 2007 2008 2009 2010
Contribution30 510,7 376,0 846,7 3.607,0 6.163,1 12.909,6 14.153,1 11.181,3 4.566,7 9.753,0
Total Fiscal
Revenue 14.901,0 14.167,0 15.277,0 21.047,0 28.131,0 37.811,0 44.208,0 43.468,0 32.731,0 46.629,0
Share of total
fiscal revenue 3,4% 2,7% 5,5% 17,1% 21,9% 34,1% 32,0% 25,7% 14,0% 20,9%
Source: Cochilco, Yearbook 2010, (Own illustration).
28 cf. Meller (2003). 29 Including state-owned and10 largest private copper companies (GMP-10) 30 Data without GMP-10

2 Copper 27
As main export and earning product of the country, copper played significant roles in the
history of Chile. In 1942, President Rios created a law, which said that 10% of the countries
revenue of copper had to go directly to the army’s budget. This law is still valid today.
The economy of the country is quite dependent on the price of copper. Fortunately, the
price of copper has grown significantly over the last years and, thereof, the state has had more
possibility to invest and support other sectors. Though Chile’s current economy is diversified,
the copper sector is still the most important. In 2010, over 17% of Chilean GDP came from
this sector31.
In table 9, we can observe the contribution of Chilean copper companies to the public
treasury. The significance of copper in Chile is enormous. There was time when the
contribution was not that high, but with the development of copper prices over the last years,
the significance of the metal has grown more and more. In 2006, the contribution of copper to
the public treasury was 34.1%, which is an immense amount and in the following year, 2007,
the contribution was over 14 billion USD.
The development of total fiscal revenue reflects the enormous progress of the Chilean
economy. While in 1991, the fiscal revenue was only about 8.5 billion USD, after 20 years,
the revenue was over 46 billion USD. As we can see in Figure 5, the enormous increase in
copper price brought the Chilean government full surpluses.
Figure 5: Government Budget of Chile, (Percentage of the GDP)
Source: “Chile GDP Growth Rate”. Trading Economics. www.tradingeconomics.com/chile/gdp-growth
17.July.2012
31 cf. Cochilco, Yearbook 2010, p.69

2 Copper 28
Copper is not just an important factor for the fiscal revenue, it also provides and creates a lot
of jobs. In 2008, in the Chilean mining industry, in total, 167.509 people were employed
directly or indirectly.32
The mining industry is also the most important sector relating to FDI. In 2010, the FDI, which
represented the mining sector, fell by 38.3%, equal to over 15 billion USD.33
Table 10 shows that private copper companies are gaining more and more importance. While
in the past, state-owned Codelco dominated Chilean copper production, other private
companies are currently increasing their production capacity.
Table 10: Copper production of Chile by company, 2010
Companies 2010
Codelco-Chile 1.689,1
División Codelco Norte 903,7 División Salvador 76,2 División Andina 188,5 División El Teniente 403,6 Gaby 117,1 OTROS PRODUCTORES / Other Producers 3.729,8
Anglo American Norte 139,6 Anglo American Sur 257,7 Escondida 1086,7 Compañía Minera El Indio (1) 0,0 Michilla 41,2 Candelaria 136,4 Cerro Colorado 89,0 Quebrada Blanca 86,2 Zaldívar 144,4 El Abra 145,2 Collahuasi 504,0 Lomas Bayas 71,8 Los Pelambres 398,0 El Tesoro 95,3 Spence 178,1 OTROS / Other 356,2
Source: Cochilco, Yearbook 2010, (Own illustration)
32 cf. Perez and Villalobos, (2009). 33 cf. Foreign Investment Committee Chile.
http://www.foreigninvestment.cl/index.php?option=com_content&view=article&id=229:noticia-principal-17&catid=38:noticias&Itemid=106 6.Aug.2012

2 Copper 29
2.2.3. Codelco
Corporacion Nacional del Cobre de Chile (CODELCO) is the biggest copper
producing company in the world. This 100% state-owned company is by far the most
important of the country. Codelco was created through a Chilean governmental decree in
1976 and consists of several subdivisions. The company was the main subject of so-called
“Chileanisation” and “Nationalization of Copper”, which were illustrated previously. It is a
company, which contributed mostly to the Chilean fiscal treasury and, more important, it is a
company, which has enormous symbolic character for the Chilean people. This is illustrated
by the fact that the date, July 11, 1971 - the day when the congress allowed president Allende
to nationalize the copper companies - is named “The Day of National Dignity”. Hence, the
government of Pinochet, which actually was unfriendly towards the US, didn’t have the heart
to renationalize the company. Codelco grew over the years through fusions to a global copper
giant. The contribution of the company to Chilean fiscal treasury is enormous. While the
company contributed 11 billion USD to the treasury between 1970 and 1990,34 it grew from
1991 to 2010 thanks to the increased copper price to an amount of over 49 billion USD, which
is a tremendous number for a single company.35Besides this contribution, Codelco is also a
large employer in Chile and provides jobs for more than 19,000 people.36
34 cf. Meller (2003). 35 cf. Cochilco, Yearbook 2010, p.74 36 cf. “Figures”. Codelco. http://www.codelco.com/cifras/prontus_codelco/2011-02-25/155208.html
12.Aug.2012

2 Copper 30
Table 11: Codelco in numbers, (in Mill. US$)
2006 2007 2008 2009 2010
Sales 17.077 16.988 14.425 12.379 16.066
Pre – tax profits 9.215 8.460 4.970 3.948 5.799
Treasury payments 8.334 7.933 6.829 3.048 6.069
Total assets 13.033 15.186 13.707 18.254 20.279
Total liabilities 8.505 10.442 9.831 13.811 15.748
Equity 4.528 4.744 3.876 4.443 4.531
Investment 1.219 1.605 1.975 1.681 2.309
Production (000 tons) 1.783 1665 1.548 1782 1.760
Source: “Figures”, Codelco, http://www.codelco.com/cifras/prontus_codelco/2011-02-25/155208.html
12.Aug.2012
Table 12: Employment
2006 2007 2008 2009 2010
Own Personel 17.936 18.211 19.300 19.359 19.347
Operating contractors 24.028 26.210 23.171 22.602 23.138
Investment contractors 8.620 17.079 15.627 24.556 18.103
Source: “Figures”, Codelco, http://www.codelco.com/cifras/prontus_codelco/2011-02-25/155208.html
12.Aug.2012

2 Copper 31
2.3 Mongolia
2.3.1. Overview
A country more than four times bigger than Germany with only 2.7 million people, Mongolia
is the most sparsely populated country in the world. Through its geographic position between
the two giants Russia and China, the country stayed relatively isolated on the current world
stage.
In 1921, after more than 200 years of Chinese occupation, Mongolia was able to free
itself through Russian help. In 1924, Mongolia adopted the Russian constitution and became
the second communistic country in the world. This era lasted until the collapse of the Soviet
Union in 1990. In the same year, Mongolia experienced its first democratic election and is
counted today as the most stabile democratic country of the former Soviet Union countries.
The economy of the country was primarily based on traditional herding and agriculture,
whereas the second sector is underdeveloped due to the barren ground and continental climate
with very low precipitation. Until the transition in 1990, the country’s economy was strongly
dependent on the Soviet Union’s assistance. During this communistic period, the country was
able to build a broad industry sector through help from the Soviet Union.
After the collapse in 1990, the Soviet Union’s assistance disappeared over night and
the country experienced a deep recession. The economic transition from socialistic to open
market proved to be a difficult process. The industry sector broke down completely and left a
huge lack of basic products. Even the food industry collapsed and brought the country serious
problems. Mongolia had to introduce food rationing and the people began to see the
powerlessness of the government and started to handle affairs themselves. It was the
beginning of the gray economy, where Mongolians began to do business privately, and still
today makes up a significant amount of the country’s economy.
Due to 70 years of socialistic thinking, the people were accustomed to receiving
everything from the state and had forgotten how to handle themselves - meaning, Mongolians
had to learn to take personal responsibility.
Politics had to also adjust. The first democratic chosen government, which was the old party
from the Soviet period, was unable to handle the new orientation. They simply had no

2 Copper 32
experience and know-how of a market oriented economy and delayed the required market
reforms. The other new party, which arose from the protests in 1990, consisted mainly of
young politicians, who did not have political experience.
However, the positive point of the Mongolian political transition was that it happened
peacefully and without any heavy trouble. The country’s industry was inefficient and non-
competitive and, after only a few years, achieved privatization and stabilization.
Since 2000, the economy of Mongolia has begun to recover from the recession. With the
increasing copper prices and the start of several large mining investments, the economy has
improved significantly in the last years. The two big investment projects, Oyu-Tolgoi (copper
and gold) and Tavan-Tolgoi (coal), accelerated this development. The Mongolian Real GDP
grew 17,3% in 2011, which was the second highest in the world behind Qatar.37 However, the
country has enormous problems with inflation, which was over 14,7% during the first half of
2012.38 Mongolia became a member of WTO in 1997.
Figure 6: GDP-Mongolia, (In billions US$)
Source: Hallberg. “Invest in Mongolia”. Contrarian Investor. http://www.contrarian-investor.com/invest-in-
mongolia.html 26.Aug.2012
37 cf. “Mongolia Quarterly Economic Update-February 2012”. World Bank.
http://www.worldbank.org/en/news/2012/02/28/mongolia-quarterly-economic-update-february-2012 14.Aug.2012
38 “Mongolian Inflation Rate”. Trading Economics. http://www.tradingeconomics.com/mongolia/inflation-cpi 20.Aug.2012

2 Copper 33
2.3.2. Challenges
Currently, one of main concerns in Mongolia is a possible political failure. The political
parties concentrate more on their own interests and on upcoming elections than the countries
current challenges. The generous cash presents given to every Mongolian before the 2012
election in a country with inflation problem reflects this reproach.
Figure 7: Mongolia Government Budget, Percentage of the GDP
Source: “Mongolia Government Budget”. Trading Economics.
http://www.tradingeconomics.com/mongolia/government-budget 20.Aug.2012
The countries economy is developing positively in a never before seen way, yet the
political representatives are destroying this for their own interests. Indeed, it is a critical time
for the Mongolian future and coming generations and that is what the current rulers need to
internalize.
Figure 7 shows that though the country’s economy is growing and the main commodity prices
are still high, the government is not managing a positive surplus. Instead of acting carefully in
such a rapidly growing economy, the government is increasing its expenditures and
overheating the country’s economy.
It is also a time where the representatives are to accept the rules of market economy.
Still today, there are several opinions which desire to stop foreign investments in large
projects or to nationalize them, which is irresponsible and absolutely not in line with the
2 Copper 34
times. It is always damaging to hear such opinions in a country where many other foreign
investors are beginning to look for investment projects.
Another challenge facing Mongolia is the need to diversify its economy. The revenue of the
mining sector has to be the source for the developments of other sectors. Mongolia can learn
here from the history of Chile.
The economic diversification is indeed very limited and there is the danger of “Dutch
Disease”, where the none-mining sector could be disadvantaged and the overvalued currency
could bring these sectors in non-competitiveness.
The wholly dependence on Russian oil export is also a big concern for the country.
Additionally, due to the fact that Mongolia only has two direct neighbours and no existing
access to the sea, the issue of access to oil is critical, being that independence from Russian
oil is a current goal of Mongolia. Not to be forgotten is that these Russian oil-exporting
companies are a favourite political instrument of the Kremlin.
Besides this concern, over 90% of Mongolian exports in 2010 went to China,39 which is also a
worrying development. The country is highly dependent on the Chinese economy, which has
begun to slow down recently.
However, besides oil prices, the main sources for increasing inflation in Mongolia are copper,
coal and meat prices. According to the National Statistic Office of Mongolia, the increase on
the price of meat was the main reason for the 14,7% inflation rate in the first half of 2012.
Mongolia, with 2.7 million people, has over 40 million livestock and has the possibility to
bring the price of meat under control.
39 “Mongolia”. CIA Factbook. https://www.cia.gov/library/publications/the-world-factbook/geos/mg.html
20.Aug.2012

2 Copper 35
Figure 8: Mongolia Inflation Rate
Source: Mongolian Inflation Rate”. Trading Economics. http://www.tradingeconomics.com/mongolia/inflation-
cpi 20.Aug.2012
The people also have to understand the new situation. The fact is that Mongolia, with only 2.7
million people, is a shorthanded country. The historically based resentments directed at the
Chinese cheap labour force, which are hired by companies, need to change and the rightwing
politicians need to take action to reconcile the problem instead of throwing oil on the fire,
making the situation worse.
Also, another factor is to reduce the gray market, which has prospered since the 1990’s.
One thing that Mongolians can learn from the current world economic situation is inequality.
Many developed or less developed countries are currently experiencing difficulties with the
unequal distribution of income amongst its people. Mongolia is just beginning to develop its
economy and improve living standards. This is the chance to not repeat the mistakes of other
countries. Many countries, which passed excellent economic growth in the last years, are now
facing this problem and having serious social turbulences and, according to actual statistics,
Mongolia is on the road to developing a two-class society.
The remittances of abroad Mongolians played a sizeable role in the economy of the country,
especially before the mining boom. Here is another possibility - the hiring and bringing back
of these young educated labours.
2 Copper 36
2.3.3. Chances
A potential opportunity is to support the renewable energy sector. Mongolia has an
enormous amount of land and it is in a geographical area with many hours of sunshine and
constant wind intensity. As well, the energy sector of the country consists completely of coal-
fuelled power plants, which cause vast environmental pollution. The capital of the country,
Ulaanbaatar, is the one of most polluted cities in the world.
Generally, Mongolia is a large country with undeveloped deposits, which means that current
projects could be just the beginning. Since Mongolia does not have its own technology and
know-how with which to explore and develop, the political arena should provide a legal and
secure environment for foreign investors.
Mongolia is a country with only 2.7 million people and most of them are young and
relatively well educated. In addition, since the 1990’s, many Mongolians have immigrated to
other countries and sampled know-how and experiences. Through the historically nomadic
lifestyle, the people are generally quite open to other cultures and easily adaptable to new
situations. These are all positive aspects in a globalized world, which should be utilized for
forward progress.
The tourism sector could also play an important role in the country’s economy. The vast and
untouched nature is an attraction for many foreign tourists. There is enormous potential for
growth.
Mongolia has great chances for self-development. However, the political atmosphere must
create a clean and secure environment without corruption and nepotism. The rulers should
broadly diversify the economy in order to reduce dependence on commodity price volatilities.
Last, but not least, the government should try to build a broad middle class to avoid future
social disturbances.
2 Copper 37
2.3.4. Copper in Mongolia
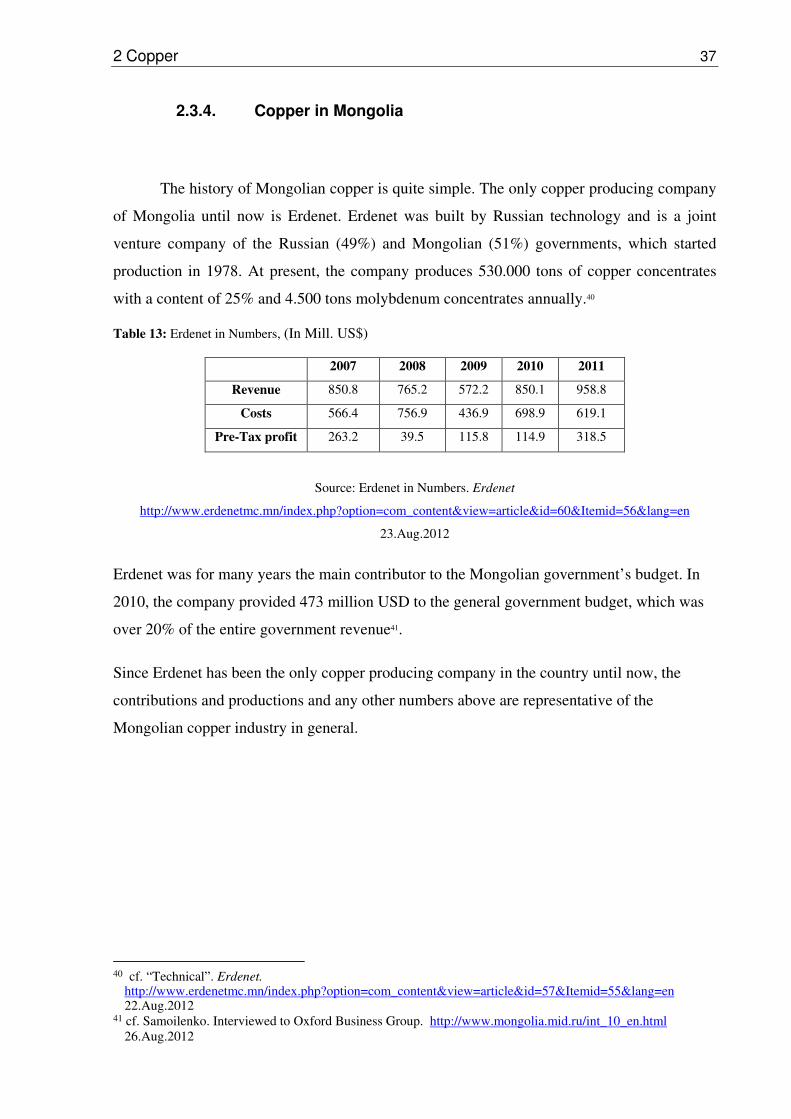
The history of Mongolian copper is quite simple. The only copper producing company
of Mongolia until now is Erdenet. Erdenet was built by Russian technology and is a joint
venture company of the Russian (49%) and Mongolian (51%) governments, which started
production in 1978. At present, the company produces 530.000 tons of copper concentrates
with a content of 25% and 4.500 tons molybdenum concentrates annually.40
Table 13: Erdenet in Numbers, (In Mill. US$)
2007 2008 2009 2010 2011
Revenue 850.8 765.2 572.2 850.1 958.8
Costs 566.4 756.9 436.9 698.9 619.1
Pre-Tax profit 263.2 39.5 115.8 114.9 318.5
Source: Erdenet in Numbers. Erdenet
http://www.erdenetmc.mn/index.php?option=com_content&view=article&id=60&Itemid=56&lang=en
23.Aug.2012
Erdenet was for many years the main contributor to the Mongolian government’s budget. In
2010, the company provided 473 million USD to the general government budget, which was
over 20% of the entire government revenue41.
Since Erdenet has been the only copper producing company in the country until now, the
contributions and productions and any other numbers above are representative of the
Mongolian copper industry in general.
40 cf. “Technical”. Erdenet.
http://www.erdenetmc.mn/index.php?option=com_content&view=article&id=57&Itemid=55&lang=en 22.Aug.2012
41 cf. Samoilenko. Interviewed to Oxford Business Group. http://www.mongolia.mid.ru/int_10_en.html 26.Aug.2012

2 Copper 38
2.3.5. Oyu-Tolgoi LLC42
The project, Oyu-Tolgoi, is the biggest foreign investment in the history of Mongolia
and located in the south of the country in the Gobi desert. This mine should have one of the
largest and highest grades of copper and gold reserves in the world. Oyu-Tolgoi LLC was
founded in 2009 through an agreement between the government of Mongolia, Ivanhoe Mines
Mongolia INC LLC, Ivanhoe Mines LTD and Rio Tinto International Holdings Limited,
where the Government of Mongolia owns 34% of the company’s shares.
Figure 9 shows that Oyu-Tolgoi is highly profitable – a reason being the existence of
up to 3% copper grade in some areas43. The measured and indicated amount of copper is
around 18 million metric tons and 21 million ounces of gold. Additionally, the same amount
of copper and 25 million ounces of gold is predicted.44 The total investment for the project is
around 5.2 billion USD,45 which for a country like Mongolia with a GDP of 8.6 billion USD,
is a huge amount. The first production of Oyu-Tolgoi LLC is planned for 2013 and should be
a huge stimulus for the Mongolian economy.
Figure 9: Major Copper-Gold Projects in Development
Source: “Update: Major Copper-Gold Projects”. Minefund. http://minefund.com/wordpress/2010/06/29/update-
major-copper-gold-projects/ 25.Aug.2012
42 cf. Oyu-Tolgoi. http://www.ot.mn/en/about-us 18.July.2012 43 See Appendix 44 ibid. 45 “Oyu-Tolgoi (Copper-Gold), Mongolia”. Turquoise Hill.
http://www.turquoisehill.com/s/oyu_tolgoi.asp?ReportID=379189 26.Aug.2012

2 Copper 39
The contribution of the Oyu-Tolgoi LLC to the Mongolian economy is enormous. Currently,
there are already over 9,000 people working and when production begins, there will be jobs
for around 3,500 Mongolians. The contribution to the Mongolian government budget is 700
million USD until the start of production and with the beginning of full operation, the amount
will grow to 600 million USD annually, on average. This should boost the GDP of the country
to 35% during full operation. According to IMF, Mongolia will receive around 55% of the
Oyu-Tolgoi cash-flow through different taxes, fees and dividends.
The project also provides many smaller projects and business units for small and mid
sized local companies. Until Q2 2012, around 3,000 companies were able to participate in the
project and the transaction of those companies with Oyu-Tolgoi LLC was around 400 billion
Mongolian Tögrög (MNT). Oyu-Tolgoi LLC also invested 100 billion MNT for educating
future Mongolian workers in the company.46
The future of this large project is secured by the commodity giant Rio Tinto, who
recently overtook the control of Oyu-Tolgoi LLC from Ivanhoe. Rio Tinto is one of the
biggest commodity companies in the world and has enormous financial potential for such
projects. It is a project in a deserted area, which means that an entirely new infrastructure had
to be built. Thus, it was expected that the financially better-suited Rio Tinto would overtake
the command.
46 “Economy”. News.mn http://economy.news.mn/content/59599.shtml 27.Aug.2012

3 Joint Venture and State-owned Enterprise, The Case of Oyu-Tolgoi LLC and Codelco 40
3 Joint Venture and State-owned Enterprise, The Case of Oyu-Tolgoi LLC and Codelco
3.1 Joint Venture and The Case of Oyu-Tolgoi LLC
3.1.1. (International) Joint Venture
3.1.1.1. Introduction
Greece, a small, almost economically insignificant country belonging to the European Union
(EU), today demonstrates the high interdependency of our world economy. The endless
speculations and discussions about a possible Greek collapse due to a staggering debt problem
and the resulting negative influences on other EU countries and, finally, also the EU itself,
bring the economy of the continent to a point of stagnation, which, furthermore, negatively
influences the economy of both the US and China. All of the small less developed and mainly
raw material exporting countries worldwide, which profited from gigantic Chinese economic
performances in the last decade, are beginning to now worry about their developments. In
such an economic environment, it is nearly impossible for multinational companies (MNCs)
to survive without having knowledge about other countries and networks. There are several
different opportunities to cooperate with other companies, however, joint ventures (JV) are
probably the most well-known method for obtaining knowledge and connecting with the new
world.
Today, there is no doubt that the global economy is shifting to new areas - from Europe and
North America to South East Asia and South America, in general. Also, in other parts of the
world, countries are gaining more and more significance and all these new areas and markets
are attracting other countries and companies, which are looking for new business areas. Vice
versa, the new emerging markets are also looking for partnership and cooperation with highly
developed and technology-based companies.
3 Joint Venture and State-owned Enterprise, The Case of Oyu-Tolgoi LLC and Codelco 41
“While it may not be true for all industries, there is ample evidence to suggest that at least in
industries based on natural resources, joint-venture firms are in increasingly popular form of
corporate organization”.47
Indeed, the commodity market is an excellent example of networking and cooperation. Many
less developed countries have resources, but because of their limited structural conditions,
these countries are forced to cooperate with other partners. On the other side, the commodity
market is very concentrated. There are only a few large companies who are ruling the market.
Especially in the last decades, there were several mergers and acquisitions and, thus, the
know-how and technological innovations, which are essential for this business, are mainly
only concentrated in these few giant companies.
Mining projects, by nature, are usually very high-priced and risky. The investment companies
are going into uncertain regions and taking a large risk, which requires expensive investments.
On the other side, the less developed countries are dependent on these large investing
companies, especially for huge mining projects. However, at the same time, these host
countries want to have certain control over the projects. Also, in many such cases, sentimental
and emotional factors of the indigenous people are connected with these projects. If one
considers all these factors, probably the most satisfying and most known form of organization
is that of a joint venture, which provides both parts security and power.
Joint venture is an organization form, which was used broadly in many sectors. In the
history of the car industry and also in the commodity sector, there were large JV cooperations.
Indeed, it is a cooperation form, which can provide, especially for new players, many
examples and experiences, which could be very helpful, especially for less developed
countries in their decision-making processes.
47 Stuckey (1983) p.149
3 Joint Venture and State-owned Enterprise, The Case of Oyu-Tolgoi LLC and Codelco 42
3.1.1.2. Definition of Joint Ventures and International Joint Ventures
Due to the nature of this organization form, which differs from the given situation and
conditions and also through the different local country’s laws, there exist several different
definitions of JV.
This paper is mainly focused on the international equity joint venture cooperation of Oyu-
Tolgoi LLC. Thus,
“Equity joint ventures are legally and economically separate organizational entities created
by two or more parent organizations that collectively invest financial as well as other
resources to pursue certain objectives”. 48
Furthermore, Geringer and Hebert (1989) noted “if at least one parent organization is
headquartered outside the JV’s country of operation, or if the venture has a significant level
of operations in more than one country, then it is considered to be an international joint
venture.”49
3.1.1.3. Types of Joint Ventures50
First of all, one differs between contractual (non-equity) and equity JVs. The
contractual JV is mainly aimed at short-term cooperation, especially in marketing, sales,
service and innovation sectors. The main character of this cooperation form is that it does not
require the setting up of a new company with a legal entity. It is a cooperation form where the
parties involved can reduce their financial risks and costs and where it could be also intended
to receive synergy effects from the cooperation. The advantage of contractual JV is that this
kind of cooperation does not need a complicated high-cost, time wasting set-up procedure,
which is especially relevant in International Joint Ventures (IJVs) and it is also much easier to
finish the cooperation.
Unlike the contractual JV, the equity JV requires the set-up of a new corporation, which
should be completely independent of the parent companies. According to Beamish and
48 Anderson 1990; Pfeffer and Novak 1976 quoted in Yan and Luo, 2001 p.3 49 Geringer and Hebert (1989) p.235 50 cf. Abdul Jaami, “Joint Venture Structure”, 2011, New-York,
http://www.shajlaw.com/media/reports/JointVentureStructure.pdf 20.Aug.2012
3 Joint Venture and State-owned Enterprise, The Case of Oyu-Tolgoi LLC and Codelco 43
Lupton (2009), the capital invested in a JV signals partner commitment, thereby enhancing
the probability of success. Furthermore, the equity JVs split into corporate- and
unincorporated JVs. Both, as mentioned before, are independent, new corporations, but the
unincorporated JV has a different legal entity. The common variants of unincorporated JVs
are Limited Liability Company (LLC), Limited Partnership (LP) or Limited Liability
Partnership (LLP). The reason for this differentiation is the chosen tax agreement.
A corporate JV pays tax on its profit and then distributes its dividends further to the
shareholders. The shareholders, in turn, have to again pay a tax, which makes it a two level
taxation. The unincorporated JV has the principle of pass-through taxation, which means, as a
JV, those companies do not pay federal taxes, but the earnings go directly to the co-ventures.
They have to pay tax on these earnings.
3.1.1.4. Motives for Joint Ventures
The approaches for identifying motives for engaging in JVs differ in business literatures.
Killing defined four reasons for engaging in a JV.51
1. Government insistence: Many governments, especially in developing countries, try to
connect their own firms with foreign investors. From the viewpoint of these countries, it is
important that the home country’s firms learn from investor know-how regarding technology,
innovation and marketing and, vice versa, it is beneficial for foreign firms to have networks
according to the home country’s social and cultural industrial differences.
2. Projects are too large to finance alone: Some projects are simply too large to take the entire
financial investment alone. Here, the mining and generally commodity sectors provide a good
example.
3. Absence of certain skills: Often, a single firm does not have all the skills needed to make a
successful business. In order to compensate this lack of know-how, the firms cooperate with
other organizations.
4. Economies of scale in research and development, production and marketing: Firms try to
minimize their costs by cooperating with other firms in certain areas. This point is particularly
relevant for small and medium companies because of their limited resources and capabilities. 51 cf. Killing (1983), p.6

3 Joint Venture and State-owned Enterprise, The Case of Oyu-Tolgoi LLC and Codelco 44
Other authors in entrepreneurship literature have different approaches in defining motives.
While Harrigan (1996) differentiates the main motives engaging in joint ventures as being
internal, competitive and strategic targets, Yan and Luo (2001) analyzed the thematic from
practical and theoretical aspects52.
This paper is mainly focused on the copper industry, thus, the author of this paper prefer the
reasons for going joint venture as stipulated by Stuckey. He analyzed the aluminium market,
which is quite similar to the copper sector. According to Stuckey, in the aluminium industry,
there are three reasons for engaging in a joint venture in order to avoid market failure.53
1. The markets of the intermediate-products, especially bauxite and alumina, which are
comparable with copper ore and semi-products, are “subject to failure”.
2. Technical, know-how and management expertise are not easily exchanged via the market.
3. The combination of high barriers to enter or exit in the aluminium sector and the absence of
capital market in the industry.
Furthermore, Stuckey highlighted the point of the so-called “management of oligopolistic
mutual interdependence”. “A joint venture offers the opportunity for cooperative and
collusive behaviour between an industry’s going firms, during both planning and operation”.
At the end, Stuckey pointed out the relationships between foreign firms with host country
governments, which is a typical way of creating joint ventures in the aluminium industry,
especially in small or economically underdeveloped countries.
Except for the absence of capital market in point three, all these reasons presented by Stuckey
are adoptable to the copper industry. Only the capital market plays an important role in the
commodity sector today.
52 Since the approaches overlap in many aspects I decided to not illustrate each point of those authors. 53 cf. Stuckey (1983), p. 152ff.

3 Joint Venture and State-owned Enterprise, The Case of Oyu-Tolgoi LLC and Codelco 45
3.1.1.5. Risks
Besides the many risks connected with becoming a part of a joint venture, one of the most
recently discussed and illustrated risks of cooperating in joint ventures is the possible loss of
intangible know-how. According to Perlmutter and Heenan, joint ventures represent an
effective way of coping with the increasing competitive and technological challenges of
today’s environment.54
“Even if its products or processes are protected by patents or copyrights, a firm may
nonetheless fear damaging ‘leakage’ of unprotected innovations or know-how if shared with
partners. Such disclosures, between the partners or to organizations outside the venture, may
have serious effects on the competitive position of a parent or the IJV, possibly creating new
competitors or otherwise limiting the IJV’s or parent’s overall efficiency”.55
The commodity market is strongly affected on this point. The high-cost innovation processes,
which the companies obtained through long-time research and development, could be
potentially copied and such occurrences could significantly weaken the company’s
competitiveness.
Stuckey noted that “technological- and production management know-how include the
capacity to design and construct a plant with the optimal technology, to operate the plant with
technical efficiency, and sometimes to modify the plant optimally when unexpected events
occur”.56 All this know-how requires extensive experience and it is not possible to gain the
necessary knowledge simply through exhaustive research alone.
54 Perlmutter, H. V. und Heenan, D. A. (1986) p. 136–152. 55 Parry (1985); Rugman (1985); Reich and Mankin (1986) quoted in Geringer and Hebert (1989), p. 236. 56 Stuckey (1983), p. 163.

3 Joint Venture and State-owned Enterprise, The Case of Oyu-Tolgoi LLC and Codelco 46
3.1.1.6. Culture in International Joint Ventures
“Managers of different countries may have differing attitudes to such basic things as the
desirability of material wealth, the importance of on-the-job performance, or the desirability
of change. The greater the cultural gap between the parents’ base countries, the greater the
problem”.57
Indeed, cultural differences play an important role in international joint ventures. In the
1960s, many Japanese and American joint ventures failed because of strong cultural
differences between the countries.58 It could also be assumed that there are such differences
between developing and developed countries. Furthermore, besides culture differences, there
are also differences in management and staff levels. According to Yan and Luo, one typical
mistake in international joint ventures is that one partner tries to enforce based on cultural
values and norms without respecting the other partner’s values.59
3.1.2. The Case of Oyu-Tolgoi LLC
3.1.2.1. Formation of the Joint Venture
Since Ivanhoe Mines60 invested vast money in exploring and defining the huge copper and
gold resources, the company had the initiative to build Oyu-Tolgoi LLC. However, Ivanhoe is
mainly specialized in exploring and defining resources and, thus, the investor had to look for a
better financially suited partner, which they found with Rio-Tinto. Rio Tinto is one of the
biggest commodity companies in the world with many years of experience in constructing
new plants all over the world, in many different commodity areas and, thus, it was obvious
that this company would overtake the rule of this large project. In July 2012, Rio Tinto
acquired 51% of Ivanhoe’s shares.
Generally, it is a very common method in the mining industry. There are many companies,
especially American, Canadian and Australian companies, which are specialized in exploring
such mines in order to cooperate with other financial institutes to produce or sell the projects
for producing companies. 57 Killing (1983), p. 57 58 ibid. 59 cf. Yan and Luo (2001), p.21 60 Ivanhoe Mines recently changed its name to Turquoise Hill Resources
3 Joint Venture and State-owned Enterprise, The Case of Oyu-Tolgoi LLC and Codelco 47
This project is indeed the biggest investment until today in the history of the Mongolian
economy, thus, there was enormous interest by the Mongolian government to receive a “slice
of the pie”. Generally, Mongolians are people who, from their history and also from their way
of life, very connected with nature. Thus, the people confronted the project with a lot of
emotion and sentimentality. In addition, the media and also the government spread the feeling
that the Oyu-Tolgoi project is an essential project for the Mongolian future, which caused
over caution and slowed down the building of cooperation.
The project also represents the first biggest investment of a western company in Mongolia.
Through the 70 years of communist rule, Mongolia almost only cooperated with Russian
firms and after the political change in the 1990’s, this project is the biggest cooperation with a
market-oriented firm.
After long discussions for many years, in October 2009, the Mongolian government and
Ivanhoe and Rio-Tinto finally signed the contract to realize this project. The joint venture,
Oyu-Tolgoi LLC, was born.
3.1.2.2. Management Structure
Two and more parents often cause poor performances for JVs.61 Oyu-Tolgoi could potentially
have exactly such problems in management level. Though Rio-Tinto overtook control from
Ivanhoe, the project was, from the beginning, confronted with interest from three different
organizations. However, on the other side, the nature of business provides the investing
companies, with their unique financial and technical know-how, the opportunity to take an
active role in the project. According to Killing, if one partner is willing to play a passive role,
then this joint venture will be more successful.62 In this case, the Mongolian government will
play the more passive role and rely on the years of experience and unique know-how provided
by Rio Tinto.
The executive directors board of Oyu-Tolgoi is equally shared between the three parties. The
two key executives consist of one Mongolian and one investor from a firm acting as managing
61 cf. Killing (1983), p.12. 62 cf. Killing (1983), p.15.

3 Joint Venture and State-owned Enterprise, The Case of Oyu-Tolgoi LLC and Codelco 48
director. Four Mongolians, three persons from Ivanhoe, one from Rio-Tinto and one from a
non-partisan, furthermore, share the board member positions.
3.1.2.3. Motives for Oyu-Tolgoi LLC63
The definition set forth by Killing in 1983 for engaging in a joint venture fits for the building
of this organization.
First, there was government insistence. It was clear that Ivanhoe Mines had to cooperate with
a Mongolian contribution. As mentioned before, there was a large sentimental and emotional
aspect connected to the local people regarding this project. Every governmental decision
related to the project Oyu-Tolgoi was observed closely and the expectations of the local
people were big for this cooperation.
At the same time, the Mongolians knew that the project was huge and of high-cost, which
Mongolians themselves cannot finance alone. Killing defined this point as “too large
projects”. Also, the third reason for joining a joint venture, which Killing noted as “Absence
of certain skills”, was given here. The Mongolian government or mining industry simply had
no knowledge and no know-how as to how to handle such a project. The newest technical
standards and highly educated and experienced managers and engineers were also absent. The
last point of Killing, “Economies of scale”, fits more to the cooperation between Ivanhoe and
Rio-Tinto. Through this joint venture, both companies are reducing their costs regarding risk,
marketing and production.
3.1.2.4. Risks of Oyu-Tolgoi LLC
The nature of the commodity sector, which is highly dependent on the market price of the
products, is the main risk regarding such projects. As of July 2012, around 5.2 billion USD
has been invested in this project, which is an enormous sum.64 In respect to that investment,
the price of copper must remain stand stabile and high. Otherwise, the danger of falling into
financial risk remains high.
63 cf. Killing (1983), p. 6-8. 64 Oyu-Tolgoi. http://www.ot.mn/en/about-us 18.July.2012

3 Joint Venture and State-owned Enterprise, The Case of Oyu-Tolgoi LLC and Codelco 49
“The board of joint ventures represent their parents, which could have differences in
priorities, direction and perhaps values will emerge. The result can be confusion, frustration,
possibly bitterness and a resulting slowness to take decisions”.65
Since this joint venture is represented by three different organizations, it could have exactly
such problems on the management level.
Furthermore, it is an international joint venture, which connects completely different cultures
to each other, thus, there is an enormous potential for misunderstandings, which will be
illustrated precisely in the next section.
3.1.2.5. Cultural differences of Oyu-Tolgoi LLC
It will be a challenging point for international investors to understand Mongolian culture.
There exist almost no examples of such cooperation in Mongolia. Thus, many other foreign
investors will observe this experience carefully.
Oyu-Tolgoi LLC is in cooperation with the Mongolian government, which means that this
joint venture is directly dependent on the country’s political situation. Since the contract has
been signed between the parties in October 2009, certain political sectors or politicians have
voiced feelings of displeasure due to the condition of the contracts. Even the famous political
party, (MPRP), which is one of the biggest political parties in the country, discusses openly
the possibility of nationalizing the Oyu-Tolgoi LLC.
The political culture of Mongolia is strongly connected to the time of the Soviet Union. Many
ruling politicians were active before 1990 in the communistic party and, generally, nearly all
the powerful politicians in Mongolia received their education in Russia or in former Soviet
countries. Therefore, to cooperate with a British/Australian company, which comes from a
long-history of market-oriented countries, is a completely new, undeveloped and uncertain
area.
Before the political change in 1990, the people had, on average, a high education level,
but during the last 20 years, the country has experienced a deep recession and serious
economic problems, thus, the gap between the rich and the poor increased significantly.
Consequently, the mean education level decreased, which makes the society weak for
65 Killing (1983) p.9

3 Joint Venture and State-owned Enterprise, The Case of Oyu-Tolgoi LLC and Codelco 50
populists. Through the long years of recession, only a few groups of rich people emerged who
share the power of the country, making the country non-transparent and providing the grounds
for corruption.
On the other side, the observation of cultural differences on the operational level is also very
important. Unfortunately, useful scientific studies regarding the Mongolian culture and its
differences do not exist. In general, the people have big hopes regarding the living standard,
which will be provided by the profits of Oyu-Tolgoi LLC, but at the same time, they also have
some distrust for these new foreign partners. It is a society, which could be described as
collective. The nomadic way of life has forced the people to act in groups. In addition, the
family structure is very different to western society. The family is still the most important
point in Mongolian lives. It is normally big and the mother is the main actor. Through a
nomadic lifestyle, the women have always held a significant role in the family. Men went
several months with the herd and the women had to keep the house. Compared to women in
Muslim countries or countries such as China or Korea, Mongolian women have more rights
and better social positions66.
Indeed it is a completely new way of cooperation. The people have big hopes and the younger
generation, especially, is quite open-minded and looking for better chances and opportunities.
3.2 State-owned Enterprise and The Case of Codelco
3.2.1. State-owned Enterprise (SOE)
3.2.1.1. Introduction
During the last decades, there was a wave of privatization throughout the world. Especially
with the transition of the former soviet countries, the thematic of state-owned enterprises
(SOE) and their efficiency and economic performances compared to privately owned
companies became an issue for scientific studies all over the world.
It is not a completely new topic, which we will discuss. In western countries, the SOEs
have played an important role since the end of the Second World War. Only in the 1980s did
those countries begin to decline their contributions on SOEs.
66 “Masculinity vs. Femininity of Mongolia”. International Business Wiki.
http://internationalbusiness.wikia.com/wiki/Masculinity_vs._Femininity_of_Mongolia 27.Aug.2012
3 Joint Venture and State-owned Enterprise, The Case of Oyu-Tolgoi LLC and Codelco 51
Today, nearly every country in the world acts in a market-oriented system. Even the neo-
liberal way of thinking has established itself in the world economy. The SOE is still an
important matter in the economic system of many countries. Governments want to have
control over specific essential strategic sectors and, at times, it also became a political
instrument in certain areas of the world. Recently, during the economic crisis, many countries
had to at least partially participate in some struggling, but important sectors.
3.2.1.2. Definition
There exist different names for such organizations: Government-owned corporation, state-
owned enterprise, state-company, government business enterprise or commercial government
agency. All of these different names describe an organization, which is partially or fully
owned by a government. Since such enterprises differ through different motives and the
juridical definition of each country, there does not exist any standard definition. An SOE is
normally aimed at making commercial activity profit-oriented and is usually a legal entity.
3.2.1.3. Motives
The history of SOEs is long and differs by each given situation and condition. Thus, it is
nearly impossible to find standardized motives for building SOEs. However, Toninelli gave
three main reasons for building a SOE.67 He argued first that there are political and ideological
motives. The examples given by this point are the former soviet countries and also the
nationalization programs of western countries after the Second World War.
He furthermore noted as his second point the “social-motives”, which have the aim of
guaranteeing full employment and better labour conditions. This social aspect of SOEs was
especially broadly used after the Second World War. Bruno Kreisky, the former prime
minister of Austria, said once that “he preferred a budget deficit a few billion to
unemployment of a few thousand”, which highlights the politics of the 60’s and 70’s. 68Hence,
it also provides governments with a political scope.
According to Toninelli, the third point of building an SOE is for economic reasons.
67 cf. Toninelli (2000), p. 5-10. 68 Bruno Kreisky quoted in Toninelli (2000), p.7.
3 Joint Venture and State-owned Enterprise, The Case of Oyu-Tolgoi LLC and Codelco 52
Here, one of the most used motives of holding companies as state-owned is to ensure the
supply of the country’s essential sectors, such as public transportation or post. This reason is
to be found nearly everywhere in the world and well known under the name of “natural
monopoly”. In such sectors, a monopoly firm is producing goods cheaper than privately
organized ones.69 He argued that the unregulated private companies would exploit the market
in such sectors.
The second economic reason given by Toninelli is nationalization policies, which aim to
support underdeveloped countries and regions with their economic growth. Kaldor
encouraged this point in the following statement:
“SOE makes its decisions on the basis of long-term considerations, and these are not or
cannot profit minded”.70
Another broadly used motive is to hold the strategic sectors. The oil industry in western
countries is a famous example. In general, the natural-resource-oriented countries still hold
these companies as state-owned. (e.g. Oil industry of Saudi Arabia). The recently
nationalization of Argentinean oil company YPF through the country’s government is also
aimed to ensure the strategic sector of the country.
Toninelli further noted the industrial bailout as a third point of economic motives.
Here, countries tried to save some sectors during the economic and financial crisis. These
sectors are normally huge and, in respect to employment, highly important. The concern of
such intervention is that it could cause social riots. Recently, we could exactly observe such
interventions. During the economic crises in the last years, many countries had to take action
in their respective finance sectors in order to prevent this system-relevant sector from going
bankrupt and, furthermore, to avoid any social disturbances.
The final economic reason for building public enterprises is that such companies are aimed at
reducing the price of goods. The goal is to help lower income earners.71
As we can see now, the motives of building SOEs are different and complex. However, the
sectors, where SOEs come into action, are similar from one country to the next.
69 cf.Bös (1986), p.27 quoted in Toninelli (2000), p.7. 70 Kaldor (1980), p.5 quoted in Toninelli (2000) p.8. 71 cf. Toninelli, (2000) p.9.

3 Joint Venture and State-owned Enterprise, The Case of Oyu-Tolgoi LLC and Codelco 53
Bös categorized as follows:72
1). Public utilities, communications, and transportation
2). Basic good industries (coal, oil, atomic energy, steel)
3.) Banks, insurance and social security
4). Education (public universities) and health (public hospitals).
3.2.1.4. The Performances of State Owned Enterprises
One of the most discussed issues of SOEs is the difference between an SOE and a private
corporation (hereafter PC) according to its efficiency. Vining and Boardman researched the
efficiency of SOEs and, furthermore, asked whether different ownerships have any positive or
negative influences for the companies in a competitive environment.73 These two scholars also
analyzed the performances of private, mixed and state-owned enterprises.74 While this paper
compared the ownership and performances in competitive environments, Bradbury and Hooks
analyzed the ownership and performances in a non-competitive environment, which was the
Australian electricity sector.75 Dewenter and Malatesta went further and compared SOEs and
PCs related to their profitability, leverage and labor intensity.76
Some authors chose particular countries. While Arocena, P. and Oliveros, D. analyzed the
efficiency of SOEs and PCs in Spain, Omran M. concentrated on Egyptian companies. The
results of all theses papers differ from each other. Arocena and Oliveras found that the
Spanish SOEs have not been very efficient, however, after privatization, these SOEs could
increase their efficiency even more.77
Omran worked out that the Egyptian SOEs had similar performances like their PC
counterparts. He added that Egyptian SOEs could also increase their profitability and
efficiency and, furthermore, Omran noted that in a competitive environment, ownership does
not matter.78 Vining and Boardman had a different opinion. They found in their paper that
ownership does matter for both technical and allocative efficiency. Furthermore, these two
72 Bös (1986), p.16-19 quoted in Toninelli (2000), p.10. 73 cf. Vining and Boardman (1990), p.205-232. 74 cf. Vining and Boardman (1989), p.1-33. 75 cf. Bradbury and Hooks (2007). 76 cf. Dewenter and Malatesta (2001), p.320-334. 77 cf. Arocena and Oliveros (2001), p.8. 78 cf. Omran (2004), p.1037-1038.

3 Joint Venture and State-owned Enterprise, The Case of Oyu-Tolgoi LLC and Codelco 54
scholars asserted that mixed as well as state-owned enterprises have significantly worse
performances than private enterprises. They further noted that mixed companies are less
profitable than state-owned- and private enterprises.
Dewenter and Malatesta confirmed the results of Vining and Boardman. They found that
SOEs are significantly less profitable than PCs. They furthermore noted that SOEs tend to
maintain bigger employer ratios and, thus, they tend to have larger leverage than the PCs.
We can see now that the there are different opinions regarding the performances of SOEs and
PCs. However, it has to be mentioned that these papers are made with the data of different
countries.
Another interesting point to the discussion of SOEs was contributed by Yair Aharoni. He
analyzed so-called “managerial discretion” in SOEs.79 Williamson defined the managerial
discretion as:
“The ability of managers to choose and pursue objectives and strategies that differ from those
of the owners”.80
Aharoni assumed that the owners of PCs have been mostly interested in having larger profit,
while the objectives of SOEs are multiple.
Even the question of who is the principal of a SOE is disputable. The different ministers could
have different interests and goals. For example, the finance minister could have more interest
on higher dividends, while the minister of labour may have interest on maximizing
employment. Such discrepancies cause SOEs to potnetially have an absence of clearly defined
objectives.81
Aharoni further argued that the managers of state-owned companies are more constrained
than managers of PCs regarding their choices of strategies because of the different interests of
certain groups of PCs. The managers of SOEs work under political pressure. Often it is
expected that they choose domestic companies as suppliers and, furthermore, they should
choose or prefer an SOE as a supplier rather than a PC.
79 cf. Aharoni (1981), p.184. 80 Williamson (1964), quoted in Aharoni (1981), p.184. 81 cf. Aharoni, (1981), p.185.

3 Joint Venture and State-owned Enterprise, The Case of Oyu-Tolgoi LLC and Codelco 55
The managers of SOEs also have to support the national interests. Aharoni noted the possible
national interests expected from SOEs:
“to refrain from raising prices in periods of inflation; to invest more during recessions; to
borrow abroad in order to avoid balance-of-payments problems; and to act as trust busters
by competing against strong private monopolies; to purchase ailing industries; to invest in
laggard regions and weak sectors of the economy”.82
It is clear that all these factors have potential significant influences on the performance of an
SOE. Thus, managerial discretion is a very important issue for both managers and
governments.
3.2.2. The Case of Codelco
3.2.2.1. Introduction
The history of this company is long and closely related with the history of Chile.
Codelco is directly related to national pride and the most important company in the country. It
is a company, which reflects the country’s various natural wealth. As mentioned in previous
sections, the company was nationalized during the time of so-called “Chileanisation of
copper” in 1970’s. The reason for this step was purely politically and ideologically motivated.
The US-owners, who mainly ruled the Chilean copper companies during the period of left-
oriented governments, were absolutely a thorn in the side of the country’s leader.
The nationalization of the company happened step-by-step. It began under the government of
Carlos Ibanez del Campo during 1950’s and the process culminated in the 1970’s with the
government of Allende. Through these steps, Codelco became a 100% state-owned company
and the US friendly, right-oriented government of Pinochet could not change the company’s
entity.
82 Aharoni (1981), p. 184.
3 Joint Venture and State-owned Enterprise, The Case of Oyu-Tolgoi LLC and Codelco 56
3.2.2.2. Motives for building Codelco83
The first point of Toninelli, namely the political and ideological reason for building state-
owned enterprises, fits perfectly with this situation. It was not that the mines had poor
economic results before becoming Codelco, but it was a time where the whole political
system of Chile was in transition. Socialism became more and more important throughout the
world and also in South America. For the political leaders of that time, the nationalization of
Codelco was a question of distribution. The objective of the nationalization was to diminish
the private capital and to increase the power of labour. For the leaders of that time, such huge
Chilean resource mines had to have the aim to act in the best interest of their own people.
The second reason of Toninelli, which is the “social-motive”, also fits to Codelco’s
nationalization. Namely, the mines were important employers and had enormous significance
for the country’s social system. Many people worked there and the guarantee of employment
and, furthermore, better labour conditions for these workers played also a role. Still today, the
workers of Codelco are some of the best-paid labourers in Chile and Codelco as a work place
has a very good reputation.
The third point of Toninelli, namely the economical reason, does not fit very well for the
nationalization of Codelco. As mentioned before, the company worked economically well and
the only point, which fits, is the strategic-motive. The company is not just an important
employer in the country - it is also the main contributor to the Chilean public treasury. It is
definitely a very strategically important company.
3.2.2.3. The Performance of Codelco
The business of copper in nature depends highly on the price of the metal and, furthermore,
with the economic development of the world. It is, therefore, useless to compare companies
according to their profitability. First, the companies are normally profitable when the price of
copper increases and, second, each mine has different costs to extract the metals. The
extraction processes for some mines are easier, thus, cheaper to and some others are more
costly. Recently, the unit costs of volume in the copper sector are increasing because the
83 Toninelli (2000), p. 5-10.

3 Joint Venture and State-owned Enterprise, The Case of Oyu-Tolgoi LLC and Codelco 57
companies have to go more and more deeper into the earth coast to find copper, which of
course pushes up the unit costs.
Codelco is also such a big company in the copper sector, which makes it difficult to say that
the company acts in a competitive environment. It is, moreover, a sector where several huge
mines or companies give the direction. In the global scheme of things, the copper market is an
oligopolistic one. In Chile, Codelco is nearly a monopoly. Only Escondida, another Chilean
private-owned copper company, has a similar size like Codelco. The copper sector is also a
sector where the demand for the product was due to the enormous development of China,
which was nearly insatiable in the last years. It is, therefore, quite difficult to compare
Codelco according to its performance with other privately owned companies.
Surely, the company had enormous development in the last 40 years. The contribution of the
company for the Chilean treasury is remarkable since the founding of the company and still
today, Codelco has enormous significance for the Chilean government and people.

4 Conclusion 58
4 Conclusion
The high importance of copper in everyday life and for the economy was at first not clear to
the author. Through writing this paper, the importance of copper for certain sectors and
countries became apparent. The entire copper industry experienced a boom time in correlation
with positive developments in some areas of the world. However, in the opinion of the author,
all these progresses have just one name - China. The tremendous development of the most
populous country in the world is common knowledge, but only after the writing of this thesis,
did the author fully recognize the real meaning of China for this industry. For many other
countries and regions, this metal also has essential significance. The positive development of
China has had positive ramifications for many other countries. As the Chinese economy
began to grow, it pushed up the economies of other countries.
When the Chinese economy continues to grow in such a way as it has in the last decade it will
have a great influence on both the Chilean- and Mongolian economy. These two commodity
export-oriented countries depend directly on China. Many other less developed countries from
South America, Asia and Africa are hoping that China will maintain its economic progress. If
we imagine that one day India, Brazil and Indonesia will have similar developments as China,
a very good future for the copper sector is foreseeable. In addition, there are new perspectives
for this sector. In an era where every country recognizes environmental problems, the
meaning of clean energy and electro mobility is gaining more and more importance. Through
the current research, it was stated that a hybrid car motor requires 75 kg of copper and a big
wind energy complex requires up to 30 tons of copper. With this knowledge, it is safe to
assume that the future demand for copper will not diminish, but rather it will grow even more
than in the last decade.
The copper sector is also an area, which has, like other commodity industries, a long and
interesting history. The copper organization CIPEC, which should have actually had the same
function as OPEC for oil exporting countries, fizzled after just a few years. The
nationalization era in Chile and in some African copper exporting countries brought more
turbulence than advantages. Additionally, the mining sector, by nature, is constantly
confronted with environmental problems. The copper industry needs a lot of groundwater and
a finished mine looks like a natural disaster. Also, most of the largest mines in the world are

4 Conclusion 59
in countries like Chile, Peru, Indonesia, Zambia, the Democratic Republic of Congo and
Mongolia and it would seem that the investing commodity companies, which are mainly from
developed countries, have to act with sensitivity. People from these countries are very close to
nature and they are extremely cautious of such mines. The locals have many emotions and
sentimental feelings for such projects.
Chile had great performances in the last years. A country with a long, interesting and
ever changing history found itself only in the 1990’s. Before this time, Chile was a victim of
different political ideologies and the locals and the economy suffered under socialists as well
as under dictator Pinochet. However, the last two decades were a good time for Chile and for
its economy. The politics of the country became more and more stabile and Chile was able to
diversify its economy. However, even though the country managed to be one of the most
successful countries in South America, the distribution of wealth is alarming. Historically, the
economic power of the country was concentrated within a few big families or groups of
people. Thus, the gap between the rich and the poor was continuously increasing. It will be a
coming challenge for the Chilean elite to bring equality to the country in order to prevent
serious social riots.
The second country chosen for this thesis was Mongolia. This country has tried only for the
last few years to develop and diversify its economy. Mongolia, a geographically huge, but
economically poor country, has only recently discovered the tremendous natural resources
under foot. For the small population - only 2.8 million people - there is a potentially fantastic
future ahead. The resources of the country do not only include extensive copper and gold
mines, but there are many other resources, including coal, uranium, oil and rare earth metals.
However, there are several challenges, which Mongolia currently faces. The political
transition from communistic to democratic seems to be working very well. However, the
transition from a communistic economic system to a market-oriented system does not seem to
be working smoothly. Many political elite as well as many Mongolians still harbour some
doubts about the new market system. The complete geographical and political isolation of the
last century, where Mongolia was only cooperating with Russia, is not currently helpful when
attempting to open up to other countries. Mongolia and Chile were chosen for this paper
because, in the opinion of the author, these countries have very similar economic conditions.
Both countries’ economies are based on the export of natural resources. The only difference
4 Conclusion 60
being that Chile has over 100 years of experience with this sector, while Mongolia has just
begun to explore such potential. Thus, Mongolia can learn a lot from Chilean experiences.
Recently, one of the biggest political parties in Mongolia came up with the idea of
nationalizing the copper mining company Oyu-Tolgoi LLC, which is the biggest foreign
investment in the history of the country. Here, Mongolian politicians can learn from the
history of Chilean copper giant Codelco. The nationalization of Codelco caused a long and
deep recession for the Chilean economy. After the nationalization of this company, the FDI
for the country decreased significantly, which left a huge lack of foreign currency reserve and
only after many years did the economy recover from this recession. It is the opinion of the
author of this thesis that the economy of Mongolia has a great chance, but such a development
requires a stabile political system and that is the most challenging point for Mongolia.
In the second part of this thesis, the authored compared the Mongolian copper Joint venture
Oyu-Tolgoi LLC with the Chilean state-owned copper enterprise Codelco. According to the
Joint Venture Oyu-Tolgoi LLC, the most difficult point would be the huge cultural
differences between the co-partners. The investing partners, British Australian Rio-Tinto and
Canadian Ivanhoe Mines, are cooperating with a country, which has only 20 years of
experience operating with democracy and a free-market system. In addition, the Mongolian
co-partner of this company is the country’s government, which makes the cooperation very
dependent on politicians. For the Mongolian government, it is also a new way of cooperating.
It is the first time that the Mongolian government has cooperated with western companies,
who have extensive experience acting in a free-market. However, even though production has
not yet started, Oyu-Tolgoi LLC continues to progress and will start already next year with
the extraction of copper.
The case of Codelco is a more difficult one. The nationalization of the company caused a long
deep economic recession in Chile, but, in the last decades, it also greatly helped to recover
and to diversify the country’s economy. The contribution of Codelco for the Chilean public
treasury is stunning. However, it is almost impossible to prove that this result is related to the
company’s state-owned structure.
State-owned enterprise (SOE) was a broad subject for many scholars and economists in the
last decades. Here, one of the main subjects is the comparing of efficiency between SOEs and
private corporations (PC). The ratio of profitability, leverage and employment of SOEs are the
most researched and discussed. However, in relation to the copper industry and mining
4 Conclusion 61
companies, it is useless to compare the results of a copper SOE with the results of a copper
PC because the nature of this business differs through the different mines. Some mines are
easier to operate, thus, copper extraction is cheaper, while others are much more difficult to
manage and, thus, more expensive, which influences the results.
At the end, it is the stance of this paper that the copper industry has a good future. When the
financial crisis is over and when other countries are able to also catch up economically, the
demand for this product will stay high.
Even though Codelco and Oyu-Tolgoi have different characteristics, these two companies are
staying in a position of importance in their respective countries.

62
Abstract in German
Die Kupferindustrie erlebte in den letzten zwei Jahrzehnten eine Blütezeit. Der
wirtschaftliche Aufschwung in China verursachte eine stetig steigende Nachfrage nach
Kupfer und löste damit eine Preissteigerung in eine noch nie da gewessene Ausmaße aus.
Die Verschiebung der wirtschaftlichen Machverhältnisse in der heutigen Welt zeigt sich
auch in der Kupferindustrie wieder. Die Rollenverteilung wird heute neu gemischt und
darum musste eine Aktualisierung von der ganzen Branche gemacht werden.
Die wirtschaftliche Aufschwung in China hatte auch positive Einflüsse auf andere Länder.
Hier, vorallem profitierten die Rohstoff exportierende Länder wie Chile und Mongolei
davon. Beide Länder, mit ihren zwei großen Kupferunternehmen, Codelco (Chile) and
Oyu-Tolgoi LLC (Mongolei) spielen wichtige Rollen in der globalen Kupferindustrie.
Dennoch sind es zwei komplett unterschiedliche aufgebaute Unternehmen. Nämlich, die
chilenische Kupferunternehmen Codelco wird 100% staatlich geführt, während die
mongolische Kupferunternehmen Oyu-Tolgoi LLC ein Joint-Venture ist.
In dieser Arbeit wird diese zwei Unternehmen hinsichtlich ihrer Profitabilität und
Wettbewerbsfähigkeit verglichen.
Schlüsselwörter:
Staatsunternehmen, Joint Venture, Kupferindustrie, Codelco, Oyu-Tolgoi LLC,
4 Conclusion 63
References:
[1] ABDUL JAAMI: Joint Venture Structure: 2011 [2] BEAMISH, Paul W.; LUPTON, Nathaniel C.: Managing Joint Ventures: Academy of
Management Perspectives, May 2009 [3] COCHILCO; Yearbook 2010 [4] DEWENTER Kathryn L.; MALATESTA, Paul H.: State.Owned and Privately Owned
Firms: An Empirical Analysis of Profitability, Leverage, and Labor Intensity: The American Economic Review, Vol. 91, No.1,
[5] GERINGER, J. Michael; HEBERT, Louis: Control and Performance of International Joint Ventures: Journal of International Business Studies, Summer 1989
[6] GLÜSING, Jens; JUNG, Alexander; SCHULZ, Thomas: Rohstoffe Spielweise für Spekulanten: Der Spiegel, 42/2010
[7] HENRÍQUEZ JOSÉ YÁÑEZ: Efecto del Cobre en las Finanzas Publicas Chilenas, Universidad de Chile, Chile, 2008
[8] HOOKS, Jill J.; BRADBURY, Michael E.: Ownership and Performance in a Lightly Regulated, Non-Competitive Operating Environment, 2008
[9] International Copper Study Group; World Copper Factbook 2010 [10] JOAQUIN, Vial: An Ecometric Study of the World Copper Market, 1988 [11] KILLING, J.Peter: Strategies for Joint Venture Success, London & Canberra: Croom
Helm, 1983 [12] MELLER, Patricio: El Cobre Chileno y LA Politica Minera, Serie Estudios
Socio/Economicos Nr. 14, Cieplan, Chile [13] OLIVEROS, Diana; AROCENA, Pablo: The Efficiency of State-Owned and Privatized
Firms: Does Ownership Make a Difference?: International Journal of Production Economics, http://dx.doi.org/10.1016/j.ijpe.2012.06.029, 2012
[14] OMRAN, Mohammed: The Performance of State-Owned Enterprises and Newly Privatized Firms: Does Privatization Really Matter?: World Development: Elsevier, 2004
[15] SPILIMBERGO, Antonio: Copper and Chilean Economy, 1960-98: IMF, 1999 [16] STUCKEY, John A.: Vertical Integration and Joint Ventures in the Aluminum Industry,
Cambridge; Massachusetts; London: Harvard University Press, 1983 [17] PEREZ, Villalobos: „¿Por Qué Subcontratan Las Empresas Mineras en Chile?“, Capitulo
5, Recopilacion de Estudios, Cochilco, Chile, 2009 [18] TONINELLI, Pier Angelo: The Rise and Fall of State-Owned Enterprise in the Western
World, Cambridge: Cambridge University Press, 2000 [19] United Nations Environmental Programme’s (UNEP); Metal Stocks in Society Report, 2010
[20] VERNON, Raymond; AHARONI, Yair: State-Owned Enterprise in the Western Economies, London: Croom Helm, 1981
[21] VINING, Aidan R.; BOARDMAN, Anthony E.: Ownership versus competition: Efficiency in public enterprise, The Netherlands: Kluwer Academic Publishers, 1992
[22] VINING, Aidan R.; BOARDMAN, Anthony E.: Ownership and Performance in Competitive Environments: A Comparison of the Performance of Private, Mixed, and State-Owned Enterprises: Journal of Law and Economics, The University of Chicago, Vol.32, No.1, Apr. 1989
[23] YAN, Aimin; LUO, Yadong: International Joint Ventures: Theory and Practise, Armonk; London: M. E. Sharpe, 2001
[24] Kupferinfo, “Kupfer- Werkstoff und Anwendung” http://www.kupferinfo.at/
[25] Handelsblatt-online, http://finanzen.handelsblatt.com/kurse_einzelkurs_uebersicht.htn?chart_zeit=100000&i=354331
[26] Perlmutter, H. V. und Heenan, D. A. (1986) Cooperate to compete globally. Harvard Business Review, 64(2), 136–152.

64
Appendix
65
Curriculum Vitae
Name: Bayanmunh Janshin
Address: Strozzigasse 17/22
Vienna 1080, Austria
E-mail: [email protected]
Telefon: 0043/(0) 6504550552
Born: 3 of April 1982, Ulaanbaatar, Mongolia
Citizenship: Mongolia
Education: 1998-1995 Primary and Secondary school, Ulaanbaatar, Mongolia
1998-1999 Secondary School ISOP Graz, Austria
1999-2003 Gymnasium Klusemann, Graz, Austria
Since 2004 Student on the University Vienna, International Business
Winter term 2008/09 Erasmus semester at Euromed Marseille, France
Summer term 2009 Exchange semester at Carleton University, Ottawa,
Canada
Languages: Mongolian (mother tongue), German (fluently), English (good), Russian
French, Spanish (basic knowledge)