Embed Size (px)
Citation preview
-
,...
---
SSC-106
MILL SAMPLING TECHNIQUES FOR QUALITY
DETERMINATION OF SHIP PLATE STEEL1
1#-
by
CharlesL S*augaitis
--
.—
‘-
-.
,,,. .,
---
... .1
II._
SHIP STRUCTURE CWITTEE
.-,’
.— ‘-..
SHIP STRUCTURE COMMITTEE —
MEMBER AGENCIES:
mummu OF SHIM. Dsw. OF NAW
MILITARYS- TRANSPORTATION SRRVICR, BUT. o: MAW
UNITED 87AYC0 COA8T aUARD. TnCAmURV DER.
MARITIME AOUIN18TRATION. Dwr. OF COMMERCE
AMIRICAN Bumuu OF SHI?WIm
ADDREES CORRESPONDENCETO: -$ECnB?ARV
1’
SHIP STRUCTURE CONNITTEC . . ..
U. S. COA9T GUARD HEAOOUARTKRS —
WASHINa70N am. 8. C.I
January 31, 1958 ~
Dear Sir:
The Ship Structure Committee and the American Ironand Steel Institute are jointly sponsoring a study at theNational Bureau of Standards to determine tihenotch tough-ness of currently produced ship plate steels. Herewith isa copy of SSC-106, First Progress Report OIY‘lMillSamplingTechniques for Quality Determination of Ship Plate Steel,~tby C. L. Staugaitis.
The project is being conducted wittithe advisoryassistance of the Committee on Ship Steel af the NationalAcademy of Sciences-NationalResearch Council.
Any questions, comments, criticism or other mat-ters pertaining to the report should be addressed to theSecretary, Ship Structure Committee.
This report is being distributed tu those individ-uals and agencies associated with and interested in the workof the Ship Structure Committee. I
Yours sincerellyl
K. K. Cowart~ Rear AdmiralU. S. Coast WardChairman, Ship Structure.,,,. . Committbe ~
I i
—.
I,,
—.1’,,
.I,—
.
Ik— , I
I.—.
I— I
—.
.
—
.—’ I
‘—
—-
—-
1
--
-.Serial No. SSC- 106
First Prcgrre ss Reportof
Project, SR- 139
tothe
SHIPSTRUCTURE COMMITTEE
on
MILL SAMPLING TECHNIQUES FOR QUALITY
DETERMINATION OF SHIPPLATESTEEL
by
CharlesL. Staugai~ls
NationalBu~eauofStandards
under
IWasuryDepartmentU. S. CoastGuard,
RequisitionNo. CG-39, 152-B
transmimedthrough
Committeeon ShipSteelDivision of Engineering and Industr.~ al Research
National Academy of Science s–National Research Council
u,nder
Department of the NavyBureau of Ships Contract NObs-72046
BuShips Index No.. NS- 731-036
Washington, D. C.National Academy of Sciences-National Research Council
January 31j 1958
(Reprinted Qctober 3, 1958)— .—
MILL SAMPLING TECHNIQUES FOR QUALITY,—-. .—l.DETEl?M:H4Aii;ONOF S“HWPm= STEEL—---— — — — —
- -.
ABSTRACT
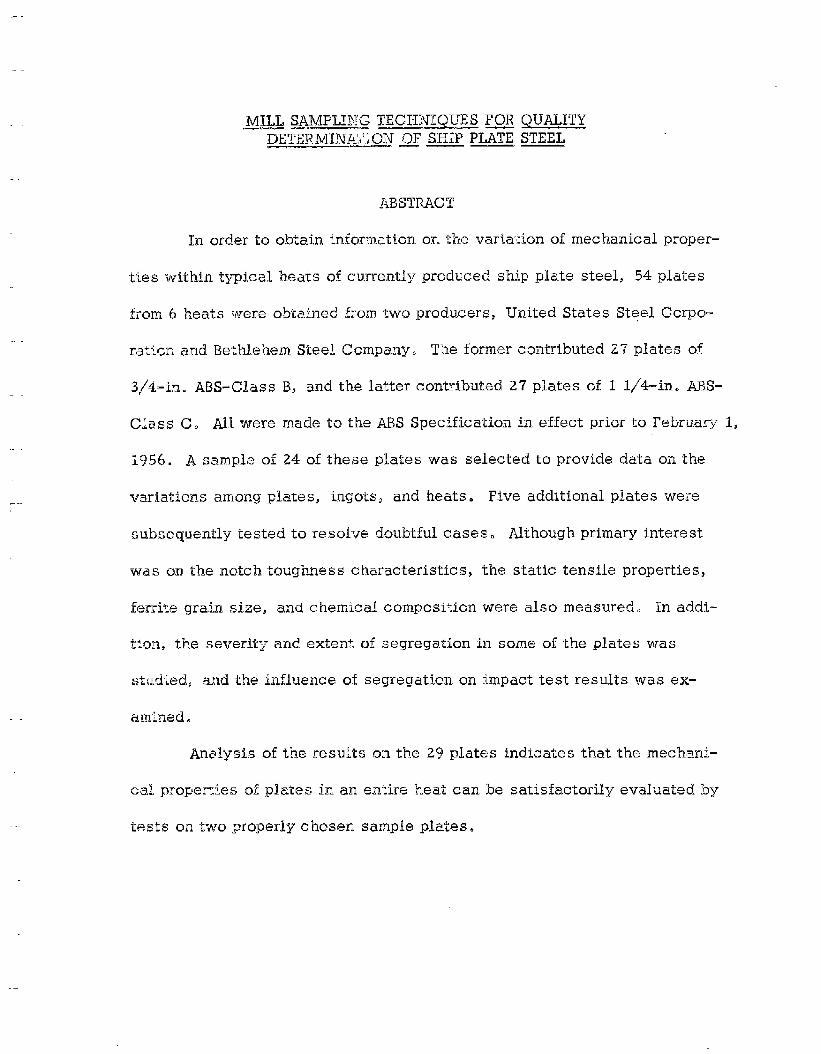
In order to obtain information on ?:he variaiion of mechanical proper–
ties within typical heats of currently produced ship plate steel, 54 plates
from 6 heats were obtaimd from two producers, United States Steel Gorpo-
ratiGn and Bethlehem. Steel Company. The fonner contributed. Z7 plates of
3\4-in. ABS-Class B, and the latter cont~ibuted 27 plates of 1 l\4-in. ABS-
CJa ss (2,, AH were made to the ABS Specification in, effect prior to February 1,
1,956. A sample of 24 of these plates was selected to provide data on the
~~ariati~n~ a,mong plates, ingots, and heats. Five additional plates were
subsequently tested to resolve doubtful cases. Although primary interest
was an the notch. tougbmess characteristics, the static tensile properties,
ferrite gra~m S,IZej a,nd,chemical composition were also measured,, In addi-
tion, the severitiz and extent of segregation in some of the plates was
Stu,died,j and the iniluence of segregation on impact test results wa.s ex-
amined o
Analysis of the results oa tb.e 29 plates indicates that the rnechar~i-
ca,l prope~ks of plates in an entire heat can be satisfactorily evaluated by
tests m two properly chosen sample plates.
TABLE OF CONTENTS
Introduction . . . . . . . . . . . . . . . . . . . . . . . . . . . . . . . . . . . 1
Material, . . . . . . . . . . . . . . . . . . . . . . . . . . . . . . . . . . . . 2
Testing Procedure . . . . . . . . . . . . . . . . . . . . . . . . . . . . . . . 8
Impact tests . . . . . . . . . . . . . . . . . . . . . . . . . . . . . . . . . 8Tensile tests . . . . . . . . . . . . . . . . . . . . . . . . . . . . . . . . 9Chemical and spectrochemical analyses. . . . . . . . . . . . . . . 9Full-plate thickness tests. . . . . . . . . . . . . . . . . . . . . . . . 9Metallographic examination. . . . . . . . . . . . . . . . . . . . . . . 10
Results and Discussion. . . . . . . . . . . . . . . . . . . . . . . . ...10
Conclusions . . . . . . . . . . . . . . . . . . . . . . . . . ..........19
Appendix A. Statistical Evaluation ofABS-B and ABS-C Steel DatabyW. J. Youden, M. Natrella and J. M. Cameron. . . . . . . . . 21
Appendix B. Nil-Ductility Transitions of Select ABS-B and ABS-CSteels by A.J. Babeckiand P. P. Puzak . . . . . . . . . . . . . . . 32
Appendix C. Tabulation of Charpy V-Notch Energy Absorptionand Per Cent Cleavage Fracture Area. . . . . . . . . . . . . . . . . . 40
.-.
MILL SAIIPLTNGTECHNIQUES FOR QUALITY-~RMINATION OF L3HI~~~~ smm.— ——
1. INTRODUCTION
This investigation was initiated as a result of a survey
of the ship steel research program made h 1953(1). One of
the recommendations in the report of this survey was that a
test program
or currently
factors that
project thus
be undertaken to determhe the notch toughness
produced ship plate steels and to evaluate those
may significantly influence this property. The
established has been sponsored jointly by the
Ship Structure ~ommittee and the American Iron and Steel In-
stitute. ,Dr. W. J. Harris$ Jr., is chairman of the project
advisory committee.
The first steps of this investigation were to assess the
degree of variation that exists within a heat and to determine
the best location and minimum number of test samples necessary
to describe adequately the notch toughness characteristics of
a heat of ship steel. Thus the work described in this report
was confined to only six heats of steel.
Dr. W. J. Youden of the National Bureau of Standards! Sta-
tis~ical Engheering Section, served as consultant on the project
(1)C. S. Barrett and W!.E. Mahin2 11AReview of Shfp SteelResearch and Recommendations for Future Studies,” Review Report?Shin Structure Committee Report Serial No. SSC-70, February 15,19*.
and laid out the schedule of tssts for certain portions of the
investigation. Personnel of the statistical group also made
extensive statistical computations from these test data. %-
suits and discussion of the statistical computations are given
in Appendix A.
II. MATERIAL
The first phase of this investigation is concerned onlY
with those steels made to the specifications of the Amertcan
Bureau of Shipping prior to I?sbmary 1, 19~60 Twenty-seven
samples of 3/%-in. ABS Class E?Steel were contributed by the
United States Steel Corporation and a like number of 1 l&ino
ABS Class C plates by the Bethlehem Steel Cm.pany. Each group
of twenty-seven plate samples was obtained from three separate
heats. The test samples were chosen from the top, center, and
bottom plates of the secondp middle and next-to-last ingots of
each heat. The mills contributing the steel plate provided
data sheets which gave extensive information on the manufacturi-
ng and processing of the individual samples+ These sheets
allowed complete identification of each heat$ ingot,and plate.
They also included information on melting practice$ ingot
practice,and rolling practice.
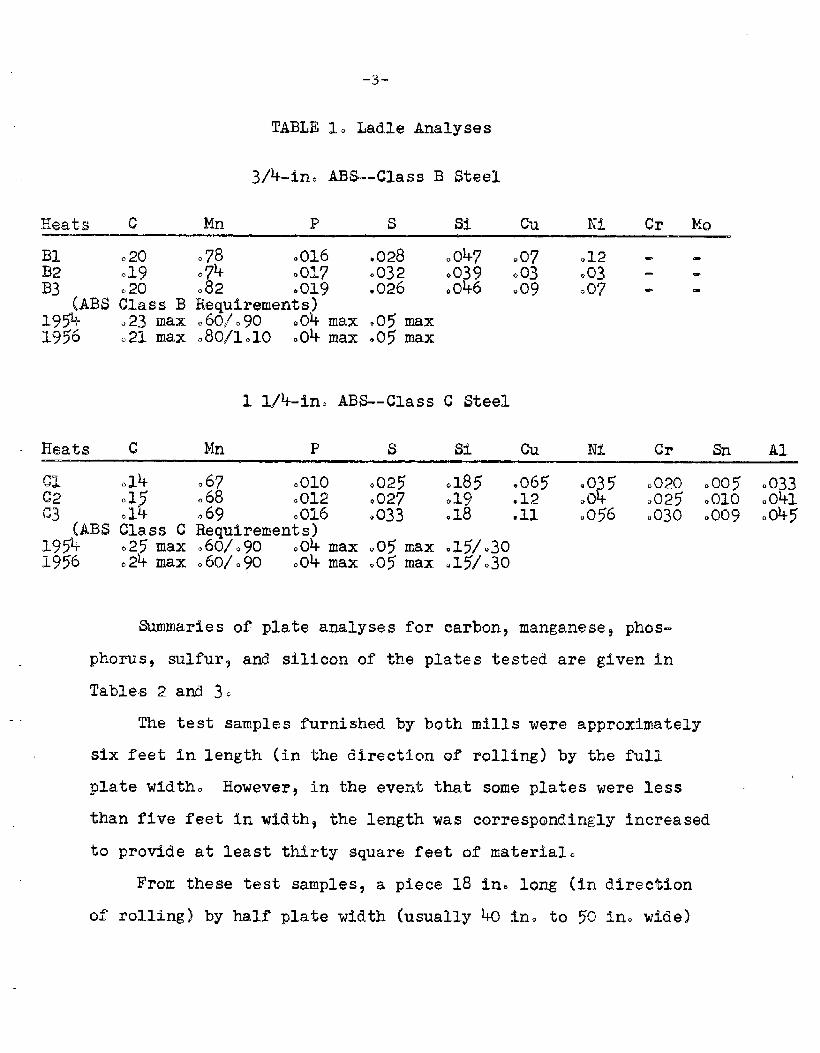
The ladle analyses of each heat are given in Table 1 and
conform to the 1954 ABS maqul~ements (now slightly changed]
as shown in the same table.
-3-
TABLE 1. Ladle Analyses
3/kin. ABtS--ClassB Steel
Heats c Mn P s M. h Ni Cr Mo
078 .016 .028 .047 .07 .12 - -0(% .017 .032 0039 003 .03 - -.82 .019 .026 ‘0046 .09 007 - -Requirements)o60/.90 .OL max .05max080/1010 .04 max .05 max
1 114-in. ABS--Class C Steel
Mn P s Si Cu Ni Cr Sn Al
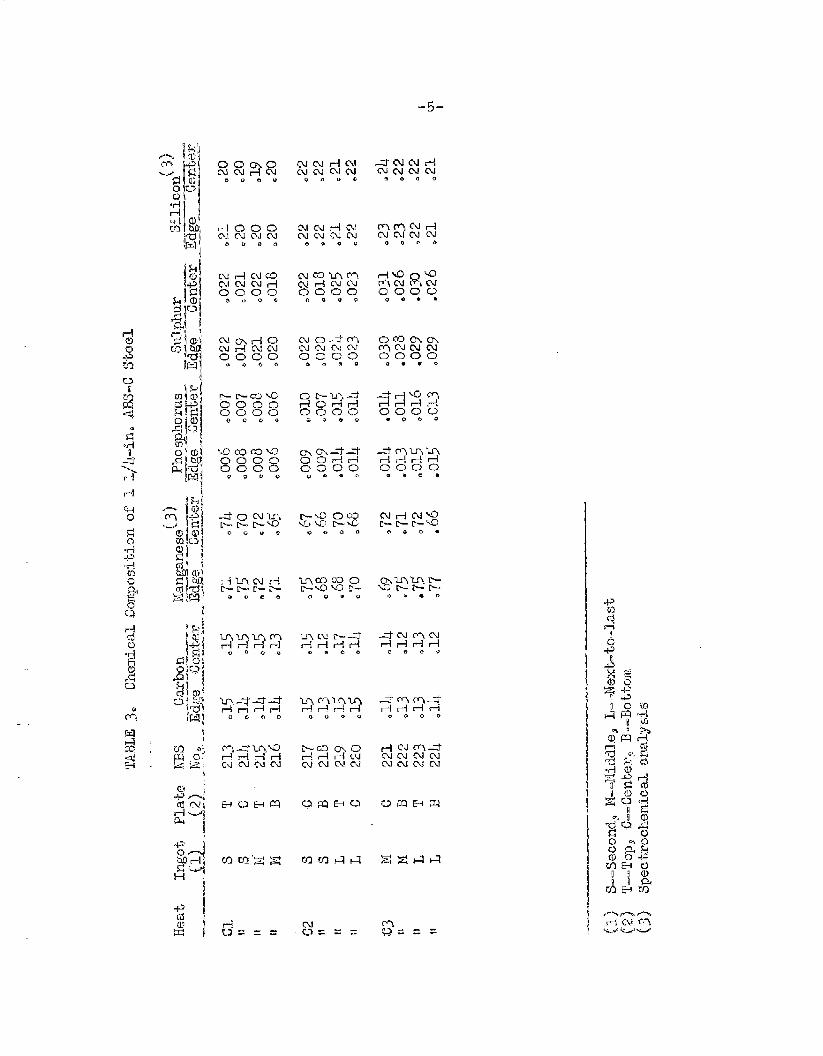
m 014 .67 .010 .025 .185 .065 .035 0020 0005 .033C?2 ::? 068 0012 .027 019 .12 004 .025 .010 .041(23 .69 .016 .033 018 ●11 0056 0030 .009 .045
(ABS Class C Requirements)39* .25max .60/090 .04max ,Ojmax .15/.301956 .24 max .60/.9o .04max .05max .15].30
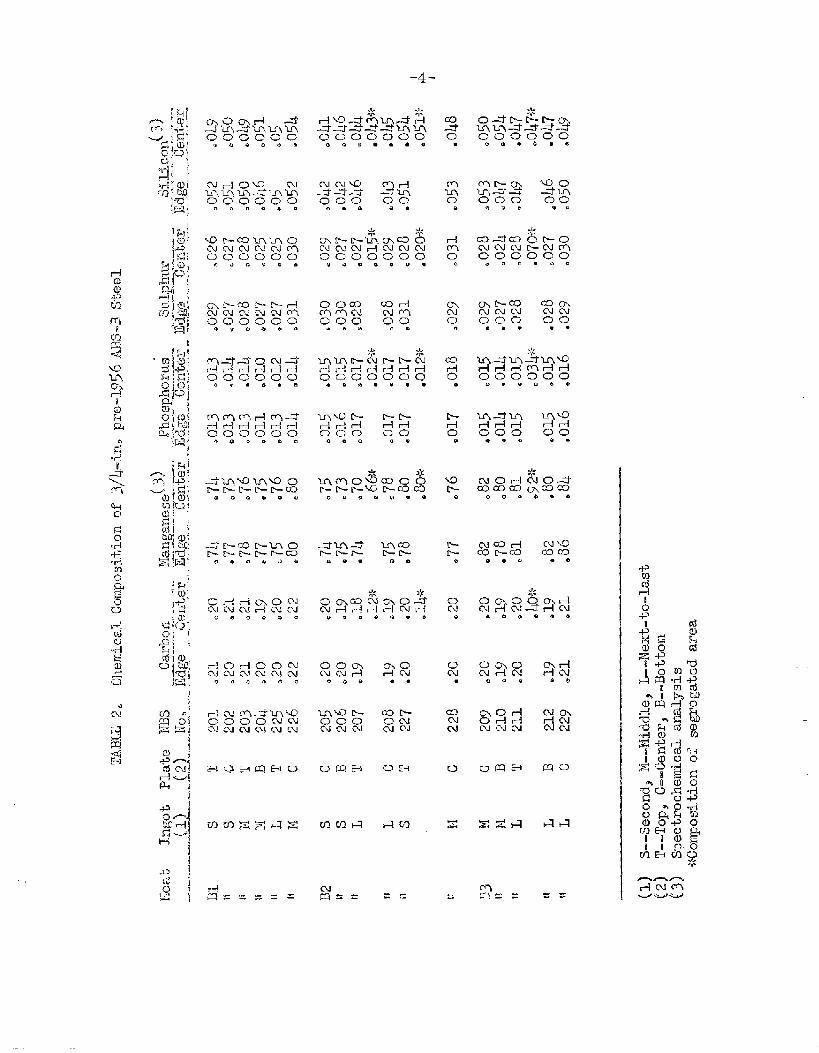
summaries of plate analyses for carbon? manganese? phos-
phorus, sulfur~ and silicon of the plates tested are given in
Tables 2 and 30
The test samples furnished by both mills were approximately
six feet in length (in the direction of rolling) by the full
plate width. However, in the event that some plates were less
than five feet in width$ the length was correspondingly increased
to provide at least thirty square feet of material.
From these test samples, a piece 18 in. long (in direction
of rolling] by half plate width (usually 40 in. to 50 in. wide]
–4 -
Cwr-lc)v.m!m.uf-ul-=i-m,mC3cooc)o..” a*.
07” 000.
mmmrlm=r-ldr-lr+r-!r-100000000,000
I
W..
,–ior-!oocuF3JCUCVCV.NN
0000a Q
OamCMcur-iO(I*
rJmE+
I-1A
-5-
s-cum+mJoJcucu
.9000
C’dar-lmlP.lcvcucveoou
l-nm~rlPJcdcwcv
Oocb
p,jmmmcurl’ ?d@JOnoooo
00
ClmmmO-j Cucuml0000
0 “80
2“2’520000.000
0000
L(CV r----ai-trlr’id
0.00
-.dCWmN,-irlt-11-l.-.0
r-mmor-!rlr+cuCuo.lmm
r-+#===
-6-
‘,1 ,, ,,,
,,, ,,, ‘1~,<,,*’ ‘. ,.
‘,, ,
a $; ‘,!“, ‘,!
;, m,“ ,,
,“
,,l“,’
*’ ● ‘!))! ‘!,” “,,!,,,
:,: .’’,’,,
“0,’,,,,,!’
F> ,j,,
‘:,p “, t , ,
‘,’’’’,,:,’, <!),,’,,’, ,,! ,,,,
-7-
,-
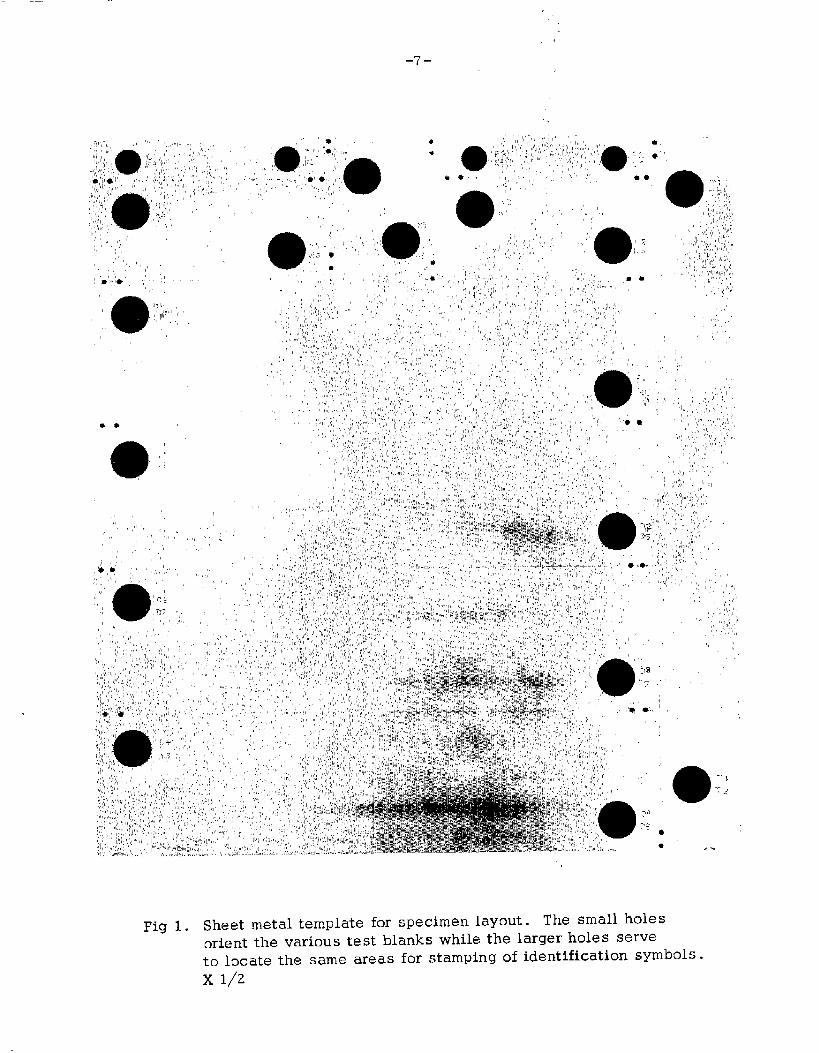
Fig 1. Sheetmetaltemplateforspecimenlayout.The smallholesorient the various test blanks while the larger holes serveto locate the same areas for stamping of identification symbols.x 1/2
-8-
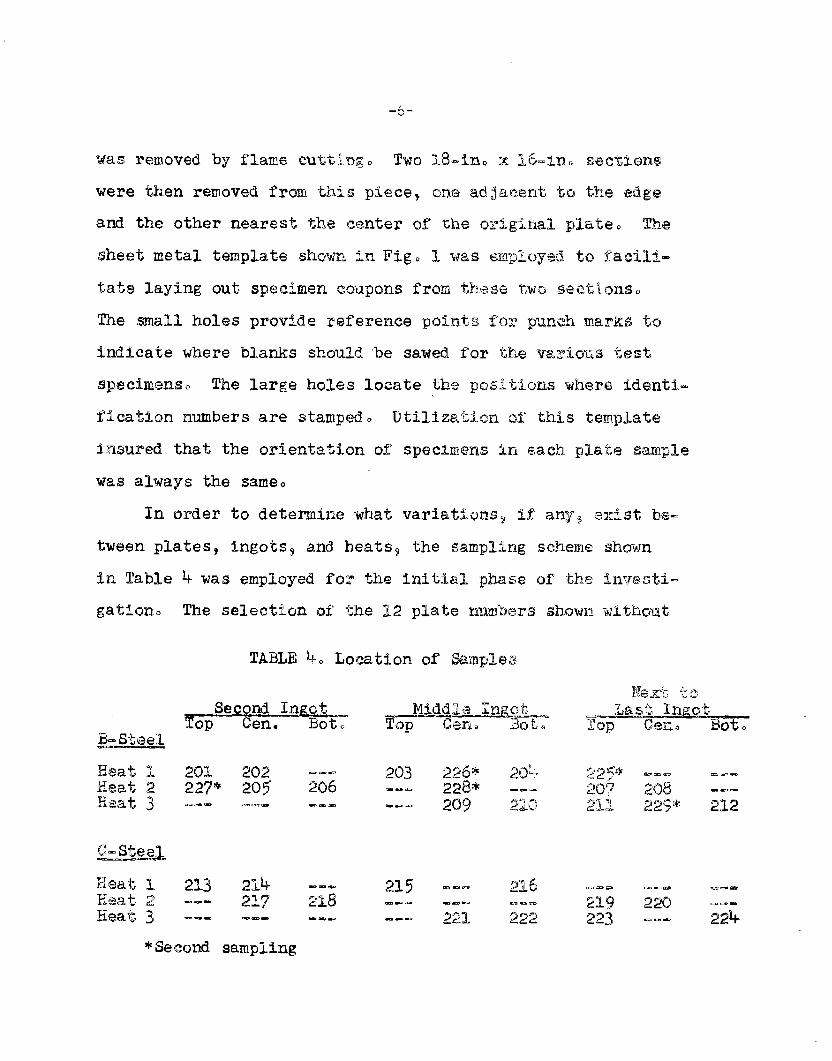
as~erisks permits Comparisons to be made between plates of
the same ~ngot, between ingots of the same heat, and between
ingots of different heats. The same sampling procedure was
followed for the B and C steels. However, in tha case of
the B heats, this plate selection was supplemented by a sec-
ond sampling indicated by asterisks in order to analyze more
rigorously the variations in this grade of steel which ex-
hibited rather marked differences in plate segregation.
Therefore, in this preliminary program, 29 plates were fully
tested. This figure represents 17 samples of B Steel and 12
of C Steel. Numbers in the table are the
code as used throughout this report. The
as shown in table 4.
111. TESTING PROCEDURE
The following tests were performed on
selected.
NBS identification
sampling scheme is
each plate sample
(al Qmact tests. Charpy V-notch impact tests
ducted on a pendulum-type 224 ft-lb capacity Charpy
were con-
machine
with a striking velocity of 16.85 ft per sec. The impact
specimens were cut parallel to the rolling direction, and the
V-notches were cut perpendicular to ths plate surface. The
dimensions were
47T for type A.
in accordance with ASTM specifications E23-
The speci~ens were immersed in a
___ .
-9-
bath* for at least 20 minutes before testing. The tempera-=
ture was carefully controlled within +.1F. Tests were made
at intervals of 10 F over a temperature range that included
energy values from 10 to 30 ft-lb. (See Appendix C).
(b) ~t@st~o All tensile tests were carried out
on a 200,000-lb capacity Riehle hydraulic testing machine.
An averaging extensometer of 8-in. gauge length was used to
obtain stress-strain curves for all full-plate thickness
coupons tested.
(c) Chemicati One blank
for analysis was obtained near the edge of each plate and
one near the center. Carbon, phosphorus, sulfur? and nickel
were determined by chemical analysis; manganese, silicon,
copper, nickel$ chromium, vanadium, molybdenum~ aluminumY
tin, titanium and arsenic by spectrochemicalmethods.
(d) Fu-@ate thic~es~ tests. Drop-weight crack starter
tests were made on each plate sample at the Naval Research Lab-
oratory. Results and discussion of these tests are given in
Appendix B.
*Fclr
For
For
temperatures
temperatures
temperatures
above k-oF--a water bath cooled withchipped ice was used.
below 40 F--a mixture of glycol and watercooled with dry ice was used.
below -30 F--a mixture of CC14 and chloro-form cooled with dry ice wasused.
-1o- ..—
MetallogradQfi g~aminati~jr. Ferrite grain si~e nea%-
were made by the Heyn Intercept Method*. In additional
a cross section of each plate was etched with ~~ Nital and ex-
~%minedto determine the d~gree of segregation. These etched
samples were located adjacent to the impact specimens and.~hus
represent accurately the degree of segregation of”the impact
specimens. Photomicrographs were taken of significant features.
IV. RESULTS AND DISCUSSION
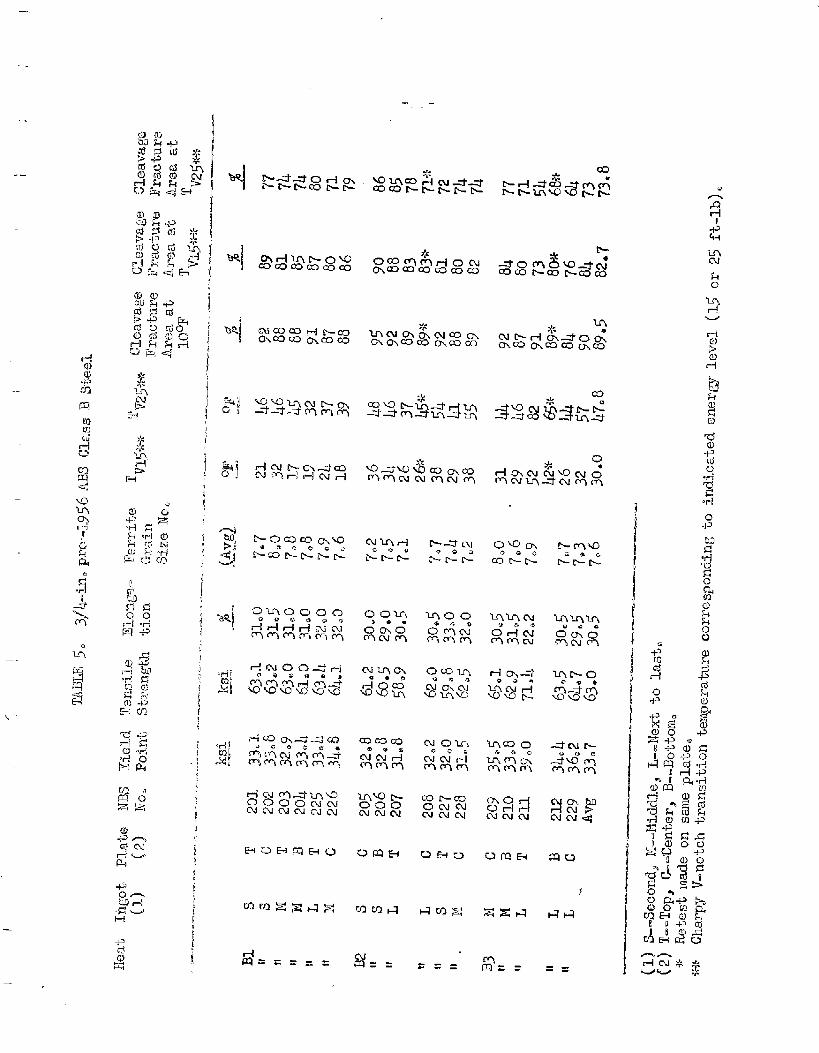
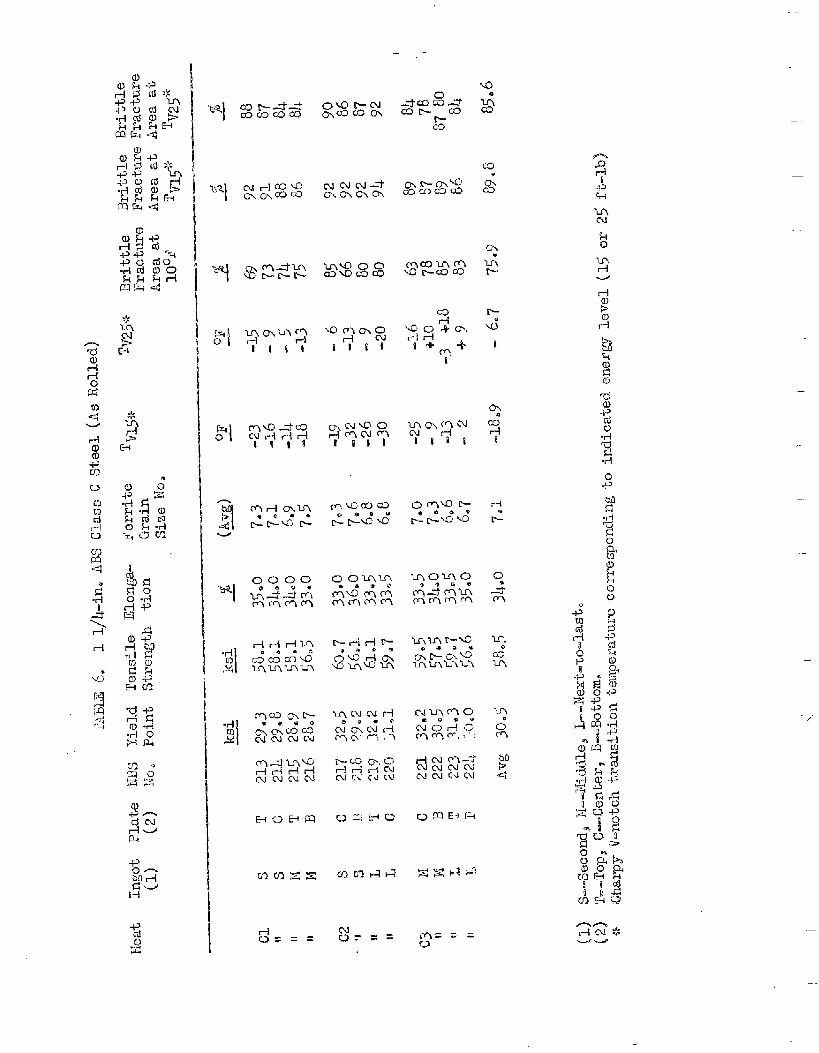
Tables 5 and 6 summarize the results of all t~sts on the
29 plate samples tested. These tables include the static prop-
erties~ ferrite grain size and impact test results? in termti
of both fracture appearance and transition temperature.
With one exception the tensile properties of all plates
were within 7% of the average and in most instances within ~%.
HoweverA B steel sample NBS No. 211 had a significantly higher
yield point and tensile strength with a corresponding:.ylower
~Wr cent elongation. The deviations from the average were lj.6q
13.4 and 27.2%? respectively. An explanation for this variation
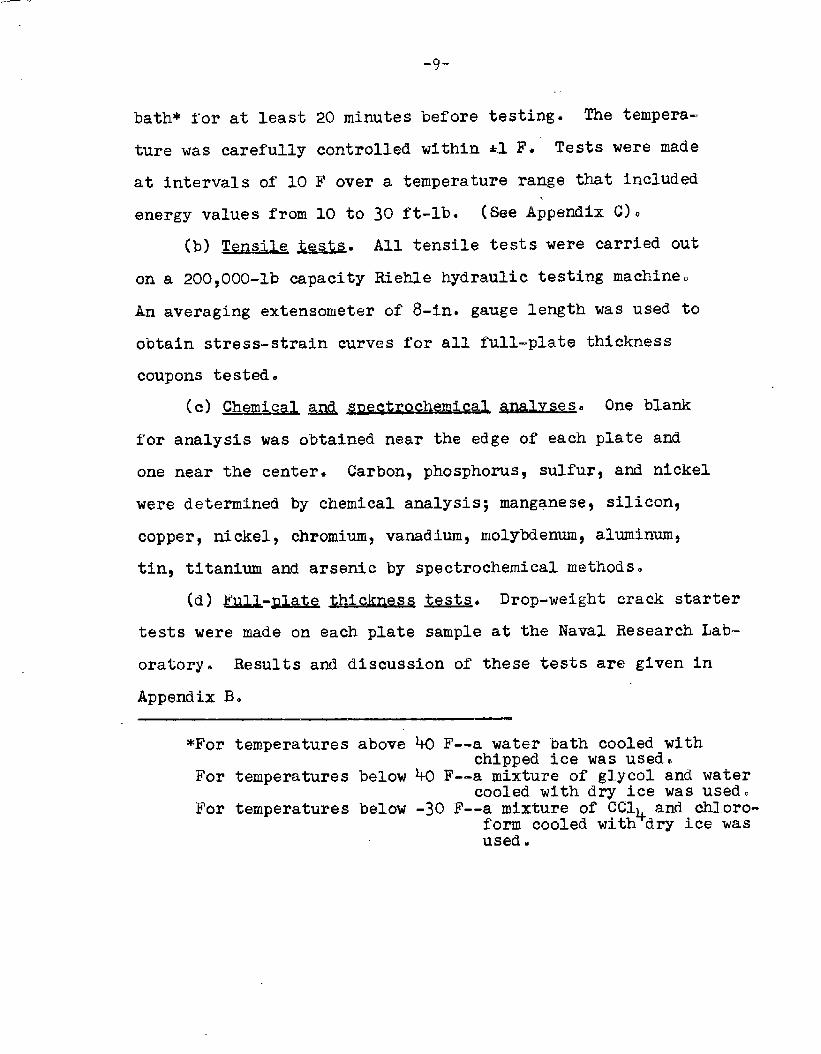
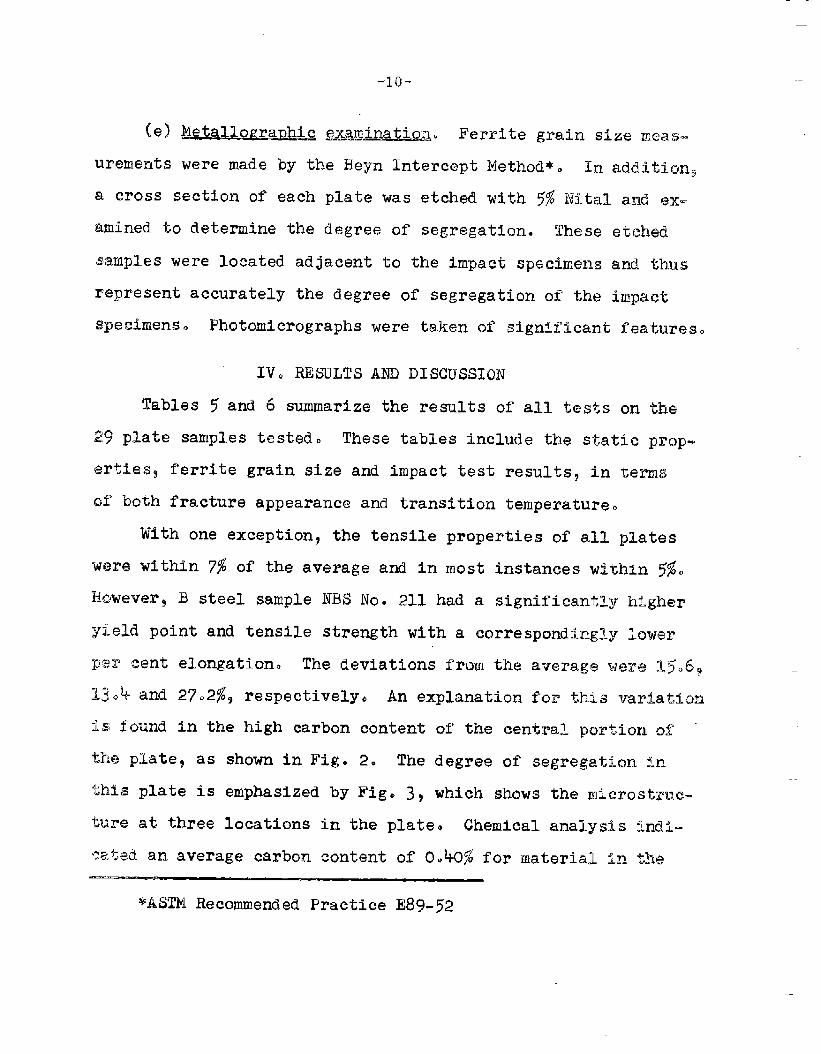
is found in the high carbon content
the plate$ as shown in Fig. 2. The
this plate is emphasized by Fig. 3,
ture at three locations in the plate. Chemical analysis indi-
l~~,t~dan average Carbon content of 0040% fOr material in t~~a
*ASTM Recommended Practice E89-52
-11-
—
—
Fig. 2. Segregation zones present in four selected cross sections removed fromplate No. 211, of A13S Class B steel (X 1). Cross section at top is fromcenter of plate, and cross section at bottom Ls from edge.
a) Zone of normal carboncontent. X 250
Fig. 3. Photomicrographs
b) Boundary betweennormal and segre -gated areas. X 100
c) Segregated zone.X 250
representing the cross-section of plate No. 211.
.
.—

..1
Fig. 4. Negative segregation of etch blanks from four locations acrossplate 207, of AES Class E steel, X 1. cross section at top isfrom center of plate, and cross section at bottom is from edge .
“~, !?, ‘ ~’ :’, ,;’ ,,
,’,,,~ ,:) ,,, , ,,’,’,’ ., ,:;,,,,”,,’“!. ,,’ ,,
“,,,,’,,?, ,,:
,,:11;:,’!, ,’!
,,,!, ,
‘~t!,, , ., :,,’ “ $/, ‘,’,,,,)”, “/!’/, , ,,
:!’,, >,l>, >,$, >,,,;:$ ‘::,-,, ,,,”
‘1 ,? ‘)x’+%”,‘,,!,’,, ‘, ,, ‘,;!,<,)!),,,) ,,’:
‘,’,,’,,,
Fig. 5. Segregation bands in etch blanks from four locations acrosspldte 203, of ABS Class B steel, X 1. Cross section at top is
from center of plate, and cross section at bottom is from edge .
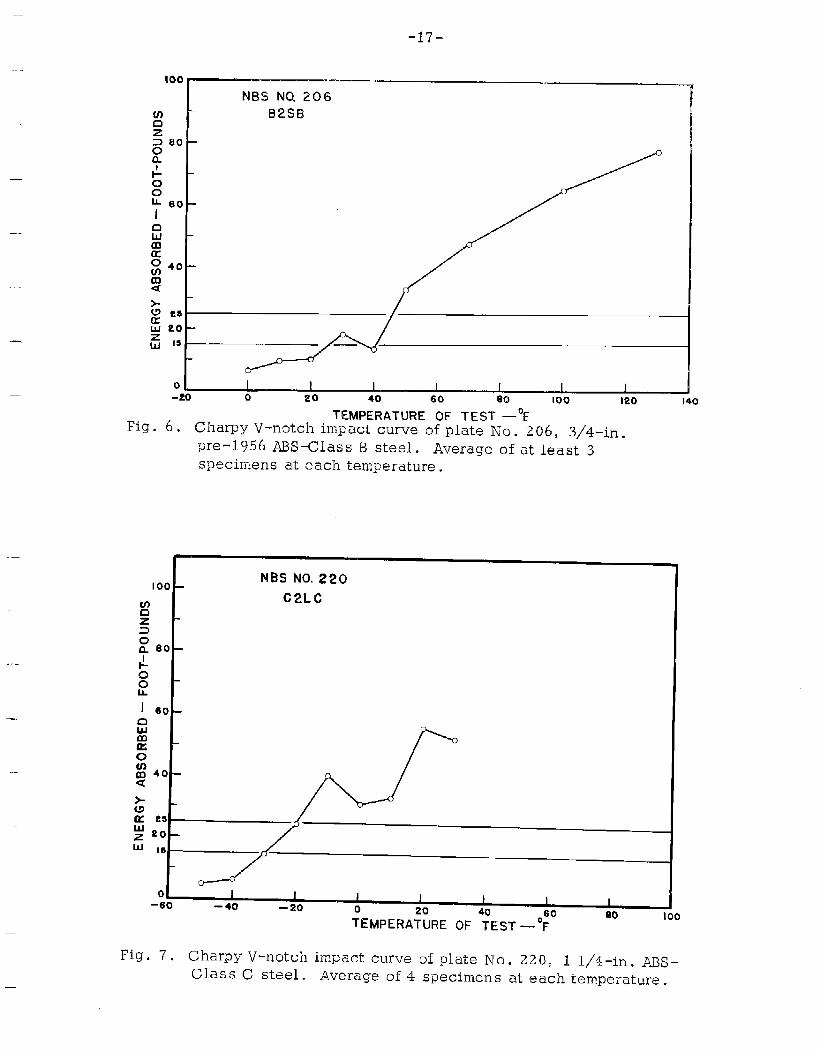
of the majority of samples tested. This reversal sometimes
made it difficult to assign transition temperatures corre-
sponding to the 15 and 25 ft-lb energY le~elso The transi-
tion temperatures listed in Tables j and 6 were therefore
obtained by connecting the midpoints of the straight lines
aS shown for typical cases in FiEso 6 ad 7° These trar@-
tion temperatures differ slightly from those obtained by
fitting a quadratic to the datat as discussed in the sta-
tistical supplement (Appendix A) at the end of this report$
prepared by Dr. Youden and co-workers.
It will be noted that plate No; 211, which had the high
carbon segregation, also had significantly higher transition
temperatures for both energy levels than the respective aver-
ages of all the plateso It is somewhat surprising that~
while the B steels exhibited far more segregation and laminated*
impact specimens from all but one plate tested$ the dispersion
of the Charpy data from these plates was less than that from
the C steels. Only three of the C steel plates showed laminated
~racture~ andY as was observed earlierq they displayed re~ati~elY
slight segregation effects.
The precise roLe that segregation and laminations play in
affecting the notch toughness characteristics is difficult to say
-..
*An impact specimen was ~Onsldered to be laminated when itwas observed to have a split in the fracture surface in a planeparallel to the plate surf%ee~
-_
. .-
-s
-—
c mu
—
--
—
r-l-l rlE-
,&&’~”& —
..
I
.
..- m4[
i!!
.NBS IW. 206
B2SIB
80 —
60 -
40 -
ZsZo-Is
01 I I I I 1 I I-20 0 20 40 60 80 100 120 140
TEMPERATURE OF TEST —%6. Charpy V-notch impact curve of plate No. 206, 3/4-in.
pre-1956 ABS-Class B ste:l. Average of at least 3specirriens at each temperature .
NBS NO, 220
C2LC
JT--/h--”
01 1 I I–60
I-40
I-20
I I
Eio II%h4PERA%E OF 4~E5J — ‘g”
Fig.7. Charpy V-notch impact curve of plate No. 220, 1 l/4-in. ABS -Class C steel. Average of 4 specimens at each temperature.
-18-’
—
—.
—.
.
—“..
.—
..—
.
—
.
—
—
-19-
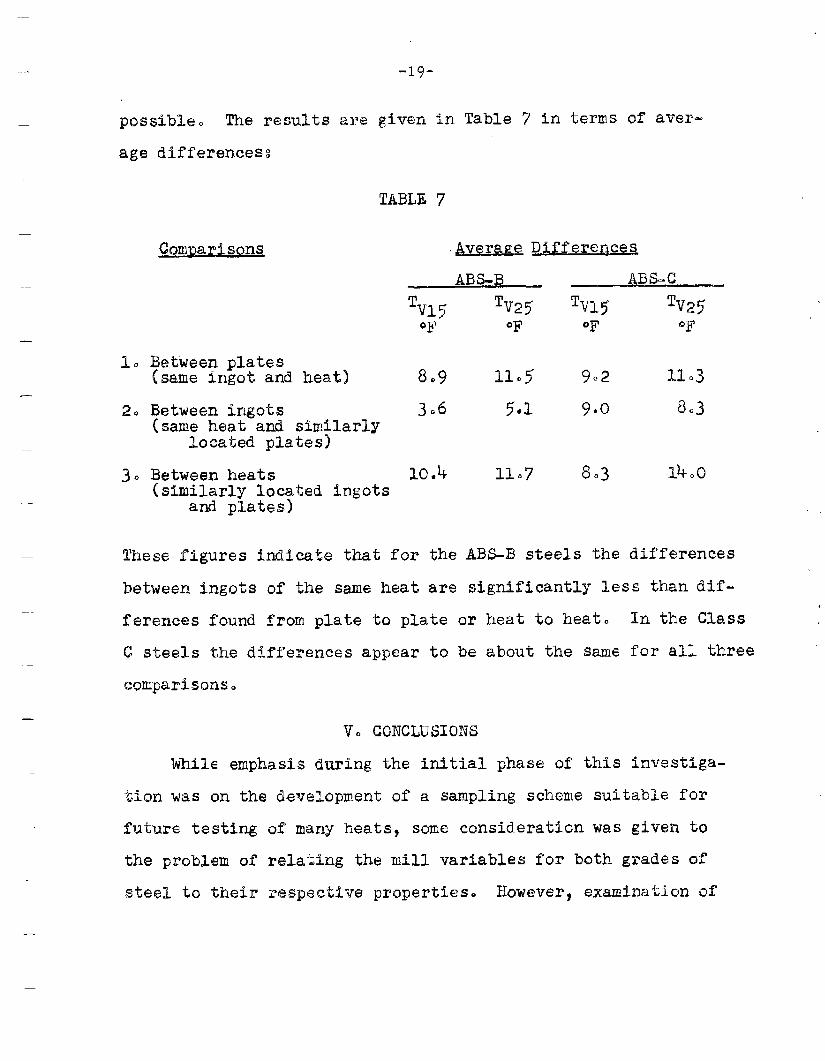
possible. The results are given in Table 7 in terms of aver-
age differences:
10
20
3.
AB$-B
*V15 TV25OF OF
Between plates(sane ingot and heat] 8.9 11OJ
Between ir~gots 3.6 5*3(same heat and similarly
located plates]
Betweeu heats 10.4 11.7(similarly located ingots
and plates)
These figures indicate that for the ABS-B steels the differences
between ingots of the same heat are significantly less than dif-
ferences found from plate to plate or heat to heat. In the Class
C steels the diffe~ences appear to be about the same for all three
comparisons.
V. CONCLUSIONS
While emphasis during the initial phase of this investiga-
tion was on the development of a sampling scheme suitable for
future testing of many heats, some consideration was given to
the proble?.nof relating the mill variables for both grades of
steel to their respective properties However, examination of
—
-20-
the r.uilldata sheets brou,rhtout the fact that both mills
emplay~d rather uniform p~ac~~ces ~n. the
heats; and consequently studies of such
deferred until a greater variety of data
A statistical evaluation of the results obtained on
these steels indicates that selection of at least two plates
from the same ingot would provide satisfactory informati~n
on the characteristics of a heat. Howwer, as pointed out
in Appendix A, it would be desirable to test an additional
plate from the same ingot and thus allow a better evaluation
of the uniformity of the heat.
.
—
——
—.
-—
-.—
,.
STATISTICAL ENALUATIIJNOF AM-B AND AILS-C STEEL DATA
W. J. YuudenY M. Natrdlah and J. M. Cameron
SARiPLINGP,ROGRAN
The initial hvestigat~on d ship steel plates was directed
toward devising a sampling scheme that would economically reveal.
the variation in properties among heatsa among ingot~ from tlh~
sam~ heat~ and among plates from the same hgot~ The mc)xwbaats
sampled for a given type and source of steel, the rmre certain
would be &E evaluation of the production process. On the other
hand? it is also necessary to make sure that the examination
given each ‘heatwill be intensive enough to give reliable values
for the heat. It was essential to avoid oversampling a heat in
order to “beable to spread the total number of plates in the
program over various types and sources of steel.
—
.
—
.
.
.-..
—
—
.—
—
-23-.-
.-
—
——
.
—
.
,—
.—
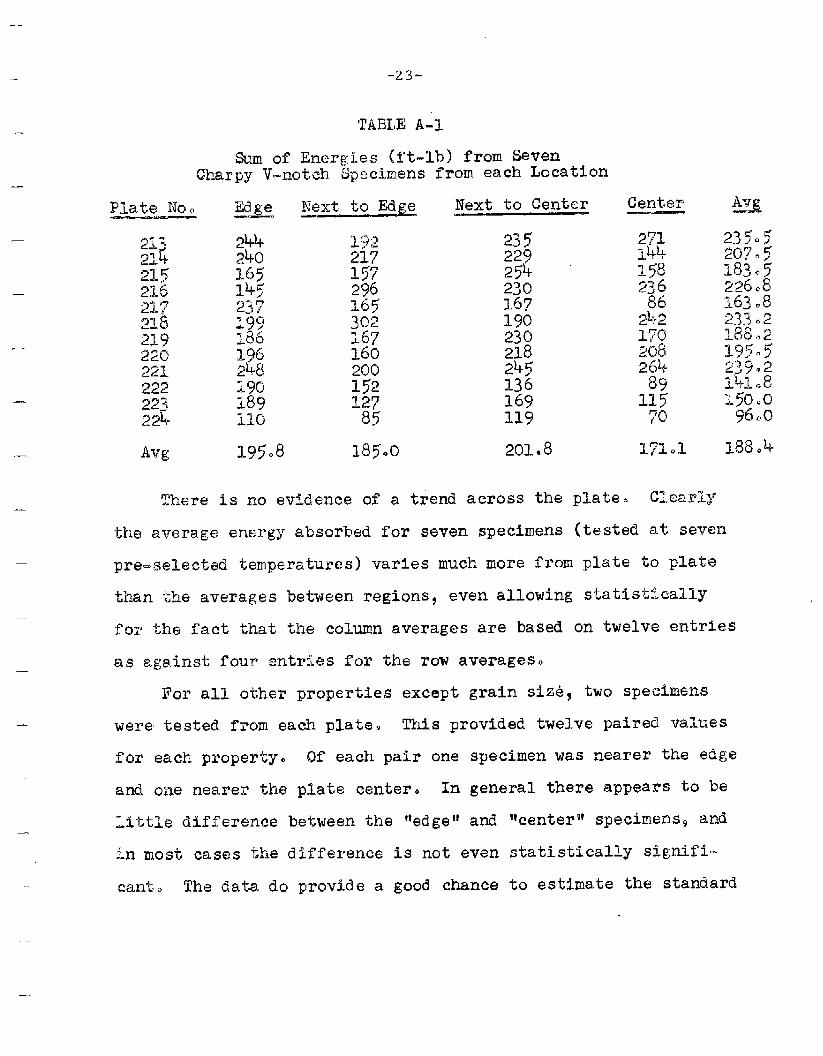
TABLE A-1
WKKIof llner~ies(ft-lb) from Seven.,,,Charpy V-notch Specimens
Plate No. Edge Next to Edge——.
21922022122222322b
199186
~y2
217157’29616530216716020315212785
Avg 19J.8 185+0
Next to Center
;;;
&230167190230218245136169119
201e8
Centqer
1~8!.23686
There is no evidence of a t~end across the plate. Clearly
the average energy absorbed for seven $pecinens (tested at seven
pre-selected ~emperatures) varies much more r~~m plate ~0 P~a~s
than the averages between regions, even allowing statistically
for the fact that the column averages are based on twelve entries
as against four entries for the row averages.
For all other properties except grain size, two specimens
were tested from each plate. This provided twelve paired values
for each property. Of each pair one specimen was nearer the edge
and ofienearer the plate center. In general there appears to be
little difference between the ??edgettand ~lcenter~~specimens~ and
in most cases the difference is not even statistically signifi-
cant. The data do provide a good chance to estimate the standard
deviation of a single test (based on 11 degrees of freedom).
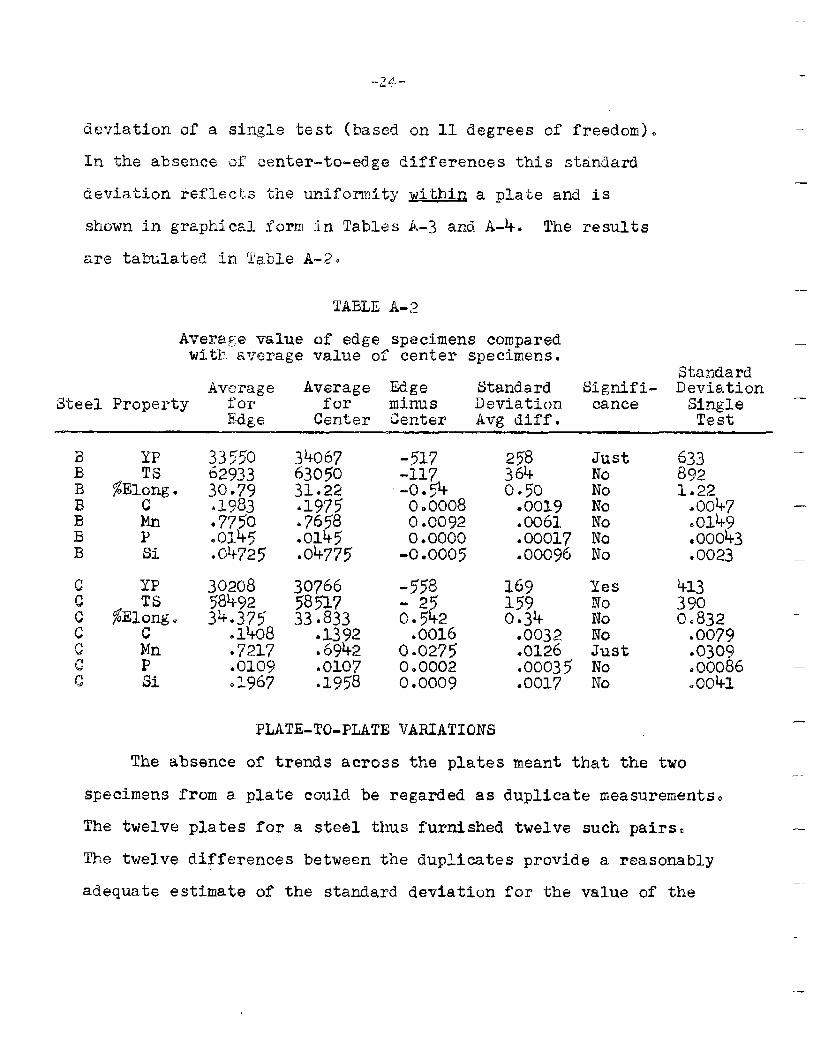
In the absenne of wantem-to-edge differences this standard
deviation ieflects the uniformity withilga plate and is
shown in graphical. ~orm in Tables A-3 and. A-4. The results
are tabulated M Table A-2,
TABLE A-2
Avera~s value of edge spacimens comparedWitiklaverage value of center specimens.
StanclardAverage Av@rage Edge Standard Signifi- Ileviation
Steel Property for for minus Deviation cance SingleEdge center ~entez’ Avg cliff. Test
YPTS
ZElong.cMnPtli
YPTS
fililong.cMnPSi
:Jg
30.79*1983● 775Q.0145.04725
30208584923k*375
.1408
.7217
.0109
.1967
.04775
307665851733.833
.1392,6942.0107.3.958
-517-117-O*%0.0008O.00$.Po ●0000-0.0005
-558- 250 ● 542.0016
p::;
0:0009
2583640.50.0019.0061●00017●00096
1691590.34.0032.0126●0003540017
JustNoNoNoNoNcJNo
YesNoNoNoJustNoNo
533,3921.22
●0047
—
.
—
—
4=133900.832 —
●0079.0309SOO086.Ookl
PLATE-TO-PLATE VARIATIONS.
The absence of trends across the plates meant that the two
specimens from a plate could be regarded as duplicate measurements.
The twelve plates for a steel thus furnished twelve such pairs, .
The twelve differences between the duplicates provide a reasonably
adequate estimate @ the standard deviation for the value of the
-25-
—
—
—
—,
property being considered~ This standard deviation gives a
measure or the minimum variabion. that could be ackd.eved for
the property if differences between heatsg differences be-
tween ingots, and differences arising from the part of the
ingot sampled could be eliminated ~Q obtain limits wit~in
which around 95 per-cent of individual results might be ex-
pected to lie? it is conv~nticmal to add and subtract tw~ce
the
age
standard deviation to the average value.
Tables A-3 and A-4.show on a horizontal line the aver-
value of the property, Short vertical marks extending
QQYQ the h~~i~o~~al line ~esiwate thI= liDIits~~s@ On twostandard deviat~ons above and below the average value. In
most cases there are individual measurements that fall out-
side thess limits. The maximum and minimum values have been
located by short vertical lines crosa~.g the horizontal Iineo
Attached to each of these,vertical lines is the cade number
(See Table k of main report) of the plate frornwhich the
specimen came9 together with the letter E or C to designate
whether the specimen came from the edge or center of this
plate. (Sometimes two or more plates gave rise to the same
maximum or minimum values, All plate numbers are shown fo~
these cases).
On the chart particular attention should be given to
those minimums and maximums that fall considerably beyond the
Iinits of plus and minus two standard deviations. For the B
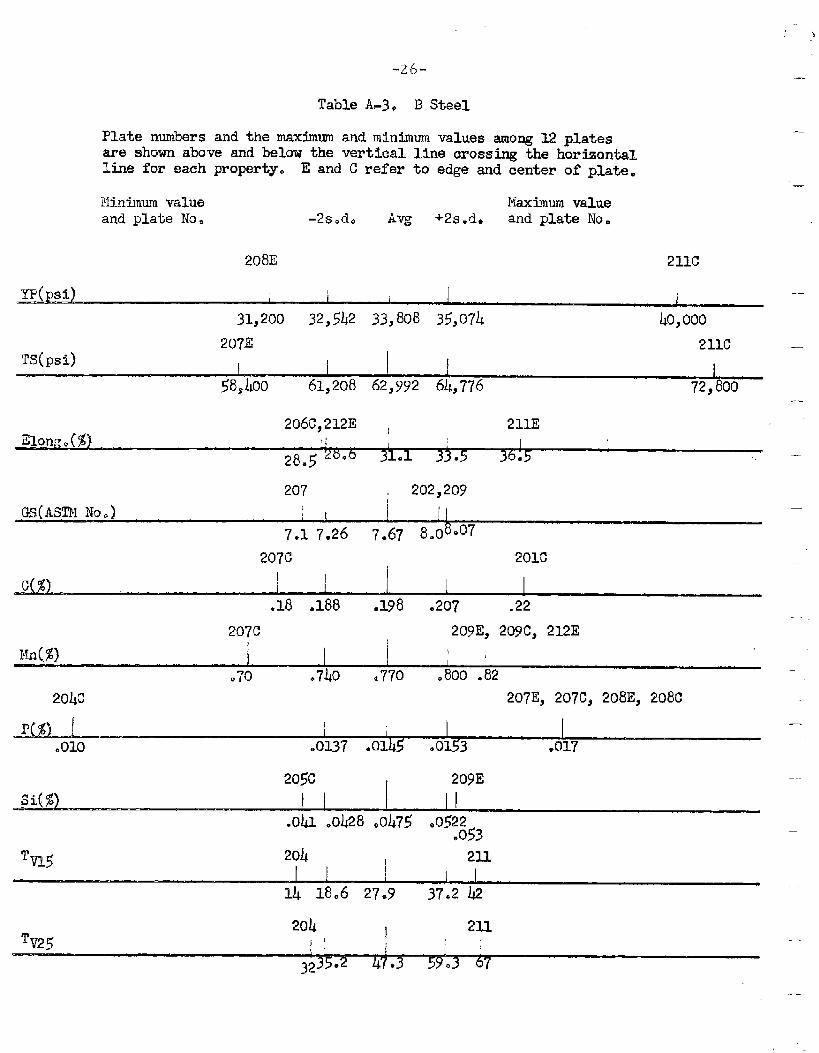
-26-
Table A-3,, B Steel
Plate numbers and the maximumand minimum values among 12 platesareshownaboveandbelowtheverticall,inecrossingthehorizontallineforeachproperty.E andC referto edgeandcenterof plate.
Minimwnvalue MaxtiurnvalueandplateNo. -2s.d. Avg +2s.d* andplateNo.
-—.
.
208E 211C
WJJJsiJ 1I I 1
31,200 32,542 33,808 35’2074 40,000
2Q7E 211CTS(psi)
J 158,400 61,208 62,792 64,776 72,800
207 202,209
GS(ASTt! No.) [ I
7.17.26 7*67 8.o~*07
207G 201C
C(jg) I
.18 .188 .298 .20? .22
207C 209E,2Q9c,212EI
Mn(%? i1
070 .740 .770 .i300.82
204c 207EJ 207C3 208EI 208C
P(%) I --I
0010 .0137 .0145 .0153 .017
205C 209E~~(fj) I II
.Ohl.ok2800.47500522.053 —
%5 204 211I I
4 18.6 27.9 37.2 .@
204 211%25
!,,\[
323~”2 47’*3 59.3 6[
-—
.-
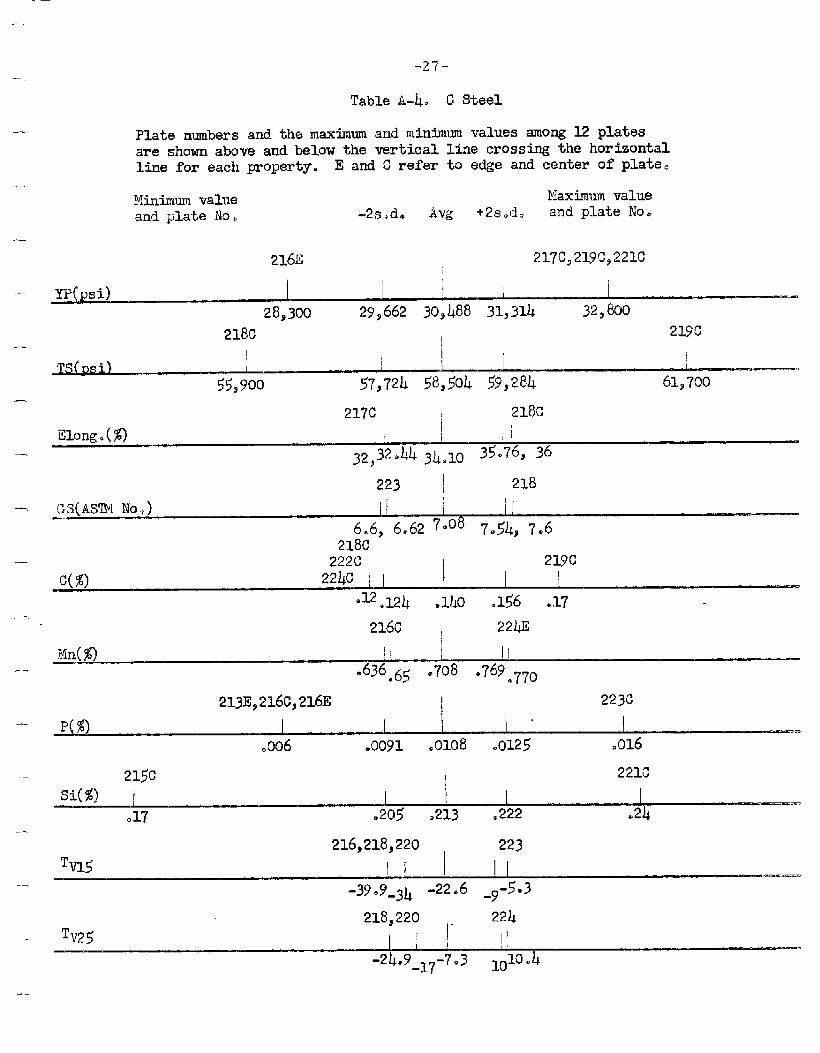
-z7-—.
—
TableA-h. C steel
Platemmbers and themaxhm+mandmintiumvaluesamong12 platesareshownaboveandbelowtheverticallinecrossingthehorizontallineforeachproperty.E andC referto edgeandcenterof plate.
l!inimmvalue Maximumvalueand @ate No. -~S ,d. Avg +2~Od0 and plate No*
..—
2161z 217’c,219cj221Cl
-—
.—
-.
—
-..
-.
r-
.-
.-
1
YP(psi) !
28~300 29,662 30,448 31,31L 32,800
218C 219CII ( 1
TS(yi) I .—
55,900 57,724 !%,504 59,284 61,;00
217C 1 21i3G
Elongd($) ,,
j2,320~434.10 3~076Y36
223 ! 218
L5(ASTY1No,)I
-.6.6,6.627*08 7054,7.6
218G222C I 219c
C($4) 221& I*12.124 .140 .156 .17
216c , 224E
Mn(%) I !
.636065.708 .769~770
213E5216C,2161Z ! 223c
~..)
.006 .0091 .0108 .0125 .016
215CI
221C
Si(x) 1*17 .205 .213~ .222
216,218,220 223
224
.—
-28-
.—.
shsel extreme values are equally divided between edge and
center specim~ns~ ‘whereas center specimens predominate among
the naximums for the C steel, Plates from the top of the
ingot furnish most of these extremely high or low values.
Either center cm bottom plates run more true to form, One
might conclude that plates from the middle or bottom of the
iugot would be more representative in the sens’e of approximat-
i~g the heat. Equally~ if it Is desired to detect a lack of
uniformity in the producty the top plates are more likely to
serve as indicators. Therefore, two plates--one of them from
the top and the other from either the center or bottom--would
reveal by their disparity the lack of uniformity.
The two charts are shown facing to facilitate cross com-
parison of the steels. It is instructive to note? for examplea
—
—.
.
-
that silicon is much more uniform in the B steel than in the
C steel. A very large number of such comparisons can be made,
many of which may be of no particular metallurgical improtanae.
The attempt has been made to present the data in such a way
‘thatanswers can be found to many inquiries t“hatmight be proposed. -.
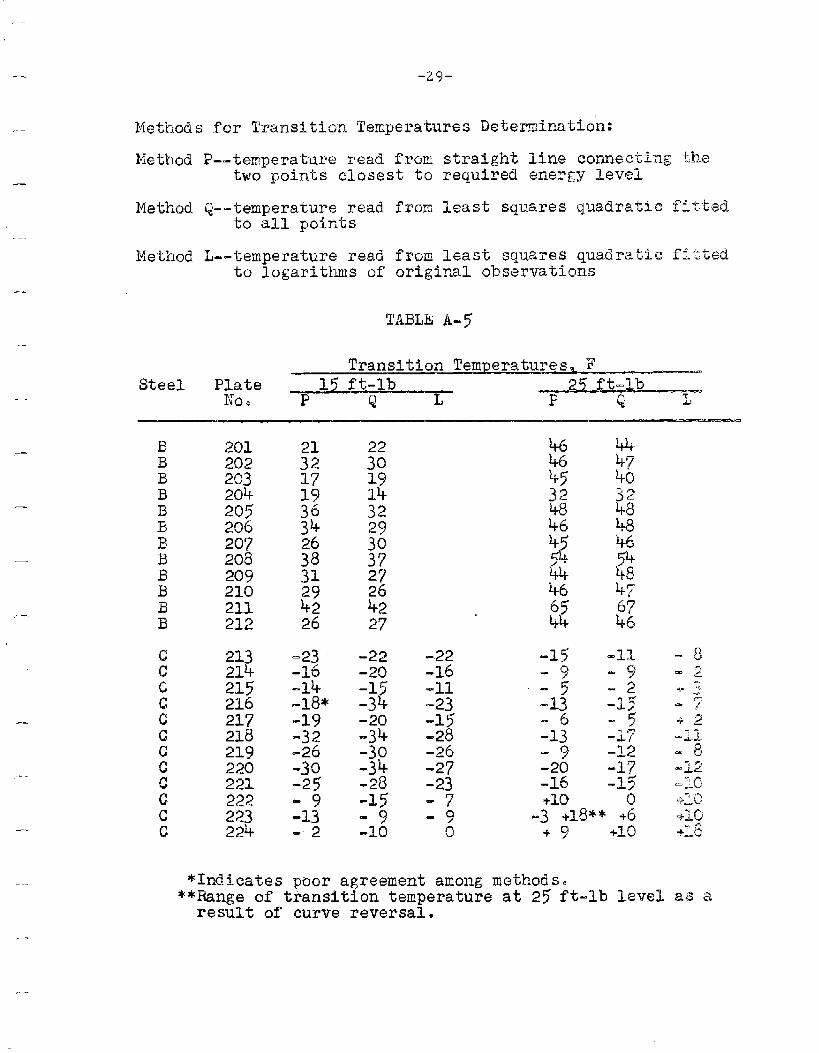
DETERMINATION OF TRANSITION TEMPEJUiTUdES
One of the by-products of the study was a comparison of
various methods of interpolation to get transition temperature~
as shown in Table A-5. Given reasonably smooth data, simple
-—
. ..-
---
.. .
—
.—.
-.
-.
---
—
—
,.—,
. .
---.
,.. .
-..
.-
-.
-29-
Methods for Transition Temperatures Iletermination:
Method P--temperature read from straight line cm.netting thetwo points closest to required ene~~y level
Method +-temperature read from least squares quadratic fit.td,to all points
~~ethodL--temperature read fmm least squares quadratic fi.’fitedto logarithms of original observations
TABLE A-5
Transition Temperatures, FSteel Plate __A5.JW-lb ~’
Noo P ‘Q L P Q ~-
BBBBBBBBBB
:
201202203204205206207208209210211212
213214215216217218219220221222223224
~;
1936;;
383129;;
-23-16-14.18*-19-32-26-30-25“9-13-.2
%19143229303727264227
-22-20-15-34-20---;
+$
-15=--:
-.22-16-11-23-15-28-26-27-23-7-90
46 4446 4745 40;; 32
48
~Inc?tcatespoor agreement among methods.**Range of tramxttion temperature at 25 ft-lb level as arestiltof curve reversai.
-3c -
Ilnear interpolation is satisfactory. In certain cases it ap-
pears desirable to ftt a curve and make use of points other
than those hmed.iately adjacent to the interpolated value. The
methods are usually in good agreement$ ‘but occasionally the
linear Interpolation gives rise to difficulty.
CONCLUSIOITS
Finally, the remarks below should provide a guide for future
sampling of heats. Ingot identity IS unimportant (with the pos-
sible exception of first and last fngots, which were not included
in the scope of this sampling program). Plate position within
the Ingot is important. ‘l’hegeneral level of a property is well
represented by a plate from the center of an ingot. Extreme
values, if present, occur chiefly in top plates. The inclusion
of a top plate in sampling a heat depends on the importance at-
tached to detecting the existence of plates most divergent from
the general average.
The sampling scheme used in the work thus far was planned
to serve as a guide ior sampling additional heats and plates.
The statistical analysis points to less variation between plates
from comparable positions in &&fferent ingots than is round be-
tween plates from dii’ferentpositions in the $am~ ingot. Visual
observation of segregation confirms this view. It was found
thata for the B steel, segregation was present in all top and
center plates and very slightly in one bottom plate. Faint
. ..
—
-..
—
-.
——
.—
- .
..-
— —-
.-
.-
...-. -31-
... .
—
-.—
..-
-- ..
segregation was observed in two of the three heats d“ C slx?d.
and then only in the top and center plates.
Not less than two plates should be tak~n to characterize
a heat of steel. They should be fron th~ same Ingot. A pair
of locations such as top and center (or top and bottom) of
the ingot will be most likely to bring to light lack of uni-
formity in the product. Uniformity is as important as the
average in evaluating the product. Three platesq rather than
two, from the same ingot would double the information on uni-
formity. If the scope of the investigation permits? three
plates are recommended to characterize a heat of ste~l.
—.
.—
,...
.-
,-
ABS-G STEELS
Study” ) Wi2S e stab-
Identical steel numbers and code designations as established by NBS ,,are
used to idenliiy these plates..(1,2)
Detailed procedures for drop-weight ~ests have been described .
Briefly, test conditions are adjusted so as to normalize variables involving
sleel strengths, specimen tyhic,kness, dimensions etc. , and thus ~e~mit
the measurement Of the same par~rneter (i.e. , ductility in the presence of
a crack) for all steels. The nil-ductility transition (NDT) temperatures
determined in the standard drop-weight test have been related to the tem-
peratures at and belmv which brittle-fracture initiation becomes potentially
POSsible in conventional engineering structures. This relationship has
been established by cc~rnparison cd test results with service performance.
. .
—
-.
-..
—
.-
—.
--
.-
....
—
-—
---
. ..
.—
.-..
,-—
—.
..-
-33-
The NDT temperature was also found to correlate with the ternp~ratures for
Charpy V energies of 3 to lCI ft-lb (usually within the range 5 to 7 ft-lb) for(2, 3,4)
World War II ship plate steels . Similar studies for fully killed and(4, 5, 6);
medium-alloy steels indicated that 10 ft-lb index was not general
such steels were found to correlate with index values of 20 ft–lb or higher.
The se predictions have since been corroborated
failure material for three low alloy steels where
tures corresponded to approximately the Charpy
all three steels involved.
by investigations of service-
the failure initiation tempera–
V 20 ft-lb temperatures of
Correlations of NDT with Charpy V re suits have been predicated upon
relationships to the average (faired-position) Charpy transition curves. The
inherent variations observed in tests of different grades of steels have demons-
trated that the determination of the complete Charpy V transition curve is(.6]preferable to the use of single-temperature or limited-temperature tests .
With the use of well–defined average Charpy V curves (2 or more specimens
te steal at each 20 F interval in the transition region) the NDT temperatures
established for a particular grade of steel are observed to correspond to a
range of Charpy values.
Normally, 6 to8 drop-weightspecimensarerequiredtoestablishthe
nil-ductilitytransition(NDT)temperaturetoan accuracyof ~ 10 F. However,
it was believed that NDT temperatures could be established reliably with the
aid of Charpy V correlations and only 4 specimens from the edge and center
regions of each plate. Accordingly, drop-weight tests of these plates were
not started until Charpy V data were obtained from the NBS.
For all except one (No. 225) of the ABS-B steels, the NBS Charpy tests
were conducted over a temperature range sufficient to develop complete tran-
sition curves for these steels. From the average (faired–position) curves
drawn with the NBS data, the range of temperatures correlating approximately
‘—
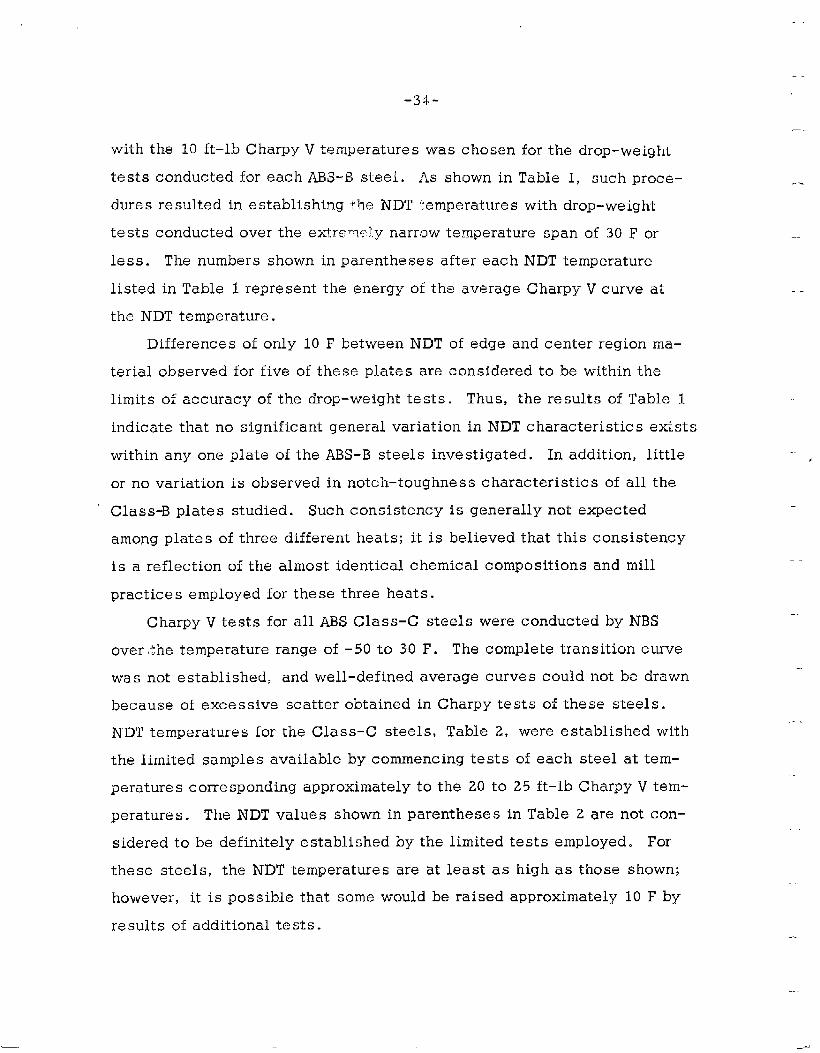
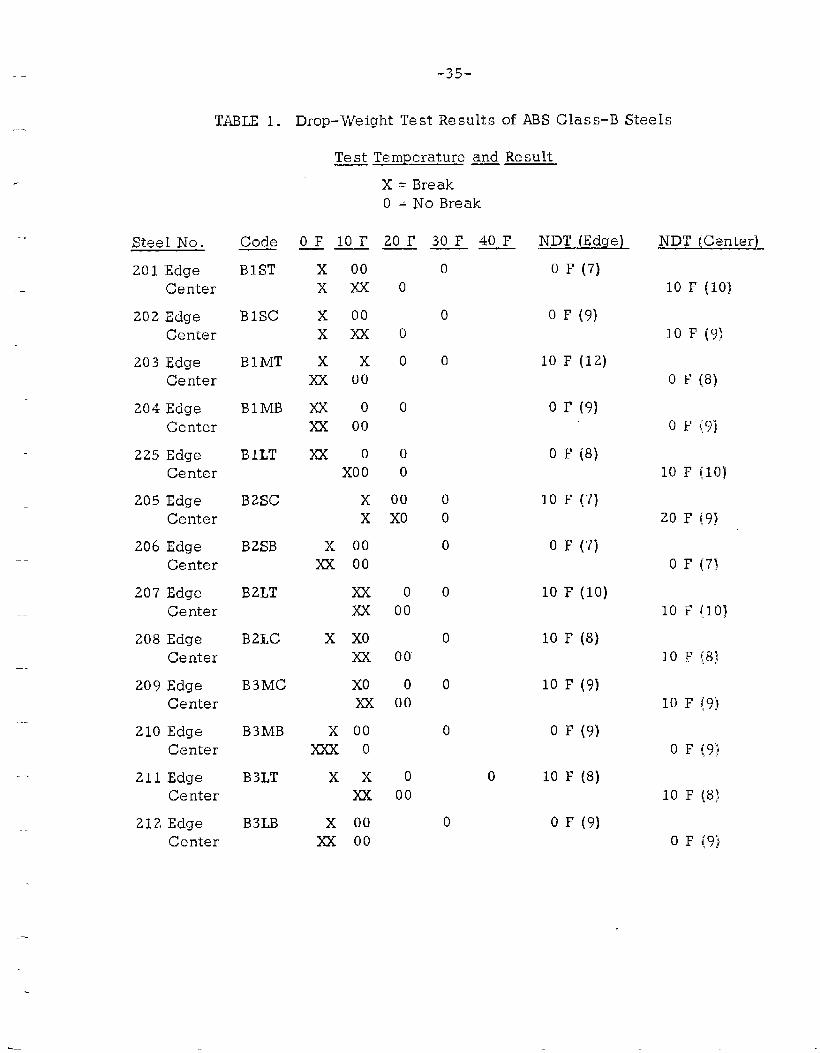
with the 10 ft–lb Charpy V temperatures was chosen for the drop-weight
tests conducted for each ABS-E! steel. As shown in Table 1, such proce–
dures re suited in establishing !’!w NDT temperatures with drop-weight
tests conducted over the exl:remm?,y narrow temperature span of 30 F or
less. The numbers shown in parentheses after each NDT temperature
listed in Table 1 represent the energy of the average Charpy V curve at
the NDT temperature.
Differences of only 10 F between NDT of edge and center region rna–
terial observed for five of these plates are considered to be within the
limits of accuracy of the drop–weight tests. Thus, the results of Table 1
indicate that no significant general variation in NDT characteristics eti. sts
within any one plate of the ABS-B steels investigated. In addition, little
or no variation is observed in notch–toughne ss characteristics of all the
“ Class-B plates studied. Such consistency is generally not expected
among plates of three different heats; it is believed that this consistency
is a reflection of the almost identical chemical compositions and mill
practices employed for these three heats.
Charpy V tests for all ABS Class-C steels were conducted by NBS
over the temperature range of –50 to 30 F. The complete transition curve
was not established, and well-clef ined average curves could not be drawn
because of excessive scatter obtained in Charpy tests of these steels.
NDT temperatures for the Class-C steels, Table 2, were established with
the limited samples available by commencing tests of each steel at tem-
peratures corre spending approximately to the 20 to 25 ft–lb Charpy V tem-
peratures. The NDT values shown in parenthesess in Table 2 are not con-
sidered to be definitely established by the limited tests employed. For
t’hese steels, the NDT temperatures are at least as high as those shown;
however, it is possible that some would be raised approximately 10 F by
re suits of additional tests.
—.
—.
...
..
. ...
SteelNo.
201 EdgeCenter
X = BreakO = No Break
OF1OF 20F 30F 40F.— —— —
x 00
Xxxo
x 00
Xmo
Xxo
xx 00
=00
m 00
mooXoo o
x 00
x Xo
x 00x 00
no
m 00
x Xo
m 00
Xo om 00
x 00
mwo
Xxoxi 00
x 00xx 00
0
0
0
0
0
0
0
0
0
0
0
0
NDT (Edqe)
O F (7)
O F (9)
10 F (12)
O F (9]
O F (8)
10 F (7)
O F (7)
10 F (10)
10 F (8)
10 F (9)
O F (9)
10 F (8)
O F (9)
NDT (,Center)
10 I’ (10]
10F (9)
O F (8)
O F (9)
10 F (10)
20 F (9)
0 F (7]
10 F (10)
10 F’ (8)
10 F (9)
O F {9)
10F (8)
O F {9)
-35-
TABLE 1. Drop-Weight Test Results of ABS Glass-B Steels
202EdgeCenter
203EdgeCenter
204EdgeCenter
225EdgeCenter
205EdgeCenter
206EdgeCenter
207 EdgeCenter
208 EdgeCenter
209EdgeCenter
210 EdgeCenter
211 Edge
Center
212 EdgeCenter
Code
BIST
Blsc
BIMT
BIMB
BILT
B2SC
B2SB
B2LT
B2LC
B3MC
B3MB
B3LT
B3LB
Test Temperature and Re suit
<.-
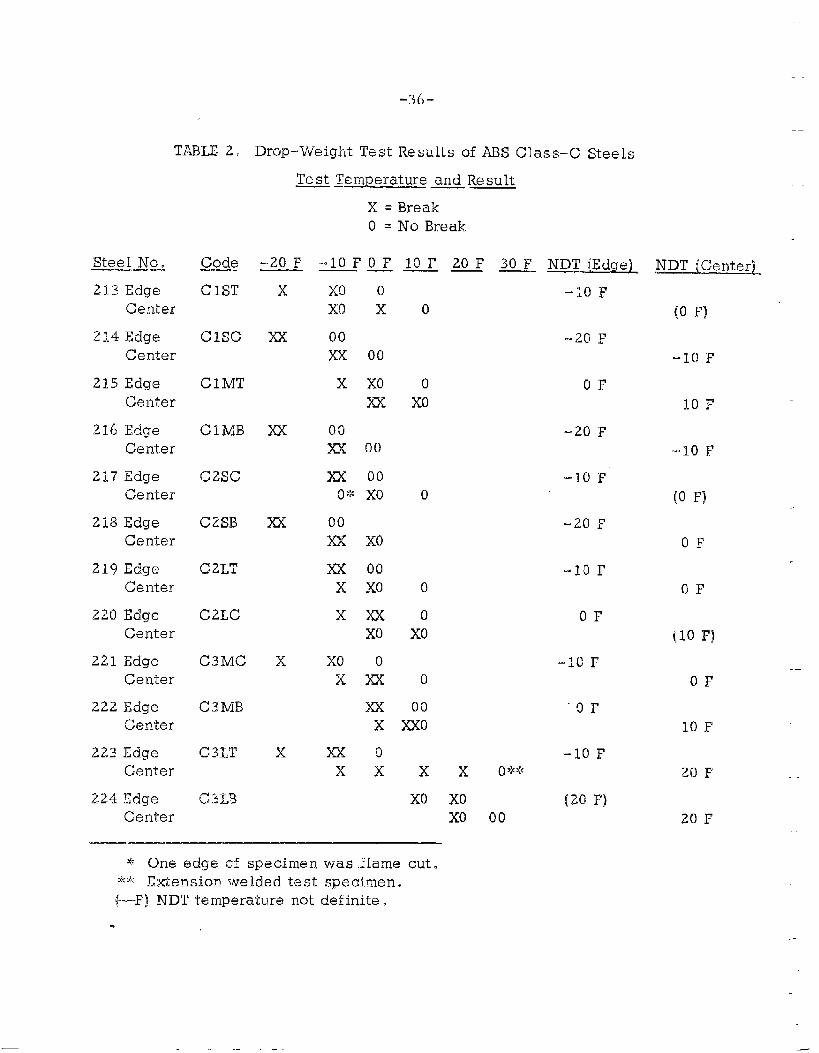
TABLE 2.
Wee 1 No———. . ..-
21.3 EdgeCenter
21.4 EdgeCenter
215 EdgeCenter
216EdgeGnl:.er
217 EdgeCenter
218 EdgeCenter
219 EdgeCenter
220 EdgeGenter
221 EdgeCenter
222 EdgeCenter
223 EdgeC&rlter
224 EdgeCenter
Code.—
GIST
Clsc
Cl MT!
CIMB
C2SC
C2SB
C2LT
C2LC
C3MC
C31VIB
C3LT
C3LB
-36-
Drop-Weight TestResultsofABFIGlass–C Steels
TestTemperatureand Re suit—— —
-20 F.—,
x
xx
xx
n
x
x
X = BreakO = No Break
-.10F O F——
Xo ox.!’) x
00
n 00
x Xl
xx
00m 00
m 00~:x XCJ
00
x Xo
xx 00
x Xo
XM
Xo
Xo o
xxx
nx
Xx o
xx
10F 20F—.
0
0
Xo
30 F NDT (Edqe)—-
-Iol?
-20 F
-20 F
-10 Fo
-20 F
o
0
Xo
o
00
Xxo
xx
OF
-10 F
OF
Xo Xo (20 F’)Xo 00
‘~’ Cme edge of specimen was ,Ilame cut.‘$’~ Extension welded test spedmen.(--–F) NDT temperature not def ini.te.
.
.— —
. .-
.—
.
-.
—.
-37-
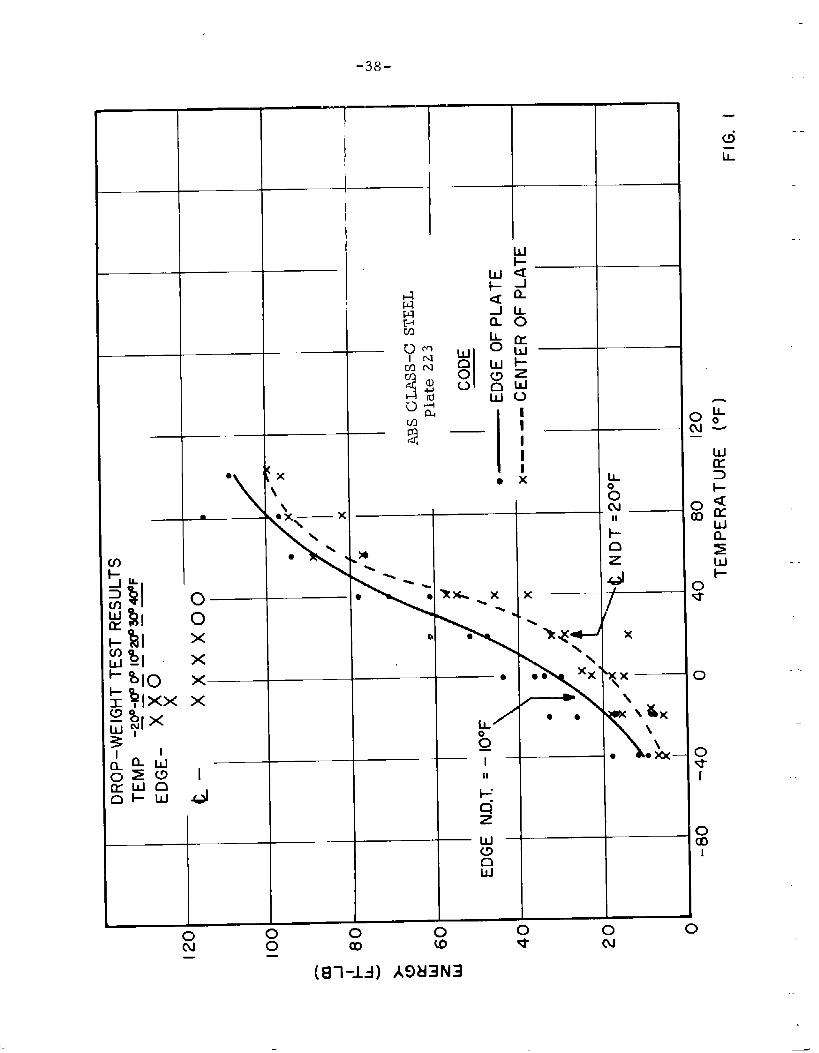
As shown by the NDT range of -20 to 20 F for edge-of–plate specimens
and – 10 to 20 F for center-of-plate specimens, the Class-C steels do ex-
hibit variations in. notch toughness among plates of the three different hezits.
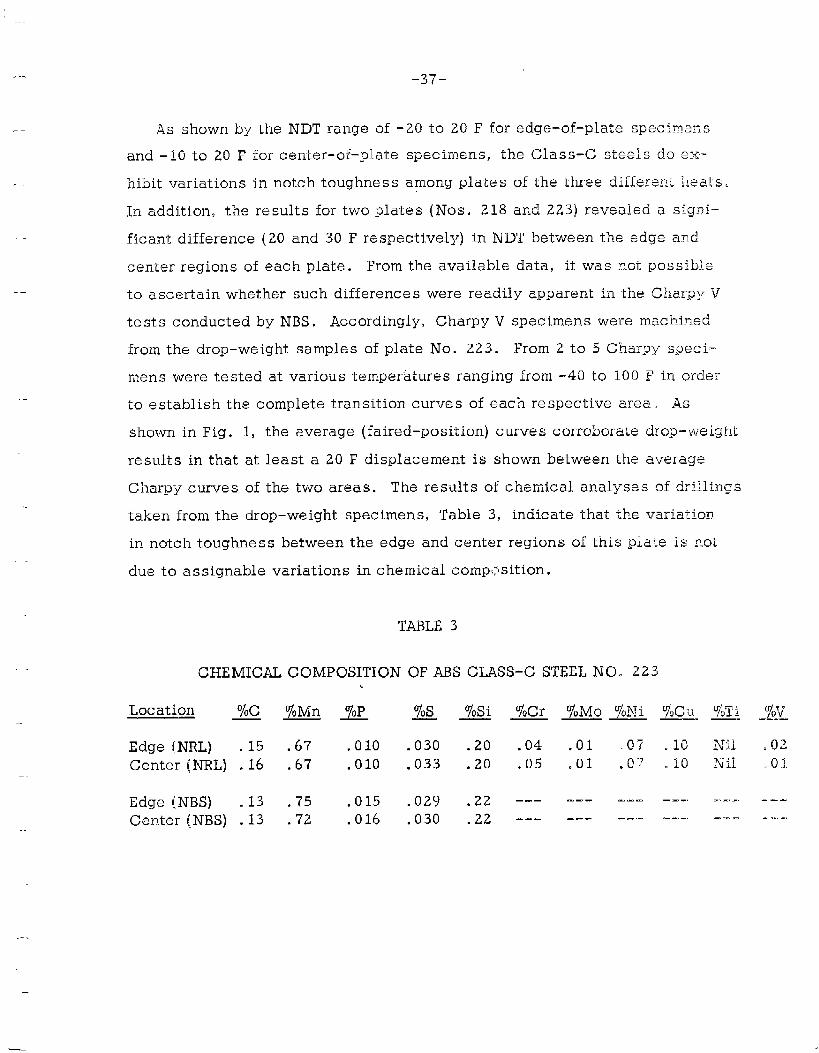
In addition, the results for two plates (Nos. 218 and 223) revealed a signi-
ficant difference (20 and 30 F respectively) in NDT between the edge and
center regions of each plate. From the available data, it was not POSsible
to ascertain whether such differences were readily apparent in the Gharpy V
tests conducted by NBS. Accordingly, Charpy V specimens were machined
from the drop-weight samples of plate No. 223. From 2 to 5 Charpy speci-
mens were tested at various temperatures ranging from -40 to 100 F in order
to establish the complete transition curves of each respective area, As
shown in Fig. 1, the average (faired-position) curves corroborate drop-weight
results in that at least a 20 F displacement is shown between the average
Charpy curves of the two areas. The results of chemical analyses of drillings
taken from the drop–weight specimens, Table 3, indicate that the variation
in notch toughness between the edge and center regions of this pla-~e is not
due to assignable variations in chemical composition.
TABLE 3
CHEMICAL COMPOSITION
Location—— ~ VoMn ~
Edge {NRL) .15 .67 .010Center(NRL) .16 ,67 .010
Edge(,NBS) .13 .75 .015Center(NBS) .13 .72 .016
OF ABS CLASS-C STEEL NO. 223
x 70Si ToCr %Mo 70Ni ~oCu ‘7’oTi ‘%V-. —. —-.—
.030 .20 .04 .01 ,07 .10 Nil .02
.033 .20 .05 .01 .o~ .10 ~~~ .01,
.029 .22 --- --- --- --- -. ---- .- .- -
.030 .22 --- --- ---” ‘--- --- - .. -,
.-.
.—
b
.\
o0x
x
x
I
4
0N
K
\bx —:
\
\
L\
●
+
2“”
I
ikno
—
— —
(81-14) AW13N3
—
-39-
REFERENCES
--
..
—.
1. Pellini, W. S., Puzak, P. P., and Eschbacher, E. W., “proceduresfor NRL Drop-Weight Test, “ NRL MEMO Report No. 316, June 1954.
2. Puzak, P. P., Schuster, M. E., and pellini, W. S., “Cracker-starterTests of Ship Fracture and Project Steels”, The Welding Journal, Res.Suppl. , October 1954, p. 481-s. See also=zak, P. P., Schuster,M. E., and Pellini, W. S., “Part 1: C~ack-Starter Tests of ShipFracture and Project Steels”, Final Report, Ship Structure CommitteeReport, Serial No. SSC-77, June 18, 1954.
3. Puzak, P. P., Eschbacher, E. W. , and Pellini, W. S. , “Initiation andPropagation of Brittle Fracture in Structural Steels, “ & Welding
JQUI@ R~s” Suppl. , December 1952, p. 561-s.
4. Puzak, P. P., Schuster, M. E., and Pellini, W. S. , “Applicability ofCharpy Test Data, “ The Welding Journall Res. Suppl., September 1954,p. 433-s.
5. Puzak, P. P. and Pellini, W. S., “Effect of Temperature on the Ductilityof High Strength Structural Steels Loaded in the Presence of SharpCracks, “ NRL Report No. 4545, June 1955.
6. Puzak,P. P. andPellini,W. S., “EvaluationoftheSignificanceofCharpyTestsforQuenchedandTemperedSteels,“ The WeldingJournal,Res.Suppl., June1956,p. 275-s.
.-
L—
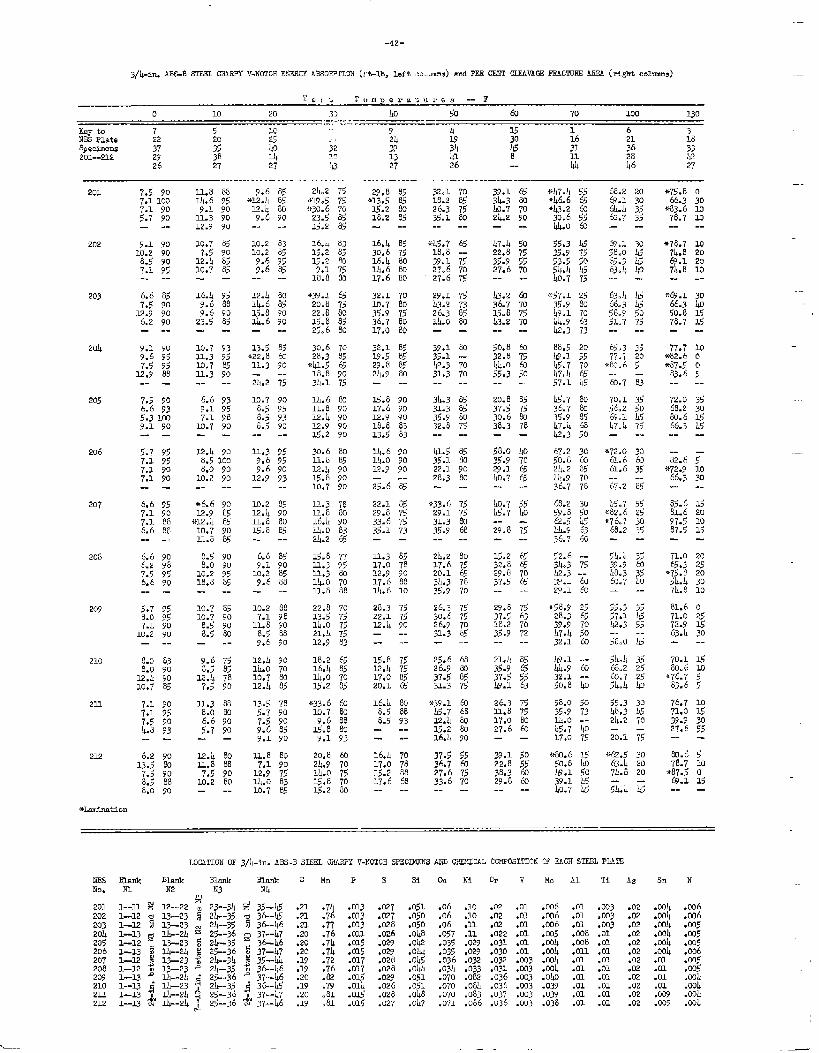
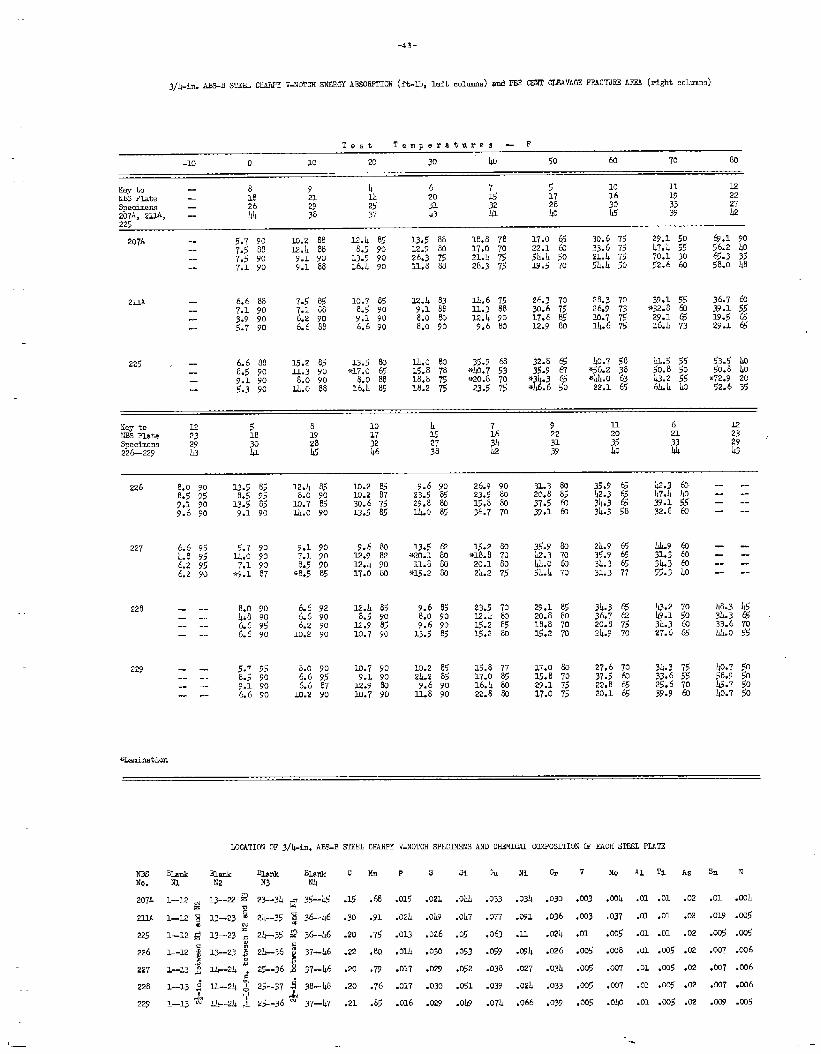
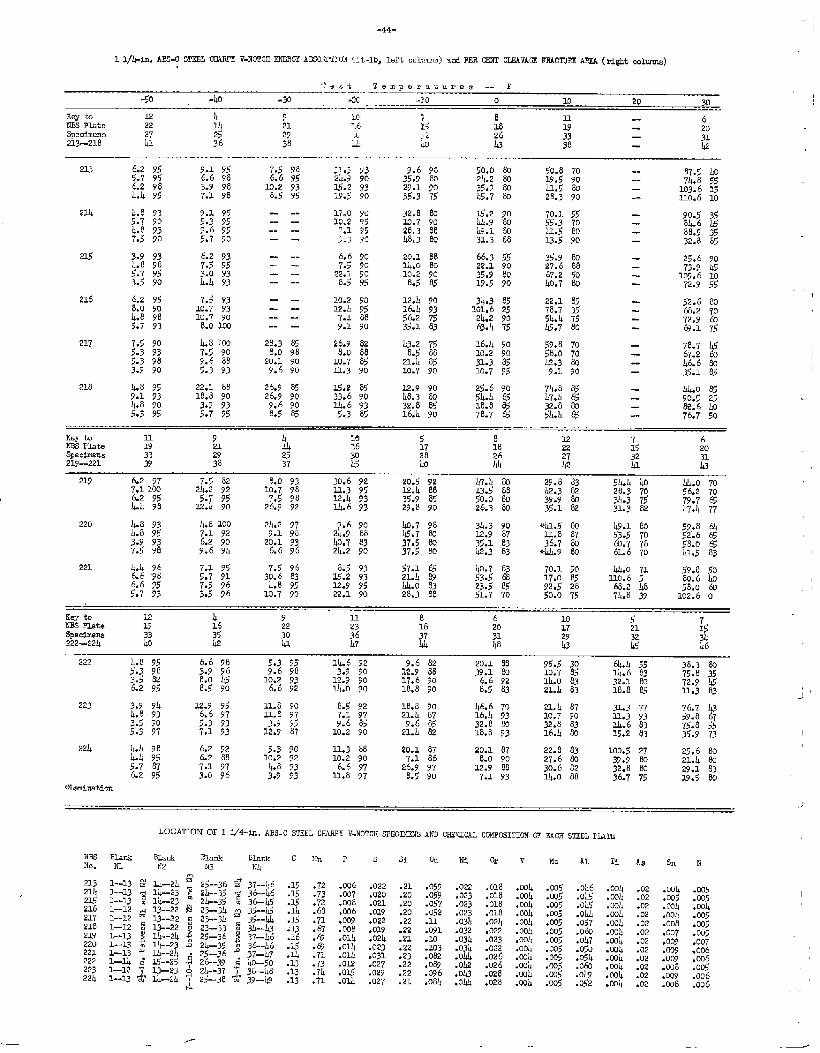
-40.,”,
TABULATION OF GHARIW V-NOTCH ENERGY ABSORPTIONAN13 PER CENT CLEAV<4GEFRACTURE AREA
The following tables consist of a comprehensive tabulation of data
obtained for each Charpy V–notch specimen tested parallel to the direc–
tion of rolling, lt is offered aa informaticm to future investigators to
obviate duplication of these tests.
For statistical purposes the location of each specimen has been ‘
noted o The specimens were cut from blanks shown with an “N” desig-
nation on the template in Fig. 1 (See page 7). Each specimen, begin–
ning with the first one at the edge, of the plate was numbered con secu -
tively toward the center of the plate . The key to the numbered specimens
te steal for each plate is given at the beginning of each group of specimens.
The location of each specimen in its respective plate with reference
to edge (Blank N 1), next to edge (Blank N 1), next to center (Blank N 3),
or center (Blank N 4), is shown at the bottom of each sheet together with
each plate’s chemical composition. Each value shown for the chemical
composition is the average of two analyses.
The following example illustrates how to obtain information for a
given specimen. The third test at 10 F for Plate 228 of ABS Class B
steel can be found first by locating the plate number in the first column
of each sheet. Plate 228 is on page 43. The third test is in the third
rOW down . At 10 !? the specimen broke under 6.2 ft-lb of energy and. had
90 per cent cleavage area. Referring to the specimen key at the top of
the 10 F column for this IWOW ? the number designating specimen position,
which is in the third row down, is 28. To determine the approximate
.—
—
-41–
position in the plate that this number 28 represents, one refers to the
plate listing at the bottom ~f the page. Reading acress the line for Plate
228, specimen location 28 is found in the column under Blank N 3. Thus
this specimen, the third test at 10 F for Plate 228, was obtained from the
next-to-center blank in the plate. The location of number 28 within the
blai_d<can be inferred from th~ fact that, within this blank, specimen lo-
cation 25 was on the “edge” side and specimen location 37 was on the
“center” side. The chemical composition as determined for the total
plate is also given on the same line.
-.
\—_
-42-
3/&h. ABS-BSTEELC17ARFYV-NOTCHENBRGTAMOW mli (yt.-lb, z.eft ,:,>-utirig ) and PES CENT CLEAVAGEFRACTUREAREA (rightCOhlllllS)
o 10 20 J;, Lo <0 63 70 100 130—,. .. -,.- —.—.
Key tu 7 s J.c ., 9 l! G 1 6NSs Plate 22 20
325
+ecimou24 2-9
3730 16 21
3<M
j;39
$$ f 31 36
201--212 29 38 3.?33
13 2“2 2826 27 j$ 27
@26 -. IL 46 27
201
202
203
204
205
206
207
208
209
210
211
22.2
7.5 907.1 10Q7.1 905.7 90-- . .
9.1 9010.2 90
8.5 907.1 95
--
6.6 es7.5 90
2“2.9 906,2 90
--
9.1 909.6 95
7.5 95x2.9 88
.- -
7.5 906.6 93
5.31039.1 90-. —
5.7 957.1. 9s7.1 907.1 90.-
6.6 957.1 907.1 886.6 8Z-- -.
6.6 906.2 g87.5 956.6 90-- —
5.7 958.0 9~7.1 90
M.2 90— --
8.0 838.0 90
12.4 9010.7 85
7.1 907.1 957.5 90IL.8 93-- -
6.2 9013.g 03
11.8M. 6
L;12.9
%909090
85908585
9.6*12 .11
12.49.6
32.1 7018.2 8S26.3 753<.1 80-. --
*45.7 6518.8 --39. L 7s27.6 7027.6 7g
29.1 l’sI!3.? 73?6.3 85M.o 80-- —
39.1 m35.1 [email protected] 7031,3 70-- -.
31!.3 0531.3 8<35.9 8U32.8 75-- --
IL5 8<3SJ. 8022.L 9028,3 80
--
*33. ~ 7529.1 7531.3 m35.9 68-- --
211.2 8017.6 7520.1 6<3L3 7835.9 70
26.3 7530.6 7526.9 7031.3 8S-- .-
25.6 6826.9 zo37.5 8531.3 7s
*39.1 63lJ.7 60u.4 802.5.2 851.6.4 90
37.5 %36.7 6227.6 7533.6 70-- --
39.1 653.L.3 80110.7 702)J.290
*lL7.11 55*h6. 6 6S*43.2 &
30.6 55I&o @
%.3 L535.9 7553.< <054JI h5110.7 7s
X.57. 1 tg35.9 8049.170141,.763@3 7388.520L7.15sL5’.770l17,1!6557.1 wK-7 8036.7&35.985L7.>,68&3 [email protected]’7036.77860.23U59.6ro62.54sul.9 6336.7 &g2.6 --*; ::
3::1 bP?.1 (q
*58.9 2528.3 6539.9 7047.4 5032.1 .fa
@.1 .,..44.9 6332.1. --5(L8 40
:.; $
111.O --W. 7 ho17.0 75
*80.6 1550.8 lloL9.1 50g.+ g
*75 .866.3
*83. 678.7
030103.0--
—2JI!>2 75
?+19.5 75+30. 6 7023.~ &lg.2 35
16.4 8J15.2 85$.: ~
&a 80
,~,;;.; ;:
22;8 80L5.8 8525.6 80
30.6 7028.3 85
ML< 6j18.8 90311.1 75
14.6 @u11.8 9012.4 9012.9 9015.2 90
3$: :
1.2.1, 9015.8 9010.7 90
1L3 7s11.8 8016.k 90lJ.; ~
15.8 7711.3 9s11.3 80Lo 7011.8 88
22.8 7013.s 75111.0 7s21.)1 7512.9 83
2-8.2 6516.4 85Lo 7015.2 85
+33.6 to10.7 80
9.6 88ti.8 80
9.1 93
20.8 632)h9 70lk.o 7515.8 701<.2 80
29.8*I3 .5
15.218.2
8<858085---. -- --
10.77.5
12.IJ10.7
10.210.2
9.69.6
83859585—
16. L30.63.6.1114.617.6
857580FL)80
b7.422.835.927.6
10202010
-- -- .- --
16.L 9s 12.JJ88 111.6;: 3.5.8
a. 6
80859090--
32.110.735.936.717.0
L3.236.7g.:
iF@ .1 3066.3 [email protected] 1.578.7 3.5
9.69.6
23.<-- -- -- -- —
50.832.8IJ4@
55.3
10.711.310,73.I..3
93?58590
13.s+22.8
32.1 8519.S 8529.6 8524.9 80
77.7*82.6*87.5
83.6
10005..-
11.3
24.2-- -- --
6.6 93959890
10.’/
W8.58.5
25.817.612.918.813.5
90
g
83
&
80.666.3.-
9.17.1
37.s30.638.310.7
--
12.48.58.0
10.2--
U+. 6UJ,o32.9
58.0
3s.929.1ILO.7
110706565
909090
i;
--lbu
9090--
82.6*72.9
66.3i2.9--
—25.6-- -- . .
*6.63.2.9
W?,410.73J.8
10.212.4IL. a15.8
85908085--
22.129.833.,4
35.1
85757<73
40.7W.7
55ho
.33:
97:587.5
2“520103529.8 ?5— --
11.317.012.917.6L 6
85789088
35.232.829.837.5
71.065.3 25
*75. 8 2051b4 3071+.8 10
20as 908.o 90
10.2 9518.8 85
9;110.2
9.610--
8898908890
213.322.112.lk
29.8
37.518.2
83..610.710.7
6.58.5
8590
10.27.1
11.88.59.6
12.4Lo10.712. h
l;.;.
;:29.1
7s7590----
75637072
025ls30--
71.072.963.11
9080 35.9—
--
9.6 756.5 85
E.k 787.5 90
11.38.o
;:
90 15.812.1117.020.1
7575B565
2Lb 8535.9 6537.5 [email protected] 63
70.180.6
3.76.783.6
70m85
88so9090
78 16.lL8.<8.<
808893--.-
26.311.817.027.6
76.771.0
39-927.6
102“53055
9090W90
%756385
----
1.L87.1
12.914.010.7
16.111’7.0L5.217.6
70788868--
39.122.838.329.8
?a.678.7
+87.5
f9.1.-
12.411.87.5
10.27.< 908.5 888.0 90 — -- -. —
*lmrinatiOn
LOCATIONOF 3/&n. ABs-BsTEELWRPI! V-NOTCHSPECIWNS ANZ CIDK@AL COMFOSI’2TONW EACHST?J3LPIATE
ms ~ank Bknk Blank Blank C Mn P s Si CuNo. N1 N2
Ni G- V Ho Al Ti As h NN3 Nh
!,
201 1--D ~ 12--22 : 23--34 = 35-45 .21 .74 .013 .027 .051 .06 .10 .02 .01 .006 .01202 ;--~ ; ~.-;; ~ 2)J--35 m 36--!J .21 .76 .013 .027 .O~O .06 .1O .02
. W3 .02 .w4 .w6.0: .006 .01 .033
203 -.02 .004 .006
~ 24--35 ~ 3E--46 .2L .77 .013 .028 .050 .06 .~ .02 .01 .006 .01 . cG3 .02 .mll .m520& 1-13 d 111--2lI = 2S--36 ~ 37--k7 .20 .76 .OI.3. .026 .0118 .057 .3.2 .022 .01 .005 .008 .01 .02 .ooh .m5205 1-12 R 13-23 S &-35 3LL6 .20 .7& .015 .029 .042 .035 .029 .031 .01206 1.-I.3 k 14--24 ~ 25--36 ~ 37–47 .711 .015
.034 .008 .01 .02.20
.004 .005.029 .O1111 .035 .029 .030 .01 .0311 .03J .01
207 1-22 ~ 13--23 t 2tJ--3& ~ 3+-U.02
.19.00~ .006
.72 .017 .02D .ob5 .036 .032 .032 .003 .WII .01208 l—12 % 13—23 n 24—35 ~ ;$-~ .19
.01 .02 .01 .035.76 .017 .028
209.O.!bj .03L .033 .031 .003 .004J
1-13 * l&--2)J ; 25--36 .82.01 .01 ,02 .01 .035
.015l--~ ~ 1.!I--23 T 2h--35 ~ 3&~v
.20 .029 .051 .070210
.082 .036 .003 .040 .01 .01 .02 .01.19
.004.79 ~y; .026 .051 .070 .08.!I .036 .003 .039
2U.01 .01 .02 .03. .Oo11
1-13 “I lL--2IL ,% Z-36 jm 37--lJ7 .20 .81 .028 .048 .070 .083 .037 .003 .039 .01212
.01 .02 .0C9 .oO&].--~ k“ L4--2~ j 25—36 w 37--46 .19 ,,81 .015 .027 .o117 .071 .086 .036 .003 .038 .01 .01 .02 .009 .Wh
.—.—
-43-
j/h-in. AR%B STEELCH.i8PXV-NOTCHENERGY AB90RIWON (ft.lb,left colm!m) and PER CENTCLIMVAGEFR4CTUE3ASE! (right column.)
TeB* Temperatures - F
-lo 0 10 20 30 40 50 62 70 80
Key *O . . 8 9 II b 5 10 n L2
NBS Plate — 1.9 21 lh 20 L 17 16 39 22Specimens — 26 29 25 :; 32 28 30 33 27
207A, 21ti> -- 44 38 37 Ill l!o 45 39 u225
207A 5.7 90 1.o.2 88 1.2.)1 8< 13.5 88 M.a 78 17.0 # 30.6 75’ 29.1 50 @.1 90
7.5 88 12. IJ ‘w 8.5 go 12.9 80 17.0 -10 22.1 a 33.6 75— 47.4 55 g.: hJ
7.5 90 9.1 90 13.5 90 26.3 75 2LL 7< 54.11 50 21.11 75-- 70.1 30-. 7.1 90 9.1 88 16.4 90 ri..8 68 28.3 75 L9s 70 54.11 50 <2.6 ti 58:0 48
211A -— 6.6 88 7S 85 10.7 85 mb 83 14.6 75 26.3 70 28.3 70 39.1 55 36.7 @-- 7.1 90 7.1 88 8.5 90 9.1 88 L1.3 88 30.6 75 26.9 73 *32.8 .@ 3%; &
3.9 90 6.2 90 ~; ;: 8.o 80 12.4 90 17.6 85 1o.7 7$
5.7 90
29.1 e,.- 6.6 8a . 8.0 90 9.6 80 32.9 80 14.6 75 lb.b 73 29.1 65
22< / -- 6.6 88 15.2 85 13.5 @J) 111.o ao 3s.9 @ 32.8 65 Lo.7 58 lid 55— 8.5 90 1.1.3 90
<3.< &ow;.: g L5.8 78 Mlo.7 53 35.9 67 +6.2 38 go.8 <0 go.aho
— ~; & 8.o 90 18.8 75 Q20.8 70 *34.3 6 *bh.O 63 ~; g *72.9 20lIJ.O 88 16:4 85 3.8.2 7s 23.5 75 *IL6.6 50 22.1 65 . 52.6 35
Xcy to 12 5 10 7 9 u 6 1.2NW Plate 23 !9 17 !5 16 22
$23 ,
$ $specimens 29 28226-229
32 27 3k 31 29
113 u 45 k6 38 IL? 39 44 L3
226 8.0 906.< 959.1 909.6 90
3-3.5 ES8.5 95
13.5 859.1 90
5.7 90111.O 90
7.1 90+9.1 87
8.o 901#: ;:
6:6 90
5.7 950.5 909.1 906.6 90
12.4 858.o 90
3.o.7 8<U.o 90
9.1 907.1 908.5 90
%8.5 85
6.6 926.6 906.2 90
10.2 90
8.o 906.6 956.6 87
10.2 90
10.2 0510.2 a730.6 7S13.5 85
9.6 8012.9 8212.IJ 9017.0 80
12.11 8S8.5 90
!“2.9 8510.7 90
10.7 909.1 90
12.9 m10.7 90
9.6 9023.< 8529.8 Mllko 85
13.5 62*20.1 80
11.8 80++G.2 80
9.6 858.o 909.6 90
13.S 85
10.2 852&.2 85
9.6 9011.8 90
26.9 9023.5 803.5.8 8036.7 70
15.2 00*18.8 70
20.1 8024.2 75
23.5 7012.11 8315.2 8515.2 20
15.8 7717.0 851.6.11 8022.8 2a
31.3 .9020.8 8S37.5 &l39.1 to
$.; :
411:0 4351J.I 70
29.1 8520.8 8018.8 70X.2 70
17.0 8015.8 7029.1 7517.0 75
35.9 6542.3 65
34.3 653&.3 m
24.9 65:;] g
31:3 77
3&.3 6536.7 @20.8 752k9 70
27.6 7037.s to22.8 6520.1 65
h2.3 b117.& Lo3?.1 5532.8 @
1114.9 6331.3 &
34.3 ~55.3 ho
11.3.2 70IJ9.1 50311.3 6327’.6 65
3L.3 -/S33.6 552S.6 7039.9 10
-- .-------
—
227 6.6 95h.8 956.2 956.2 90
. .
.---
118.334.3~;
228 - --— -.-- --— --
40.758.9&5.740.7
229 - ---- -.-. --
.-
+Lminwtion
LOCATIONOF 3/&in. AWB STEEL CHMPY V-NOTCH SPEciXENS Am c~mU.L cOlfPOSI~oN @ FJ.cH STESL PMTE
NBSNo.
207A
mark Blank Bknk BWW
NJ. N2 N3 N4
s SI hi Ni f%- V Mo Al Ti As N
I.-12 13--22~ 23--3& ~ 35--452
1-12 8 13--23 g 24--35 ~ 3&-&6. m!
.Oo11
.C05
.035
.CQ6
.c06
.c06
.035
.15 .69
.30 .91
.20 .75
.22 ,80
.20 .79
.20 .76
.21 .85
.o1.5
.0211
.Ou
. OIL
.017
.017
.016
.021
.0119
.026
.030
.029
.030
.029
.OMJ
.0117
.05
.053
.052
.051
.o&9
.033
.077
.063
.0<9
.038
.039
.07L
.034
.091
.11
.074
.027
.024
.066
.030
.036
.024
.026
.034
.033
.039
.003
.003
.01
.005
.005
.m5
.005
.ml!
.037
.005’
.036
.007
.037
.o&o
.01 .01 .02
.01 .01 .02
.01 .01 .02
.01 .0+35 .02
.01 .C05 .02
.01 .005 .02
.01 .00s .02
.01
.019
.ms
.0Y7
.007
.037
J@
211A
22s
226
227
228
229
-44-
,>p. ,~.k. Tempnr%tures -- F
—...,— ..— —— .______.50 -m .30 -2C -?o 0 3.0 20 30. ..-— —
213 6.2 95 9.1 95 7.5 98 ;I.j 5’35.7 95
9.6 906.6 98 6.6 95
50.0 80 50.8 ‘io 87.S Lo21+.7 90
6.2 98 3.9 9835.9 80 21!.2 m 19.5 90 71h8 55
10.2 93--
15.2 934.4 95
29.1 907.1 98
35.9 80 Ic@ 80 103.6 M6s 95 -19.s 90 55.3 7s
—115.7 80 28.3 90 -- uo.6 10
214 lL.8 93<.7 90
9.1 95 - -.” 17.0 go5.3 95 -- --
32.8 00 15.2 90 70.1 S5 — ;:? K1$: ;~ in.7 90
k8 93 9.6 957.5 90
26.3 afl44.9 80 55.3 70
5.7 90 : : 3::1 wIp.1 80
413,3 ~~J.L.5 80
31.3 88 U.5 9088:5 35
—
21s 3.9 93
32.8 85
6.2 93 - -- 6.6 90h8 98
20.1 06 66.3 557.5 95 – - 7.s 90 I.11.c. 80
3s.9 so 25.6 90
S.-1 95 3.0 9322.1 90
22.1 9027’.6 88 — 73.9 lL5
3.5 90 4.4 93 :: =:10.2 90 35.9 80 67.2 SO 109.6 10
8.s 95 8.5 85 19.s 90 4L7 m 72.9 <~
216 6.2 95 7.5 93 - -- 10.2 90 12. IJ yo8.0 90 1o.7 93
34.3 85I!2.4 95
22.1 85-- 16.k 93 101.6 25
~:.: g
4.8 9878.7 35
10.7 90 7.1 80 56.2 758.o 100 = =
2Lh2 90.
5.7 9354. Ii 75 72.9 &
9.1 90 3<.1 83 63.4 75 115.7 80
7.5 90
@.1 75
217 11.0100 28.3 85 26.9 82 43.2 75 16. k 90 59.8 70%3 93 7.5 90 8.o 98 8.o 88 8.5 80
—
j.3 983.0.2 90
78.7 IF:.; ~: 67.2 h
9.6 88 20.1 903.9 90
10.7 85 21.11 85 31.3 85 l@. 6 80<.3 93 9.6 90 11.3 90 10.7 90 m.-) 95 9:1. 90 — 35.1 85
218 l!.a 95 22.1 88 26.9 85 U.2 85 2.2.9 90 25..5 909.1 93 16.8 90 26.g 90
711.8 E5 44.o 8533.6 90 h8.3 80 54.11 65 k7.11 65 90.5 25
4.8 90 3.9 93 9.6 90 Q. 6 93 3t.a 85 18.8 85 32.8 M5.3 95 5.7 95 8.5 85 5’.3 8s
— 82.6 LO16.4 90 78.7 G 5fl.JJ 65 -. 76.7 50
—.. ———— ..-
Key to 11 9 II la 5’ 8NBS Plate 19 21 111 16
3.2 617 18
Spocim$ns 29 2522 L 20
:;30 28
219—221 3826
37 k527
40 u32
42~
Ill
219 6.2 97 7.5 82 8.0 93 30.6 927.1100
20.< 92 47.4 80 g.; :82h.2 92 10.7 9a
5L.L J@ 1111.o 70IJ..3 9s
6.2 95 5.7 9512.4 86
7.5 9013.s 88 28.3 70 ;6.; g
12.4 93 35.9 85 50.0 80JJ.JJ 98 2-2.4 90 26.9 92 ilk 6 93
~:; f 34.3 7529.8 90 26.3 00 . 31.3 82 47.4 77
220 &.8 93 h. 8100 24.2 974.8 95
9.6 907.1 92
fIO.7 989.1 98
34.3 902)L.9 08 45.7 m
*ILI.5 80 49.1 80 59.8 6!I3.2.9 87
3.9 93u. 8 07
6.2 905J; ~ S2:6 E
20.1 937.5 90
IQ7 03 37.5 au 35.1 83 36.7 2Q9.6 91! 6.6 96 24.2 90 37.5 80 42.3 83 *&I1.9 Bo 61:6 70
58.0 G41.5 83
221 ~~ ;: 7.1 95 7.S 96 8.5 93 57.1 65 40.7 83 70.1 50 M.o 715.7 91 30.6 83 3s.2 93 21.4 89
59.8 50
6:6 95 7.5 96 4.8 95<3.< .$8 17.0 85
12.9 95 ~.O 83UO.6 5
23.5 8580.6 &O
5.7 9392.S 28 68.2 M 58.o @
3.5 96 10.7 90 22.1 90 28.3 88 51.7 70 50.0 7s 74.8 B 102.6 0
Key to 12 JJ 9 11 8 6N3S Plate 19 16
10 s20
SpQcimens 33 35 % #17
$ $L
;222-2211 &o & kl
2944 &3
311h6
222 L.8 9s 6.6 98:.: {:
;.: ;: lb.6 92:.; g
9.6 82 20.1 883.9 90 12.9 88
95.5 30 611.11 55 38.3 m3&* ; 10.7 85’
10:2 9314.6 83
I-2.9 9075.8 35
6;2 9517.6 90 lk.o 83
8:5 90 6.6 92 Q.o 90 18.8 90 8:5 8332.1 m 72.9 ~
21. IJ 83 18.8 8S 11.3 83
223 ;? ;9 1.2.9 95 11.8 90 8.5 92 18.8 90 L6.6 70 21.11 876.6 97 1.I.8 97
31..3 77
3:s 90
76.7 437.1 97
<.3 9321.Ik B7
3.9 953.6J 93 10.7 90
9.6 85 9.6 85 32.8 PQn.3 93
5.3 97 7.1 93 12.9 8732.8 83 L4. 6 83
<9.8 67
10.2 9075.8 w
21.4 82 10.8 93 16.11 80 15.2 83 35.9 73
2211 k.li 98 6.2 92 5.3 90 L1.3 88 20.1 87 20.1 87 22.8 834.4 9s 6.2 88
100.5 27 25.6 8010.2 92
S.7 8710.2 90 7.1 86 8.o 90 27.6 80
7.1 97 4.8 9339.9 80 21.11 au
6.6 976.2 95
26.9 97 12.9 88 30.6 823.0 96 3.9 93 11.e 97 8.5 90
32.8 80 29.1 837.1 93 Q.o 88 36.7 75 19.5 80
LOGATTON OF 1 l/4-in.ABS-C STSELCHWFY V.NO’TCHSPECDCSNSAND C~UCAL cOMPOSITIONOF EACH STEELPUTE
NBS Blank Rlank Blank Blank C Mn P 5No. N1 N2
sih NiCr TN3
Mo Al Ti Aa Sn Nml
g213 1-.13 & ll@21J 25’--36 = 37--46 .15 .72 .006214 1-.13 m IL--23 ~ 211--35 m 36-b6
.022 .21 .059.15
.022 .018 .C@ .005 .046 .004 .02 . Oolb
2U 1--13 ~ U--23
.005
24--3S 8 3&45 :;~ :;;.0s7 .020 .20 .059 .023 .018 .O@ .m5.008 .021
.Ow .COL .02 .CQ5 .005
2J.6 1--12 # 13--22 % 23-311 ~ 35-+.20
.68.057 .023 .018
,CQ6 .019.cQ4 .005 .oll.5
.20.oO& .02
.052 .023.0011 . ~4
2L7 l—12 13--22 S 23-.34.018 .0011 .005 . OIJI .m4
218 1—12 ~ 13--22 $ 23-33 ~ ;~::~.15 .71 .009 .022 .22 .11
.02.03k .024 .0011
.c04 . (05
i 13 .67 .008. c05
.019.057 .004 .02 .008 .005
219220 1--13 $ l&2.!I ; 25--36 f 37-46.22 .C91 .032 .022
.16 [email protected] .005
m: .024 .21.062
.10.004 .02 .007 . 0U5
1.-u $ 14--23 D 2.h-35 j 36-IJ6 .15 [email protected] .023 .@
.023.005 .047 .004 .02 .Ocp
221
.007
1-2.3 s 14--2& . 25--36.22
37—117 .U.103 .034
.71 .Oti.022 .00II .005 .050 . w)-! .02
222
.0G9 .006
1--4 ~ P--25 .2 26--39 ,: )!0--S0.031 .23 .082 .044 .026 .CQII
l–u? “,w 13--23 ~ 2k-37 f 38–M :;; :% :~ti ::;; :% :% :% :% :% ~;;
.054 .coll .02 .003
223
.036.o& .004 .02 .008
224
.005
I-U & lL--2! , 25—38 k“ 3945 .13 .71 .Ou .027 .21.O11$ .Ooh
&.02 .009 .006
.084 .OM .028 .MIJ .005 .052 .034 .02 .008 .006