Embed Size (px)
Citation preview
SSC-168
Rolling History in Relation to
The Toughness of Ship Plate
by
B. M. KAPADti AND W. A. BACKOFEN
SHIP STRUCTURE COMMITTEE
CopI., Ilm!lobl. hem btmtlwy. shipSlr”<tvmCammlllw,u, s. coed O“erd H.odquiwt.r,, W.’hi”!Jl.”, D. c, 201!6
SHIP STRUCTURE COMMITTEE
MEMBER AGENCIES: ADDRESS CORR8SPONDRNCE TO.
B“.,.” 0, S.,,-, DSPT,e, NAVY SECRETARY!.4,,,,,., s,. T*AN,,O”,A,,.N S, RV,CX,DEW 0, ?4,”, SHIPS7R”CT”F16COMMITTCSUN,,ZDSr.47,a (70.s7 GUAmO,7“1.s”., DEW, U S, COASTG“,.. HEADQUARTERSM,. !,,., ADM,N,ST”ATION,0s,7, 0, COMMERCE WAGHINeTQN2S, D. C.AMERICANBu,zA” 0, SH,P?,Na
May 1965
Dear Sir:
Herewith is a coPy of SSC -168 entitled Rollinri His-tory in Relation to the Toughness of ShiR Plate by B. M,
Kapadia and W. A. Backofen. This is the final report on a
project eponsored by the Ship Structure Committee at the
Massachusetts Institute of Technology to determine the rela-
tionship of mill-rolling practice to metallurgical structure
and properties of ship plate.
In sponsoring this research project, the Ship Structure
Committee, received guidance and review from the National
Academy of Sciences through its Ship Hull Research Commit-
tee, and a Project Advisory Committee SR-147, “Mill-Rolling
Practice, “ established specifically for liaison with the prin-
cipal investigator. The Academy undertakes this research
advisory service to the Ship Structure Committee through a
contract arrangement.
Comments on this report would be welcomed and
should be addressed to the Secretary, Ship Structure Com -
mittee.
Sincerely yours,
/+.L?44d2L?—n(/” ~OHN B. OREN
Rear Admiral, U. S. Coast Guard
Chairman, Ship Structure
Committee
SSC-168
ROLLING HISTORY IN RELATION TO
THE TOUGHNESS OF SHIP PLATE
by
B . M . Kapacfia and W. A. Backofen
Massachusetts Institute of Technology
Prepared for
THE SHIP STRUCTURE COMMITTEE
Project SR-147, “Mill Rolling Practice”
under
Department of the Navy
Bureau of Ships Contract NObs-88Z82
Washington, D. C
National Academy of Sciences-National Research Council
May 1965

ABSTRACT
Plates of ABS Cl ass-B and Cl ass-C steel were rol led with differenttemperature- reduction schedules to observe effects of processing historyon final structure and properties. Each class was finished at a constantthickness (1-l /2-inch for Class B; I -1 /4-inch for Cl ass C) fol lowing bothisothermal and non-isothermal schedules with reductions from 15 percentto 60 percent and temperatures in the range 1250°F (6770C) to 2000°F(1093°C) . The principal measurements for toughness evaluation were the15 foot-pound V-notch Charpy, the 50 percent-fibrous Charpy, and thetensile- ductil ity transition temperatures.
Effects were divided into t~ basic categories, one concerned entirelywith ferrite grain size, the other with various extra-grain-size detail s ofstructure and composition. The nwst significant improvements in toughnesswere the resul t of ferrite grain-size refinement . %e notch toughness ofboth steel s was increased equal Iy for this reason as rol I ing temperaturewas lowered to 14500F (7880c) .
The superior toughness of Class C at constant grain size was an exampleof an extra-grain-size effect of composition. Normal izing of Cl ass B PI atesafter rot I ing produced Widmanst&itten structure and some embrittlement whichwas interpreted as an apparent extra-grain-size effect of this particularheat treatment. Mechanical fibering was studied with techniques that in-CI uded el ect ron microscopy, but the cent ribution of microf issuring effectsto toughness was too subtle for observation. Embrittlement from resid”.slCOI d mrk as a consequence of low-temperature finishing was al so identified.Results of heat treatment after rol I ing were studied in detail; of specialinterest was a pronounced increase in transition temperature from sub-criticalanneal ing, which has been rel ated in some measure to carbide spheroidizat ion.
Possibil ities for further toughness improvement by control of rol I inghistorv have been discussed.

CONTENTS
&
INTRODUCTION . . . . . . . . . . . . . . . . . . . . . . . . . . . . . . .
MATERIALS AND EXPERIMENTAL PROCEDUIUS . . . . . . . .
P(SSULTS . . . . . . . . . . . . . . . . . . . . . . . . . . . . .
DISCUSSION . . . . . . . . . . . . . . . . . . . . . . . . . . . . . . .
SUMMARYAND CONCLUSIONS . . . . . . . . . . . . . . . . . . . .
AL:<NOWLEDGMENTS . . . . . . . . . . . . . . . . . . . . . . . . . . .
REFERENCES . . . . . . . . . . . . . . . . . . . . . . . . . . . . . . .
APPENDIX . . . . . . . . . . . . . . . . .
References . . . . . . . . . . . . . . . . . . . . . . . . . . . . . .
1
2
7
27
29
30
30
34
46

INTRODUCTION
Sc+?!edegree of cent rol 1ed shape change is invariably a goal in processing.Associated with this, however, there is a capacity for control of properties~ich is not al ways real ized. In deformation processing, the I atter controlmust be based entirely on a regulation of structure in its various forms.bre specifical I y, in the hot rol I ing of steel ship plate, there are severalpossibil ities for al tering structure so as to control , and even to improve,the notch toughness of the resul ting product. Whether they ever find prac-t ical appl icat ion wil I be determined 1argel y by other, economic factors. Inthe U. S. A., the facilities for steel plate rolling are in most plants of a
tyPe that substantial improvements WOUId be the prerequisite for any seriousconsideration of change in practice.
At I east three such possibilities have been recognized, each rel stingto a different detail of material structure. One is based on ferrite grainsize, which acts to depress transition temperature as it is made smal Ier. I -6
The improvement varies with the type of test and the criterion for eval uatingtransit ion temperature, 7-9 but it has been found that the temperature definedby 15 foot-pound energy absorption in the Charpy V-notch impact test isIow.ered by an amount somewhere in the range 15-250F (8-140c) for each unit ofincrease on the AsTM grain-size scale .4,6,9 NO other variabl e has such apotent effect, so that reduction of ferrite grain size (or increase in grain-size number) is the nwst attractive, if not ful 1y exp!ored, method of micro-structural toughening. Currentl y, the grain size in rol led PI ates is rarelyfiner than ASTM No. 8. Abroad, however, cent rol 1ed-rol I ing processes havebeen devised in which temperature-reduction schedul es are regul ated so as tofinish at lower-than-normal temperatures (near the upper-critical ), with theresult that grain size is smal I er by about 1 ASTM unit and transition temper-ature is lowered according y.lo, 1 I A handicap in the eventual planning ofeven more sophist icated cent rol I ies in the 1imit ed understanding ofkinetics and structural change in hot w.orkf.ng.
With major importance attached to ferrite grain size, other possibil itiesfor toughness regulation are convenient y label led as “extra-grain-size” inorigin. The second of the three, in this category, involves the mechanical I yal igned fiber-1 ike structure of included particles, pores, and other weakinterfaces inherent in wrought material s. Such a structure is basical I yresponsible for an anisotropy in fracturing characteristics. ] 2-15 When acrack travel s by cutting across the fiber, it has been shown that t riaxial it yin regions of stress concentration at crack tips may be relaxed by local(micro-scale) sep rations (or fissuring) between the less strongly coheringfiber ~leme”t~.6,~ I“ that w.z,y, more intense fibering or 9reater fracturin9
anisot ropy may have a toughening inf I uence. Lower finishing temperature has6 8 Again, the amount of toughening as meas-been found to favor the trend. >
ured by a drop in transition temperature is different, depending uponcriterion app} ied.8 However, it is c1 ear that the effect is not nearl y somarked as that of grain size. @antitative estimates are difficult to find,but statistical I y derived formulas from van der Veen, 7 for calculation oftransition temperature, contain terms suggesting that the fiber effect isroughl y an order of magnitude less than that of grain size.

-2-
TABLE 1. CHEMICAL COMPOS1TION
c
Pm
P
s
Si
c.
Ni
c.
no
v
Ti
Al (Acid 5.1 .)
Al (Total )
N (Acid Sol .)
N (Total)
Percent b
&Bs c1.s$ B Steel
0.20
0.93
0.012
0,031
0.02
0.05
0.o6
0.03
0.04
< 0.005
< 0.005
0.002
0.006
0.007
0.008
A8S [1 as. C Steel
0.23
0.66
0.014
0.03
0.17
0.029
0.033
0.004
Stil 1 a third possibility is associated with residual cold work that maybe introduced in attempting to schedul e low-temperature passes for grain-sizerefinement and fiber development . Its contribution ought to be stronglynegative, 16, 17 but control to avoid its presence shoul d be important in pro-ducing optimum microstructure.
With such background, general I y known but not yet ful I y detailed, planswere made to evaluate structure-property relationships in a number Ofsystematically rol led plates of ship-hul I steels. Schedul es were arrangedto cover a variety of temperature-reductiOn seauences, and in view of therecognized bearing ofunnotched tension andwork is rel ated here.
measurement criterion on ‘tough n&s observed, bothCharpy impact tests were planned. The outcome of that
MATERIALS AND EXPERIMENTAL PROCEDURES
Plates were rol led from steel s of ABS Class B and Class C specifica-~ion5 .18 CI=55 6 is ~ ~emi.kil ] ~d ~tee] , Cl ass C a fine-grain kil 1ed steel .
Chemical analyses are given in Table I.

TABLE
-3-
11. PROCESSING HISTORIES.
Number,_ the table identify p] .,,, ,.1 ledaw. rdiog to the different ,chedule,.
AESCl.,, B, l-1/2 .l,,ch final thick ”..,
Isothermal reduct,0. at (“F) Non-isothermal r.d.c, ion,Reduction, finishing e, (OF)
% 1250 I 450 1650 I 950 1250 1455 1595
15 z E u 1 . . . . . .
30 2 !2 ~ 5 L* z,’ @
60 2.? Q U & . . . . . .
* Iba”-i,ot hema! reduction ,chedul e, cc.”Pr%,,”g ,tx q.., passe, wtththe tmver. ture dropping ePF.roximat.ly 400F +x, pa,, to the f,ni, h-t“g 1.”.1. The ,.1 lLng schedule of Plate 12 W, nearly that ofconvention., i,,du, cr, al practice i“ the u.s. A., Mile the ,dwdulcof P1.,. 22 ,ePre, ented aPPr.axlmatel the ..?.,,.1 ,,6 ,.1 I ingw..ti.. of certain mills in woo.. r,
ABSC!.,, C, l-l /4-tn.h 5,..1 thick,,.,,
=* Standard ,ndu, trial P,+., ice with the 1.,, 50%red.., 10” being
mad. o“ a fal Ii.g temperature scale, frc.T 2090°F to !8000F.
Rol I inq Histories: Class B plates were rol led according to 15 differentschedules (Table II and IP#) . Prel iminary rol 1ing of 6-inch-thick slabs wascarried out above 2100° F to establ ish the proper initial thicknesses fordeveloping the same final thickness of 1-1 /2-inch. Fol lowing the slab-sizing
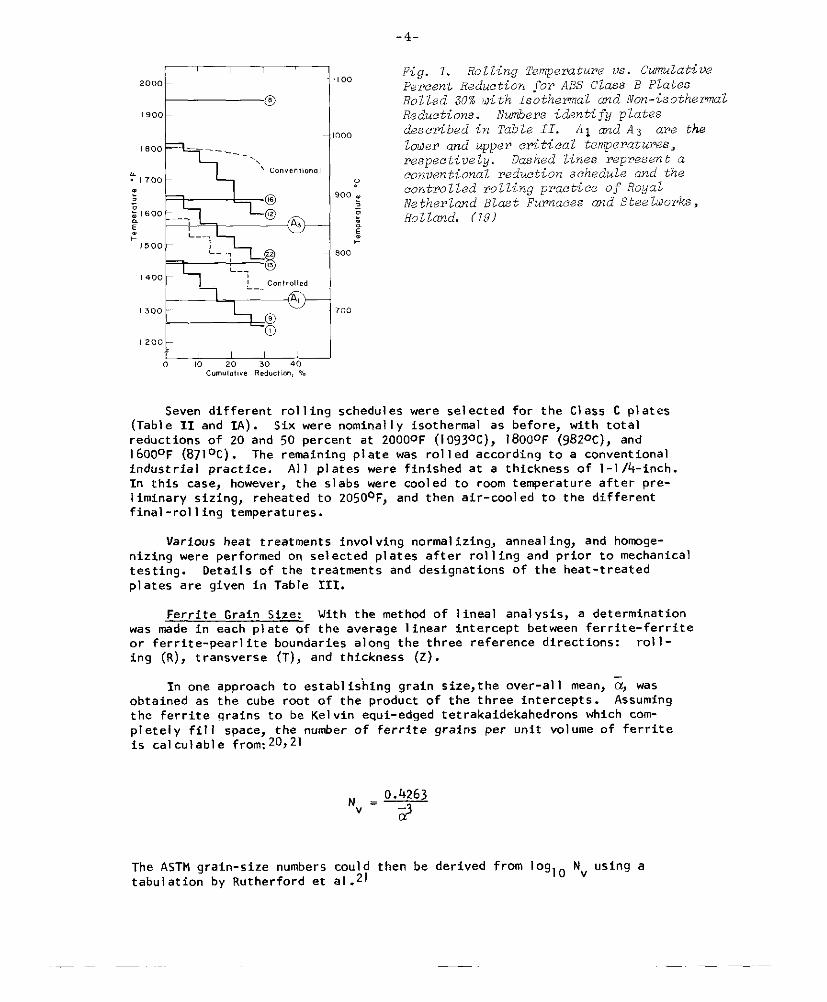
reductions, Plates were al lowed to cool in air to se] ected lower temperaturesbefore further rol I ing. Twel ve of the final schedul es were nominal 1y iso-thermal, each involving 6 equal drafts for total reductions of 15, 30 and60 percent at 19500F (10660 c), 16500F (8990 C), 14SOOF (7880 c), and 12500F(677QC) . Each of the remaining three schedules accompl ished total reductionsof 30 percent, again in 6 equal passes, with the temperature droppingapproximately 40°F per pass to the final val ues of 15950F (8680 c), lf+550F(790°C), and 1250°F (677°C). A schematic plot of ttle rol 1 ing temperature vs.cumulative percent reduction for al 1 plates reduced 30 percent is given inFigure I . The control led-rot I ing practice of the Royal Netherlands BlastFurnaces and Steel worksl 1-19 was the nwdel for the non-isothermal schedulesa dashed 1 ine in Figure 1 is representative of such practice. The temperature-reduction trend in more conventional practice is al so noted in Figure 1 .
,’, The I etter designation refers to a table or figure in the Appendix.
-4-
,oo.~”””
B10’00
1800 —- —---- ,.\ ,.””,.,,O ...
5 ,,!30:
@900 .
: :z 1600 @A3;F ‘–-. L–-.‘,500
:., 8 800:
L-.,
1400 :_- C.n!r.11.d
~1I 300
(3 ’00a
Fig. 1. Rolling (&rnpemture %s. CmUlati*Percent Reduction for ABS Class B PlatesRolled 30% with Isothema~ md Non-isothermalReductions. Numbers identify platesdesctibed in Tabk II. A, mdA3 are the
louer and upper cr-itical tenrpemtures,respectively. Dashed lines mpmsen t aconventionalreduction schedule and thecontrolled rolling practice of Royallktherland Bkst Fumaees md Stieeloorks,Holland. (19)
,200
0 10c“m”?.:,“e,72..,,.”:O./.
Seven different rol I ing schedules were sel ected for the Cl ass C plates(Table II and 2A). Six were nominal I y isothermal as before, with totalreduct ions of 20 and 50 percent at 20000F (10930C), 18000F (9820 c), andI 6000F (871°C) . The remaining plate was rol 1ed according to a conventionalindustrial practice. A) 1 plates were finished at a thickness of I -1 /k-inch.In this case, however, the slabs were cooled to room temperature after pre-
1 iminary sizing, reheated to 20500F, and then air-cool ed to the differentfinal -rol I ing temperatures.
Various heat treatments involving normal izing, anneal ing, and horcoge-nizing were performed on selected plates after rol I ing and prior to mechanicaltesting. Details of the treatments and designations of the heat-treatedplates are given in Table III.
Ferrite Grain Size: With the method of 1ineal anal ysisj a determinationwas made in each PI ate of the average 1 inear intercept between ferrite-ferriteor ferrite-pearl ite boundaries along the three reference directions: rol 1-ing (R), transverse (T), and thickness (Z).
In one approach to establ is’hing grain size, t he over-al I mean, & wasobtained as the cube rcot of the product of the three intercepts. Assuming
the ferrite grains to be Kel vin equi-edged tetrakaidekahedrons which com-
pletel y fil I space, the number of ferrite grains per unit volume of ferrite
is cal culable from: 20721
The AsTM grain-size numberstabul at ion by Rutherford et
~ - 0.4263v
2
could then be derived from 10910 Nv USin9 a~[.21

-5-
TABLE III. DETAILS OF HEAT TREATMENT.
ABS CLASS B
——PI ate
Identification Treatrm?.nt Desig”at ionN.mbe r
2, 9, 10 1650° F (899°C), 1-1/2 hr., air-cooled . . . (N3rmalize) 2a,9a, 10a*16, 20, 25 16a,20a.25a
10 1725°F (9 b00c), 2-)/2 hr., furnace-cooled . . . (FIJI I Anneal ) I oB*20 1725°F (9400 C). 5 hr., furnace-cooled . . . (Ful I Anneal ) 20C
8 1250°F (677°C), I hr., atr-cooled . . . (Subcritical Anneal ) 8=9 12500F (6770 c), 2 hr., air-ccaled . . . (Subcritical Anneal ) 9f9, 16 12500F (6770 C), 2 hr., furnace-cool ed . . . (Subcritical Anneal )8
9F,16FlZ500F (677°C), 10 hr., air-cooled . . . (Subcritical Anneal ) 8g
8 1250°F (677°C), 10 hr., furnace-cooled . . . (Subcritical Anneal) 8G
8
‘:b*
22000F (12000 C), 20 hr., slowly cooledw . . . (Ilmogenize)8H 16500F (899°C), 1-1/2 hr., air-cooled; repeated . . .8H 1650°F (899°C), 1-1/2 hr., air-cooled (Normalize); followed by
16s0°F (899°C), 1-1/2 hr., f“r.ace-cooled (Full Anneal
ABS CLASS C
PlateIde”t ifi.atio” Treatment Desiqmt ion
Nwnber
4, 7 1650QF (8gg0c), 1-1/2 hr., air-mwled . . . (Normalize) 4a, 78
4, 7 1250°F (677°C), 2 hr., air-ccoled . . . (Subcritical Anneal) 4f, 7f
Small letters represent air-cooling and capital letters furnace-cooling. The average rates ofair- and furnace-cooling through the transformation range were approximately 60° F (33°C) perminute and 4.50F (z.50c) per minute, respectively.
F.r”ace-.cxa led at a rate of approximately 1.8’”F (1.00C) per minute dam to about 12000F (649°C),a“d then air-cooled to room t.arperat. re.
An alternative grain-size evaluation was based only upon average in-tercepts in the T and Z directions, the reason being that fracture in con-ventionally oriented Charpy specimens propagates mainly in the T-Z plane.However, the difference between T-Z and R-T-z values was never mre than0.25 ASTM units (R-T-Z giving the smaller ASTM number) except in Plate B-23where the R- T-Z value was smaller by about 0.8s units. Charpy test resultshave been related in what follows to the T-Z or “fracture-plane” grain size.
Pearl ite-patch Size: Lineal analysis along the three reference directionswas similarly made to define the pearl ite-patch size. The pearlite regionsassumed various irregular shapes, and hence the mean pearl i.te lineal intercept(based on the three unidirectional averages) was taken as the nmst appropriateparameter for patch size. The volume fraction was given directly by the ratio
of total pearlite intercept to the total traverse in ferrite and pearl ite.
-6-
Inclusion Fiberinq: To provide at least a relative indication of theintensity of inclusion fibering, al I incl usions above a certain size werecounted on pol fshed and unetched surfaces using a micrometer microscope withtravel I ing stage. The lower size I imit was set at 0.02 mi.1 I imeter, and thetotal count, q, included those intersected by an imaginary 100 mil 1imeterI ine in the R-Z PI ane along the Z direction; the method originates withvan der Veen.7 The quantity, q, is thus determined by the size and shape ofindividual inclusions, as well as by the amount of included material . Forgiven inclusion content, a greater degree of inclusion elongation (or fiber-ing) is refl ected in a higher q value.
Tensile Testinq: Tensile tests were made in rol I ing (R) and thickness (Z)directions on al 1 as-rol I ed Class B plates from room temperature down to-LI050F (-z430c), using 20 or n-ore specimens per plate and test direction.
Room-temperature tests were al so made on al I as-rol I ed Class C, and some ofthe heat-treated PI ates. PI ain cyl indrical specimens with shoul ders forgripping were machined to a gage diameter of 0.25 inch and length about0.875 inch, with total specimen I ength of l-l /2-inch (Class B) or I -1 /4~inch(Class C). Apparatus and test procedure have been described elsewhere.Lower-yield stress, u] timate tensil e strength, and the true stress at fracturewere computed from autographic 1oad vs. el ongation records, the pul I ing speedbeing about 0.05 inch/minute. The fracture-stress cal culation, and that fort rue fracture-strain as wel 1, required the cross-sectional area at fracture;*this was obtained by rejoining the ha] ves of a broken specimen and measuringthe mininwm diameter on an optical comparator. A mean diameter was used ifspecimens became el I iptical during extension. For all as-rolled Class Bpl ates, the lower yiel d stress Oy, true fracture stresses OR and UZ, andtrue fracture strains, CR and CZ, (R and Z identifying directions of measure-ment) were plotted against test temperature in obtaining data presented below.
Charpy Impact Testinq: V-notch Charpy tests were made on al 1 as-rol I edand heat-treated plates. The 15 foot-pound (Tv-, ) and 50 percent fibrous
z(TV-500,4) transition temperatures were determined y testing about 25-30specimens per PI ate, with specimen Iengt h along the rol I ing direct ion andnotch in the thickness direction. Precision was estimated to be ~ 10.50F(60c) and + 180F (Iooc) for TV-,5 a“d Tv-50yd re~pectively, with a confidence
of 95 perc;nt. Tests were also made on some plates with specimen lengthalong the transverse direction. Complete experimental details and stasticalanalysis of the results are given in the Appendix.
Micro structural Examination: Metal Iographical I y polished and etchedsurfaces were examined for micros tructural detail s. Comparisons were madeof inter lamellar spacings of the pearlite in all Class B plates. The an-auntof spheroidization during subcritical anneal ing was estimated visual 1y andnoted as a fraction of the total cementite content . Fracture surfaces andmicrocracks were al so studied on sectioned tensil e and Charpy bars testednear the transition temperatures.
* Formul as are: 6 (true fracture stress) = Pf/Af and c (true fracturestrain) = I n (Ao/Af) where Pf and Af are load and cross-sectional areaat fracture, respective y, and A. is the original area of cross section.

-7-
Observations on inclusions with 1ight microscopy were I imited to adiameter of about I P. Below this 1 imit, to about 0.05 1A, el ectronmicroscopy was used to examine inclusion structure and other details Offracture on selected surfaces treated with a two-stage technique for pro-ducing chromium-shadowed, negative carbon repl icas. Oetails are found inthe Appendix.
RESULTS
Rot I ing schedules were selected with the intention of developing awide range of structure, especial I y of ferrite grain size and of themechanical fibering responsible for fracturing anisotropy. The I imitedsuccess in these efforts to manipulate structure is evident fromFigures 2 and 3. The ferrite grain-size variation was only 2 ASTM units,from about 6.4 to 8.65, and q was changed relatively I ittl e, excePt by theheaviest reductions. Further details are given in the Appendix.
A. Structure
Ferrite Grain Size: It is clear from recent studies that grain sizeafter recrystal I ization during hot working is determined in I arge measureby the size of the deformed parent grains. 22>23 The ~ea~o” is that new
grains tend to be nucleated along the boundaries of the 01 d. Since al 1
plates (of each class) were at the same austenitizing temperature beforerol I ing, al I ought to have had about the same initial austenite grain size.Therefore, the final austenite grain size of plates rol led above the criticalrange coul d i,ave been more nearl y al ike than might be expected in view of thewide variations in rol I ing history. This WOUId have I ed, in turn, to onlymodest differences in the UI timate ferrite grain size.
Fig. 2. Dependence ofFe pti te Grain Size(R-T-Z)m Rolling Historyof Class B (0) md Cla8sC (~) Plates. Numbersidentify platea describedin Table II. Points rep-resenting the same per-cent reduction are inter-connected. p2.atesrolledaccording to non-isothemlpractice (B-12, -22, -1;C-12) are rwpws ented bythe temperature of thefinishing pass. Al andA~ are the looer mdupper ctitical ternpe*atures, respe etively.

-8-
800 900 1000 I 100 ~
Fig. 3. Dependence of theFibering IntensityPazwnet;r, q, on io1lingHistory of C1O.SSB (0) andClass C (~) Plates.Numbers identify phtesdescribedin Table II.Points representingthesam percent rwductionare interconnected.PLates rolled accordingnon-isothermalpractice(B-12, -22, -1; C-12) are
wmsented bY thetemperatureof the finish-ing pass. Al mad A3 arethe lotiermd uppercriticaL temperatures,respectively.
to
Rolling Temperature
It is also known that heavier, more rapid and more nearldeformation contributes to greater hot-wmrk grain refinement. Iz%t ‘&s
reason may simpl y be the reduced time for growth subsequent to new-grainformation. Within 1imits, a similar trend should fol low from low deforma-tion temperature. Considering the over-al 1 cooling rate of plates rol ledat 14500F (see Appendix), the upper critical temperature (Ac 3) COUI d nothave been higher than about 1400°F. Therefore, a minimum austenite grainsize, evident as a peak in ferrite grain-size number, WOUId be a 1ogicalresul t of the heaviest reduction imposed at this temperature.
Rol I ing at 1250°F was probabl y not begun before at least partial trans-formation of the austenite, nor terminated before most of the transformationhad occurred. With ferrite being formed from unv.orked austenite at 1250°F,the final grain size would necessarily y be coarser than that from 145o0Ffinishing. Metal Iographical Iy obvious strain markings and grain-shape dis-tortion (Figure 4), together with higher hardness, reflected the incompl eterecrystal 1ization of ferrite after reduction at I z500F. On the Rockwel 1-Bseal e, these plates were harder by 5 to 10 points than al 1 others atcomparable grain size (see Appendix Figure 3A) .
The general 1y finer grain size of Cl ass C PI ates, by about 0.5 ASTMunits, is a natural reflection of the IIfine-grain!f practice by which thematerial is made, coupled with the fact that PI ates of this class werecool ed and transformed before austenitizing and rol I ing. The grain-coarsening temperature for the steel under study was determined to beabout 17250F; detail s are given in the Appendix. However, there is nodiscontinuous change in grain size with rol I ing over a range includingthat temperature. Perhaps none should be expected, since tendency towardsgrain coarsening is modified by both prior treatment and deformation.26Therefore, any coarsening temperature measured in a l’static” sense mayhave 1ittl e significance in actual rol I ing.
~ncl usion Character: The trend in B steel, of more elongation withheavier, lower-temperature reduction, is partl y a consequence of the over-al I shape change. Beyond this, it may al so refl ect the influence of

-9-
Fig. 4. Strain Markings md Grain-shapeDistortion in Class B Plates Rolled at 1250 F(T-z Plww). 2% Nital etch. 450 x
(a) B-1, 30% Non-isothemaL. (b) B-25, 15% Isothermal.(c) B-9, 30% IsothemaL. (d) B-23, 60% Isothemal.
rot I ing pressure being increased with lower temperature and thus actingto elongate inclusions more, as discussed by Pickering .27 Inclusions inC steel are eneral 1y longer than in B because silicates, which have highplasticity,2 % are nmre plentiful, and sil icate and SU1 phide are agglomer-
ated in a I arger, duplex form.
Pearl Ite Morpholoqv: Pearl ite-patch size varied more or less as did
ferrite grain size, al though with much scatter in the measurements. Theamount of pearl ite ranged from 18 to 28 volume percent, but was notsystematical IV related either to rol I ing history or subsequent heat treat-ment . Inter lamel Iar spacing COUI d not be correlated with rol 1ing practice.
Crystal Ioqraphic Texture: Various plates were examined, but only in
B-23 (6o percent at I 2500F) was the preferred orientation sufficient y wel Ideveloped to permit the plotting of a pol e figure. Using a modificationof the Schul z refl ection technique, 29 the three mutual 1y perpendicular
surfaces of a I /2 inch cube (oriented along R, T, and Z directions) wereexamined. The basic al though diffuse texture was (001) [1 10], which hasbeen found previously after rol I ing at temperatures as high as 14400 F.30,31

-1o-
B. Properties and Behavior
Tensil e Testinq: Selected examples of test data are given in Figure 5.Plates B-2 and B-23 were chosen as they represented extremes in rol linghistory from the I ightest high-temperature reduction (15 percent at 1950°F)to the hea iest low-temperature reduction (6o percent at 1250°F). AS inpast wrk, z the intersection of yiel d and fracture-stress curves defined aductil ity~transition temperature, OT.
-200 -1oo 0 “cI
80
60
40 [20}
B-231 1250”F, 60% ]
1i
L8
I .0+-f-” “ E~ “
08
f
..
0.6
0.4●z
..0 .“ .
0.2 .
0-400 -200 0 “F
-200 -100 0 “c[ 1
B -21 1950”F, 15%
i
I I I 1 I 1
1 \ 1 1 \ )
<-
f
.
.
Ez.
0 %
J/”
/“. 1
-400 -200 0 “FTemperature
Fig, 5. Twperature Depen&nce of Tensile Yield Stress (F, ) True Fracture Stress(F, ,v,)and Strain (c,, c, ) for Plates B-23 and B-2. Fracture in the absence ofmeaeural le plastic strain is indicated by ~ or ~ . Certain fractures locateduheregripping fiztu.masbore on the specimen have been treated by dividing load by minimumcross sectional ana and plotting the result tiithm arrotipointing updard. For theexample of fracturw outside of the neck region, stress and strain have been computedoith both actual fracture area and the minimum area in the neck; results are connectedby a vertical tie-line.
-11-
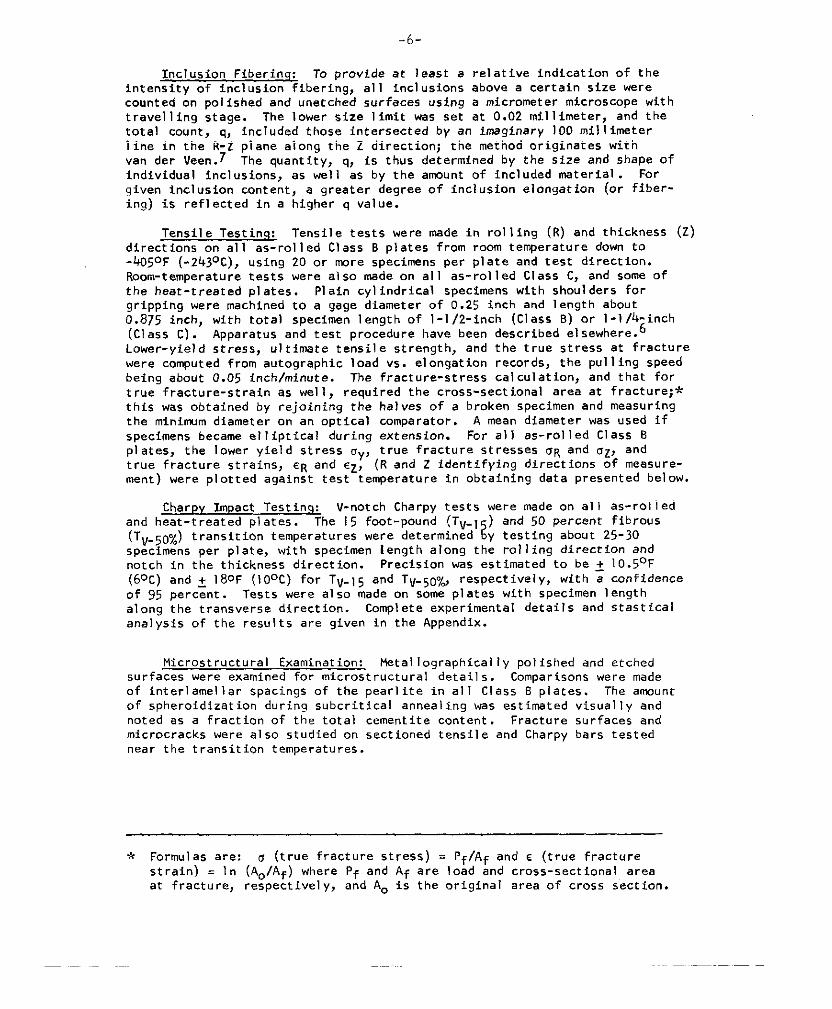
Certain fracturing peculiarities were encountered, particular y in B-23.Below DT, fracture in the Z direct ion sometimes occurred at stresses sub-stantial I y below the yield stresses; occasional 1y such fractures were foundin other PI at es and in the R direct ion as wel I . In metal Iographic sections
(Figure 6), the fractures are seen to have fol lowed closely the direction ofmechanical fibering. They were probably initiated at inclusions acting asinternal notches, after which propagat ion fol I owed at very I ow stress.
Fig. 6. l?icrosaczions (R-Z Plane) of Tensile Specimens from Plate B-23 ShooingFracture surfaces (hi-Plated)in ObviO~ ROlation tO ~ech~ical ~ibering. Tensileaxis vertical in all cases. 2% NitaZ.etch.
(a,b) Fraetum at stress beLou the yield level in a z-directionspecimen puLled at -396 F. 450X
(c) RO1Zing-phw de2atinationinitiated at an inclusion inan R-%kwetion ~pecimen pulled at -171 F. 900X
(d) CLeaoage cracks (indicatedby arwms ) aligned along load&s in an R-dirwction .specirnentestad at -315 F. 300X
-12-
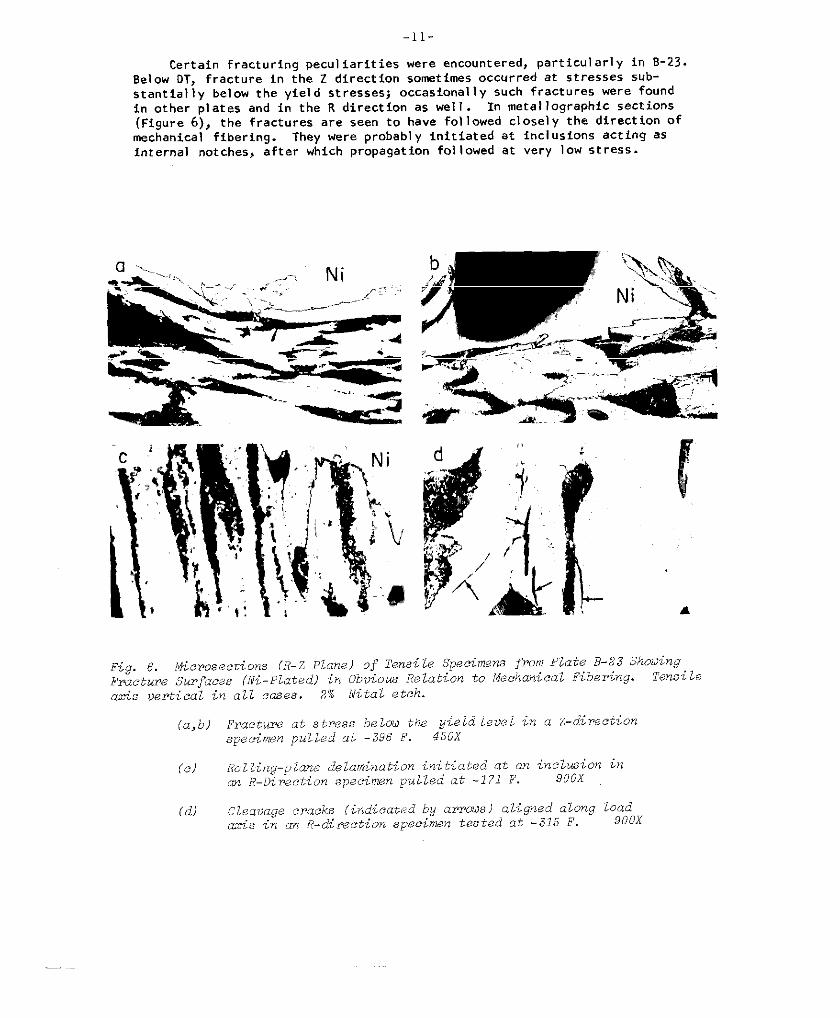
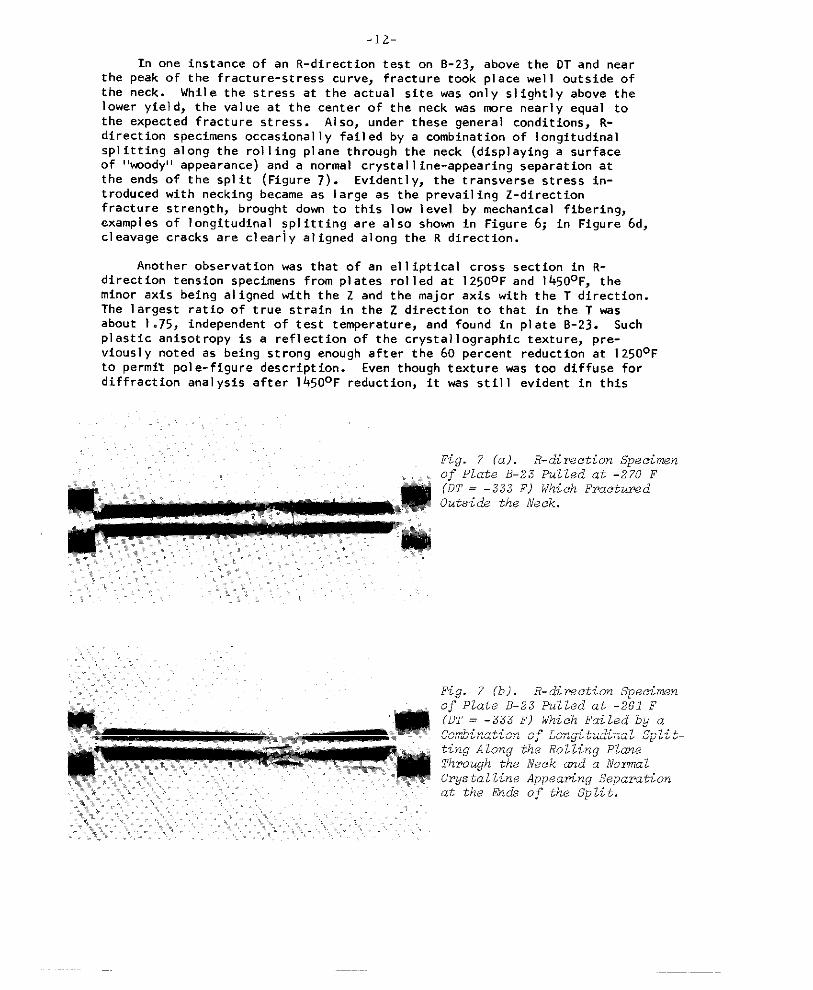
In one instance of an R-direction test on B-Z3, above the DT and nearthe peak of the fracture-stress curve, fracture took place we] 1 outside ofthe neck. While the stress at the actual site was only slightly above thelower yield, the value at the center of the neck was nwre nearly equal tothe expected fracture stress. Al so, under these general conditions, R-direct ion specimens occasional I y failed by a combinat ion of I ongitudinalspl itting along the rol I ing plane through the neck (displaying a surfaceof l’tmodyil appearance) and a normal crystal 1ine-appearing separation atthe ends of the split (Figure 7). Evidentl y, the transverse stress in-troduced with necking became as I arge as the prevail ing Z-directionfracture strength, brought down to this low level by mechanical fibering,examples of Iongitudi”al spl itting are al so shown in Figure 6; in Figure 6d,cleavage cracks are cl earl y al igned along the R direction.
Another observation was that of an el I iptical cross section in R-Redirection tension specimens from plates rot led at I z500F and 14500F, theminor axis being al ig”ed with the Z and the major axis with the T direction.The I argest ratio of true strain in the Z direction to that in the T wasabout I .75, independent of test temperature, and found in plate B-23. Suchplastic anisotropy is a refl ection of the crystal Iographic texture, pre-viousl y noted as being strong enough after the 60 percent reduct ion at I Z500Fto permit PO] e-figure description. Even though texture was too diffuse fordiffraction anal ysis after 14500F reduction, it was stfl I evident in this
,-, . . .,. -
.! =,.,. ,..,>. . .. .. . .. ...-.”%%.”.”,, ..:. ...”%.,.. ..; .: ~‘,-.*1
,.. ..% >’ . .. ..’. -..%%...,.,” ‘.’ . “ ..x, . ....j.’. “. .,. .’ .’.:. . . . . .. . .. . .,., .. . .. . ... . . .. . . ....”!... “., ... ‘,
. . . . . . . . ... . . . . . . . . . ,, ’....
Fig. 7 (a). R-direction Specimenof Plate B–23 Pulled at -270 F(DT = -333 F) Which FracturedOutside the fleck.
Fig. 7 (b). R-direction Specimenof Plate B-23 Pulled at -261 F(DT = -333 F) Which Failed by aCombinationof LongitudinalSplit-ting Along the Rolling PlaneThrough the Neck and a NormalCrystal?,ineAppearing Sepamtionat the .&ds of the Split.
-13-
departure from circutar cross section. A basis can be found in recent cat -CUI at ions for expecting a plastic anisotro y with greater Z-direction strainas a consequence of the observed texture. 3? Al so, from an isotropic p] asticitytheory, it can be argued that in plate B-23 the plane-strain yiel d stress atthe root of a notch through the thickness direction (as in a conventionalCharpy specimeg) ought to be increased by about another 3- I /2 percent abovethe usual (z/v3) x (uniaxial yiel d stress) for an isotropic material .32 Aneffect of this kind might properl y be regarded as embrittl ing, although onl ymil dl y SO.
Al I tensile ductility-transition temperatures are plotted against rol lingtemperature in Figure 8 (with tabulation in the Appendix) . Only the Z-direction val ues, DTZ, appear sensitive to rol 1ing history, the I evel beingincreased sharpl y in the extreme case of pl ate B-23. Some of the reason isfound in mechanical fibering (Figure 3), the more intense fibering acting toraise OTZ. That more is invol ved is evident from specific comparisons, asbetween B-Z3 (q = 106) a“d B-20 (q = 103), which are similar in q but not inOTZ, a“d between B-9 (q = 66) and B-20 (q = 103), in which case the higherDTZ is found in B-9. Residual cold work must also be involved. It was mostintense after the heaviest 125o0F reduction and correlates with the highestDTZ for these condit ions.
Various ratios of fracture stress and strain in R and Z directions maybe used to demonstrate the marked fracturing anisotropy. Those fornwl atedfrom true stress and strain at fracture in room-temperature tests were asreveal ing as any, and are PI ot ted against q, with good correl at ion, inFigure 9. Figure 10 contains exampl es of ductile Z-direction fractures inwhich the separation around inclusions is clearly seen. Cl ass-C anisotropywas consistently greater, which is to be understood against the backgroundof duplex and more massive inclusions in this material . R-direction prop-erties for both C and B stock were much the same; the difference grew outof the lower level s along the Z direction in Class C.
A further indication of residual COI d work from lZ500F finishing was evi-dent in the Petch-type plots of lower yield stress vs. (grain diameter)-l /2.33Such plots are given for al I B plates at sel ected test temperatures inFigure I I . A reasonable I east-square fit can be made to the data, excludingthose from the plates finished at 1250°F; ay is consistent I y higher in theI atter four cases, which is interpretable as an increase in the frictionstress, Ci, from COI d work. The increase in Ui (or lower yield stress) abovethe trend-1 ine level s is I isted in Table IV for the 12500F PI ates at theseveral test temperatures. The average increase is found to be larger thegreater the amount of reduction imposed on the ferrite, assuming that thenon-isothermal B-1 fits between B-25 and B-9.
Charpy Impact Testinq: These results were much rrore influenced byreduction schedule (Figure 12) . Trends were determined basical I y by ferritegrain size (Figure 2) and residual cold-work (Table IV). The inverse I inearrelationship between TV- I 5 and ASTM grain-size number is shown in Figure I 3,where the slope for both Class B and C of -20°F (-l 1°C)/ASTM No. is in theusual range .6,9
Two extra-grain-size effects are immediate! y apparent in Figure 13:One is the roughly 400F (22°C) displacement between Class B plates rol ledat and above I Z500F (Figure I 3a), which has its origin in residual CO1d work.The other is the 24°F (1 30C) separation between the two as-rol led Class Band C trend 1 ines (Figure 13d) . From previous work, it should be expected

-14-
that at least part of this separation can bechemical -coinpasition differences. 4 The ~~t
“F
-180
-220
:-260
-300
-340
rational ized in terms ofdetail ed study of transition
1000 1100 “c
‘c
-120
- 140
-160
-180
-200
Rol Iing Temperature
Fig. 8. Dependence of Tensile-Ductility Transition Temperaturecn RoUing Histowof Class B Plates. #umbers idsntify plates &ser-ibed in I?&le II. Points rep=s ent-ing the same percent reduction are interconnectedand Me Lled. Plates w 1ledaccording to non-isothermalpractice (B-12, -22, -1) are representedby the temper-ature of the finishing pass. Al and A3 are the Louer and upper CA tical twnpe>atures, respectively.
temperature in relation to composition is described in a recent report byBoul ger and Hansen ta the Ship Structure Comnittee.9 With coefficientsestabl ished in that wrk, by simple correlation anal ysis, a difference inTV. ]5 at constant grain-size can be cal culated fram the two analyses inTable I which is exactly the observed 24°F (13°C) . Wowever, by calculatingwith a fornula generated in the same work through a mre rigoraus multiplecorrelation anal ysis, the difference is found to be only 5°F (3aC). Thediscrepancy might be understmd on the basis of the uncertainty inherentin such work. Conversely, other factors may be involved which might beexploited, if they could be identified.
A third passibl e extra-grain-size effect WUl d be that derived frammicrof issuring. Al though a fairly wide variation in fracturing anisot ropy

-15-
1 I 1 I {
0.7
N.
“~ 0,6
:‘t
i
o L,, I I I I20 40 60 80 100 120
Inclusion count q
Fig. 9. L@e,zlenee of Room TemperatureFracture Anisotropg in As-Rolled Class Bmd Class C Plates cm the FibetingIntensity
TABLE IV.
Parwmeter, q.
(a)
(b)
Fig. 10. Examp10s of Duct’iLe Z–directionFractures in Plate B-23 at -142 F(DT = -180 F), Shcwing SeparationArowad Inclusions. (i) 581X (b) 881X
TEMPERATURE DEPENDENCE OF YIELD PARAMETERS.
ETest
Temperature
‘F
RT
-1oo
-145
-235
-280
-320
AverageValU,
Class B Plates Rol led Above 1250°F ! Class B Plates Rol led at 1250°
Friction stress, Locking strength parameter Increase in lower yield stress
.i (1000psi)I/2 (or friction stress) from cold
ky (1000 psi-m- ) twrk (1000 psi)
B-25 B- I B-9 0-23
14.05 4.42 5.5 6.5 5 18
18.42 6.17 5 6 II 15
36.10 4.44 6 7 12 15
67.30 3.38 5 5.5 10.5 14
88.60 2.70 3.5 6 13 15
93.50 4.94 8 8.5 12.5 19
----- 4.35 5.5 6.5 12 .16
-16-
E9,
-320” F
120 v“
9● I
,.-.—
z /“ ., ● -280” F0100 – H“’o
&
80 /“’ /------
7
9— -~
..-. . -235° F
b=.
.80 – . .
m- ,, ---.al ~. /’. ..=z
-145° F
; 60 – -l OO° F.—>
,.: /3 .= RT
.-: 40 –,. ~
0 , /’/
/,/ /“
/’ ,.-”’2 o~” ,~
.>
t01 I I I I I I I I
0123456,7 8
Grain Diameter-+ (mm-~)
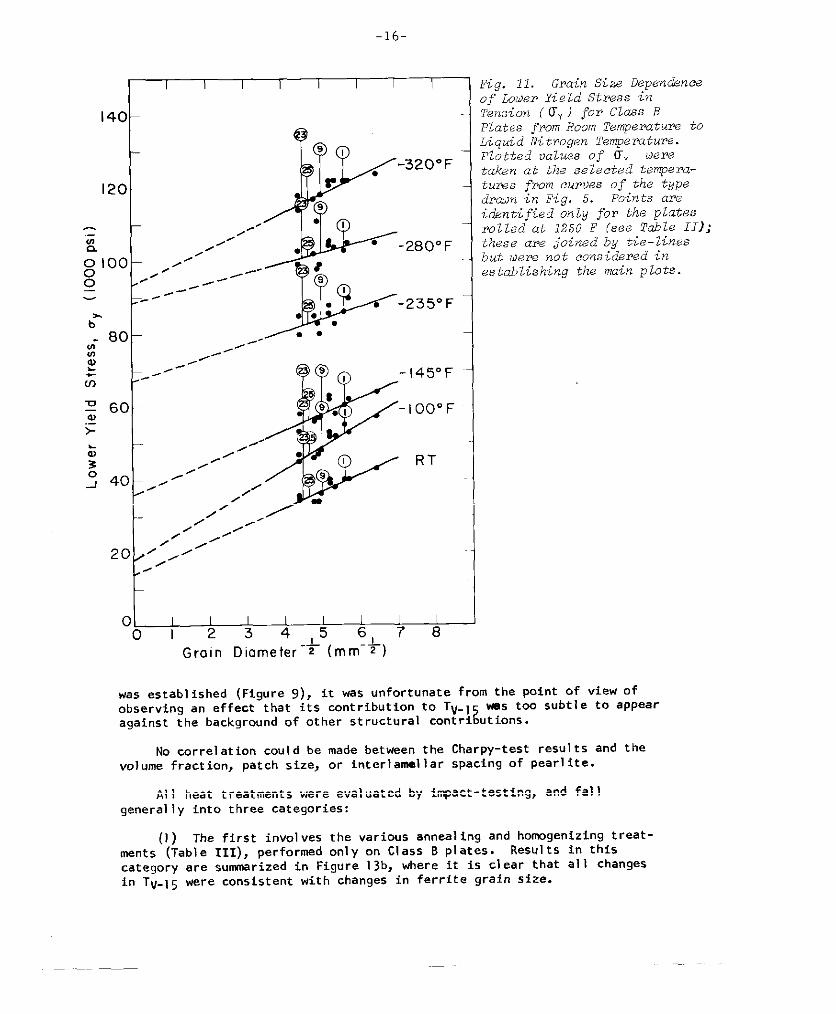
Fig. 11. Grain S’i ze Dependenceof LOWP Y’ieLd Stress in
Tension ((TY) for Class BPlates from Room ?emperatur% toLiquid hltrogen Temperature.plotted values of UY WPQtaken at the seLected tempera-tures from curves of the typedrcwn in Fig. 5. points cmidmtified only for the platesrolled at 1260 F (see Table II);these are joined by tie-Linesbut WT. not considered in
establishing the main plots.
was establ ished (Figure 9), it was unfortunate from the point of view ofobserving an effect that its cent ribution to Tv. ]
zwas tc-a subtl e to appear
against the background of other st ructural cent ri ut ions.
No correlation COUI d be made between the Charpy-test results and thevolume fraction, patch size, or interl ame.1 I ar spacing of pearl ite.
Al I heat treatments were evaluated by impact-testing, and fal I
general I y into three categories:
(1) The first involves the various anneal ing and homogenizing treat-ments (Table 111), performed only on Class B plates. Resul ts in thiscategory are summarized in Figure 13b, where it is c1 ear that al 1 changesin TV- I 5 were consistent with changes in ferrite grain size.
-17-
“F
80
60
r
40 -
u-l
720-/-
700 800 900 I 000 I 100 ‘cI I I I I
7 A
%
9
23
‘1./.
<
30%
I (NON -[SO.)o
-20
I
?
/43
[
30%
6’0 %
.L&~1400 1600 1800 2000 ‘F
Rolling Temperature
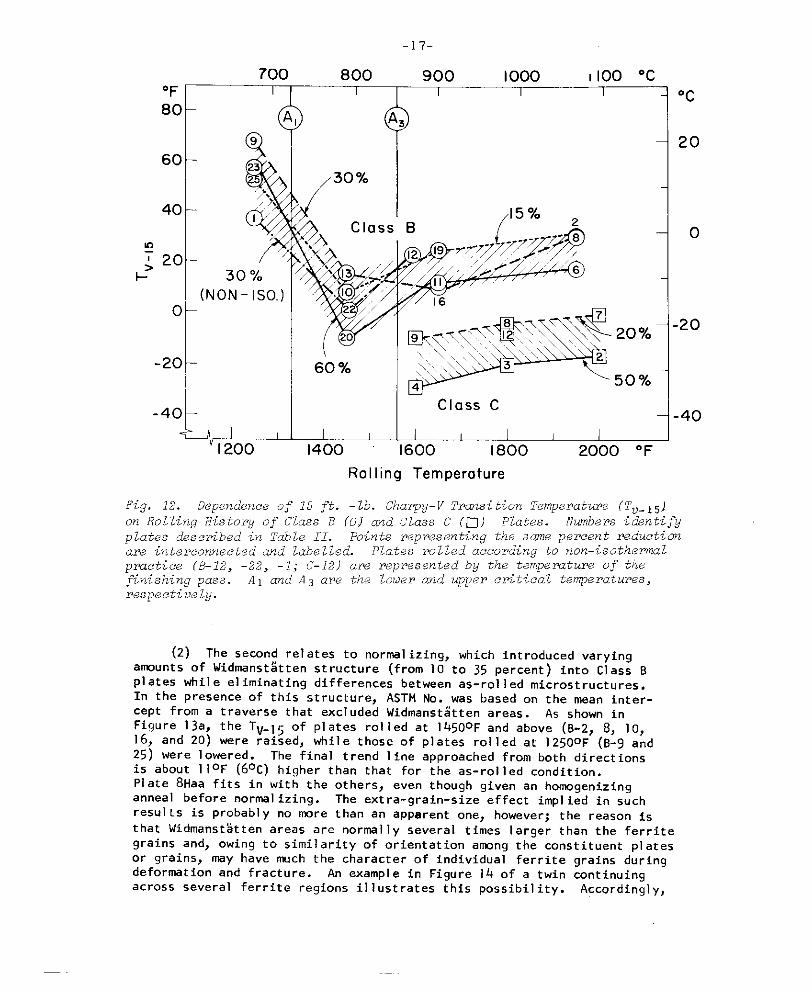
Fig. 12. Dependence of 15 ft. -lb. Charpy-V Trwsi tion Temperature (Tv_L~1on RolZ.ingHisto~ of Class B (0) and Class C (~) Plates. Numbers identifyplate~ de~ctibed in Table II. Points representing the sconepercent reductionare interconnectedand labelled. Plates rolled according to non-isothermalpmctice (B-12,-22, -1; c-12) arw representedby the temperature of thefinishing pass. A 1 and A 3 are the louer and upper critical temperatures,respectiw Ly.
(2) The second relates to normalizing, which introduced varyinganuunts of Widmanst&itten structure (from IO to 35 percent) into Class Bplates whil e e] iminating differences between as-rol led microstructure.In the presence of this structure, ASTM Wo. was based on the mean inter-cept from a traverse t hat excl uded Widmanst2tten areas. As shown inFigure 13a, the TV-IS of PI ates rol led at 14500F and above (B-2, 8, IO,16, and 20) were raised, while those of plates rol led at 12500F (8-9 and
25) were I owered. The final trend I ine approached from both direct ionsis about I 10F (60c) higher than that for the as-rol led condition.Plate 8Haa fits in with the others , even though given an homogenizinganneal before normal izing. The extra-grain-size ef feet impl ied in suchresul ts is probabl y “o rrmre than a“ apparent one, hO~ever; the ~ea~o” f~
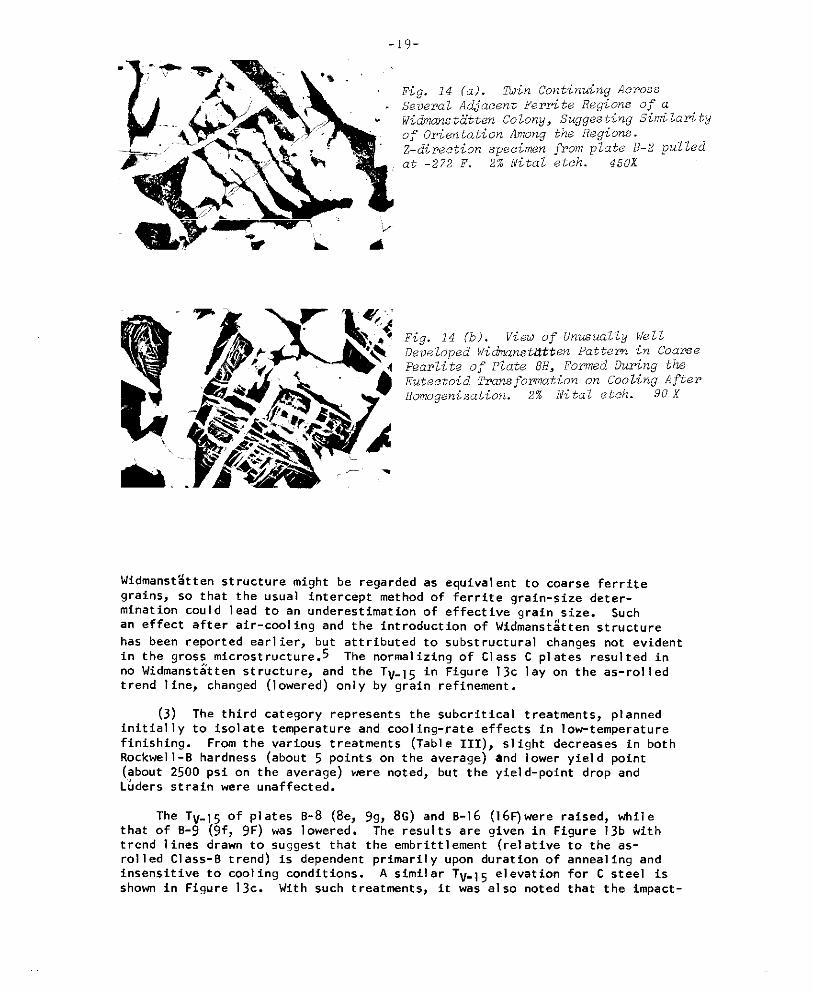
that Widmanst’Atten areas are normal I y several times larger than the ferritegrains and, owing to similarity of orientation among the constituent PI atesor grains, may have much the character of individual ferrite grains duringdeformation and fracture. An exampl e in Figure 14 of a twin continuingacross several ferrite regions il lust rates this possibil ity. According y,
“c
20
0
20
40
-18-
100
80
60
2 40
+> 20
I
o
-20
——
(a)
I , , ( , I !
46[ 1 1 1
7 8 9F Grain Size ASTM No.
‘:rI
~ 40
T
k> 20
0
L
\
\
*7
,@ 4’
-20z 3
47.
-40
6 7 8 ~
\
8s (b)
;\
AA
\
@
e . .
,08 Lx
(6F8
(0
Note: Change inabscissascale
456789
1 1 1
.... (d)... .
‘-- .. . .‘-. . ... . . ‘- . . . .
Y
‘----.. . . . -%..-..
‘- .. . . .. . .. . . . .
,~
..,- ‘
\~las/c.:’’’’” . .. .._clas. ~
.. .. . .-..
‘- . . . .. . . . .
-..
— As railed–.– Normalized
------- Subcritically annealedA 1 \ 1 I
‘6 7 8 <
30
20
10
0
10
20
30
c
30
20
10
0
-lo
-20
-30
-40
Grain Size ASTM Na.
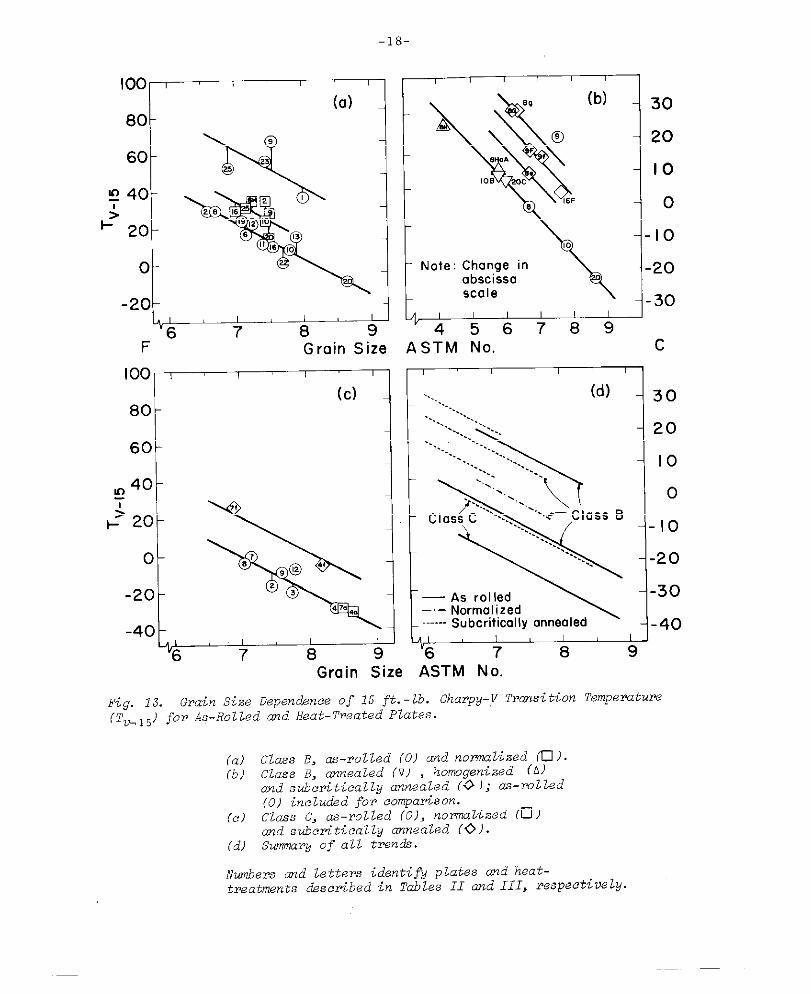
Fig. 13. Grain Size Depenck?nceof 15 ft.-lb. Charpy-.VTr@mi tion Temperat~
(To.,~) for As-Rolled and Heat-TreatedPlates.
(a) Class B, as-rolled (0) and normalized (U).(b) Class B, annealed (v) , homogenized (A)
and subcriticallyannealed (0 ); as-rolled(0) included for cornpar%on.
(.) Clews C, as-rolled (0), normalized (~)and subctiticallyannealed (0).
(d) Swmna~ of all trends.
Numbers cmd letters identify plates md heat-trwatmentsdzscribedin Tables II md III, respectively.
-19-
Fig. 14 (a). !lhinContinuingAcrossSeveral Adjacent Fe?tite Regions of aWidmcxsttitten Colony, Suggesting Similatityof OrientationAmong the Regiom.Z-directionspecimen from plate B-2 pulledat -272 F. 2% Nital etch. 450X
.— --- —, . . . . !
Fig. 14 (b). Vieu of Unusual%y We11Developed WidnanstttttenPuttern in CoarsePearlite of Plate 8H, Formed During theEutectoid Transformationon Cooling AfterHomogenization. Z% Nital etch. 90 x
Widmanst~tten structure might be regarded as equival ent to coarse ferritegrains, so that the usual intercept method of ferrite grain-size deter-minant ion cou I d I ead to an underest imat ion of ef feet ive grain size. hi chan effect after air-cool ing and the introduction of Widmanst~tten structure
has been reported earl ier, but attributed to substructural changes not evidentin the gross microstructure. 5 The normalizing of Cl ass C PI ates resulted inno Widmanstatten structure, and the TV-15 in Figure 13C lay on the as-rol ledtrend 1ine, changed (lowered) only by grain refinement .
(3) The third category represents the subcritical treatments, plannedinitial I y to isolate temperature and CCOI ing-rate effects in low-temperaturefinishing. From the various treatments (Table III), SI ight decreases in bothRockwel I -B hardness (about 5 points on the average) and I ower yield point
(about 2500 psi on the average) were noted, but the yiel d-point drop andLfiders strain were unaffected.
The T“-] 5 of plates B-8 (8e, 9g, 8G) and B-16 (16 Fjwere raised, whilethat of B-9 (9f, 9F) was lowered. The results are given in Figure 13b withtrend 1 ines drawn to suggest that the embrittlement (relative to the as-rol led Cl ass-B trend) is dependent primaril y upon duration of anneal ing andinsensitive to cool ing condit ions. A similar TV., ~ elevation for C steel isshown in Figure 13c. With such treatments, it was al so noted that the impact-

-20-
energy vs. test-temperature curves became mwre steep and that the maximumamount of energy absorbed was increased by as much as a factor of 2 in someinstances. The data are sunmmrized in Table V.
Stout and McGeady34 also observed embritt 1ement in a 0.25 percentC Si-kil led steel after holding at 12000F for 1 hour and air cooling; agingwas suggested in expl anation of that finding. It is difficult for tworeasons to u“dersta”d how the subcritical embrittlement can be interpreted
relative to aging: The degree of embritt 1ement is strongly dependent upontime at temperature yet dislocation atmxpheres ought not to be stableabove about 8000F.3$ The insensitivity of tensil e yiel d behavior to timeat 1250°F or to cool ing conditions reinforces this position. Thus changes
in the ferrite H x may not be responsible. In that vein, there was no
effect upon the TV-20 transition temperature of a 0.01 percent c iron after
hol ding at 12500F for 15 minutes .36 tkmeover, fracture in Charpy specimensof the present wrk, heated at 1 ZSOOF and broken near the transit ion tenrper-ature, was mainly transgranular cleavage which rules against any grain-
boundary embritt I ement acting to I ower the notch toughness.
The obv’ous change in microstructure with 1250°F heating was spheroid-ization. Al though that development is usual 1y associated with the tougheningof medium and high-carbon steel , there is at least one observation by Rinebolt37
TABLE V. RESULTS OF SUBCRITICAL HEAT TREATMENTS.
P1ate
(Tab~” III)
8-8B-8eB-8gB-8G
B-9B-9fB-9F
B-16B-16F
c-4c-4f
C-7c-7f
Heat TreatmsntSpheroidization
Ourat ion, Cool ing of Cement ite, %hrs.
as-rol led o1 air 50
10 air I 0010 furnace I 00
as-rol led
2 air 8:2 furnace 80
as-rol led2 furnace 8:
as-rol 1ed o2 air 50
as-rol led o2 air 50
-- I 0718 >14045 20043 >190
> 90~;>% >130j2.?+ 108
-- 10227 176
-- 12818 > 180
-- 127
25 152
I

-21-
of the opposite effect in a 0.3 percent C steel . Upon plotting ~ TV-) against
ipercent spheroidizatio”, from Table V, the resul t is a reasonable stra ght linewhich at I east suggests a physical relationship (Figure I 5) . Some basis forsuch a relationship might be found in alterations at the ferrite-pearl iteinterface. With spheroid ization in these low-carbon steels the ferrite-pearl ite interface may become less effective in its abil ity to arrest acleavage crack. Representative microsections are shown fn Figure 16. InFigure 16a, a cleavage crack (Ni fil led in plating) has travel led across aconsiderable e region of spheroidized cem.entite. In Figure 16b, cracks are
130—
Fig. 15. Rise in To_15 as a
Fmetion o.fPereen tSpheroidia;tionDuringSubcriticalAnnealing ofClass B (0) and Class C(~) Plates.
Spheroid izotion, “A
seen in both pearl ite and ferrite, but there is a strong suggestion here of
blunting and defl ection at the pearl ite-ferrite interface.
Whatever the ful I reason for the embrittlement, it is equivalent in itseffect to a decrease in the ASTM grain-size number of as~rol I ed ferrite by asmuch as 2 units, this being roughly the ratio of the maximum ~Tv-15 inFigure 15 to the -20 °F/ASTM No. slope of the trend I ines. Al though the resul tof spheroid ization might be regarded as an increase in effective mean-freecrack path, there are stil 1 no grounds for imagining that change in carbiderrorphol ogy, even to the point of its compl ete el iminat ion from the micro-structure, COUI d account for such a I arge increase. The suggest ion being
made is onl y qual itative at best. Other support for it does come from the
al tered form of the impact-energy vs. temperature curve. that after 1250°F
heating is nnre nearly characteristic of ferrite alone. 58
A few resul ts of tests on Charpy specimens taken paral Iel to the trans-
verse direction (notch stil I along the z direction) are summarized in

(a) Propagation 0f a cleavage crack(Ni fiZled in plating) across aconsiderableregion of spheroidizedcementite in a Charpy specimen fromplate B-16F tihiehabsorbed 25 ft. -lb. at 50 F (Tv_l~= 37 F). Large
amount of eemwtite seen here
(R-T plane) is a consequence 0fbanding. 450 x
(b) Cleavage cracks in pearli teand ferrite blunted or deflectedat the pearlite–femite interface.Z-directionspecimen from plateB-2 pulled at -272 F. 950x
Fig. 16 (a) and (b) RepresentativeMicros ections Comparing Cleavage PropagationThrough Spheroidized Cementite and Pe?arlite. 2% Nital etch.
Figure 17. The greater anisot ropy before compared to after heat treatmentis to be expected in view of the reduced fibering intensity (lower q),chemical heterogeneity, etc. resul ting from the treatments.
If over-al I results are examined in rel at ion to the 50 percent fibroustransition temperature, the outcome is much the same. The SI ope of Tv.50xvs. grain-size number v.es somewhat higher, being about -z70F (150C) /ASTM NO.
Fig. 17. Effect of Homogenization onthe OrientationDependence (R us. T)of charpy Impact Energy Absorbed as a
Function of Temperaturefor Class BPlates. Transition curves of as-rolled plates 19 and 25 on the leftare compared with those of homogenized(8H) and homogenized-normalized-annealed (8HaA)pZates on the right.Nwnbers and letters identifyplate.sand heat–treatmentsdescribed inTables II and III, respectively.
-23-
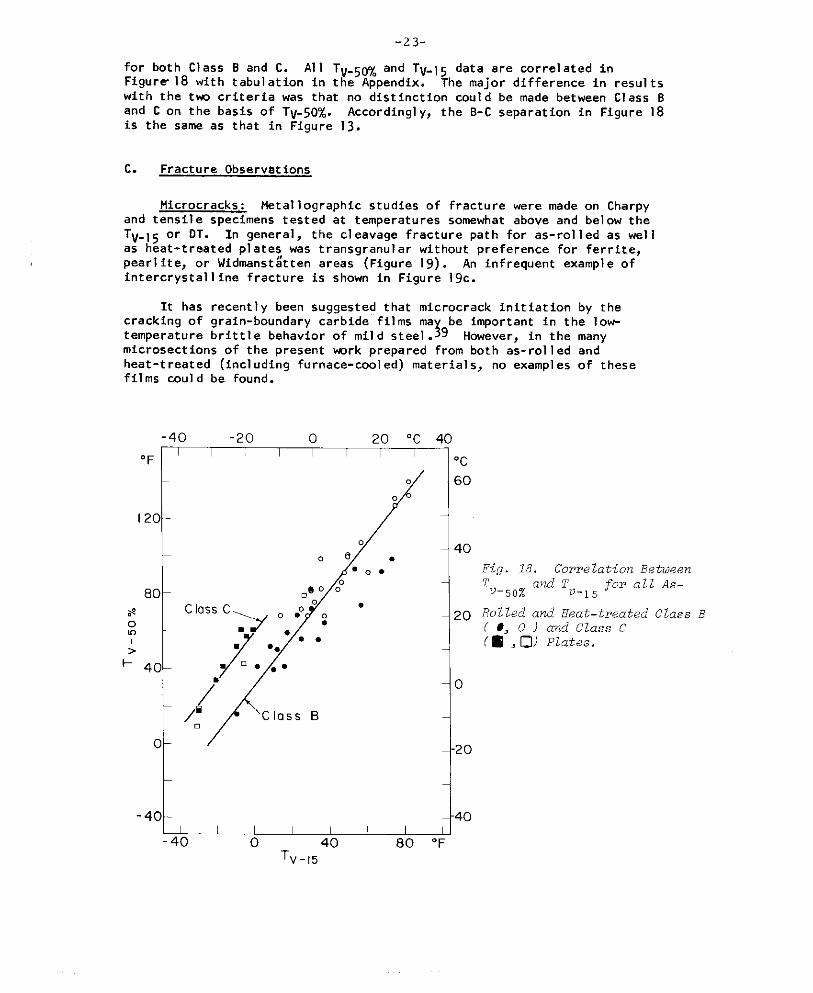
for both Class B and C. All TV.50Z and Tv.,~ data are correlated inFigure 18 with tabulation in the Appendix. The maior difference in resul tswith the tvm criteria was that no distinction coul~ be made between Class Band C on the basis of Tv.50Z. According y, the B-C separation in Figure 18is the same as that in Figure 13.
c. Fracture Observations
Microcracks: Metal 1ographic studies of fracture were made on Charpyand tensil e specimens tested at temperatures somewhat above and bel ow theTV-,5 or DT. In general, the cleavage fracture path for as-rol led as wel 1as heat-treated plates was transgranular without preference for ferrite,pearl ite, or Widmsnst&te” areas (Figure 19) . An infrequent example ofintercrystal I ine fracture is shown In Figure 19c.
It has recent 1y been suggested t hat microcrack init iat ion by thecracking of grafn-boundary carbide films ma be important in the low-
;temperature brittle behavior of mil d steel . 9 However, in the manymicros ectio”s of the present mrk prepared from both as-rol I ed andheat-treated (including furnace-cooled) materials, no examples of thesefilms COUI d be found.
-40 -20 0 20 “c 40
“FI I I I I
/
o
0
I 20 -
0
08.● O*
80 .90 0°
# class c
00 >O.”; )
~/
/“/: Class B
o
-40 -I I
-40 0 40
Tv-15
.
I I80 “
‘c
50
40
?0
3
20
40
Fig. 18. Corre Lation Between2-”v–~~% ~_15 for all As-and T
Rolled and Heat-treatedCla6.sB( ., 0 ) and Class c
( ~ , 0) Plates.
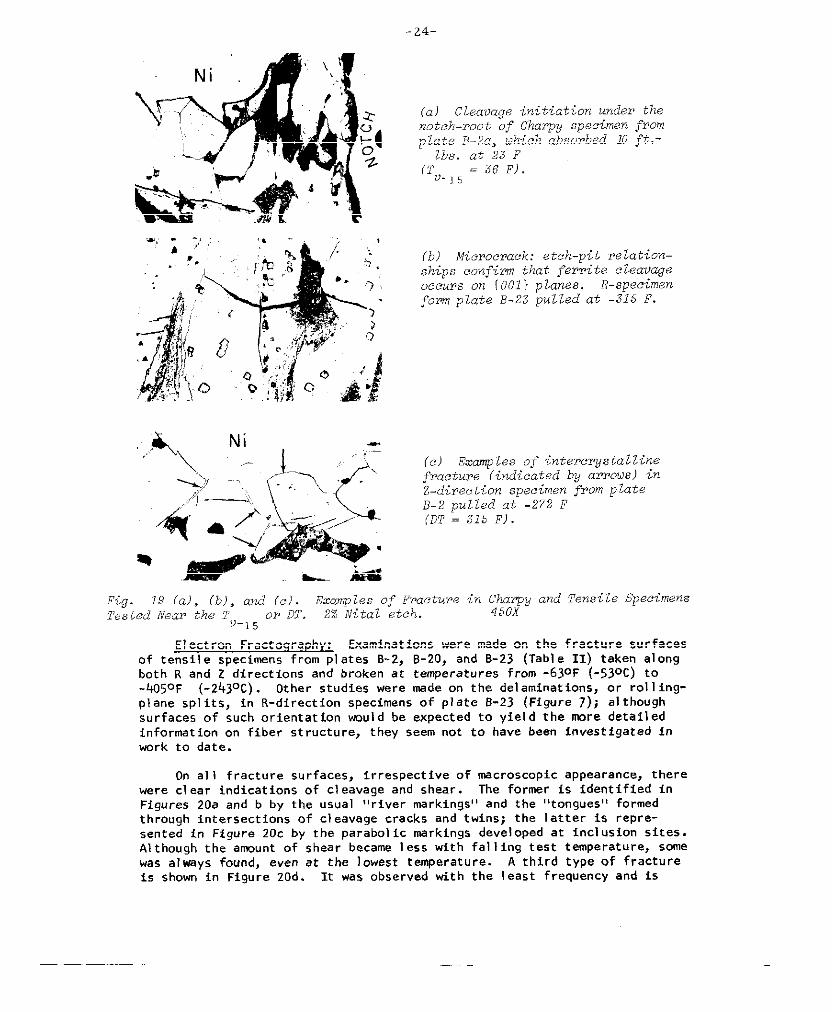
(a) Cleavage initiation under thenotch-root of Char’py speciman fromplate B-2a, uhich absorbed 10 ft.-
lbs. at 23 F(T –36 F).v.~~ –
(b) MicYocKIck: etch-pit relation-ships confirm that ferrite cZeauageoccurs on {001} planes. R-specimenform pLate B-23 pulled at -315 F.
(c) E.wxnples of intercrysta2Zinefracture (indicatedby arrow) inZ-directionspecimen from plateB-2 pulled at -272 F(DT = 315 F).
Fig. 19 (a), (b), and (c). EzampZ.esof P’raeturein Charpy and Tensile SpacimensTested Near the !7 o? DT. 2% ltitaletch. 450X
u-~~
Elect ron Fractoqraphy: Examinations were made on the fracture surfacesof tensile specimens from PI ates B-2, B-20, and B-23 (Tabl e II) taken alongboth R and Z directions and broken at temperatures from -63°F (-530C) to-4050F (-2430C) . Other studies were made on the delamination, or rol I ing-
plane SPI its, in R-direction specimens of plate .9-23 (Figure 7); al thoughsurfaces of such orientation would be expected to yield the more detailedinformation cm fiber structure, they seem not to have been investigated inwork to date.
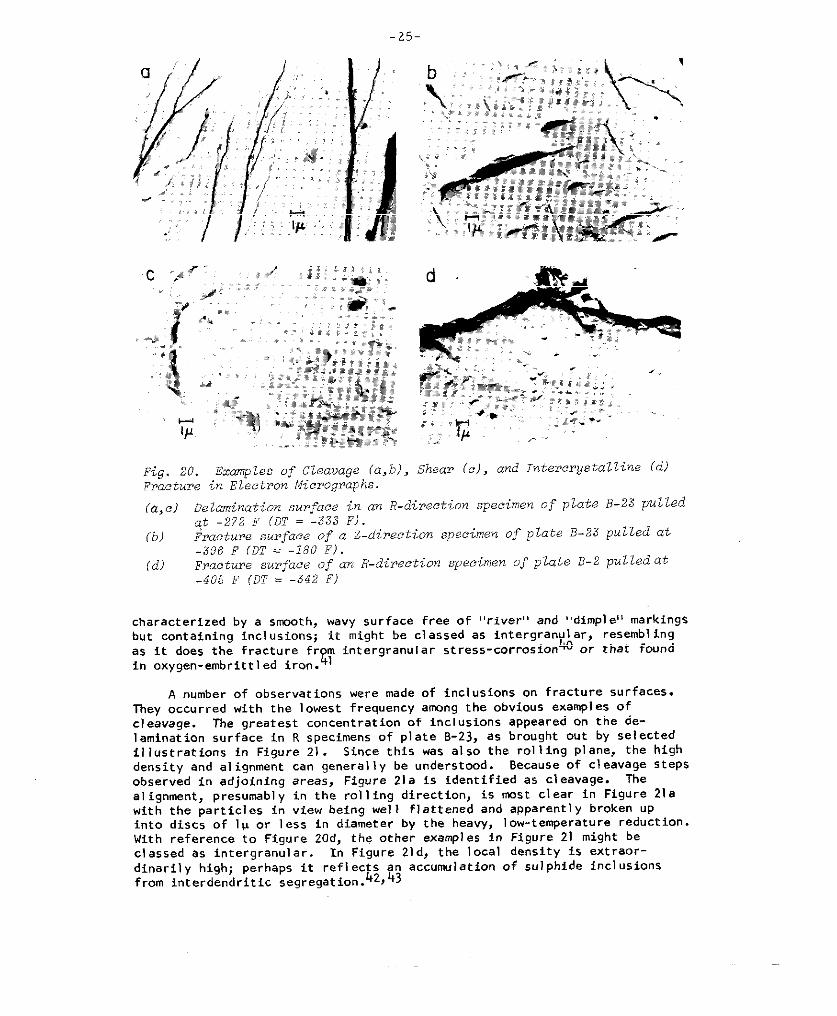
On al I fracture surfaces, irrespective of macroscopic appearance, therewere cl ear indicat ions of cl eavage and shear. The former is identified in
Figures 20a and b by the usual “river markings” and the “tongues” formedthrough intersections of cleavage cracks and twins; the latter is repre-sented in Figure 20c by the parabol ic markings developed at incl us ion sites.Although the amount of shear became less with fal 1ing test temperature, sanewas al ways found, even at the 1owest temperature. A third type of fractureis shown in Figure ZOd. It was observed with the least frequency and is
-25-
Fig. 20.” EXq LeS of cleavage (a,b), s~eap (c), and Inte?cw6tal~ine (d)Fracture in Electron Micrographs.
(a,c)
(b)
(d)
Delarninatiorzsurface in an R-direction specimen of plate B-23 pulled@ -272 F (DT = -333 F).Fracture sur.faceof a Z-direction specimen of plate B-23 pulled at-396 F (DT = -180 F).Fracture surface of an R-direction specimen Of PLate B-Z PU1 led Qt-405 F (D? = -342 F)
characterized by a srmoth, wavy surface free of “river” and “dimplei’ markingsbut containing inclusions; it might be classed as intergranul ar, resembl ingas it does the fracture fr m intergranular stress -corrosion~ or that foundin oxygen- embrittl ed iron. &
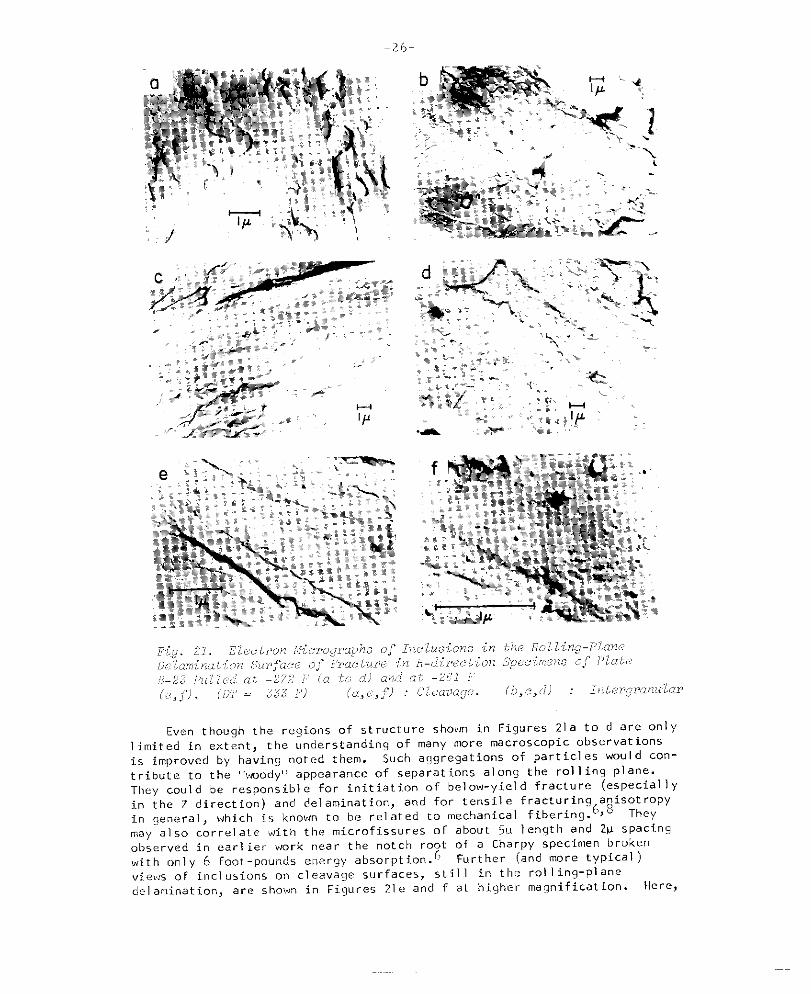
A number of observations were made of inclusions on fracture surfaces.They occurred with the I owest frequency among the obvious exampt es ofcleavage. The greatest concentrate ion of inclusions appeared on the de-lamination surface in R specimens of plate B-23, as brought out by selectedillustrations in Figure 21. Since this was also the rol I ing plane, the highdensity and al ignment can general I y be understood. Because of cleavage stePsobserved in adjoining areas, Figure 21a is identified as cleavage. Theal ignment, presumabl y in the rol I ing direction, is most clear in Figure 21awith the particles in view being we] I flattened and apparentl y broken upinto discs of I w or I ess in diameter by the heavy, I ow-temperature reduction.With reference to Figure 20d, the other examples in Figure 21 might beclassed as inter granular. In Figure 21 d, the I ocal density is ext raor-dinaril y high; perhaps It refl ec~z v accurmilation of sulphide incl usionsfrom interdendritic segregation. ,
-26
.
.,.., .,<,~.,-:.,, ,.
*
Even though the regions of structure shown in Figures 21a to d are onlyI imited in extent, the understandin~ of many more macroscopic observationsis improved by having noted them. Such aggregations of particles would con-
tribute to the “woody” appearance of separations along the rolling plane.They could be responsible for initiation of below-yield fracture (especial I yin the Z direction) and delaminat ion., and for tensj.le fracturin9 ani50tr0PYin general, 6 8 Theywhich i~ known to be related to mechanical fibering. ~may also correlate with the micro fi. ssures of about 5U length and 21J spacingobserved in earl ier work “ear the notch root of a Charpy specimen broken
~ F., ther (and more typical )with only 6 foot-pounds eneryy absorption.views of inclu5i0ns on cleav~ge surfaces, 5Li1 1 in tlyc rOl lin~-planedelamination, are sho’wn in Figur@s Zle and + at higher magnification. Here?

-27-
inclusions are more randomly distributed; as the size is reduced, towardsabout ‘C1.lp, they become more nearly spherical as WCI I .
DISCUSSION
Observations have been made on several el ements of structure as theyrelate to the ductile-brittle transition in ship-bul I steels. Ferrite grainsize proved to be by far the most significant, which confirms what is knownfrom l.ong experience, and it was shown once again that the TV. ] ~ transition
temperature is lowered by about 20° F (1 1°C) for each unit of increase inASTM ?rain-size number. There can be little doubt that the structural routeto low transition temperature I ies along a trend I ine of the kind drawn inFigure I 3. At the same time, the probl ems in attempting to fol I m! such aroute, within the frame,mrk of conventional practirc, have been indicated.
In B steel, the resul t of more-or-l ess conventional finishing wasASTM 7.10 in B-12 (Figure 2). The smal I est size was only ASTM 8.65 inB-20, produced by the unconventional 60 percent isothermal reduction at14500F. The grain size in other plates rol led at 14500F was general I ythe next smal lest, by about I ASTM unit (B-1 3, B-1 O, and B-22); of thesePI ates, the Royal Netherl ands practice was most closel y simul ated in B-22.Thus rel ativel y I ittle has bee” done to improve on establ ished control led-rol I ing practice for ferrite Srain-size refinement. Simil ar findings weremade in C-steel pl ates. The smal I est grain size now was ASTM 8.3 in C-4,reduced 50 percent isothermal I y at 16000F. The resul t of a more near) ystandard practfce was ASTM 7.7 in C-12.
Procedures to fol low in moving stil 1 further down the TV. I vs.)ASTM No. trend I ine can be imagined, suggested, and even cited rom
experience. However, al I mu] d invol ve operational probl ems, difficul tif not impossible to solve in current practice.
Smal I ferrite grain size is to be expected from austenite that isfine- grai”ed prior to transformation .22, 23 Therefore, the need is tominimize pre-transformat ion austenite grain size. This can be done, inprincipl e at I east, by restricting austenite grain growth before reductionbegins; some obvious possibil ities are to introduce grain-refining agentsin steel-making so as to el evate coarsening temperature, 44,45 ~~ to cool
and transform before reheating and rol I ing rapid] y at the lowest possibl etemperature above the critical range. It can al so be done by ensuring amaximum density of ““cl eat ion sites for austenite recrystal I ization duringhot-working; now, the emphasis COU1d be PI aced on heavy reduction to in-crease the ratio of grain-boundary area to grain volume 23?24 or on includedparticles which act as intragranular nucleation centers. 23,46 Sti] ] Other
possibilities relate to cool ing-rate control, to minimize time for austenitegrain growth in the interval between reduction and transformation, and toaccel crate transformation; response to efforts in this direction shoul d beimproved in thinner plates.
Apropos to the 1ast point, Stout and co-workers 47 found significant
improvement in the notch toughness of pressure-vessel steels if, insteadof normal izing, COOI ing from the austenitizing temperature was accOmpl ishedby spray-quenching; the effect was reported to resul t from ferrite :Irainrefinement, al though no quantitative comparison of grain sizes was estab -I ished. As a further illustration, a ferrite grain size as small as ASTM 1 Ihas been obtained i“ AISI 1020 Si-Al-kil led steel bars by cool ing from the

-28-
austenitizing temperature in air (to 13000F); fol lowed by lead (at I 100° F),and final 1y with a water-quench. 4 f.bre pertinent to the entire last para-graph, the results of recent 1y reported experiments~ on medium-carbon steelsdemonstrate how extraordinarily y smal I ferrite grain size may become undersome conditions: The vmrk involved heavy reduct ion at a temperature justabove the upper critical a“d ho! ding briefl y for recrystal I ization beforefinal cool ing and t ransformat ion. In one example, an Al -kil led 0.4 percentC steel plate O.1 I inch thick was reduced about 73 percent (to 0.03 inch) inone pass at 1500° F, hel d at this temperature for 10 seconds and air-cool ed,to acquire a grain size of ASTM 14.
The development of the smal lest grain size of ASTM 8.65 in plate B-20of the present wrk is at least consistent with that patter”. The 60 percentreduction at 14500F was probably completed above but near the upper criticaltemperature. It might be wondered if any more refinement COUI d have beenobtained by faster reduction, shortened cool ing time, and smal 1 er prioraustenite grain size. In comparison of as-rol I ed grain sizes, those ofClass C were general 1y the smal ler for reason of the fine-grain practiceand the fact that C-steel pl ates were cooled and reheated through thecritical range before rol I ing. Nevertheless, improvement measured by thedifference between ferrite grain size produced according to conventionaland control led practices was about the same for both B and C, cf. Figures 2and 13. Apparent I y this has not been the finding of others who have reportedgreater improvement in semi-kil I ed materiat .11
Normal izing after rol I ing is a possibil ity for further grain-size re-finement, al though its effect on B steel was c1 early adverse, acting tocoarsen grains devel oped in 1ow-temperature (1 450° F) reduct ion. In addition,it produced the general elevation of trend I ine by al lowing Widmanst$ittenstructure to form (Figure 13a) . There was no grain coarsening in C-steel ,the holding temperature being below that level, but neither was there anysignificant refinement either after the low-temperature finishing. Instead,the comparison for C-steel suggests an equival ence, in capacity for grainrefinement, between normal izing and low finishing temperatures.
After exhausting the possibil ity of toughening by grain-size reduction,at I east one alternative remains. With reference to Figure I 3, this is avertical descent exploiting any available extra-grain-size effects. TheI argest of these are general 1y chemical in origin, as reflected in theseparation between as-rol led B and C trend I ines (Figure 13d) and in thevarious transition-temperature formul as with their terms for cal CU1stingthe cent ribut ions of individual components .7, ~ However, such effects mayal so be related to rol I ing practice.
Mechanical fibering has been identified as the source of one in thenon-chemical category. Since this is a comnmn development in wroughtmaterials, its contribution ought to be expected more general I y than not.The amount by which transit ion temperature may be I owered has been evaluatedaccording to different criteria and found, in the case of Tv-15, tO be 0f6nearly the same magnitude as the experimental uncertainty of measurement.Therefore, with the range of rol I ing conditions invol ved in these experi-ments, it is perhaps not surprising that the specific effect was nOtisol ated, al though the prerequisite structure was present and studied insome detail . Stil I another such effect may be based on the preferredcrystal Iographic orientation found after rol I ing as high as 14500F, butmuch more in evidence after the 1250°F reductions; both the mechanical and
-29-
crystal I ographic ani.sot ropy can be identified broadl y with texture. Inprinciple, the latter can contribute as either a negative or positiveextra-grain-size effect, depending upon details of texture. 2n hot-rol I edsteels, it is probably subtle in the extreme, al thou h i.n inherently nmre
?anisotropic material s the contribution may be large. 2 Residual COI d workunder-l ies the remaining effect, which is negative in character and mustfunction as a structural, if not practical, deterrent to finishing too lowin temperature. The amount of embritt I ement , rated as an increase in Tv. ]5for fixed grain size, can be rationalized with available theory, as it hasbeen appl ied before to the similar problem of irradiation embrittl ement(see Appendix).
SUMNARY AND CONCLUSIONS
The influence of hot-rol 1 ing practice on the structure and mechanicalproperties of $BS Class B and fine- grained Class C steel plates was studiedover a wide range of rol I ing temperatures and reductions. Charpy V-notch15 fcot-pound (Tv-l 5) and 50 percent fibrous [TV-50Y) transition temperatureswere found to be much nwre sensitive to ro] 1i“g history than the tensileductil it y-transit ion temperatures.
Lower rol 1ing temperatures, down to about 14500F, improved the notchtoughness equal 1y for both steels. Refinement of the ferrite grain sizeover a 1imited range was primarily responsible for this improvement, thegrain size dependence of TV-ls being -20°F (1 10C) /ASTM No. The transit io”temperatures of Class C PI ates were uniformly lower than those of Class Bfor reason of differences in chemical composition.
The extra-grain-size effect of microfissuring on transition temperature,reported earl ier, was too subtle for clear observation here, though goodmrrel at ions were establ ished between tensil e fracturing an isotropy andmechanical fibering intensity. The fine-seal e inclusion fiber structureimport ant in this connect ion was identified by high- magnificat ion el ect ronmicroscopy.
Residual cold work in varying amounts in PI ates rol led below 14500F hadan embrittl ing effectj a slmit ar but much smal ler effect has been associatedwith the crystal Iographic texture in these plates.
tieavy reduction at about 1450°F is indicated as having the ~st POtentialfor improvement of notch toughness. This wuld involve a substantial lowering
of finishing temperature and WUI d probabl y represent even more radical de-parture from the conventional than found in current “control 1ed rol 1ing”practice.
Normal izing destroyed the grain refinement achieved in Cl ass B P1 ates bylow-temperature finishing, but no effect on Cl ass C plates studied. Effectsof anneal img and horroge”izing treatments on TV- I ~ were consistent with a
change in ferrite grain size.
There were no significant correlations between the VO1ume-f ractfon,patch size, or inter larmnel Iar spacing of pearl ite, on the one hand, androl 1ing history, heat treatment, or transition temperature, on the other.Embrittlement was observed after subcritical anneal ing, which is bel ievedto bear some relationship to the resul ting spheroid ization of cement ite.

This work was part of athe Ship Structure Comittce
-30-
ACKNOWLEDGNRNTS
continuing program of research sponsored by
and under the advisorv ruidan. e of a Proi ect.-Advisor; Committee of the Ship Hull Research Committee of the National
Academy of Sciences-National Research Council.
REFERENCES
1.
2.
3.
4.
5.
6.
7.
8.
9.
10.
Il.
12.
13.
J. M. Hedge, R. D. Manning and H. M. Reichhold, “The Effect of FerriteGrain Size on Notch ToughnessI’, Journal of Metals, Vol . 1, 1949, P. 233.
R. W. va”rJerbeck, ,lEval uating Carbon Steels by the Keyhol d Charpy ~Pact
Test”, Wel dinq Journal, Vol. 30, 1951, p. 59-s.
R. H. Frazier, F. W. Boulger and C. H. Lorig, “Influence of HeatTreatment on the Ductile-Brittle Transition Temperature of Semikil ledSteel PI ate”, Transactions AIME, Vol . 203, 1955, p. 323.
M. W. Lightner and R. W. Vanderbeck, ,, FactorS IjIVOl ved in Britt I e
Fracture”, AISI Reqional Technical Meetinqs, 1956, p. 427.
W. S. Owen, D. H. Whitmere, M. Cohen and B. L. Averbach, “Relation ofCharpy Impact Properties to Microstructure of Three Ship Steel s“,Wel dinq Journal, Vol . 36, 1957, p. 503-s.
F. Oe Kazinczy and W. A. Backofen, ,, Influence of Hot-Rol 1 ing Conditions
on Brittle Fracture in Steel P1ate”, Transact ions ASM, Vol . 53, 1961,p. 55.
J. H. “an der veen, !lI”fl”ence of Steel -Making Variables On Mtch
Toughness”, Ship Structure Committee, SSC-128, 1960.
B. M. Kapadia, A. T. Engl ish and W. A. Backofen, “Influence ofMechanical Fibering on Brittle Fracture in Hot-Rol led Steel PI ate”,Transactions ASM, Vol . 55, 1962, p. 389.
F. W. Boul ger and W. R. Hansen, ,,The Effect of Metal Iurgical Variabl es
in Ship-Pi ate Steels on the Transition Temperatures in the Drop-Weightand Charpy V-Notch Tests”, Ship Structure Comnittee, SSC-145, 196’2.
J. H. van der Veen, ,, Co” fere”ce on Brittle Fracture in Steel”,
Journal of the West of Scotland Iron and Steel Institute, Vol . 6D,1952-53, p. 350.
R. W. Va”derbeck, ,)Control 1ed Low-Temperature Hot-Rol ] ing as pract ised
in Europe”, Wel dinq Journal , Vol. 37, 1958, p. ll&S.
A. B. Kinzel and W. Crafts, ,II”C1 “sio”s a“d Their Effect on ~pact
Strength of Steel”, Transactions AIME, Vol . 95, 1931, P. 143.
C. WeI IS ~“d R. F. Mehl, ,,Transverse Mechanical properties in Heat-
Treated Wrought Steel Products”, Transactions ASM, Vol . 41, 1949,p. 715.
14.
15.
16.
17.
18.
19.
20.
21.
22.
23.
24.
25.
26.
27.
28.
-31-
W. A. Backofen and B. B. Hundy, ,, Mechanical Anisot ropy in Some Ouctil eMetal s!r, Journal of the Institute of Metals, Vol . 81, 1952-53, p. 433.
W. A. Backof en, !, Mechanical Anisot ropy in Copper”, ~
Vol . 46, 1954, p. 655.
E. P. KI ier, F. C. Wagner and M. Gensamer, “The Correlation ofLaboratory Tests with Ful I Seal e Ship Plate Fracture Tests”,Wel dinq Journal, Vol. 27, 1948, p. 71-s.
w. T. La”kford, ‘, Effect of Cold Work on the Mechanical Properties of
Pressure Vessel Steel si(, Wel dinq Journal , Vol . 35, 1956, p. 195-s.
American Bureau of Shipping Specifications for Structural Steel forHul Is, 1955.
J. H. van der Veen, Royal Netherlands Blast Furnaces and Steel works,t!ol land. Private Ccmrnunication.
c. 5. smith ~“~ L. ~ut.m~n, !!).fe~$”~~~~”t Of I“ter”al BO””darie~ i“
Three-Dimensional Structures by Random Sectioning”, Transactions AIME,Vol . 197, 1953, p. 81.
J. J. B. Rutherford, R. H. Aborn and E. C. Bain, “Grain Areas on aPlane Section and the Grain Size of a Hetal” , Metals and Al loYs,Vol . 8, 1937, P. 345.
R. A. Grange, ,$Micros tructural Al terations in Iron and Steel oUrin9
~t working”, Paper presented to Ninth Sagamore Ordnance MaterialsResearch Conference, New York, 1962; to be publ ished in ConferenceProceedings.
A. T. Engl ish and W. A. Backofen, llRecry~tal 1ization in Hot-worked
Sil icon-Iron”, ~rans. Met. Sot. AIME, Vol . 230, p. 396, 1964.
C. Rossard and P. Blain, ,Iune ~thode de Simul at ion par TOrsiOn
Permettant de Determiner I ‘Influence sure la Structure de I ‘Acierde ses Conditions de Laminage a Chaud”, Rev. Met., Vol . 59, 1962,p. 223.
C. Rossard and P. Blain, ,lA Met hOd of Simul at ion by TorsiOn fOr
Determination of the Infl uence of Hot-Rol I ing Conditions on theStructure of Steel 11, Proceedings of the Fourth AIME MechanicalWorking Conference on FI at Rol I ed Products, Chicago, 1962, p. 3.
M. A. Grossman, llGrai”. SiZe i“ Metal S, with Special Reference to
Grain Growth in Austenite”, Grain Size Symposium, ASM, Cl eveland,
1934, p. 861.
F. B. Pickering, “Some Effects of Mechanical Working on the Deformationof Non-Metal I ic Incl usions”, Journal of Iron and Steel Institute,Vol. 189, 1958, p. 148.
M. Baeyertz, “Nonmetal 1ic Inclusions in Steel “, ASM, Cl evel and, 19k7,P. 94.

29.
30.
31.
32,
33.
34.
35.
36.
37.
38.
39.
40.
41.
42.
43.
44.
45.
-32-
L. G. Schulz, “A Direct Method of Determining Preferred Orient at io” ofa FI at Refl ection Sampl e Using a Geiger Counter X-Ray Sprectrometer(n,Journal of Appl ied Physics, Vol . 20, 1949, p. 1030.
M. Gensamer and R. F. Mehl, Transactions AIME, Vol . 120, 1936, p. 2JJ.
M. Gensamer and P. A. Vukmanic, I\ Preferred Orientations in WX-Rol I edLow Carbon Steel”, Transactions AIME, Vol . 125, 1937, P. 507.
W. F. Hosford and W. A. Backofen, !!Strength a“d PI asticity of TexturedMetal S1), in Proceedings of the Ninth Army Material s Research Conference,Syracuse University Press, 1964.
N. J. Petch, “The Cleavage Strength of POl ycrystal 511, Journal of Ironand Steel Institute, Vol . 174, 1953, p. 25.
R. O. Stout and L. J. McGeady, I, Notch severity of Wel ded Steel Plate”,
Wel dinq Journal, Vol . 28, 1949, p. l-s.
N. F. Mott, ,,Mechanical Strength and Creep in 14etal s“, Imperfections in
Nearly Perfect Crystals, Wiley, New York, 1952, p. 173.
J, A. Rinebol t, !,The Effe=t of pearl ite Spacing on Transition Temperature
of Steel at Four Carbon Level s,,, Transactions ASM VC.] . 46, 1954, p. ]527.
J. A. Rinebolt, !!Effect of Metal I urgical Structures on the ImpactProperties of Steel s”, Symposium on Effect of Temperature on the Brit t I eBehaviour of Metal s with Particul ar Reference to Low Temperatures,ASTM Special Technical Publication No. 158, 1954, p. 203.
J. A. Rinebolt and W. J. Harris, ,, Effect of Al Ioying Elements on NotchToughness of Pearl itic Steel s!!, Transactions ASH, Vol . 43, 1951, p. 1I 75.
c. J. MCMah~p, !,Micromecha”isms of c1 eavage Fracture in POl ycrystal I ine
Iron”, Sc. D. Thesis, Department of Metal lurgy, M. I. T., 1963.
P. J. Forsyth and D. A. Ryder, ,,sme Res”l ts Obtained from the El ectron
Microscopic Examinat ion of the Fracture Surface of Al 1oysl’, EuropeanRegional Conference on Electron Microscopy, Del ft, 196o, p. 473.
C. Crussard, J. Plateau and G, Henry, ,Ist”dy of Mechanisms of Inter-
granular Fracture”, Conference on Properties of Grain Boundaries,Sacl ay, France, 1960, p. 33.
A. Hayes and J. Chipman, ll”echa”i~m of SOI id if icat ion and Se9re9at iOn
in Low-Carbon Rinsning-St eel Ingot”, Transact ions AIME, Vol . 135, 1939,p. 85.
M. 6aeyertz, !\ Effect~ of I“itia] structure on A“ste”ite Grain Formation
and Coarsening”, Trans. ASM, Vol . 30, 19k2.
J. W. Hal Icy, llGrai”-Growth Inhibitors in steel “,
Vol . 167, 1946, p. 224.
M. A. GroSSma”, ,10” Grain-Size and Grain-Growth”,
vol. 2!, 1933, p. 1079.
Transactions AIME,
Transactions ASST,

-33-
46. E. S. Davenport and E. C. Bein, ,, Ge”era I Re] at ion Between Grain-size
and Hardenabil ity and the Normal ity of Steel SII, Grain Size Symposium,ASM, Cl evel and, 1934, p. 879.
47. D. A. Canonico, E. H. Kottcamp, and R. D. Stout, “Accelerated Cm] ingof Carbon Steels for Pressure Vessel Sri’, Weldinq Journal, Vol . 44, 1961,p. 400-s.
48. United States Steel Corporation, $lFi”e-&rai”ed, Heat-Treated, Wrought
Medium-Carbon Steel ‘8, U. S. Patent, 1959.
-34-
APPENDIX
Further Detail on Materials and Procedure,Microstructure Data and Test Resul ts
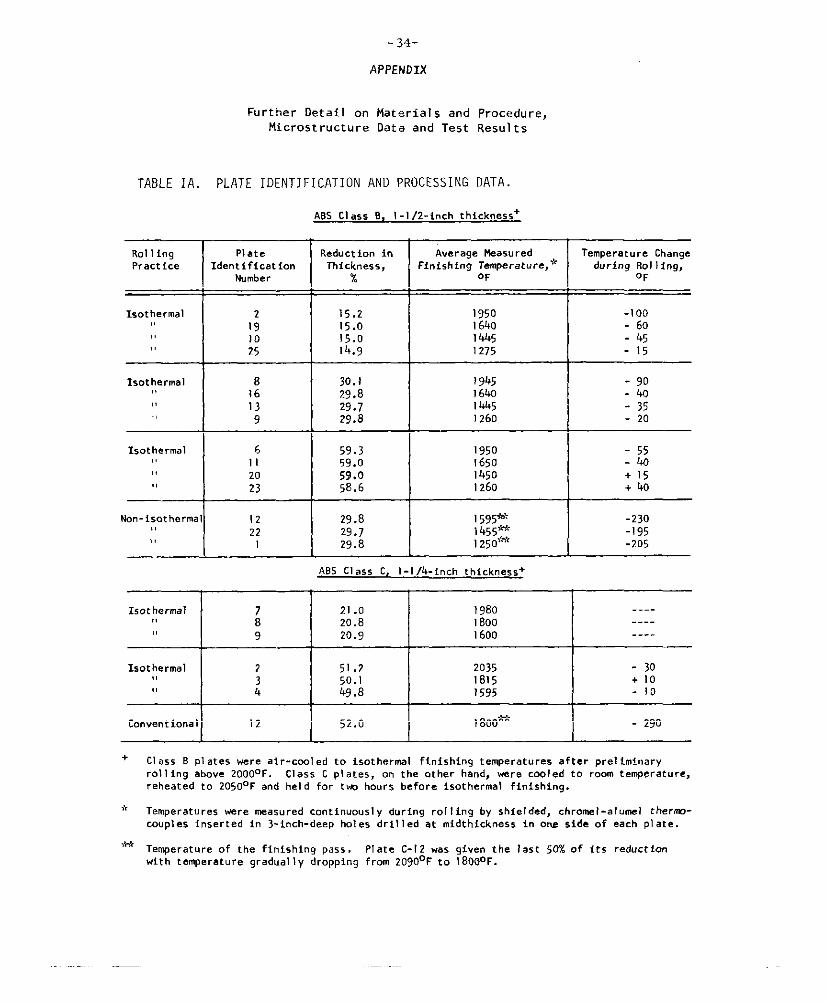
TABLE IA. PLATE IDENTIFICATION AND PROCESSING DATA.
ABS Cl ass B, I -1 /2-inch thickness+
uIsot herrnal 8
,, 16,, 13
9
Non-isothermal 12,,
II22
, !
Reduct ion in Average P.sasured Tempa rat u re ChangeThtckness, Finishing Temperature, * duringRol 1i“g,
% OF ‘FI 1
I I
H-!---R29.8 I595*, -23029.J I455* -19529.8 I250’%t -205
ABS Class C, l-1/4-inch thfcknes,s+
Isothermal 2).0 198o ----,! ; 20.8 1800 ----,, 9 20.9 1600 ----
Isothermal 2 51.2 2035!,
- 3050.1 1815
,, :+ 10
49.8 I 595 - 10
Convent ions 1 12 52.0 1800’+k - 290
+
*
,*
Cl ass B PI ates were air-coaled to isothermal finishing temperatures after prel imfnaryrol I fng above 20000F. Class C PI ates, on the other hand, were cooled to room temperature,reheated to 2050° F and hel d for two hours before isothermal finishing.
Temperatures were measured ccmtfn.cwsl y during rol f ing by shielded, chrome l-al .mel thernv-couples inserted in 3-ioch- deep hol es dril I ed at midthick”ess in one side of each PI ate.
Te~erature of the finishing pass. PI ate C-12 was given the last 50% of its reductionwfth temperature gradual ly dropping from 20900F to 18000F.
-35-
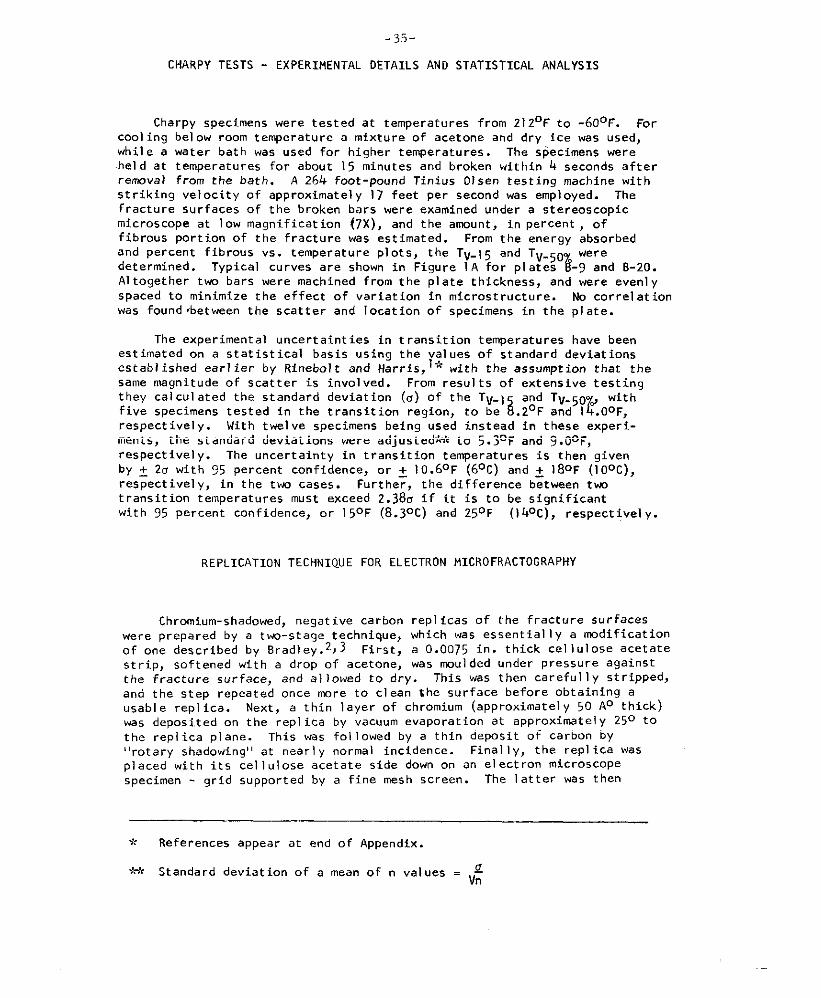
CHARPY TESTS - EXPERIMENTAL DETAILS AND STATISTICAL ANALYSIS
Charpy specimens were tested at temperatures from 212°F to -600F. Forcool ing bel ow room temperature a mixture of acetone and dry ice was used,whil e a water bath was used for higher temperatures. The specimens werehel d at temperatures for about 15 minutes and broken within 4 seconds afterremoval from the bath. A 264 foot-pound Tinius Olsen testing machine withstriking velocity of approximately 17 feet per second was employed. Thefracture surfaces of the broke” bars were examined under a stereoscopicmicroscope at low magnification 17X), a“d the amount, in percent , offibrous portion of the fracture was estimated. From the energy absorbedand percent fibrous vs. temperature plots, the Tv.15 and Tv-50 weredetermined. Typical curves are shown in Figure 1A for plates E-9 and B-20.Al together two bars were machined from the plate thickness, and were evenl yspaced to minimize the effect of variation in microstructure. No correl at ionwas found ebetween the scatter a“d location of specimens in the plate.
The experimental uncertainties in transition temperatures have beenestimated on a statistical basis using the val ues of standard deviations
lx with the assumption that theestabl ished earl ier by Rinebolt and Harris,same magnitude of scatter is involved. From resul ts of extensive testingthey cal cul ated the standard deviation (a) of the TV- Ifive specimens tested i“ the transition region, to be ~.;:: TJ;57y.;gh
respective y. With twel ve specimens being used instead in these experi-ments, the standard deviations were adjustedw to 5.30F and 9. OoF,
respectively. The uncertainty in transition temperatures is then givenby ~ 20 with 95 percent confidence, or ~ 10.60F (6°C) and ~ 180F (l DOC),respective y, in the tm cases. Further, the difference between twtransition temperatures must exceed 2.38s if it is to be significantwith 95 percent confidence, or 150F (8.3oc) and Z5° F (140c), respective y.
REPLICATION TECHNIQUE FOR ELECTRON MICRO FRACTOGRAPHY
Chromium-shadowed, negative carbon replicas of the fracture surfaceswere prepared by a tvm-stage technique, which was essential I y a modification
2 3 First, a 0.0075 in. thick cel I“lose acetateof one described by Bradley. ,strip, softened with a drop of acetone, was maul ded under pressure againstthe fracture surface, and al lowed to dry. This was then careful I y stripped,a“d the step repeated once nmre to cl ean the surface before obtaining ausabl e repl ica. Next, a thin layer of chromium (approximate y 50 AO thick)was deposited on the repl ica by vacuum evaporation at approximate y 250 tothe replica plane. This was fol lowed by a thin deposit of carbon by,,rotary ~hadowi”g), at nearl Y normal incidence. Final I y, the repl ica was
placed with its cel I ulose acetate side down on an el ectron microscopespecimen - grid supported by a fine mesh screen. The latter was then
9< References appear at end of Appendix.
M Standard deviation of a mean of n values = v:

-36-
-40 -20 0 20 40 60 80 ‘CI I I
~loo --Y ● :-k; 80 – ●
mL x/-x
; 60 –
u
f( :
@xiz 40 —
x● *
E
/
●
—●
@
20 –2
—— —
# :=<+$- ‘-- -0 I
I 00 –
Ln~ 80 —
“~ “>-: >;-
/
20k ./’
K 60 –
/
x
——————— 8
: 40 —/ Jo 9
&
‘2 o– :/: ~ p x
h/s /
o. :I I I I
-40 0 40 80 120 160 0 FTemperature
Fig. 1A. RepresentativeCharpy V-notch Test Data From Close B Plates 9and 20, Showing Detemninationof To_l ~ and To_50%
PI aced on the surface of an acetone bath (so that the repl ica is wettedby, but not submerged in, the acetone) to dissol ve away the acetate,1caving behind a chromium - shadowed, negative carbon repl ica to beexamined.
A Siemens 100 KV el ectron microscope was used for the purpose. Theresol ving power obtained with the repl ication process described was about
o.05~. Fracture surfaces at magnifications ran9in9 from 4,000X to 40,000XCOUI d be successful 1y examined.
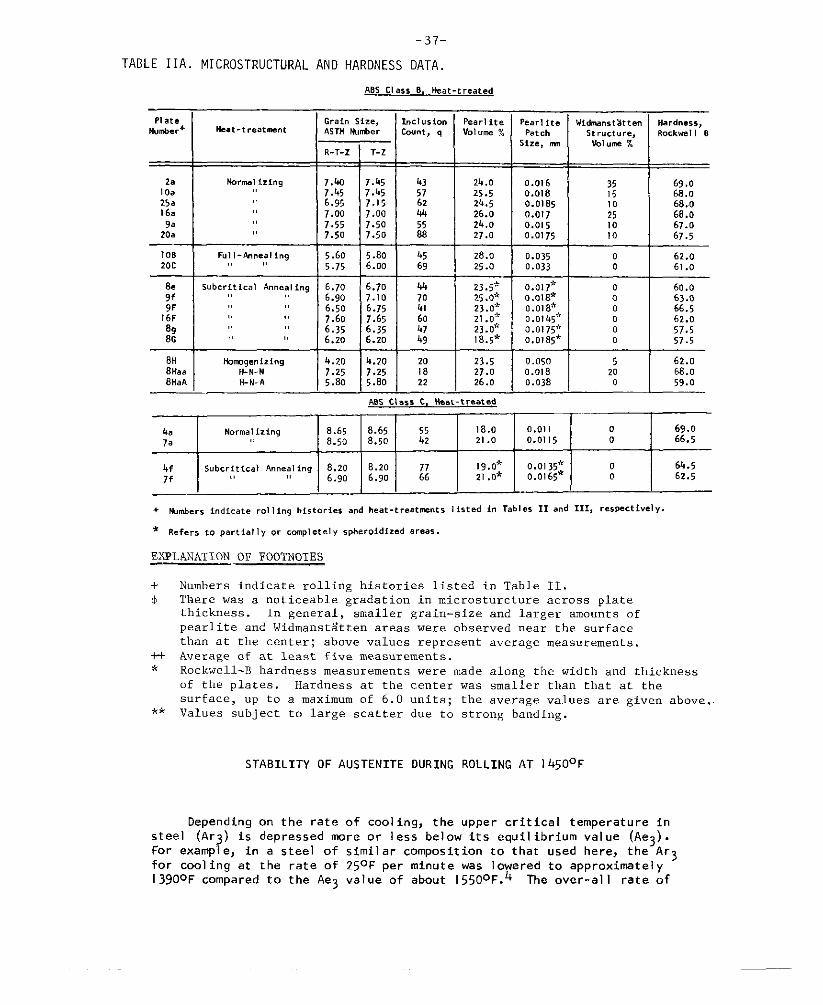
-37-
TABLE I IA. MI CROSTRUCTURAL AND HARDNESS DATA.
PIateN.mk..v+
2.1Oa25a16.9.
20.
10B20C
8,gf9F
16F898G
8H8Haat3HaA
ABS Class 0, Meat-treated
Grain Size, 1..1 ”,10” P,a,l it,He. t-treetmmt &STH !+m’&mr count, q VO1“m.?%
R-T-Z T-Z
f24.o. .
H-+,..>,, 0.>7.)5 62 24.57.00 44 26. o7.50 24.07.50 :2 27.0
5.80 45 28.06.00 6. ,,. ”
NOmul izin’g 7.42,, 7.45 ?!!2 I ‘!: I
6.95,, 7.00!, 7.55!! 7.50
Ful l-h”,,) I.g 5.60,, !! 5.75 ..-.
Subcritical Anneal+.9 6.7o 6.70 44,, 6.9o 7.10 ;,, 6.50 6.75
!, !, 7.6o 7.65 60!! ,, 6.35 6.35 47,, ,, 6.20 6.20 49
mmqenizi.g b.20 4.20 20 23.5H-N-N 7.25 7.25 18 27.0H-N-A 5.80 5.8o 22 26.0
----
23.5*25.O>~23.0,’21.0:23.0’<18.5*
Pearl it,Pat ch
size, m
—
0.o160.o180.01850.0170.0150.0175
0.0350.033
0.017’0.018*0.018*0.0145”0.0175*0.0185*
0,0500.0180.038
60.0: 63.00 66.50 62.o0 57.50 57.5
-i-EABSClass C. bat-treated
I 1 1 1 1 r--~4. Normal Izing 8.65 8.65 55 18.0 0.01 I o 69.0
7. ,! 8.5o 8.50 42 21.0 0.0115 0 66.5
bf Subcritical Annealin.q 8.20 8.2o 19.0” 0.01 35* o 64.57f !, ,, 6.90 6.90 12 21 .O* 0.01 65* 0 62.5
+ t+mbers indicate r.1 Iing histories a.d heat-treatments I isted in Tables 11 and 111, respectively.
% Ref. m to partial 1Y w CWII et.1 Y whmaidim.d areas.
EXPLANATION OF FOOTNOTES
+‘$
i-t*
**
Mmnbers indicate rolling histories listed in Table II.There was a noticeable gradation in microst”rcture across platethickness. In general, smaller grain-size and larger amounts ofpearlite and WidmanstStten areas were observed near the surface
than at the center; above values represent average measurements.
Average of at least five measurements.Rockwell-B hardness measurements were made along the width and thickness
of the plates. Hardness at the center was smaller than that at the
surf ace, UP tO a maximum of 6.0 units; tbe average values are given above.Values subject to large scatter due to strong banding.
STABILITY OF AUSTENITE OURING ROLLING AT 1450°F
Depending on the rate of cool ing, the upper critical temperature insteel (Ar~) is depressed rmre or less below its equilibrium value (Ae3).For example, in a steel of similar composition to that used here, the Ar3for cool ing at the rate of 250F per minute was lowered to approximatelyI 39o0F compared to the Ae3 value of about 15500F.4 The over-al I rate of

-38-
TABLE I 1A (cONTINUED) MI CROSTRUCTURAL AND HARDNESS DATA.
PIateNumber+
_
1;1025
8
~;9
6II2023
Grain Size, eASTMNumber
TR-T-2 T-z
6.45 6.606.95 7.107.8o 7.8o6.8D 6.90
16.50 6.107.40 7.557.90 ;.;7.30 .
7.15 7.157.40 7.408.65 8.656.60 7.45
[
-L7.10 7.257.60 7.701.8o 8.OO
A@S Class 8
Inclusion++ Peartlte, + Pearlite Parch Widmm, t5tten* Hardness,*count, q Wal“me % size, Km St ,Uct”.e, WI “m % Rock-l 1-B
43 22.0 0.0215 5 64.055 21.0 0.020 5 63, o57 26.5 0.015 69.549 23.5 0.016 ); 74,0
38 22.5 0.021 0 63.062 23.5 O.ola o 69,051 25.5 0.015* 68.066 23.0 0.015 1: 74.0
51 22.5 0.0185 0 66.066 20.0 O.olw 0 69.5
103 23.0 0.01 5* 69. s106 24.0 0.019 1; 79.0
m 20.5 0.0155 64.567 20.5 O.olk : 6?.070 23.5 0.014 5 75.0
ABS Cla,, C
7 7.15 7.15 56 22.0 0.0168
5 66.07.00 7.05 73 21.5 0.0165 5
966.0
7.55 7.60 61 23.0 0.015 0 67.o
2 7.40 7.45 92 21.0 0.015 0 67.07.75 7.75 2).5 0.015 0 66.5
: 8.30 8.4o ;: 22.5 0.0!5 o 66.5
)2 7.70 7.8o 87 21.0 0.015 0 70.0
COOI ing from Aej down to 13900F for the plates rol I ed at 1450° F in thiswrk may be approximate y equated to
[
1550 - I 390~1550 - 1390,
1
~ 340F per minute
50+1.5
where the (1550 - 1390, ~“ ~he50
denominator is the time for air cool ing at a
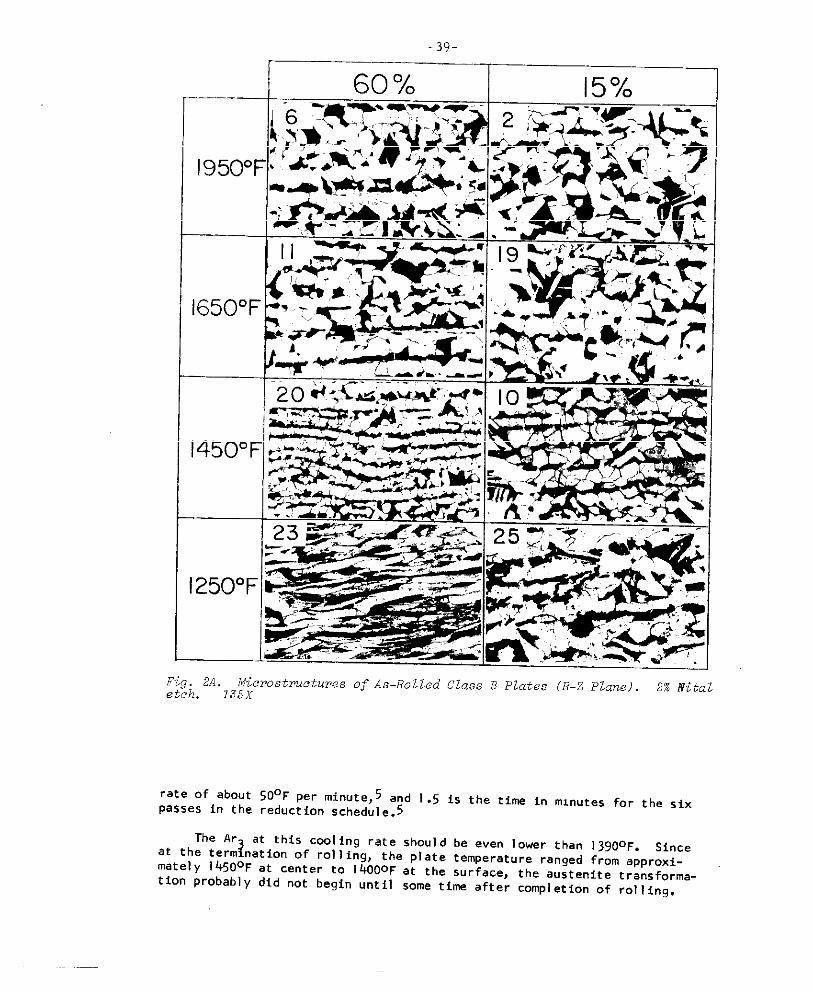
-39-
r
1950°1
1650”F
1450”F
‘250”F
Fig 2A. Microstructure of As-Rolled Class B Plates (R-Z Plane). 2% ?+italetch. 135X
rate Of about 50° F per minute,5 and I .5 is the time in minutes for the sixpasses in the reduction schedule.5
The Ar at this CIYJI ing rate should be even lower than 13sJ00F. Sinceiat the term nation of rol I fng, the plate temperature ranged from approxi-
mately 1450° F at center to 14000F at the surface, the austenlte transforma-tion probabl y did not begin until some time after compl etion of rol I ing.

I--,. ,
50% -- ~F;:!.+Ec-~._...:..–.-----~~.f, ~,5,F---- _ _____
..—.
, ,. ‘-%%Y-k-r%%’? %
~I 800°F *2.
“’T’’w&@._.._lE2._.:.5- ‘L..
K ..!” .— —.– .
Fig. 2A (continued). Microstructure of As-Rolled Class C Plates (R-Z Plane).2% Nital etch 135 ‘1

-41-
, I 1 1
1 J4 5 6 7 8 9
Grain Size ASTM No.
Fig. .3A Grain Size Dependence of Rockwe11-B Hardness for Class B and Class C Platesin A6-Rolled (6) and Heat-treated (0)Condition. Plate6 rolled at 1250 F (A) weresignificantlyharder than others owing toresidual cold work, while those subcritical ly
annealed at 1250 F ( ~) had someuhat 10WPhardness because of spheroid izationofcementite.
Awten, t,zing Tempero lure
Fig. 4A. .AusteniteGrain CoarseningBehavior in Class C Steel. Shadedarea approximately represents dup lez
g?ain-size field. A3 locates the
equilibriumvalue Of the UPPaPcritics1 temperature.
AU$TENITE GRAIN COARSENING IN CLASS C STEEL
The austenite grain-coarsening behavior of ABS C1ass C fine-grained
steel was studied by austenitizing samples for 1 hour at temperatures from158o0F to 21 000F, and rapid] y quenching in water. On etching with a5 percent aqueous solution of ferric chlorid~, the resulting microstructurewas observed to consist of low-carbon martensite with a netwrk of ferriteat the prior austenitic grain boundaries. The coarsening temperature wasobserved to be about 1725°F, at which the avera9e austenite 9rain sizeunderwent a sharp increase from 8.o ASTM No. to nearly 2.0 ASTM No., asshown in Figure 4A.
THEORETICAL IMPLICATIONS
measurements rel sting to the grain-size effect and two of‘he ‘v-’? ~the extra-gra n-size effects can be rational ized to some degree with current
fracture theory. The occurrence of brittle fracture is Influenced byfactors which govern P1 ast ic yiel ding; according to Cott rel 1,6 the conditionfor ductile-brittle transition is defined by the equation:
1/2dy ky d =$7V (I)

-42-
TABLE 111A. TENSILE RESULTS.ABS Class &
. thctil itY-Tr.aositioII, ‘F
PIate Thickness (Z) Rolling (R)Nu&er+ Direct ion Direct ion
2 -315 -32k19 -297 -33310 -315 -31525 -297 -315
8 -315 -32416 -297 -35113 -297 -333
9 -243 -315
6 -306 -33311 -297 -35120 -26Y -34223 -180 -333
12 -333 -33322 -270 - 3L2
1 -288 -333
Fracturing Pni
w
+
>.50 0.633.37 0.6o3.39 0.623.45 0.62
0.51 0.620.30 0.550.47 0.610.39 0.60
0.48 0.650.30 0.570.25 0.520.31 0.59
0.45 0.620.41 0.590.39 0.60—
t ,0.” Rat fo,++
zg~(~1’.R ma.
0.78 0.970.62 0.870.69 1.000.74 0.88
0.71 0.920,58 0.780.66 0.810.63 0.76
--1--0.66 0.880.60 0.780.57 0.680.53 0.57
L0.68 t .000.66 0.770.65 0.83
+ Numbers indicate r.! I 1.9 histories 1isted in Table 11.
++ RT ~epresents rm temperature.lhe ‘-ma.<’ subscript means that values were obtained from the peaksof the stress vs. temperature curves.me * ,Ytil ~a., ~h.t th, ,,ti. 1S formed of stress val .es at
the ductil ity-transition temperatures.
TABLE 111A ( CONTINUED). TENSILE RESULTS.
ABS Cl ass C
Fracturing Anf sot ropy Rat iosw
P1 ateNumber+ (~RT ($RT
7 0.210 0.588 0.121 0.479 0.157 0.52
2 0.113 0.450.121 0.44
: 0.110 0.44
12 0.146 0.52
+ Numbers indicate rol 1ing hisot rieslisted in Table II.
* RT represents row! temperature.

-43-
where Oy is the lower yiel d stress, k is a dislocation locking strengthparameter, d is mean grain diameter, $ is a co”sta”t depending on the typeof stress system, y is the effective surface energy, and v is the shearmodul us. When the I eft-hand side exceeds the right-hand side, dependingon temperature and strain-rate, the condition for crack growth is satisfiedand brittle fracture results. The critical temperature at which the con-dition is just satisfied for a give” strain-rate is the ductil ity transitiontemperature; such a temperature can probably be identified with the15 foot-pound level in a Charpy V-notch test (Tv-l ). For a given material,
2equation I predicts the transition temperature to e a function of grain-size,the friction stress on a free dislocation , ai, the dislocation locking strength,and the degree of triaxial ity of stress. Predictions of the theory have beenfound to be in reasonable quantitative agreement with experimental measurementswith studies of transition temperature in relation to grain-size, strain-rate,and radiation .6,7 petch8 has derived a simil ar equat ion for the fracture modetransit ion from duct il e to c1 eavage; this also gave reasonable explanations ofthe effect on transition temperature of grain-size, quench-aging, prestrain,and strain-aging.
In the present vcmk, ferrite-grain-size appears as the major structuralvariabl e affecting transition temperature. Using theory at hand, the grain-
‘ize ‘epende”ce ‘f Tv-15found here can be rational ized.
Differentiating equation I, assuming that p y II is in fact a constant,
~Tv-15— . .
Ad-’/’
=-
l/2), ad-i/2~(u k d
b(uy ky d1’2)/b T
~ dl /2k dl/2 (~) + Oy ky (—
Y d-l /2 ~d-1/2)
k d]’z (~)+,yyda
Y] ‘2 (&)
According to the I imited data in Table IV, ky is independent of temperature.Therefore,
(II)

-44-
TABLE IVA. CHARPY RESULTS.
AU Class B
F’).te<
Number‘V-15 (”F) 7+50% (“F]
— —_
30 721; 2; [W) 55 [55*)
52: 54 [73,’) 93 (99”)
30 821: 1013 :7, !: 91
12 I 23
\
6822 41
J! 64
AB3 cl .,, C
—- ,
*12 I -8 I 61
PIateNumber+ TV-15 ~Fl ‘V-SO% ‘“F)
10B I 46I
8620C 45 82
wA8S class C, Heat Treated
4. -3)7. -29 1:
k? -6 43lf 17 79
+ Numbers indicate rolling historieslisted in Table II.
* Specimens taken along transverse
direction in the plate with notch
along the thickness direction.
Eva] uating the right-hand side requires data for both numerator and denominatortaken under conditions existing near the notch root in a Charpy bar at theductility transition temperature (Tv-15). The best SUPPI y of such data WU1 dcome from smooth-bar tension tests as a function of temperature at the charac-teristic Charpy strain-rate. Unfortunate! y, those experiments have not beenmade. According to one interpretation of the theory, however, the importantthing to know is the value of oy, at transition--in the presence of a notch inthe Charpy example. The reason IS that if ky is neither temperature nOrst rain-rate dependent, and grain-size is fixed by considering a given material,only u is left to satisfy the left-hand side of equation I.
l’”Now, ductil ity
transi Ion temperatures have been measured using low strain-rate notched-tensiontests; in 1 ight of the preceding remark, Oy under these conditions Ought tO bethe same as that prevail ing at the Charpy notch-root. Of course, the temper-ature for notched-tension transition wil I be lower owing to the lower strain-rate, b“t Oy should be the same. Going further, the notched-tension ductilitytransition usual 1y fal I s about 1800F higher than the srnmth-bar tensile-ductil i~y tran5itio”j6 i“ the present work, the latter temperature is -2300F
on the average (Figure 8, R data). Therefore the notched-tension temperature

-45-
WOUId have been about -1 50° F, had it been measured. The conventional tensil e-yield vs. d-l /2 plots contain one for -145°F ; the ai value at this temperature(Table IV) is close to 36,100 psi; that value would be introduced in equation II.From al 1 u vs. T plots (examples shown in Figure 5), the avera e ( b ay/b T) at-1 500F was approximate y -250 psi per ‘F. ?Finally, choosing d /2 = 0.}9 milli-meter /2 for an ASTM grain-size number 7.5, the grain-size dependence of Tv-15that comes from equation II is equal to -27.5°F per mil I imeter-l /2, or - 260Fper ASTM number, which is in reasonable agreement with the experimentaldependence of -200F per ASTM number.
The amount of COI d-work embrittl ement, rated as an increase in TV-, 5 forfixed grain-size, was estimated for each Of the 12~°F finished Plates.Average val ues of the friction stress increment, A ai, fOr each PI ate 9ivenin Table IV are repeated in Tabl e VA; the corresponding rise in Tv-1 5 observedexperimental I y (extra-grain-size embritt I ement ) is incl uded for comparison.Oifferent iat ing equat ion I,
.k dl /2 (~) 1
Y=-
k dl’2 (#)+aydl/2 +!#,
Y 1.
‘-2$
TABLE VA. COLD WORK EMBRITTLEMENT.
P1ate Average IncrementNumber+ Rol 1Ing History in Friction Stress,
ATV-15
A=i (1000 pSi) Experimental
B-23 60% at 1250°F, ISO. 16.0 43
B-9 30% at 125fJ°F, ISO. 12.0 56
B-25 15% at 1250°F, 1S0. 5.5 27
B-1 30% at 1250°F, NON-ISIJ. 6.5 3b
+ Number indicate rol I ing histories I isted in Table II.
(OF)
Calculated
64
48
22
26

-46-
on s.impl ifying, since ky is again independent Of temperature. Substitutingfor (b ay/~ T) as before:
aTv.,5 (OF) ~ 0.004 ~ ~i (111)
Values Of ~Tv_15 (°F) wsre cal culated from equation III for each plot, andresults compared with experimental values in Table VA, are in reasonableagreement.
REFERENCES
1. J. A. Rinebolt and W. J. Harris, ,, Statistical Analysis Of Tests Of
Charpy V-Notch and Keyhole Bars”, Weldinq Journal, Vol . 30, 1951,p. 202.
2. D. E. Bradl ey, ‘, Evaporated Carbon Repl ica Technique for El ectron
Microscope”, Journal of the Institute of Metalsj Vol . 83, 1954-55,
P. 35.
3. ~. E. ~radl ~y, I,some Advances with Evaporated CarbOn Repl ica
Techniquei’, Proceedings of the International Conference onElect ron Microscopy, London, 1954, p. 478.
4. J. A. Rinebol t and W. J. Harris, ,,Ef feet of Al 1eying El ements on
Notch Toughness of Pearl itic Steels”, Transactions American Societyfor Metals, Vol . 43, 1951, p. 117S.
5. R. M. 8rown, Applied Research Laboratory, United States SteelCorporation, Pittsburgh; Private communication.
6. A. H. Cottrel I, ,(Theory of Brittle Fracture in Steel and similar
Netal s”, Transactions AIME, Vol . 212, 1958, P. 192.
7. A. T. Churchman, I. tbgford and A. H. Cottrel 1, “The Hardening andSmbrit t I ement of Steel by Irradiation with Neutrons”, Philosophicalt.!aqazine, Vol. 2, 1957, P. 1271.
8. N. J. Petch, I!The Ducti I e-C I eavage Transit ion in Al @-iron”,Proceedings of the International Conference on the Atomic Mechanismsof Fracture, Wiley, New York, 1959, P. 54.

NONEsecurity Classification
DOCUMENT CONTROL DATA - R&DCsm=.+t”CJ...lftimtim0!1,,,., t.,,+,., .t..,,a=t .“. ,.d.,,,2* mn.,mtio.~u., *. . . .. .. . d,.. *. m=.,, ~w,, ,. .bm. t,,.<,
0.,., )4.,,. G..,, ”,,, rco,psra,e ,,,,fio,) 2“. .,.0., s,. ”.,,, c . . . . . . . . . . . . .
NONEShip Structure Committee , b . . . . .
..,0., ,,,, =s
ROLLING HISTORY IN RELATION TO THE TOUGHNESS OF sHIP PLATE
DESCRIPT I”, MOTES (,x; ., rep,;, . . . ‘“0,..,”. ..,..)———
Final Report——
Au,...(s) (La,, m.. ,,,., ..”,., /.,,,.,)—— ——— .,-z _. ____
B M. Kapadia and W. A. Backofen
REP. R, DATE
1- ‘
..—7.. . . . . . . . . ., . . . . . ,,. . . . ., ..,,
May 1965 46 56——— ______,, .0. ,..., 0. .“.. , ,“..
,——_9.. 0.!. !..,.”.s ..”0.7 !+.MP,,.,S.)
NObs-88282,. . . . ...? :.,,,
——— __$-i. ~:;4z2jJ..mT ..[s} (.,“, .<”., ““”,. . .. that“,., b. . ...*..
,,—.. —__________1..“. ,1. A., L, TY, L, Ml,.,, ON NOTICES
..— ——.—— ———
All distribution of this report is controlled. Qualified DDC users shall requestthrough Ship Structure Committee, U. S . Coast Guard Headquarters, Washington,D.c. _———__. —,________ _____S.,F. Ls.. uTi.” .0,,,
1
!2. SPONSORING !4,,,,. ”” ,ACT,V,, Y
Bureau of Ships, Dept of the NavyWashington, D. C
———.——. —.—.“’’”ACT PIates of ABS Class-B and Class-C steel were rolled with different tempe]
$ture-reduction schedules to observe effects of processing history on final structure!nd properties . Each class was finished at a constant thickness (1-1/2-in. for Clas}; 1 -1/4-in. for Class C ) foIlowing both isothermal and non–isothermal schedules witeductions from 15!70 to 60% and temperatures in the range 1250” F (677 ”C)to 2000” F1093” C). The principal measurements for toughness evaluation were the 15 fi-lb V-]otch Charpy, the 50%-fibrous Charpy, and the tensile-ductility transition temps.
Effects were divided into two basic categories, one concerned entirely witerrite grain size, the other with “ario”s extra–grain-size details of structure andcomposition. The most significant improvements in toughness were the result of ferite grain-size refinement. The notch toughness of both steels was increase dequall:or this reason as rolling temperature was lowered to 1450” F (788-C).
The superior toughness of Class C at constant grain size was an example>f an extra-grain–size of composition Normalizing of Class B plates after rolling pn
Iuced Widmanst&ten structure and some em brittlement which was interpreted as an
lPParent extra -9rain -size effect of this particular heat treatment. Mechanical fiber-ng was studied with techniques that included electron microscopy, but the contribu-tion of micro fisswing effects to toughness was too subtle for observation. Em brittle
nent flom residual cold work as a consequence of low-temperature finishing was als{dentif ied. Results of heat treatment after rolling were studied in detail.
D ,1::% 1473 hTI_IhTF..-.:u
Security Classification
NONE
secumy uassmcatto.
,.KEY WORDS
.—
INSTRUCTIONS
1. ORIGINAmNG ACTIVRY. E.,., the name a.d .dd,etisof the contract m, e..b..antract .,, want,., Dec. ,rtm.n, of Defens. .cti.it Y w other .rcmi. atim (c.w.tale author) is..i.athe rewrt.
20. REPORT SECUKT Y CLASS1FICATIOR Enter the over-.11 security c I.ssif 1. at i.. .1 the report. Indicate whether8,Re.tri. ted Dm. P-1. Include& Marking i. to be III .ccor&. . . . with appropriate s-wit y reeiet ions.2b.GROUR A.tom.t i. downgrading is specified i. DoD DE.rective 5200.10 and Armed forces I“dustrid l&muaL E“t=the W..P nmr,ber. Also, wk. applicable, show that optional,mrkirws have be=” used for GmuP 3 end GrouB 4 a, authm-i.ed.
3. REPORT TnLE: Enter the .Oqlete report title i“ ellcapital letters, Titles i. all cases should be uo.1.s.ified.U a nteani”tiul title . .mmt be selected without clu,iiic *ti. m show title .Iassific.ki.. in all c@tnl* 1. parenthesisimmediately following the title.4. D E3CRIPTIVE NOTES [f Ww.ptia., e.ter the t YP. ofreport, e.g., i.terim, progress, summary, . ...4. or find.~~ert~~ i..lusiv e d.tes when . specific rep.rtl.z period i.
5. AUTHOR(S) Enter the .ame(s) of .uth.r( s) .s show” onor in the Wport. E.t et 1ast imme, first n.m., middle ifliti .1.U !r.ilit.ry, show rank and branch of .er.ice. The name ofthe principal amtlvar is . . absolute minimum r.quiremenk
6, REPORT DAT5 !%.ter the data of th. ,ePOrt . . day,m. *t h, Y.,. ., month, Y..,. If more t h.” one date wpeerso. the rermrt, use date of public.ti.m
7.. ?OTAL NUMBER OF PAGm Tti total peg. countshould follow normal pagination procedwe., i.e., enter thenumber of pages c..tdr.i.g infommtior.
7b.NUM6EKOF REFERENCES Enter the total number ofref . . . . . . s . i,ed 1“ the reDort.
8.. CONTRACT OR GRAi-W NUMf3ER If appropriate. entefthe SU.li. able “umber .f the .ont, act or went under whit hthe r:pml w., Writte%
8b, %, b 8d. PROJEW NUMBER E“teP the nPwor,ri.t.milit my dep mtment ide.tific.t,.., such .s project number,s uWro, e.t nuti @, SYSt.m numb.% t ask “umber, etc
9.. ORIGINATOR,S R WORT NUMBER(S> Enter the ofifl-.i.l rezort number by which the document will be identifiedand controlled by the otlgi..tins activity. ‘TM. mumber m..the . . . . . . ,0 ibis re.ort.
9b.OTHER R1720RT NUMBER(S) If the rep.tt h.. be..assigned soy other re?.=rl numbers fef(her .5F the cmlgi”at’aror hYffieSPO.SOO,alsoe“t er this “umber(s).
10. AVAIL ABILITY/LIMITAITON NOTICE% Enter any li-it at ions o. f wther di9se min. tie. of the report, other than th.s
Y-J.T-
— —
W&a~: by sec.rit Y CI.S sif ic.ti.n, .siw .t md.rd stat enwits
(1) ,Qmlif ied requesters may cbt.i. copies of this,eport from DDC ‘S
(2) “FOreIW muummceme”t and di.semi..tlo” .f thisreport by DDc CS “ot authorized.,,
(3) ,CU. S. Government wencles may obtain copies .1this report directly from DDC. Other qualified DDC. . ..s shall request through
,,,
(4) ,W. S. milit.w *E... %.. may obtain copies of thisrewmt dltect Iy from DDC Other w.lified . ser.shall request through
.,,—
(5) ‘-ml dlstrib.tio. of this report is controlled 12.Jal-ified DDC . .em shall ~~.we.t tb..gh
,.—.—
If the rwo rt has been furni shed t. the Office of T.&ni..1service% Department of Commerce, for s.le to the public, ind!ate this fact .,x! enter the WC., if know
IL SUPPLEMENTARY NOTES Use for .ddlti..ti e?#mm-torv notes,
12, SPONSORING MILITARY ACTIVITY. EM=, the -me ofthe dwmttne.tal project office m Ie.bomtory apo.mri.g (Payin4 for) the research emd development. Imclude address.
13. ABSTRACT Enter a. abstract @vi”g a brief and factual..mm. t-i of the do..ment indicative of the report, evrn thougtit IIIq also appear elsewhere in the bed, of the technmal re-c.ort. If .dditi...l s..ce is rewired, . ..mti...tion sheet .h!& attach.d.
It is highly desir.ble that the abstract of .I.seified rem?be .ncl.esified. Each Lwmw.ph of the abstract shall end wil. . i.diceti.. of the n?ilit.w security classification of the in.formation i. the P.r.maph, reprea.nied as (T.), (S), (.), ot ([
mere is . . Iimi;.t;.n . . the Ie.@ .f fII. .b.t..ct. Ho-e.er, the s...es ted length is from 150 t, 225 words.
ID ,:::% 1473 (BACK) NONESecurity Clasaificatim

NATIONAL ACADEM’I’ OF SCIENCES-NATIONAL RSSEARCH COUNCILDIVISION OF ENGINEERING AND INDUSTRIAL RESEARCH
The Ship Hull Research Committee undertakes research service activities in the generalfields of materials, design, and fabrication, as relating to improved ship hull structure, whensuch activities are accepted by the Academy as part of its functions The Committee recommendsresearch objectives and projects; provides liaison and technical guidance to such studies; re-views project reports; and stimulates productive avenues of research.
SHIP HULL RESEARCH COMMITTEE
ChairmaQ : PADM A. G, Mumma, USN (Ret. )Executive Vice PresidentWorthington Corporation
Members: Prof. R. B. Couch, ChairmanDept. of Naval Architecture
& Marine EngineeringUniversity of Michigan
Mr. Hollinshead de LuteAsst. to Vice PresidentBethlehem Steel Co.
Dr. C . 0. DohrenwendVice President & ProvostRensselaer Polytechnic Inst.
Prof. J. Harvey EvansProf. of Naval ArchitectureMass. Institute of Technology
Arthur R. LytIeDirector
Professor J. E. Goldberg
Prof. of Civil Engineering
Purdue University
Mr. James GoodrichExec. Vice PresidentBath Iron Works
Mr. D. C. MacMillanPresidentGeorge G. Sharp, Inc.
R. W. RumkeExecutive Secretary
SR-147 PROJECT ADVISORY COMMITTEE“Mill RolIing Practice”
Chairman: Mr. Thomas S. Washburn
C he sterton, Indiana
Members: Mr. J. L. GioveChief MetaUuWistU. S. Steel Corp.Homestead District Works
Mr. T. T. Watson. Coatesville
Pennsylvania
Mr. J. R. LeCronMetallurgical EngineerBethlehem Steel Co.
Dr. Cyril WellsPrincipal Research Metallurgical
Engin6?erMetal Research LaboratowCarnegie Institute of Technology

SHIP STRUCTURE COMMITTEE PUBLICATIONS
SSC-158,
SSC-159,
SSC-160,
SSC-161,
SSC-16Z,
SSC-163,
~ow-Stress Brittle Fracture in Mild Steel by R. Dechaene, W.Soete, and A. Vinckier. August 30, 1963. *WB 181-s47 $.75
Acrruisition and Analysis of Acceleration Data by F. C. BaileY,D. J. Fritch and N. S. Wise. February 17, 1964.
Geometric Effects of Plate Thickness by R. D. Stout, C. R. Roperand D. A. Magee. February 7, 1964.
Micromechanisms of Cleavage Fracture in PolYcrY stalllne Iron byCharles j. McMahon, Jr. May 1964.
Exhaustion of Ductility and Brittle Fracture of E-Steel Caused byPrestrain and Aging by C. Mylonas. July 1964.
Investigation of Bendina Moments within the Midships Half Lerwhof a Mariner Model in Extreme Waves by N. M. Maniar, Iune 1964.
SS~ -164, Results from Full-Scale M~ts f Midsh ID Bendina S@S~on Two C4-S-B5 Drv-Carao ShiDs Ower~tina in North AtlaQQ
SQ@&.Q byD. J. Fritcht F. C. Baiiwand ~. s. wise.September 1964.
SSG -165, Local Yieldina and Extension of a Crack Und~ r by G.T. Hahn and. A. R. Rosenfield. December 1964.
SSC-166, Reversed-Bend Tests of ASS-C Ste el with As -Rolled and MachI&Surfaces by K. Satoh and C. Mylonas. APril 1965.
SSC -167, Restoration of Ductilitv of Hc% or Cold Strained ABS-B Steel by~re at me nt at 700tol150F by C. Mylonas and R. J, Beaulieu.April 1965.