Embed Size (px)
Citation preview

8/3/2019 Determination of Haplotypes from Single DNA Molecules: A Method for SingleMolecule Barcodin
http://slidepdf.com/reader/full/determination-of-haplotypes-from-single-dna-molecules-a-method-for-singlemolecule 1/9
HUMAN MUTATION 0,1 ^9,2007
METHODS
Determination of Haplotypes from Single
DNA Molecules: A Method for Single-Molecule Barcoding
Ming Xiao,1 Matthew P. Gordon,2 Angie Phong,1 Connie Ha,1 Ting-Fung Chan,1 Dongmei Cai,1
Paul R. Selvin,2,3 and Pui-Yan Kwok1,4Ã
1Cardiovascular Research Institute and Center for Human Genetics, University of California, San Francisco, San Francisco, California;2Department of Physics, University of Illinois, Urbana, Illinois; 3Center of Biophysics, University of Illinois, Urbana, Illinois; 4Department
of Dermatology, University of California, San Francisco, San Francisco, California
Communicated by Richard Cotton
Determining the haplotypes in a diploid individual is a major technical challenge in genetic studies of humancomplex traits. Here we report a method of molecular haplotyping by directly imaging multiple polymorphic
sites on individual DNA molecules simultaneously. DNA fragments amplified by long-range PCR were labeled
with fluorescent dyes at each polymorphic site using a modified gap-filled padlock probe ligation approach. The
labeled DNA molecules were then stretched into linear form on a functionalized glass surface and imaged with
multicolor total internal reflection fluorescence (TIRF) microscopy. By determining the colors and positions of
the fluorescent labels with respect to the backbone at polymorphic sites, the haplotype can be inferred
accurately, in a manner similar to reading a barcode, even when the DNA fragments are not fully labeled. The
feasibility of this technology is demonstrated by the determination of the haplotype of a 9.3-kbp DNA fragment
containing four SNPs. Hum Mutat 0, 1–9, 2007. Published 2007 Wiley-Liss, Inc.y
KEY WORDS: single molecule fluorescence imaging; molecular haplotyping; DNA barcoding; SNP
INTRODUCTION
SNPs are the most abundant form of human genetic sequence
variation, and are the markers of choice for genetic association
studies. The recent successful completion of the HapMap project
[The IHC, 2003] and the availability of low-cost, large-scale, high-
throughput genotyping platforms [Hardenbol et al., 2003;
Matsuzaki et al., 2004; Oliphant et al., 2002; Patil et al., 2001],
have paved the way for comprehensive genetic analysis of complex
traits such as susceptibility to common diseases and drug responses
[Collins et al., 2003]. In a genome-wide case–control genetic
association study [Botstein and Risch, 2003], the cases and
controls are genotyped with a large set of SNPs to identify the
associated loci. However, the power to detect association is greatlyenhanced when one compares the haplotypes of the cases and
controls rather than working exclusively with SNPs [Douglas
et al., 2001; Schork, 2002]. A number of techniques have been
developed to obtain haplotype information. Haplotype prediction
computer programs have been very useful in obtaining the most
likely haplotypes found in an individual [Fallin and Schork, 2000].
Parental genotyping can be used to infer haplotypes in a family
study [Sobel and Lange, 1996]. However, this is not feasible in
studies of late-onset disorders, where parental DNA is not
available. Unambiguous haplotype data can be generated by direct
molecular haplotyping methods but they are limited by the need to
optimize stringent reaction conditions, low throughput, and high
cost. For example, allele-specific PCR [Ruano and Kidd, 1989] is
not robust enough for amplifying longer stretches of DNA for
haplotype analysis; single-molecule PCR amplification [Ding and
Cantor, 2003; Mitra et al., 2003; Ruano et al., 1990; Tost et al.,
2002] is limited by the number of markers one can study with just
one DNA molecule and the throughput one can achieve. Somatic
hybrid cell line technology [Douglas et al., 2001; Patil et al., 2001]
and clone-based strategies [Burgtorf et al., 2003] are usually quite
laborious and not practical for population studies. With techno-
logical advances in microscopy, one group has shown that single
labels hybridized to a DNA molecule up to 10kbp can be
visualized by atomic force microscopy (AFM) with carbon
nanotubes [Woolley et al., 2000]. But AFM technology is not
readily available to most researchers and the experimental
procedures are difficult to automate.
Published online in Wiley InterScience (www.interscience.wiley.com).yThis article is a US Government work and, as such, is in the public
domain in the United States of America.
DOI 10.1002/humu.20528
The S upplementary Material referred to in this article can beaccesse d at http://www.intersci ence.wil ey.com/jpages /1059-7794/suppmat.
Received 19 January 2007; accepted revised manuscript 2 March2007.
Grant sponsor: National Institutes of Health (NIH).
MingXiao and Matthew P. Gordon contributed equally to this work.
ÃCorrespondence to: Pui-Yan Kwok, University of California,San Francisco, 513 Parnassus Avenue, Box 0793, HSW-901G, SanFrancisco, CA 94143- 0793. E-mai l: Pui.kwok@uc sf.edu
PUBLISHED 2007 WILEY-LISS, INC.
8/3/2019 Determination of Haplotypes from Single DNA Molecules: A Method for SingleMolecule Barcodin
http://slidepdf.com/reader/full/determination-of-haplotypes-from-single-dna-molecules-a-method-for-singlemolecule 2/9
Here we report a molecular haplotyping method by directly
imaging multiple polymorphic sites on individual DNA molecules
simultaneously. Our method starts with long-range PCR amplifica-
tion of target DNA segments containing the polymorphic sites,
followed by allele-specific labeling of polymorphic alleles with
fluorescent dye molecules, imaging the linearly stretched single
DNA molecules, and determining the nature and positions of the
fluorescent dyes along the DNA molecules. A variation of thepadlock probe ligation approach [Nilsson et al., 1994] was used to
introduce a fluorescent dye molecule at each polymorphic site
such that the fluorescent label stays in place for distance
measurements. The labeled single DNA molecules were then
stretched into linear form on a glass surface and imaged using
multicolor total internal reflection fluorescence (TIRF) micro-
scopy, a technique capable of localizing single fluorescent dye
molecules with nanometer-scale accuracy [Yildiz et al., 2003].
By determining the colors and positions of the fluorescent labels
with respect to the backbone at polymorphic sites, the haplotype
may be inferred with great accuracy, in a manner similar to reading
a barcode, even when the DNA fragments are not fully labeled
(Fig. 1) [Kwok and Xiao, 2004]. The instrument was built with
widely available commercial components at reasonable cost. Thefeasibility of this approach is demonstrated by the determination of
the haplotypes of a 9.3-kbp DNA fragment containing four SNPs
in a region on human chromosome 17 that is linked to the
susceptibility of the skin disease psoriasis [Helms et al., 2003].
MATERIALS AND METHODS
DNA Samples and Long-Range PCR
DNA samples from the Centre d’Etude du Polymorphisme
Humain (CEPH) panel were obtained from the Coriell Institute for
Medical Research (Camden, NJ). PCR primers were ordered from
Integrated DNA Technologies (IDT, Coralville, IA). Primer
sequences are listed in Supplementary Table S1 (available online
at http://www.interscience.wiley.com/jpages/1059-7794/suppmat).
Long-range PCR was performed with the Eppendorf TripleMaster
PCR System (Westbury, NY), using the TripleMaster PCR Polymerase
mix and 10Â tuning buffer with Mg21. The 10-mM dNTP mix was
from Invitrogen (Carlsbad, CA). Long-range PCR was performed in
an MJ Peltier Thermocycler (Bio-Rad, Hercules, CA).
All PCR reactions were conducted according to the manufac-
turer’s manual. Two different master mixes were prepared on ice in
separate sterile microcentrifuge tubes. Master mix 1 contained
4mL each of the forward and reverse PCR primers at 5 mM, 10mL
of molecular biology grade water, and 2 mL (250ng) of a DNA
template. Master mix 2 was comprised of 22.1mL molecular
biology grade water, 5 mL 10Â tuning buffer with Mg21, 2.5mL
dNTP mix (10 mM each of dATP, dCTP, dGTP, and dTTP), and0.4mL TripleMaster polymerase mix (0.04 U/ mL). Immediately
prior to cycling, the two master mixes were combined and gently
mixed by pipetting up and down several times. Then the solution
was placed into a thermocycler preheated to 931C. The PCR
mixture was held at 931C for 3 minutes to denature the DNA
template, followed by 10 cycles of amplification. Each cycle started
with template denaturation at 931C for 15 seconds, then primer
annealing at 651C for 30 seconds, and ended with an incubation at
681C for 15 minutes. A second round of amplification was carried
out, with 17 cycles at 931C for 15 seconds followed by 30 seconds
at 651C, then 15 minutes at 681C (20 seconds/cycle). The PCR
product can be stored at 41C until further use or it can be stored
long-term at À201C. The yield of PCR products was estimated by
0.4% agarose gel electrophoresis in TAE buffer.
Allele-Speci¢c Labeling
Allele-specific labeling requires a two-step process (Supplemen-
tary Fig. S1a–d). First, we denatured the long-range PCR product.
A total of 10 mL of 9.3-kbp-long double-stranded PCR product,
0.5mL each of the four gap-filled padlock probes at 20mM
(Supplementary Table S1), and 2mL of 10Â Ampligase DNA
Ligase Buffer (Epicentre Biotechnologies, Madison, WI) were
mixed and denatured at 981C for 5 minutes and then immediatelyplaced on ice. After the samples were cooled to 41C, 1mL of each
of the fluorescently-labeled dNTPs was added to the mixture. To
this mixture we also added 1 mL of the Stoffel Fragment (Applied
Biosystems, Foster City, CA) for dye incorporation at the
polymorphic site, and 1mL of Ampligase DNA Ligase (Epicentre
Biotechnologies, Madison, WI) to seal the gap and circularize the
probe. The entire mixture was incubated at 551C for 4 hours.
Parental Genotyping
The DNA samples of family trios from the CEPH panel were
used for parental genotyping. Four SNPs, rs12797, rs745318,
rs878906, and rs734232, were genotyped with the template direct
dye-terminator incorporation with fluorescence polarization (TDI-FP) assay. PCR was conducted by combining 3 mL of PCR primer
mix (0.2mM each of the forward and reverse primer) with 3 mL of
zPCR solution consisting of 0.5mL 10Â buffer, 0.25 mL MgCl2at 50mM, 0.1 mL dNTP mix at 2.5mM each, 0.02 mL of Plati-
num Taq DNA Polymerase (Invitrogen), and 2.13 mL of double-
distilled water (ddH2O). The total solution of 6 mL was added to
each well of 2.4 ng dried DNA. The reactions were held at
951C for 2 minutes, followed by 45 cycles of amplification.
Each cycle started with template denaturation at 921C for
10 seconds, then primer annealing at 581C for 20 seconds, and
ended with primer extension at 681C for 30 seconds. The mixture
was kept at 681C for 10 minutes to complete extension, then
stored at 41C.
Excess dNTPs and inorganic pyrophosphate were enzymaticallydestroyed by adding 2 mL of PCR Clean-Up mix to each PCR
product. The mixture included 10Â PCR Clean-Up buffer, PCR
Clean-Up reagent (PerkinElmer, Boston, MA), and pyropho-
sphatase enzyme (Roche, Indianapolis, IN). The ratio was
10.5:1.33:1.5, respectively. The total mixture was incubated
at 371C for 1 hour followed by enzyme inactivation at 901C for
15 minutes; then stored at 41C.
Primer extension was carried out by adding an 8-mL TDI
cocktail to the post-clean-up PCR product. The cocktail consisted
of 2mL Acycloprime 10Â reaction buffer, 1mL of dye terminator,
0.05mL Acyclo enzyme (PerkinElmer), and 4.95 mL of ddH2O.
The total mixture was held at 951C for 2 minutes followed by 5 to
15 cycles consisting of 15 seconds at 951
C and 30 seconds at 551
C,and then stored at 41C.
Preparation of the GlassCoverslips andDNA Mounting
This protocol was adopted from Braslavsky et al. [2003] and
Kartalov et al. [2003], with modifications. Briefly, Fisher premium
coverslips (22Â30 mm) were sonicated in 2% MICRO-90 soap
(Cole-Parmer, Vernon Hills, IL) for 20 minutes and then cleaned
by boiling in RCA solution (6:4:1 high-purity H2O/30% NH4OH/
30% H2O2) for 1 hour. Poly(allylamine) (PAll) and Poly(acrylic
acid) (PAcr) (Sigma-Aldrich, St Louis, MO) were dissolved at
2 mg/mL in high-purity water. The solutions were adjusted to pH
8.0 using HCl and NaOH. The polyelectrolyte solutions were then
passed through a 0.22-mm filter. The RCA-cleaned coverslips were
immersed in the positive (PAll) and the negative (PAcr)
2 HUMAN MUTATION 0,1^9,2007
Human Mutation DOI 10.1002/humu

8/3/2019 Determination of Haplotypes from Single DNA Molecules: A Method for SingleMolecule Barcodin
http://slidepdf.com/reader/full/determination-of-haplotypes-from-single-dna-molecules-a-method-for-singlemolecule 3/9
polyelectrolytes according to the scheme1/wash/–/wash/ 1/wash.
Each polyelectrolyte incubation was 30 minutes on a shaker at
150 rpm and 351C, and each wash step involved rinsing with high-
purity water three times. The polyelectrolyte-coated coverslips
were stored in high-purity water at room temperature.
DNA mounting was performed by a procedure similar to the one
published by the Schwartz group [Lim et al., 2001]. Padlock
probe–labeled, column-purified DNA was diluted to approximately100 pM in imaging buffer (10 mM TRIS, 1 mM EDTA, 2 mM
YOYO-1, 20% 2-mercaptoethanol, pH 7.5). Glass slides were
passed through a propane torch flame to remove impurities and
moisture. A coated coverslip was placed on the glass slide, and
7mL of diluted DNA was pipetted onto the edge. The solution was
drawn under the coverslip by capillary action, resulting in a strong
flow, which caused the DNA fragments to be stretched and aligned
on the coverslip surface. Figure S2 showed the length distribution
of stretched DNA molecules of 9.3 kbp. The coverslip was sealed
with clear nail polish (Revlon Extra Life Top Coat 950). The
imaging buffer consisted of 300 pM YOYO-1 iodide (Molecular
Probes, Eugene, OR) and 20% 2-mercaptoethanol in sterile TE
buffer. YOYO-1 iodide is an intercalating dye that stains the
DNA backbone and makes it possible to visualize the DNA.2-Mercaptoethanol is a strong reducing agent that retards
photobleaching of the YOYO-1 and cyanine dyes by scavenging
oxygen from the solution.
Total Internal Re£ection Microscopy
The total internal reflection fluorescence microscope was based
on an Olympus IX-71 microscope (Olympus America, Inc., Center
Valley, PA) with a custom-modified Olympus TIRFM Fiber
Illuminator, and a 100Â SAPO objective (Olympus SAPO
100Â /1.40 oil). YOYO-1 was excited using 488-nm wide-field
excitation from a mercury lamp mounted on the rear port of the
TIRFM illuminator. Cy3 and Cy5, the padlock probe labels, were
excited using 543-nm and 628-nm helium-neon lasers, respectively(JDS Uniphase, San Jose, CA), which were combined by a dichroic
mirror and expanded to a 7-mm diameter beam. The 543-nm and
628-nm excitations were focused via objective-type TIR through a
translation stage. The emitted photons were collected through two
separate filter cubes that contained either emission filter
HQ510LP for blue dye YOYO-1 or a dual-band pass emission
filter (Z543-633M) for Cy5 and Cy3. The HQ510LP and Z543-
633M emission filters were wedge-matched to reduce pixel shift
during filter cube switching. A polychromatic mirror (Z543-633
RPC) was used in conjunction with the Z543-633M emission filter.
All filters were obtained from Chroma Technology (Rockingham,
VT). The image was magnified by a 1.6Â tube lens and recorded
by a back-illuminated, TE-cooled, frame-transfer charge-coupled
device (CCD) detector BV887 (Andor Scientific, Belfast, North-
ern Ireland). Both the DNA backbone image and the padlock
probe–labeled images were integrated for 1 second. Each dye was
illuminated separately in sequence, and the series of three images
formed a single image set.
Data Analysis
Custom-written software in IDL (Research Systems, Inc.,
Boulder, CO) was used for data analysis (source code available
upon request). First, raw images were combined into a false-color
three-channel composite image, and DNA fragments with adequate
stretching and labeling were selected and extracted for analysis.
After a DNA fragment was extracted, the contour of the backbone
was computed (Supplementary Fig. S3). The fragment boundaries
were determined by threshold segmentation. Depending on the
orientation of the molecule, the image was then split into either
horizontal or vertical ‘‘strips’’ of pixels. Each strip was fit to a
Molecular Haplotying
Distance discrimination and color combination
SNP 1 SNP 2 SNP 3 SNP 4 SNP 5
SNP 1 SNP 2 SNP 3 SNP 4 SNP 5
G
C
A
A
C
T
G
G A
A
distance
FIGURE 1. Haplotype barcodes. Unique ‘‘haplotype barcodes’’ for the two haplotypes, where each allele of ¢ve SNPs is labeled witheither a Cy5 (red) or a Cy3 (green) £uorescent probe.The distance and color combinations between labels along theYOYO-stainedDNA backbone (blue) are determined by £uorescence single-molecule detection withTIRF microscopy. The haplotype can then beinferred from the‘‘barcode.’’
FIGURE 2. Gap-¢ll padlockprobe labelingscheme. A: Avariationof thepadlockprobe ligation approachwas used in this study, inwhich a long oligonucleotide (80^100 bases) was designed sothat both 50 and 30 ends of the probe can hybridize to the targetand leave a 1-base gap at the polymorphic site, forming anincomplete ring. B:The gap was then ¢lled with a £uorescently-labeled nucleotide by polymerase, and C: a thermostable ligasethen joined the two ends to form a circularized padlock probethat tightly intertwined with the target.
HUMAN MUTATION 0,1^9,2007 3
Human Mutation DOI 10.1002/humu

8/3/2019 Determination of Haplotypes from Single DNA Molecules: A Method for SingleMolecule Barcodin
http://slidepdf.com/reader/full/determination-of-haplotypes-from-single-dna-molecules-a-method-for-singlemolecule 4/9
Gaussian distribution plus an offset, and the backbone contour was
determined by the line joining the centroids of each distribution.
The padlock probe labels in the green and red channels were
then individually localized either by fitting to Gaussian point-
spread functions (PSFs) (Supplementary Fig. S4) or, in cases in
which the signal-to-noise ratio was too low, the centroid was
determined by finding the center of mass of the intensity
distribution.Since the stretching of the DNA fragment is variable between
fragments, and along the contour length of the same fragment, it is
assumed that the DNA fragment is of a known size in base pairs,
and that the fluorescence intensity is proportional to the number
of base pairs per unit length. The image of the DNA fragment was
split at the label position along an axis perpendicular to the DNA
contour at that point, and the total DNA image intensity on each
side of the split was computed. The label position, in terms of base
pairs, was then computed as the ratio of the intensity on one side
of the label to the total intensity.
Once the label positions have been determined, it is necessary to
match each observed label to a known locus, and to determine to
which haplotype(s) it corresponds (see Supplementary Fig. S5).
Briefly, for a given fragment, we generate all possible locus-labelmatchings, consistent with maintaining the observed linear order of
the labels. Each of these matchings is assigned a score
S ¼P N
i¼0
eÀd2i =s
2
, where di is the distance between label i and its
assigned locus, N is the number of labels, and s is based on the
observed standard deviation for label position measurements
(approximately 5–10%). The matching with the highest score is
selected. This score is then multiplied by the number of labels,
reflecting the increased confidence in the locus-label matching that
comes from having multiple labels present. Because this strategy
weighs labels by how well they match up with the expected label
positions based on the relative locations of the polymorphic sites,
labels that are not close to any locus (e.g., those due to nonspecificlabeling or free dye) will not strongly impact the results.
A running score is kept for all possible haplotypes, and the score
for the fragment is added to the score for the appropriate haplotype.
If a fragment has fewer labels than there are loci, it may correspond
to several possible haplotypes. For instance, if there are four loci,
and three labels, such that the matching is RGÃR, where à is the
unmatched position, then this fragment could correspond to either
RGGR or RGRR. In this case, the scores for all possible matching
haplotypes are incremented. This way, partially labeled fragments
can contribute to the calculation of the haplotype.
Alternatively, scores for each individual position are computed
based on whether a particular label is observed at a particular
position, and based on the color of the label. In this manner, each
individual position can be shown to be either homozygous orheterozygous, depending on whether only one or both label colors
are observed at that position. After all the positions have been
shown to be heterozygous or homozygous, the number of possible
haplotypes is reduced, and corresponding haplotype scores from
the above analysis are added together to create a scored reduced
set of possible haplotypes. These are the scores that are then
evaluated to determine the dominant haplotype that is present.
RESULTS
Localization of Polymorphic Alleles Tagged by Single
Fluorescent Dye Molecules Along DNA Backbones
Allele-specific labeling of the markers found on the long-range
PCR products for single-molecule analysis is very challenging. Not
only must the target DNA be labeled with great efficiency and
specificity, the labels must also be tightly bound to the DNA so
that their positions on the DNA molecule can be determined with
accuracy at the end of the experiment. A variation of the padlock
probe ligation approach [Nilsson et al., 1994] was used in this
study, in which a long oligonucleotide (80–100 bases) was
designed such that both 50-end and 30-end of the probe hybridized
to the target region, forming an incomplete ring with a 1-base gapat the polymorphic site (see Fig. 2). DNA polymerase is used to fill
the gap with a fluorescently-labeled nucleotide and DNA ligase
is used to seal the nick to yield a circular DNA padlock probe that
is topologically linked with the target. The labeling specificity was
confirmed by using both synthetic oligonucleotides and long-range
PCR products as templates (Supplementary Appendix).
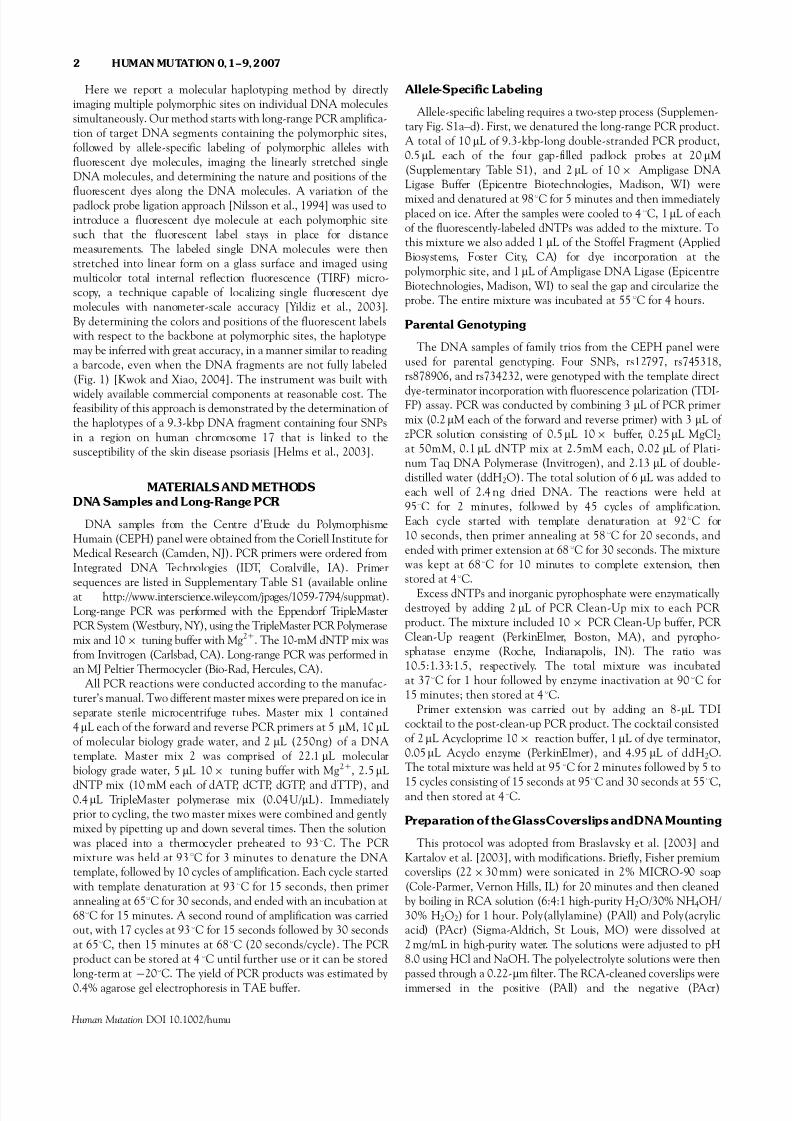
In the first set of experiments, we sought to label an SNP
specifically and measure the location of the SNP on the DNA
backbone. To aid with the distance measurements, we used
Cy3-labeled PCR primers to amplify a 9.3-kbp fragment containing
the SNP rs12797, a G4A polymorphism. Using the gap-filled
ligation approach, the two alleles were tagged with Cy3-dATP
(green) and Cy5-dGTP (red). The DNA backbone was stained
with YOYO (blue). Three images (with the green, red, and bluechannels) were taken and superimposed to produce a composite
picture of the DNA molecules. Figure 3a is a false-color three-
channel composite image showing the stretched DNA contours
and allelic labels (with Cy5-dGTP in red, Cy3-dATP in green, and
YOYO in blue). About 30 DNA molecules are shown in this image
and 20 of them are fully stretched, with a mean contour length of
3.5mm. This suggests slight overstretching of the DNA of 0.38 nm
per basepair, compared with the solution conformation of 0.34 nm
per basepair (see Supplementary Appendix). Most of the DNA
fragments in Figure 3a have Cy3 dyes at both ends, and some of
them have a Cy3 in the middle (as shown by the red arrows),
indicating the presence of Cy3-labeled probe on the backbone.
The Cy3 label (A allele) was calculated to be at position
33117161 bp, which is in excellent agreement with the expected
position of 3291 bp from one end (Fig. 3b). On the other hand, few
red labels (G allele) were detected, and these were distributed
randomly, confirming the fact that this DNA sample is from A4A
homozygote for SNP rs12797. There are also occasional Cy3 dye
signals at unexpected positions on the DNA backbone, as shown
by the yellow arrows. These are most likely the result of either
fluorescent impurities on the coverslip, unassociated Cy3, or
nonspecific labeling. Because our algorithm for computing
haplotypes takes advantage of the distance relationships between
the dyes as well as their colors, these rare, nonspecific signals will
have little effect on the accuracy of haplotype calls (see Materials
and Methods).
Figures 3c and d show the results of another experiment inwhich the DNA sample from an rs12797 G4A heterozygote was
labeled and the distances measured. In this case, both green and
red labels (G and A alleles) were detected at about 34597492bp
and 34137372 bp from one end, respectively, compared with the
expected position of 3,291 bp from one end. The proportion of red
labels and green labels found on the DNA backbone is roughly
50:50, as expected from a heterozygous sample.
A total of 890 DNA molecules were chosen for analysis based
on two criteria: at least one green label was found at the end of the
DNA molecule and the contour length of the DNA backbone
must be between 2.5 and 4.0mm to ensure full stretching
(Supplementary Appendix). Out of the 890 DNA molecules,
internal labels were found on 228 DNA molecules, indicating that
the labeling efficiency was $26%. These experiments demonstrate
4 HUMAN MUTATION 0,1^9,2007
Human Mutation DOI 10.1002/humu

8/3/2019 Determination of Haplotypes from Single DNA Molecules: A Method for SingleMolecule Barcodin
http://slidepdf.com/reader/full/determination-of-haplotypes-from-single-dna-molecules-a-method-for-singlemolecule 5/9
three key capabilities of the technology: 1) the labeling is allele-specific; 2) DNA molecules of 10 kb can be fully stretched; and 3)
individual fluorescent dyes of different colors can be imaged and
localized accurately along the DNA backbone to within several
hundred base pairs.
Direct Haplotype Determinationof a Human DNA Sample
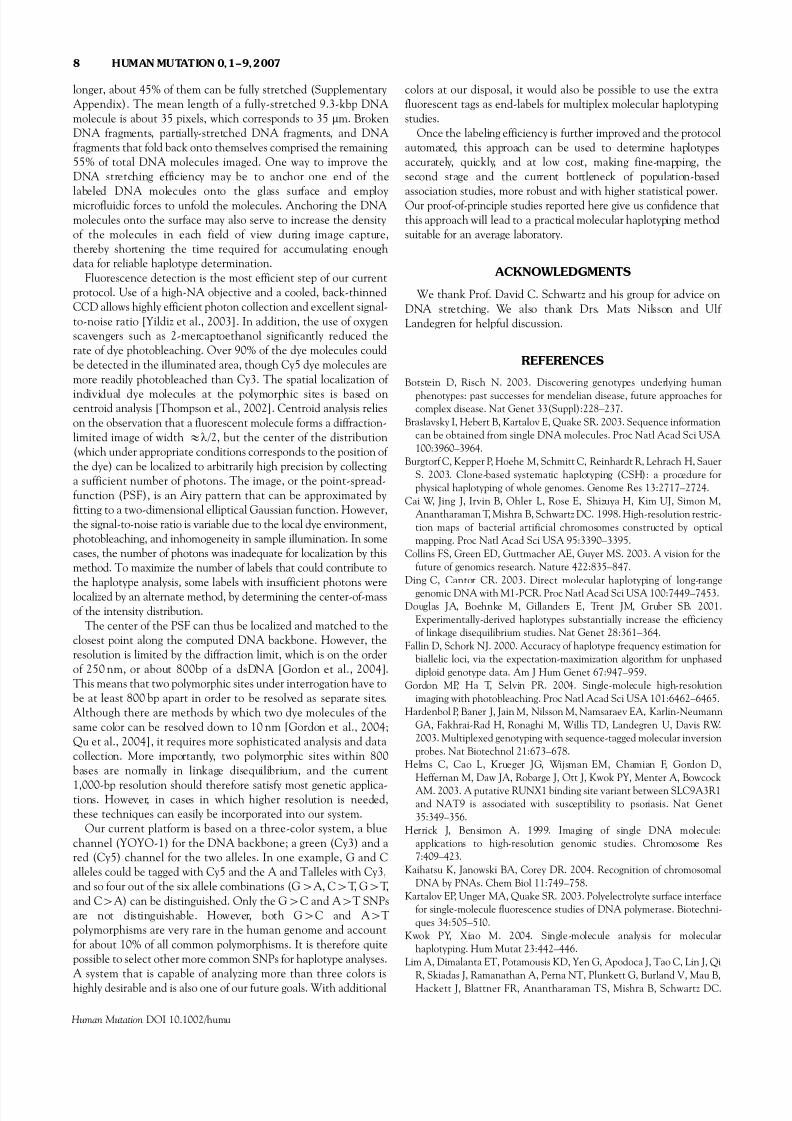
The second set of experiments was designed to demonstrate
this technology’s ability to correctly determine a haplotype
consisting of four SNPs. Once again, we studied the 9.3-kbp
DNA segment of human chromosome 17, containing markers
rs878906(C4T) (SNP 3-1), rs12797 (G4A) (SNP 3-2),
rs734232(G4A) (SNP 3-3), and rs745318(C4T) (SNP 3-4).
As before, the alleles were tagged with gap-filled padlockprobes. In this case, the G and C alleles were labeled with red
Cy5-dGTP and Cy5-dCTP, and the A and T alleles were tagged
with Cy3-dATP and Cy3-dUTP, respectively. An additional
green-channel dye was introduced at one end during long-range
PCR using a Cy3-labeled primer. This end label was used to
indicate the orientation of DNA molecules. The relative distance
between polymorphic sites starting from the end label is shown
in Figure 4a. Figure 4b is a false-color composite image of all three
channels from a typical experiment with a DNA sample from
an individual who is heterozygous at all four SNPs. Most of the
DNA fragments are fully stretched, and some fully-stretched DNA
molecules show more than one internal labels. As the current
labeling efficiency is about 25% for each SNP, one should find an
average of four DNA fragments out of 1,000 DNA molecules with
a.
c.
N u m b e r o f L a b e l s
0
2
4
6
8
10
12
14
16
Allele A (Cy3)
Allele G (Cy5)
Calculated location
Location of dye molecules from one end
0 bp 937 bp 1874 bp 2811 bp 3748 bp 4685 bp
Location of dye molecules from one end
N u m b e r o f L a b e l s
0
2
4
6
8
10
12
14
16
Allele A (Cy3)
Allele G (Cy5)
Calculated location of Cy3
Calculated location of Cy5
0 bp 937 bp 1874 bp 2811 bp 3748 bp 4685 bp
d.
b.
FIGURE 3. A: An intensity-scaled composite image of all three channels. The alleles of the SNP rs12797 were labeled with Cy 3 dye(green) for theA allele andCy5 dye (red) for theG allele.The positions of labeled alleles are indicated with red arrows. Few red labelswereobserved, indicating that thissampleis A/A homozygous.Yellow arrowsindicate dyes at incorrect positions. B: Histogram of thedistance distribution of the results from ( A). Red bars indicate the G allele and green bars represent the A allele, respectively. TheGaussiancurve ¢tting shows a green peak at 3,3117161bp from one end, which is consistent with the expected distance of 3,291bp.A total of 86 molecules were examined; 66 with Cy 3 internal labels and 20 with Cy5 internal labels were observed in total. C: Anintensity-scaled composite image of all three channels.The alleles of SNP rs12797 were labeled with Cy3 (green) for theA allele andCy5 (red) for the G allele. The positions of labeled alleles are indicated with red arrows. Both Cy3 and Cy5 labels were observed,indicating that this sample is G/A heterozygous. D: Histogramof the distance distribution of the results from (C). Red indicates theG allele and green represents the A allele. The Gaussian curve ¢tting shows a green peak and a red peak at 3,4597492 bp and3,4137372 bp from oneend, respectively, which is consistent with the actual distance of 3,291bp. A total of 228 DNA molecules wereexamined, from which 73 Cy3 labels and 69 Cy5 labels wereanalyzed.
HUMAN MUTATION 0,1^9,2007 5
Human Mutation DOI 10.1002/humu

8/3/2019 Determination of Haplotypes from Single DNA Molecules: A Method for SingleMolecule Barcodin
http://slidepdf.com/reader/full/determination-of-haplotypes-from-single-dna-molecules-a-method-for-singlemolecule 6/9
Site 4, rs745318
Site 3, rs734232
Site 3, rs734232
Site 2, rs12797
Site 1, rs878906
958bp
3300bp
6497bp
4563bp
9370bp
SNP 3-1
rs878906
End
label
C
T
A
G
A
G
C
T
SNP 3-2
rs12797
SNP 3-3
rs734232
SNP 3-4
rs745318
a.
b.
FIGURE 4. A: Relative locations of the polymorphic sites, their alleles, and the labels assigned to each allele. Green represents Cy3and red represents Cy5. B: Rescaled false-color composite image of all three channels, showing DNA fragments with multiple labels,which have been identi¢edand tagged based on their position on theDNA fragment.
FIGURE 5. All eight possible heterozygous haplotypes with their scores.The arrow indicates the score of the highlighted haplotype,RGGR/GRRG. Inset: Scores forCy3 andCy5 at each individual locus, showing that all four loci are heterozygous.
6 HUMAN MUTATION 0,1^9,2007
Human Mutation DOI 10.1002/humu

8/3/2019 Determination of Haplotypes from Single DNA Molecules: A Method for SingleMolecule Barcodin
http://slidepdf.com/reader/full/determination-of-haplotypes-from-single-dna-molecules-a-method-for-singlemolecule 7/9
all four polymorphic sites labeled. Considering the fact that about
40% of the DNA fragments are fully stretched and are therefore
suitable for analysis, 2,500 DNA molecules must be scanned to
find one fully-labeled DNA fragment. However, because the
spatial localization of fluorescent dyes is very accurate, some
partially-labeled DNA fragments can be used to assemble the
haplotype, as long as they fulfill three criteria. First, the labeled
DNA fragments must be fully stretched so that the label positionsmay be accurately determined. Second, they must have an
end-label, to allow them to be oriented and aligned properly.
Third, DNA fragments must have at least two polymorphic sites
labeled to show the haplotype relationship between them. One
such DNA molecule with two internal labels is shown in the
uppermost inset of Figure 4b. After calculating the distances
between the internal labels, they were determined to be the alleles
of SNP 3-3, and SNP 3-4, with the alleles being G(SNP 3-3)-
G(SNP 3-4). Another fragment, with three internal labels, are
shown in the lower inset, with the allele labels being C(SNP 3-1)-
A(SNP 3-2)-T(SNP 3-4).
Although a diploid sample heterozygous at four SNPs can have
any two of the 16 possible haplotypes, the sample can only contain
two distinct haplotypes from eight pairs of complementaryhaplotypes. One can therefore take advantage of this biological
knowledge and construct haplotypes with partially-labeled DNA
molecules.
Figure 5 shows the results of scoring 72 doubly- or triply-
labeled, well-stretched DNA fragments with end labels. Of those,
77% had two labels, 21% had three labels, and 2% had four labels.
These numbers taken together suggest approximately 30% labeling
efficiency; however, this is likely to be a slight overestimate due
to the presence of nonspecific labeling, and the occasional inability
to distinguish between multiple DNA fragments that are closely
spaced. The inset shows the normalized score assigned to each of
the four positions corresponding to the number of times a Cy3 or
Cy5 was seen at that position. It confirms that all four positions are
heterozygous, because all four positions show instances of both
Cy3 and Cy5.
Given that all four positions are heterozygous, the horizontal
axis of Figure 5 shows all eight possible pairs of haplotypes, where
each pair consists of two complementary haplotypes that can
produce the four heterozygous genotypes observed. Each allele
is represented by a color, either red or green; for instance, the
top scored genotype is red-green-green-red/green-red-red-green
(RGGR/GRRG), corresponding to either G-C-C-G or T-A-A-T for
the loci rs878906, rs12797, rs734232, and rs745318, respectively.
The score for this haplotype pair is more than 30% higher than the
next highest scored haplotype pair, clearly indicating that this is
the haplotype pair observed for this sample. This result was
confirmed by parental genotyping of all four SNPs (data notshown).
DISCUSSION
Our approach to molecular haplotyping combines several
different technologies: allele-specific tagging of the polymorphic
sites on long-range PCR products; stretching DNA molecules into
linear form on a solid glass surface; and efficient detection and
localization of the location of single fluorescent dye molecules on
the double-stranded DNA (dsDNA) backbone. Its suitability for
use in large-scale genetic studies will depend on its overall
robustness, which depends in part on the efficiency of each of the
individual steps and the degree of automation one can achieve. Of
these, allele-specific labeling of the polymorphic sites is the most
challenging step.
Unlike regular SNP genotyping, in which it is sufficient to know
whether an allele is present in the target DNA or not, in molecular
haplotyping, multiple labels must be placed on the same DNA
molecule in such a way that the spatial relationship among the
alleles is preserved throughout the detection process. Here,
labeling specificity and efficiency are of utmost importance. Fora haplotype containing four polymorphic sites, and with our
current 25% labeling efficiency of individual SNPs, only 0.4%
(0.254) of the DNA molecules would have all four markers tagged.
In practice, polymorphic sites closer to the end of the DNA show
higher labeling efficiency, presumably because there is a lower
energetic barrier to melt the DNA at the ends (data not shown).
Higher labeling efficiency would be more desirable and produce
more accurate results. For example, with 90% labeling efficiency
for each SNP, 65% (0.94) of DNA molecules would be fully
labeled. Fortunately, as we have demonstrated, the biological
realities of diploid genomes allow one to determine haplotypes
with confidence even when fully-labeled DNA molecules are not
found.
A number of methods are available for labeling specific DNAsequences. But probes based on hybridization to form stable
Watson-Crick duplexes are the only practicable approaches for
universal sequence recognition. The competition between the
hybridization of the padlock probe and the native dsDNA
renaturation determines the labeling efficiency of padlock probes.
We were able to establish a labeling protocol that is more favorable
to the hybridization of padlock probes. The key changes include
placing the newly-generated single-stranded DNA (ssDNA) on ice
and maintaining it at low temperature during the gap-fill ligation
step before allowing the sample to renature (Supplementary
Appendix). Even with improvements, however, the individual
SNP labeling efficiency is still at 50% or less. A possible
explanation for this relatively low yield is that not all of the
long-range PCR products can be converted to ssDNA, and only
about 80% of the ssDNA can be renatured. Now that we have
achieved single-molecule detection and interlabel distance
measurement with good specificity and accuracy, we will explore
other labeling approaches such as working directly with ssDNA or
with probes that can bind efficiently to dsDNA without the need
to denature the templates, such as peptide nucleic acids (PNAs)
[Kaihatsu et al., 2004]. High labeling efficiency would also make
multiplex haplotyping (studying multiple regions at the same time)
possible and further reduce the cost of large-scale molecular
haplotyping analysis.
The degree of DNA stretching also directly affects our
haplotyping results, as the spatial localization of fluorescent tags
with respect to the DNA backbone is more accurate with fully-stretched DNA fragments. There are numerous ways of mounting
and stretching dsDNA molecules on a glass surface, such as those
methods (a moving fluid meniscus, capillary fluid flow) used in the
applications of karyotyping, fluorescent in situ hybridization
(FISH), optical mapping and nanowire [Cai et al., 1998; Herrick
and Bensimon, 1999; Stoltenberg and Woolley, 2004]. However,
much of the work was done with rather large DNA molecules
(usually longer than 40 kbp), and most methods of functionalizing
the glass surface were not suitable for single molecules. Here we
combine a glass polymer coating system [Braslavsky et al., 2003;
Kartalov et al., 2003] with a DNA mounting strategy to allow us
to observe single fluorescent dye molecules attached to fully-
stretched DNA molecules. The percentage of fully-stretched DNA
molecules depends on its size. For DNA molecules of 10 kbp or
HUMAN MUTATION 0,1^9,2007 7
Human Mutation DOI 10.1002/humu
8/3/2019 Determination of Haplotypes from Single DNA Molecules: A Method for SingleMolecule Barcodin
http://slidepdf.com/reader/full/determination-of-haplotypes-from-single-dna-molecules-a-method-for-singlemolecule 8/9
longer, about 45% of them can be fully stretched (Supplementary
Appendix). The mean length of a fully-stretched 9.3-kbp DNA
molecule is about 35 pixels, which corresponds to 35 mm. Broken
DNA fragments, partially-stretched DNA fragments, and DNA
fragments that fold back onto themselves comprised the remaining
55% of total DNA molecules imaged. One way to improve the
DNA stretching efficiency may be to anchor one end of the
labeled DNA molecules onto the glass surface and employmicrofluidic forces to unfold the molecules. Anchoring the DNA
molecules onto the surface may also serve to increase the density
of the molecules in each field of view during image capture,
thereby shortening the time required for accumulating enough
data for reliable haplotype determination.
Fluorescence detection is the most efficient step of our current
protocol. Use of a high-NA objective and a cooled, back-thinned
CCD allows highly efficient photon collection and excellent signal-
to-noise ratio [Yildiz et al., 2003]. In addition, the use of oxygen
scavengers such as 2-mercaptoethanol significantly reduced the
rate of dye photobleaching. Over 90% of the dye molecules could
be detected in the illuminated area, though Cy5 dye molecules are
more readily photobleached than Cy3. The spatial localization of
individual dye molecules at the polymorphic sites is based oncentroid analysis [Thompson et al., 2002]. Centroid analysis relies
on the observation that a fluorescent molecule forms a diffraction-
limited image of width El/2, but the center of the distribution
(which under appropriate conditions corresponds to the position of
the dye) can be localized to arbitrarily high precision by collecting
a sufficient number of photons. The image, or the point-spread-
function (PSF), is an Airy pattern that can be approximated by
fitting to a two-dimensional elliptical Gaussian function. However,
the signal-to-noise ratio is variable due to the local dye environment,
photobleaching, and inhomogeneity in sample illumination. In some
cases, the number of photons was inadequate for localization by this
method. To maximize the number of labels that could contribute to
the haplotype analysis, some labels with insufficient photons were
localized by an alternate method, by determining the center-of-mass
of the intensity distribution.
The center of the PSF can thus be localized and matched to the
closest point along the computed DNA backbone. However, the
resolution is limited by the diffraction limit, which is on the order
of 250 nm, or about 800bp of a dsDNA [Gordon et al., 2004].
This means that two polymorphic sites under interrogation have to
be at least 800 bp apart in order to be resolved as separate sites.
Although there are methods by which two dye molecules of the
same color can be resolved down to 10 nm [Gordon et al., 2004;
Qu et al., 2004], it requires more sophisticated analysis and data
collection. More importantly, two polymorphic sites within 800
bases are normally in linkage disequilibrium, and the current
1,000-bp resolution should therefore satisfy most genetic applica-tions. However, in cases in which higher resolution is needed,
these techniques can easily be incorporated into our system.
Our current platform is based on a three-color system, a blue
channel (YOYO-1) for the DNA backbone; a green (Cy3) and a
red (Cy5) channel for the two alleles. In one example, G and C
alleles could be tagged with Cy5 and the A and Talleles with Cy3,
and so four out of the six allele combinations (G4A, C4T, G4T,
and C4A) can be distinguished. Only the G4C and A4T SNPs
are not distinguishable. However, both G4C and A4T
polymorphisms are very rare in the human genome and account
for about 10% of all common polymorphisms. It is therefore quite
possible to select other more common SNPs for haplotype analyses.
A system that is capable of analyzing more than three colors is
highly desirable and is also one of our future goals. With additional
colors at our disposal, it would also be possible to use the extra
fluorescent tags as end-labels for multiplex molecular haplotyping
studies.
Once the labeling efficiency is further improved and the protocol
automated, this approach can be used to determine haplotypes
accurately, quickly, and at low cost, making fine-mapping, the
second stage and the current bottleneck of population-based
association studies, more robust and with higher statistical power.Our proof-of-principle studies reported here give us confidence that
this approach will lead to a practical molecular haplotyping method
suitable for an average laboratory.
ACKNOWLEDGMENTS
We thank Prof. David C. Schwartz and his group for advice on
DNA stretching. We also thank Drs. Mats Nilsson and Ulf
Landegren for helpful discussion.
REFERENCES
Botstein D, Risch N. 2003. Discovering genotypes underlying human
phenotypes: past successes for mendelian disease, future approaches forcomplex disease. Nat Genet 33(Suppl):228–237.
Braslavsky I, Hebert B, Kartalov E, Quake SR. 2003. Sequence information
can be obtained from single DNA molecules. Proc Natl Acad Sci USA
100:3960–3964.
Burgtorf C, Kepper P, Hoehe M, Schmitt C, Reinhardt R, Lehrach H, Sauer
S. 2003. Clone-based systematic haplotyping (CSH): a procedure for
physical haplotyping of whole genomes. Genome Res 13:2717–2724.
Cai W, Jing J, Irvin B, Ohler L, Rose E, Shizuya H, Kim UJ, Simon M,
Anantharaman T, Mishra B, Schwartz DC. 1998. High-resolution restric-
tion maps of bacterial artificial chromosomes constructed by optical
mapping. Proc Natl Acad Sci USA 95:3390–3395.
Collins FS, Green ED, Guttmacher AE, Guyer MS. 2003. A vision for the
future of genomics research. Nature 422:835–847.
Ding C, Cantor CR. 2003. Direct molecular haplotyping of long-range
genomic DNA with M1-PCR. Proc Natl Acad Sci USA 100:7449–7453.Douglas JA, Boehnke M, Gillanders E, Trent JM, Gruber SB. 2001.
Experimentally-derived haplotypes substantially increase the efficiency
of linkage disequilibrium studies. Nat Genet 28:361–364.
Fallin D, Schork NJ. 2000. Accuracy of haplotype frequency estimation for
biallelic loci, via the expectation-maximization algorithm for unphased
diploid genotype data. Am J Hum Genet 67:947–959.
Gordon MP, Ha T, Selvin PR. 2004. Single-molecule high-resolution
imaging with photobleaching. Proc Natl Acad Sci USA 101:6462–6465.
Hardenbol P, Baner J, Jain M, Nilsson M, Namsaraev EA, Karlin-Neumann
GA, Fakhrai-Rad H, Ronaghi M, Willis TD, Landegren U, Davis RW.
2003. Multiplexed genotyping with sequence-tagged molecular inversion
probes. Nat Biotechnol 21:673–678.
Helms C, Cao L, Krueger JG, Wijsman EM, Chamian F, Gordon D,
Heffernan M, Daw JA, Robarge J, Ott J, Kwok PY, Menter A, Bowcock
AM. 2003. A putative RUNX1 binding site variant between SLC9A3R1
and NAT9 is associated with susceptibility to psoriasis. Nat Genet
35:349–356.
Herrick J, Bensimon A. 1999. Imaging of single DNA molecule:
applications to high-resolution genomic studies. Chromosome Res
7:409–423.
Kaihatsu K, Janowski BA, Corey DR. 2004. Recognition of chromosomal
DNA by PNAs. Chem Biol 11:749–758.
Kartalov EP, Unger MA, Quake SR. 2003. Polyelectrolyte surface interface
for single-molecule fluorescence studies of DNA polymerase. Biotechni-
ques 34:505–510.
Kwok PY, Xiao M. 2004. Single-molecule analysis for molecular
haplotyping. Hum Mutat 23:442–446.
Lim A, Dimalanta ET, Potamousis KD, Yen G, Apodoca J, Tao C, Lin J, Qi
R, Skiadas J, Ramanathan A, Perna NT, Plunkett G, Burland V, Mau B,
Hackett J, Blattner FR, Anantharaman TS, Mishra B, Schwartz DC.
8 HUMAN MUTATION 0,1^9,2007
Human Mutation DOI 10.1002/humu
8/3/2019 Determination of Haplotypes from Single DNA Molecules: A Method for SingleMolecule Barcodin
http://slidepdf.com/reader/full/determination-of-haplotypes-from-single-dna-molecules-a-method-for-singlemolecule 9/9
2001. Shotgun optical maps of the whole Escherichia coli O157:H7
genome. Genome Res 11:1584–1593.
Matsuzaki H, Loi H, Dong S, Tsai YY, Fang J, Law J, Di X, Liu WM, Yang
G, Liu GY, Huang J, Kennedy GC, Ryder TB, Marcus GA, Walsh PS,
Shriver MD, Puck JM, Jones KW, Mei R. 2004. Parallel genotyping of
over 10,000 SNPs using a one-primer assay on a high-density
oligonucleotide array. Genome Res 14:414–425.
Mitra RD, Butty VL, Shendure J, Williams BR, Housman DE, Church GM.
2003. Digital genotyping and haplotyping with polymerase colonies. ProcNatl Acad Sci USA 100:5926–5931.
Nilsson M, Malmgren H, Samiotaki M, Kwiatkowski M, Chowdhary BP,
Landegren U. 1994. Padlock probes: circularizing oligonucleotides for
localized DNA detection. Science 265:2085–2088.
Oliphant A, Barker DL, Stuelpnagel JR, Chee MS. 2002. BeadArray
technology: enabling an accurate, cost-effective approach to high-
throughput genotyping. Biotechniques 56–58(Suppl):60–61.
Patil N, Berno AJ, Hinds DA, Barrett WA, Doshi JM, Hacker CR, Kautzer
CR, Lee DH, Marjoribanks C, McDonough DP, Nguyen BTN, Norris
MC, Sheehan JB, Shen NP, Stern D, Stokowski RP, Thomas DJ, Trulson
MO, Vyas KR, Frazer KA, Fodor SPA, Cox DR. 2001. Blocks of limited
haplotype diversity revealed by high-resolution scanning of human
chromosome 21. Science 294:1719–1723.
Qu X, Wu D, Mets L, Scherer NF. 2004. Nanometer-localized multiple
single-molecule fluorescence microscopy. Proc Natl Acad Sci USA101:11298–11303.
Ruano G, Kidd KK. 1989. Direct haplotyping of chromosomal segments
from multiple heterozygotes via allele-specific PCR amplification.
Nucleic Acids Res 17:8392.
Ruano G, Kidd KK, Stephens JC. 1990. Haplotype of multiple
polymorphisms resolved by enzymatic amplification of single DNA
molecules. Proc Natl Acad Sci USA 87:6296–6300.
Schork NJ. 2002. Power calculations for genetic association studies using
estimated probability distributions. Am J Hum Genet 70:1480–1489.
Sobel E, Lange K. 1996. Descent graphs in pedigree analysis: applicationsto haplotyping, location scores, and marker-sharing statistics. Am J Hum
Genet 58:1323–1337.
Stoltenberg RM, Woolley AT. 2004. DNA-templated nanowire fabrication.
Biomed Microdevices 6:105–111.
The IHC. 2003. The International HapMap Project. Nature 426:789–796.
Thompson RE, Larson DR, Webb WW. 2002. Precise nanometer localization
analysis for individual fluorescent probes. Biophys J 82:2775–2783.
Tost J, Brandt O, Boussicault F, Derbala D, Caloustian C, Lechner D, Gut
IG. 2002. Molecular haplotyping at high throughput. Nucleic Acids Res
30:e96.
Woolley AT, Guillemette C, Li-Cheung C, Housman DE, Lieber CM. 2000.
Direct haplotyping of kilobase-size DNA using carbon nanotube probes.
Nat Biotechnol 18:760–763.
Yildiz A, Forkey JN, McKinney SA, Ha T, Goldman YE, Selvin PR. 2003.
Myosin V walks hand-over-hand: single fluorophore imaging with 1.5-nm localization. Science 300:2061–2065.
HUMAN MUTATION 0,1^9,2007 9
Human Mutation DOI 10.1002/humu