Embed Size (px)
Citation preview

Turk J Elec Eng & Comp Sci(2021) 29: 1871 – 1886© TÜBİTAKdoi:10.3906/elk-2009-8
Turkish Journal of Electrical Engineering & Computer Sciences
http :// journa l s . tub i tak .gov . t r/e lektr ik/
Research Article
Design and planning of a distribution system using renewable technologies in arural area of Pakistan
Abdur Rehman YOUSAF, Ghulam MUJTABA, Muhammad AMJAD, Zeeshan RASHID∗
Department of Electrical Engineering, The Islamia University of Bahawalpur, Pakistan
Received: 02.09.2020 • Accepted/Published Online: 18.11.2020 • Final Version: 26.07.2021
Abstract: The inclusion of renewable energy sources in a distribution system to form a dispersed or decentralizedgeneration network has gained tremendous progress in recent years. The architecture of the distribution system hasthe potential to serve as a microgrid during an islanding operation connected directly to the load center while excitedfully by renewable technologies. This paper deals with planning and designing of a medium voltage power distributionsystem in a rural area of Pakistan affluent with abundant reserves of renewable sources of electricity. Two types ofdistribution system architectures, namely radial and ring systems, are simulated using a power flow algorithm with threetypes of renewable generation technologies: solar, wind, and biogas. The theoretical study involves realistic parameterssuch as total houses, estimated load, distance of the load from proposed generation site, solar irradiance, wind speed,and biogas reserves. As a result, transformer losses, line losses, power factor, and voltage profile across the load areevaluated for both system types and compared. It is concluded that the ring system maintains better voltage profile,higher power factor, and less transformer and line losses as compared to the radial system. All the relevant constructiondetails together with the electrical and operational parameters of the power system need to be processed accurately in acomputer program. Such a program has been modeled as part of this research with embedded methods and conditionsoutlined in this paper.
Key words: Distributed generation, radial system, ring system, line losses, power factor, power flow, islanding
1. IntroductionThe face of electrical power systems is rapidly changing all over the world due to the growing needs of electricalenergy to fulfill domestic and commercial objectives. With the growing trend, advanced methods and state-of-the-art equipment are being introduced to the power system community to reduce losses [1], minimize greenhousegas emissions [2], ensure reliability [3], voltage stability [4, 5], improve power quality [6], and utilize renewableenergy without adverse environmental effects [7, 8]. Due to the intermittent nature of renewable energy sources(RES), a control mechanism is required to smartly operate the bidirectional flow of power, storage systems,security and stability in both grid-tied and/or islanding mode [9]. Upgradation of existing medium voltage(MV) networks with RES is a global system approach where the potential candidates for these services arefuel cells, wind farms, PV plants, biogas generators, and thermal plants which are typically smaller in size [10].The incorporation of these RES in potentially rich sites to form a microgrid eliminates voltage, thermal, andtransformer instability issues [11].
The efficient implementation of dispersed generation (DG) in a MV distribution network for power sys-∗Correspondence: [email protected]
This work is licensed under a Creative Commons Attribution 4.0 International License.1871

YOUSAF et al./Turk J Elec Eng & Comp Sci
tem design, planning, and analysis calls for the inclusion of theoretical framework using efficient power flowalgorithms embedded in a computer program. Apart from the conventional methods, more sophisticated solu-tions are proposed including backward sweep method [12], forward sweep method [13], node branch numberingscheme [14], direct solution [15], load admittance method [16], and linear data structure [17]. Despite the exoticnature of these unconventional power flow algorithms and their exquisite ability to forecast optimum power sys-tem layout, there remains a challenge of successful and fast convergence while modeling a spacious architecturewith multiple renewable injections. For this reason, Newton Raphson power flow algorithm is concluded to bethe robust program for modeling complex power networks in a broad spectrum of sophisticated appliances.
There exist four types of primitive architectures of distribution systems namely radial, ring, mesh, oraromatic with each of the type bearing unique features in terms of consistency and reliability of services to theconsumers [18]. Radial network is the simplest, cheapest, and widely used type of distribution system; however,if a fault occurs at a certain point, all the lines in the downstream lose power due to its tree-like structure.Distribution systems are most often prone to natural disasters such as earth quakes, floods, and cyclones, and inthe worst case, fault at a local node may cause power failure in all branches in the tree. Ring and mesh networksare relatively stable systems in terms of fault sensitivity since they maintain multiple connections towards asingle load unit ensuring continuous supply even after connection failure. Although mesh and radial networkscan be mutually transformed to one another by simply breaking or establishing proper connections among thebuses respectively [19, 20], the path of power flow within the nodes modifies enormously causing major reformsin the end results.
Over the past decade, expedient and innovative exercises are being practiced for the performance en-hancement and efficient fault detection in the distribution systems by adaptive algorithms. Suripto performedenergy loss calculation of a 20-kV distribution network and minimized effort using network reconfiguration [21].He performed a simulation study over the region of PTPLN (Persero) UPJ Bantul and calculated energy lossesper annum in the existing system to be 1.7%. After performing network reconfiguration by operating normallyopen and normally closed switches and changing the topology of the line, he reduced the system losses to 1%.Abdelmonem et al. demonstrated loss reduction in distribution networks by network reconfiguration takinginto account bus voltage limits and thermal limits of network branches [1]. They formulated power flow equa-tions in a modified form to incorporate opening/closing of tie switches and introduced embedded generatorsand shunt capacitors while preserving the radial configuration. After comparison with the published results,they concluded that the most appropriate topology of the system causes minimum distribution losses. Raut etal. demonstrated a Pareto multiobjective sine cosine algorithm for determining optimal location of DGs in adistribution system [22]. Due to the contradictory objectives, they determined an optimized Pareto set to helpnetwork operators make fast decisions. Wei et al. introduced a fundamental component shift and multiple-transient-feature fusion method to detect a single phase to ground fault in a distribution network [23]. Theyused the Hilbert transform and a shift factor to preserve all transient features and identified the feeder withmaximum fault degree as the faulty feeder. Shaheen et al. proposed a backtracking search technique for feederreconfiguration in (i) 11-kV Egyptian ring distribution network and (ii) 12.66-kV radial distribution system of32 buses and 37 distribution segments [24]. Using power flow solutions, they concluded that the reconfigurationsatisfactorily improved the voltage profile and minimized the losses and overloading in the branches. Malik etal. performed strategic planning of renewable DGs in a radial distribution network using multiobjective parti-cle swarm optimization method and tested on Portuguese 94-bus system [25]. The simulation results revealedreduction in power loss up to 77.82%, in voltage deviation up to 9.68%, and in voltage stability index up to
1872
YOUSAF et al./Turk J Elec Eng & Comp Sci
44.25%. Recently, Behbahani et al. demonstrated reduction of voltage fluctuations by the reconfiguration ofdistribution network using discrete particle swarm optimization [26]. They considered IEEE 69- and 95-buspractical Iranian distribution network as a case study to analyze the fluctuating load (e.g., welder) which violatespower quality standards. After performing network reconfiguration using normally open and closed switches,they developed optimization problem to mitigate the flicker, improve voltage profile, and reduce power losses.
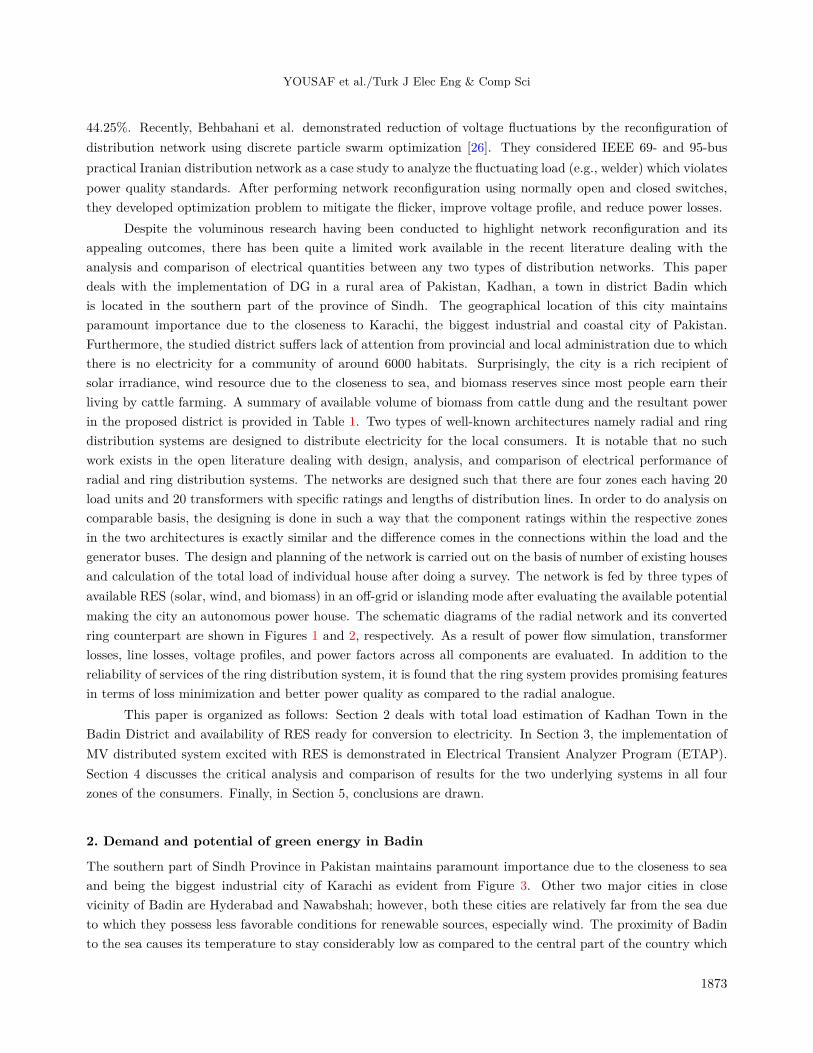
Despite the voluminous research having been conducted to highlight network reconfiguration and itsappealing outcomes, there has been quite a limited work available in the recent literature dealing with theanalysis and comparison of electrical quantities between any two types of distribution networks. This paperdeals with the implementation of DG in a rural area of Pakistan, Kadhan, a town in district Badin whichis located in the southern part of the province of Sindh. The geographical location of this city maintainsparamount importance due to the closeness to Karachi, the biggest industrial and coastal city of Pakistan.Furthermore, the studied district suffers lack of attention from provincial and local administration due to whichthere is no electricity for a community of around 6000 habitats. Surprisingly, the city is a rich recipient ofsolar irradiance, wind resource due to the closeness to sea, and biomass reserves since most people earn theirliving by cattle farming. A summary of available volume of biomass from cattle dung and the resultant powerin the proposed district is provided in Table 1. Two types of well-known architectures namely radial and ringdistribution systems are designed to distribute electricity for the local consumers. It is notable that no suchwork exists in the open literature dealing with design, analysis, and comparison of electrical performance ofradial and ring distribution systems. The networks are designed such that there are four zones each having 20load units and 20 transformers with specific ratings and lengths of distribution lines. In order to do analysis oncomparable basis, the designing is done in such a way that the component ratings within the respective zonesin the two architectures is exactly similar and the difference comes in the connections within the load and thegenerator buses. The design and planning of the network is carried out on the basis of number of existing housesand calculation of the total load of individual house after doing a survey. The network is fed by three types ofavailable RES (solar, wind, and biomass) in an off-grid or islanding mode after evaluating the available potentialmaking the city an autonomous power house. The schematic diagrams of the radial network and its convertedring counterpart are shown in Figures 1 and 2, respectively. As a result of power flow simulation, transformerlosses, line losses, voltage profiles, and power factors across all components are evaluated. In addition to thereliability of services of the ring distribution system, it is found that the ring system provides promising featuresin terms of loss minimization and better power quality as compared to the radial analogue.
This paper is organized as follows: Section 2 deals with total load estimation of Kadhan Town in theBadin District and availability of RES ready for conversion to electricity. In Section 3, the implementation ofMV distributed system excited with RES is demonstrated in Electrical Transient Analyzer Program (ETAP).Section 4 discusses the critical analysis and comparison of results for the two underlying systems in all fourzones of the consumers. Finally, in Section 5, conclusions are drawn.
2. Demand and potential of green energy in Badin
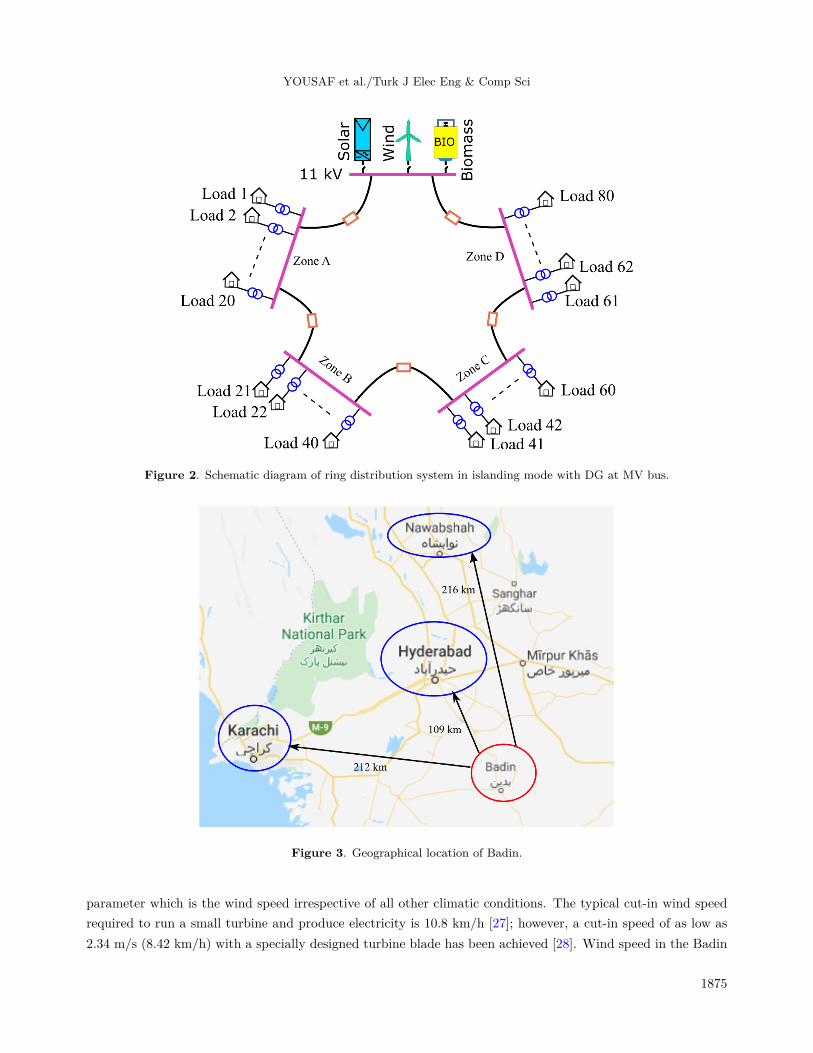
The southern part of Sindh Province in Pakistan maintains paramount importance due to the closeness to seaand being the biggest industrial city of Karachi as evident from Figure 3. Other two major cities in closevicinity of Badin are Hyderabad and Nawabshah; however, both these cities are relatively far from the sea dueto which they possess less favorable conditions for renewable sources, especially wind. The proximity of Badinto the sea causes its temperature to stay considerably low as compared to the central part of the country which
1873

YOUSAF et al./Turk J Elec Eng & Comp Sci
Figure 1. Schematic diagram of the radial distribution system in islanding mode with DG at MV bus.
is also a good prospect for solar PV operation. It should be noted that the electricity deficit exists in thewhole country and power outage is a frequent issue even in large cities of Pakistan. Successful installation of aDG-based distribution system in Badin will not only empower its own community but also allow its surroundingdeveloped cities to run at a steady pace. Furthermore, the capital cost of such an enormous project is inevitablyon the higher side due to the congested land with higher price and rental tariffs in large industrial cities.This makes these adjacent rural areas with vast land at cheap prices more promising for power infrastructuredevelopment.
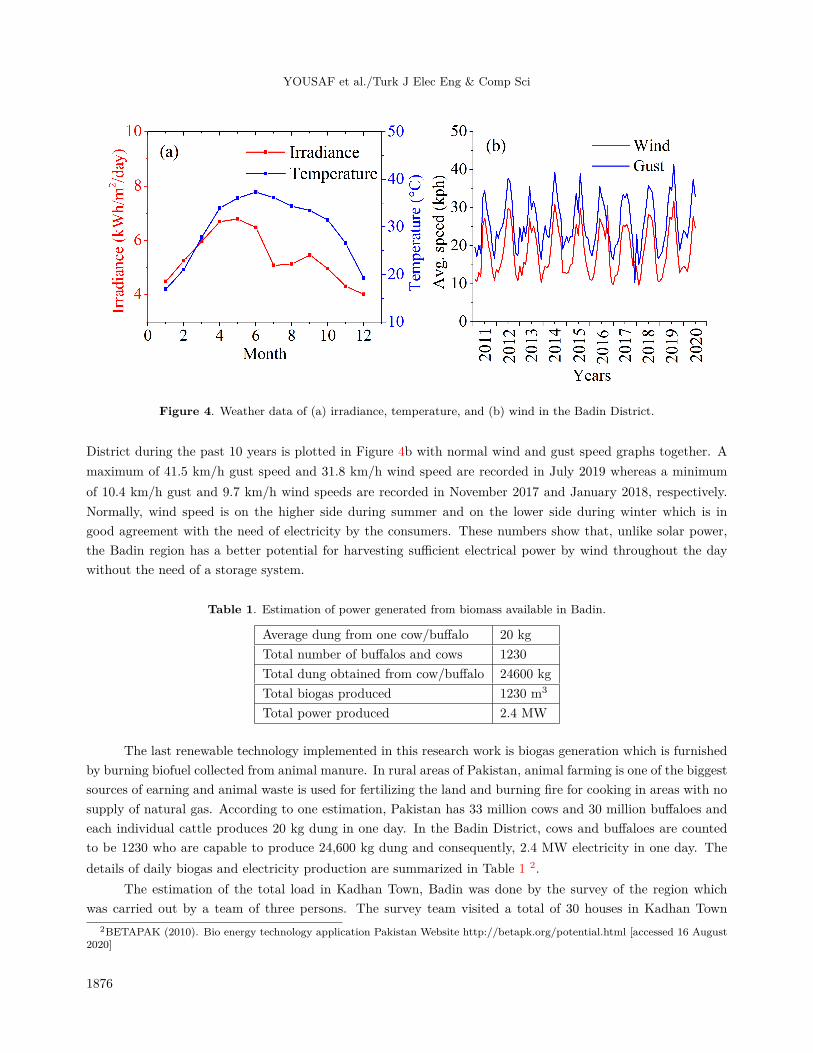
Figure 4 shows the weather data of Badin as recorded from World Weather Online website for the past 10years in each month 1. The irradiance/temperature data are plotted as a function of each month during a yearon the left/right vertical axis, respectively. The irradiance in Badin ranges from 3.6 kW/m2 in December toaround 6.95 kW/m2 in May. The temperature varies from 17 ◦C in January to 37.3 ◦C in June which is notablyquite lower than that in the northern part of Sindh and the southern part of Punjab Province. The smallertemperature additionally enhances PV efficiency in the presence of abundant sunlight for longer duration.
Unlike solar power, the efficient operation of a wind turbine is the function of only one environmental
1Badin Monthly Climate Averages (2020). World Weather [Online]Website https://www.worldweatheronline.com/lang/en-pk/badin-weather-averages/sindh/pk.aspx [accessed 14 August 2020]
1874
YOUSAF et al./Turk J Elec Eng & Comp Sci
Figure 2. Schematic diagram of ring distribution system in islanding mode with DG at MV bus.
Figure 3. Geographical location of Badin.
parameter which is the wind speed irrespective of all other climatic conditions. The typical cut-in wind speedrequired to run a small turbine and produce electricity is 10.8 km/h [27]; however, a cut-in speed of as low as2.34 m/s (8.42 km/h) with a specially designed turbine blade has been achieved [28]. Wind speed in the Badin
1875
YOUSAF et al./Turk J Elec Eng & Comp Sci
Figure 4. Weather data of (a) irradiance, temperature, and (b) wind in the Badin District.
District during the past 10 years is plotted in Figure 4b with normal wind and gust speed graphs together. Amaximum of 41.5 km/h gust speed and 31.8 km/h wind speed are recorded in July 2019 whereas a minimumof 10.4 km/h gust and 9.7 km/h wind speeds are recorded in November 2017 and January 2018, respectively.Normally, wind speed is on the higher side during summer and on the lower side during winter which is ingood agreement with the need of electricity by the consumers. These numbers show that, unlike solar power,the Badin region has a better potential for harvesting sufficient electrical power by wind throughout the daywithout the need of a storage system.
Table 1. Estimation of power generated from biomass available in Badin.
Average dung from one cow/buffalo 20 kgTotal number of buffalos and cows 1230Total dung obtained from cow/buffalo 24600 kgTotal biogas produced 1230 m3
Total power produced 2.4 MW
The last renewable technology implemented in this research work is biogas generation which is furnishedby burning biofuel collected from animal manure. In rural areas of Pakistan, animal farming is one of the biggestsources of earning and animal waste is used for fertilizing the land and burning fire for cooking in areas with nosupply of natural gas. According to one estimation, Pakistan has 33 million cows and 30 million buffaloes andeach individual cattle produces 20 kg dung in one day. In the Badin District, cows and buffaloes are countedto be 1230 who are capable to produce 24,600 kg dung and consequently, 2.4 MW electricity in one day. Thedetails of daily biogas and electricity production are summarized in Table 1 2.
The estimation of the total load in Kadhan Town, Badin was done by the survey of the region whichwas carried out by a team of three persons. The survey team visited a total of 30 houses in Kadhan Town
2BETAPAK (2010). Bio energy technology application Pakistan Website http://betapk.org/potential.html [accessed 16 August2020]
1876
YOUSAF et al./Turk J Elec Eng & Comp Sci
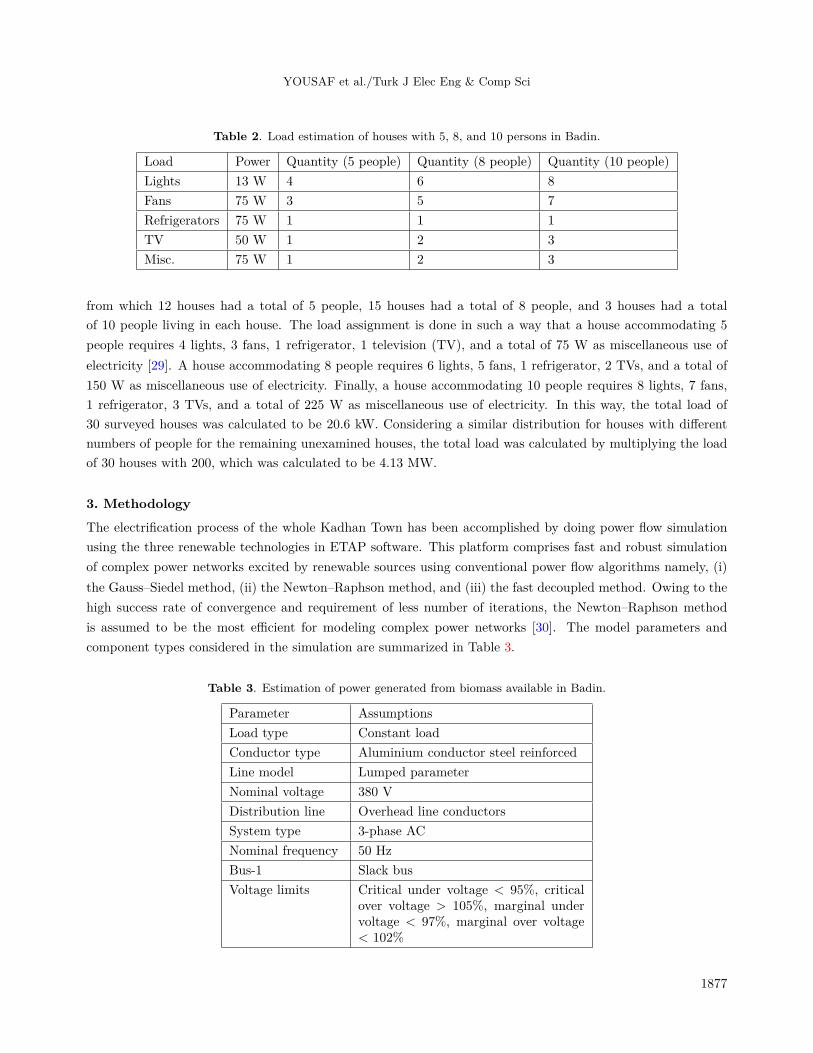
Table 2. Load estimation of houses with 5, 8, and 10 persons in Badin.
Load Power Quantity (5 people) Quantity (8 people) Quantity (10 people)Lights 13 W 4 6 8Fans 75 W 3 5 7Refrigerators 75 W 1 1 1TV 50 W 1 2 3Misc. 75 W 1 2 3
from which 12 houses had a total of 5 people, 15 houses had a total of 8 people, and 3 houses had a totalof 10 people living in each house. The load assignment is done in such a way that a house accommodating 5people requires 4 lights, 3 fans, 1 refrigerator, 1 television (TV), and a total of 75 W as miscellaneous use ofelectricity [29]. A house accommodating 8 people requires 6 lights, 5 fans, 1 refrigerator, 2 TVs, and a total of150 W as miscellaneous use of electricity. Finally, a house accommodating 10 people requires 8 lights, 7 fans,1 refrigerator, 3 TVs, and a total of 225 W as miscellaneous use of electricity. In this way, the total load of30 surveyed houses was calculated to be 20.6 kW. Considering a similar distribution for houses with differentnumbers of people for the remaining unexamined houses, the total load was calculated by multiplying the loadof 30 houses with 200, which was calculated to be 4.13 MW.
3. MethodologyThe electrification process of the whole Kadhan Town has been accomplished by doing power flow simulationusing the three renewable technologies in ETAP software. This platform comprises fast and robust simulationof complex power networks excited by renewable sources using conventional power flow algorithms namely, (i)the Gauss–Siedel method, (ii) the Newton–Raphson method, and (iii) the fast decoupled method. Owing to thehigh success rate of convergence and requirement of less number of iterations, the Newton–Raphson methodis assumed to be the most efficient for modeling complex power networks [30]. The model parameters andcomponent types considered in the simulation are summarized in Table 3.
Table 3. Estimation of power generated from biomass available in Badin.
Parameter AssumptionsLoad type Constant loadConductor type Aluminium conductor steel reinforcedLine model Lumped parameterNominal voltage 380 VDistribution line Overhead line conductorsSystem type 3-phase ACNominal frequency 50 HzBus-1 Slack busVoltage limits Critical under voltage < 95%, critical
over voltage > 105%, marginal undervoltage < 97%, marginal over voltage< 102%
1877
YOUSAF et al./Turk J Elec Eng & Comp Sci
Based on these parameters, two most commonly used distributed architectures namely (i) radial distri-bution and (ii) ring distribution systems are simulated. The details of individual components of the networkand their arrangements are discussed in the next subsections.
3.1. Radial system implementation
Radial system of power distribution is the most common and simplest form of electrical network consisting ofradially emanating distribution transformers from a single point of the bus. For small scale power networks,this architecture serves as a convenient platform for providing quality electricity to the consumers. However,for large-scale networks, consumers located near the far end may experience voltage regulation and unscheduledblackouts in case of fault occurrence. The whole region is divided into four zones namely, Zone A, Zone B,Zone C and Zone D with each comprising of 20 transformers namely T1 - T20 (11 kV/380 V) and 20 load units(Load1 - Load20). The simulation diagram of Zone A of the radial distribution system is shown in Figure 5 inwhich transformers are connected to load units through distribution lines of various lengths. The distance ofload unit from the transformer and kVA of each load unit is calculated from the site survey and the kVA ratingof each transformer is assumed to be equal to that of the corresponding load unit. In this way, the transformeroverloading issues and voltage regulation due to transformer is eliminated and the overall system stays the mosteconomical. The voltage values, transformer kVA, distribution line lengths, and active powers coming from thesimulation are displayed along with each component. In Zone A, the active power flowing towards the loadunits ranges from 18 kW to 188 kW whereas the apparent power of the load ranges from 25 kVA to 200 kVAdepending on the size of the load.
It is apprised that the structure of each zone in the radial network is exactly similar and the only differencecomes in the electrical values across each component. To save space on the paper, the corresponding values ofsimulated apparent powers and distribution line lengths across each branch in Zones B, C, and D are plottedin Figures 6a–c, respectively. In Zone B, the distribution line length ranges from 2 km to 15 km and apparentpower ranges from 21 kVA to 192 kVA. The distance of load from the transformer in Zone C ranges from 1.4km to 18 km whereas apparent power ranges from 19 kVA to 193 kVA. Finally, in Zone D, the distribution linelength ranges from 1.31 km to 16.1 km and apparent power varies between 22 kVA and 193 kVA. As expected,the active power in all zones is slightly smaller than the apparent power for most of the branches and equal tothe apparent power at a few places as well, implying unity power factor.
3.2. Ring system implementation
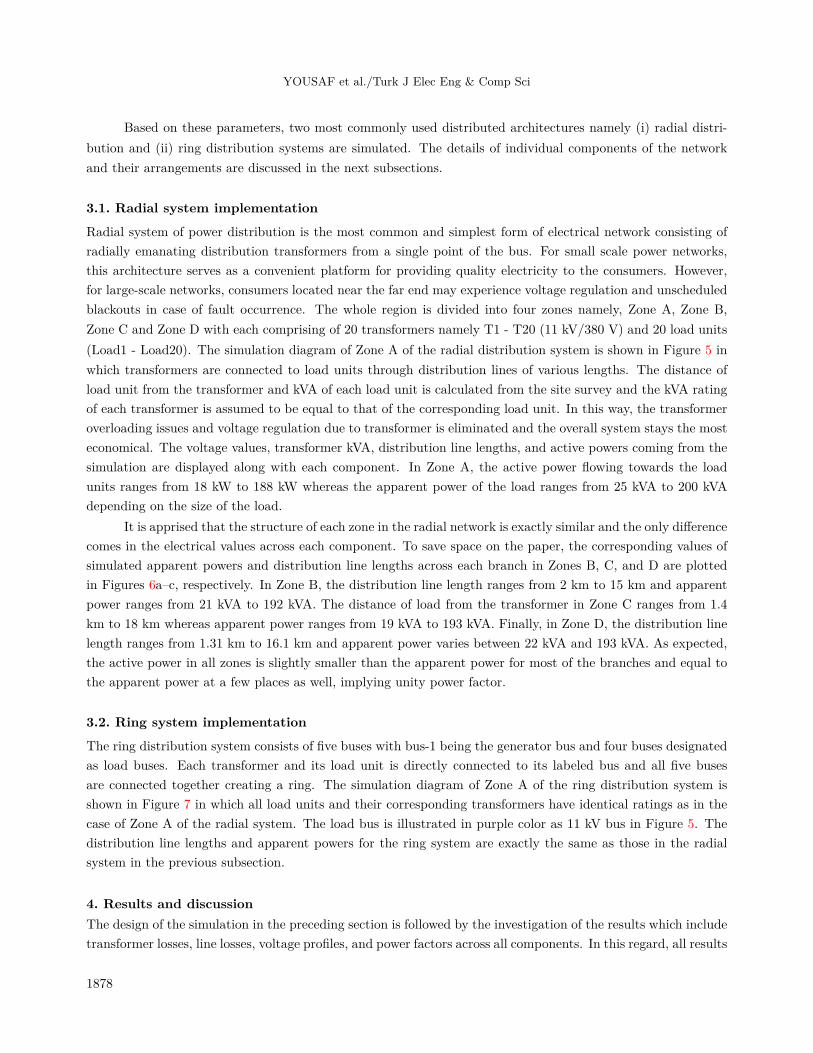
The ring distribution system consists of five buses with bus-1 being the generator bus and four buses designatedas load buses. Each transformer and its load unit is directly connected to its labeled bus and all five busesare connected together creating a ring. The simulation diagram of Zone A of the ring distribution system isshown in Figure 7 in which all load units and their corresponding transformers have identical ratings as in thecase of Zone A of the radial system. The load bus is illustrated in purple color as 11 kV bus in Figure 5. Thedistribution line lengths and apparent powers for the ring system are exactly the same as those in the radialsystem in the previous subsection.
4. Results and discussionThe design of the simulation in the preceding section is followed by the investigation of the results which includetransformer losses, line losses, voltage profiles, and power factors across all components. In this regard, all results
1878

YOUSAF et al./Turk J Elec Eng & Comp Sci
Figure 5. Zone A of the radial distribution system simulated in ETAP.
Figure 6. Active and apparent powers of (a) Zone B, (b) Zone C, and (c) Zone D of the radial distribution system.
for both the radial and ring distribution systems are plotted in the same figure to get a valid comparison. Foreach zone, the electrical parameters are plotted in separate subsections.
1879
YOUSAF et al./Turk J Elec Eng & Comp Sci
Figure 7. Zone A of ring distribution system simulated in ETAP.
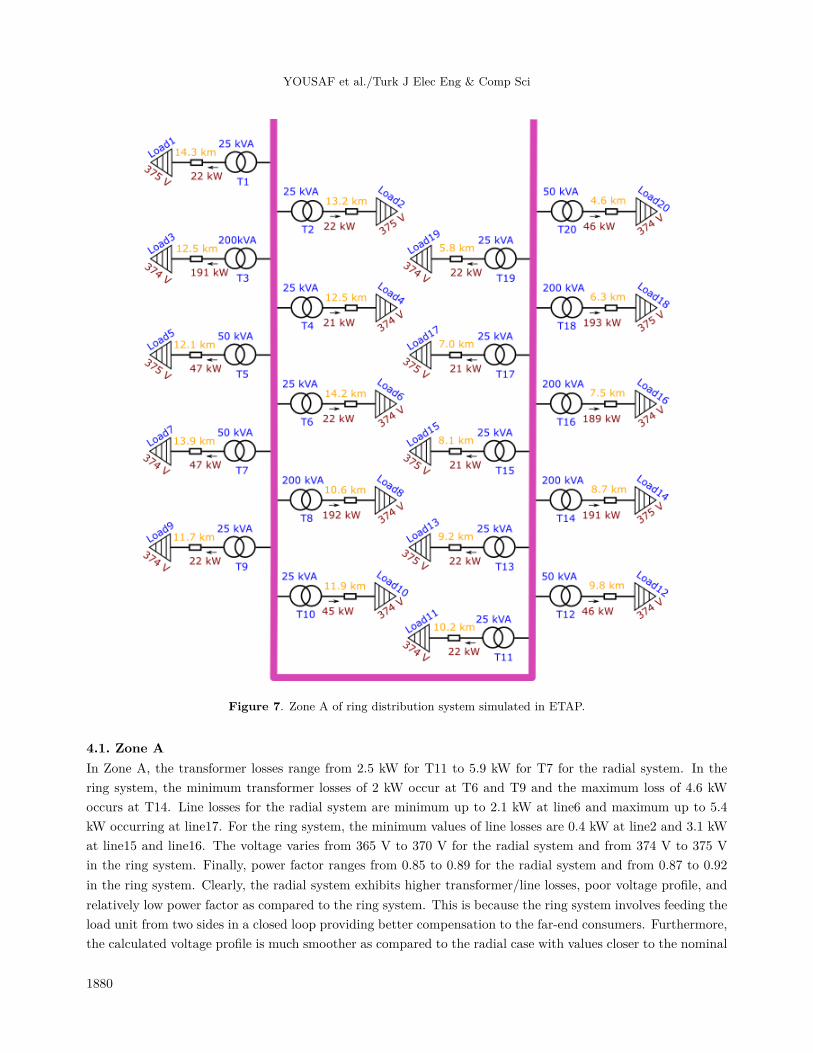
4.1. Zone AIn Zone A, the transformer losses range from 2.5 kW for T11 to 5.9 kW for T7 for the radial system. In thering system, the minimum transformer losses of 2 kW occur at T6 and T9 and the maximum loss of 4.6 kWoccurs at T14. Line losses for the radial system are minimum up to 2.1 kW at line6 and maximum up to 5.4kW occurring at line17. For the ring system, the minimum values of line losses are 0.4 kW at line2 and 3.1 kWat line15 and line16. The voltage varies from 365 V to 370 V for the radial system and from 374 V to 375 Vin the ring system. Finally, power factor ranges from 0.85 to 0.89 for the radial system and from 0.87 to 0.92in the ring system. Clearly, the radial system exhibits higher transformer/line losses, poor voltage profile, andrelatively low power factor as compared to the ring system. This is because the ring system involves feeding theload unit from two sides in a closed loop providing better compensation to the far-end consumers. Furthermore,the calculated voltage profile is much smoother as compared to the radial case with values closer to the nominal
1880
YOUSAF et al./Turk J Elec Eng & Comp Sci
380 V. The simulation results of transformer losses, line losses, voltage profile, and power factor for Zone A areshown in Figure 8.
Figure 8. (a) Transformer losses, (b) line losses, (c) voltage profile, and (d) power factor in Zone A of the radial andring distribution systems.
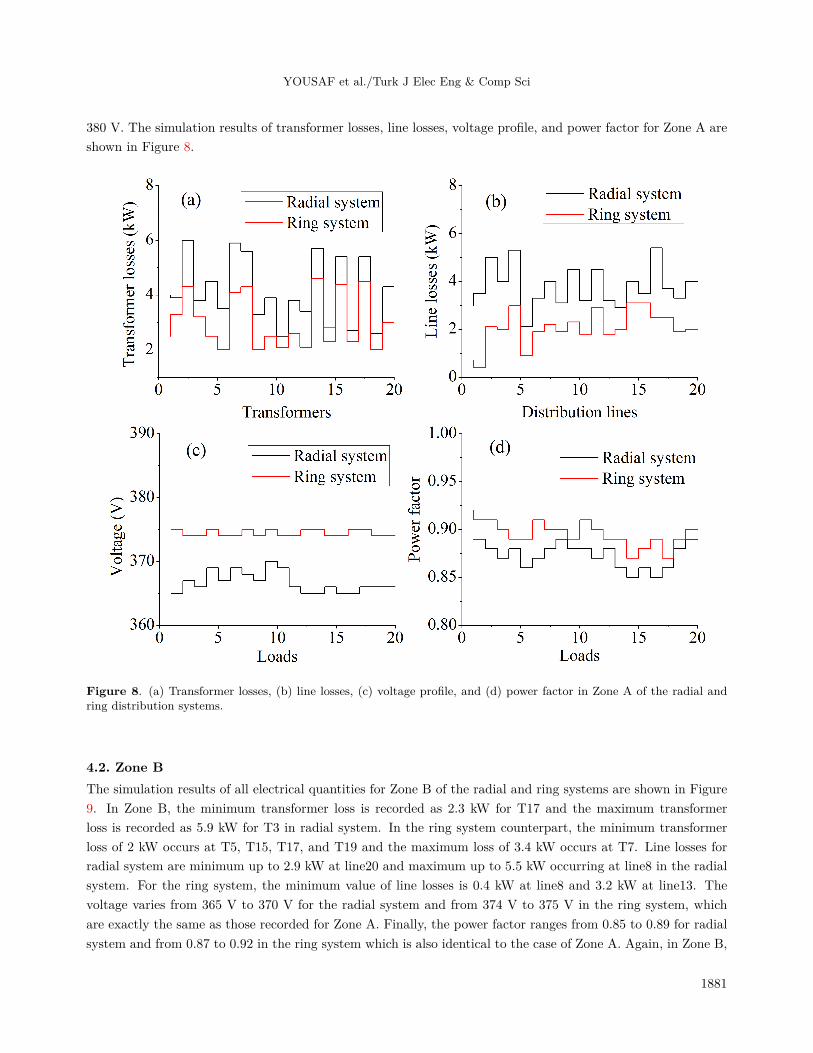
4.2. Zone BThe simulation results of all electrical quantities for Zone B of the radial and ring systems are shown in Figure9. In Zone B, the minimum transformer loss is recorded as 2.3 kW for T17 and the maximum transformerloss is recorded as 5.9 kW for T3 in radial system. In the ring system counterpart, the minimum transformerloss of 2 kW occurs at T5, T15, T17, and T19 and the maximum loss of 3.4 kW occurs at T7. Line losses forradial system are minimum up to 2.9 kW at line20 and maximum up to 5.5 kW occurring at line8 in the radialsystem. For the ring system, the minimum value of line losses is 0.4 kW at line8 and 3.2 kW at line13. Thevoltage varies from 365 V to 370 V for the radial system and from 374 V to 375 V in the ring system, whichare exactly the same as those recorded for Zone A. Finally, the power factor ranges from 0.85 to 0.89 for radialsystem and from 0.87 to 0.92 in the ring system which is also identical to the case of Zone A. Again, in Zone B,
1881
YOUSAF et al./Turk J Elec Eng & Comp Sci
the radial system exhibits higher transformer/line losses, poor voltage profile, and relatively low power factoras compared to the ring system.
Figure 9. (a) Transformer losses, (b) line losses, (c) voltage profile, and (d) power factor in Zone B of the radial andring distribution systems.
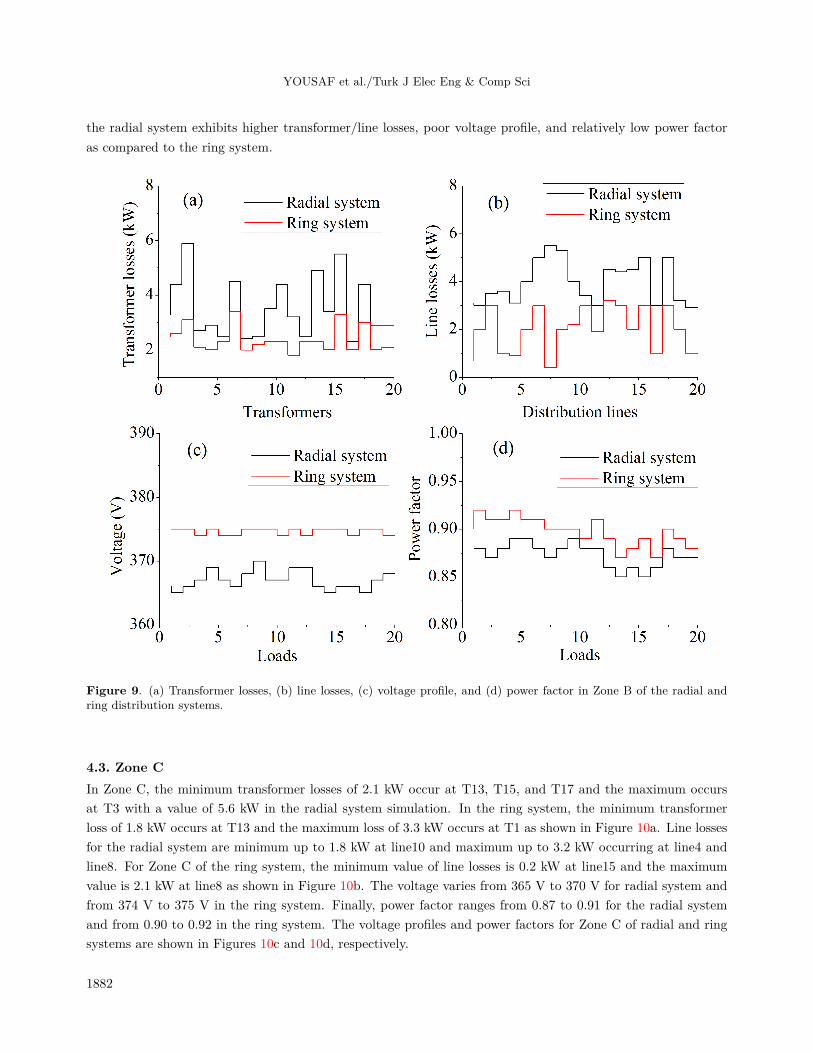
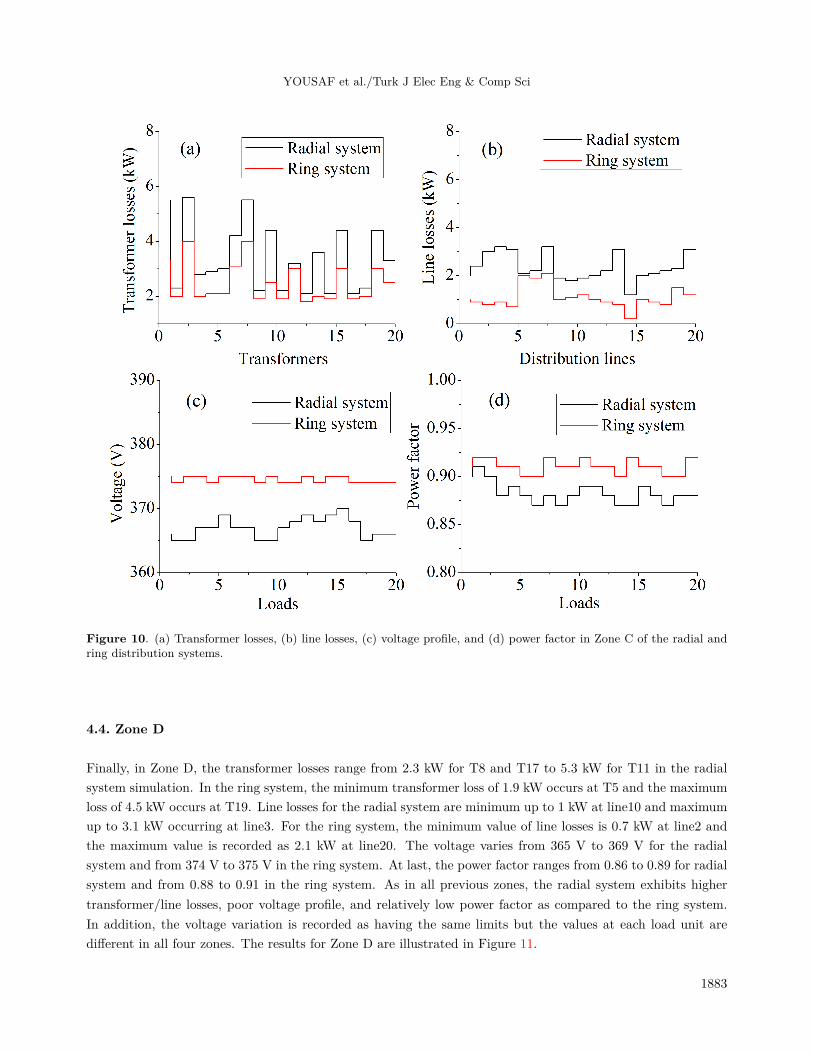
4.3. Zone CIn Zone C, the minimum transformer losses of 2.1 kW occur at T13, T15, and T17 and the maximum occursat T3 with a value of 5.6 kW in the radial system simulation. In the ring system, the minimum transformerloss of 1.8 kW occurs at T13 and the maximum loss of 3.3 kW occurs at T1 as shown in Figure 10a. Line lossesfor the radial system are minimum up to 1.8 kW at line10 and maximum up to 3.2 kW occurring at line4 andline8. For Zone C of the ring system, the minimum value of line losses is 0.2 kW at line15 and the maximumvalue is 2.1 kW at line8 as shown in Figure 10b. The voltage varies from 365 V to 370 V for radial system andfrom 374 V to 375 V in the ring system. Finally, power factor ranges from 0.87 to 0.91 for the radial systemand from 0.90 to 0.92 in the ring system. The voltage profiles and power factors for Zone C of radial and ringsystems are shown in Figures 10c and 10d, respectively.
1882
YOUSAF et al./Turk J Elec Eng & Comp Sci
Figure 10. (a) Transformer losses, (b) line losses, (c) voltage profile, and (d) power factor in Zone C of the radial andring distribution systems.
4.4. Zone D
Finally, in Zone D, the transformer losses range from 2.3 kW for T8 and T17 to 5.3 kW for T11 in the radialsystem simulation. In the ring system, the minimum transformer loss of 1.9 kW occurs at T5 and the maximumloss of 4.5 kW occurs at T19. Line losses for the radial system are minimum up to 1 kW at line10 and maximumup to 3.1 kW occurring at line3. For the ring system, the minimum value of line losses is 0.7 kW at line2 andthe maximum value is recorded as 2.1 kW at line20. The voltage varies from 365 V to 369 V for the radialsystem and from 374 V to 375 V in the ring system. At last, the power factor ranges from 0.86 to 0.89 for radialsystem and from 0.88 to 0.91 in the ring system. As in all previous zones, the radial system exhibits highertransformer/line losses, poor voltage profile, and relatively low power factor as compared to the ring system.In addition, the voltage variation is recorded as having the same limits but the values at each load unit aredifferent in all four zones. The results for Zone D are illustrated in Figure 11.
1883

YOUSAF et al./Turk J Elec Eng & Comp Sci
Figure 11. (a) Transformer losses, (b) line losses, (c) voltage profile, and (d) power factor in Zone D of the radial andring distribution systems.
5. ConclusionIn this paper, power system planning is investigated in Kadhan Town of the Badin District, which is a ruralarea of Pakistan located in the southern part of Sindh Province. The district is surrounded by several big andindustrial cities of Pakistan and is enriched by the most prominent renewable sources namely solar, wind, andbiogas. Unfortunately, the town is a denizen of around 6000 families who are suffering in their lives due to theabsence of electricity. In spite of the lack of attention from the provincial and local administration, an expedientand cost-effective solution is proposed for the well-being of the habitants of the region by all-renewable powerdistribution to the consumers.
The three renewable technologies were integrated at 11 kV grid from where the consumer lines areoriginating towards the load units. The simulation was carried out on ETAP software embedded with a powerflow solver using different algorithms. The Newton–Raphson method was utilized in the performed simulationsowing to its high success rate of convergence and fast approaching ability towards the solution. A surveywas carried out in the initial phase of the research to estimate the total load, to constitute possible zones, tocharacterize the load units, and subsequently to evaluate transformer ratings. The survey data were fed to the
1884
YOUSAF et al./Turk J Elec Eng & Comp Sci
simulation software along with the information of correct ratings of the generators. For an estimated maximumload of 4.13 MW, three power plants (solar, wind, and biogas) of 2 MW output each were connected to the 11kV grid. The selection criteria of these ratings were as follows: During day timing, the load is maximum so twogenerators, solar and wind, are capable to fulfill load requirement. If the load exceeds 4 MW, biogas generatorof 2 MW rating will supply the deficiency in the generation. During night hours, the load is normally reducedto sometimes smaller than half of the maximum value, wind plant alone is utilized to fulfill the consumption.If the load exceeds the generation level, biogas plant is put into service making a total of 4 MW generationkeeping in mind that the maximum load is 4.13 MW.
The load distribution scheme works in a reliable way ensuring continuous supply without surplus gen-eration. However, the type of distribution is of paramount importance to evaluate quality of electricity andamount of losses. From the results of this research, it is concluded that the radial system implementation issimpler due to the requirement of only one generator bus connected to all consumer lines. The ring systemrequires five buses with one dedicated generator bus and four load buses connected in a closed manner creatinga loop. The ratings of the components and load units are kept identical in both the architectures to draw a faircomparison which concludes that the ring system maintains superior results in terms of power factor, voltagelevels, and losses.
AcknowledgmentThe authors would like to thank M. Waseem for useful discussions.
Author contributionsA.R.Y. gave the idea and performed the simulations. G.M. recorded the site data to be used in the simulations.M.A. and Z.R. interpreted the results. Z.R. wrote the paper.
References
[1] Abdelmonem T, Hassan HA, Farrag MAM, Osman ZH. A new method for loss reduction in distribution networksvia network reconfiguration. Journal of Electrical Systems 2018; 4: 146-164.
[2] Kifle Y, Khan B, Singh P. Assessment and enhancement of distribution system reliability by renewable energysources and energy storage. Journal of Green Engineering 2018; 8: 219-262.
[3] Li W, Wang P, Li Z, Liu Y. Reliability evaluation of complex radial distribution systems considering restorationsequence and network constraints. IEEE Transactions on Power Delivery 2004; 19: 753-758.
[4] Gubina F, Strmcnik B. A simple approach to voltage stability assessment in radial networks. IEEE Transactionson Power Systems 1997; 12: 1121-1128.
[5] Ranjan R, Venkatesh B. Voltage stability analysis of radial distribution networks. Electric Power Components andSystems 2003; 31: 501-511.
[6] Islam FR, Lallu A, Mamun KA, Prakash K, Roy NK. Power quality improvement of distribution network usingbess and capacitor bank. Journal of Modern Power Systems and Clean Energy 2020; 1-8.
[7] Hadjsaid N, Canard JF, Dumas F. Dispersed generation impact on distribution networks. IEEE Computer Appli-cations in Power 1999; 12: 22-28.
[8] Zahid H, Umer F, Rashid Z, Raheem A, Shakoor R, Hussain GA. Critical analysis and application of net-meteringpractice in MEPCO. International Journal of Photoenergy 2020; 2020: 1-13.
[9] Hossain E, Kabalci E, Bayindir R, Perez R. A comprehensive study on microgrid technology. International Journalof Renewable Energy Research 2014; 4: 1-15.
1885

YOUSAF et al./Turk J Elec Eng & Comp Sci
[10] Bertani A, Bossi C, Delfino B, Lewald N, Massucco S, Metten E, Meyer T, Silvestro F, Wasiak I. Electricalenergy distribution networks: actual situation and perspectives for distributed generation. In: 17th InternationalConference on Electricity Distribution; May 2003; Barcelona, Spain.
[11] Mariam JL, Basu M, Conlon MF. A review of existing microgrid architectures. Journal of Engineering 2013; 1-9.
[12] Augugliaro A, Dusonchet L, Favuzza S, Ippolito MG, Sanseverino ER. A backward sweep method for power flowsolution in distribution networks. International Journal of Electrical Power and Energy Systems 2010; 32: 271-280.
[13] Salimon SA, Aderinko HA, Damilola FI, Suuti KA. Load flow analysis of Nigerian radial distribution network usingbackward/forward sweep technique. Journal of VLSI Design and its Advancement 2019; 2: 1-11.
[14] Das D, Nagi HS, Kothari DP. Novel method for solving radial distribution networks. IEE Proceedings - Generation,Transmission and Distribution 1994; 141: 291-298.
[15] Goswami SK, Basu SK. Direct solution of distribution systems. IEE Proceedings C - Generation, Transmission andDistribution 1991; 138: 78-88.
[16] Haque MH. Efficient load flow method for distribution systems with radial or mesh configuration. IEE Proceedings- Generation, Transmission and Distribution 1996; 143: 33-38.
[17] Parasher R. Load flow analysis of radial distribution network using linear data structure. PhD, Rajasthan TechnicalUniversity, Kota, India, 2013.
[18] Islam FR, Prakash K, Mamun KA, Lallu A, Pota HR. A comprehensive study on microgrid technology. Aromaticnetwork: A novel structure for power distribution system. IEEE Access 2017; 5: 25236-25257.
[19] Celli G, Pilo F, Pisano G, Allegranza V, Cicoria R, Iaria A. Meshed vs radial MV distribution network in presenceof large amount of DG. In: IEEE PES Power Systems Conference and Exposition; October 2004; New York, USA.
[20] Cristian N, Ahmed AA, Dakyo B. Impact analysis of distributed generation on mesh and radial distribution network.Overview and state of the art. Scientific Publications 2013; 3: 1-9.
[21] Suripto S. Calculation of 20 kV distribution network energy losses and minimizing effort using network reconfigu-ration in region of PTPLN (Persero) UPJ Bantul. Journal of Electrical Technology UMY 2017; 1: 75-83.
[22] Raut U, Mishra S. A new Pareto multi‑objective sine cosine algorithm for performance enhancement of radialdistribution network by optimal allocation of distributed generators. Evolutionary Intelligence 2020; 1-22.
[23] Wei X, Yang D, Wang X, Wang B, Gao J, Wei K. Faulty feeder detection based on fundamental component shiftand multiple-transient-feature fusion in distribution networks. IEEE Transactions on Smart Grid 2020; 1-12.
[24] Shaheen AM, El-Sehiemy RA. Enhanced feeder reconfiguration in primary distribution networks using backtrackingsearch technique. Australian Journal of Electrical and Electronics Engineering 2020; 17: 1-7.
[25] Malik MZ, Kumar M, Soomro AM, Baloch MH, Gul M, Farhan M, Kaloi GS. Strategic planning of renewabledistributed generation in radial distribution system using advanced MOPSO method. Energy Reports 2020; 6:2872-2886.
[26] Behbahani MRP, Jalilian A, Amini M. Reconfiguration of distribution network using discrete particle swarmoptimization to reduce voltage fluctuations. International Transactions on Electrical Energy Systems 2020; 1-15.
[27] Brunelli D. A high-efficiency wind energy harvester for autonomous embedded systems. Sensors 2016; 16: 1-19.
[28] Singh RK, Ahmed MR. Blade design and performance testing of a small wind turbine rotor for low wind speedapplications. Renewable Energy 2013; 50: 812-819.
[29] Iqbal A, Iqbal MT. Design and analysis of a stand-alone PV system for a rural house in Pakistan. InternationalJournal of Photoenergy 2019; 2019: 1-8.
[30] Mujtaba G, Rashid Z, Umer F, Baloch SK, Hussain GA, Haider MU. Implementation of distributed generationwith solar plants in a 132 kV grid station at Layyah using ETAP. International Journal of Photoenergy 2020; 2020:1-14.
1886