Embed Size (px)
Citation preview
October 2, 2017 1October 2, 2017 1
Utility Distribution Planning 101
Distribution Systems and Planning Training
for New England Conference of Public Utility Commissioners, Sept. 27-29, 2017
Michael Coddington, NREL
Kevin Schneider, PNNL
Juliet Homer, PNNL

October 2, 2017 2October 2, 2017 2
Set-up
► Presentation will be from 2:30 – 3:30
► Brief background on presenters
► Learning objectives - desired outcomes of this session
► Questions welcome as we go through
Michael Coddington Kevin Schneider Juliet Homer
October 2, 2017 3October 2, 2017 3
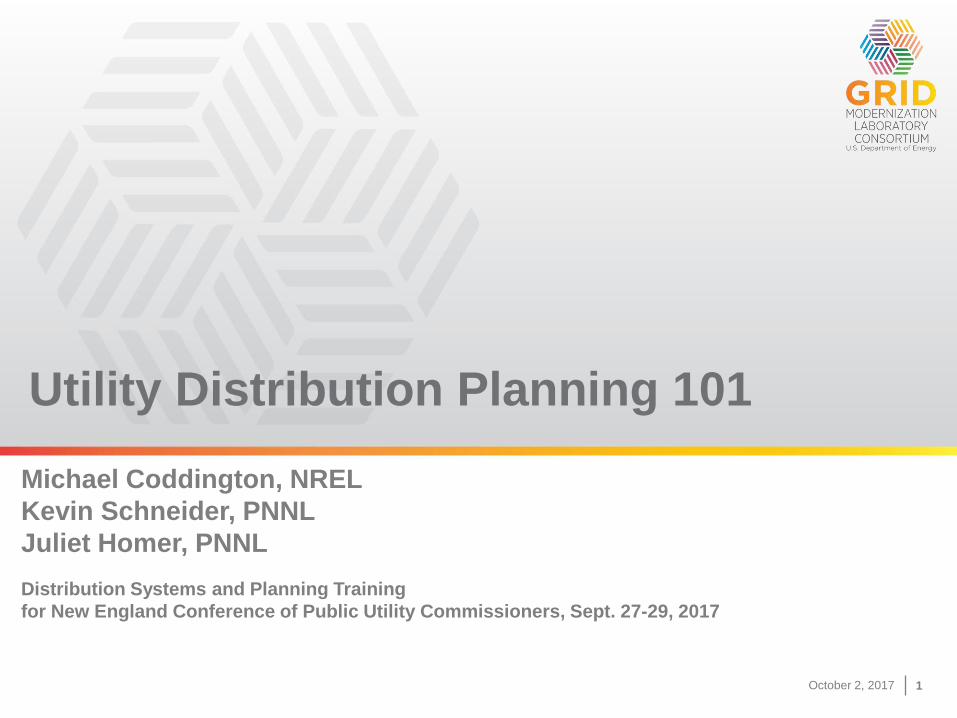
Presentation Agenda
► Set-up
► Initial context
► Overview of traditional planning
► Maintaining Safety, Reliability and Cost
► Planning functions at small vs. large utilities
► Traditional functions
► How are investment decisions made?
► Where does the money go?
► Classes of distribution planning tools
► Advances in electric distribution planning
► Hosting capacity and modeling
► Key lessons learned in modeling
► Summary of practices at advanced utilities
► Discussion and questions
Juliet
Mike
Kevin
All
Juliet
Juliet
October 2, 2017 4October 2, 2017 4
Context
► Distribution planning is changing
► Distribution planning has traditionally been focused on maintaining:
◼ Safety
◼ Reliability
◼ At reasonable cost
► At the core distribution planning supports investment decisions
► As the grid and resource mix are changing, distribution systems are
changing and distribution planning is changing
◼ In many places, a lot of new gen is connected to the distribution system
◼ Distribution system has least amount of utility visibility/control
► In some states, more detailed distribution plans are being required :
◼ Hosting capacity
◼ Locational benefits and non-wires alternatives
► New skill sets are required as well as coordination across entities within
the utility
October 2, 2017 5October 2, 2017 5
Traditional Key Areas of Focus for
Distribution Planning Engineers
October 2, 2017 6October 2, 2017 6
Electric Distribution System Planning –
The Big Picture
Safety• Design and maintain an electric system that does not place utility
workers or the general public at risk
Reliability• Provide the power that the consumers need• Maintain power quality
Maintain stable voltage at point of delivery Provide a stable frequency
• Reduce number of outages Frequency of outages (S.A.I.F.I.) Duration of outages (S.A.I.D.I.)
Cost• Supply energy at an acceptable price
October 2, 2017 7October 2, 2017 7
Traditional Areas of Focus for Larger Utilities**
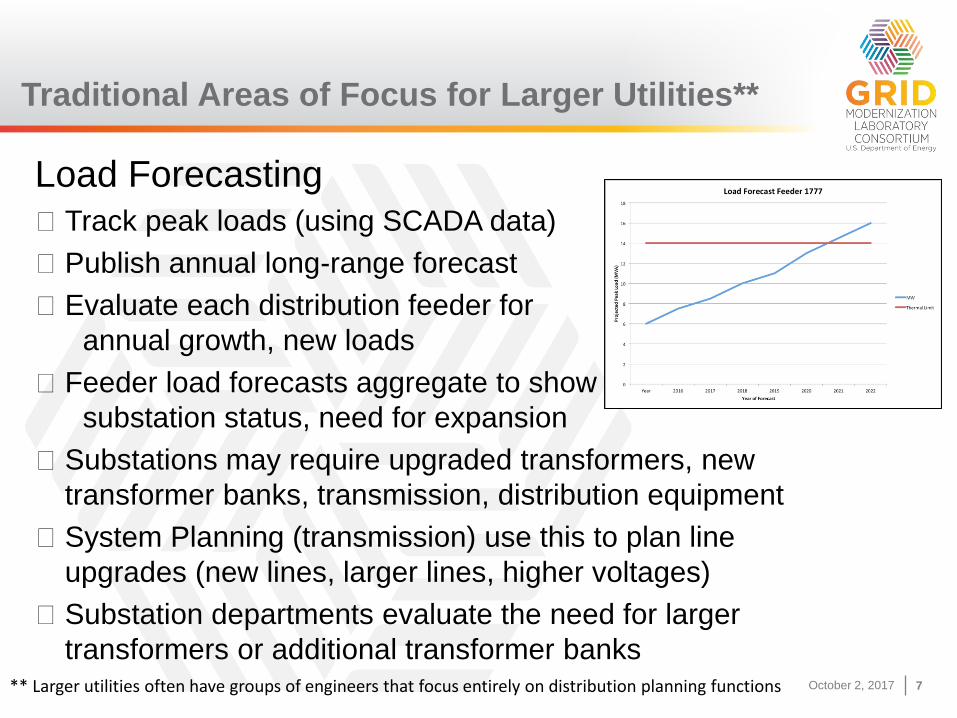
Load Forecasting
◼ Track peak loads (using SCADA data)
◼ Publish annual long-range forecast
◼ Evaluate each distribution feeder for
annual growth, new loads
◼ Feeder load forecasts aggregate to show
substation status, need for expansion
◼ Substations may require upgraded transformers, new
transformer banks, transmission, distribution equipment
◼ System Planning (transmission) use this to plan line
upgrades (new lines, larger lines, higher voltages)
◼ Substation departments evaluate the need for larger
transformers or additional transformer banks** Larger utilities often have groups of engineers that focus entirely on distribution planning functions
October 2, 2017 8October 2, 2017 8
Traditional Areas of Focus for Larger Utilities
- Continued
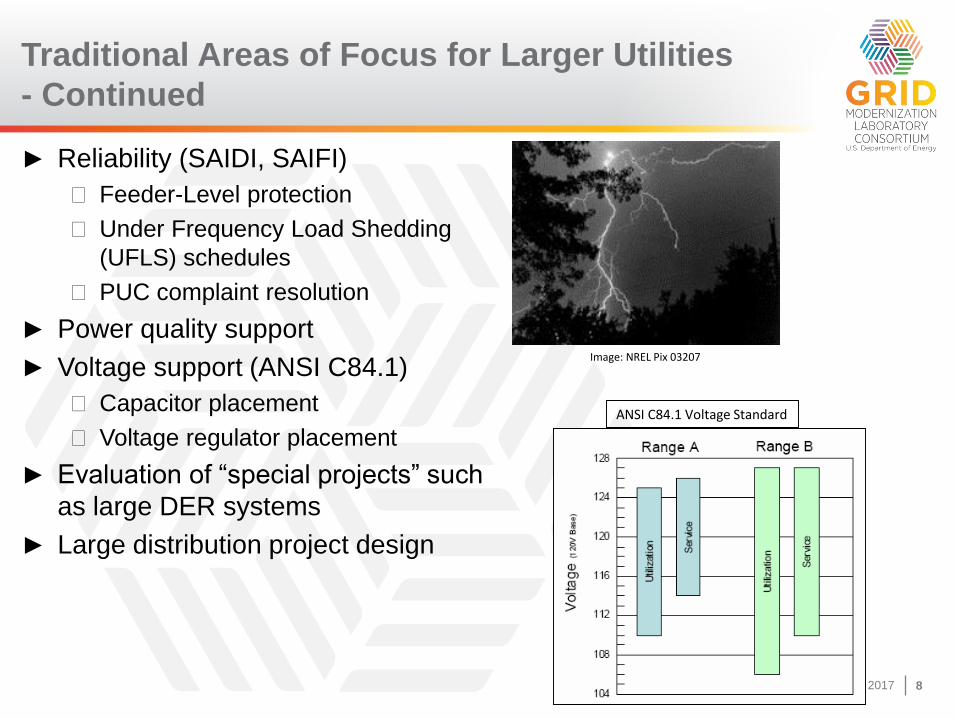
► Reliability (SAIDI, SAIFI)
◼ Feeder-Level protection
◼ Under Frequency Load Shedding
(UFLS) schedules
◼ PUC complaint resolution
► Power quality support
► Voltage support (ANSI C84.1)
◼ Capacitor placement
◼ Voltage regulator placement
► Evaluation of “special projects” such
as large DER systems
► Large distribution project design
Image: NREL Pix 03207
ANSI C84.1 Voltage Standard
October 2, 2017 9October 2, 2017 9
Process of Identifying System Risks
October 2, 2017 10October 2, 2017 10
Identify System Risks
► Determine N-0 (system intact overloads) and N-1 (based on one-point of
failure) risks based on the peak demand and available capacity
► Other considerations
◼ Power Quality (low or high voltage)
◼ Reliability (line and equipment exposure)
◼ Environmental considerations (e.g. line losses)
◼ Safety
◼ Legal
◼ Financial
October 2, 2017 11October 2, 2017 11
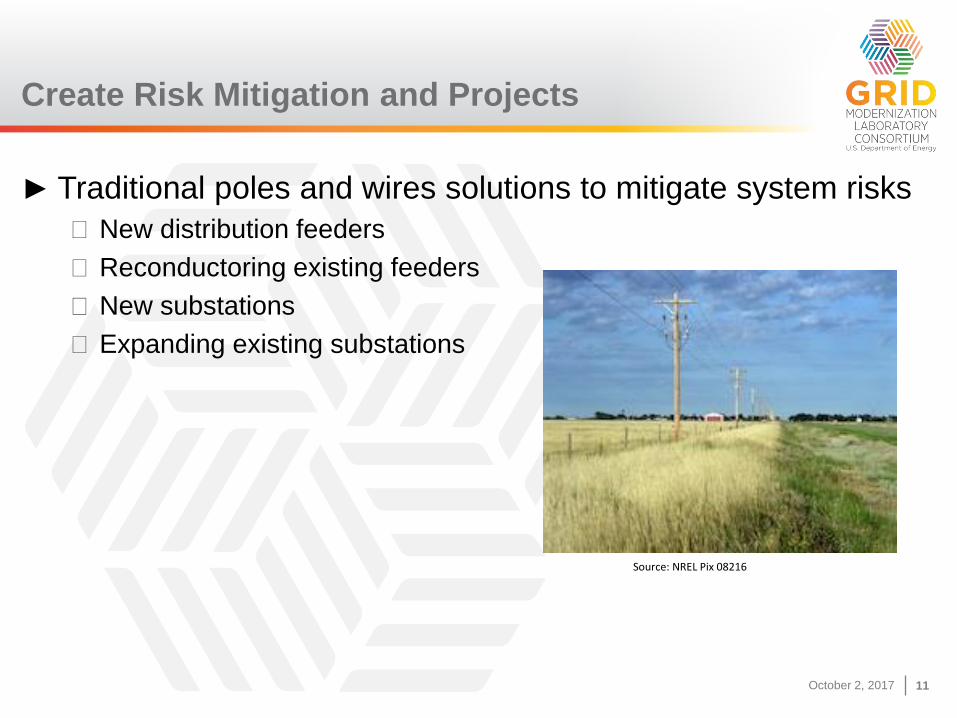
Create Risk Mitigation and Projects
► Traditional poles and wires solutions to mitigate system risks
◼ New distribution feeders
◼ Reconductoring existing feeders
◼ New substations
◼ Expanding existing substations
Source: NREL Pix 08216

October 2, 2017 12October 2, 2017 12
Where Does the Money Go?
October 2, 2017 13October 2, 2017 13
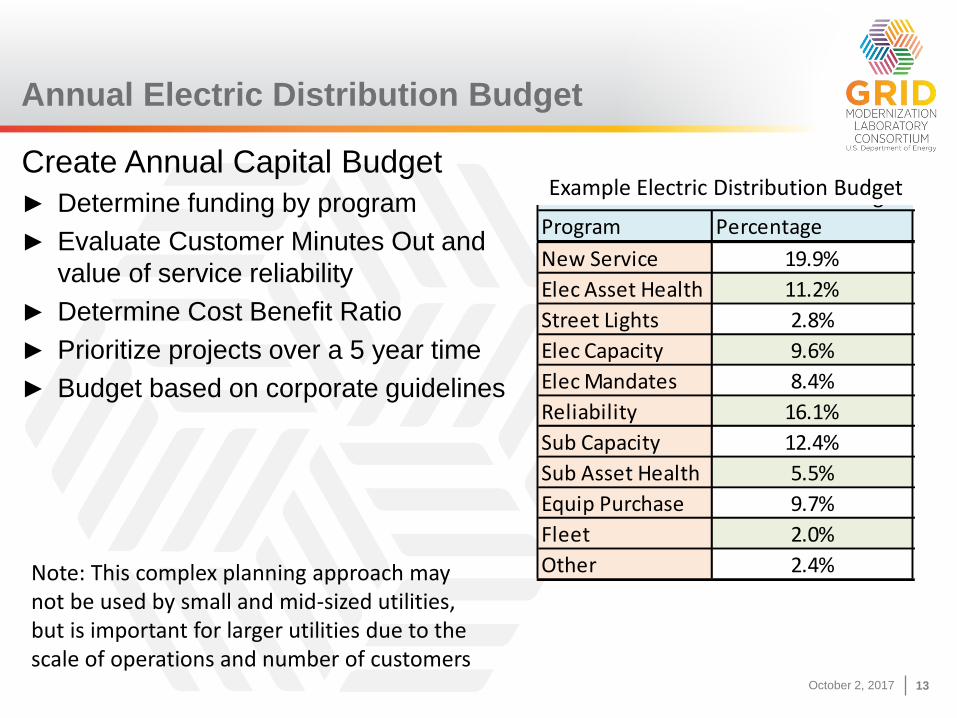
Annual Electric Distribution Budget
Create Annual Capital Budget
► Determine funding by program
► Evaluate Customer Minutes Out and
value of service reliability
► Determine Cost Benefit Ratio
► Prioritize projects over a 5 year time
► Budget based on corporate guidelines
Program Percentage
New Service 19.9%
Elec Asset Health 11.2%
Street Lights 2.8%
Elec Capacity 9.6%
Elec Mandates 8.4%
Reliability 16.1%
Sub Capacity 12.4%
Sub Asset Health 5.5%
Equip Purchase 9.7%
Fleet 2.0%
Other 2.4%
2015 PSCo Electric Distribution BudgetExample Electric Distribution Budget
Note: This complex planning approach may not be used by small and mid-sized utilities, but is important for larger utilities due to the scale of operations and number of customers
October 2, 2017 14October 2, 2017 14
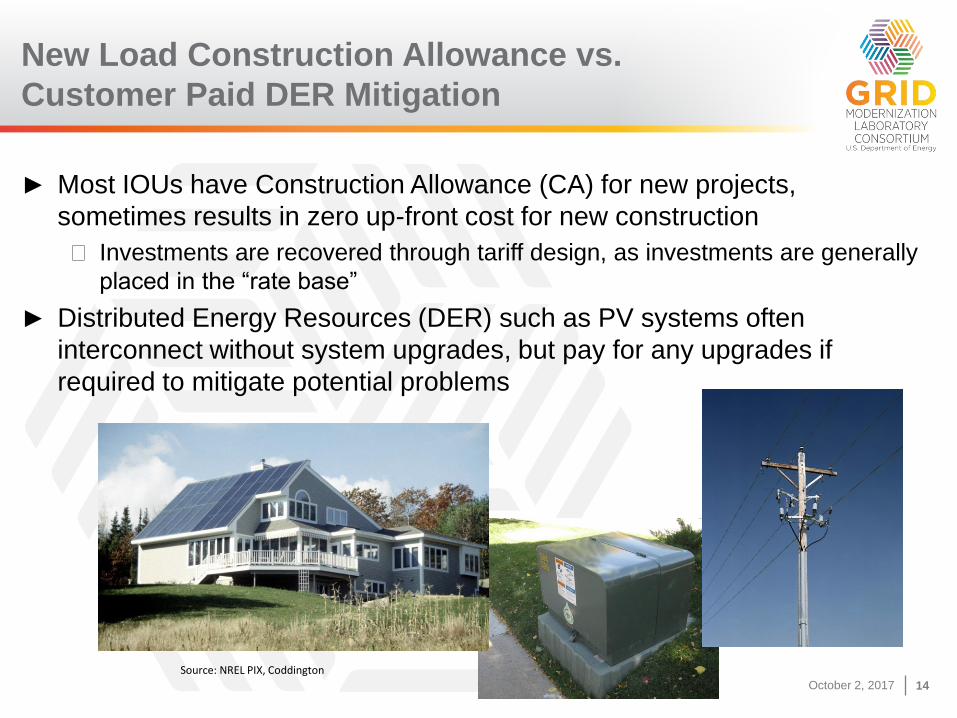
New Load Construction Allowance vs.
Customer Paid DER Mitigation
► Most IOUs have Construction Allowance (CA) for new projects,
sometimes results in zero up-front cost for new construction
◼ Investments are recovered through tariff design, as investments are generally
placed in the “rate base”
► Distributed Energy Resources (DER) such as PV systems often
interconnect without system upgrades, but pay for any upgrades if
required to mitigate potential problems
Source: NREL PIX, Coddington
October 2, 2017 15October 2, 2017 15
The Brooklyn Queens Demand Management
Project – A New Way to Plan?
October 2, 2017 16October 2, 2017 16
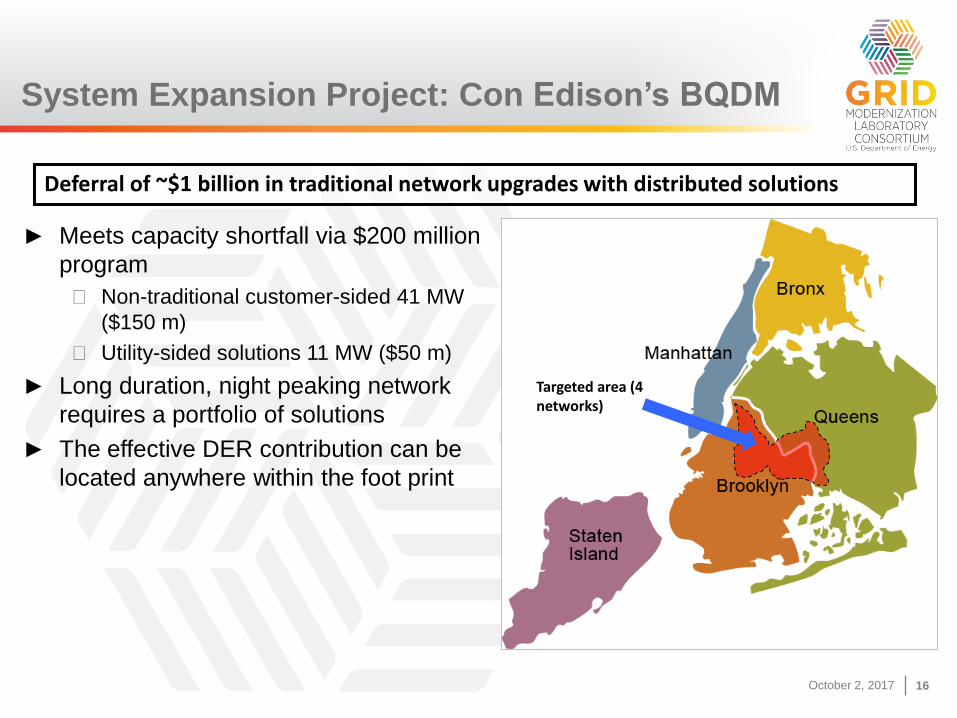
System Expansion Project: Con Edison’s BQDM
► Meets capacity shortfall via $200 million
program
◼ Non-traditional customer-sided 41 MW
($150 m)
◼ Utility-sided solutions 11 MW ($50 m)
► Long duration, night peaking network
requires a portfolio of solutions
► The effective DER contribution can be
located anywhere within the foot print
16
Deferral of ~$1 billion in traditional network upgrades with distributed solutions
Targeted area (4 networks)
October 2, 2017 17October 2, 2017 17
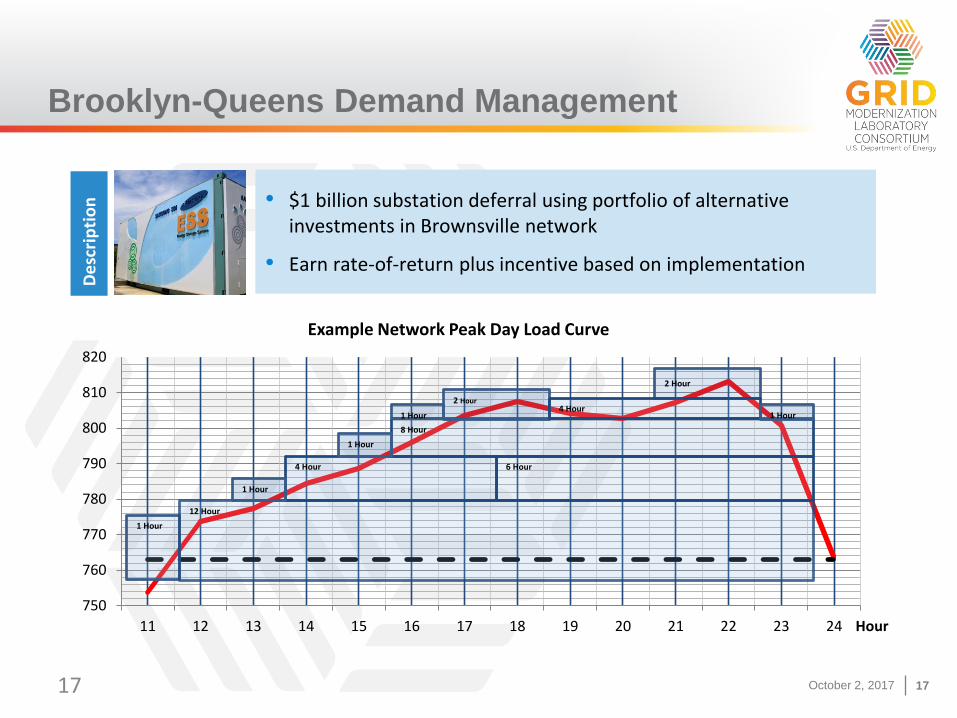
Brooklyn-Queens Demand Management
17
750
760
770
780
790
800
810
820
830
840
850
11 12 13 14 15 16 17 18 19 20 21 22 23 24
MW
Hour
Sample network 2016 peak day load curve
1 Hour
12 Hour
8 Hour
1 Hour
6 Hour4 Hour
2 Hour
2 Hour4 Hour
1 Hour
1 Hour
1 Hour
• $1 billion substation deferral using portfolio of alternative investments in Brownsville network
• Earn rate-of-return plus incentive based on implementation
Example Network Peak Day Load Curve
De
scri
pti
on
October 2, 2017 18October 2, 2017 18
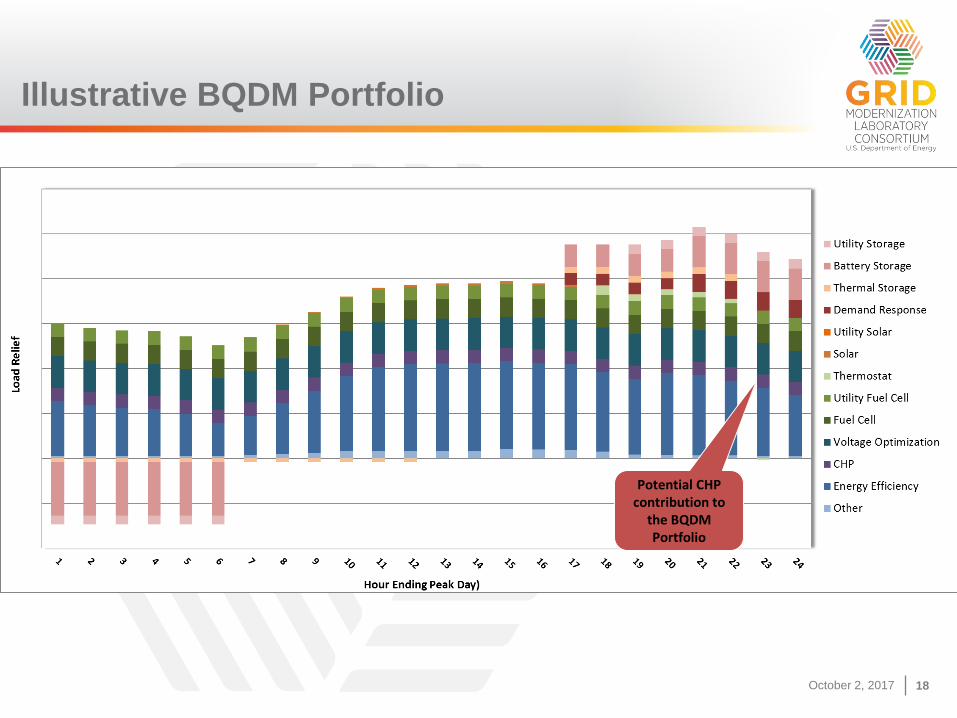
Illustrative BQDM Portfolio
Potential CHP contribution to
the BQDM Portfolio
October 2, 2017 19October 2, 2017 19
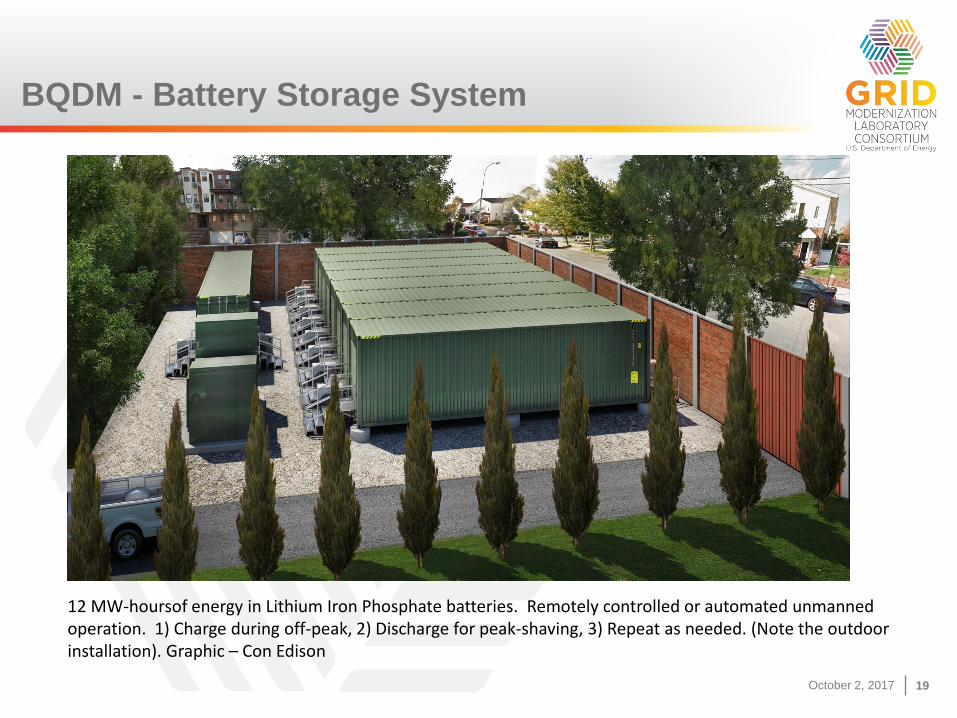
BQDM - Battery Storage System
12 MW-hoursof energy in Lithium Iron Phosphate batteries. Remotely controlled or automated unmanned operation. 1) Charge during off-peak, 2) Discharge for peak-shaving, 3) Repeat as needed. (Note the outdoor installation). Graphic – Con Edison
October 2, 2017 20October 2, 2017 20
Planning Tools - Overview
October 2, 2017 21October 2, 2017 21
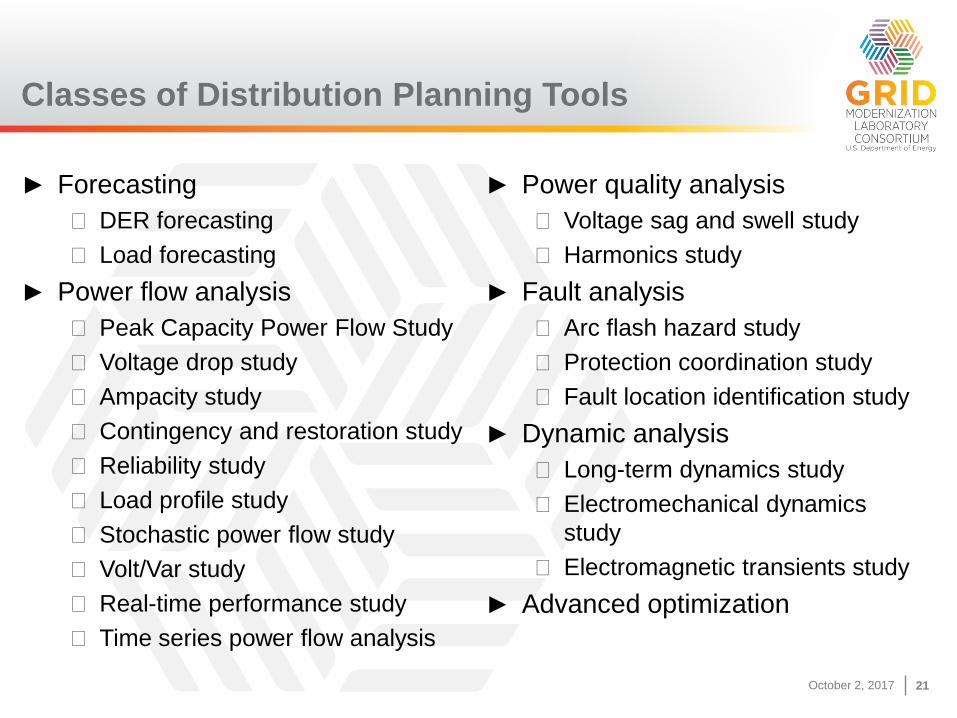
► Forecasting
◼ DER forecasting
◼ Load forecasting
► Power flow analysis
◼ Peak Capacity Power Flow Study
◼ Voltage drop study
◼ Ampacity study
◼ Contingency and restoration study
◼ Reliability study
◼ Load profile study
◼ Stochastic power flow study
◼ Volt/Var study
◼ Real-time performance study
◼ Time series power flow analysis
► Power quality analysis
◼ Voltage sag and swell study
◼ Harmonics study
► Fault analysis
◼ Arc flash hazard study
◼ Protection coordination study
◼ Fault location identification study
► Dynamic analysis
◼ Long-term dynamics study
◼ Electromechanical dynamics
study
◼ Electromagnetic transients study
► Advanced optimization
Classes of Distribution Planning Tools
October 2, 2017 22October 2, 2017 22
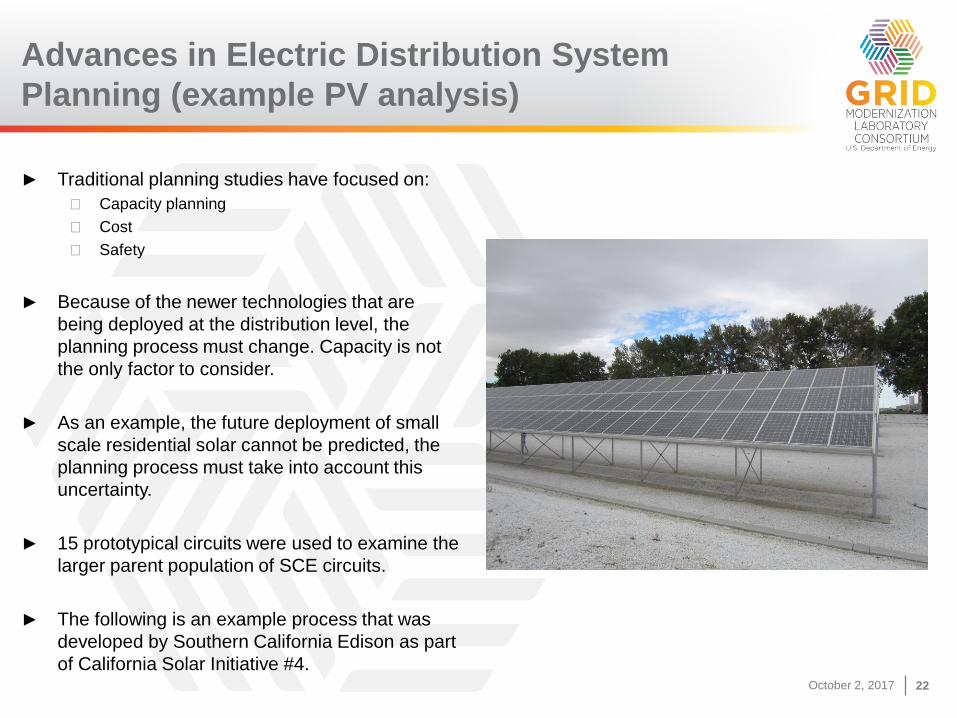
► Traditional planning studies have focused on:
◼ Capacity planning
◼ Cost
◼ Safety
► Because of the newer technologies that are
being deployed at the distribution level, the
planning process must change. Capacity is not
the only factor to consider.
► As an example, the future deployment of small
scale residential solar cannot be predicted, the
planning process must take into account this
uncertainty.
► 15 prototypical circuits were used to examine the
larger parent population of SCE circuits.
► The following is an example process that was
developed by Southern California Edison as part
of California Solar Initiative #4.
Advances in Electric Distribution System
Planning (example PV analysis)
October 2, 2017 23October 2, 2017 23
Grid Hosting Capacity Modeling
October 2, 2017 24October 2, 2017 24
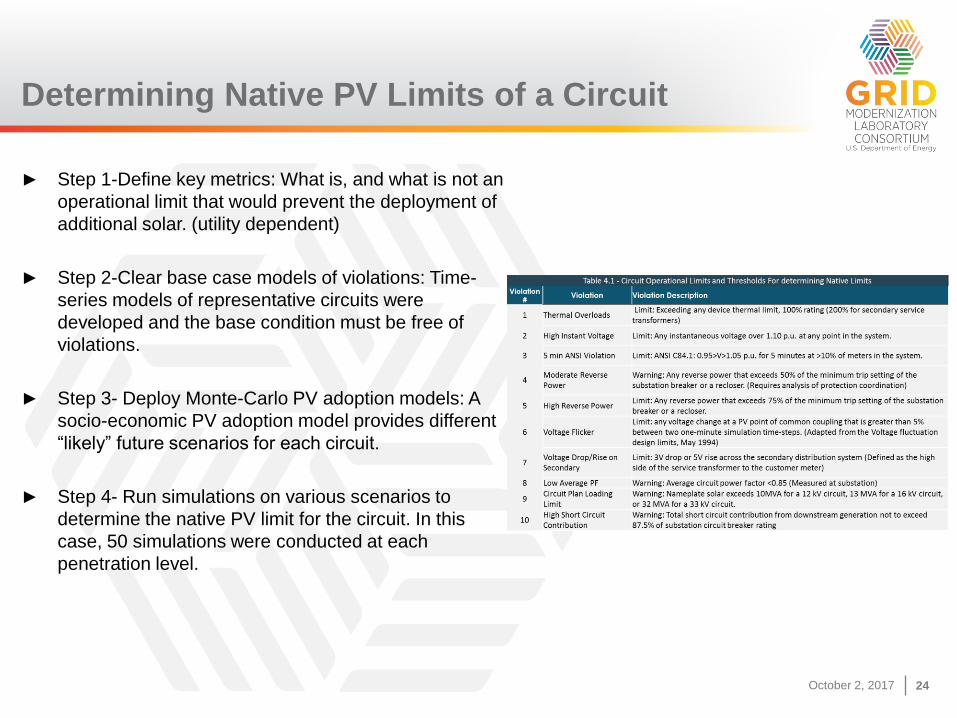
► Step 1-Define key metrics: What is, and what is not an
operational limit that would prevent the deployment of
additional solar. (utility dependent)
► Step 2-Clear base case models of violations: Time-
series models of representative circuits were
developed and the base condition must be free of
violations.
► Step 3- Deploy Monte-Carlo PV adoption models: A
socio-economic PV adoption model provides different
“likely” future scenarios for each circuit.
► Step 4- Run simulations on various scenarios to
determine the native PV limit for the circuit. In this
case, 50 simulations were conducted at each
penetration level.
Determining Native PV Limits of a Circuit
October 2, 2017 25October 2, 2017 25
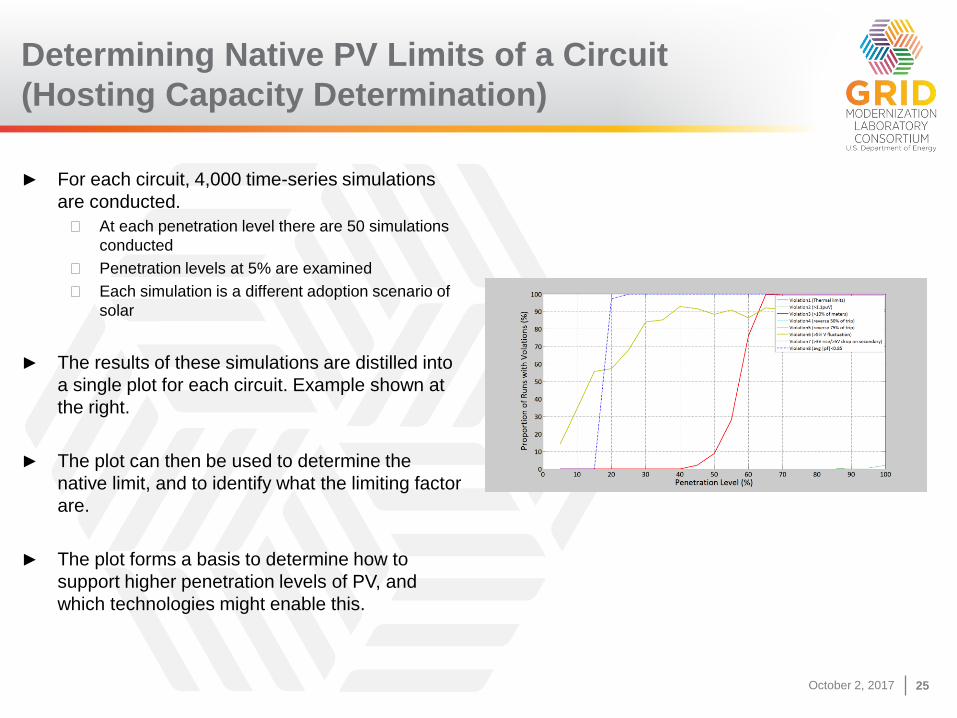
► For each circuit, 4,000 time-series simulations
are conducted.
◼ At each penetration level there are 50 simulations
conducted
◼ Penetration levels at 5% are examined
◼ Each simulation is a different adoption scenario of
solar
► The results of these simulations are distilled into
a single plot for each circuit. Example shown at
the right.
► The plot can then be used to determine the
native limit, and to identify what the limiting factor
are.
► The plot forms a basis to determine how to
support higher penetration levels of PV, and
which technologies might enable this.
Determining Native PV Limits of a Circuit
(Hosting Capacity Determination)
October 2, 2017 26October 2, 2017 26
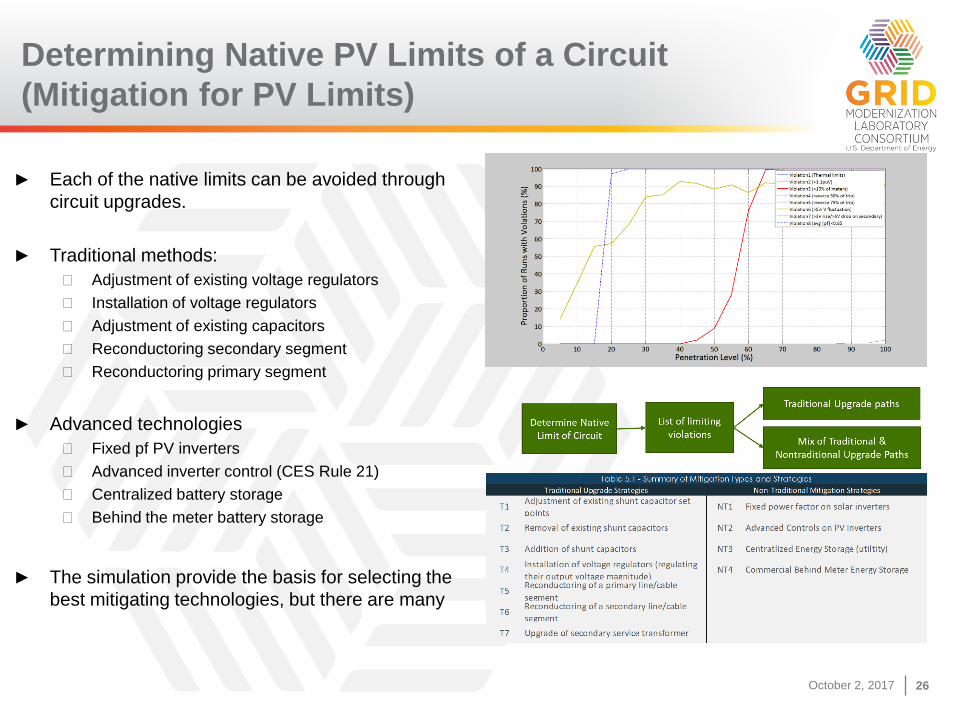
► Each of the native limits can be avoided through
circuit upgrades.
► Traditional methods:
◼ Adjustment of existing voltage regulators
◼ Installation of voltage regulators
◼ Adjustment of existing capacitors
◼ Reconductoring secondary segment
◼ Reconductoring primary segment
► Advanced technologies
◼ Fixed pf PV inverters
◼ Advanced inverter control (CES Rule 21)
◼ Centralized battery storage
◼ Behind the meter battery storage
► The simulation provide the basis for selecting the
best mitigating technologies, but there are many
Determining Native PV Limits of a Circuit
(Mitigation for PV Limits)
October 2, 2017 27October 2, 2017 27
Determining Native PV Limits of a Circuit
(Key Lessons Learned)
► Most SCE circuits could support 100% penetration of PV once the proper mitigation strategies have been
applied.
► Nearly 50% of SCE circuits can host less than 50% PV, where approx. 40% can host less than 25% PV
► Determining how to achieve 100% penetration on legacy circuits can be challenging, with a mitigation
leading to new violations. (domino effect)
► The most common violations experienced were power factor and voltage based.
► Proper sizing of secondary drops when new solar is installed is essential.
October 2, 2017 28October 2, 2017 28
Summary of practices at advanced utilities
► Performing detailed load and DER forecasts, by location
► Conducting hosting capacity studies for some or all feeders and making
information publicly available via online maps
► Systematically considering non-wires alternatives (NWA) to traditional
distribution system investments – developing NWA suitability criteria
► Investing in automation, communication and information technology
improvements to provide greater visibility and flexibility and enable
greater levels of DERs
► Looking at value components of DERs by location and incorporating into
tariffs. Value components include:*
◼ Energy
◼ Capacity
◼ Environmental
◼ Demand reduction and system relief
* From New York REV Value Stack tariff

October 2, 2017 29October 2, 2017 29
Discussion and questions
► Thanks!