Embed Size (px)
Citation preview

International Journal on Electrical Engineering and Informatics - Volume 8, Number 1, March 2016
Optimal Planning of Smart Distribution Network Based on Efficiency
Evaluation Using Data Envelopment Analysis
Elnaz Babazadeh1, Mohammad Reza Jannati Oskuee
2, Jafar Pourmahmoud
3,
and Sajad Najafi-Ravadanegh4
1,3Department of Applied Mathematics, Azarbaijan Shahid Madani University, Tabriz, Iran
2,4Smart Distribution Grid Research Lab, E. E. Dept., Azarbaijan Shahid Madani University, Tabriz, Iran
Abstract: Optimal planning of electric distribution networks is a complicated multi-objective
and multi-constraint problem. This context will be more challenging, regards to the constraints
rising from the nature of smart grids. Optimal planning in such a network needs advanced
strategies which consider both technical and economical aspects. Distributed generation (DG)
and Capacitor banks have attracted a great attention due to their ability in power loss reduction;
voltage profile adjustment; voltage stability improvement and emissions reduction. Ever
increasing use of electricity imposes a need to enhance the accountability of the power system
and improve the system performance parameters. In the literatures, the optimal sizing and
siting of several combinations of DGs and/or capacitors have been studied considering
different objective functions. The differences are mainly in the problem formulation,
methodology and constraints. In this paper, a new approach for optimal allocation of DGs and
Capacitor banks, separately and simultaneously, is proposed. The proposed scheme evaluates
both the technical and economical aspects with considering several objective functions. The
proposed method can easily be expanded with more objectives to cover all the network
planners’ preferences. The proposed scheme is the combination of an intelligent algorithm and
data envelopment analysis (DEA). So, in this paper firstly intelligent algorithm is applied to the
sitting and sizing problem, and then the obtained optimal solutions are prioritized by DEA. The
significant advantage of using DEA is that, there is no need to impose the decision maker's idea
into the model. And ranking is done, based on the efficiencies of the optimal solutions. The
most efficient solution is the one which has improved network parameters considerably and has
lowest costs. So, using DEA gives a realistic view of solutions and the provided results are for
all, not for a specific decision maker. The proposed scheme is applied on a 33-bus radial
distribution network and the obtained results are discussed which are satisfactory.
Keywords: Optimal planning, Smart distribution grid, Distributed generation, Capacitor bank,
Data envelopment analysis
1. Introduction
Ever increasing use of electricity imposes a need to enhance the accountability of the power
system and improve the system performance parameters. Optimal planning of electric
distribution networks is a complicated problem which is usually divided into sub problems.
The medium voltage (MV) network planning is one of the major problems in conventional
networks [1]. Another sub problem which has attracted a great attention is DG allocation.
Several economical, environmental and technical benefits are the essential drivers that increase
the contribution of DGs in distribution networks. Reduction of transmission and distribution
costs, saving of fossil fuels, reduction of pollution and greenhouse gases as well as technical
advantages like loss reduction, peak shaving, voltage profile and load factor improvements and
power quality enhancement are the driven forces behind the DGs application [2, 3]. The
ultimate goal of distribution system from the planner’s point of view is to provide economical
and reliable electric power supply to customers. Therefore, the design of power distribution
networks is an important issue which with an optimal scheme, reliable power supply can be
provided in a low operation costs [4, 5]. In this regards, there are several papers. Optimal
Received: December 31st, 2014. Accepted: February 14
th, 2016
DOI: 10.15676/ijeei.2016.8.1.4
45

siting, sizing and timing of MV substations are solved in [6]. A framework for multistage
planning of distribution networks using ICA is proposed in [7]. Optimal planning of
distribution networks at the presence of DGs is an active research area studied in several papers
for instance in [8, 9]. Many interesting methods and algorithms have been proposed to solve
the above mentioned problems. The differences are mainly in the problem formulation,
methodology and constraints. In [10] some of the algorithms are clearly discussed. For optimal
planning of distributed generation in distribution networks, there are several papers which
cover a wide range of methods and include the heuristic algorithms, analytical approaches and
power flow methods [1, 11-21]. An analytical approach is used in [11, 12]; [13] uses non-linear
programming; [14] employs combination of GA and SA; [15, 16] solve the problem with GA;
[17] presents tabu search method; [18] submits fuzzy approach for optimization of its
algorithm; [1] and [19] apply load flow approaches; [20] uses sequential optimization and [21]
uses heuristic approach. In the radial distribution systems, shunt capacitor banks are widely
used for different purposes such as voltage improvement, loss reduction, power factor
correction and available capacity increase of the feeders [22, 23]. Therefore optimal siting and
sizing of capacitors are important in distribution networks [24, 26]. Because of the complexity
of the problem, many optimization techniques and algorithms have been applied to optimal
capacitor placement problem [27, 28]. As discussed before, given that DG and Capacitor
allocation is an optimization problem, each paper is focused on a specific objective function.
Also, in some papers, several objectives are considered. To sum up the different objective
functions into a single objective function, a common way is to use weighting factors that is
used in the most research works. These schemes with single objective function needs to
convert all system technical aspect into correct monetary value which somewhat is difficult or
also impossible like voltage profile. On the other hand, in single objective some weights
determined by the decision makers are needed which are less reliable. Also, from the
experiments, the obtained results from optimization of single objectives do not necessarily
guarantee the optimal value for the other system parameters. So, maybe with enhancing one
parameter, the others get worse. To overcome the mentioned problem, Data Envelopment
Analysis (DEA) is proposed to be used. DEA has proven to be an excellent tool in decision
support system for measuring efficiency and productivity of a set of decision-making units
(DMUs) where multiple inputs convert into multiple outputs [29-38]. Therefore, by using this
approach determining the optimum size and site of DGs and capacitors, considering both
economic and technical aspects are better suited.
In DEA there is no necessity to have parameters with the same type. Also, with the
proposed scheme, several solutions with different characteristics are ranked considering
economic and technical aspects and gives varieties to system planners to choose one. On the
other hand, in single objectives some weights determined by the decision makers are needed,
while in DEA such weights are not required. DEA is an objective methodology which with no
knowledge of weights can rank the solutions. With the proposed scheme, well technical and
economical solution which means maximum network efficiency is obtainable. Therefore, in
this paper, a new method is proposed, in which single-objective functions are used in a
combinatory manner. These objectives are not in the same nature. With this method optimal
sitting and sizing of DGs and capacitors is available with considering both technical and
economical aspects.
2. Problem Formulation
In this paper, a methodology to optimize functionality of active distribution networks at the
presence of DGs and capacitor banks by minimizing power losses, improving voltage profile,
maximizing voltage stability and reducing emissions, individually and simultaneously,
considering the installation, operation and maintenance costs of the system is proposed.
Elnaz Babazadeh, et al.
46

A. Cost Functions
A.1. Power Loss Cost
Compared to transmission systems, distribution networks are well known for a higher R/X
ratio and significant voltage drops, which result substantial power and energy losses along MV
and LV feeders. As a result, the reduction of electric distribution network losses is one of the
major challenges for the utilities [39]. The real power loss of distribution network is given by
(1):
1
1
2N
k
kkTL IRP (1)
Where k is the line number, kR is the resistance and kI is the current of k th line,
respectively. TLP is the total real power loss of N-bus distribution network. The objective
function for loss reduction is formulated as follows:
)( TLLoss PMinCF (2)
Where LossCF is considered as the first objective function aimed in planning procedure.
A.2. Voltage Profile
The objective function to improve and regulate voltage profile [40] is given by (3):
))(( 2
N
m
RatedmVP VVMinCF (3)
Where m is the bus number in a N-bus distribution network, mV is the voltage of bus m and
RatedV is the nominal voltage. Where VPCF is considered as the second objective function
aimed in planning procedure
A.3. Voltage Stability Index
In [41] the voltage stability is defined as the ability of a power system to maintain voltage
in acceptable level where the system is able to control both power and voltage when load is
increased. Optimal placement of both DGs and/or capacitor banks can affect the voltage
stability of the distribution networks. Equation (4) which is described in [42] is used to
formulate the voltage stability index as figure 1 and (4). 4 22 2( ) 4[ ] 4 [ ]Index S R k R k S R k R kVS R V P X Q R V P R Q X (4)
Figure 1. Simple two-node system
Where, kR and kX are the resistance and reactance of k th line. RP and RQ are total real
power load and total reactive power load fed through bus S . Maximization of voltage stability
is formulated as follows:
NmmVS
MaxCFIndex
VS Index,...,3,2)
)(
1( (5)
V V
I k
S R
P + jQR R
Optimal Planning of Smart Distribution Network Based on Efficiency Evaluation Using
47

In order to maximize voltage stability, weak buses with minimum voltage stability index
should be identified and using capacitor or DG the voltage magnitudes are improved at these
weak buses. It is obvious that for radial distribution systems to be stable, 0)( mVSIndex .
Where IndexVSCF is considered as the third objective function aimed in planning procedure.
A.4. Emission
The minimization of emissions produced by DG units and substation buses such as xNO ,
2SO and 2CO results from consumption of fuels can be formulated as [43]. As mentioned,
minimizing the emissions is one of the main objective functions in distribution system which
can be considered by (6):
)( GridDGEmission EmissionEmissionMinCF (6)
Where,
)( 22DGDGDG
xDGDG COSONOPEmission
)( 22GridGridGrid
xSubstationGrid COSONOPEmission (7)
In which, DGEmission and GridEmission are the emission of DG units and substation bus
connected to the grid, respectively. The emission factors such as xNO , 2SO and 2CO are
produced depending on the fuel; natural gas, oil and liquefied petroleum gas. DGP and
SubstationP are the produced active power of DG and purchased active power from transmission
network, respectively. Where EmissionCF is considered as the fourth objective function aimed in
planning procedure.
B. Capacitor Modeling
The commercially available capacitors have discrete sizes, however they are often assumed
as continuous variables. Rounding the continuous optimal values of capacitor sizes, may not
guarantee an optimal solution, so it is better to model optimal capacitor placement as an
integer-programming problem [24]. In this paper discrete capacitors are considered. In practice,
capacitors have standard sizes which are integer multiples of the size 0CQ . Besides, capacitors
of larger size have lower unit prices. The maximum fixed capacitor size is usually limited to:
0CCMax LQQ (8)
Where, 0CQ is the base size and L is an integer. The total cost due to capacitor placement is
written as:
)( CiAICFixCost QKKCostCapacitor (9)
FixCostK is the fixed cost for the capacitor placement and the AICK is the annual capacitor
installation cost.
C. Dispatchable DG Modeling
The output power of a dispatchable DG is considered constant at its rated value and has no
associated uncertainties. In the rest of the paper, for simplicity, DG is used instead of
dispatchable DG. The available ratings are a discrete multiple of 200kW. The mentioned DG
generates both active and reactive power, in which reactive power can be from -0.6 to 0.8 of
the active power. In this study, the value of active power; power factor and the site of DG are
Elnaz Babazadeh, et al.
48
optimized. Generally, cost per kWh electrical energy produced by DG (DGP
CF ) is a function of
the capital cost, fuel cost, and the operation and maintenance costs [44]. The cost function of
DG is modeled as follows:
DGPbaCostDG (10)
Where a and b are:
$cos ( ) ( )
( ) 365 24
Capital t Capacity kW GrkWa
LifeTime Year LF
$ $ $( ) ( ) ( )b FuelCost OpCost MaCostkW h kW h kW h
Load factor is defined by LF; annual interest rate by Gr; and the cost of operation and
maintenance by Op &Ma Cost, respectively.
3. Proposed Scheme
As discussed before, in this paper, a novel scheme is proposed to find the optimum size and
site of several combinations of DGs and capacitors, separately and simultaneously, in a
distribution network with considering technical and economical aspects which proper
allocation improves the efficiency of the network. In order to find the efficient solution DEA is
proposed to be used. DEA is to rank the DMUs from the best to the worst. The best DMU is
the one with highest efficiency which in this study means the one which has improved network
parameters considerably and has lowest cost. So, in this scheme the efficiency of each DMU
has to be estimated. Using the definition of inputs and outputs in DEA, all of the system factors
are divided into inputs and outputs. Using an appropriate DEA model, the efficiency of each
DMU is determined. Then, in order to rank the efficient DMUs, from the best to the worst, AP
model (the super efficiency model proposed by Anderson-Peterson) [40] is employed.
A. Data Envelopment Analysis
Defining the principle of DEA in detail, is out of this paper’s scope and the complete
review can be found in several papers, for instance in [29, 30]. A brief description of DEA
technique is provided in the following paragraphs. In this paper, DEA is proposed to
economically evaluate the system performance. Based on this procedure several single
objective functions are considered for optimal sizing and siting of the dispatchable DGs and
capacitor banks. DEA is a mathematical programming technique for comparing relative
efficiency of a set of firms, usually called as the decision making units (DMUs), which use a
variety of identical inputs to produce a variety of identical outputs [29-31]. This method was
originated by Charnes, Cooper and Rhodes (CCR) [32] under constant-returns-to-scale (CRS).
Banker, Charnes and Cooper (BCC) introduced a variable-returns-to-scale (VRS) version of
the CCR model, namely the BCC model [33]. Following the CCR and BCC models, other
models of DEA have been introduced in DEA literature. Nowadays DEA is a widely
recognized technique and is applicable in several fields of sciences.
Assuming that there are n DMUs, each with m inputs and s outputs, the relative efficiency
of a particular })...2,1{0(0 nDMU is obtained by solving the following fractional
programming model:
Optimal Planning of Smart Distribution Network Based on Efficiency Evaluation Using
49

0
10
0
1
1
1
. . 1, 1,2,...,
0 1,2,...,
0 1,2,...,
s
r r
r
m
i i
i
s
r rj
r
m
i ij
i
r
i
u y
Max
v x
u y
s t j n
v x
u r s
v i m
(12)
Where j is the DMU index j=1,2…n, )...2,1( mixij are the value of ith
input for the jth
DMU, ),...,2,1( sryrj are the value of rth
output for the jth
DMU, ),...,2,1( srur are the
weights of outputs, ),...,2,1( mivi are the weights of inputs and let the 0DMU be a DMU
under evaluation. 0DMU is the efficient if and only if 10 . The efficiency of 0DMU is
defined as the ratio of its weighted outputs to weighted inputs subjected to the condition that
the similar ratios for all DMUs be lower than or equal to 1. A relative efficiency score of 1
indicates that the DMU under consideration is efficient, whereas a score lower than 1 implies
that it is inefficient. Model (14) reflects that the goal of DEA is to identify the DMU that has
the maximum ratio of its weighted outputs to weighted inputs. As can be seen the weights are
determined by the model. So, this technique with no knowledge of weights can rank the
DMUs. The objective property of DEA allows us to have a judgment in a just manner. This
fractional program can be converted into a linear programming problem: if either the
denominator or numerator of the ratio is forced to be unity, then the objective function will
become linear, and a linear programming problem can be obtained. By setting the denominator
of the ratio equal to 1, the reformulated linear programming problem, also known as the
multiplier form of CCR input-oriented model, is as follows:
miv
sru
njxvyu
xvts
yuMax
i
r
m
i
iji
s
r
rjr
m
i
ii
s
r
rr
,...,10
,...,2,10
,...,2,10
1..
11
1
0
1
00
(13)
By setting the numerator equal to 1, the multiplier form of CCR output-oriented model is
obtained. Because of the nature of the formulations, the optimal objective function values of
the CCR input and output oriented represent reciprocal efficiency scores. The dual problem of
Elnaz Babazadeh, et al.
50
(13) is expressed with a real variable and a non-negative vector Tn ),...,,( 21 of
variables as follows:
nj
yy
xxts
Min
j
r
n
j
rjj
i
n
j
ijj
,...,2,10
..
0
1
0
1
(14)
Model (14) is called the envelopment form of CCR-input oriented model. The literature on
DEA has many more extensions of these simple models [29-31]. DEA divides DMUs into two
groups- efficient and inefficient- while in practice, there is often a need to fully rank them. In
DEA models, as usual, more than one DMU may be efficient and their efficiency scores will be
1, so one of the most interesting research matters in DEA is to discriminate efficient units.
Some authors have proposed several methods to rank the best performers [34-38]. The super
efficiency concept is proposed to differentiate completely among all efficient DMUs when
there are more than one efficient DMU. One of the super efficiency models for ranking
efficient DMUs in DEA was introduced by Anderson and Peterson [34]. This method enables
an extreme efficient unit 0 to achieve an efficiency score greater than one by removing the 0th
constraint in the envelopment LP formulation, as shown in model
0
10
0
10
. .
0 1,2,...,
n
j ij i
jj
n
j rj r
jj
j
Min
s t x x
y y
j n
(15)
In this paper DEA is proposed which can be advantageously combined with distribution
network planning to determine the well technical and economical scenarios in distribution
network. Given that siting and sizing is an optimization problem, Imperialist competitive
algorithm (ICA) is found to be an appropriate alternative in this regard. ICA is an optimization
algorithm that has recently been developed. ICA optimizes the defined objective functions
through the concept of imperialistic competition. Defining the principle of ICA is out of the
scope of this paper and the complete review can be found in several papers, for instance [45].
The flowchart of the proposed method based on ICA and DEA is illustrated in Figure 2.
As seen in Figure 2, the initial requirements for the proposed approach is scenario
definition with considering network designers’ preferences (see 4.3 scenarios 2-7). Here in
order to determine the optimal mix of DGs and capacitors, six scenarios are proposed;
(scenarios 2-7), along with an extra reference scenario for comparison (scenario 1). For
simplicity and limitations in feasible DGs and capacitors location availability, maximum two
devices for each technology are considered but it can be expanded to several devices depending
on the network capability. In every scenario, minimizing each defined objective function,
(power loss, voltage deviation, voltage stability and emission) is to find the optimum site and
Optimal Planning of Smart Distribution Network Based on Efficiency Evaluation Using
51
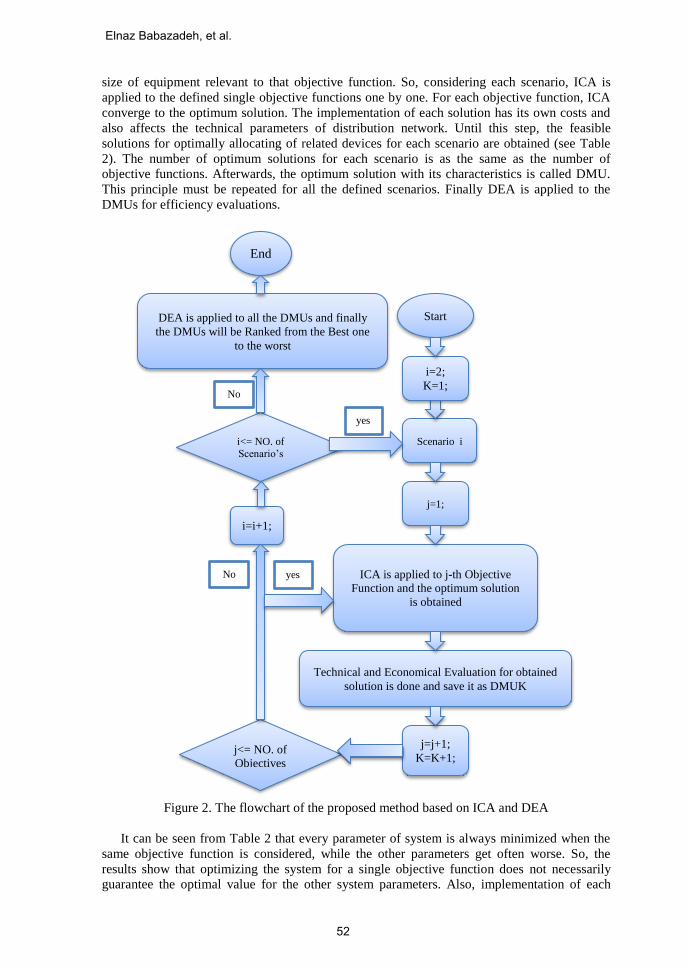
size of equipment relevant to that objective function. So, considering each scenario, ICA is
applied to the defined single objective functions one by one. For each objective function, ICA
converge to the optimum solution. The implementation of each solution has its own costs and
also affects the technical parameters of distribution network. Until this step, the feasible
solutions for optimally allocating of related devices for each scenario are obtained (see Table
2). The number of optimum solutions for each scenario is as the same as the number of
objective functions. Afterwards, the optimum solution with its characteristics is called DMU.
This principle must be repeated for all the defined scenarios. Finally DEA is applied to the
DMUs for efficiency evaluations.
Figure 2. The flowchart of the proposed method based on ICA and DEA
It can be seen from Table 2 that every parameter of system is always minimized when the
same objective function is considered, while the other parameters get often worse. So, the
results show that optimizing the system for a single objective function does not necessarily
guarantee the optimal value for the other system parameters. Also, implementation of each
Scenario i
j=1;
ICA is applied to j-th Objective
Function and the optimum solution
is obtained
Technical and Economical Evaluation for obtained
solution is done and save it as DMUK
j=j+1;
K=K+1; j<= NO. of
Objectives
i<= NO. of Scenario’s
DEA is applied to all the DMUs and finally
the DMUs will be Ranked from the Best one
to the worst
End
Start
i=2;
K=1;
i=i+1;
yes
No
yes No
Elnaz Babazadeh, et al.
52
solution needs related investment and operation costs according to the technology used and the
system performance characteristics, according to (9) and (10), the cost of purchased energy
from transmission system and power loss costs and also the environmental impacts.
For the purpose, DEA is applied because, with this approach determining the optimum size
and site considering both economic and technical aspects are better suited.
As discussed before, when several objective functions with different types aimed to be
optimized, converting all them into one objective function by using weighting factors,
somewhat is difficult and is depended to the decision makers personal preference so it’s not
common for all. But in DEA there is no necessity to have parameters with the same type. Also,
with the proposed scheme, several DMUs (optimum solutions) with different characteristics are
ranked considering economic and technical aspects and gives varieties to system planners to
choose one. DEA is an objective methodology which with no knowledge of weights can rank
the solutions which use a variety of identical inputs to produce a variety of identical outputs.
DEA is for comparing the relative efficiency of DMUs with the same multiple inputs and
outputs. It means that the relative efficiency measure of each DMU (optimum solution) is
obtained without imposing the decision maker’s preferences.
4. Simulation and Results
A. System under Study
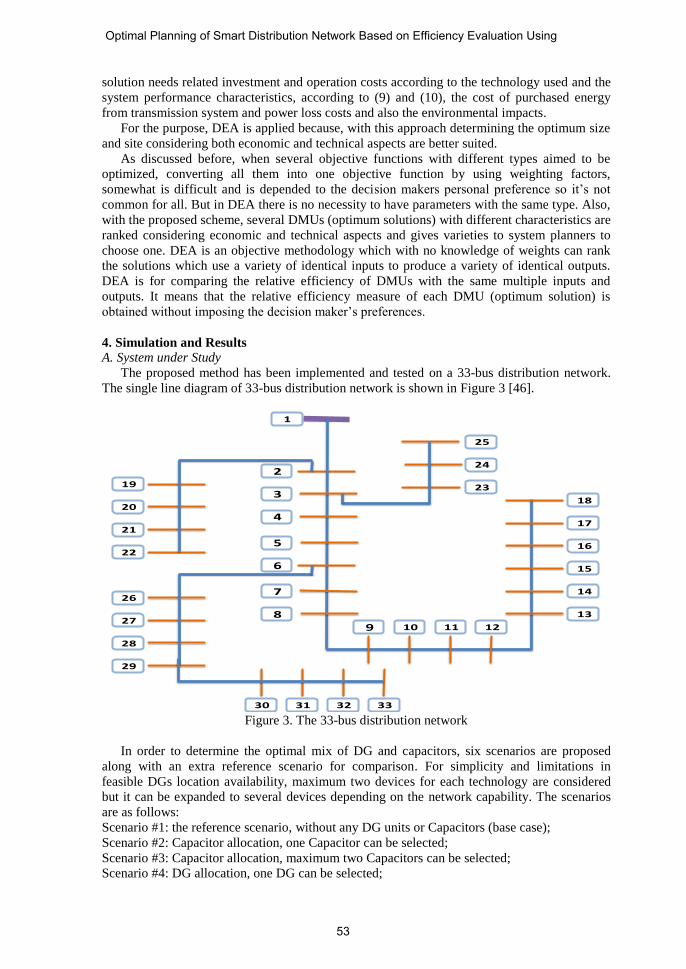
The proposed method has been implemented and tested on a 33-bus distribution network.
The single line diagram of 33-bus distribution network is shown in Figure 3 [46].
Figure 3. The 33-bus distribution network
In order to determine the optimal mix of DG and capacitors, six scenarios are proposed
along with an extra reference scenario for comparison. For simplicity and limitations in
feasible DGs location availability, maximum two devices for each technology are considered
but it can be expanded to several devices depending on the network capability. The scenarios
are as follows:
Scenario #1: the reference scenario, without any DG units or Capacitors (base case);
Scenario #2: Capacitor allocation, one Capacitor can be selected;
Scenario #3: Capacitor allocation, maximum two Capacitors can be selected;
Scenario #4: DG allocation, one DG can be selected;
1
2
3
4
5
6
7
89 10 11 12
13
14
15
16
17
18
19
20
21
22
23
24
25
26
27
28
29
30 31 32 33
Optimal Planning of Smart Distribution Network Based on Efficiency Evaluation Using
53

Scenario #5: DG allocation, maximum two DGs can be selected;
Scenario #6: Simultaneous DG and Capacitor allocation, one DG and one Capacitor can be
selected;
Scenario #7: Simultaneous DG and Capacitor allocation, maximum two DGs and two
Capacitors can be selected;
B. Technical Constraints
Load flow method is based on optimal power flow with its defined constraints which
comprises: power flow equations, voltage limit on buses, feeder capacity limit, maximum
penetration of DG units in the system and maximum penetration on each bus. Also it should be
noted that in each selected bus just one technology can be placed.
C. Results
The cost functions are considered as:
ii FCF (16)
Table 1 shows the single objective function values in scenario #1 as the base case.
Table 1
Cost function (CF) values before allocation
1CF 224
2CF 0.14
3CF 1.64
4CF 8.26
To enhance the performance parameters of the system, considering technical constraints,
several scenarios are detailed in Table 2.
Table 2 illustrates the sizing and siting results of DG and capacitors for the rest six
scenarios. Second column shows the implemented single objective function for each DMU;
Column three depicts the DMU’s number, Columns from four to five give the sizing and siting
results; and the remained columns show the obtained value of each cost function, given the
obtained allocation; namely system parameters. It can be seen from Table 2 that every
parameter of system is always minimized when the same objective function is considered,
while the other parameters get often worse. So, the results show that optimizing the system for
a single objective function does not necessarily guarantee the optimal value for the other
system parameters. Also, implementation of each solution needs related investment and
operation cost according to the technology used and the system performance characteristics and
also the environmental impacts.
With the proposed scheme well technical and economical solution which means maximum
network efficiency is obtainable. To this, DEA is applied to Table 2 to find the well technical
and economical solution, see 3.1. As seen, third column of table 2 is named DMU and there
are 30 DMUs equal to the number of solutions obtained by ICA. As discussed before, each
solution is for a specified scenario with relevant objective used. Each DMU defines with the
network parameters and has some costs to be implemented.
Elnaz Babazadeh, et al.
54

Table 2. Siting and sizing results of DG and capacitor
Scenarios
CFs DMU Size and site of DGs and Capacitors
DG
MW, MVar/
MW,(Bus number)
Capacitor
KVar, (Bus
number) 1CF 2CF 3CF 4CF
# 2
1CF DMU_1 - 1200, (30) 163.34 0.10 1.59 8.13
2CF DMU_2 - 1200, (17) 236.98 0.08 1.47 8.28
3CF DMU_3 - 4050, (6) 243.89 0.11 1.28 8.30
4CF DMU_4 - 1200, ( 30) 163.34 0.10 1.59 8.13
5CF DMU_5 - 1200, ( 30) 163.34 0.10 1.59 8.13
# 3
1CF DMU_6 - 1050, (30)
450, (12) 153.57 0.10 1.50 8.11
2CF DMU_7 -
4050, (
22)1050, (17)
467.57 0.07 1.47 8.75
3CF DMU_8 - 4050, (5)
4050, (6) 519.59 0.19 1.08 8.86
4CF DMU_9 - 1050, (30) 450, (12)
153.57 0.10 1.50 8.11
5CF DMU_10 - 1050, (30)
450, (12) 153.57 0.10 1.50 8.11
# 4
1CF DMU_11 2.6, 0.7, (6) - 71.50 0.02 1.14 5.51
2CF DMU_12 3.8, 0.5, (7) - 95.98 0.00 1.11 4.44
3CF DMU_13 5, 0.8, (6) - 198.16 0.02 1.03 5.55
4CF DMU_14 3.6, 0.8, (8) - 215.03 0.04 1.08 4.87
5CF DMU_15 3.8, 0.5, (6) - 88.27 0.00 1.07 4.43
# 5
1CF DMU_16 2.2, 0.8, (3) 1.6,
0.8, (30) - 57.53 0.02 1.23 4.36
2CF DMU_17 1, 0.8, (10) 1.2,
0.8, (31) - 37.10 0.00 1.10 5.82
3CF DMU_18 2, 0.6, (8) 2, 0.8,
(27) - 112.09 0.02 1.06 4.44
4CF DMU_19 2, -0.4, (31) 1.6,
0.8, (30) - 217.42 0.03 1.25 4.88
5CF DMU_20 2.2, 0.8, (3) 1.6,
0.8, (30) - 57.53 0.02 1.23 4.36
# 6
1CF DMU_21 1.2, 0.4, (10) 1050, (30) 70.12 0.02 1.22 6.82
2CF DMU_22 1.2, -0.1, (17) 1200, (31) 114.54 0.00 1.19 6.91
3CF DMU_23 1.2, 0.4, (10) 1950, (29) 94.75 0.02 1.11 6.87
4CF DMU_24 3.4, -0.4, (12) 1350, (5) 419.44 0.21 1.23 5.48
5CF DMU_25 1.4, 0.4, (10) 1050, (30) 68.31 0.01 1.20 6.63
# 7
1CF DMU_26 0.4, 0.6, (14) 0.6,
0.3, (31) 600, (30) 600, (27)
57.28 0.03 1.23 6.98
2CF DMU_27 1, -0.6, (17) 1050, (30)
1800, (27) 149.18 0.00 1.21 7.17
3CF DMU_28 1.2, 0.8, (17) 1650, (31)
1650, (24) 173.27 0.03 1.08 7.03
4CF DMU_29 2.8, 0.3, (31) 0.8,
0.8, (30) 1050, (27) 1050, (24)
215.80 0.04 1.15 4.87
5CF DMU_30 0.6, 0.2, (31) 0.6,
0.6, (14)
900, (30)
300, (27) 46.32 0.02 1.14 6.77
Optimal Planning of Smart Distribution Network Based on Efficiency Evaluation Using
55

5. Using DEA Concepts for Assignment of the Efficient Solution
Table 3. DEA and ranking method
Results CCR Results AP Ranking
DMU_1 0.668 0.668 25
DMU_2 0.7182 0.7182 23
DMU_3 0.815 0.815 21
DMU_4 25
DMU_5 25
DMU_6 0.7038 0.7038 24
DMU_7 0.7201 0.7201 22
DMU_8 0.9557 0.9557 12
DMU_9 0.7038 0.7038 24
DMU_10 24
DMU_11 0.9297 0.9297 14
DMU_12 1 1.2145 2
DMU_13 1 1.0232 4
DMU_14 1 1.0106 6
DMU_15 1 1.0252 3
DMU_16 1 1.0144 5
DMU_17 1 1.2323 1
DMU_18 1 1.0081 7
DMU_19 1 1.0032 8
DMU_20 5
DMU_21 0.8613 0.8613 19
DMU_22 0.9197 0.9197 15
DMU_23 0.9374 0.9374 13
DMU_24 0.9915 0.9915 10
DMU_25 0.8773 0.8773 18
DMU_26 0.8494 0.8494 20
DMU_27 0.9088 0.9088 17
DMU_28 0.959 0.959 11
DMU_29 0.9983 0.9983 9
DMU_30 0.9155 0.9155 16
DEA provides a useful tool in ranking the different solutions obtained for the distribution
network. The solutions are the DMUs, as their efficiencies have to be estimated. Using the
definition of inputs and outputs in DEA, all of the system factors in this study are considered as
inputs. Since DEA calculations cannot be made entirely with inputs and require at least one
output, then a dummy output that has a value of 1 for all the DMUs is employed. The terms of
Elnaz Babazadeh, et al.
56

2CF , 3CF and 4CF are considered as inputs. Also the sum of DG Cost and Capacitor Costs
and power loss costs is another input. By avoiding the similar DMUs and applying the model
(14), we can obtain the following results. As can be seen from Table 3, the CCR-input oriented
value for the 8 DMUs is 1 i.e. the 8 DMUs are efficient, so their ranking order is 1. In order to
rank the efficient DMUs, AP model (15) is employed. The obtained results using DEA and
Ranking Method are detailed in Table 3. The final ranking is presented in the 4th column of
Table 3. Note that the vacancies in Table 3 are because some DMUs overlap.
It can be seen from Table 3 that the ranking order of DMU-17 is one, which means that the
obtained solution, listed in DMU-17 chart, is the most preferred from the technical and
economical points of view. DMU-17 proposes two DGs with MVAjS 8.011 and
2 1.2 0.96S j MVA at bus numbers of 10 and 31, respectively as indicated in Figure 4. It
can be seen that after DMU-17, DMU-12 is preferred and it is followed by DMU-15.
Figure 4. Best technical and economical solution.
It’s clear that with the implementing of DMU-17, considerable improvements can be
achieved comparing with the base case (scenario 1). The obtained results validate the
efficiency of the proposed approach.
6. Conclusion
In this paper, a new method is proposed to optimally allocate the DGs and capacitor banks
considering both technical and economical aspects. The proposed approach can put into
practice considering several objective functions with different types, which in this study are:
the network costs minimization, voltage profile adjustment, voltage stability improvement and
emission reduction. The proposed method can easily be expanded with more objectives to
cover all the network planners’ preferences. With the proposed scheme, several solutions with
1
2
3
4
5
6
7
89 10 11 12
13
14
15
16
17
18
19
20
21
22
23
24
25
26
27
28
29
30 31 32 33
DG
DG
Optimal Planning of Smart Distribution Network Based on Efficiency Evaluation Using
57

different characteristics are ranked considering economical and technical aspects and gives
varieties to system planners to choose one. Also, efficiency evaluation is available with the
proposed method to find the well economical and technical solution. On the other hand, with
the proposed approach, the most efficient solution for optimal sizing and siting of DGs and
capacitor banks is obtained. Simulation results validate the practicability of this method.
7. References
[1]. Najafi S, Hosseinian SH, Abedi M, Vahidnia A, Abachizadeh S. “A framework for
optimal planning in large distribution networks”. IEEE Trans. Power System, 2009;
24(3): 1019-10
[2]. Ghosh S, Ghoshal SP, Ghosh S. “Optimal sizing and placement of distributed generation
in a network system”. International Journal of Electrical Power & Energy Systems,
(2010); 32(8): 849–8
[3]. Andrews CJ, Weiner SA. “Visions of a hydrogen future”. IEEE Power and Energy
Magazine, (2004); 2(2): 26–8
[4]. Barker PP, De Mello RW. “Determining the impact of distributed generation on power
systems”. I. Radial distribution systems. in Power Engineering Society Summer Meeting,
IEEE, (2000); 3: 1645–11
[5]. Khalesi N, Rezaei N, Haghifam MR. “DG allocation with application of dynamic
programming for loss reduction and reliability improvement”. International Journal of
Electrical Power & Energy Systems, (2011); 33(2): 288–7
[6]. Najafi Ravadanegh S, Gholizadeh Roshanagh R. “A heuristic algorithm for optimal
multistage sizing, siting and timingof MV distribution substations”. Electric Power
Systems Research (2013); 105: 134– 8
[7]. Najafi Ravadanegh S, Gholizadeh Roshanagh R. “On optimal multistage electric power
distribution networks expansion planning”. International Journal of Electrical Power &
Energy Systems, (2014); 54: 487–11
[8]. Elnashar MM, Shatshat R El, Salama M. “Optimum siting and sizing of a large
distributed generator in a mesh connected system”. Electric Power Systems Research,
(2010); 80(6): 690–7
[9]. Keane A, O’Malley M. “Optimal allocation of embedded generation on distribution
networks. Power Systems”, IEEE Transactions on, (2005); 20(3): 1640–6
[10]. Gallego RA, Monticelli AJ, Romero R. “Optimal capacitor placement in radial
distribution networks. Power Systems”, IEEE Transactions on, (2001); 16(4): 630–7
[11]. Wang C, Nehrir MH. “Analytical approaches for optimal placement of distributed
generation sources in power systems”. Power Systems, IEEE Transactions on, (2004);
19(4): 2068–8
[12]. Gözel T, Hocaoglu MH. “An analytical method for the sizing and siting of distributed
generators in radial systems”. Electric Power Systems Research, (2009); 79(6): 912–7
[13]. Le ADT, Kashem MA, Negnevitsky M, Ledwich G. “Optimal distributed generation
parameters for reducing losses with economic consideration”. in Power Engineering
Society General Meeting, IEEE, 2007; 1–8
[14]. Gandomkar M, Vakilian M, Ehsan M, “A combination of genetic algorithm and simulated
annealing for optimal DG allocation in distribution networks”, in Electrical and
Computer Engineering, Canadian Conference on, 2005; 645–4
[15]. Celli G, Pilo F. “Optimal distributed generation allocation in MV distribution networks.
in Power Industry Computer Applications”, PICA 2001. Innovative Computing for
Power-Electric Energy Meets the Market. 22nd IEEE Power Engineering Society
International Conference on, 2001; 81–7
[16]. Carpinelli G, Celli G, Mocci S, Pilo F, Russo A. “Optimization of embedded generation
sizing and siting by using a double trade-off method”. IEE Proceedings-Generation,
Transmission and Distribution, (2005); 152(4): 503–11
Elnaz Babazadeh, et al.
58

[17]. Nara K, Hayashi Y, Ikeda K, Ashizawa T. “Application of tabu search to optimal
placement of distributed generators”, in Power Engineering Society Winter Meeting,
IEEE, (2001); 2: 918–4
[18]. Cano EB. “Utilizing fuzzy optimization for distributed generation allocation”. in
TENCON IEEE Region 10 Conference, 2007; 1–4
[19]. Rau NS, Wan Y. “Optimum location of resources in distributed planning”. Power
Systems, IEEE Transactions on, (1994) ; 9(4): 2014–7
[20]. Rios MS, Rubio SM. “Sequential optimization for siting and sizing distributed generation
(DG) in medium voltage (MV) distribution networks”. in Power Tech, 2007 IEEE
Lausanne, 2007; 2213–6
[21]. Porkar S, Poure P, Abbaspour-Tehrani-fard A, Saadate S. “A novel optimal distribution
system planning framework implementing distributed generation in a deregulated
electricity market”. Electric Power Systems Research, (2010); 80(7): 828–11
[22]. Segura S, Romero R, Rider MJ. “Efficient heuristic algorithm used for optimal capacitor
placement in distribution systems”. International journal of electrical power & energy
systems, (2010); 32(1): 71–8
[23]. Puttgen HB, Macgregor PR, Lambert FC. “Distributed generation: Semantic hype or the
dawn of a new era?”. Power and Energy Magazine, IEEE, (2003); 1(1): 22–8
[24]. Rao RS, Narasimham SVL, Ramalingaraju M. “Optimal capacitor placement in a radial
distribution system using plant growth simulation algorithm”. International Journal of
Electrical Power & Energy Systems, (2011); 33(5): 1133–7
[25]. Huang TL, Hsiao YT, Chang CH, Jiang JA. “Optimal placement of capacitors in
distribution systems using an immune multi-objective algorithm”. International Journal
of Electrical Power & Energy Systems, (2008); 30(3): 184–8
[26]. Chang CF. “Reconfiguration and capacitor placement for loss reduction of distribution
systems by ant colony search algorithm”. Power Systems, IEEE Transactions on, (2008);
23(4): 1747–9
[27]. Da Silva IC, Carneiro S, de Oliveira EJ, de Souza Costa J, Rezende Pereira JL, Garcia
PAN. “A heuristic constructive algorithm for capacitor placement on distribution
systems”, Power Systems, IEEE Transactions on, (2008); 23(4): 1619–8
[28]. Sundhararajan S, Pahwa A. “Optimal selection of capacitors for radial distribution
systems using a genetic algorithm”, Power Systems, IEEE Transactions on, (1994); 9(3):
1499–9
[29]. Ray SC. “Data envelopment analysis: theory and techniques for economics and
operations research”. New York: Cambridge university press; 2004.
[30]. Cooper CA, Lewin AWW, Seiford LM. “Data envelopment analysis: theory,
methodology and application”. Boston: Kluwer; 1994
[31]. Cooper WW, Seiford LM, Tone K. Data envelopment analysis: “A Comprehension Text
with Models, Applications, References, and DEA-Solver Software”. Boston: Kluwer
Academic Publishers; 2000
[32]. Charnes A, Cooper WW, Rhodes E. “Measuring the efficiency of decision making units,
European Journal of Operation Research”, (1978); (2): 429-20
[33]. Banker RD, Charnes A, Cooper WW. “Some models for estimating technical and scale
inefficiencies in data envelopment analysis, Management Science”, (1984); 30: 1078-15
[34]. Anderson P, Peterson NC. “A procedure for ranking efficient units in data envelopment
analysis”. Management Science, (1993); 39: 1261-4
[35]. Cook W, Kress M, Seiford L. “Prioritization models for frontier decision making units in
DEA”, European Journal of Operational Research, (1992); 59: 319-323
[36]. Sexton TR, Silkman RH, Hogan AJ, Data envelopment analysis: critique and extensions,
in: Silkman RH (Ed.), Measuring efficiency: An assessment of Data Envelopment
Analysis, Jossey-Bass, San Francisco, CA, (1986), 73-105
[37]. Liu FHF, Peng HH, “Ranking of units on the DEA frontier with common weights,
Computers & Operations Research”, (2008); 35: 1624-1637
Optimal Planning of Smart Distribution Network Based on Efficiency Evaluation Using
59

[38]. Cooper WW, Tone K, “Measures of inefficiency in data envelopment analysis and
stochastic frontier estimation, European Journal of Operational Research”, (1997); 99: 72-
88
[39]. Baghzouz Y, Ertem S. “Shunt capacitor sizing for radial distribution feeders with
distorted substation voltages”. Power Delivery, IEEE Transactions on, (1990); 5(2): 650–
8
[40]. Hung DQ, Mithulananthan N, Bansal RC. “Analytical expressions for DG allocation in
primary distribution networks”. Energy Conversion, IEEE Transactions on, (2010);
25(3): 814–7
[41]. Moradi MH, Abedini M. “A combination of genetic algorithm and particle swarm
optimization for optimal DG location and sizing in distribution systems”. International
Journal of Electrical Power & Energy Systems. (2012); 34(1): 66–9
[42]. Sajjadi SM, Haghifam MR, Salehi J. “Simultaneous placement of distributed generation
and capacitors in distribution networks considering voltage stability index”. International
Journal of Electrical Power & Energy Systems, (2013); 46: 366–10
[43]. Chakravorty M, Das D. “Voltage stability analysis of radial distribution networks”.
International Journal of Electrical Power & Energy Systems, (2001); 23(2): 129–7
[44]. Taher Niknam, Seyed Iman Taheri, Jamshid Aghaei, Sajad Tabatabaei, Majid Nayeripour.
“A modified honey bee mating optimization algorithm for multiobjective placement of
renewable energy resources”. Applied Energy, (2011); 88: 4817-4830
[45]. Khorani V, Razavi F, Disfani VR. “A mathematical model for urban traffic and traffic
optimization using a developed ICA technique”. Intelligent Transportation Systems, IEEE
Transactions on, (2011); 12(4): 1024–13
[46]. Baran ME, Wu FF. “Network reconfiguration in distribution systems for loss reduction
and load balancing”. IEEE Transactions on Power Delivery, (1989); 4(2): 1401-7
Elnaz Babazadeh is a Ph.D student in Azarbaijan Shahid Madani University
in Operations Research field. She received her M.Sc. degree from the
mentioned university. She has published papers on Data envelopment
analysis in Journal of the Operational Research Society (JORS), International
Journal of Industrial Mathematics and also different international and foreign
conferences. Her major research interests include: Operations Research, Data
Envelopment Analysis (DEA), MCDM problems and particularly
incorporating DEA with engineering fields such as Electrical Engineering.
Mohammad Reza Jannati Oskuee was born in Tabriz, Iran, in 1988. He
received his B.Sc. degree in electrical power engineering from University of
Tabriz, Tabriz, Iran and M.Sc. degree from Azarbaijan Shahid Madani
University, Tabriz, Iran, graduating with first class honors, where he is
currently working towards the Ph.D. degree at Electrical Engineering
Department. In 2014, he was the recipient of the Best Student Researcher
Award of the Azarbaijan Shahid Madani University. His major research
interests include: smart grids, power system planning and operation, power electronics, power
system dynamics and FACTs devices.
Elnaz Babazadeh, et al.
60

Jafar Pourmahmoud is an assistant professor in Department of Applied
Mathematics, Azarbaijan Shahid madani University. He has published papers
in Bulletin of the Iranian Mathematical Society, Applied Mathematics and
computation, Journal of Applied Environmental and Biological Sciences,
International Journal of Industrial Mathematics and International Journal of
Industrial Engineering Computations. His research interest is on Operations
Research (especially on Network Data Envelopment Analysis and fuzzy
DEA) and Numerical Linear Algebra and Applications.
Sajad Najafi Ravadanegh was born in Iran, in 1976. He received the B.Sc.
degree from the University of Tabriz, Tabriz, Iran, and the M.Sc. and Ph.D.
degrees from the Amirkabir University of Technology, Tehran, Iran, in 2001,
2003, and 2009, respectively, all in electrical engineering. He is currently an
Associate Professor with the Electrical Engineering Department, Azarbaijan
Shahid Madani University, Tabriz, where he is responsible for the Smart
Distribution Grid Research Laboratory. His current research interests include
smart distribution networks and microgrids optimal operation and planning, power system
stability and control, power system controlled islanding, optimization algorithms applications
in power systems, nonlinear dynamic, and chaos. He has authored/co-authored of over 40
technical papers.
Optimal Planning of Smart Distribution Network Based on Efficiency Evaluation Using
61