Embed Size (px)
Citation preview

Department of Health & Human Services OFFICE OF
INSPECTOR GENERAL
MEDICAID BRAND-NAME DRUGS: RISING PRICES ARE OFFSET
BY MANUFACTURER REBATES
Daniel R. Levinson Inspector General
August 2011
OEI-03-10-00260

O E I - 0 3 - 1 0 - 0 0 2 6 0 R I S I N G P R I C E S F O R M E D I C A I D B R A N D - N A M E D R U G S A R E O F F S E T B Y R E B AT E S i
E X E C U T I V E S U M M A R Y E X E C U T I V E S U M M A R Y
OBJECTIVE
To assess changes in prices for brand-name prescription drugs since 2005 and their potential financial impact on the Medicaid program.
BACKGROUND According to a series of reports issued by AARP, published prices for the most widely used brand-name prescription drugs have risen significantly since 2002, substantially outpacing the inflation rate. Senator Bill Nelson expressed concern over the reported price increases and requested that the Office of Inspector General (OIG) review drug pricing changes and their impact on Government health care programs, such as Medicaid. To address Senator Nelson’s concerns, this study looked beyond reported increases in published prices to examine changes in transaction-based drug prices and Medicaid payments.
In 2009, Medicaid spent approximately $26 billion for prescription drugs (not including rebates), with brand-name drugs generally accounting for about 80 percent of this total. For Federal payment to be available for covered outpatient drugs under Medicaid, drug manufacturers must, among other things, enter into rebate agreements with the Secretary of Health & Human Services, report quarterly average manufacturer prices (AMP) to the Centers for Medicare & Medicaid Services (CMS) for each of their covered outpatient drugs, and pay quarterly rebates to State Medicaid agencies. The rebate amount for any given drug generally depends on the quarterly AMP submitted by the manufacturer, as well as whether the drug is brand-name or generic. Manufacturers pay a higher rebate for brand-name drugs than for generic drugs.
For this study, we selected all brand-name drugs used by Medicaid beneficiaries in 2009 and calculated median changes in their wholesale acquisition costs (WAC—the published prices examined by AARP), AMPs, Medicaid payment amounts, and rebate-adjusted Medicaid payment amounts during the 5-year period between the first quarter of 2005 and the first quarter of 2010.
We then examined these changes in relation to the consumer price index, which measures the inflation rate for a market basket of consumer goods and services. We also analyzed a subset of high-dollar brand-name drugs used by Medicaid beneficiaries in 2009.

O E I - 0 3 - 1 0 - 0 0 2 6 0 R I S I N G P R I C E S F O R M E D I C A I D B R A N D - N A M E D R U G S A R E O F F S E T B Y R E B AT E S ii
E X E C U T I V E S U M M A R Y
FINDINGS Overall, prices and payment amounts for Medicaid brand-name drugs increased at about three times the inflation rate between 2005 and 2010. Over this 5-year period, WACs, AMPs, and Medicaid payment amounts increased between 34 and 40 percent at the median while the inflation rate increased only 13 percent. In addition to outpacing inflation overall, increases in WACs, AMPs, and Medicaid payment amounts for brand-name drugs outpaced the inflation rate in each of the 5 years under review. For the 50 Medicaid brand-name drugs with the highest expenditures, total median increases in prices and payment amounts not only outpaced the inflation rate, but also outpaced total median increases in prices and payment amounts for brand-name drugs as a whole.
Significant increases in prices and payment amounts for brand-name drugs were offset by savings generated from the Medicaid drug rebate program. We found that when the per-unit payment amounts for all Medicaid brand-name drugs were adjusted to account for the rebates paid to States by manufacturers, the per-unit net cost to Medicaid increased at a much lower rate than other points of comparison between 2005 and 2009 (rebate data were not available for 2010). In fact, Medicaid’s rebate-adjusted payment amounts for brand-name drugs actually declined at the median in 3 of 4 years, lagging behind the inflation rate.
CONCLUSION Taken as a whole, the results of our study indicate that price increases for brand-name drugs may not necessarily translate to corresponding increases in Medicaid costs. Much like AARP, we found that median increases in WACs for Medicaid brand-name drugs outpaced the inflation rate during the 5-year period under review, as did AMPs and the amounts Medicaid paid to cover pharmacies’ ingredient costs. However, these increases were offset by rebates that manufacturers paid to States. Because of the savings generated by the rebate program, Medicaid’s net costs for brand-name drugs actually increased at a lower rate than other points of comparison, including the inflation rate.
O E I - 0 3 - 1 0 - 0 0 2 6 0 R I S I N G P R I C E S F O R M E D I C A I D B R A N D - N A M E D R U G S A R E O F F S E T B Y R E B AT E S iii
E X E C U T I V E S U M M A R Y
AGENCY COMMENTS AND OFFICE OF INSPECTOR GENERAL RESPONSE CMS expressed its belief that the Medicaid drug rebate program has been effective in helping to offset the increasing cost of drugs in the Medicaid program. CMS also offered two technical comments, both of which reiterated information provided by OIG in the body of the report. We did not make any changes to the report based on CMS’s comments.

T A B L E O F C O N T E N T S
E X E C U T I V E S U M M A R Y . . . . . . . . . . . . . . . . . . . . . . . . . . . . . . . . . . . . . i
I N T R O D U C T I O N . . . . . . . . . . . . . . . . . . . . . . . . . . . . . . . . . . . . . . . . . . . . 1
F I N D I N G S . . . . . . . . . . . . . . . . . . . . . . . . . . . . . . . . . . . . . . . . . . . . . . . . . 10 Overall, prices and payment amounts for Medicaid brand-name drugs increased at about three times the inflation rate between 2005 and 2010 . . . . . . . . . . . . . . . . . . . . . . . . . . . . . . . . . . 10
Significant increases in prices and payment amounts for brand-name drugs were offset by savings generated from the Medicaid drug rebate program . . . . . . . . . . . . . . . . . . . . . . . . . . . . 12
C O N C L U S I O N . . . . . . . . . . . . . . . . . . . . . . . . . . . . . . . . . . . . . . . . . . . . . 15 Agency Comments and Office of Inspector General Response . . . . 15
A P P E N D I X E S . . . . . . . . . . . . . . . . . . . . . . . . . . . . . . . . . . . . . . . . . . . . . 16 A: Detailed Methodology for Identifying State Dispensing
Fees and Calculating Medicaid Payment Amounts for Ingredients . . . . . . . . . . . . . . . . . . . . . . . . . . . . . . . . . . . . . . 16
B: Additional Information About Changes in Prices and Payment Amounts for the Top 50 Medicaid Brand-Name Drugs . . . . . . 17
C: Agency Comments . . . . . . . . . . . . . . . . . . . . . . . . . . . . . . . . . . . 19
A C K N O W L E D G M E N T S . . . . . . . . . . . . . . . . . . . . . . . . . . . . . . . . . . . . . 22

O E I - 0 3 - 1 0 - 0 0 2 6 0 R I S I N G P R I C E S F O R M E D I C A I D B R A N D - N A M E D R U G S A R E O F F S E T B Y R E B AT E S 1
I N T R O D U C T I O N
I N T R O D U C T I O N
OBJECTIVE To assess changes in prices for brand-name prescription drugs since 2005 and their potential financial impact on the Medicaid program.
BACKGROUND According to a series of reports issued by AARP, published prices for the most widely used brand-name prescription drugs have risen significantly since 2002.1 For example, one of the more recent reports found that published prices for widely used brand-name drugs increased by 9.7 percent from April 2009 to March 2010, exceeding both the inflation rate and the rate of increase for the same group of drugs during any of the previous 8 years.2 Senator Bill Nelson expressed concern over the reported price increases and requested that the Office of Inspector General (OIG) review changes in drug pricing and their effects on Government health care programs, such as Medicaid.
OIG has a long history of examining Medicaid payment amounts for prescription drugs, which are typically based on published prices like those examined in AARP’s reports. A number of OIG studies have demonstrated that these published prices, which do not represent actual transaction prices, often exceed actual drug acquisition costs.3 To address Senator Nelson’s concerns, this current study looked beyond the reported increases in published prices by examining changes in transaction-based prices, as well as the financial effect of price changes on the Medicaid program.
Medicaid Payments for Prescription Drugs
All 50 States and the District of Columbia (hereinafter referred to as States) offer prescription drug coverage under Medicaid. Beneficiaries typically obtain covered drugs from pharmacies, which bill and are
1 Reports in AARP’s Rx Watchdog series are available online at http://www.aarp.org. 2 L. Purvis and S.W. Schondelmeyer, Rx Watchdog Report: Brand Name Drug Prices Continue to Climb Despite Low General Inflation Rate, May 2010. Accessed at http://www.aarp.org on May 19, 2010. 3 OIG, Medicaid Pharmacy – Additional Analyses of the Actual Acquisition Cost of Prescription Drug Products, A-06-02-00041, September 2002; OIG, Deficit Reduction Act of 2005: Impact on the Medicaid Federal Upper Limit Program, OEI-03-06-00400, June 2007; OIG, A Comparison of Federal Upper Limit Amounts to Acquisition Costs, Medicare Payment Amounts, and Retail Prices, OEI-03-08-00490, August 2009.

O E I - 0 3 - 1 0 - 0 0 2 6 0 R I S I N G P R I C E S F O R M E D I C A I D B R A N D - N A M E D R U G S A R E O F F S E T B Y R E B AT E S 2
I N T R O D U C T I O N
reimbursed by State Medicaid agencies.4 In 2005, Medicaid paid in excess of $43 billion for prescription drugs; however, drug expenditures decreased by almost half in the following year, when drug coverage for “dual eligible” beneficiaries (i.e., beneficiaries eligible for both Medicaid and Medicare) shifted from Medicaid to Medicare Part D. Since 2006, Medicaid payments for prescription drugs have remained relatively steady. In 2009, Medicaid drug expenditures totaled approximately $26 billion (not including rebates). Brand-name drugs generally account for about 80 percent of the total dollars reimbursed.
Federal regulations require, with certain exceptions, that each State Medicaid agency’s reimbursement for covered outpatient drugs not exceed (in the aggregate) the lower of the estimated acquisition cost plus a reasonable dispensing fee or the provider’s usual and customary charge to the public.5 The Centers for Medicare & Medicaid Services (CMS) allows States the flexibility to define estimated acquisition cost, with most States basing their calculations on the average wholesale prices (AWP) or wholesale acquisition costs (WAC) published in national compendia, adjusted by a certain percentage.6, 7, 8
The AWP is not defined in law or regulation. Rather, it is a list price that is typically either suggested by the manufacturer or calculated based on a markup of another price, such as WAC.9 Pursuant to the Social Security Act (the Act), the WAC is defined as the manufacturer's list price for the drug or biological to wholesalers or direct purchasers in the United States as reported in wholesale price guides or other publications of drug or biological pricing data.10 WACs and AWPs do
4 Most States require some beneficiary cost sharing for Medicaid prescription drugs. In the fourth quarter of 2010, 40 States required copayments from beneficiaries, ranging from $0.50 to $3 per prescription. One State required certain beneficiaries to pay 2.5 percent of drug costs in the form of coinsurance (up to $300). The remaining 10 States did not require any beneficiary cost sharing for prescription drugs. 5 42 CFR § 447.512. 6 CMS, Medicaid Prescription Reimbursement Information by State – Quarter Ending December 2010, accessed at www.cms.gov on January 28, 2011. 7 States also have flexibility when determining dispensing fees. In the fourth quarter of 2010, State dispensing fees for brand-name drugs ranged from $1.50 to $10.64, excluding fees for compounded and mail-order prescriptions and intravenous therapy. 8 To limit reimbursement amounts for certain multiple-source drugs, Medicaid also uses the Federal upper limit (FUL) and State maximum allowable cost programs. 9 First Data Bank, Inc., NDDF Plus Documentation, April 2008. 10 Section 1847A(c)(6)(B) of the Act.
O E I - 0 3 - 1 0 - 0 0 2 6 0 R I S I N G P R I C E S F O R M E D I C A I D B R A N D - N A M E D R U G S A R E O F F S E T B Y R E B AT E S 3
I N T R O D U C T I O N
not represent actual transaction prices and do not include prompt pay or other discounts, rebates, or price reductions.11
The Medicaid Drug Rebate Program
For Federal payment to be available for covered outpatient drugs under Medicaid, the Act mandates that drug manufacturers enter into rebate agreements with the Secretary of Health & Human Services and pay quarterly rebates to States.12, 13
As part of the Medicaid drug rebate program, manufacturers must provide CMS with the average manufacturer price (AMP) for each of their national drug codes (NDC) on a quarterly basis.
As a result of these rebates, Medicaid recouped approximately one-third of its expenditures for prescription drugs between 2006 and 2009, yielding an average annual savings of about $8 billion.
14 An NDC is a unique 11-digit identifier that represents a specific manufacturer, product, and package size. During the period covered by this review, the AMP was generally defined in statute as the average price paid to the manufacturer for the drug in the United States by wholesalers for drugs distributed to the retail pharmacy class of trade.15, 16
The Medicaid unit rebate amount (URA) for any given drug generally depends on the quarterly AMP submitted by the manufacturer, as well as whether the drug is a brand-name or generic. Manufacturers pay a higher rebate for brand-name drugs than for generic drugs. From 1996 to 2009, the URA for a generic drug was 11 percent of the AMP and the basic URA for a brand-name drug was the greater of 15.1 percent of the
11 First Data Bank, Inc., NDDF Plus Documentation, April 2008. 12 Sections 1927(a)(1) and (b)(1) of the Act. 13 Sections 1927(k)(2–3) of the Act define a covered outpatient drug. 14 Section 1927(b)(3) of the Act. 15 Section 1927(k)(1) of the Act. 16 Section 2503 of the Patient Protection and Affordable Care Act (Affordable Care Act), P.L. 111-148, changed the definition of AMP, effective October 2010. However, those changes are not relevant for the purposes of this study.
O E I - 0 3 - 1 0 - 0 0 2 6 0 R I S I N G P R I C E S F O R M E D I C A I D B R A N D - N A M E D R U G S A R E O F F S E T B Y R E B AT E S 4
I N T R O D U C T I O N
AMP or the difference between the AMP and best price.17, 18, 19 If the AMP for a brand-name drug has risen faster than inflation, then the drug’s manufacturer must pay an additional rebate over and above the basic URA.20
CMS calculates a URA for each NDC and transmits that information to States. States then determine the total quarterly rebates that participating manufacturers owe by multiplying the URA for a specific drug by the number of units of that drug dispensed to beneficiaries in that quarter.
METHODOLOGY Scope
For this study, we selected all brand-name drugs (i.e., NDCs) used by Medicaid beneficiaries in 2009 and calculated median changes in their WACs, AMPs, and Medicaid payment amounts during the 5-year period between the first quarter of 2005 and the first quarter of 2010. Because data on Medicaid rebates were not available for 2010, we performed the same calculations described above for rebate-adjusted Medicaid
17 Section 1927(c) of the Act. 18 Pursuant to § 1927(b)(3)(A)(i)(II) of the Act, manufacturers must provide a quarterly “best price” for each of their brand-name drugs. Best price is generally defined by § 1927(c)(1)(C) of the Act as the lowest price available from the manufacturer to any purchaser in the United States, with certain exceptions. 19 Effective January 2010, § 2501(a) of the Affordable Care Act increases the URA for brand-name drugs to the greater of 23.1 percent of the AMP or the difference between AMP and best price (with certain exceptions). Section 2501(b) of the Affordable Care Act increases the URA for generic drugs to 13 percent. 20 Section 1927(c)(2) of the Act. To determine whether a brand-name drug is subject to the increased rebate amount, CMS compares the reported AMP for a given quarter to its inflation-adjusted baseline AMP. The baseline AMP for a drug is the AMP for the first quarter after the drug’s initial market date. To adjust the baseline AMP for inflation, CMS first divides the baseline AMP by the baseline consumer price index for all urban consumers (consumer price index), which is the consumer price index for the first month prior to the first quarter after the drug’s initial market date. The result of that calculation is then multiplied by the quarterly consumer price index, which is the consumer price index for the month prior to the quarter being calculated. If the reported AMP is greater than the inflation-adjusted baseline AMP, then the difference is added to the URA.

O E I - 0 3 - 1 0 - 0 0 2 6 0 R I S I N G P R I C E S F O R M E D I C A I D B R A N D - N A M E D R U G S A R E O F F S E T B Y R E B AT E S 5
I N T R O D U C T I O N
payment amounts during the 4-year period between the first quarter of 2005 and the first quarter of 2009.21
Data Sources and Data Collection
We obtained files from CMS containing Medicaid drug utilization data for the 5-year period between 2005 and 2010. These files, which were current as of July 19, 2010, included the total Medicaid expenditures (ingredient costs plus dispensing fees), the total number of prescriptions, and the total number of units dispensed by each State for each NDC in each quarter.22
As an additional source for determining whether an NDC represents a brand-name or generic drug, we downloaded the Medicaid drug product file for the second quarter of 2010 from CMS’s Web site, which was the most current file available at the time of our analysis.
In addition, CMS provided us with States’ dispensing fees for the first quarter of each year from 2005 to 2010. We also obtained CMS’s AMP data for the first quarter of each year between 2005 and 2010, including the URA for each NDC and whether that NDC represented a brand-name or generic drug. AMP data for the first quarters of 2005 through 2009 were current as of July 13, 2010. AMP data for the first quarter of 2010 were current as of May 10, 2010.
23
We obtained WACs from 2005 through 2010 from First Data Bank’s National Drug Data File. WACs were available monthly rather than quarterly; therefore, we used data from March of each year when tracking this pricing point.
To examine price trends for consumer goods in general, we used the consumer price index as calculated by the Bureau of Labor Statistics (BLS). According to BLS, the consumer price index measures “the average change over time in the prices paid by urban consumers for a
21 We were unable to obtain URAs for the first quarter of 2010 from CMS because the agency’s systems had not yet been modified to reflect the rebate changes implemented by the Affordable Care Act. In lieu of calculating and sending URAs to States to determine the rebate amounts owed by participating manufacturers, CMS instructed manufacturers to calculate and pay first-quarter 2010 rebates directly to States in accordance with the rebate changes. 22 At the time of our analysis, Arizona did not participate in the rebate program and had no reported utilization data. Therefore, Arizona was not included in our review. 23 CMS, Medicaid Drug Rebate Program Drug Product Data, accessed at http://www.cms.gov on August 10, 2010.

O E I - 0 3 - 1 0 - 0 0 2 6 0 R I S I N G P R I C E S F O R M E D I C A I D B R A N D - N A M E D R U G S A R E O F F S E T B Y R E B AT E S 6
I N T R O D U C T I O N
market basket of consumer goods and services.”24
Analysis Variables Defined
For the purposes of this study, we used the consumer price index for all items, with adjustments made for seasonal variations. Because the consumer price index is calculated monthly rather than quarterly, we used data from March of each year when tracking this measure.
For the purposes of this report, the points of comparison used to examine pricing and payment trends are defined as follows:
WACs. A WAC is a published price that does not represent actual sales transactions and does not account for price concessions. WACs and other published prices, such as AWPs, are often used by States to establish Medicaid payment amounts.25
AMPs. Generally speaking, an AMP is the average price paid by wholesalers for a drug distributed to pharmacies, accounting for certain price concessions. AMPs are based on actual sales transactions and are used to calculate Medicaid URAs.
Medicaid payment amounts. A Medicaid payment amount is the average per-unit amount jointly paid by the Federal Government and State Medicaid agencies to cover pharmacies’ ingredient costs for an outpatient prescription drug. Medicaid payment amounts do not include dispensing fees and do not account for rebates collected under the rebate program.
Rebate-adjusted Medicaid payment amounts
24 BLS, Consumer Price Index Frequently Asked Questions, accessed at
. A rebate-adjusted payment amount is the Medicaid payment amount minus the URA paid to States by manufacturers. The rebate-adjusted payment amount represents the net cost to Medicaid for an outpatient prescription drug.
http://www.bls.gov on December 8, 2010. According to BLS, the all-urban consumer group represents about 87 percent of the total U.S. population and includes “professionals, the self-employed, the poor, the unemployed, and retired people, as well as urban wage earners and clerical workers. Not included in the CPI are the spending patterns of people living in rural nonmetropolitan areas, farm families, people in the Armed Forces, and those in institutions, such as prisons and mental hospitals.” 25 We did not include AWPs in our analysis because they have typically been calculated as a markup of WACs and therefore generally have rates of change that are identical to the rates of change in WACs.

O E I - 0 3 - 1 0 - 0 0 2 6 0 R I S I N G P R I C E S F O R M E D I C A I D B R A N D - N A M E D R U G S A R E O F F S E T B Y R E B AT E S 7
I N T R O D U C T I O N I N T R O D U C T I O N
Inflation rate. The inflation rate represents changes in the consumer price index, which reflects spending patterns for almost all residents of urban or metropolitan areas for all goods and services purchased for consumption.
Analysis of All Brand-Name Drugs Reimbursed by Medicaid
Using the utilization, AMP, and drug product files, we identified 6,821 NDCs representing brand-name drugs paid for by Medicaid in 2009.26 We calculated changes in prices and payments for these drugs and compared those changes to the inflation rate.
Changes in drug prices. To capture trends in prices for brand-name drugs as a whole, we first calculated the total percentage changes in WACs and AMPs for each NDC over the entire 5-year period between the first quarter of 2005 and the first quarter of 2010. We then used first-quarter data in each year to calculate annual percentage changes in WACs and AMPs for each NDC. Using those data, we then calculated median total rates of change and median annual rates of change in WACs and AMPs for the entire group of brand-name drugs over the past 5 years. The number of Medicaid brand-name NDCs with WACs and AMPs in each year is listed in Table 1.
Table 1: Number of NDCs Included in OIG’s Analysis of Price Changes
Number of Brand-Name NDCs
First Quarter of the Year With AMPs With WACs
With Medicaid Payment Amounts
With Rebate-Adjusted
Medicaid Payment Amounts
2005 4,168 3,595 3,582 3,355
2006 4,734 4,220 4,066 3,816
2007 5,350 4,832 4,633 4,245
2008 5,932 5,436 5,219 4,594
2009 6,426 5,966 5,905 5,225
2010 6,193 6,227 5,894 N/A
OIG identified 6,821 NDCs representing brand-name drugs paid for by Medicaid in 2009. For the purposes of our study, Medicaid payment amounts represent the ingredient cost portion only. Source: OIG analysis of AMPs and Medicaid payment amounts from the first quarter of 2005 to the first quarter of 2010 and WACs from March 2005 to March 2010.
26 Four States (California, Kansas, Missouri, and New York) had utilization data for only three of the four quarters of 2009; two States (Alabama and Arkansas) had utilization data for only two of the four quarters in 2009; and one State (Wisconsin) had no utilization data for any quarter of 2009.

O E I - 0 3 - 1 0 - 0 0 2 6 0 R I S I N G P R I C E S F O R M E D I C A I D B R A N D - N A M E D R U G S A R E O F F S E T B Y R E B AT E S 8
I N T R O D U C T I O N
Changes in Medicaid payment amounts. For the first quarter of every year from 2005 to 2010, we calculated an average Medicaid payment amount per unit for each brand-name NDC.27
We calculated the total percentage change in Medicaid payment amounts for each NDC from the first quarter of 2005 to the first quarter of 2010, as well as the year-to-year percentage changes. Using those data, we then calculated median total rates of change and median annual rates of change in Medicaid payment amounts for the entire group of brand-name drugs during the 5-year period under review.
Because Medicaid’s total expenditure data include dispensing fees, we calculated the average Medicaid payment amount for only the ingredient cost by subtracting the total dispensing fees from the total expenditures for each drug. To calculate total dispensing fees, which vary by State, we multiplied each State’s dispensing fee by the total number of prescriptions dispensed for each drug in that State. We then summarized the ingredient-cost expenditures for each drug across States and divided those total expenditures by the total units. For more details regarding our calculation of ingredient costs and the use of dispensing fees, see Appendix A.
To determine the extent to which any increases in Medicaid payment amounts were offset by increases in Medicaid rebate amounts, we subtracted the URA from the average Medicaid payment amount per unit for each brand-name drug. We then calculated changes in these rebate-adjusted payment amounts. Because rebate amounts were not available for the first quarter of 2010, we were able to calculate median rates of change in rebate-adjusted payment amounts only for the 4-year period between 2005 and 2009.
The number of Medicaid brand-name NDCs with ingredient costs and rebate-adjusted reimbursement amounts is specified in Table 1.
Changes in the consumer price index
. To measure changes in the inflation rate, we calculated the total percentage change in the consumer price index over the entire 5-year period between March 2005
27 Some States did not have utilization data for the first quarter of every year between 2005 and 2010. South Dakota had no utilization data for the first quarter of 2007; Wisconsin had no utilization data for the first quarter of 2009; and Alabama, Arkansas, California, Kansas, Nevada, New York, Rhode Island, South Dakota, and Wisconsin had no utilization data for the first quarter of 2010.
O E I - 0 3 - 1 0 - 0 0 2 6 0 R I S I N G P R I C E S F O R M E D I C A I D B R A N D - N A M E D R U G S A R E O F F S E T B Y R E B AT E S 9
I N T R O D U C T I O N I N T R O D U C T I O N
and March 2010, as well as the total percentage change in the consumer price index over the 4-year period between March 2005 and March 2009. We also calculated year-to-year percentage changes in the consumer price index.
Analysis of High-Dollar Brand-Name Drugs Reimbursed by Medicaid
To determine whether pricing and payment trends differed for high-dollar Medicaid drugs, we selected the 50 NDCs representing brand-name drugs that had the highest Medicaid expenditures in 2009. We then compared the rates of change in prices and payment amounts for each of the top 50 NDCs (as calculated above) to the rates of change in prices and payment amounts for brand-name drugs as a whole.
Limitations
Because drugs reimbursed by Medicaid in 2009 may not have been marketed or covered in previous years, prices and Medicaid payment amounts were not available for all brand-name drugs in all 5 years under review. Therefore, the number of drugs in our analysis files tended to decrease as we trended back in time (see Table 1 on page 7).
We did not verify the accuracy or completeness of CMS’s data or the accuracy of data in First Data Bank’s National Drug Data File. Furthermore, AMP data submitted by manufacturers are subject to revision. Because manufacturers are generally required to report any revisions to their AMP data within 12 quarters from the quarter in which the data were initially due, some of the AMPs and URAs may have changed since the time of our analysis.
We did not evaluate the appropriateness of Medicaid payment amounts for brand-name drugs relative to pharmacy acquisition costs. Also, in calculating the per-unit net cost of drugs to Medicaid, we did not include the additional rebates that individual State Medicaid agencies are permitted to negotiate and collect from manufacturers.
Standards
This study was conducted in accordance with the Quality Standards for Inspection and Evaluation issued by the Council of the Inspectors General on Integrity and Efficiency.
O E I - 0 3 - 1 0 - 0 0 2 6 0 R I S I N G P R I C E S F O R M E D I C A I D B R A N D - N A M E D R U G S A R E O F F S E T B Y R E B AT E S 10
F I N D I N G S
-2%
0%
2%
4%
6%
8%
2005– 2006– 2007– 2008– 2009–
2006 2007 2008 2009 2010
Med
ian
Per
cent
age
Cha
nge
WAC Inflation Rate
Overall, prices and payment amounts for Medicaid brand-name drugs increased at about three times
the inflation rate between 2005 and 2010
For brand-name drugs covered by Medicaid, WACs, AMPs, and Medicaid payment amounts rose about three times faster than
the inflation rate between 2005 and 2010. Over this 5-year period, WACs for all Medicaid brand-name drugs increased 34 percent at the median, AMPs increased 40 percent at the median, and payment amounts increased 39 percent at the median. During those same 5 years, the inflation rate increased only 13 percent.
Increases in prices and payment amounts for Medicaid brand-name drugs
outpaced the inflation rate in each individual year as well
In addition to outpacing overall inflation from 2005 to 2010, median increases in WACs, AMPs, and Medicaid payment amounts outpaced the inflation rate in each of the 5 years under review.
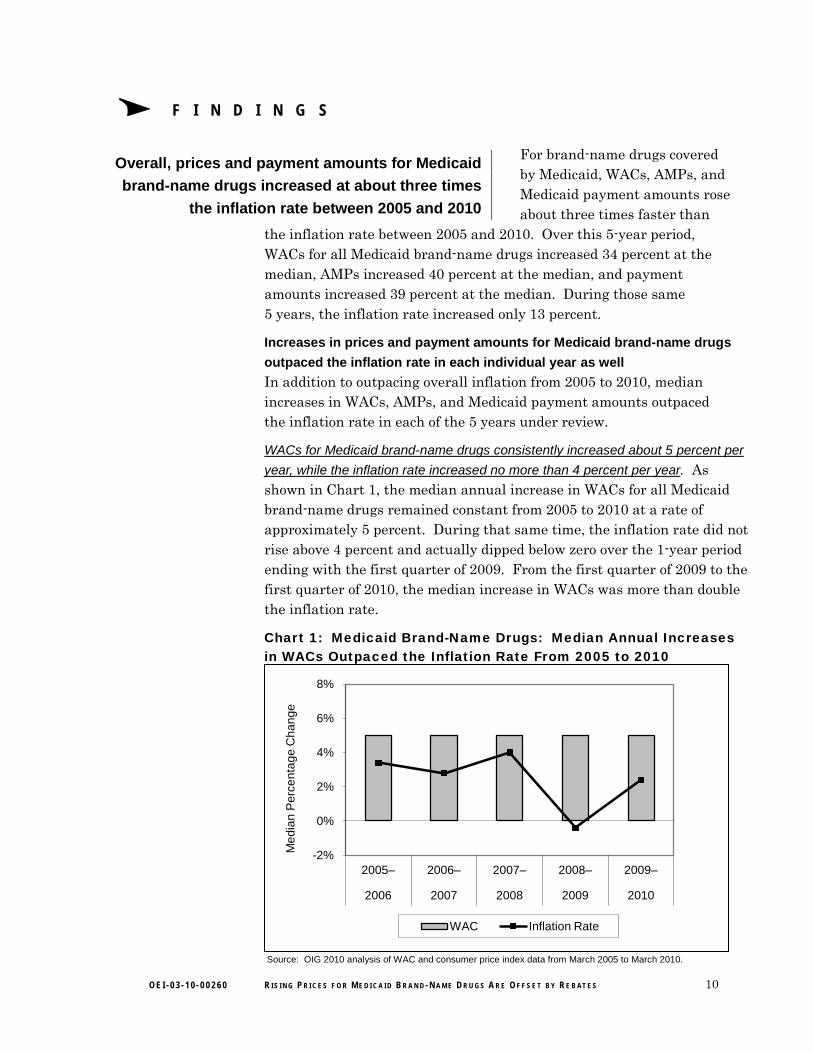
WACs for Medicaid brand-name drugs consistently increased about 5 percent per
year, while the inflation rate increased no more than 4 percent per year
. As shown in Chart 1, the median annual increase in WACs for all Medicaid brand-name drugs remained constant from 2005 to 2010 at a rate of approximately 5 percent. During that same time, the inflation rate did not rise above 4 percent and actually dipped below zero over the 1-year period ending with the first quarter of 2009. From the first quarter of 2009 to the first quarter of 2010, the median increase in WACs was more than double the inflation rate.
Chart 1: Medicaid Brand-Name Drugs: Median Annual Increases in WACs Outpaced the Inflation Rate From 2005 to 2010
Source: OIG 2010 analysis of WAC and consumer price index data from March 2005 to March 2010.
O E I - 0 3 - 1 0 - 0 0 2 6 0 R I S I N G P R I C E S F O R M E D I C A I D B R A N D - N A M E D R U G S A R E O F F S E T B Y R E B AT E S 11
F I N D I N G S
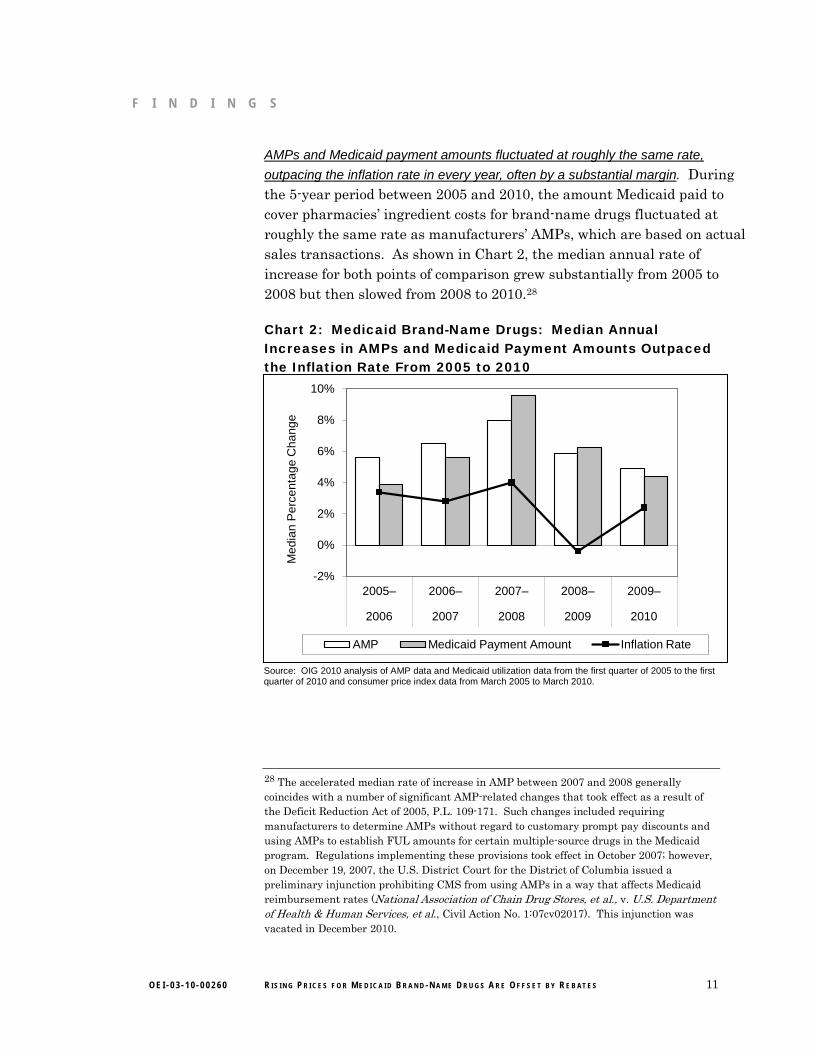
AMPs and Medicaid payment amounts fluctuated at roughly the same rate,
outpacing the inflation rate in every year, often by a substantial margin. During the 5-year period between 2005 and 2010, the amount Medicaid paid to cover pharmacies’ ingredient costs for brand-name drugs fluctuated at roughly the same rate as manufacturers’ AMPs, which are based on actual sales transactions. As shown in Chart 2, the median annual rate of increase for both points of comparison grew substantially from 2005 to 2008 but then slowed from 2008 to 2010.28
Chart 2: Medicaid Brand-Name Drugs: Median Annual Increases in AMPs and Medicaid Payment Amounts Outpaced the Inflation Rate From 2005 to 2010
-2%
0%
2%
4%
6%
8%
10%
2005– 2006– 2007– 2008– 2009–
2006 2007 2008 2009 2010
Med
ian
Per
cent
age
Cha
nge
AMP Medicaid Payment Amount Inflation Rate
Source: OIG 2010 analysis of AMP data and Medicaid utilization data from the first quarter of 2005 to the first quarter of 2010 and consumer price index data from March 2005 to March 2010.
28 The accelerated median rate of increase in AMP between 2007 and 2008 generally coincides with a number of significant AMP-related changes that took effect as a result of the Deficit Reduction Act of 2005, P.L. 109-171. Such changes included requiring manufacturers to determine AMPs without regard to customary prompt pay discounts and using AMPs to establish FUL amounts for certain multiple-source drugs in the Medicaid program. Regulations implementing these provisions took effect in October 2007; however, on December 19, 2007, the U.S. District Court for the District of Columbia issued a preliminary injunction prohibiting CMS from using AMPs in a way that affects Medicaid reimbursement rates (National Association of Chain Drug Stores, et al., v. U.S. Department of Health & Human Services, et al., Civil Action No. 1:07cv02017). This injunction was vacated in December 2010.
O E I - 0 3 - 1 0 - 0 0 2 6 0 R I S I N G P R I C E S F O R M E D I C A I D B R A N D - N A M E D R U G S A R E O F F S E T B Y R E B AT E S 12
F I N D I N G S
In each year, the median increases in AMPs and Medicaid payment amounts rose faster than the inflation rate for other consumer goods and services. As shown in Chart 2, discrepancies between the inflation rate and the two other points of comparison were greatest between 2006 and 2009, when annual median increases in AMPs and Medicaid payment amounts were at least double the increases in the consumer price index. In fact, between 2008 and 2009, AMPs and payment amounts for all Medicaid brand-name drugs each grew about 6 percent at the median while the cost of other common consumer goods and services shrank by almost half a percent.
Prices and payment amounts increased at a higher rate for the
top 50 Medicaid brand-name drugs than for brand-name drugs as a whole
For the 50 Medicaid brand-name drugs with the highest expenditures, total median increases in prices and payment amounts from 2005 to 2010 not only outpaced the inflation rate, but also outpaced total median increases in prices and payment amounts for brand-name drugs as a whole.
During the 5-year period under review, WACs and AMPs for the top 50 brand-name drugs each increased a total of 49 percent at the median and Medicaid payment amounts increased 43 percent at the median (compared to total median increases of 34 percent, 40 percent, and 39 percent, respectively, for brand-name drugs as a whole). This pattern held true not only for the top 50 drugs in the aggregate, but also for the majority of individual drugs in the top 50. For additional information about changes in prices and payment amounts for the top 50 Medicaid brand-name drugs, see Appendix B.
Significant increases in prices and payment amounts for brand-name drugs were offset by savings
generated from the Medicaid drug rebate program
We found that when the per-unit payment amounts for all Medicaid brand-name drugs were adjusted to
account for rebates paid to States by manufacturers, the per-unit net cost to Medicaid increased at a much lower rate than other points of comparison between 2005 and 2009.29 While WACs, AMPs, and unadjusted Medicaid payment amounts each increased by roughly
29 Because URAs were not available for the first quarter of 2010, we were able to examine the effects of rebates on Medicaid payment amounts only for the period from 2005 to 2009.
O E I - 0 3 - 1 0 - 0 0 2 6 0 R I S I N G P R I C E S F O R M E D I C A I D B R A N D - N A M E D R U G S A R E O F F S E T B Y R E B AT E S 13
F I N D I N G S F I N D I N G S
30 percent over the 4-year period under review and the consumer price index increased by 10 percent, rebate-adjusted Medicaid payment amounts for all brand-name drugs increased by only 2 percent. In other words, although Medicaid payment amounts for brand-name drugs rose faster at the median than inflation, rebates paid by manufacturers helped protect the program from rising costs.
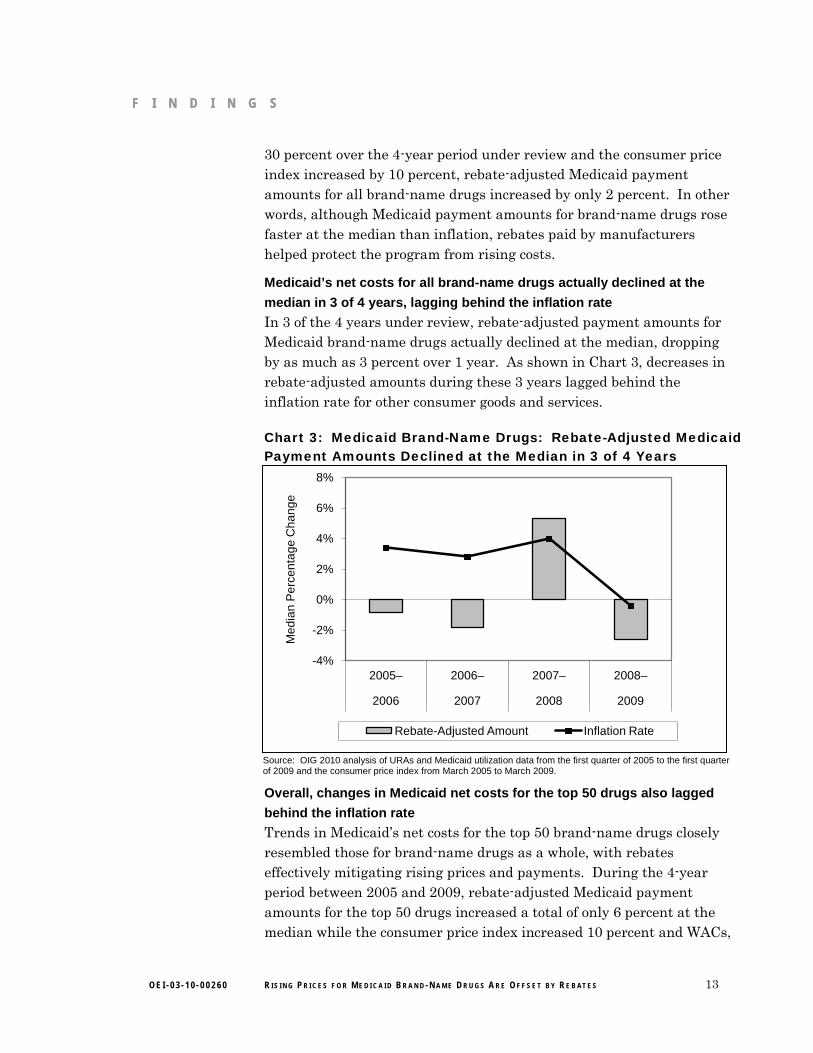
Medicaid’s net costs for all brand-name drugs actually declined at the
median in 3 of 4 years, lagging behind the inflation rate
In 3 of the 4 years under review, rebate-adjusted payment amounts for Medicaid brand-name drugs actually declined at the median, dropping by as much as 3 percent over 1 year. As shown in Chart 3, decreases in rebate-adjusted amounts during these 3 years lagged behind the inflation rate for other consumer goods and services. Chart 3: Medicaid Brand-Name Drugs: Rebate-Adjusted Medicaid Payment Amounts Declined at the Median in 3 of 4 Years
-4%
-2%
0%
2%
4%
6%
8%
2005– 2006– 2007– 2008–
2006 2007 2008 2009
Med
ian
Per
cent
age
Cha
nge
Rebate-Adjusted Amount Inflation Rate
Overall, changes in Medicaid net costs for the top 50 drugs also lagged
behind the inflation rate
Trends in Medicaid’s net costs for the top 50 brand-name drugs closely resembled those for brand-name drugs as a whole, with rebates effectively mitigating rising prices and payments. During the 4-year period between 2005 and 2009, rebate-adjusted Medicaid payment amounts for the top 50 drugs increased a total of only 6 percent at the median while the consumer price index increased 10 percent and WACs,
Source: OIG 2010 analysis of URAs and Medicaid utilization data from the first quarter of 2005 to the first quarter of 2009 and the consumer price index from March 2005 to March 2009.
O E I - 0 3 - 1 0 - 0 0 2 6 0 R I S I N G P R I C E S F O R M E D I C A I D B R A N D - N A M E D R U G S A R E O F F S E T B Y R E B AT E S 14
F I N D I N G S
AMPs, and unadjusted Medicaid payment amounts each increased by more than a third.
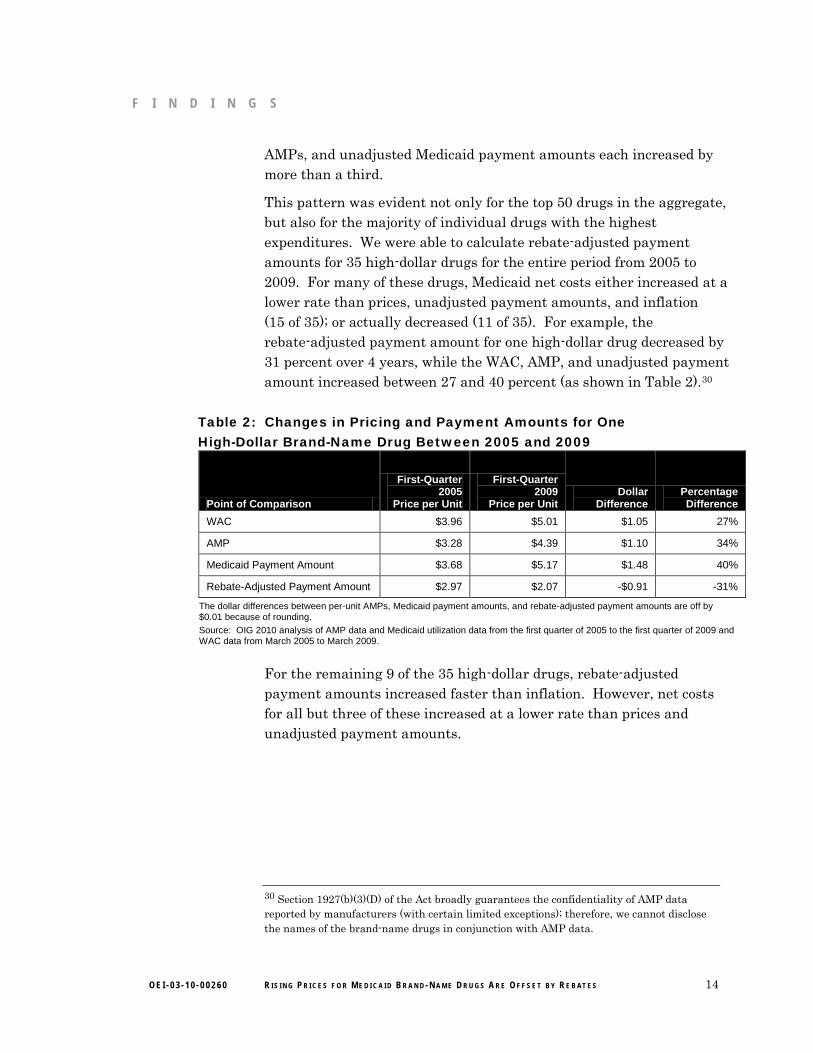
This pattern was evident not only for the top 50 drugs in the aggregate, but also for the majority of individual drugs with the highest expenditures. We were able to calculate rebate-adjusted payment amounts for 35 high-dollar drugs for the entire period from 2005 to 2009. For many of these drugs, Medicaid net costs either increased at a lower rate than prices, unadjusted payment amounts, and inflation (15 of 35); or actually decreased (11 of 35). For example, the rebate-adjusted payment amount for one high-dollar drug decreased by 31 percent over 4 years, while the WAC, AMP, and unadjusted payment amount increased between 27 and 40 percent (as shown in Table 2).30
Table 2: Changes in Pricing and Payment Amounts for One High-Dollar Brand-Name Drug Between 2005 and 2009
Point of Comparison
First-Quarter 2005
Price per Unit
First-Quarter 2009
Price per Unit Dollar
Difference Percentage Difference
WAC $3.96 $5.01 $1.05 27%
AMP $3.28 $4.39 $1.10 34%
Medicaid Payment Amount $3.68 $5.17 $1.48 40%
Rebate-Adjusted Payment Amount $2.97 $2.07 -$0.91 -31%
The dollar differences between per-unit AMPs, Medicaid payment amounts, and rebate-adjusted payment amounts are off by $0.01 because of rounding. Source: OIG 2010 analysis of AMP data and Medicaid utilization data from the first quarter of 2005 to the first quarter of 2009 and WAC data from March 2005 to March 2009.
For the remaining 9 of the 35 high-dollar drugs, rebate-adjusted payment amounts increased faster than inflation. However, net costs for all but three of these increased at a lower rate than prices and unadjusted payment amounts.
30 Section 1927(b)(3)(D) of the Act broadly guarantees the confidentiality of AMP data reported by manufacturers (with certain limited exceptions); therefore, we cannot disclose the names of the brand-name drugs in conjunction with AMP data.
O E I - 0 3 - 1 0 - 0 0 2 6 0 R I S I N G P R I C E S F O R M E D I C A I D B R A N D - N A M E D R U G S A R E O F F S E T B Y R E B AT E S 15
C O N C L U S I O N
A series of reports issued by AARP found that average increases in WACs for the most widely used brand-name prescription drugs far surpassed the price increases for other consumer goods and services. Given that Medicaid drug reimbursement amounts are typically based on published prices, such as WACs, AARP’s findings raised concerns about the effects of the reported price increases on the Medicaid program.
Taken as a whole, the results of our study indicate that price increases for brand-name drugs may not necessarily translate to corresponding increases in Medicaid costs. Much like AARP, we found that median increases in WACs for Medicaid brand-name drugs outpaced the inflation rate during the 5-year period under review, as did AMPs and the amounts Medicaid paid to cover pharmacies’ ingredient costs. However, these increases were offset by rebates that manufacturers paid to States. Because of the savings generated by the rebate program, Medicaid’s net costs for brand-name drugs actually increased at a lower rate than other points of comparison, including the inflation rate. Furthermore, States may have been deriving even greater benefit from the rebate program since January 2010, when the rebate percentage for brand-name drugs increased from 15.1 percent to 23.1 percent.
AGENCY COMMENTS AND OFFICE OF INSPECTOR GENERAL RESPONSE CMS expressed its belief that the Medicaid drug rebate program has been effective in helping to offset the increasing cost of drugs in the Medicaid program. CMS also offered two technical comments, both of which reiterated information provided by OIG in the body of the report. We did not make any changes to the report based on CMS’s comments.
For the full text of CMS’s comments, see Appendix C.

O E I - 0 3 - 1 0 - 0 0 2 6 0 R I S I N G P R I C E S F O R M E D I C A I D B R A N D - N A M E D R U G S A R E O F F S E T B Y R E B AT E S 16
A P P E N D I X ~ B A P P E N D I X ~ A
Detailed Methodology for Identifying State Dispensing Fees and Calculating Medicaid Payment Amounts for Ingredients
Generally speaking, State Medicaid agencies reimburse pharmacies for the ingredient costs of prescription drugs and for the costs of dispensing those drugs to beneficiaries. However, the Centers for Medicare & Medicaid Services’ Medicaid utilization data do not provide separate expenditure data for ingredient costs and dispensing fees; rather, they provide only the total Medicaid expenditures for each drug in each State. To identify trends in ingredient costs for Medicaid brand-name drugs over the 5-year period between the first quarter of 2005 and the first quarter of 2010, it was necessary to subtract the total dispensing fees from the total expenditures for each national drug code (NDC) included in our study.
Dispensing fees vary by State, and each State may have different dispensing fees for different types of drugs dispensed in different types of settings. For the purposes of our study, we selected only those dispensing fees provided to outpatient, for-profit retail, and independent pharmacies. Dispensing fees provided to nursing or long-term-care facilities were excluded from our analysis, as were dispensing fees for compounded drugs, unit dose drugs, and intravenous therapy. Six States (Alaska, Nebraska, Tennessee, Texas, Utah, and Washington) had dispensing fees that could not easily be determined; therefore, utilization data from these States were excluded from our analysis. Dispensing fees for the remaining States ranged from $1.75 to $7.25.
For the first quarter of each year from 2005 to 2010, we calculated total dispensing fees for each NDC in each State by multiplying the State’s dispensing fee by the total number of prescriptions dispensed in that State. To identify total ingredient-cost expenditures for each NDC, we then subtracted the total dispensing fees from the total expenditures. We excluded any NDCs for which the ingredient cost was negative (assuming that this was the result of problematic expenditures data). To calculate an average Medicaid payment amount per unit for each brand-name NDC in our study, we then summarized the ingredient-cost expenditures for each drug across States and divided those total expenditures by the total units.
O E I - 0 3 - 1 0 - 0 0 2 6 0 R I S I N G P R I C E S F O R M E D I C A I D B R A N D - N A M E D R U G S A R E O F F S E T B Y R E B AT E S 17
A P P E N D I X ~ B
Additional Information About Changes in Prices and Payment Amounts for the Top 50 Medicaid Brand-Name Drugs
For the top 50 Medicaid brand-name drugs, median annual increases in prices and unadjusted payment amounts not only outpaced the inflation rate, but also generally outpaced annual increases in wholesale acquisition costs (WAC), average manufacturer prices (AMP), and Medicaid payment amounts for brand-name drugs as a whole.
As shown in Chart B-1a, median annual changes in WACs for the top 50 drugs trended upward from 2005 to 2010, increasing from a low of approximately 6 percent in the first 2 years to a high of over 10 percent in the fifth year. In contrast, median changes in WACs for brand-name drugs as a whole remained relatively constant at about 5 percent, so that by 2010 the median increase in WACs for drugs in the top 50 was double that for brand-name drugs as a whole.
AMPs also typically increased at a higher rate for drugs in the top 50, particularly during the last 2 years under review. Between 2008 and 2010, median rates of increase for AMPs rose steadily for high-dollar drugs but declined steadily for brand-name drugs as a whole. As shown in Chart B-1b, AMPs for the top 50 drugs increased 11 percent at the median by 2010, whereas AMPs for all brand-name drugs increased only about 5 percent.
Trends in median payment amounts for high-dollar drugs somewhat resembled those for brand-name drugs as a whole, with median rates of increase growing from 2005 to 2009 and declining from 2009 to 2010. However, as shown in Chart B-1c, median changes in unadjusted payment amounts were greater for the top 50 drugs, outpacing those for all brand-name drugs in 4 of the 5 years under review.

O E I - 0 3 - 1 0 - 0 0 2 6 0 R I S I N G P R I C E S F O R M E D I C A I D B R A N D - N A M E D R U G S A R E O F F S E T B Y R E B AT E S 18
A P P E N D I X ~ B
Chart B-1. Median Increases in WACs, AMPs, and Medicaid Payment Amounts Were Generally Greater for High-Dollar Drugs
a. WACs
b. AMPs
c. Medicaid Payment Amounts
0.0%
2.0%
4.0%
6.0%
8.0%
10.0%
12.0%
2005– 2006– 2007– 2008– 2009–
2006 2007 2008 2009 2010
Med
ian
Per
cent
age
Cha
nge
All
Top 50
0.0%
2.0%
4.0%
6.0%
8.0%
10.0%
12.0%
2005– 2006– 2007– 2008– 2009–
2006 2007 2008 2009 2010
Med
ian
Per
cent
age
Cha
nge
All
Top 50
0.0%
2.0%
4.0%
6.0%
8.0%
10.0%
12.0%
2005– 2006– 2007– 2008– 2009–
2006 2007 2008 2009 2010
Med
ian
Per
cent
age
Cha
nge
All
Top 50
Source: Office of Inspector General 2010 analysis of WACs, AMP, and Medicaid utilization data from 2005 to 2010.

A P PEN D x c
Agency Comments
(~~ DEPARTMENT OF HEALTH & HUMAN SERVICES Centers for Medicare & Medioaid Services
,S'r- Administrator Washinglon. DC 20201
JUN 2 9 2011DATE:
TO: Daniel R. Levinson Inspector General
FROM: Donald M. Berwick, M:D. Administrator
SUBJECT: Office of Inspector General (OlG) Draft Report: Medicaid Brand-Name Drugs: Rising Prices are Offset by Manufacturer Rebates (OEI-03-IO-00260)
Thank you for the opportunity to review and comment on the OlG Draft Report entitled, "Medicaid Brand-Name Drugs: Rising Prices are Offset by Manufacturer Rebates," (OEI-03-1000260). This report assesses changes in prices for brand-name prescription drugs since 2005 and their potential financial impact on the Medicaid program. The basis for the report was a series of reports issued by the American Association of Retired Persons (AARP) indicating that published prices for the most widely used brand-name prescription drugs have risen Significantly since 2002, substantially outpacing inflation. To address Congressional concerns, this study looked beyond published prices to transaction based prices and Medicaid payments.
While the OlG confirmed the AARP findings that price and payment amount increases did exceed the rate of inflation, the OIG also found that price increases for brand-name drugs do not necessarily translate to corresponding increases in costs for the Medicaid program. The OlG stated that the price and payment increases were offset by the Medicaid drug rebate amounts that manufacturers paid to States.
Specifically, the OIG found that overall, prices and payment amounts for Medicaid brandname drugs increased at about three times the general rate of inflation between 2005 and 2010. Over this 5-year period, the OIG stated that Wholesale Acquisition Cost (WAC), Average Manufacturer Price (AMP), and Medicaid payment amounts increased between 34 percent and 40 percent at the median, while the general inflation rate increased only 13 percent. In addition to outpacing the overall inflation rate, the OlG stated that these amounts outpaced the general inflation rate in each of the 5 years under review. The 01G also reported that the total median increases in prices and payment amounts for the 50 Medicaid brand-name drugs with the .highest expenditures also outpaced general inflation rate as well as outpaced total increases in prices and payment amounts for brand-name drugs as a whole.
However, the OIG noted that these increases in prices and payment amounts for brand-name drugs were offset by savings generated from the Medicaid. Drug Rebate Program. When the per
OEI·03·10-00260 RISING PRICES FOR MEDICAID BRAND-NAME DRUGS ARE OFFSET BY REBATES 19

O E I - 0 3 - 1 0 - 0 0 2 6 0 R I S I N G P R I C E S F O R M E D I C A I D B R A N D - N A M E D R U G S A R E O F F S E T B Y R E B AT E S 20
A P P E N D I X ~ C

O E I - 0 3 - 1 0 - 0 0 2 6 0 R I S I N G P R I C E S F O R M E D I C A I D B R A N D - N A M E D R U G S A R E O F F S E T B Y R E B AT E S 21
A P P E N D I X ~ C
O E I - 0 3 - 1 0 - 0 0 2 6 0 R I S I N G P R I C E S F O R M E D I C A I D B R A N D - N A M E D R U G S A R E O F F S E T B Y R E B AT E S 22
A C K N O W L E D G M E N T S
This report was prepared under the direction of Robert A. Vito, Regional Inspector General for Evaluation and Inspections in the Philadelphia regional office, and David Tawes, Director of the Medicare and Medicaid Prescription Drug Unit.
Lauren McNulty served as the team leader for this study. Central office staff who contributed include Kevin Manley.

Office of Inspector General http://oig.hhs.gov
The mission of the Office of Inspector General (OIG), as mandated by Public Law 95-452, as amended, is to protect the integrity of the Department of Health & Human Services (HHS) programs, as well as the health and welfare of beneficiaries served by those programs. This statutory mission is carried out through a nationwide network of audits, investigations, and inspections conducted by the following operating components:
Office of Audit Services The Office of Audit Services (OAS) provides auditing services for HHS, either by conducting audits with its own audit resources or by overseeing audit work done by others. Audits examine the performance of HHS programs and/or its grantees and contractors in carrying out their respective responsibilities and are intended to provide independent assessments of HHS programs and operations. These assessments help reduce waste, abuse, and mismanagement and promote economy and efficiency throughout HHS.
Office of Evaluation and Inspections The Office of Evaluation and Inspections (OEI) conducts national evaluations to provide HHS, Congress, and the public with timely, useful, and reliable information on significant issues. These evaluations focus on preventing fraud, waste, or abuse and promoting economy, efficiency, and effectiveness of departmental programs. To promote impact, OEI reports also present practical recommendations for improving program operations.
Office of Investigations The Office of Investigations (OI) conducts criminal, civil, and administrative investigations of fraud and misconduct related to HHS programs, operations, and beneficiaries. With investigators working in all 50 States and the District of Columbia, OI utilizes its resources by actively coordinating with the Department of Justice and other Federal, State, and local law enforcement authorities. The investigative efforts of OI often lead to criminal convictions, administrative sanctions, and/or civil monetary penalties.
Office of Counsel to the Inspector General The Office of Counsel to the Inspector General (OCIG) provides general legal services to OIG, rendering advice and opinions on HHS programs and operations and providing all legal support for OIG’s internal operations. OCIG represents OIG in all civil and administrative fraud and abuse cases involving HHS programs, including False Claims Act, program exclusion, and civil monetary penalty cases. In connection with these cases, OCIG also negotiates and monitors corporate integrity agreements. OCIG renders advisory opinions, issues compliance program guidance, publishes fraud alerts, and provides other guidance to the health care industry concerning the anti-kickback statute and other OIG enforcement authorities.