Embed Size (px)
Citation preview
12 Upper Grosvenor Street, London, W1K 2ND ~ Tel +44 (20) 7208-1400 Fax: +44 (20) 7208-1401 ~ www.odey.com
Authorised and Regulated by the Financial Conduct Authority
■ In February-16 the EUR class returned -10.8% against the MSCI Daily
TR Net Europe (EUR) return of -2.2%.
■ After currency hedging the short equity book made a negative
contribution for the month (-6.3%). Positive contributions before
currency hedging came from a number of positions including Coloplast
(+23bps), Banco Popular Espanol (+18bps) and LafargeHolcim (+17bps).
These were outweighed by the negative contributions, the most notable of
which were attributable to Anglo American (-215bps), Las Vegas Sands
(-45bps) and Royal Dutch Shell (-38ps).
■ The long equity book made a negative contribution after currency
hedging (-5.5%). The largest positive contributions before currency
hedging came from Randgold Resources (+38bps), Sibanye Gold (+35bps)
and Shiseido (+27bps). These were outweighed by negative contributions,
the worst of which came from Nokia (-92bps), Sky (-80bps) and Bank of
America (-46bps).
■ Elsewhere, active currencies returned -0.4% while government bonds and
commodities returned +0.1% and +1.4% respectively.
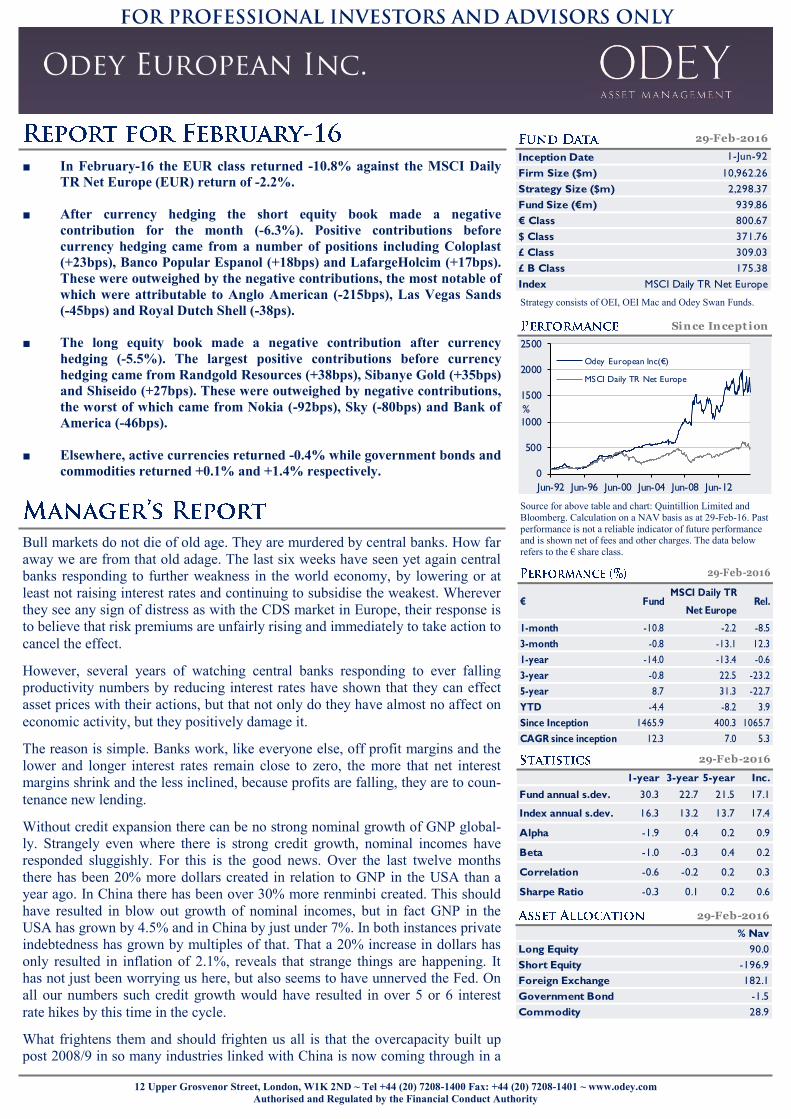
Source for above table and chart: Quintillion Limited and
Bloomberg. Calculation on a NAV basis as at 29-Feb-16. Past
performance is not a reliable indicator of future performance and is shown net of fees and other charges. The data below
refers to the € share class. Bull markets do not die of old age. They are murdered by central banks. How far
away we are from that old adage. The last six weeks have seen yet again central
banks responding to further weakness in the world economy, by lowering or at
least not raising interest rates and continuing to subsidise the weakest. Wherever
they see any sign of distress as with the CDS market in Europe, their response is
to believe that risk premiums are unfairly rising and immediately to take action to
cancel the effect.
However, several years of watching central banks responding to ever falling
productivity numbers by reducing interest rates have shown that they can effect
asset prices with their actions, but that not only do they have almost no affect on
economic activity, but they positively damage it.
The reason is simple. Banks work, like everyone else, off profit margins and the
lower and longer interest rates remain close to zero, the more that net interest
margins shrink and the less inclined, because profits are falling, they are to coun-
tenance new lending.
Without credit expansion there can be no strong nominal growth of GNP global-
ly. Strangely even where there is strong credit growth, nominal incomes have
responded sluggishly. For this is the good news. Over the last twelve months
there has been 20% more dollars created in relation to GNP in the USA than a
year ago. In China there has been over 30% more renminbi created. This should
have resulted in blow out growth of nominal incomes, but in fact GNP in the
USA has grown by 4.5% and in China by just under 7%. In both instances private
indebtedness has grown by multiples of that. That a 20% increase in dollars has
only resulted in inflation of 2.1%, reveals that strange things are happening. It
has not just been worrying us here, but also seems to have unnerved the Fed. On
all our numbers such credit growth would have resulted in over 5 or 6 interest
rate hikes by this time in the cycle.
What frightens them and should frighten us all is that the overcapacity built up
post 2008/9 in so many industries linked with China is now coming through in a
Strategy consists of OEI, OEI Mac and Odey Swan Funds.
Since Incept ion
0
500
1000
1500
2000
2500
Jun-92 Jun-96 Jun-00 Jun-04 Jun-08 Jun-12
%
Odey European Inc(€)
MSCI Daily TR Net Europe
€ FundMSCI Daily TR
Net EuropeRel.
1-month -10.8 -2.2 -8.5
3-month -0.8 -13.1 12.3
1-year -14.0 -13.4 -0.6
3-year -0.8 22.5 -23.2
5-year 8.7 31.3 -22.7
YTD -4.4 -8.2 3.9
Since Inception 1465.9 400.3 1065.7
CAGR since inception 12.3 7.0 5.3
29-Feb-2016
1-year 3-year 5-year Inc.
Fund annual s.dev. 30.3 22.7 21.5 17.1
Index annual s.dev. 16.3 13.2 13.7 17.4
Alpha -1.9 0.4 0.2 0.9
Beta -1.0 -0.3 0.4 0.2
Correlation -0.6 -0.2 0.2 0.3
Sharpe Ratio -0.3 0.1 0.2 0.6
29-Feb-2016
29-Feb-2016
% Nav
Long Equity 90.0
Short Equity -196.9
Foreign Exchange 182.1
Government Bond -1.5
Commodity 28.9
Inception Date
Firm Size ($m) 10,962.26
Strategy Size ($m) 2,298.37
Fund Size (€m) 939.86
€ Class 800.67
$ Class 371.76
£ Class 309.03
£ B Class 175.38
Index MSCI Daily TR Net Europe
29-Feb-2016
1-Jun-92
12 Upper Grosvenor Street, London, W1K 2ND ~ Tel +44 (20) 7208-1400 Fax: +44 (20) 7208-1401 ~ www.odey.com
Authorised and Regulated by the Financial Conduct Authority
severe credit down cycle. An unwillingness to countenance closure of capacity, even as new capacity was still being added, in
the face of prices that were far below fair value, have ensured these industries have ongoing losses which are still not abating.
And this is where it gets interesting, because these losses are undermining the loans that these industries have. As bonds due
for redemption trade below par, companies are drawing down credit lines, which would usually be the signal that bankruptcies
would follow. However, because of the very weak profitability of the banking sector, these banks are not able to absorb these
losses. As they wait, their loan becomes the cash to pay back the bonds and their losses expand. Banks now need rights issues
but the central banks’ attention remains on trying to lower rates to reflect falling productivity. There is thus no story to attach
to a rights issue for a bank. The only way that the banks would be a buy is if interest rates were to go up, repricing assets rela-
tive to deposits, but that can never be because down that route lies recession. And strangely recessions are no longer permitted.
However, negative productivity rates are already telling the central banks that any growth in nominal GNP is the equivalent of
eating your capital.
Central banks can ignore the CDS market, but they cannot imagine away the losses coming through the system. They cannot
save the banks now, without creating a recession, with all the consequences that has for bad loans and falls in GNP. The fall in
productivity is already encouraging companies to eschew capital spending in favour of buy backs, which compounds the prob-
lem of credit growing faster than the economy. In a world of negative productivity growth it is absolutely sensible for compa-
nies to buy back their shares, and indeed buybacks have accounted for 82% of US net notional buying YTD*, just as it is abso-
lutely sensible in a deflationary world for individuals to be selling shares, which is exactly what they have been doing. Profit
margins are naturally falling as wages rise faster than prices and overcapacity rules out pricing power. No wonder that central
banks feel that they are nearly out of ammunition. There is not a good choice to be made.
Markets need equilibrium to prosper. When the authorities have a problem, markets have a problem. We have been hurt by this
rally in China-related companies, and indeed we reduced the gross and net positioning of the fund significantly in mid-March,
to help reduce the short term volatility of the fund, but we remain convinced that China is in many ways in an even greater
bind over policy than the developed world. By mid-March the fund was rising and falling by over 5% per day. At which point
this was no longer an investment market but a battlefield. On the day that Draghi came out with his massive market support
operation, the stock markets rose 2.5% and then closed down 1.5% on their lows. Imagine how painful it was to see the mar-
kets bounce the next day and celebrate his success. At that point I reduced the short book by a third and the long book by 10%.
Despite this strong rally, there is, aside from a pickup in government spending in China, little to support growth in the world
economy. Everything from rising default rates in the booming auto financing industry to new lows in LNG, dry bulk shipping
prices, points to slowdown everywhere.
For equity markets, a world without credit is for now a deflationary world. The underperformance of the banking, insurance
and asset management industry warn that this is when equities can de-rate as the Japanese stock market did between ’96 and
’98.
*BofA Merrill Lynch Research, published w/c 21-Mar-2016.
12 Upper Grosvenor Street, London, W1K 2ND ~ Tel +44 (20) 7208-1400 Fax: +44 (20) 7208-1401 ~ www.odey.com
Authorised and Regulated by the Financial Conduct Authority
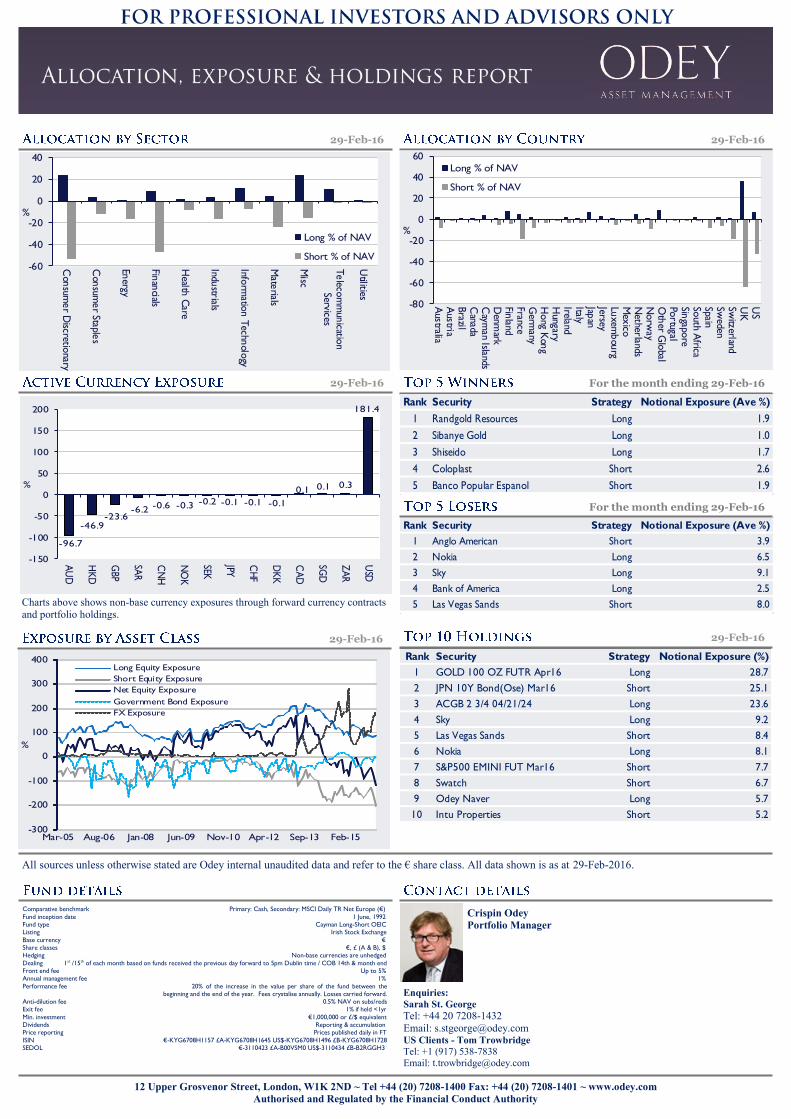
Charts above shows non-base currency exposures through forward currency contracts and portfolio holdings.
29-Feb-16
29-Feb-16
29-Feb-16 29-Feb-16
Comparative benchmark Primary: Cash, Secondary: MSCI Daily TR Net Europe (€)
Fund inception date 1 June, 1992 Fund type Cayman Long-Short OEIC Listing Irish Stock Exchange
Base currency € Share classes €, £ (A & B), $ Hedging Non-base currencies are unhedged
Dealing 1st /15th of each month based on funds received the previous day forward to 5pm Dublin time / COB 14th & month end Front end fee Up to 5% Annual management fee 1%
Performance fee 20% of the increase in the value per share of the fund between the beginning and the end of the year. Fees crystalise annually. Losses carried forward. Anti-dilution fee 0.5% NAV on subs/reds Exit fee 1% if held <1yr
Min. investment €1,000,000 or £/$ equivalent Dividends Reporting & accumulation Price reporting Prices published daily in FT
ISIN €-KYG6708H1157 £A-KYG6708H1645 US$-KYG6708H1496 £B-KYG6708H1728 SEDOL €-3110423 £A-B00VSM0 US$-3110434 £B-B2RGGH3
29-Feb-16
For the month ending 29-Feb-16
For the month ending 29-Feb-16
Enquiries:
Sarah St. George
Tel: +44 20 7208-1432
Email: [email protected] US Clients - Tom Trowbridge
Tel: +1 (917) 538-7838
Email: [email protected]
Crispin Odey
Portfolio Manager
All sources unless otherwise stated are Odey internal unaudited data and refer to the € share class. All data shown is as at 29-Feb-2016.
-60
-40
-20
0
20
40
Con
sumer D
iscretionary
Con
sumer Staple
s
Energy
Finan
cials
Health
Care
Industrials
Inform
ation T
echnolo
gy
Mate
rials
Misc
Teleco
mm
unicatio
nServices
Utilities
%
Long % of NAV
Short % of NAV
-80
-60
-40
-20
0
20
40
60
Australia
Austria
Brazil
Canada
Caym
an IslandsD
enmark
Finland
FranceG
ermany
Hong K
ong
Hungary
IrelandItalyJap
anJerseyLu
xembou
rgM
exico
Netherlands
Norw
ayO
ther G
lobal
Portugal
Singapo
reSo
uth Africa
SpainSw
edenSw
itzerlandU
KU
S
%
Long % of NAV
Short % of NAV
-300
-200
-100
0
100
200
300
400
Mar-05 Aug-06 Jan-08 Jun-09 Nov-10 Apr-12 Sep-13 Feb-15
%
Long Equity Exposure
Short Equity Exposure
Net Equity Exposure
Government Bond Exposure
FX Exposure
Rank Security Strategy Notional Exposure (%)
1 GOLD 100 OZ FUTR Apr16 Long 28.7
2 JPN 10Y Bond(Ose) Mar16 Short 25.1
3 ACGB 2 3/4 04/21/24 Long 23.6
4 Sky Long 9.2
5 Las Vegas Sands Short 8.4
6 Nokia Long 8.1
7 S&P500 EMINI FUT Mar16 Short 7.7
8 Swatch Short 6.7
9 Odey Naver Long 5.7
10 Intu Properties Short 5.2
-96.7
-46.9-23.6
-6.2 -0.6 -0.3 -0.2 -0.1 -0.1 -0.1
0.1 0.1 0.3
181.4
-150
-100
-50
0
50
100
150
200
AU
D
HK
D
GBP
SAR
CN
H
NO
K
SEK
JPY
CH
F
DK
K
CA
D
SGD
ZA
R
USD
%
Rank Security Strategy Notional Exposure (Ave %)
1 Randgold Resources Long 1.9
2 Sibanye Gold Long 1.0
3 Shiseido Long 1.7
4 Coloplast Short 2.6
5 Banco Popular Espanol Short 1.9
Rank Security Strategy Notional Exposure (Ave %)
1 Anglo American Short 3.9
2 Nokia Long 6.5
3 Sky Long 9.1
4 Bank of America Long 2.5
5 Las Vegas Sands Short 8.0
12 Upper Grosvenor Street, London, W1K 2ND ~ Tel +44 (20) 7208-1400 Fax: +44 (20) 7208-1401 ~ www.odey.com
Authorised and Regulated by the Financial Conduct Authority
This communication is for information purposes only and it is not intended to be viewed as a piece of independent investment research.
© 2016 Odey Asset Management LLP (“OAM”) has approved this communication which is for private circulation only, and in the UK is directed to persons who are professional clients or eligible
counterparties for the purposes of the Conduct of Business Sourcebook of the Financial Conduct Authority of the United Kingdom (the “FCA”) and it is not intended for and must not be distributed
to retail clients. It does not constitute an offer to sell or an invitation to buy or invest in any of the securities or funds mentioned herein and it does not constitute a personal recommendation or
investment taxation or any other advice. For the avoidance of doubt, while not authorised by the FCA, the Fund is a recognised scheme pursuant to section 264 of the Financial Services and Markets
Act 2000 of the United Kingdom (the “Act”). The information and any opinions have been obtained from or are based on sources believed to be reliable, but accuracy cannot be guaranteed. The
capital you invest is at risk and you may lose some or all the money you invest. Past performance does not guarantee future results and the value of all investments and the income derived therefrom
can decrease as well as increase. Investments that have an exposure to currencies other than the base currency of the Fund may be subject to exchange rate fluctuations. This communication and the
information contained therein may constitute a financial promotion for the purposes of the ACT and the rules of the FCA. The distribution of this communication may, in some countries, be restrict-
ed by law or regulation. Accordingly, anyone who comes into possession of this communication should inform themselves of and observe these restrictions. OAM is not liable for a breach of such
restrictions or for any losses relating to the accuracy, completeness or use of information in this communication, including any consequential loss. Please always refer to the Fund’s prospectus before
you invest. OAM whose company No. is OC302585 and whose registered office is at 12 Upper Grosvenor Street, London, W1K 2ND, is authorised and regulated by the
Financial Conduct Authority.
The investment objective of the Fund is capital appreciation. The Investment Manager seeks to achieve this objective principally through managing a portfolio of securities, bonds and currencies and related financial instruments. The Investment Manager expects that the Fund's investments will tend, over time, to be weighted towards European
securities with investments in non-European securities subject to the limits set out in the Investment Objective and Policy section of the prospectus.
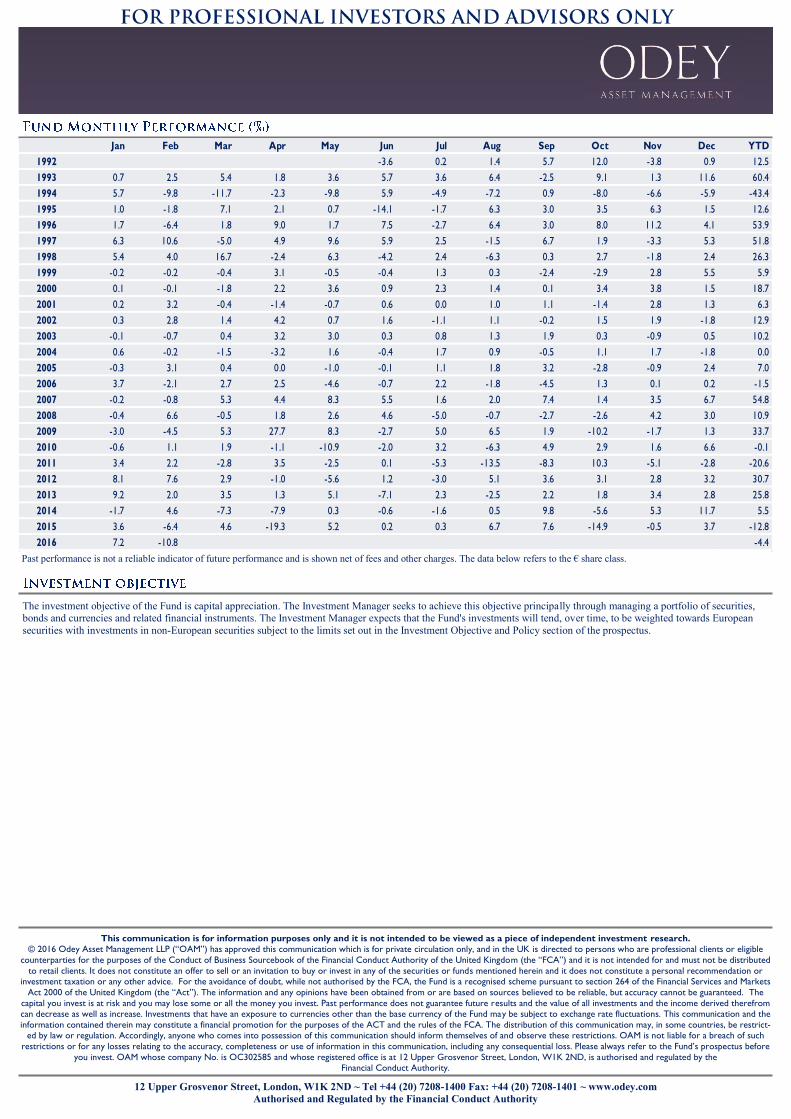
Past performance is not a reliable indicator of future performance and is shown net of fees.
Jan Feb Mar Apr May Jun Jul Aug Sep Oct Nov Dec YTD
1992 -3.6 0.2 1.4 5.7 12.0 -3.8 0.9 12.5
1993 0.7 2.5 5.4 1.8 3.6 5.7 3.6 6.4 -2.5 9.1 1.3 11.6 60.4
1994 5.7 -9.8 -11.7 -2.3 -9.8 5.9 -4.9 -7.2 0.9 -8.0 -6.6 -5.9 -43.4
1995 1.0 -1.8 7.1 2.1 0.7 -14.1 -1.7 6.3 3.0 3.5 6.3 1.5 12.6
1996 1.7 -6.4 1.8 9.0 1.7 7.5 -2.7 6.4 3.0 8.0 11.2 4.1 53.9
1997 6.3 10.6 -5.0 4.9 9.6 5.9 2.5 -1.5 6.7 1.9 -3.3 5.3 51.8
1998 5.4 4.0 16.7 -2.4 6.3 -4.2 2.4 -6.3 0.3 2.7 -1.8 2.4 26.3
1999 -0.2 -0.2 -0.4 3.1 -0.5 -0.4 1.3 0.3 -2.4 -2.9 2.8 5.5 5.9
2000 0.1 -0.1 -1.8 2.2 3.6 0.9 2.3 1.4 0.1 3.4 3.8 1.5 18.7
2001 0.2 3.2 -0.4 -1.4 -0.7 0.6 0.0 1.0 1.1 -1.4 2.8 1.3 6.3
2002 0.3 2.8 1.4 4.2 0.7 1.6 -1.1 1.1 -0.2 1.5 1.9 -1.8 12.9
2003 -0.1 -0.7 0.4 3.2 3.0 0.3 0.8 1.3 1.9 0.3 -0.9 0.5 10.2
2004 0.6 -0.2 -1.5 -3.2 1.6 -0.4 1.7 0.9 -0.5 1.1 1.7 -1.8 0.0
2005 -0.3 3.1 0.4 0.0 -1.0 -0.1 1.1 1.8 3.2 -2.8 -0.9 2.4 7.0
2006 3.7 -2.1 2.7 2.5 -4.6 -0.7 2.2 -1.8 -4.5 1.3 0.1 0.2 -1.5
2007 -0.2 -0.8 5.3 4.4 8.3 5.5 1.6 2.0 7.4 1.4 3.5 6.7 54.8
2008 -0.4 6.6 -0.5 1.8 2.6 4.6 -5.0 -0.7 -2.7 -2.6 4.2 3.0 10.9
2009 -3.0 -4.5 5.3 27.7 8.3 -2.7 5.0 6.5 1.9 -10.2 -1.7 1.3 33.7
2010 -0.6 1.1 1.9 -1.1 -10.9 -2.0 3.2 -6.3 4.9 2.9 1.6 6.6 -0.1
2011 3.4 2.2 -2.8 3.5 -2.5 0.1 -5.3 -13.5 -8.3 10.3 -5.1 -2.8 -20.6
2012 8.1 7.6 2.9 -1.0 -5.6 1.2 -3.0 5.1 3.6 3.1 2.8 3.2 30.7
2013 9.2 2.0 3.5 1.3 5.1 -7.1 2.3 -2.5 2.2 1.8 3.4 2.8 25.8
2014 -1.7 4.6 -7.3 -7.9 0.3 -0.6 -1.6 0.5 9.8 -5.6 5.3 11.7 5.5
2015 3.6 -6.4 4.6 -19.3 5.2 0.2 0.3 6.7 7.6 -14.9 -0.5 3.7 -12.8
2016 7.2 -10.8 -4.4
Past performance is not a reliable indicator of future performance and is shown net of fees and other charges. The data below refers to the € share class.