Embed Size (px)
Citation preview
i
Department of Chemical Engineering
National Institute of Technology Rourkela
December 19, 2016
Certificate of Examination
Roll Number: 614CH3003
Name: Shreeparna Mishra
Title of Dissertion: Preparation and characterization of Cassia-4 Hydroxy-benzoic acid resin for
removal of Cr+6 from contaminated water
We the below signed, after checking the dissertation mentioned above and the official record
book(s) of the student, hereby state our approval of the dissertation submitted in partial
fulfilment of the requirements of the degree of M.Tech (Research) in Chemical Engineering at
National Institute of Technology Rourkela. We are satisfied with the volume, quality,
correctness, and originality of the work.
Prof .Abanti Sahoo Prof. Susmita Mishra
Chairman Principal Supervisor
Prof. Arvind Kumar Prof. Aditya Kumar
Member, DSC Member, DSC
Sudipta Sen Prof. Parmesh Kumar Chaudhari
Member, DSC External Examiner
Prof. R.K Singh
Head of the Department

ii
Department of Chemical Engineering
National Institute of Technology Rourkela
Prof. Susmita Mishra December 19, 2016
Associate Professor
Supervisors’ Certificate
This is to certify that the work presented in the dissertation entitled “Preparation and
characterization of Cassia-4 Hydroxy-benzoic acid resin for removal of Cr+6 from contaminated
water” submitted by Shreeparna Mishra, Roll Number 614CH3003, is a record of original
research carried out by her under my supervision and guidance in partial fulfillment of the
requirements of the degree of M.Tech (Research) in Chemical Engineering. Neither this
dissertation nor any part of it has been submitted earlier for any degree or diploma to any
institute or university in India or abroad.
Prof. Susmita Mishra
Associate Professor

iii
Dedication
This thesis is dedicated to my parents; the
reason of what I become today, thanks for
your continuous support and intensive care,
this honorable work is a symbol of my love
and respect towards you.
Shreeparna Mishra

iv
Declaration of Originality
I, Shreeparna Mishra, Roll Number 614CH3003, hereby declare that this dissertation
entitled “Preparation and characterization of Cassia-4 Hydroxy-benzoic acid resin for removal
of Cr+6 from contaminated water” presents my original work carried out as a M.Tech (Research)
student of NIT Rourkela and, to the best of my knowledge, contains no material previously
published or written by another person, nor any material presented by me for the award of any
degree or diploma of NIT Rourkela or any other institution. Any contribution made to this
research by others, with whom I have worked at NIT Rourkela or elsewhere, is explicitly
acknowledged in the dissertation. Works of other authors cited in this dissertation have been
duly acknowledged under the section “Reference”. I have also submitted my original research
records to the scrutiny committee for evaluation of my dissertation.
I am fully aware that in case of any non-compliance detected in future, the Senate of
NIT Rourkela may withdraw the degree awarded to me on the basis of the present dissertation.
December 19, 2016
NIT Rourkela Shreeparna Mishra

v
Acknowledgment
I sincerely thank my supervisor, Prof. Susmita Mishra for guiding me into this research field
and for their constant help, encouragement, and endless support on my research work. Her
care and enlightenment strengthened me in every progress of this work.
I would like to express my profound gratitude to my D.S.C members Prof. Abanti Sahoo,
Prof. Arvind Kumar, Prof. Aditya Kumar, and Prof.Sudipta Sen for their valuable suggestions in
several occasions during my research work. I would like to acknowledge the department of
Chemical Engineering, National Institute of Technology (NIT), Rourkela for providing me various
facilities throughout my research work.
During my M.Tech.(Research) work, I am very much grateful to my friends especially
Krutika Lokapriya Routray, Shilpi Das, Pallavi Suhashinee Behera , Suresh Sir, Harinandan
Kumar for their kind care, selfless help, and the deep friendship.
Finally, I wish to express my hearted appreciation to my family. Their deep love,
understanding, constant support and encouragement over the years are the great impetus to my
research.
December 19, 2016 Shreeparna Mishra
NIT Rourkela Roll Number: 614CH3003

vi
Abstract
The current research emphasizes on removal of Cr+6 from the contaminated water by the
preparation of natural resin using cassia gum powder and testing its feasibility to reduce Cr+6in
contaminated water. The effects of various process parameters including pH of the solution,
amount of resin, initial Cr+6 concentration, contact time etc., on removal efficiency of Cr+6 from
the water stream has been studied. The study demonstrates that the prepared natural CHBA
resin has potential to remediate Cr+6 from the drinking water. It is observed that using 1g/ml
resin 99.26% Cr+6 could be removed from initial concentration 3 ppm at pH 6.8 within 25 min.
Experimental data obtained were allowed to fit to various models such as pseudo first order
model, pseudo second order, intra particle diffusion, Elovich model. Results indicate that the
process of adsorption on Cr+6 was followed by second order kinetic model with R2 value
0.989.Similarly other models of adsorption isotherms such as Langmuir, Freundlich, Temkin
were also applied to the data and constants of isotherms were calculated. Cr+6
adsorption on
the prepared resin shows good agreement to Freundlich adsorption isotherm model with the
regression coefficient of 0.989. Thermodynamics parameter studied that the Positive values of
change in enthalpy shows that there is a presence of an energy barrier during the process of
adsorption and the process of adsorption follows process of endothermic reaction. The positive
values in the change of entropy (∆S) shows good binding capacity of Cr+6 ions for the resin
surface and it also increases the uncertainty of the solid solution interaction during the process
of adsorption.
RSM experiments were also conducted which showed that the ideal conditions required
for Cr+6 adsorption were as per the following: amount of resin as (0.43 g), at pH (6.13) as well as
Initial Concentration of (4.53 mg/L) with the value of maximum adsorption is 95.05%. The
following results were obtained from the box-behenkn design RSM method with a desirability of
0.989. The Column performances were also evaluated by varying the amount of resin inside the
column bed, influent rate of flow with Cr+6 concentrations. Furthermore it was seen that with the
expansion in height or depth of the bed, at lower flow rates and at low Cr+6concentration the
column performance was good or proved to be better.
Keywords: Resin, Cr+6 removal, wastewater treatment, adsorption

vii
CONTENTS
Certificate ………………………………………………………………………………….……..i
Dedication ………………………………………………………………………………………..ii
Declaration of originality ………………………………………………………………………iii
Acknowledgement ………………………………………………………………………..…….iv
Abstract ……………………………………………………………………………………...……v
CHAPTER 1
INTRODUCTION ...................................................................................... 1
CHAPTER 2
LITERATURE REVIEW ............................................................................ 6
2.1 IMPORTANCE OF Cr+6.............................................................................................. 6
2.2 TOXICITY OF Cr+6 ................................................................................................... 10
2.3 MUTAGENICITY ...................................................................................................... 10
2.4 CARCINOGENICITY................................................................................................ 10
2.5 Cr+6 REGULATIONS ................................................................................................ 11
2.6 METHODS TO REMOVE Cr+6 ............................................................................... 111
2.6.1 MEMBRANE SEPARATION ........................................................................... 111
2.6.2 ADSORPTION ................................................................................................... 12
2.6.3 BIOSORPTION................................................................................................ 122
2.6.4 ION-EXCHANGE ............................................................................................. 133
2.7 OBJECTIVES ......................................................................................................... 155
CHAPTER 3
MATERIALS AND METHODS .............................................................. 166
3.1 PREPARATION OF ADSORBENT ....................................................................... 166
3.1.1 PREPARATION OF RESIN............................................................................. 166
3.2 CHARACTERIZATION OF ADSORBENT ............................................................ 177
3.2.1 FTIR ANALYSIS .............................................................................................. 177
3.2.2 CHNS ANALYSIS ............................................................................................ 188

viii
3.2.3 NITROGEN CONTENT ................................................................................... 188
3.2.4 TOTAL ION EXCHANGE CAPACITY ............................................................. 188
3.2.5 MOISTURE CONTENT ..................................................................................... 18
3.3 CHEMICALS .......................................................................................................... 199
3.4 STOCK SOLUTION PREPARATION ...................................................................... 19
3.5 METHODOLOGY ................................................................................................... 199
3.6 ADORPTION MECHANISMS ................................................................................ 200
3.7 ADSORPTION ISOTHERMS................................................................................. 211
3.7.1 FREUNDLICH ISOTHERM ............................................................................. 211
3.7.2 LANGMUIR ISOTHERMS ............................................................................... 211
3.7.3 TEMKIN ISOTHERM ....................................................................................... 222
3.7.4 DUBININ–RADUSHKEVICH ISOTHERM....................................................... 222
3.8 ADSORPTION KINETIC STUDIES ....................................................................... 233
3.8.1 PSEUDO-FIRST ORDER MODEL.................................................................. 233
3.8.2 PSEUDO-SECOND ORDER MODEL ............................................................ 233
3.8.3 INTRAPARTICLE DIFFUSION STUDY .......................................................... 244
3.8.4 ELOVICH MODEL ........................................................................................... 244
3.9 THERMODYNAMIC FACTORS ............................................................................ 244
3.10 FIXED BED ADSORPTION STUDIES ................................................................ 255
3.11 ANALYSIS OF COLUMN DATA .......................................................................... 266
3.12 MODELING OF FIXED BED COLUMN STUDIES ON RESINS (CHBA) ........... 277
3.12.1 THOMAS MODEL ......................................................................................... 277
3.12.2 THE ADAMS AND BOHART MODEL........................................................... 288
3.12.3 YOON – NELSON MODEL ............................................................................. 28
CHAPTER 4
CHARACTERISATION STUDIES ......................................................... 300
4.1 CHARACTERISATION OF ADSORBENT ............................................................ 300
4.1.1 FTIR ANALYSIS .............................................................................................. 300
4.2 ELEMENTAL ANALYSIS ....................................................................................... 322
4.3 NITROGEN CONTENT.......................................................................................... 322
4.4 ION-EXCHANGE CAPACITY ................................................................................ 333
4.5 MOISTURE CONTENT.......................................................................................... 333

ix
4.6 BATCH ADSORPTION STUDIES ......................................................................... 333
4.6.1 EFFECT OF PARAMETERS........................................................................... 333
4.6.1.1 EFFECT OF ADSORBENT DOSE....……………………………………….33
4.6.1.2 EFFECT OF pH...……………………….…………………………………….34
4.6.1.3 EFFECT OF CONTACT TIME..............…………………………………….35
4.6.1.4 EFFECT OF Cr+6 CONCENTRATION....……….……….……….………....36
4.6.1.5 ADSORPTION ISOTHERMS...…………………..………………………….36
4.6.1.6 KINETIC STUDIES...………………………………………………………....39
4.6.1.7 THERMODYNAMICS STUDIES...…………………………………………..43
CHAPTER 5
BATCH STUDY- DESIGN OF EXPERIMENTS...................................... 454
5.1 RESULTS AND DISCUSSIONS ............................................................................ 465
5.1.1 STATISTICAL ANALYSIS ............................................................................... 465
5.1.2 MODEL ADEQUACY....................................................................................... 487
5.1.3 FITTING OF SECOND-ORDER POLYNOMIAL EQUATION AND STATISTICAL
ANALYSIS .................................................................................................................. 49
5.1.4 MODEL VALIDATION ..................................................................................... 510
5.1.5 INTERACTION EFFECT OF PROCESS PARAMETERS.............................. 532
CHAPTER 6
RESULTS AND DISCUSSION- COLUMN ADSORPTION ..................... 576
6.1 EFFECT OF PARAMETERS ................................................................................. 576
6.1.1 EFFECT OF BED HEIGHT ............................................................................. 576
6.1.2 EFFECT OF SUPERFICIAL VELOCITY......................................................... 587
6.1.3 EFFECT OF INLET CONCENTRATION …………………….………....….……58
6.2 REGENERATION STUDIES ................................................................................... 60
6.3 MODELING OF BREAKTHROUGH CURVE ........................................................ 610
6.3.1 THOMAS MODEL ........................................................................................... 610
6.3.2 YOON-NELSON MODEL ................................................................................ 632
6.3.3 ADAM- BOHART MODEL ............................................................................... 643
CONCLUSIONS .................................................................................... 676
SCOPE OF FUTURE WORK………………………………………………………………….68
REFERENCES………………………………………………………………………………69-75
DISSSEMINATION……………………………………………………………..………………76

x
LIST OF FIGURES
3.1 Preparation of epoxypropyl ether of cassia
3.2 Preparation of Cassia 4-hydroxybenzoic acid(CHBA)resin
3.3 Calibration plot for Cr+6
3.4 Packed bed experimental setup
4.1 FTIR analysis without adsorption
4.2 FTIR analysis of (CHBA) resin with adsorption
4.3 Effect of Resin dosage on % removal
4.4 Effect of pH on % removal
4.5 Effect of Contact time on % removal.
4.6 Effect of Initial concentration on % removal
4.7 Freundlich adsorption Isotherm for Cr+6
on CHBA resin of 0.1 g, 0.5 g
and 1 g resin
4.8 Langmuir adsorption Isotherm for Cr+6 on CHBA resin of 0.1 g, 0.5 g
and 1 g
4.9 Temkin adsorption Isotherm for Cr+6 on CHBA resin of 0.1 g-1 g
4.10 Pseudo first order kinetics at different concentrations
4.11 Pseudo second order kinetics at different concentrations
4.12 Elovich model at different concentrations
4.13 Interaparticle diffusion study at different concentrations
4.14 Vant Hoff plot for the adsorption of Cr+6 at various temperatures
5.1 Normal probability plot of residuals for Defective percentage
5.2 Residuals versus Predicted for Defective percentage
5.3 Scatter diagram of predicted response versus actual response of
Cr+6 removal
5.4 Perturbation plot showing adsorption %
5.5 3D response surface graph for Cr+6 removal versus adsorbent dose
(g/L) and pH for Adsorption of CHBA resin
5.6 3D response surface graph for Cr+6 removal versus adsorbent dose
(g/L) and initial concentration for Adsorption of CHBA resin
5.7 3D response surface graph for Cr+6 removal versus adsorbent pH
and initial concentration for Adsorption of CHBA resin

xi
6.1 Effect of bed height
6.2 Effect of flow rate
6.3 Effect of inlet Cr+6 concentration
6.4 Plot of Regeneration
6.5 Regeneration at different Cr+6 concentrations
6.6 Effect of bed height in Thomas model
6.7 Effect of Flow rate in Thomas model
6.8 Effect of Flow Rate in Yoon-nelson model
6.9 Effect of Bed-height in Yoon-nelson model
6.10 Effect of Flow rate in Adam-Bohart Model
6.11 Effect of Flow rate in Adam-Bohart Model

xii
LIST OF TABLES
2.1 Industrial wastewater containing Cr+6
2.2 Permissible limits of Cr+6in different water resources
4.1 FTIR analysis of (CHBA) resin
4.2 FTIR analysis of (CHBA) resin after Cr+6 adsorption
4.3 CHNS ANALYSIS
4.4 Isotherm Parameters for the removal of Cr+6using CHBA resin at
different resin dosages
4.5 Kinetic Parameters for the removal of Cr+6 using CHBA resin at
different Concentrations
4.6 Thermodynamic Parameters values for the adsorption of resin on
Cr+6 at different temperatures
5.1 Coded and actual values of variables of the experimental design.
for removing Cr+6
5.2 Experimental and the predicted values yields for removing Cr+6
5.3 Adequacy of the model tested
5.3 Lack of Fit Tests
5.4 Model Summary Statistics
5.5 ANOVA of the second-order polynomial equation
6.1 Parameters from column studies
6.2 Parameters using Thomas Model
6.3 Parameters obtained from Yoon Nelson Model
6.4 Parameters obtained from Adam Bohart Model

1
Chapter 1
INTRODUCTION
Disposal of industrial effluent contaminated with heavy metals typically Cr+6is a serious
environmental issue as it ultimately gain access to surface and ground water which may be
used for drinking purpose. This pollutant is released into the water bodies by discharges from
textile industries, industries of leather tanning, electroplating as well as metal finishing. It also
causes detrimental effects at a point when its respective concentration of 0.1 mg/g is achieved
by the body and has been considered as lethal [1]. Hence various regulatory bodies have
enforced strict regulation for discharge of cr+6 to the water bodies and its permissible limit has
been stated as 0.05 ppm [2].
Thus to mitigate these pollutant released into the water bodies various techniques have
been adopted which includes coagulation, flocculation, electrolytic reduction, biodegradation
etc. The greater part of these techniques experiences the ill effects of certain demerits like high
sludge production, handling and disposal problem, slow process etc. Membrane separation
process is yet another method adopted to remove cr+6
from the waste stream that works at high
pressure, is quite expensive and is incapable to treat larger volumes of waste water. However
adsorption using various adsorbents has been widely used by the researchers. Various low cost
natural adsorbents such as activated charcoal, wheat grain, activated neem leaf powder
prepared from activated carbon and groundnut shell powder, Orange Peel, Avena monida (oat),
sawdust, rice husk, Papaya wood , maize leaf, modified sawdust of walnut, cocoa shells, have
been successfully used by authors to reduce Cr+6from the waste water [3,4,5,6,7,8]. Many
researchers have worked with activated carbon and have successfully reduced Cr+6
to
permissible limits. All these adsorbents has a major demerit as it requires regeneration, results
in loss of adsorbents and is limited to applications for Cr+6 removal at low pH(<2) [9]. Hence
resins have been a good alternative to reduce Cr+6.It possess great mechanical properties, good
imperviousness to ecological degradation, great glue like properties, low shielding properties
,low shrinkage, easy and quick curing etc. It has been used extensively to treat drinking water
due to its important properties such as applicability at neutral pH and capability to treat low
concentration of pollutant.

2
The resins are categorized commonly into two types which can be utilized to detoxify
polluted water as in the form of synthetic and natural resin. The hydrophobic nature can only be
seen with the resins which are prepared from divinyl benzene-styrene [10]. Resins which are
synthesized mainly from products of petrochemicals, are quite expensive. The two important
parameters like the functional groups residing in the resin as well as pH of the respective
solution is totally dependent on their capacity of Ion-exchange .Thiol, thiourea, dithionite,
aspartate and triisobutyl phosphine sulfide are the widely used functional groups which are
effectively used for different metal ions removals [11, 12, 13, 14, 15]. Some of the important
properties of Ion exchange resins are they are hydrophobic in nature and are non-
biodegradable. This is because of the reason of the expansion in the costs of petrochemical
items so that Natural man-made materials could be used instead of this ion exchange resins.
Tamarind kernel powder, Guar gum Powder, Xanthium gum powder, Sesbania gum powder etc.
[16] are extensively used natural products which have been employed for the treatment of
waste water by removing several metal ions Such materials are biodegradable as well as are
less costly. A few metals holds resins consisting of a series of complexing or chelating lignin’s
that have been accounted to adequately remove overwhelming metal ions [17] . Several groups
like Amino, thio, Oxo, carboxyl, phosphoryl, has been already proposed and established.
Among these groups, amino/carboxyl group can provide highest adsorption of metals [18, 19].
Later on, it was proposed that amino group can accommodate large number of vacant sites for
the process of adsorption to occur [20].
Henceforth an effective sorbent with high limit and high rate of adsorption requires
higher area around the surface of the adsorbent [21]. Due to the increment in contamination
level in the water, these types of new materials are thus being employed. Thus Cassia gum
powder, a characteristic material which can be found through the seeds of endosperm of Cassia
tora and cassia obtusifolia that has a place in leguminosae family has been utilized to
synthesize natural resin. This tree is generally developed in tropical area and has high
therapeutic quality.
Optimization of process parameter on adsorption of Cr+6 on the resin has been reported
by many authors [22] has demonstrated experiment on adsorption of Cr+6 using Lewatit FO36
ion-exchange resin by varying pH from 5.0–8.0 and reported adsorption of maximum capacity
when the pH is adjusted to 6.0. Influence of adsorbent dosage has been identified utilizing
resins containing cationic exchange like IRN77 and SKN1 and As the resin amount was

3
increased from 0.050 to 0.1g shows change in adsorption behavior of Cr+6 [23]. Contact time
plays a major role in the effective Cr+6 adsorption on resin as reported by various authors [24].
The time after which there is no further adsorption of Cr+6 on the resin was attained at 30 min
and that time is known as the equilibrium time. Similarly influence of Cr+6 concentrations
affected the Percentage removal. It was found the highest removal of 99.4% of the removal was
obtained by keeping the process parameters at initial concentration of 100ppm [25]. Cr+6
adsorption data has been verified by established isotherms such as Freundlich, Langmuir,
Temkin, D-R models [26].
Thus this research reports the feasibility of removal of Cr+6 ions from water using cassia
gum powder resin. Various process parameters such as amount of resin, effect of time, effect
of pH, effect of Cr+6 concentration has been studied to test the removal of Cr+6 by the prepared
CHBA resin using batch experiments . Column study to explore its design parameters has been
also studied. Various model equations has been used to fit the experimental data too.

4
ORGANIZATION OF THESIS:
Chapter 1 consists of introduction to Cr+6 and its toxicity, properties, sources of release, its
permissible limits and remediation methods. Use of resins for Cr+6 removals by various
researchers and advantage of using natural resins has been discussed in brief. It highlights the
optimization of process parameters to effectively reduce Cr+6 from the waste water.
Chapter 2 includes Literature Review which describes the toxicity of Cr+6, the permissible limits
of Cr+6 in various water resources, Various methods which has been adopted by the researchers
for the effective removal of Cr+6 such as Membrane Separation, Bisorption, Ion-Exchange,
Reverse osmosis, Adsorption etc. Various methods followed by the researchers using various
raw materials to mitigate Industrial wastewater containing Cr+6. Treatment of Cr+6 contaminated
water by adsorption through resins has been discussed in details. Various applications of
natural materials to prepare natural resins has been documented. Application of natural resins
to reduce heavy metals has been reported.
Chapter 3 consists of Materials and methods that reports all the chemicals required for the
preparation of Cassia 4-hydroxy benzoic acid resin, characterization of the resin using various
analytical instruments, various instruments required to carry out the experimental procedure and
preparation of stock solution for the study of batch experiments. It also deals with the
explanation of adsorption isotherms and Kinetic models. Besides, it describes various proposed
models to fit the column study data.
Chapter 4 deals with the results and discussions of the batch experiments being conducted. It
reports various model parameters when fitted to various adsorption isotherms such as
Freundlich, Langmuir, and Temkin etc. The kinetic experimental data were fitted to Pseudo-first
order, Pseudo- second order, intra-particle diffusion, elovich model and has been analysed.
Chapter 5 deals with the adsorption of the Cr+6 from water by Cassia 4-hydroxy benzoic acid
resin using statistical tool. Optimization of experimental parameters was achieved through
Response Surface methodology by Box-Behnken design tool.

5
Chapter 6 consists of the results and discussions of the continuous fixed-bed column system
and adsorption modelling including Thomas model, Yoon-Nelson Model and Adam –Bohart
Model etc.
Chapter 7 provides conclusions relating to resin characterization, batch study, column study, as
well as Box-Behnken Design.

6
Chapter 2
Literature Review
2.1 IMPORTANCE OF Cr+6
Rapid development in population growth by the method of mining, extraction and use of
several metals from industrial and domestic resources increases toxicity to a greater extent
because of the production of various metal ions in the atmosphere. The areas around the
metallurgical industries consist of wastes which deteriorates the environment. On the other hand
some of these heavy metals, in traces, show a substantial part in the human metabolic rate. The
demand of Cr+6 ought to be growing worldwide due to its widespread usage in several industries
including metallurgy, leather tanning and chemical processing as they have different physical
and chemical properties. Some of its essential uses are enumerated below:
Cr+6 have a property of resistance to corrosion due to which it can be used to harden
steel, stainless steel and alloys.
The electro-plating industry uses Cr+6 as it provides a shining surface and used for
hardening.
Used in glasses for greenish tint.
Used for Preparation of catalysts.
Used as an oxidizing agent.
Cr+6
being widely textile industry uses Cr+6
in the form of astringent.
An aircraft industry uses Cr+6 to get rid of corrosion which could be used as an
anodizing.
Used in refractory industry to give a definite shape in the formation of aluminum bricks
because of its high melting point, stable crystalline structure and moderate thermal
expansion.
Used as an agent for melting furnaces.
Used in leather tanning industries.
Cr+3 play a major role in our body [27]. Absence of Cr+6 in our body fails to utilize protein
content, sugar content and fat content that results in severe loss of weight and improper growth

7
of the body, inadequate function of nervous system and diabetic situations. Contribution of Cr+6
is to regulate blood sugar with the help of insulin by way of radio tracing. When the glucose level
of the body becomes high, the protein hormone known as insulin controls it by regulating blood
inside the body.
Cr+6 are merchandized all over the world market in the forms of high quality ore with
transitional ferrochrome because of its capability of handling different metallurgical commercial
units. Different grades of ferrochrome have been utilized to get finished yields of modern skill.
The use of other metals like co, Ni, V2O3, has been replaced with Cr+6 to make steels made up
of alloys. Yet these are not known well because of their irrelevant advantages over Cr+6 like high
cost. Thus, Cr+6 is said to be an essential element which is required to make refractory bricks
and stainless steels by mixing metals in the alloy steels.
Deposits of Cr+6 in India can be found from Eastern Ghats [28] consisting group of rocks
particularly in states of Andhra Pradesh and Tamilnadu. While deposits of iron ore known as
(Dharwad) group can be obtained from states of Bihar, Orissa, Karnataka and Maharashtra.
Few chromite deposits can also be found in Manipur, Nagaland and Assam.
Reports shows that Orissa consists about 98% of the total deposits of chromite in India
mainly found in the belts of Sukinda valley near Jajpur district and belts of Baula-Nuasahi near
Bhadrak district. Sukinda valley is situated at a zone covering 50 km in the east to west
bordered by Mahagiri and Daitary ranges. There are total reserves of around 130 million tons of
chromite zones found in India Chromite’s are found under a depth of about 50-250 meters.
Present pollution scenario due to chromium in Orissa
Chromite reserves are found to be about 88.35 million tons in India from which about 35
million tons is recovered from metallurgical grades and about 78.4 million tons from mining
activities. Low-quality ores is mostly used by chemical industry whereas high quality chromite is
traced near the belts of Sukinda. The area under Sukinda is sharply worsened due to which
there is a need for export of high-quality chromite and there is also a need of modification in the
raw material so that ferrochrome or other chrome alloys are used to acquire value-added
products. Due to the enhancement of price in raw materials and inadequate availability of
chromite, domestic market utilizes high quality ores for the large scale production of chrome.
The environment gets deteriorated by the discharge of Cr+6 effluents from mining industries. The
details regarding discharge of the pollutants from various industries are given below:

8
A) Mining industries
The air consists of an enormous amount of dust which is discharged into the atmosphere
through blasting, stacking, mining, loading and transport. Different surfaces for example area
surrounding the forest canopy where the dust gets deposited can be drained out by rainfall.
Here, chromite is mostly found in the form of dusts. The exposure to dust creates an influence
on the respiratory channels of labors and occupants, which are received from the mines, cannot
be controlled by the use of Water sprinkling technique. Water obtained from the mining
operation is poisonous. Although Cr+6 occur in a trivalent state present in a chromite but
biochemical conversions leads to the formation of some Cr+6 ions. Despite of insufficient
treatment, the polluted water discharging from mines enters into the neighboring water
resources. According to the measures taken by the Govt. regulatory bodies, chemical treatment
methods was followed only by a few mining industries because of its higher cost involved.
B) Metallurgical industries
Dust: Due to the discharge of the dust into the atmosphere from handling of ore,
reduction of arc, generation of power etc., immense measures are taken into account for the
control of these dusts but the measures taken were not proved to be a satisfactory.
Slag: Cr+6 compounds are available in various valence states from the slag which has
been disposed of over the ground. During the rainfall, Cr+6 saturates into the subsoil or physical
water sources because of some chemical transformation. The obtained ferrochrome slags from
the subsoil are allowed to get destroyed and drained out so as to recuperate the observing
ferrochrome and the waste is disposed of in low lying terrains and pits. In this procedure some
of the sludge is also produced which contaminates the water.
Water: Cooling water is allowed to blend with bichromate to use it in the process of
cooling water towers for the prevention of the developed fungal growth or contagious Treatment
of this water is essential to get rid of contaminated water which creates pollution.
C) Chemical industries (mainly bichromate manufactures)
Slag/Residue: Some of the sparingly soluble chromates and calcium carbonate are
produced during the removal of chromates from the deposits. These soluble chromates being
produced enters into the water bodies and form landfills slag which worsen the human health.

9
Dust: Dust unconfined after the process of roasting generates Cr+6 of higher
concentration liberating dust to a larger extent that has a negative impact on the labors or
workers health. Some traces of Cr+6 as a dust were also found in the nearby zones.
Water: Cr+6 is present in higher amount in the water bodies which leads to the
contamination of various water resources.
D) Others
i) Leather tanning: Nowadays, leather industry is utilizing Cr+6 sulphates for tanning. During this
process, Cr+6 extracted from chromates is almost found in its trivalent state so it cannot be
defined as the main reason of concern. However, utilization of chromic acid or bichromate is
required for the effective treatment of removal of Cr+6 from wastewater.
ii) Electroplating: Many electroplating industries have been developed due to which it’s quite
difficult to get adequate information. The wastewater contains high amounts of Cr+6 due to which
labors are prone to airborne diseases.
A study has been conducted and it was observed that higher traces of chromium from
the mines water resides in the sediments of river Brahmani and Dhamra at the meeting point of
Bay of Bengal [29].It is proved from the investigation that the wastes generated from
metallurgical, chemical and refractory industries consists Cr+6 to a larger extent which is much
higher as compared to the suggested limit for discharge. Cr+6 is found in higher amounts of
about(0.252 to 2.8 mg/L) from open-pit areas and under-ground mining areas which was
collected according to a survey done by RRL Bhuvneshwar in the year of 2000.The water
discharged from the aquatic bodies is used by the villagers for public, national and irrigation
purposes.
Plant and harvests life are greatly affected by the generation of Cr+6 from the mines and
traces of Cr+6 is found mostly in their parts like roots, stems and fruits. Roughly roots of plants
consists Cr+6 of about 60 mg/g, shoots of 14.5 mg/g Cr+6 and seeds of the plants consists about
2 mg/g which are the conditions required for growth of rice plant. Ferrochrome contains less
Cr+6 comparatively to Cr+6 sulfate, Cr+6dichromate and hence generates less pollution. Discharge
of Cr+6 from these wastes deteriorates the atmosphere

10
2.2 TOXICITY OF Cr+6
Trivalent Chromium (Cr+3) and hexavalent chromium (Cr+6) are the two forms of Cr+6
available in the earth’s crust. Cr+6 essentially prove to be more contaminated than Cr+3. The
main organ which is affected by the toxicity of Cr+6
is known as respiratory tract and this organ is
exposed to acute and chronic respiration problems. On severe exposure to Cr+6, there was a
rapid growth in the problem of respiration, coughing and wheezing but after the chronic
exposure there were other respiratory effects, holes and ulcerations occurred and other disease
like bronchitis and pneumonia increased. The study reports that intake of Cr+6 cause a bigger
threat to lung cancer. In vitro and in vivo, mutation is caused by the intake of Cr+6 complexes for
example, chromosomal abnormalities in an extensive variety of prokaryotic and eukaryotic so it
was found that Cr+6
shows the mutagenic behavior [30].
2.3 MUTAGENICITY
Reduction of mutagenic is done by decreasing gastrointestinal juice of humans. The
differences in physical and chemical characteristics well describe the change in activities related
to mutagenic on Cr+6 and Cr+3.
2.4 CARCINOGENICITY
Taking into account the lung tumors, Cr+6 causes carcinogenicity which is observed in
many studies of inhalation , In further studies, the Cr+6 was overseen by implantation or
vaccination. Studies elaborates that cancer causing nature of calcium, lead, strontium, and zinc
provides halfway confirmation for the cancer causing nature of Cr+6 trioxide along with sodium
dichromate.
Table 2.1: Industrial wastewater containing Cr+6
Industry Cr+6 Conc
(mg/ L) References
Hardware factory 60.0 Xu et al. 2005 [31]
Chrome tanning plant 3.7 Gupta et al.1999 [32]
Electroplating plant 20.7-75.4 Kiptoo et al. 2004, Tukaram Bai et al. 2005 [33,34]
Tannery plant 8.3-3,950 Esmaeili et al. 2005, Song et al. 2000,[35,36]

11
Table 2.2: Permissible limits of Cr+6 in different water bodies
WATER RESOURCES PERMISSIBLE LIMITS
River water
0.04–0.5 mg/litre
Ground water
(<1 mg/litre)
Drinking water
0.05 mg/litre
2.5 Cr+6
REGULATIONS
Cr+6 in the aquatic bodies have a great impact towards individuals, creatures, plants due
to which few organizations employ strict regulatory measures .According to the World Health
Organization (WHO) consumption has set an permissible limit of 0.05 ppm for Cr+6 removal and
2 mg/L of about 2 mg/L in drinking water [14]. The Maximum Contaminant Level (MCL) is found
to be 0.1 mg/L from total Cr+6 content according to the survey by world health organization. Cr+6
less than 50 ppm observed some fluctuations in the colour change. Cr+6 can be reused further
as a part of feedstuff for creatures. It was found to have Cr+6 at levels below 2.75% of the whole
by weight. The permissible limit for health hazards and safety has been stated as 15 mg/m3 by
National Institute for Occupational Safety and Health (NIOSH) and 0.001 mg/m3 as stated by
Suggested Exposure Limit [37].
2.6 METHODS TO REMOVE Cr+6
2.6.1 MEMBRANE SEPARATION
A.E. Pagana et al [38] work was based on the removal of arsenic and Cr+6 ions from
polluted water using porous membranes of ceramic, membranes of composite c-al2o3 by the
process of sol-gel method. The process separates the combined adsorption-ultrafiltration
process Moura et al [39]considered the Cr+6
evacuation by a membrane separation technology
where ions gets transferred from one phase to the other by the driving force applied with the
help of an electric field. The process of electro dialysis was followed by the author by mixture of
polymers known as polystyrene and polyaniline for the production of membrane. Hence the
desired membranes produced can be utilized for the removal of metal ions from tannery as well
as metal finishing industries. Christina –Veronica Gherasim et al [40] dealt with a polymer
inclusion membrane (PIM) as an adsorbent which is prepared by liquefying a polymer, a
separating agent, and a plasticizer mixed all together in a suitable dissolving solvent and then,
afterwards this dissolvable solvent was allowed to evaporate at absolute room temperature.
This developed thin and stable films membrane was further used for Cr+6 removal The studies

12
also shows the different effects on variation of contact time, pH as well as Cr+6 concentration
by batch process. MA. Hassan et al [41] used liquid emulsion membrane (LEM) for further
analysis of the research for recovery of Cr+6 .The Tri- octylphosphine oxide (TOPO) which has
been used as a carrier, cyclohexane as an natural diluent, sodium hydroxide for stripping of a
solution with Span-80 (sorbitain monooleate) to emulsify the solution were used for the
preparation of this liquid membranes.
2.6.2 ADSORPTION
Cr+6 can be removed from waste water through the process of adsorption. Some of the
natural adsorbents like bentonite, agricultural residues, oil cakes, activated charcoal, and
activated carbons are used to study the adsorption process. Mbaye Gueye et al [42]
researched on the adsorption process developed by activated carbons (AC) using Jatropha
wood and peanut shells. Effect of pH and acid/base nature on the surface of activated carbon is
also considered to have an idea about the mechanism process of adsorption which is due to
the phenomena of electrostatic attraction Mani Arulkumar et al [43] used prawn shell activated
carbon (PSAC) for the Cr+6 removal by Response surface methodology (RSM) for the
optimization of various optimum conditions The isotherms including Freundlich and Langmuir
both fits well and the kinetic studies proves that it follows a pseudo second order reaction. Hong
Zhang et al [44] studied Cr+6 removal by using activated carbon derived from the residues of
algal bloom. Various effects of process variables such as amount of adsorbent, pH of the
solution; initial Cr+6 concentrations were also used for the effective removal of Cr+6. At pH 1,
there occurs a favorable adsorption. The adsorbent was characterized using scanning electron
microscopy (SEM), Energy dispersive X-ray spectroscopy (EDS) and Fourier transform infrared
spectroscopy (FTIR) to study the mechanism related to the process of adsorption.
Z.A. AL-othman et al [45] studied the process of adsorption on Cr+6 using activated
carbon being prepared from the peanut shell. The characterization of carbons prepared was
done by BET analyzer for the calculation of surface area and pore size distribution The factors
including pH, contact time, initial concentration, temperature has also an impact of on Cr+6
adsorption were also investigated.
2.6.3 BIOSORPTION
Ihsan Ullah et al [46] studied the adsorption of Cr+6 by utilizing the sugarcane bagasse
prepared from biomass residues. The Immobilized sugarcane obtained from the biomasses
residues were taken as a function of initial Cr+6 concentration, amount of adsorbent, pH and
contact time for the effective Cr+6 removal from the tannery industries were also investigated..

13
Sharma Mona et al [47] worked on the biosorption of Cr+6 using RSM Method by utilizing
cyano-bacteria which is an waste derived from the biomass residues of Nostoc linckia .The
adsorbent obtained was in the form of alginate beads which was further used for the analysis
of various optimum parameters. Ahmet Sari [48] studied the adsorption potential for Cr+6
removal using red colored algae rock which is also known as Ceramium virgatum. The
advantage of using these algae as an adsorbent is because of its renewable, naturally available
and hence it is proved to be cost-effective. The effect of various process variables like pH,
contact time, amount of adsorbent and temperature were studied. The Langmuir model fits well
to this adsorption process among all models being applied. Ozgur Dogan Uluozlu et al [49]
confirmed adsorption conditions as a function of variation in pH, amount of biomass,
temperature and contact time on basis of research related to the adsorption on Pb2+ and Cr3+
ions from water solutions by using the lichen (Parmelina tiliaceae) derived from the biomass. XU
Han et al [50] studied Cr+6 removal using Chlorella miniata. The factors on which the
equilibrium time depends are initial pH, biomass dose and Cr+6
concentrations and the
maximum removal can be attained at initial pH of 3.0 from the reported equilibrium data’s.
Durali Mendil et al [51] reported Cd2+ and Cr3+ ions removal by the use of moss (Hylocomium
splendens) biomass. Since 20 years, mosses have been used as bio monitors to determine the
heavy atmospheric metal deposition due to its higher cation exchange capacity.
2.6.4 ION-EXCHANGE
Beharang Pakzadesh et al [52] evaluated the removal of Cr+6 using synthetic ion-
exchange brines and calcium polysulfide for determining the effects of Cr6+ concentration,
calcium polysulfide dosage, pH, and ionic strength in process of adsorption. Petruzelli et al [53]
reported process known as the IERECHROM process which is based on the concept of using
macro-porous carboxylic resin that helps in the Cr+6 removals. Chmielewski et al [54]
discovered a method by using a process of electrochemical oxidation and ion exchange for the
removal of Cu and Cr+6 from the water originating from electroplating industries. Lin and Kiang
[55] developed a procedure using multi step ion exchange process through regeneration of the
chemicals used to remove the chromic acid from a contaminated waste water stream. Yalçin et
al [56] studied Dowex 50X8, a strongly acidic cation-exchange resin, to recover the two forms of
Cr+6using the process of oxidation and reduction from the wastewater originating from
electroplating industries. Rengaraj et al [57] used three sets of ion exchange resins namely as
1200H, 1500H and IRN97H in the pH ranging from 2-6 and initial chromium concentration of
10mg/l for Cr+6 removal. The adsorption process follows both Langmuir as well as Freundlich

14
isotherms. It also obeys Pseudo second order kinetics. Sofia A. Cavaco et al [58] studied the
removal of Cr+3 by using a chelating exchange resin (Diaion CR11) and a weak cationic resin
(Amberlite IRC 86) at two different temperatures respectively while other parameters including ,
pH, time and concentration were kept as constant to determine the capacity of the resins.
Gulten Cetin et al [59], conducted research on removal of Cr+3 by using the resin
Amberjet 1200Na having a matrix of styrene-divinylbenzene by using the process of
multisorption and regeneration cycles of the resins by using hydrogen peroxide in alkali media
and kinetics of the oxidative regeneration were also performed. F Gode et al [60], studied the
Cr+3 removal by using a pair of resins such as chelating resins Chelex-100 (from Merck) and
Lewatit TP 207 (from Bayer) .The maximum adsorption capacity for Cr+3 ions was observed at
pH 4.5. Both the resins are proved to have good binding capacity because of the presence of
functional groups like styrene- divinylbenzene matrix and iminodiacetic acid groups in a styrene
matrix present in it.
RESINS
Resins are used to purify contaminated water such as synthetic and natural resins. Harbi
et al [61]; used Dowex 1X8 resin for effective Cr+6removal by Batch process. Several optimum
parameters like resin dosage, contact time and temperature were considered during the batch
study operations .The process of adsorption was followed by Freundlich isotherm and obeys the
pseudo second order model. L.Rafati et al [62]; used Lewatit FO36 ion-exchange resin for the
efficient removal of Cr+6 ions by varying the different conditions as variation in amount of resin,
initial Cr+6
concentration, contact time and pH. The Kinetic studies in this process follows
Pseudo second order model. .S.Bajpai et al [63]; studied Amberlite SR1L Na resin for the
removal of Cr+3 ions by varying the pH from (2-5), resin dose as (5-25 g/L), initial Cr+3
concentration as (50-300 mg/L) and contact time as (0- 150 min.) .M.A Barakat et al [64];
studied the effect of removal on Strong anion exchange resin known as Spectra/Gel IE 1x8
.Various process parameters including pH, Cr+6 concentration and amount of resin and
adsorbent concentration and contact time are also considered based on the conducted
experiments. Maximum adsorption capacity of the Cr+6
reached up to 173.8 mg/g. The isotherms
model fits well to the Langmuir models. S. Rengaraj et al [65]; observed that the resins 1200H,
1500H and IRN97H demonstrates a significant growth in adsorption capacity of Cr+6, related to
former .It fits well to Langmuir as well as Freundlich isotherms and follows first-order reversible
kinetics and pseudo-second-order kinetics. Ibrahim et all; used a synthetic resin known as
Amberlite IRA 400(Cl) resin and obtained a highest % adsorption of 99.92 % at 30 ppm of Cr+6
concentration. N. Kabay et al [66]; studied the process of adsorption using impregnated resins

15
known as Aliquat 336 to remove Cr+6 from the wastewater system. The process gets well fitted
to Langmuir isotherm. Catalin Balan et al [67]; has used anionic resins known as, purolite A-
400 along with purolite A-850 made up of gel like structure. The maximum percentage of Cr+6
removed observed was 99% at pH varying from 4.0–5.3 with amount of resin as 6 g/L and initial
concentration of 100 mg/L. The resins consists maximum adsorption capacity as 120.55 and
95.82 mg respectively and it also stated the adsorption process follows pseudo second order
model. Some of the natural materials are being used over synthetic resins due to the fact of high
price in petrochemical products. Few natural materials such as guar powder, tamarind kernel
powder, Xanthium gum powder, Sesbania gum powder etc. has been employed into account by
various researchers for the effective removal of metal ions. The resins prepared from these
natural materials have an advantage over synthetic resins like these are non –biodegradable
and cost-effective. Archana Chahar et al [68]; prepared tamarind 8-hydroxyquinoline-5-sulfonic
acid resin and studied the characterization of the resin by FTIR (Fourier transform Infrared)
spectra ,total ion exchange capacity and elemental analysis .The effects of various different
conditions like pH, treatment time, temperature, resin quantity with variation in the rate of flow
are maintained to remove Cr+6 from the industrial discharges A.V Singh et al [69]; used a guar
gum-based resin which consists of nitrilotriacetic group .The characterization of the (GNTAA)
resin was done by using FTIR, BET analyzer, ion exchange capacity, thermogravimetric
analysis as well as CHNS analysis. This research also emphasized on various factors which
has a great impact on pH, distribution coefficients (Kd) to study the % removal of Cr+6. Q.
Zhang et al [70]; used Sesbania gum supported dithiocarbonate chelating resin(SGDSA)for the
effective removal of Cr+6 ions based on the reaction of epoxidation. Subsequently, Cassia gum
powder, a natural material acquired from seeds of endosperms of Cassia tora and cassia
obtusifolia which belongs to leguminosae family has been utilized to prepare natural resin. This
tree is mostly grown in tropical region and has high therapeutic properties.
2.7 OBJECTIVES
The main objective of our research is to remove Cr+6 from water using natural resin.
The specific objectives are:
Preparation and characterization of natural resin.
Optimization of process condition to remove Cr+6 using batch studies.
Optimization of batch experiment using statistical tool.
Continuous removal of Cr+6 from contaminated water using column study

16
Chapter 3
MATERIALS AND METHODS
3.1 PREPARATION OF ADSORBENT
3.1.1 PREPARATION OF RESIN
Preparation of Resin from cassia gum powder involved two steps: initially epoxy propyl
ether of cassia was prepared followed by reaction with 4-hydroxybenzoic acid to produce cassia
4-hydroxy benzoic acid (CHBA) resin. The detailed process for preparation of the resin is
depicted through Schematic layout as per figure 3. 1and figure 3. 2. A definite quantity of cassia
gum powder was slurred with dioxane in a round bottom flask. Subsequently 0.1N NaOH
solution was added to make it alkaline. The contents were stirred continuously with addition of
epoxychloropropane at 600 C for 5 hours. The obtained product called epoxy propyl ether of
cassia hence parted from the above solution when centrifuged on 3000 rpm aimed at 15
minutes. Impurities in the obtained product were further removed by washing with methanol and
were further dried with the help of hot air oven at 40 0C. During the next step the obtained
epoxypropyl ether of cassia was reacted with 4-hydroxybenzoic acid while constant stirring at
600 C for 5 hours and was left overnight to settle. Further separation of resin was achieved by
centrifuging at 3000 rpm and subsequent washing with 90 % methanol with few drops of HCl to
obtain a pure resin named as Cassia 4-hydroxybenzoic acid resin. The CHBA resin produced
was acid washed with dilute HCl (0.1N) to create hydrogen group on the surface. The double
distilled water is used to wash the CHBA resin so that the excessive acid present in the resin
gets removed and the sample was dried at 313 0K in oven and stored in a steel container till
further used.
Step 1.Preparation of epoxypropyl ether of Cassia
Cassia gum powder

17
Figure 3.1: Preparation of epoxypropyl ether of cassia
Step 2: Preparation of Cassia 4-hydroxybenzoic acid(CHBA)resin
Figure 3.2: Preparation of Cassia 4-hydroxybenzoic acid (CHBA) resin
3.2 CHARACTERIZATION OF ADSORBENT
3.2.1 FTIR ANALYSIS
The FTIR analysis was used to determine the various functional groups present in the
resin sample. The FTIR analysis was done with the help of FTIR-3500 spectrophotometer. The
resin was crushed by 200 mg of KBr (spectroscopic grade) which is placed in a mortar and
compelled into 10 mm which was then used to detect the functional group analysis.
Chlorohy drin of Cassia

18
3.2.2 CHNS ANALYSIS
An elemental analyzer purpose is to offers a pathway for finding the carbon, hydrogen,
nitrogen and Sulphur contents or percentage in the resin.
3.2.3 NITROGEN CONTENT
The Kjeldahl’s method is the ordinary method to find the nitrogen content, the dried resin
consisting weight of 0.2 g was taken inside a dried Kjeldahl's flask and concentrated sulphuric
acid of 10 ml was mixed in the flask with 0.60 g of catalyst was also added into the flask and the
above solution was allowed to heat for 2 hours. After heating, the mixture of solution was
allowed to cool and then it was transferred to a distillation unit along with 20 ml of distilled water
to determine the ammonia. Subsequently, volume of 12 ml consisting 10 N of sodium hydroxide
was allowed to mix and to make up total volume residing in the flask to 75 ml. The ammonia
was then liberated which was steam distilled continuously for 5 minutes containing 5 ml of 4%
boric acid and 5-6 drops Phenolphthalein indicator. The ammonia which was distilled was
further titrated with the help of 0.05 N hydrochloric acid.
3.2.4 TOTAL ION EXCHANGE CAPACITY
Titration procedure was done in which resin weighing 1 g was allowed to convert into its
hydrogen ion form; and the wet resin consisting of 1 g was taken in an Erlenmeyer flask with
200 ml of sodium hydroxide solution of 0.1000M, 25 ml of the above supernatant liquid was
taken for further titration by using standard solution of 0.05 N HCl with the help of
phenolphthalein indicator. The resin which was left in H+ forms was used for calculating the
moisture content in the resin. Capacity of the resin is calculated brlow mentioned formulae.
Capacity of the resin = 𝒎𝑳𝑵𝒂𝒐𝑯 ×𝑴𝑵𝒂𝒐𝑯
𝒎𝒂𝒔𝒔𝒓𝒆𝒔𝒊𝒏 …3.2.1
Where mLNaOH - Volume of NaOH used to titrate.
MNaOH - Normality of NaOH.
Mass resin - Mass of resin used (grams, air dried).
3.2.5 MOISTURE CONTENT
Firstly the resin in its hydrogen form of a specified amount of 1 g is weighed accurately
and placed into a predried, cooled and tared moisture dish. The dish is then placed in an oven
operating at a specified temperature of 110ºc maintained for 1 hour then the resin was taken
from the oven and allowed to cool in a room temperature for 15 minutes. The resin was then
19
allowed to dried to a constant weight in a vaccum dessicator at 30ºc for 24 hours and then the
resin was weighed.
3.3 CHEMICALS
All chemicals used in the experiment were Analytical grade namely Epichlorohydrin
(Sisco Research Laboratories, Mumbai), 4-hydroxy Benzoic Acid (loba chemie Private Limited),
sodium hydroxide, Methanol and HCl (Sigma Aldrich, Mumbai), Dioxane (sico research
laboratories, Mumbai), potassium dichromate (Merck, India) were processed for synthesis of
resin. Cassia gum Powder was procured from Bhairav industries, Ahmedabad, India.
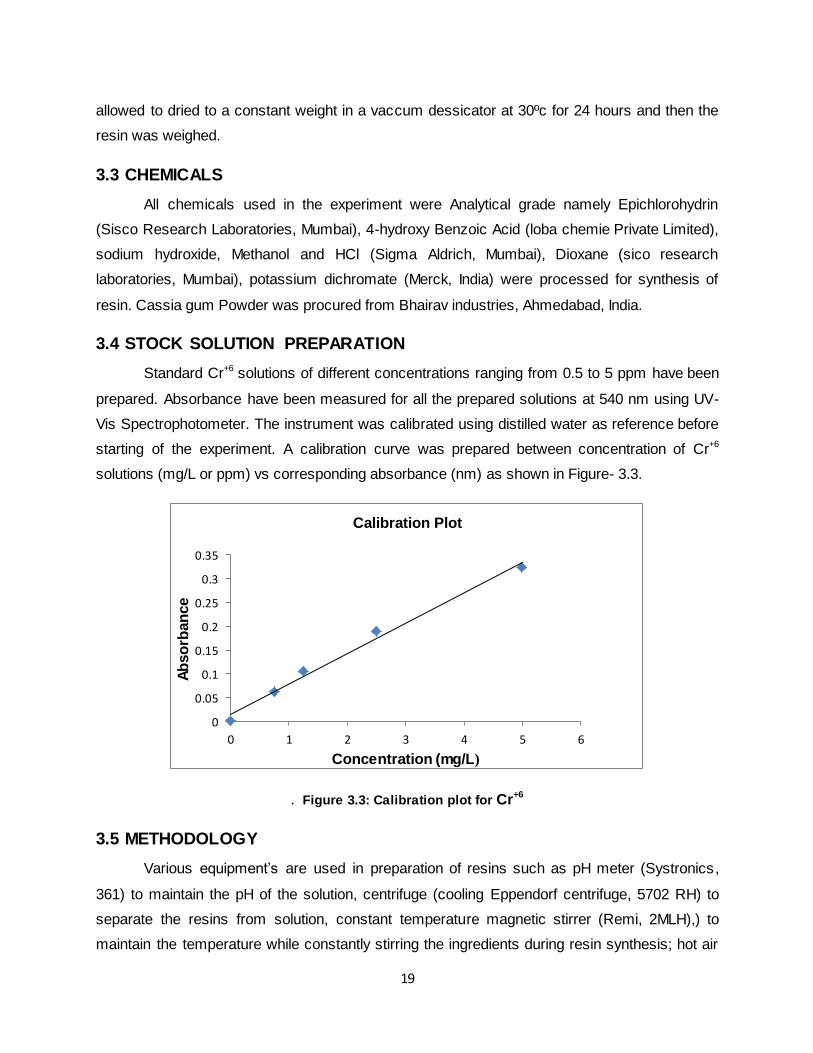
3.4 STOCK SOLUTION PREPARATION
Standard Cr+6 solutions of different concentrations ranging from 0.5 to 5 ppm have been
prepared. Absorbance have been measured for all the prepared solutions at 540 nm using UV-
Vis Spectrophotometer. The instrument was calibrated using distilled water as reference before
starting of the experiment. A calibration curve was prepared between concentration of Cr+6
solutions (mg/L or ppm) vs corresponding absorbance (nm) as shown in Figure- 3.3.
. Figure 3.3: Calibration plot for Cr+6
3.5 METHODOLOGY
Various equipment’s are used in preparation of resins such as pH meter (Systronics,
361) to maintain the pH of the solution, centrifuge (cooling Eppendorf centrifuge, 5702 RH) to
separate the resins from solution, constant temperature magnetic stirrer (Remi, 2MLH),) to
maintain the temperature while constantly stirring the ingredients during resin synthesis; hot air
0
0.05
0.1
0.15
0.2
0.25
0.3
0.35
0 1 2 3 4 5 6
Ab
so
rban
ce
Concentration (mg/L)
Calibration Plot

20
oven (Ricco, India) for drying the prepared resin. Surface Characterization of resin was
essential to understand the properties of the developed resin. FTIR studies were performed to
know the surface functional groups using Nicolet TM 10, Thermofisher scientific, and USA.
Amount of Cr+6 adsorbed by the resin was estimated using UV-Vis Spectrophotometer at 540μm
wavelength (UV-3200 Double Beam Spectrophotometer, Lab India) using 1,5-diphenylcarbazide
method [71]
FTIR: The instrument namely as Fourier transform infrared spectroscopy instrument is used to
determine the functional groups present in a metal ion with the help of KBr pellets. The resin
has to be converted to its H+ form firstly before carrying out the FTIR analysis.
CHNS: An elemental analyzer purpose is to offers a pathway for finding the carbon, hydrogen,
nitrogen and sulphur contents or percentage present in the resin.
PH meter: It was used to measure the pH (acidity or alkalinity) of the sample consisting Cr+6
with resin. The pH of the samples should be around 6-7.
Constant Temperature Shaker: It has been used for the experimental batch study.
UV-Vis Spectrophotometer: It has been used for the measurement of Cr+6 concentrations.
Centrifuge: It was used to separate the mixture of two distinct densities which was also further
being used for separation of resin.
Magnetic Stirrer: It is used for the preparation of resin.
3.6 ADORPTION MECHANISMS
Adsorption experiments under varying optimum parameters like pH, amount of resin,
contact time, amount of Cr+6 concentration is carried out by adding required amount of resin
consisting in 250 ml flasks each comprising 100 ml Cr+6 solution. pH was varied from 3-11 with
the help of 0.1 N HCl in addition to 0.1 N NaoH solution. The contents inside the flask were
shaken inside an incubator shaker (Reico, India) at a definite shaking speed (130rpm) and
temperature 300 C. After adsorption, the residual Cr+6 concentrations were estimated by the
means of UV-Vis spectrophotometer and the corresponding wavelength should be 540 nm. The
influence towards adsorbent dosage on percentage removal efficiency for the studied resin was
achieved through changing the resin amount starting from 0.1 g to 1 g for a definite Cr+6
concentration with observing other optimum parameters (pH, shaking speed, contact time as
well as temperature)constant according to the optimum values obtained from previous

21
experimentation. Percentage removal of the resin was obtained using the following expression
as given below:
Percentage Removal = 𝑪𝒐−𝑪𝒆
𝑪𝒐 … 3.6.1
Where Co and Ce (mg/L) are the initial and outlet concentration of metal ions in solution.
3.7 ADSORPTION ISOTHERMS
A correlation among adsorbate amount adsorbed on a resin surface at a definite
temperature and the equilibrium concentration of adsorbate achieved after contact with
adsorbent is termed as adsorption isotherm. Experimental data can be verified through diverse
adsorption isotherm models like Langmuir, Temkin, Dubinin Radushkevich and Freundlich.
3.7.1 FREUNDLICH ISOTHERM
Freundlich equation is used to derive the model onto a multilayer surface of adsorption
and adsorption taking place on heterogeneous surfaces. It is established with the assumption
that each component has one exponential distribution of energy related to adsorption. The
equation of Freundlich model is specified by (Freundlich and Heller, 1939). The logarithmic form
of equation
𝒍𝒐𝒈𝒙
𝒎= 𝒍𝒐𝒈𝑲𝑭 +
𝟏
𝒏𝒍𝒐𝒈𝑪𝒆 … 3.7.1
Where x relates to quantity of Cr+6
being adsorbed (mg),m known as mass of the adsorbent in
grams, Ce relates to equilibrium concentration in (mg L-1), KF , 1/n exist as the constants of
Freundlich equation,1/n known as factor of heterogeneity in addition to kF that indicates the
capacity of adsorption. The values with n>1 reflects the favorable adsorption. The slopes,
intercepts are found from the linear plots consisting log(x/m) versus log ce for different adsorbent
doses and also the data of n and kF can be calculated with the help of these slopes, intercepts
[72].
3.7.2 LANGMUIR ISOTHERMS
This model equation was first established by Langmuir in 1948. It was constructed on
the postulation that homogeneous surfaces are required for adsorption to take place and it
occurs due to monolayer coverage. The equation of Langmuir isotherm can be represented by:
𝑪𝒆
𝒒𝒆=
𝑪𝒆
𝑪𝒎+
𝟏
𝑲𝑳𝑪𝒎 … 3.7.2 (a)

22
Where Ce represents the equilibrium concentration of the Cr+6 solution in (mg L-1) and qe (mg g-1)
equilibrium capacity of adsorption. The Cm indicates the capacity of adsorption in (mg g-1) when
a complete monolayer surface is achieved and kL is linked with affinity towards binding sites.
The intercept, slopes were found using the plots (Ce/ qe versus Ce) which were then correlated to
find values of kL and Cm. The viability and favorability of the adsorption process can be stated by
a constant known as separation factor (RL) which is almost dimensionless. The dimensionless
data’s (RL) was calculated with the help of equation as followed:
𝑹𝑳 =𝟏
(𝟏+𝑲𝑳𝑪𝒐) … 3.7.2(b)
Where Co represents initial Cr+6 concentrations in (mg L-1). The RL should lie between 0 and 1 to
get an adequate adsorption, whereas RL>1 signify inadequate adsorption, and RL=1 denotes
rectilinear adsorption however the process becomes irreversible when RL=0 [73].
3.7.3 TEMKIN ISOTHERM
Temkin isotherm takes into account an element that describes the relations amongst
adsorbing rectilinear and the process of adsorption which is described by a constant
dissemination of energies binding to each other. The equation describing Temkin isotherm is
stated as:
𝒒𝒆 = 𝑩𝟏 𝐥𝐧 𝑲𝑻 +𝑩𝟏 𝐥𝐧 𝑪𝒆 … 3.7.3
Where qe relates to the quantity of metal ion which gets adsorbed per definite of adsorbent
amount in (mg/g), Ce denotes as concentration at equilibrium is (mg/L), KT is constant of binding
metal ions at equilibrium condition in (g-1) and the values of KT and B1 can be found by plotting a
linear graph between qe and ln Ce.
3.7.4 DUBININ–RADUSHKEVICH ISOTHERM
. The D-R equation can be stated as below:
𝐥𝐧 𝒒𝒆 = 𝐥𝐧 𝒒𝒔 − 𝑩 ∈𝟐 ... 3.7.4
Where B is defined as a constant of adsorption of residing energy, R (8.314 Jmol−1 K−1) denotes
gas constant, and T (K) defines as total temperature and ε = RT ln (1 + 1/Ce). The constant B
(mol2 KJ−2) tells the adsorption involving mean free energy of each and every molecule of the
adsorbate as soon as the energy is transported to the outer layer of the solid .The factor which
is used here provides data related to determine whether the adsorption process is chemical or
23
physical .If the values of E is within the range of 8 and 16 KJ mol−1, then, the process of
adsorption is said to be a chemical ion-exchange, whereas if E< 8KJmol−1, then the process of
adsorption is followed by a physical nature.[74]
3.8 ADSORPTION KINETIC STUDIES
At a fixed optimum condition, the contact time was taken by means of a function when
the resin was allowed to get adsorbed on the Cr6+surface .Different Tests were conducted using
definite amount of resin at varying initial concentration of Cr6+ to verify the order followed by the
process of adsorption using Pseudo-first order kinetics, Adsorption kinetics using Pseudo-
second order, diffusion study of Intra-particle, elovich model [75].
3.8.1 PSEUDO-FIRST ORDER MODEL
The capacity of adsorption of the solid system was fully dependent on the first order
Pseudo kinetics or Lagrengen rate equation of the kinetics involving adsorption of liquid system
to the solid system .This model has an important feature for determination of the adsorption rate
equations originating from solution as a liquid form. The equation of Langrangen model is
represented as (Ho and McKay, 1999a):
𝒅𝒒𝒕
𝒅𝒕= 𝑲𝒇(𝒒𝒆 − 𝒒𝒕) ...3.8.1(a)
Where kf (min−1) denotes the constant adsorption rate of first order Pseudo-Kinetics, qt (mg/g) is
described as the capacity of adsorption during the time interval of t (min) while qe in (mg/g) is
said to be the adsorption capacity when the process is in its equilibrium state. Integrating the
above equation by applying the conditions as: when t=0, qt =0 while when time reaches an
interval of t min, that is t = t, then qt becomes qt=qt.: the above equation can be written as:
Log (𝒒𝒆 − 𝒒𝒕 ) = 𝒍𝒐𝒈𝒒𝒆 −𝑲𝒇
𝟐.𝟑𝟎𝟑𝒕 ...3.8.1(b)
The plots between log (qe −qt) and t gives the value of the constant rate of adsorption that is, kf .
3.8.2 PSEUDO-SECOND ORDER MODEL
The equation of second order Pseudo model is expressed elsewhere (McKay and Ho,
1999).
𝒅𝒒𝒕
𝒅𝒕= 𝑲𝒔 (𝒒𝒔 − 𝒒𝒕)𝟐 ...3.8.2(a)

24
Where the rate of constant that is, ks will be in (g/(mg min) ,The slopes and intercept of the plots
provides the values of constants ks ,qe. Further integrating the above equation at the following
conditions:
When t=0, qt =0 while if time reaches the interval of t min then, qt = qt .
𝒕
𝒒𝒕=
𝟏
𝑲𝒔𝒒𝒆𝟐
+𝟏
𝒒𝒆𝒕 ...3.8.2(b)
The plots between t/qt and t provide the values of qe when the process will be in its equilibrium
state.
3.8.3 INTRAPARTICLE DIFFUSION STUDY
As per the Postulation of this study, the uptake capacity varies proportionally with t1/2,
and weber-Morris plot (qt versus t1/2
).
𝒒𝒕 = 𝑲𝒊𝒅√𝒕 + 𝑪 …3.8.3(a)
Where kid can be defined as the constant rate of intra-particle diffusion. The intercept (c) data
describes the boundary layer thickness.
3.8.4 ELOVICH MODEL
The process of activated chemisorption can be only found by elovich equation.
𝒒𝒕 =𝟏
𝒃𝐥𝐧(𝒂𝒃) +
𝟏
𝒃𝐥𝐧 𝒕 …3.8.4(b)
Where, the constants are known as a, b. The rate of initial adsorption in (mg/(g min)) is given
by the a, and The energy required for activation of sites is given by the constant b which is used
in chemisorption in (g mg-1) while qt in (mg g-1) can be described as the quantity of Cr+6 required
for adsorption during the time interval of t min. The plots between qt and ln t gives the
corresponding a and b values.
3.9 THERMODYNAMIC FACTORS
The information related to data’s were derived from the isotherms of adsorption at
different resin dosages and also variation in the temperature was also required for the
calculation of parameters of thermodynamics like Gibbs free energy ΔG change, change of
enthalpy ΔH as well as change of entropy ΔS. The constants KL from the Langmuir equation, is
required for calculating Gibbs free energy change as per the equations:
25
∆G= −𝑹𝑻 𝐥𝐧 𝑲𝑳 … 3.9(a)
∆G= ∆H-T∆S …3.9(b)
From equation (13) and (14)
𝐥𝐧 𝑲𝑳 =∆𝐇
𝑹𝑻+
∆𝐒
𝑹 …3.9(c)
To estimate the change in enthalpy and entropy a plot between ln KL and 1/T was used. [75]
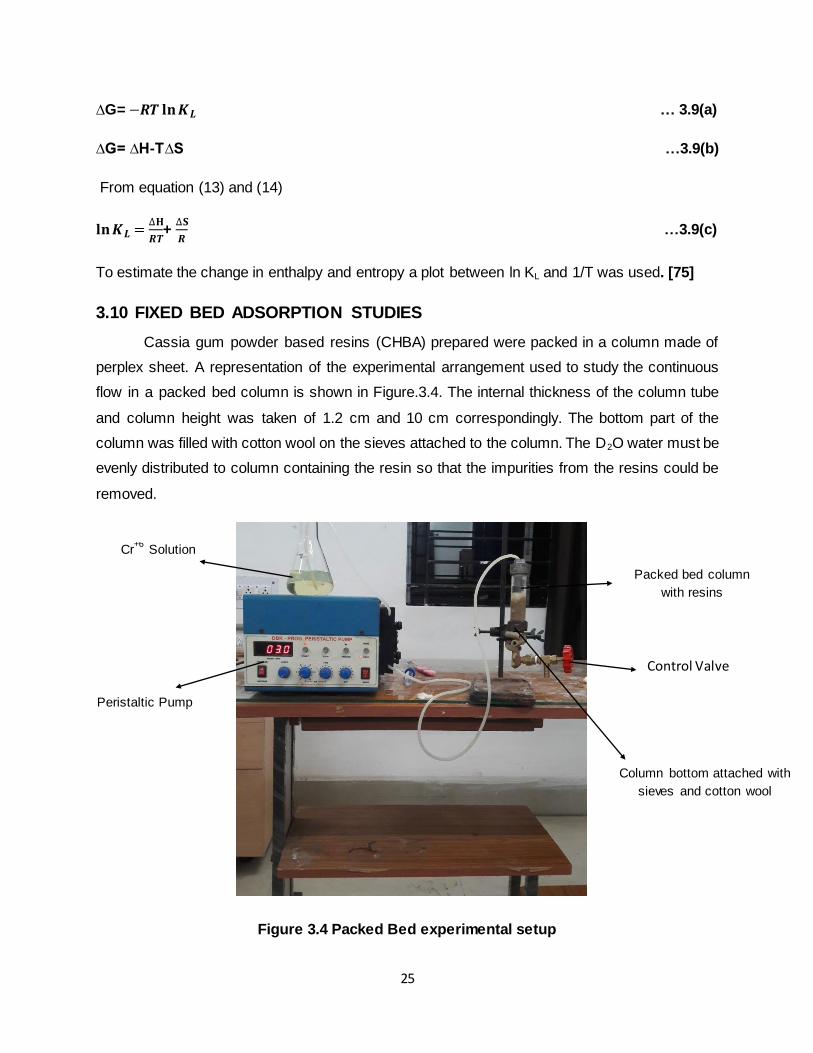
3.10 FIXED BED ADSORPTION STUDIES
Cassia gum powder based resins (CHBA) prepared were packed in a column made of
perplex sheet. A representation of the experimental arrangement used to study the continuous
flow in a packed bed column is shown in Figure.3.4. The internal thickness of the column tube
and column height was taken of 1.2 cm and 10 cm correspondingly. The bottom part of the
column was filled with cotton wool on the sieves attached to the column. The D2O water must be
evenly distributed to column containing the resin so that the impurities from the resins could be
removed.
Figure 3.4 Packed Bed experimental setup
Peristaltic Pump
Cr+6
Solution
i
Packed bed column
with resins
Control Valve
Column bottom attached with
sieves and cotton wool

26
3.11 ANALYSIS OF COLUMN DATA
The Cr+6 solutions to be treated were permitted to flow under gravity inside the column.
This respective flow was controlled and monitored using peristaltic pump [DBK-PROG
PERISTALTIC PUMP]. The inlet and outlet ends of the column were controlled by using two
valves. Influence of bed height, rate of flow and Cr+6 initial concentrations were studied by
packing the column with CHBA resin up to 6 cm height (approximately 6.3 grams). At 20 ppm
initial Cr+6 concentration, the flow rates were varied as 3, 5 and 7 ml/min to conduct the required
experiments. similarly to investigate the change occurring in bed height, at a fixed rate of flow(3
ml/min) and Cr+6 initial concentration (20 ppm), the height of the bed column was changed from
2 cm (2.1 g), 4 cm (4.2 g) and 6 cm (6.3 g). From these above studies flow rate and height were
fixed at optimum condition and Cr+6 initial concentration was varied from 5 mg/L, 10 mg/L, 15
mg/L and 20 mg/L. In each experiment, a fixed volume of treated Cr+6 solution was collected
from the bottom after every 1 minute interval and solution concentration existing could be
estimated using Varian UV Spectrophotometer.
Effective volume can be obtained from the equation 3.11(a) below:
𝑽𝒆𝒇𝒇 = 𝑸𝒕𝒕𝒐𝒕𝒂𝒍 …3.11(a)
Vef f relates to collection of the effective volume in (ml); Q denotes as volumetric rate of flow in
(ml/min): ttotal represents total time taken to flow in (min).
The maximum bed capacity can be found by the equation by keeping the rate of flow and
concentration fixed as:
𝒒𝒕𝒐𝒕𝒂𝒍 =𝑸 ∫ 𝑪𝒂𝒅𝒅𝒕
𝟏𝟎𝟎𝟎 …3.11(b)
qtotal represents maximum capacity of bed in (mg); Q defines the rate of flow inside the bed
in(ml/min); Cad is the Cr+6 concentrations which is adsorbed in (mg/L). Using the plot between
adsorbed Cr+6
concentrations verses time, the area under the curve can be calculated which
gives the value of integral in equation 3.11(b).
The net volume of Cr+6 introduced to the column bed is represented as in equation: 3.11(c)
𝑴𝒕𝒐𝒕𝒂𝒍 =𝑪𝟎𝑸𝒕𝒕𝒐𝒕𝒂𝒍
𝟏𝟎𝟎𝟎 …3.11(c)
Where Mtotal is total quantity required of Cr+6 to feed inside the bed column (g); C0 initial Cr+6
concentrations in (ppm); ttotal denotes total time required to flow in (min).
27
Thus using equation 3.11(d) below we obtain the total percentage of Cr+6 ion removed.
% 𝒓𝒆𝒎𝒐𝒗𝒂𝒍 =𝒒𝒕𝒐𝒕𝒂𝒍
𝑴𝒕𝒐𝒕𝒂𝒍× 𝟏𝟎𝟎 …3.11(d)
qtotal total adsorbed quantity of Cr+6 (mg) ; Mtotal is total quantity of Cr+6 introduced to the bed of
the column in (g).
Equilibrium The uptake capacity of Cr
+6 at equilibrium is represented as 3.11(e):
𝒒𝒆𝒒(𝒆𝒙𝒑) = 𝒒𝒕𝒐𝒕𝒂𝒍
𝒙 …3.11(e)
qeq (exp) is rate of uptake capacity of Cr+6 in equilibrium (mg/g) ; qtotal denotes maximum
adsorption capacity of bed in(mg); X is quantity of resin required for column study in (g) [76].
3.12 MODELING OF FIXED BED COLUMN STUDIES ON RESINS (CHBA)
The Designing of full scale column operation use of data from laboratory based
experiments is essential. The breakthrough curve and concentration profiles are essential
features which are required for the column study and capacity of the adsorbed resin under some
fixed operating condition is also required to effectively design the column. Besides this, the
maximum capacity of adsorption in column is also equally important to be estimated for some of
the adsorption systems. Numerous mathematical models were proposed to evaluate the
effectiveness and feasibility of the models of column which are required for large scale industrial
operations. Dynamic behavior of adsorbent adsorbate system can be studied using Thomas
model, Adam –Bohart model as well as Yoon-Nelson model.
3.12.1 THOMAS MODEL
Thomas model is widely used solutions in column performance studies which assume
the behavior of Plug flow in the Column bed. The process of adsorption in this model is limited
as well as the external and inner diffusion are also absent. The following expression represents
Thomas model for adsorption studies:
𝒒𝒆=
𝑹𝑻
𝒃𝒇𝐥𝐧(𝒌𝒇𝑪𝒆)
…3.12.1(a)
Linear Equation of Thomas model is stated as
𝐥𝐧 [(𝑪𝟎
𝑪𝒕) − 𝟏] = [(𝒌𝑻𝒉𝒒𝟎𝒙 𝑸⁄ ) − 𝒌𝑻𝒉𝑪𝟎𝒕] …3.12.1(b)

28
kTh in (ml/min.mg) is defined as rate of constant of Thomas model; q0 (mg/g) is adsorption
capacity of Cr+6 at equilibrium condition for each gram of quantity of resin; qe (mg/g) is sorption
capacity; C0 in (mg/L) is concentration of chromium at the inlet end; Ct in (mg/L) is concentration
of chromium at the outlet end during the time interval of t min. Ct/C0 represents relationship
between Cr+6 concentration at the outlet end to the inner end. At a fixed flow rate, the different
parameters of Thomas model can be depicted with the help of the plot between ln [(𝐶0 𝐶𝑡⁄ ) − 1]
and time [77].
3.12.2 THE ADAMS AND BOHART MODEL
This model was established for the study of the relationship existing between C0/Ct
versus time for the system which is continuous. It explains the starting part of the breakthrough
curve and it also postulates that adsorption rate remains proportional to capacity of the resin as
well as Cr+6
concentrations. The following expression for Adam-Bohart is given below;
𝒕 = (𝑵𝟎𝒙 𝑪𝟎 𝜸⁄ ) − [(𝐥𝐧 (𝑪𝟎
𝑪𝒕− 𝟏) (𝑪𝟎𝒌𝑨𝑩)⁄ )] …3.12.2(a)
The linear equation of Adam-Bohart model is given by:
𝐥𝐧 (𝑪𝒕
𝑪𝟎) = 𝒌𝑨𝑩𝑪𝟎𝒕 − 𝒌𝑨𝑩𝑵𝟎
𝒁
𝑭 …3.12.2(b)
C0 denotes Cr+6 concentration at inlet end and Ct in (mg/L) denotes outlet Cr+6 concentration at
time t in (min); kAB (L/mg.min) denotes rate of constant of Adam-Bohart model; F in (cm/min)
denotes linear velocity obtained by the division of the rate of flow by area of cross section; Z in
(cm) stands for depth of the column bed; N0 in (mg/ml) denotes the capacity of adsorption. The
parameters kAB N0 are obtained from the plot between ln (Ct/C0) and time from its intercept and
slope of the plot.
3.12.3 YOON – NELSON MODEL
Yoon-Nelson’s established a model which states that probability rate of the adsorbate
being adsorbed and the adsorbent of the breakthrough relating to the adsorbate decreases. The
linear expression in a single phase system can be given as
𝐥𝐧 (𝑪𝒕
𝑪𝟎−𝑪𝒕) = 𝒌𝒀𝑵𝒕 − 𝝉𝒌𝒀𝑵 …3.12.3(a)
kYN in (L/min) is constant rate of Yoon-Nelson Model, (min) denotes time needed to achieve
50% of total breakthrough curve and t denotes time required for collection of sample. The slope

29
kYN and intercept - kYN is obtained from plot between ln (Ct/ (C0-Ct)) and t. the capacity of
adsorption q0YN can be found from the equation below:
𝒒𝟎𝒀𝑵 = 𝒒𝒕𝒐𝒕𝒂𝒍 𝑿 =⁄ 𝑪𝟎 𝑸𝝉/𝟏𝟎𝟎𝟎𝑿 …3.12.3(b)
Where C0 is inlet Cr+6 concentrations; Q is flow rate and is the time for achieving 50%
of breakthrough curve and X denotes weight of resin.

30
Chapter 4
RESULTS AND DISCUSSIONS
CHARACTERISATION STUDIES
4.1 CHARACTERISATION OF ADSORBENT
4.1.1 FTIR ANALYSIS
The surface chemistry of CHBA resin before and after adsorption of Cr+6 was compared.
Functional groups that are identified include ester, ether, alcohol, and carboxylic acid and nitro
groups. Functional groups with corresponding adsorption range have been given in the table
below.
Table 4.1: FTIR analysis of (CHBA) resin before adsorption
Sl.no Absorption
Range
Functional groups
Types of
Vibration
1 1243.82 Ester C-O stretch
2 1142.40 Ester, ether C-O stretch
3 1018.94 ester,ether,alcohol,carboxylic acid C-O stretch
Figure 4.1: FTIR analysis without adsorption

31
Table 4.2: FTIR analysis of (CHBA) resin after Cr+6 adsorption
Sl. No Absorption range Functional groups Types of Vibrations
1 1373.84 Nitro groups N=0 Bond
2 1143.49 Ester and ether C-O Stretch
3 1087.84 Ester and ether C-O Stretch
4 1054.74 Ester and ether C-O Stretch
5 1025.40 Ester and ether C-O Stretch
Figure 4.2 FTIR analysis of (CHBA) resin with adsorption
Infra red spectroscopy analysis is based on interactions between electromagnetic
radiation and a compound. The atoms present in the molecules of that compound vibrate at
natural frequencies lying in the range 1013-1014 cycles per second. This range covers Infra red
radiations so these vibrations which results in dipole moment causes the absorption of Infra red
radiations. When the radiation absorbed by the substance is plotted against incident
wavelength, a graph is obtained which shows the presence of chemical bonds. FTIR hence is
proficient in determining structures.
The FTIR spectrum of cassia gum powder without adsorption shows a broadband in the
region 3700-3200 cm-1 which corresponds to –OH stretching, as hydrogen bonds can be
stretched easily, therefore less energy is needed which makes the peak broader. The peak at
2880.82cm-1 is attributed to C-H stretching vibrations; a strong and a sharp peak at 1648.81 cm-
1 is due to –OH bending. A strong peak at 1243.82 -1018.94 cm-1 denotes C-O stretching
vibration. In the graph, the area which are empty or without peaks shows that photons have not

32
been absorbed at the corresponding frequency and confirms the absence of specific bond at
that frequency. The FTIR spectrum of cassia gum powder is depicted in Figure 4.1.
The FTIR spectrum of Cassia-4-hydroxy benzoic acid resin shows a peak at 3100-3000
cm-1 which is attributed to C-H stretching vibration in aromatic nuclei. A strong peak in the
region 1240.68-1020.47 cm-1 denotes C-O stretching vibrations. The peak at 1373.84 cm -1
shows N=O stretching vibrations . The peaks at 1143.49-1054.74 shows C-O stretching
vibrations. The peak at 1518 cm -1 confirms the presence of aromatic ring. The zone from 2300
to 2100 cm-1 represents the alkyne triple bonds and nitrile triple bonds.The spectral peaks for
polysaccharides are generally observed in the region 3700-3200 cm-1 due to –OH stretching
frequency. The FTIR spectrum of Cassia 4-hydroxy -benzoic acid resin is depicted in Figure 4.2.
4.2 ELEMENTAL ANALYSIS
The resulting effects of the elemental analysis based on the Cassia 4-hydroxy benzoic acid
resin (CHBA) is shown in the table below.
Table 4.3: CHNS ANALYSIS
Element C H S N
Theoretically Analysed 72.26 3.998 0.182 1.888
Percentage Analysed 70.17 3.771 0.174 1.600
An elemental analyzer consisting of model 1160 Carlo erba was used to find the different
percentage of components present in the synthesized adsorbent. The analysis which was
obtained was calculated Theoretically as (%) 72.26 (Carbon); 3.998 (Hydrogen); and 1.888
(Nitrogen), and analyzed to be (%) 70.17(Carbon); 3.771 (Hydrogen); and 1.600 (Nitrogen). The
Theoretical and Percentage analyzed values are closer to each other which prove to be in
worthy agreement.
4.3 NITROGEN CONTENT
Nitrogen content – calculated as follows:
Resin amount required = 1 g
Volume of 0.05 N HCl consumed = 3.2ml
Nitrogen content present in resin sample = 1.600 x 3.2 = 5.12mg/1g of resin
% of Nitrogen content = 5.12 %
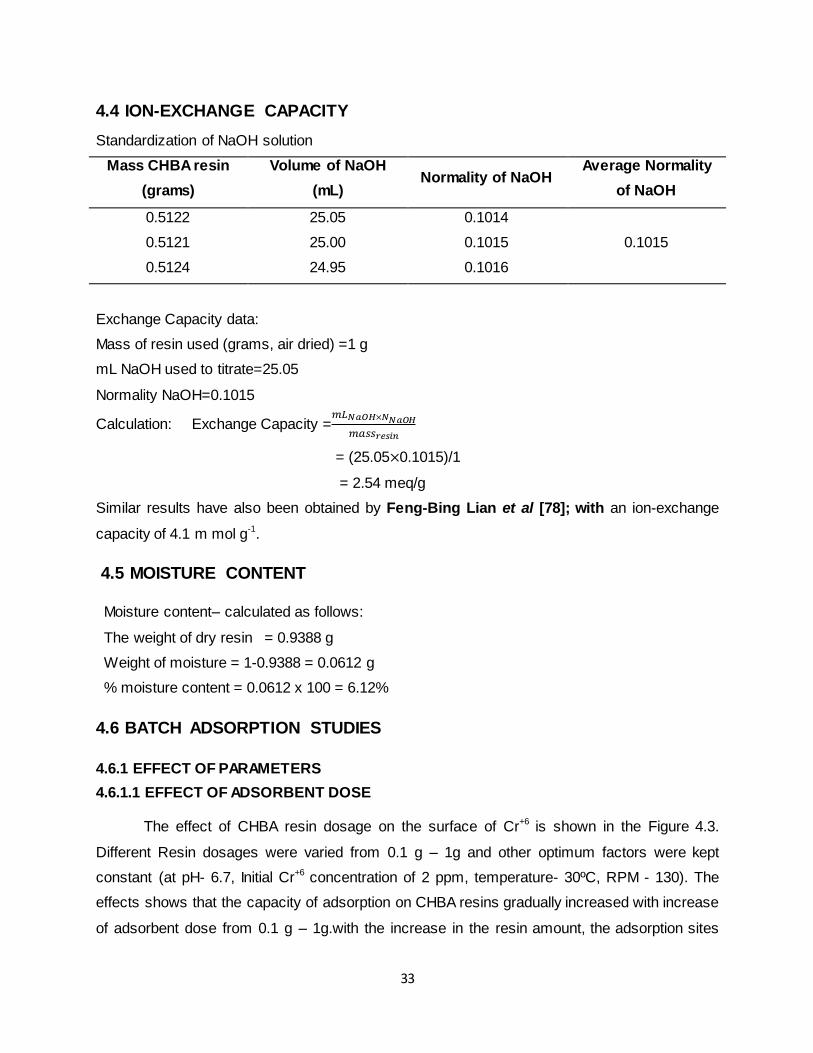
33
4.4 ION-EXCHANGE CAPACITY
Standardization of NaOH solution
Mass CHBA resin
(grams)
Volume of NaOH
(mL) Normality of NaOH
Average Normality
of NaOH
0.5122 25.05 0.1014
0.1015 0.5121 25.00 0.1015
0.5124 24.95 0.1016
Exchange Capacity data:
Mass of resin used (grams, air dried) =1 g
mL NaOH used to titrate=25.05
Normality NaOH=0.1015
Calculation: Exchange Capacity =𝑚𝐿𝑁𝑎𝑂𝐻×𝑁𝑁𝑎𝑂𝐻
𝑚𝑎𝑠𝑠𝑟𝑒𝑠𝑖𝑛
= (25.05×0.1015)/1
= 2.54 meq/g
Similar results have also been obtained by Feng-Bing Lian et al [78]; with an ion-exchange
capacity of 4.1 m mol g-1.
4.5 MOISTURE CONTENT
Moisture content– calculated as follows:
The weight of dry resin = 0.9388 g
Weight of moisture = 1-0.9388 = 0.0612 g
% moisture content = 0.0612 x 100 = 6.12%
4.6 BATCH ADSORPTION STUDIES
4.6.1 EFFECT OF PARAMETERS
4.6.1.1 EFFECT OF ADSORBENT DOSE
The effect of CHBA resin dosage on the surface of Cr+6 is shown in the Figure 4.3.
Different Resin dosages were varied from 0.1 g – 1g and other optimum factors were kept
constant (at pH- 6.7, Initial Cr+6 concentration of 2 ppm, temperature- 30ºC, RPM - 130). The
effects shows that the capacity of adsorption on CHBA resins gradually increased with increase
of adsorbent dose from 0.1 g – 1g.with the increase in the resin amount, the adsorption sites

34
also increases at higher concentration of the resin which results in higher removal of Cr+6 ions. If
the adsorbent amount is increased at definite Cr+6 concentration, then adsorption capacity qe
(quantity of Cr+6 getting adsorbed on the surface per unit mass of resin) decreases because of
the accessibility of less Cr+6 ions being available per unit mass of resin. Similar behavior has
been reported for adsorption of Cr6+ on Diaion SA20A exchange resin (F.H.G.Mesbah et al;
2010) [79].
Figure 4.3: Effect of Resin dosage on % removal
4.6.1.2 EFFECT OF pH
pH of any element is said to be an essential constraint for the metal ions to get adsorbed on the
surface as the metal ions solubility gets hindered by the factor pH, it also has an impact on the
functional groups present in the adsorbent by hindering the counter ions concentration as well
as the amount of ionization is also effected throughout the reaction. The pH was varied from 3
to 11 as given in Figure 4.4 in order to investigate the deviation in percentage removal of Cr+6
ions versus pH. Figure 4.4 depicts that the percentage removal of Cr+6 ions on the CHBA resin
increases over pH ranging from 3 - 7, beyond pH 7 there is a decrease in % removal of Cr+6 till
pH 11.During low pH, the external surface of the resin was completely shielded with H3O+ ions
that participate effectively with Cr+6 ions for the vacant sites of adsorption. As the pH increases,
there is a decrease in the concentration of H3O+ ions, resulting in the Cr+6 adsorption with the
help of the resin. Various studies conducted with resins shows different optimum pH, where
maximum removal of Cr+6 could occur (M.A Barakat et al; 2013)[80]

35
Figure 4.4 Effect of pH on % removal
4.6.1.3 EFFECT OF CONTACT TIME
Contact time study suggests the maximum time needed for a resin to achieve its
equilibrium. The present trend is in agreement with previous studies. It is clear from Figure 4.5
which reveals that as the time increases varying from 10 - 30 minutes, the percentage removal
of the Cr+6 ions also increases and the maximum time taken for the complete adsorption process
to take place was around 25 min keeping the other factors as constant such as solution pH and
speed of the shaker and temperature at 30ºC. It could be attributed to the fact that with the
increase in time, the contact between the Cr+6 ions and surface of the resin increases or they
gets more time that leads to more adsorption as the sites of adsorption is still incomplete.
Figure 4.5 Effect of contact time on % removal
10
20
30
40
50
60
70
80
90
100
0 5 10 15
% R
em
ov
al
pH
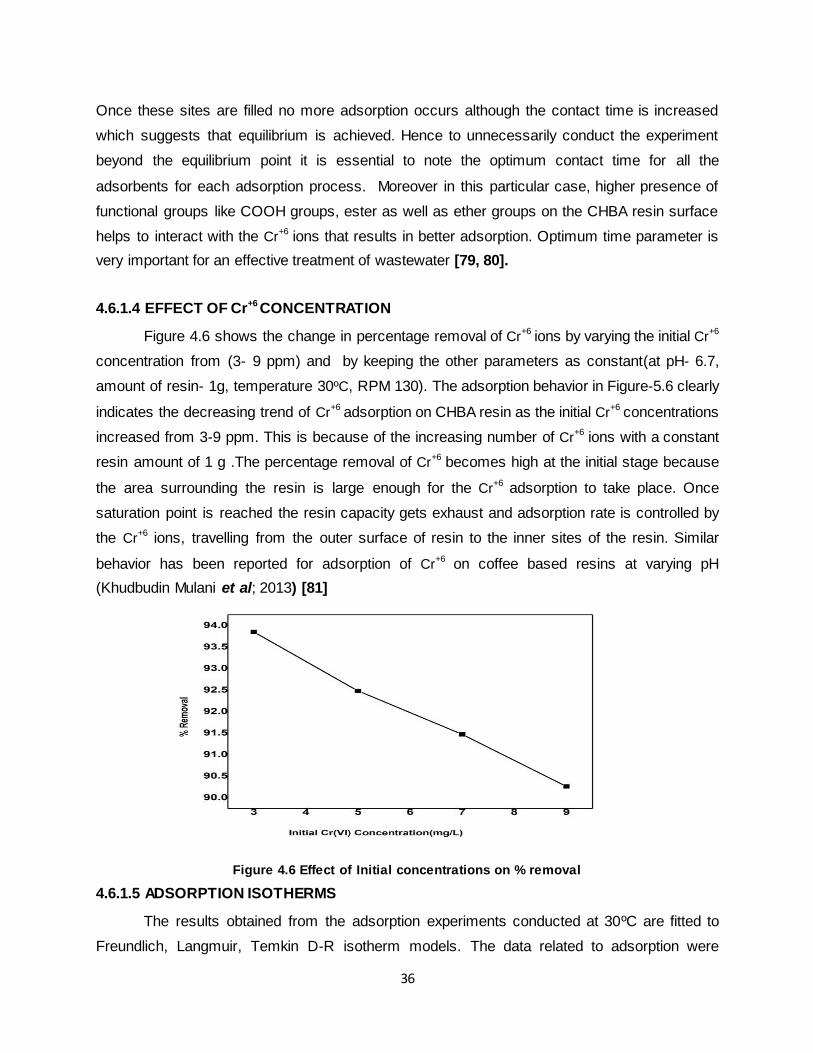
36
Once these sites are filled no more adsorption occurs although the contact time is increased
which suggests that equilibrium is achieved. Hence to unnecessarily conduct the experiment
beyond the equilibrium point it is essential to note the optimum contact time for all the
adsorbents for each adsorption process. Moreover in this particular case, higher presence of
functional groups like COOH groups, ester as well as ether groups on the CHBA resin surface
helps to interact with the Cr+6 ions that results in better adsorption. Optimum time parameter is
very important for an effective treatment of wastewater [79, 80].
4.6.1.4 EFFECT OF Cr+6 CONCENTRATION
Figure 4.6 shows the change in percentage removal of Cr+6
ions by varying the initial Cr+6
concentration from (3- 9 ppm) and by keeping the other parameters as constant(at pH- 6.7,
amount of resin- 1g, temperature 30ºC, RPM 130). The adsorption behavior in Figure-5.6 clearly
indicates the decreasing trend of Cr+6 adsorption on CHBA resin as the initial Cr
+6 concentrations
increased from 3-9 ppm. This is because of the increasing number of Cr+6
ions with a constant
resin amount of 1 g .The percentage removal of Cr+6 becomes high at the initial stage because
the area surrounding the resin is large enough for the Cr+6 adsorption to take place. Once
saturation point is reached the resin capacity gets exhaust and adsorption rate is controlled by
the Cr+6 ions, travelling from the outer surface of resin to the inner sites of the resin. Similar
behavior has been reported for adsorption of Cr+6 on coffee based resins at varying pH
(Khudbudin Mulani et al; 2013) [81]
Figure 4.6 Effect of Initial concentrations on % removal
4.6.1.5 ADSORPTION ISOTHERMS
The results obtained from the adsorption experiments conducted at 30ºC are fitted to
Freundlich, Langmuir, Temkin D-R isotherm models. The data related to adsorption were

37
applied to linear form of Freundlich plot for different adsorbent dosage 0.1, 0.5 g and 1g as
shown in the Figure 4.7, 4.8, 4.9 respectively. The higher R2 value (>0.989) shows good
agreement to Freundlich equation as depicted in the table 4.4. n value >1 was observed for all
adsorbent dosages that indicates favorable adsorption process.
Figure 4.7 Freundlich adsorption Isotherm for Cr+6 on CHBA resin of 0.1 g, 0.5 g and 1 g resin
Figure 4.8: Langmuir adsorption Isotherm for Cr+6 on CHBA resin of 0.1 g, 0.5 g and 1 g.
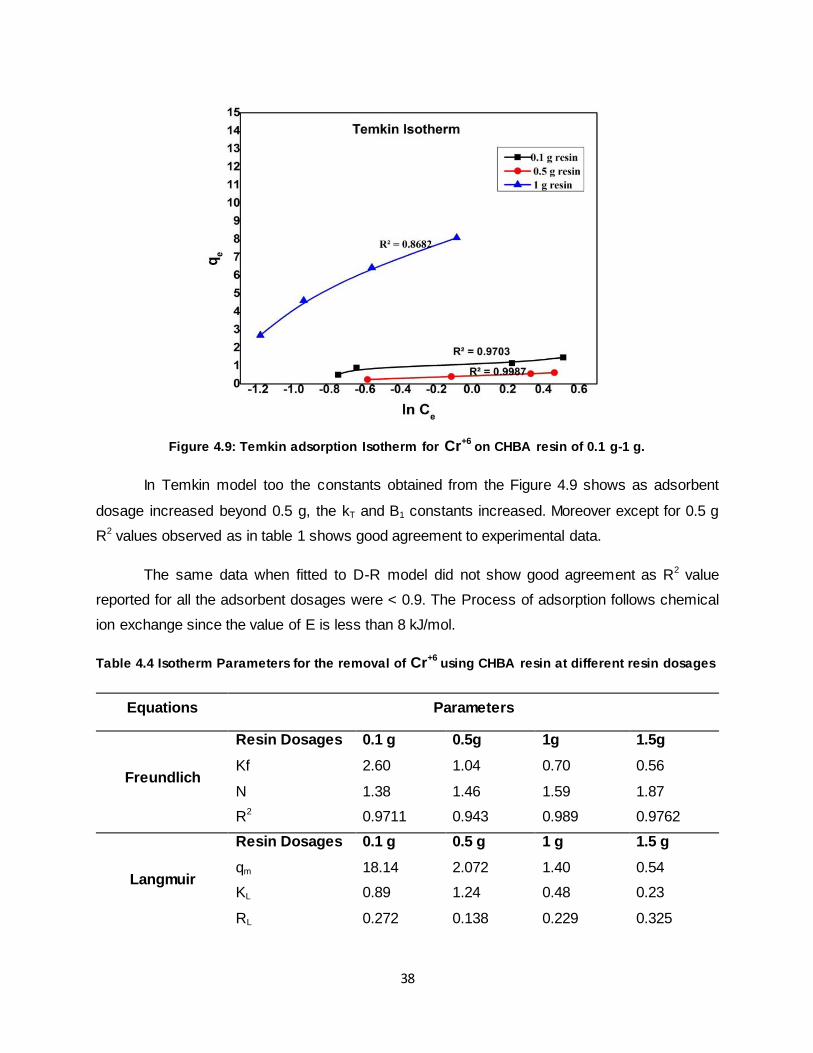
38
Figure 4.9: Temkin adsorption Isotherm for Cr+6 on CHBA resin of 0.1 g-1 g.
In Temkin model too the constants obtained from the Figure 4.9 shows as adsorbent
dosage increased beyond 0.5 g, the kT and B1 constants increased. Moreover except for 0.5 g
R2 values observed as in table 1 shows good agreement to experimental data.
The same data when fitted to D-R model did not show good agreement as R2 value
reported for all the adsorbent dosages were < 0.9. The Process of adsorption follows chemical
ion exchange since the value of E is less than 8 kJ/mol.
Table 4.4 Isotherm Parameters for the removal of Cr+6 using CHBA resin at different resin dosages
Equations Parameters
Freundlich
Resin Dosages 0.1 g 0.5g 1g 1.5g
Kf 2.60 1.04 0.70 0.56
N 1.38 1.46 1.59 1.87
R2 0.9711 0.943 0.989 0.9762
Langmuir
Resin Dosages 0.1 g 0.5 g 1 g 1.5 g
qm 18.14 2.072 1.40 0.54
KL 0.89 1.24 0.48 0.23
RL 0.272 0.138 0.229 0.325

39
R2 0.942 0.901 0.0916 0.929
Dubinin
Radushkevih
Resin Dosages 0.1 g 0.5 g 1 g 1.5 g
qs 42.23 48.67 53.27 59.81
E 0.380 0.381 0.412 0.513
R2 0.86 0.85 0.87 0.88
Temkin
Resin Dosages 0.1 g 0.5g 1g 1.5 g
KT 0.66 0.61 0.82 0.87
B1 1.9512 1.4415 2.8087 3.2215
R2 0.97 0.86 0.987 0.868
4.6.1.6 KINETIC STUDIES
To evaluate the sorption dynamics, consideration of kinetics and equilibrium studies is
essential. The uptake rate which governs contact time can only be explained through kinetic
studies. Numerous kinetic models, currently practiced to describe the process of adsorption and
its mechanism involving first order Pseudo model, second order Pseudo model, intra-particle
diffusion and elovich model. The experiment obtained at different concentration of Cr+6 (3 mg/L,
5 mg/L, 7 mg/L, 9 mg/L) has been fitted to each models as per Figures 4.8, 4.9, 4.10, 4.11
respectively. The constants obtained from individual plots have been represented in Table 4.5. It
can be clearly seen that the data obtained from the experiment being conducted is found to be
nearly fitting to second order Pseudo model equation, where R2 suggest that equilibrium is
obtained using resin for Cr+6 adsorption at a very faster rate and thereafter it remains constant.
The adsorption kinetics were calculated with varying time from 1-30 minutes. The data
obtained from the conducted experiment was allowed to fit to Pseudo first order kinetic model as
well as Pseudo second order kinetic model (Figure-4.10 & Figure -4.11). The greater R2(0.99)
value proves that the second order model was fitted well. Hence, removal of Cr+6 ions on the
surface of resin was found to be feasible to second order pseudo model as comparatively to the
first order Pseudo model[82].
The values of qe obtained from the experiment and the values of qe calculated from second
order pseudo kinetic model are found to be closer to one another.

40
Figure 4.10 Pseudo first order kinetics at different concentrations
Ks value Vs 1/T was plotted the value of ln Ks has a good linear relationship with 1/T and the
value of regression coefficient, R2 is 0.99.The equation can be written as:
𝐥𝐧 𝑲𝒔 = 𝒎𝟏
𝑻+ 𝑪 …7.1(a)
The logarithmic form of Arrhenius equation can be stated as:
𝐥𝐧 𝑲𝒔 = −𝑬𝒂
𝑹𝑻+ 𝐥𝐧 𝑨 …7.1(b)
Comparing equation (7.1) to (7.2) we get the slope as Ea/R =m thus Ea and is calculated as 4.28
KJ/mol.
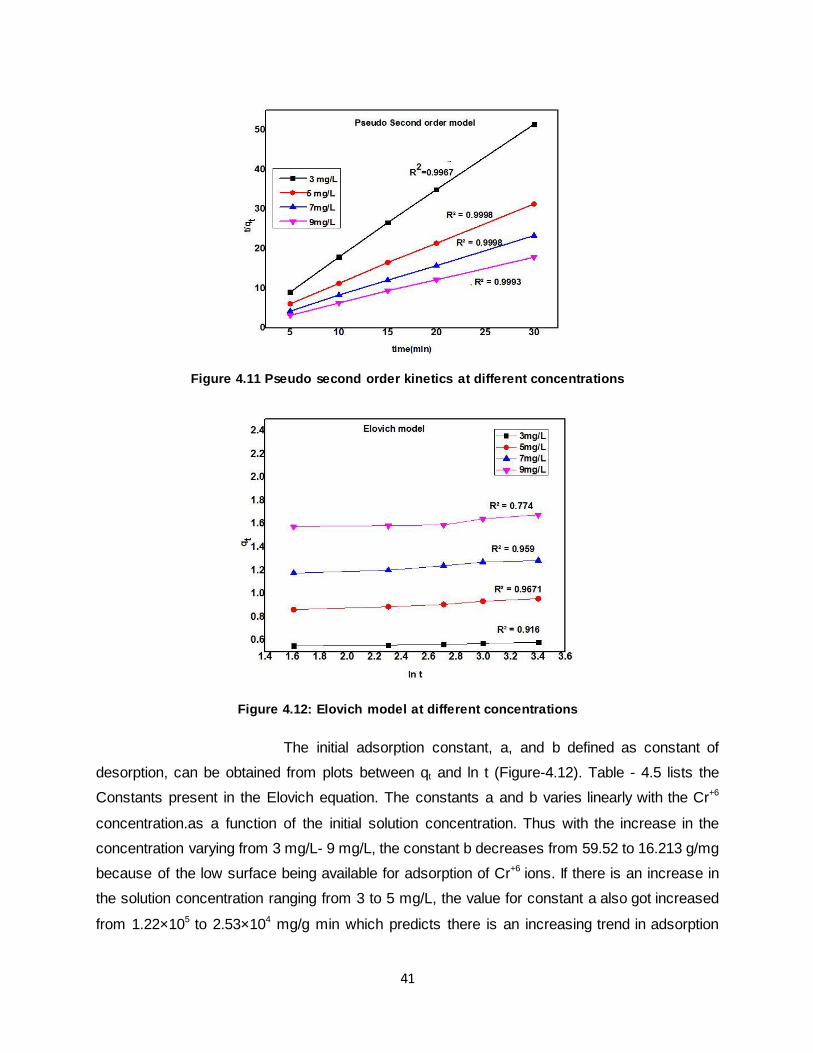
41
Figure 4.11 Pseudo second order kinetics at different concentrations
Figure 4.12: Elovich model at different concentrations
The initial adsorption constant, a, and b defined as constant of
desorption, can be obtained from plots between qt and ln t (Figure-4.12). Table - 4.5 lists the
Constants present in the Elovich equation. The constants a and b varies linearly with the Cr+6
concentration.as a function of the initial solution concentration. Thus with the increase in the
concentration varying from 3 mg/L- 9 mg/L, the constant b decreases from 59.52 to 16.213 g/mg
because of the low surface being available for adsorption of Cr+6 ions. If there is an increase in
the solution concentration ranging from 3 to 5 mg/L, the value for constant a also got increased
from 1.22×10⁵ to 2.53×10⁴ mg/g min which predicts there is an increasing trend in adsorption

42
process while decreasing trend in desorption process as the concentration of the solution is
increased. However at a higher concentration of (9 mg/L), the obtained R2 value is very poor.
In Intra-particle diffusion study kid values were calculated by the plots between qt and t1/2 in
(Figure-4.13) and corresponding values are in Table 4.5. The process follows pore diffusion.
with the increase in Cr+6 concentration from 3 mg/L to 7 mg/L the values of R2 also increases
suggesting this model is fitting to the experimental data well till 7 mg/L initial Cr+6 concentration.
Table 4.5: Kinetic Parameters for the removal of Cr+6 using CHBA resin at different Concentrations
Equations Parameters
Pseudo-first order
Concentration 3mg/L 5mg/L 7mg/L 9mg/L
qe exp(mg g-1) 0.5958 0.994 1.388 1.7882
qe cal(mg g-1) 0.62 1.10 1.52 1.84
Kf 0.3286 0.4669 0.6791 0.3358
R2 0.9708 0.9301 0.9434 0.9154
Pseudo-second
order
Concentration 3mg/L 5mg/L 7mg/L 9mg/L
qe exp(mg g-1) 0.5958 0.994 1.388 1.7882
qe cal(mg g-1) 0.5963 0.9957 1.3912 1.7898
Ks 244.55 83.35 72.77 66.41
R2 0.9997 0.9998 0.9998 0.9993
Intra-particle
diffusion
Concentration 3mg/L 5mg/L 7mg/L 9mg/L
Kid 0.0096 0.0299 0.0358 0.0328
C 0.5286 0.795 1.0976 1.488
R2 0.975 0.989 0.957 0.864
Elovich
Concentration 3mg/L 5mg/L 7mg/L 9mg/L
a(mg/g min) 1.22*105 1.47*102 3.77*102 2.53*104
b(g mg-1) 59.52 18.72 17.8571 16.213
R2 0.916 0.96 0.959 0.774

43
Figure 4.13: Intra-particle diffusion study at different concentrations
4.6.1.7 THERMODYNAMICS STUDY
The plots made between ln KL and 1/T was found to be as a straight line (Figure - 4.14)
and the slope, intercept from the corresponding plots obtained in the graph is considered for the
calculation of the enthalpy and entropy of the system and values are represented in the
following table 4.6. values of ∆H was obtained as 21.48 KJ and ∆S was obtained as
68.98KJ/mol. The ∆G value decreases from 17.87 to 2.88 kJ/mol with the increase in
temperature varying from 20 to 30ºC which suggests that there will be greater number of Cr+6
species as increase in temperature. The Positive values of change in enthalpy shows that there
is an presence of an energy barrier during the process of adsorption and the process of
adsorption follows process of endothermic reaction. The positive values in the change of
entropy (∆S) shows good binding capacity of Cr+6 ions for the resin surface and it also increases
the uncertainty of the solid solution interaction during the process of adsorption.

44
Figure 4.14 Vant Hoff plot for the adsorption of Cr+6 at various temperatures
Table 4.6: Thermodynamic Parameters values for the adsorption of resin on Cr+6 at different
temperatures
T(Kelvin) ∆Ho(kJ/mol) ∆S◦(J/mol K) ∆G(KJ/mol)
293 21.48. 68.98 17.87
298 21.48. 68.98 5.416
303 21.48. 68.98 2.887

45
Chapter 5
BATCH STUDY- DESIGN OF EXPERIMENTS
RSM is a technique which relates to a plan of Scientific and statistical systems which
have been utilized for the demonstration and investigation of a procedure which is affected by
various mathematical variables. A model in a RSM method allows to identify the impacts of
interactions on various process parameters, effects related to high order and emphasize on
getting greatest wanted response by deciding the conditions on which the model has to be
operated. [83]
A Box-Behnken Design (BBD) method employed from RSM has been explored in the
investigation to make use of the mathematical variables for removal of Cr+6 ions from drinking
water by batch process .The design model used during the experiment was BBD which consists
of three variables (Initial concentration, Resin dosage, pH), each of them with minimum as well
as maximum levels. The advantage of the model is that it is used to simplify the complex
response function by using few combinations of variables [84]. 15 experiments were required to
determine 10 coefficients of second order polynomial equation. Initial Cr+6 concentration were
taken as (3-9mg/L), pH (3-9) and resin dosage (0.3-0.9g) were taken as input variables. The
response of the system was expressed by percentage removal. The experimental table 5.1
represents the experimental design matrix derived from BBD. 3 major steps involved in
optimization process statistically designing experiments coefficients estimation, response
estimation to check the adequacy of the design model. Y= ƒ (A, B, C…An), where Y is the
response of the system and A, B, C are the variables which is called as factors. (Annadurai G.
et al; 2000).Table 5.1 shows the experimental range for each factor used and defined in three
level (low, basal and high) coded as (-1, 0, +1).
Table 5.1: Coded and actual values of variables of the experimental design.
Variable Factors Range and level
Level(-1) Level (0) Level(+1)

46
pH A 3 6 9
Dosage of adsorbent B 0.3 0.6 0.9
Initial Concentration C 3 6 9
5.1 RESULTS AND DISCUSSIONS
5.1.1 STATISTICAL ANALYSIS
About 15 experiments were examined in distinct arrangements of the constraints to
report the outcome of three factors such as Resin dosage, initial concentration, and pH (Table
5.1). It shows that the predicted and experimental data are related to percentage removals of
Cr+6.
The experimental Model data’s were well fitted to Response Surface Methodology (RSM).
[Table 5.1] and a second order quadratic polynomial equation was derived from the variables.
The equation was presented in equation –8.1.1 (a) below, where Y is represented as the yield of
experiment, A is the resin dosage, B denotes pH and C represents as initial concentration.
Y= 93.38 + 0.75 × A - 2.33 × B - 11.01 × C -1.37 × AB - 1.2 × AC + 0.19 × BC - 2.18 × A2 -
5.38× B2 - 9.27 × C2 …8.1.1 (a)
Table 5.6 shows the ANOVA for the response. Regression equation determines the major
changes in response of the values and greater F value implies the best suited model. The
corresponding values of p are less than 0.05 signifies the model is substantially significant.
(Paritosh tripathi et al; 2009)[85]
Adequacy of models is checked to illustrate the percentage removal of Cr+6 .The model
tests adequacy were carried out and the outcomes are illustrated in Table 5.3 Results obtained
shows that the p-value for the quadratic model is less than 0.05 and the R2 for the quadratic
model is found to be highest as compared with other models. Link between independent
variables and amount for Cr+6 removals was preferably demonstrated using a quadratic model.
Normality of residuals was examined from the data’s achieved. The normal probability
plot or dot diagram of the residuals was plotted as shown in Figure 5.1. Data points obtained
were found close to the straight line which proves that the chosen model adequately fits for Cr+6
removals.

47
The obtained F-values and p value of the model for determining the percentage removal
of Cr+6 is shown in the Table 5.2. The F value is 78.18 with p-value is <0.05 indicating model
expressions are substantial, whereas p greater than 0.1000 indicates models are not significant,
as shown in the table 5.3. The coefficient of determination (R2) and adjusted R2 of this model
were 0.9901 and 0.9775, respectively. The coefficient of determination (R2) is 0.9901
suggesting that 99.01% of the inconsistency in percentage removal of Cr+6 can be described by
this model. Regression also offers a technique to estimate the nature and the degree of
correlation among dependent and independent variables. If the R2 value is nearer to 1.00, the
model will be the strongest one as well the response predictions will also be improved. The
variances between values of R2 (0.9901) and adj. R2 (0.9775) are minor; as a result, the
resemblance between R2 and adjusted R2 shows the capability of the model to predict the
response.
Lack of fit F-value of 3.09 with p>0.05 implied that the lack of fit was not significant in
relative to pure error. A non-significant lack of fit is desired for fitting the model. Thus, a well-
fitted model was obtained for the equation of percentage removal.
Table 5.2: Experimental and the predicted values yields for removing Cr+6
Run Resin dosage
(A) pH(B)
Initial
Concentration( C )
Response (Adsorption %)
Y experimented Y Predicted
1 0.9 6 9 70.23 72.32
2 0.6 6 6 93.38 93.46
3 0.3 6 3 91.18 92.04
4 0.9 6 3 93.85 94.233
5 0.3 9 6 82.3 82.52
6 0.6 6 6 93.38 93.46
7 0.6 6 6 93.38 93.46
8 0.6 9 9 66.32 67.2
9 0.6 6 6 93.38 93.46
10 0.6 3 9 68.27 69.19
11 0.9 3 6 92.09 93.21
12 0.6 3 3 91.51 91.89
13 0.6 9 3 88.82 89.93

48
14 0.3 6 9 72.45 73.36
15 0.6 6 6 93.38 94.28
16 0.9 9 6 82.34 83.46
17 0.3 3 6 86.56 87.23
5.1.2 MODEL ADEQUACY
We must consider two-way interactions such as three-factor complexed system.
Statistical data were fitted to models such as Linear, interactive, quadratic and cubic to achieve
the regression equations. The best suited model to characterize Cr+6 removal using CHBA resin
were chosen by lack of fit test and model summary statistics as shown in table no-5.4 and 5.5,
All P > 0.05 for lack of fit signifies the model does not fit the data .Cubic model was neglected
whereas quadratic models was found to have maximum “R squared” and “Adjusted R-squared
“values. All three terms (A, B, C) and three 2F1 term (AB,AC, BC) from ANOVA table shows
values are significant at p< 0.05 and was found to be the most preferred model. As quadratic
model comprises terms to build the whole model for calculating the response and produces
minimum value of PRESS (predicted residual sum of squares), it indicates that the model can
be used for comparative precision in predicting future consequences and thus, promotes further
analysis [86].
Table 5.3. Adequacy of the model tested
Source Sum of
Squares Df
Mean
square F-value
P-value
Prob>F Remarks
Mean versus
Total 112400.56 1 112400.56
Linear versus
Mean 1017.99 3 339.33 7.68 0.0033
2F1 versus linear 13.65 3 4.55 0.081 0.9688
Quadratic versus
2 F1 545.24 3 181.75 81.10 <0.0001 Suggested
Cubic versus
quadratic 15.69 3 5.23 Aliased
Residual 0.0000 4 0.000

49
Total 125800.5 17 7397.09
Table 5.4: Lack of Fit Tests
Source Sum of Squares Df F values P- values Prob>F Remarks
Linear 574.58 9 16.13 0.0063
2F1 560.93 6 0.26 0.9392
Quadratic 15.69 3 49.35 0.0004 Suggested
Cubic 0.0000 0 Aliased
Pure Error 0.0000 4
Table 5.5: Model Summary Statistics
Source Std.Dev R-Squared Adjusted
R-squared
Predicted
R-Squared PRESS Remarks
Linear 6.65 0.6392 0.5560 0.4347 900.29
2 F1 7.49 0.6478 0.4365 -0.0201 1624.63
Quadratic 1.50 0.9901 0.9775 0.8424 251.01 Suggested
Cubic 0.0000 1.0000 1.0000 + Aliased
5.1.3 FITTING OF SECOND-ORDER POLYNOMIAL EQUATION AND STATISTICAL
ANALYSIS
As shows in Table 5.6, the ANOVA shows that quadratic effects of initial concentration
(C) and pH (B) were significant (p<0.05), while linear effect only initial concentration was
significant (p<0.05). A p< 0.05 shows the model is significant whereas p> 0.1000 indicates
shows insignificant models. F-value of 78.18 shows a significant model with only 0.01% chance
of increment which could occur due to noise.

50
The resin dosage does not ensure an influence on the removal of Cr+6 removals. It may
be due to the quantity between high and low limit of the resin dosage used in small range. The
initial concentration has substantial effect on the removal of Cr+6. The resin dose which is known
as the low order interaction is mainly affected due to the high significance of the initial
concentration of the Cr+6 solution[87] .The removal of Cr+6 by treating the cassia gum powder
through the preparation of the (CHBA) resin was maximum at pH 6 which is the normal drinking
water pH.
The initial concentration value of the Cr+6 solution shows an essential part during the
overall a process of adsorption and mostly on adsorption capacity. As the initial concentration of
the adsorption solution was increased, there is a larger removal with a higher ratio of available
surface to initial Cr+6 concentrations but in cases of higher concentration, there is less Cr+6
removals. With decreased in pH of adsorbed solution, there is an attraction of positively charged
functional groups near the reactive Cr+6 ions due to an increase in negative charges on the
surfaces .(Santhy K, et al; 2006)[88]
Table 5.6. ANOVA of the second-order polynomial equation
Source Sum of
squares Df
Mean
square F-value Prob>F Remarks
Model 1576.88 9 175.21 78.18 <0.0001 Significant
A-Resin
dosage
4.53 1 4.53 2.02 0.1981
B-pH 43.48 1 43.48 19.40 0.0031
C-Initial
Concentration
969.98 1 969.98 432.81 <0.0001
AB 7.54 1 7.54 3.36 0.1094
AC 5.98 1 5.98 2.67 0.1464
BC 0.14 1 0.14 0.061 0.8119
A2 20.01 1 20.01 8.93 0.0203
B2 121.76 1 121.76 54.33 0.0002
C2 362.02 1 362.02 161.53 <0.0001
Residual 15.69 7 2.24
Lack of Fit 15.69 3 5.23
Pure error 0.0000 4 0.0000

51
Moreover, the statistical analysis with standard deviation and mean are depicted in the
table-5.5. The "Pred R-Squared" of 0.8424 is acceptable with an "Adj R-Squared" of 0.9775; i.e.
the difference is less than 0.2. It was also observed that the "Adequate Precision" measures the
signal to noise ratio. A desirable ratio should always be greater than 4. The ratio of 25.555
indicates an adequate signal which concludes that this model can be used for navigation of the
design space.
5.1.4 MODEL VALIDATION
Figure 5.1: Normal probability plot of residuals for Defective percentage
Figure 5.2. Residuals versus Predicted for Defective percentage
Design-Expert® SoftwareAdsorption %
Color points by value ofAdsorption %:
93.85
66.32
Externally Studentized Residuals
Nor
mal
% P
roba
bilit
y
Normal Plot of Residuals
-6.00 -4.00 -2.00 0.00 2.00 4.00 6.00
1
5
10
20
30
50
70
80
90
95
99
Design-Expert® SoftwareAdsorption %
Color points by value ofAdsorption %:
93.85
66.32
Predicted
Ext
erna
lly S
tude
ntiz
ed R
esid
uals
Residuals vs. Predicted
-6.00
-4.00
-2.00
0.00
2.00
4.00
6.00
65 70 75 80 85 90 95
4.81963
-4.81963
0

52
Main purpose of validation is for prediction and conformation of variable response by
means of the optimal values related to process constraints. Figure 5.1 and Figure 5.2. Shows
Normal probability plot of residuals for Defective percentage and Residuals versus Predicted for
Defective percentage. Figure 5.1 show that residuals almost follow a straight line implicating
that the errors were dispersed normally. Figure 5.2 show that the point does not follow a normal
linear behavior. (Rathish Raghupathy, et al; 2014)[79]
Figure 5.3: Scatter diagram of predicted response versus actual response of Cr+6 removals
Figure.5.1 shows a graph between experimental data in relation to predicted value for Cr+6
removals (%). It was found that experimental values lie close to the straight line that indicates a
close correlation between the two. The points clustered in the parity plot (Figure 5.3) around the
diagonal line shows good fit of model. Model employed is chosen since residuals for many of
the responses are below 10 % and the residuals points lie close to the diagonal line. The
different ideas are discussed from any points lying outside the red lines. It is evident from the
Figures 5.1, 5.2 and 5.3 that all points line inside the red lines which confirms that the model fit
well to the variables.
Design-Expert® SoftwareAdsorption %
Color points by value ofAdsorption %:
93.85
66.32
Actual
Pre
dict
ed
Predicted vs. Actual
65
70
75
80
85
90
95
65 70 75 80 85 90 95

53
Figure 5.4: Perturbation Plot showing adsorption %
Perturbation plot of three independent factors is shown in Figure 5.4. The line A
represents resin dosage which does not change much from the reference point indicates a
lower significance with adsorption %. Much change can be found in line B (pH) and C (initial
Cr+6 concentrations) with respect to reference points which shows the variables are significantly
related to adsorption %.
5.1.5 INTERACTION EFFECT OF PROCESS PARAMETERS
To investigate the effect of the three parameters on the % adsorption of the resin, the
response surface methodology was adopted, and three-dimensional diagrams were plotted.
Based on the ANOVA results obtained both pH and initial concentration showed significant
effects on the % adsorption whereas resin dosage showed the least effect. The quadratic
effects of pH and initial concentration shows good fit whereas quadratic effects of resin dosage
as well as the interaction effects of all three parameters were considered moderate. The
response surface graphs of resin was shown in Figure- 5.5.
Design-Expert® SoftwareFactor Coding: ActualAdsorption % (percentage)
Actual FactorsA: resin dosage = 0.6B: pH = 6C: Initial coc = 6
-1.000 -0.500 0.000 0.500 1.000
60
70
80
90
100
AA
B
B
C
C
Perturbation
Deviation from Reference Point (Coded Units)
Adso
rptio
n %
(perc
enta
ge)

54
Figure 5.5: 3D response surface graph for Cr+6 removals versus adsorbent dose (g/L) and pH for
Adsorption of CHBA resin
The combined effects of pH and resin dosage on the response are depicted as in the
Figure 5.5.It was observed that % adsorption increased with the increasing resin dosage and pH
of 6.13 at an initial Cr+6 concentrations of 4.53 mg/L. The reason behind this is that increase in
amount of resin leads to an increase in the surface area of resin and due to the availability of
greater number of adsorption sites for Cr+6 ions Figure 5.4 also indicates that the maximum
adsorption (95.05%) occurs at a (pH 6.13) and an amount of resin dosage of 0.43 g, which
proves to be in accordance with the model. Similar results were obtained by Xinxi Zhang using
MIEX resin [89].
The interaction of AC with response to adsorption % is depicted in the Figure 5.6. The %
adsorption increases with the increase in resin dosage and it was found that the % adsorption
increases up to 4.53 mg/L and afterwards beyond 4.53 mg/L, it decreases. The decrease in the
% adsorption is due to the splitting effect of the concentration gradient between the Cr+6 ions
and the resin which causes a decrease in amount of Cr+6 adsorbed onto the unit weight of the
resin. Similar results were obtained in the removal of nickel using hypnea valentiae by
M.Rajasimman[90]
Design-Expert® SoftwareFactor Coding: ActualAdsorption % (percentage)
Design points above predicted valueDesign points below predicted value93.85
66.32
X1 = A: resin dosageX2 = B: pH
Actual FactorC: Initial coc = 6
3 4
5 6
7 8
9
0.3 0.4
0.5 0.6
0.7 0.8
0.9
60
70
80
90
100
Adsorp
tion %
(perc
enta
ge)
A: resin dosage (grams)B: pH

55
Figure 5.6: 3D response surface graph for Cr+6 removals versus adsorbent dose (g/L) and initial
concentration for Adsorption of CHBA resin
The interaction of BC with response as adsorption % is depicted in Figure 5.7. Which
can be explained as follows: with the increase in pH, the % adsorption increases slightly but at
higher concentration of pH, the % adsorption decreases. But with the increase in initial
concentration, the curve decreases and at lower initial concentration the % adsorption is
maximum. But if both the factors were observed, then the maximum % adsorption occurs at pH
of 6.12 while initial concentration at 4 ppm. The observations can conclude that among all the
interactions (AB, BC, AC) initial concentration and pH mainly governed the % removal.
Figure 5.7: 3D response surface graph for Cr+6 removals versus adsorbent pH and initial
concentration for Adsorption of CHBA resin
Design-Expert® SoftwareFactor Coding: ActualAdsorption % (percentage)
Design points above predicted valueDesign points below predicted value93.85
66.32
X1 = A: resin dosageX2 = C: Initial coc
Actual FactorB: pH = 6
3 4
5 6
7 8
9
0.3 0.4
0.5 0.6
0.7 0.8
0.9
60
70
80
90
100
Adsorp
tion %
(perc
enta
ge)
A: resin dosage (grams)C: Initial coc (mg/l)
Design-Expert® SoftwareFactor Coding: ActualAdsorption % (percentage)
Design points above predicted valueDesign points below predicted value93.85
66.32
X1 = B: pHX2 = C: Initial coc
Actual FactorA: resin dosage = 0.6
3 4
5 6
7 8
9
3 4
5 6
7 8
9
60
70
80
90
100
Adso
rption %
(perc
enta
ge)
B: pHC: Initial coc (mg/l)
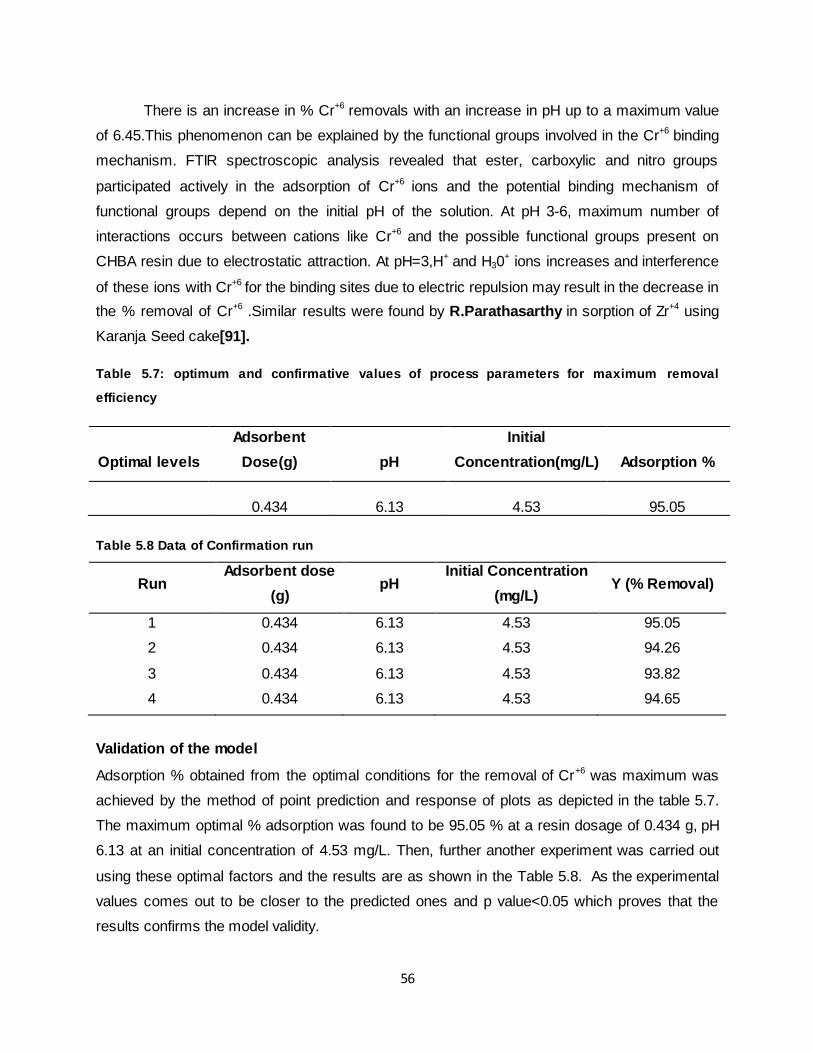
56
There is an increase in % Cr+6 removals with an increase in pH up to a maximum value
of 6.45.This phenomenon can be explained by the functional groups involved in the Cr+6 binding
mechanism. FTIR spectroscopic analysis revealed that ester, carboxylic and nitro groups
participated actively in the adsorption of Cr+6 ions and the potential binding mechanism of
functional groups depend on the initial pH of the solution. At pH 3-6, maximum number of
interactions occurs between cations like Cr+6 and the possible functional groups present on
CHBA resin due to electrostatic attraction. At pH=3,H+
and H30+ ions increases and interference
of these ions with Cr+6 for the binding sites due to electric repulsion may result in the decrease in
the % removal of Cr+6 .Similar results were found by R.Parathasarthy in sorption of Zr+4 using
Karanja Seed cake[91].
Table 5.7: optimum and confirmative values of process parameters for maximum removal
efficiency
Optimal levels
Adsorbent
Dose(g)
pH
Initial
Concentration(mg/L)
Adsorption %
0.434
6.13
4.53
95.05
Table 5.8 Data of Confirmation run
Run Adsorbent dose
(g) pH
Initial Concentration
(mg/L) Y (% Removal)
1 0.434 6.13 4.53 95.05
2 0.434 6.13 4.53 94.26
3 0.434 6.13 4.53 93.82
4 0.434 6.13 4.53 94.65
Validation of the model
Adsorption % obtained from the optimal conditions for the removal of Cr+6 was maximum was
achieved by the method of point prediction and response of plots as depicted in the table 5.7.
The maximum optimal % adsorption was found to be 95.05 % at a resin dosage of 0.434 g, pH
6.13 at an initial concentration of 4.53 mg/L. Then, further another experiment was carried out
using these optimal factors and the results are as shown in the Table 5.8. As the experimental
values comes out to be closer to the predicted ones and p value<0.05 which proves that the
results confirms the model validity.

57
Chapter 6
RESULTS AND DISCUSSION- COLUMN
ADSORPTION
6.1 EFFECT OF PARAMETERS
6.1.1 EFFECT OF BED HEIGHT
Figure. 6.1 represents the curve of breakthrough that is acquired for removal of Cr+6 ions
at various bed heights inside the column of 2, 4 and 6 cm, at a rate of flow of 3 ml/min which is
kept as constant and Cr+6 concentration as 20 ppm. it was concluded that the time required to
achieve the breakthrough curve as well as the time required by the column bed for complete
exhaustion increases as the height of the bed increases providing greater adsorption sites. At a
definite concentration of 20 mg/L, percentage removal of Cr+6 ions increases slowly ranging
from 67.14% – 71.42%. However the maximum removal 94.23 % was reported for Cr+6
concentration of 5 ppm with a maximum height of bed as (6cm). With the increase in height of
bed, percentage of removal of Cr+6 also increased because of the higher area being available at
the surface of the resin and therefore due to this higher area there will be more vacant
adsorption sites which will be available for the occurrence of the process of adsorption.
Moreover, with the increase in height of bed, the Cr+6 ions gets chance of more contact time to
interact with the resin which results in higher Cr+6 removal from the column bed.
The breakthrough curve was to some extent reduced with enhancement of the height of
bed, which brought about broadened mass exchange zone. Similar behavior was also reported
in column studies for heavy metal removal using macro fungus [92] Hence as the bed height
increases, the operation of column was simultaneously improved and continued to reduce the
resin concentration at the end of the system. The maximum the bed height, the less time will be
required by the adsorbent for bed to exhaust resulting in operating the bed for larger time period
without affecting the resin amount in the bed. Similar findings have been suggested during
column studies for nitrate removal by resins.

58
Figure 6.1: Effect of bed height
6.1.2 EFFECT OF SUPERFICIAL VELOCITY
The impact on the superficial velocity in the process of adsorption by resin was carried
through keeping constant Cr+6 concentration of (20 mgL−1), temp around (25ºC) and depth of
bed as (6cm), at a constant pH of 6.7. The superficial velocity can be maintained with the help
of peristaltic pump from 3 to 7mLmin−1. When the flow velocity is minimum, the performance of
column was better. [Figure-6.2]
Figure 6.2: Effect of superficial velocity

59
When the flow velocity is low, the process of adsorption was very rapid initially because
of the greater sites of adsorption so that the Cr+6 ions will be captured around the surface of the
resin. During the next process, the Cr+6 ions as already being occupied by these sites, the
capacity of uptake will be less. From the Figure- 6.2, the time required by initial breakthrough
curve and the time required by the bed to get exhaust gives breakthrough curves as steeper as
possible, as the flow velocity decreases from 3 - 7mLmin−1. The superficial velocity also has a
strong impact on the Cr+6
adsorption capacity. With the increase in superficial velocity ranging
from 3 - 7 mLmin−1 the % removal decreases from 67.14% to 42.06% [Table 6.1.]. It is because
of the insufficient contact time between the Cr+6 ions and the resin as the metal ions could not
diffuse into the resin pores [93].
6.1.3 EFFECT OF INLET CONCENTRATION
The inlet Cr+6
concentrations have a strong effect on the curves of breakthrough at a
definite bed depth as 6 cm with a constant rate of flow of 3ml/min is Figure 6.3. with the
increase in Cr+6 concentration ranging from 5- 20mg/l, there is a slight reduction in the time of
break point. While with the decrease in the initial Cr+6 concentrations, the steeper will be the
curves of breakthrough and reduction of breakthrough volume also occurs. Contrary behavior
have been reported by other authors where with increase in solute concentration, the
breakthrough curve becomes steeper [93,94]. With the decrease in concentration, the active
sites of resin are sufficient enough to adsorb the cr+6 ions however with increase in
concentration, the bed gets exhausted or saturated and hence the process becomes slow at
higher concentrations.
Figure 6.3: Effect of initial Cr+6 concentrations

60
6.2 REGENERATION STUDIES
The study is based on the reusability of the resin to understand the prospective
capability of adsorption process. Therefore, resin regeneration plays a significant role during the
improvement of commercial fields. Regeneration means Cr+6
removals from the resin surface.
This process should produce Cr+6 concentration of less amount, without harming the resin
capacity so that the resin can be further reused for different cycles of adsorption and desorption.
During the regeneration study (Figure- 6.4), removal of Cr+6 was done with the help of 0.1N HCl
at a rate of flow of 3mLmin−1 which is kept constant, and depth of the bed as 6cm along with
20mgL−1 of Cr+6 solution. It was observed that maximum regeneration could be achieved within
30 minutes. Then as soon as the Cr+6 ions are retrieved, the resin which was reused was again
washed with the help of distilled water and then again allowed to mix with the Cr+6
concentrations. Different cycles of adsorption and then desorption were followed by keeping the
same optimum conditions. During the time of resin regeneration followed by different cycles, the
bed depth is always kept as constant. During the proceedings of resin regeneration through
different cycles, there was a slight decrease in the breakthrough curve time. The resin
regeneration being conducted provides 89.36 % for Cr+6 .Similar experiments were conducted
repeatedly for four cycles which is presented in Figure 6.5. There was no significant changes in
regeneration observed after first cycle.
Figure 6.4 Plot of Regeneration

61
Figure 6.5 Regeneration at different Cr+6
concentrations
Table: 6.1: Parameters from column studies
Bed Height
(Cm)
Co
(mg/L)
Q
(mL/min)
Qtotal
(mg)
mtotal Total
removal %
Qeq
(mg/g)
Ceq
(mg/L)
2 20 3 1.41 2.1 67.14% 0.486 16.571
4 20 3 1.92 2.76 69.56% 0.331 11.23
6 20 3 2.10 2.94 71.42% 0.241 11.21
2 20 3 1.41 2.1 67.14% 0.486 16.571
2 20 5 1.97 3.5 56% 0.848 5.942
2 20 7 2.11 4.9 43.06% 0.727 11.38
2 5 3 0.49 0.52 94.23% 0.168 1.285
2 10 3 0.86 1.05 81.90% 0.296 1.80
2 15 3 1.14 1.575 72.38% 0.393 4.14
2 20 3 1.41 2.1 67.14% 0.486 16.571
6.3 MODELING OF BREAKTHROUGH CURVE
6.3.1 THOMAS MODEL
The plots between ln (Co/Ct-1) and time in (min) was used to calculate the constants
known as kth and qo as per the Figure 6.6 and Table 6.2 represents the values of these
constants. With the increase in the Cr+6 concentration and rate of flow, there is a decrease in the
constants values of qo , KTH . Similarly Figure 6.7 shows the plot between ln (Co/Ct-1) and time
89.36% 90%
90.08%
0
1
2
3
4
5
6
Cr+6
Conce
ntr
ati
on(m
g/L
)
Time(min)
90.42

62
(min) at varying flow rate. It can be observed from the Table 6.2 that if the depth of the bed
increases then the corresponding constant value qo also tends to increase while KTH tends to
decrease .The maximum value of R2 is found with the low flow rate and maximum height of the
column bed. [95]
Table 6.2: Parameters using Thomas Model
Figure 6.6: Effect of bed height in Thomas model
Conc
(mg/L)
Bed height
(cm)
Flow rate
(mL/min) Kth qo R2
5 6 3 0.0033 1432.72 0.99
10 6 3 0.00143 3184.63 0.986
15 6 3 0.00083 3680.43 0.97
20 6 3 0.00042 4623.21 0.99
5 2 3 0.00169 3834.07 0.99
5 4 3 0.00074 3784.17 0.98
5 6 3 0.00029 1463.06 0.971

63
Figure 6.7 Effect of Flow rate in Thomas model
6.3.2 YOON-NELSON MODEL
The plots between ln (Ct/ (Co-Ct)) and time is used to calculate the constants of the
model known as KYN and τ [Figure 6.8 & Figure 6.9].The Table 6.3 represents the respective
values of the constants. It is to be noted that the rate constant KYN tends to increase with the
increase in Cr+6 concentration along with the decreasing trend of achieving 50% of the
breakthrough time ,τ. With the increase in bed depth, the value of the breakthrough time, τ tends
to increase whereas the constant called as KYN shows a decreasing trend. With the increase in
rate of flow, the constants of the model KYN and τ displays an decreasing trend. [96]
Table 6.3: Parameters obtained from Yoon Nelson Model
Conc
(mg/L)
Bed Height
(Cm)
Flow Rate
(mL/min) KYN Τ R2
5 2 3 0.00647 54.846 0.99
5 4 3 0.00876 43.83 0.97
5 6 3 0.00965 31.49 0.97
5 6 3 0.0160 246.53 0.97
5 6 5 0.018 223.98 0.97
5 6 7 0.021 202.96 0.97

64
Figure 6.8 Effect of Flow Rate in Yoon-nelson model
Figure 6.9 Effect of Bed-height in Yoon-nelson model
6.3.3 ADAM- BOHART MODEL
With the increase in Cr+6 concentration, the constant of Adam-bohart’s model tends to
increase whereas with the increase in the rate of flow, it gets decreased as evident from Table
6.4. The values of the constants are estimated from the plots Figure 6.10 & Figure 6.11.
Increase in Cr+6 concentrations and increase in the rate of flow reduces the respective constant
values related to KAB . This demonstrated the occurrence of exchange of mass externally into
the interior surface available for adsorption controls the general framework of kinetics present

65
inside the column. In spite of the fact that the Adam-Bohart model proposes a basic and
extensive methodology for assessment of adsorption-section test, its legitimacy is constrained
to the scope of conditions utilized [97]. The coefficient of regression, R2 lies somewhere around
0.78 and 0.89.
Table 6.4: Parameters obtained from Adam Bohart Model
Conc(mg/L) Bed
Height(Cm)
Flow
rate(mL/min) KAB No Uo R2
5 6 3 0.00537 259.306 0.954 0.78
10 6 3 0.000846 329.63 0.954 0.82
15 6 3 0.000672 440.26 0.954 0.87
20 6 3 0.000423 872.65 0.954 0.89
5 2 3 0.00015 1140.835 0.5979 0.86
5 4 3 0.00037 2190.35 0.3989 0.85
5 6 3 0.00041 3119.04 0.2990 0.74
5 6 3 0.00016 302.98 0.5979 0.89
5 6 5 0.00070 119.20 0.8968 0.89
5 6 7 0.00089 43.219 1.1958 0.84
Figure 6.10: Effect of Flow rate in Adam-Bohart Model

66
Figure 6.11: Effect of Flow rate in Adam-Bohart Model

67
Chapter 7
CONCLUSIONS
Natural resin using cassia gum powder and 4-hydroxybenzoic acid was synthesized at
definite process condition.
Optimum conditions for removal of Cr+6 ions (3ppm) using CHBA cation exchange resin
at pH of 5-7 , resin amount as 1 g at contact time ~25 min
The maximum adsorption (99.26%) occurs at 3 ppm of initial concentration using the
prepared natural CHBA resin to remediate Cr+6 from the drinking water which is generally
at low ppm.
The process of adsorption is followed by second order Pseudo model through the study
of kinetics (R2=0.99). Activation energy was reported as 4.28 KJ/mol. The information
obtained from data proves the adequacy towards Freundlich isotherm (R2-0.99) when
the process is said to be in equilibrium and the surface where the adsorption occurs was
heterogeneous by nature.
The hypothetical and analyzed values are closer to each other which prove to be in
worthy agreement relating in CHNS analysis.
FTIR report suggested the addition of N=O group to the prepared resin
The enthalpy values comes out to be positive which indicates that the process of
adsorption is followed by endothermic reaction as well as the entropy values also comes
out to be positive shows good binding capacity of Cr+6 ions for the resin surface and it
also increases the uncertainty of the solid solution interaction during the process of
adsorption.
RSM demonstrated as a helpful system for concentrating on the impact of few
components with the variation in their respective response and performing a
predetermined number of tests. A second-degree polynomial equation was obtained with
the maximum coefficient of regression (R2) estimation of 99 %.
Results also showed that the ideal conditions required for Cr+6 adsorption were as per
the following: amount of resin as (0.43g), at pH (6.13) as well as Initial Concentration of
(4.53) with the value of maximum adsorption is 95.05%. The following results were
obtained from the box-behenkn design RSM method with a desirability of 0.989.

68
The Column performances were evaluated by varying the amount of resin inside the
column bed, influent rate of flow with Cr+6 concentrations. Furthermore it was seen that
with the expansion in height or depth of the bed, the column performance was good or
proved to be better.
The operation of the column is said to be better in lower stream rates at than at higher
rates of stream. At low flow rate, the process of adsorption becomes very rapid initially
during lower stream rates because of the accessibility for vacant sites of adsorption in
such a way that that the presence of Cr+6 ions could be captured around the surface of
the resin.
The experimental column data were also expressed in column adsorption models
namely Thomson, Yoon-nelson, and Adam-Bohart’s model. The data related to the Cr+6
adsorption was adequately fitted to the Thomas model with estimated correlated curve
as (r2=0.99).

69
Scope for Further Research
Various low cost natural adsorbents such as activated charcoal, wheat grain, activated
neem leaf powder prepared from activated carbon and groundnut shell powder, Orange Peel,
Avena monida (oat), sawdust, rice husk, Papaya wood , maize leaf, modified sawdust of walnut,
cocoa shells needs frequent regeneration .All these adsorbents has a major demerit as it
requires regeneration, results in loss of adsorbents and is limited to applications for cr+6 removal
at low pH(<2).
Hence resins have been a good alternative to reduce cr+6.It possess great mechanical
properties, good imperviousness to ecological degradation, great glue like properties, low
shielding properties ,low shrinkage, easy and quick curing etc. It has been used extensively to
treat drinking water due to its important properties such as applicability at neutral pH and
capability to treat low concentration of pollutant. The hydrophobic nature can only be seen with
the resins which are prepared from divinyl benzene-styrene. Resins which are synthesized
mainly from products of petrochemicals, are quite expensive. The two important parameters like
the functional groups residing in the resin as well as pH of the respective solution is totally
dependent on their capacity of Ion-exchange. Some of the important properties of Ion exchange
resins are they are hydrophobic in nature and are non- biodegradable. This is because of the
reason of the expansion in the costs of petrochemical items so that Natural man-made materials
could be used instead of this ion exchange resins. Tamarind kernel powder, Guar gum Powder,
Xanthium gum powder, Sesbania gum powder etc. are extensively used natural products which
have been employed for the treatment of waste water by removing several metal ions Such
materials are biodegradable as well as are less costly. A few metals holds resins consisting of a
series of complexing or chelating lignin’s that have been accounted to adequately remove
overwhelming metal ions. Thus, due to the increment in contamination level in the water, these
types of new materials are employed and this research reports the feasibility of removal of cr+6
ions from water using cassia gum powder resin which is eco-friendly, biodegradable and has
high therapeutic property.

70
References
[1] Richard, F. C., & Bourg, A. C. (1991). Aqueous geochemistry of chromium: a review. Water
Research, 25(7), 807-816.
[2] Elwakeel, K. Z. (2010). Environmental application of chitosan resins for the treatment of water and wastewater: a review. Journal of Dispersion Science and Technology, 31(3), 273-
288.
[3] Gandhi, N., Sirisha, D., & Sekhar, K. C. (2013). Adsorption studies of chromium by using low
cost adsorbents. Our Nature, 11(1), 11-16.
[4]Rane, N. M., & Sapkal, R. S. Chromium (VI) removal by using orange peel powder in batch
adsorption. Carbon, 5, 8.
[5]Gardea-Torresdey, J. L., Tiemann, K. J., Armendariz, V., Bess-Oberto, L., Chianelli, R. R., Rios, J., & Gamez, G. (2000). Characterization of Cr (VI) binding and reduction to Cr (III) by the agricultural byproducts of Avena monida (Oat) biomass. Journal of Hazardous Materials, 80(1),
175-188.
[6]Dakiky, M., Khamis, M., Manassra, A., & Mereb, M. (2002). Selective adsorption of chromium (VI) in industrial wastewater using low-cost abundantly available adsorbents. Advances in Environmental Research, 6(4), 533-540.
[7]Meunier, N., Laroulandie, J., Blais, J. F., & Tyagi, R. D. (2003). Cocoa shells for heavy metal
removal from acidic solutions. Bioresource Technology,90(3), 255-263.
[8]Ajmal, M., Rao, R. A. K., Anwar, S., Ahmad, J., & Ahmad, R. (2003). Adsorption studies on rice husk: removal and recovery of Cd (II) from wastewater. Bioresource Technology, 86(2), 147-149.
[9] Singha, B., & Das, S. K. (2011). Biosorption of Cr (VI) ions from aqueous solutions: kinetics, equilibrium, thermodynamics and desorption studies. Colloids and Surfaces B: Biointerfaces, 84(1), 221-232.
[10] Sarin, V. K., Kent, S. B., & Merrifield, R. B. (1980). Properties of swollen polymer networks. Solvation and swelling of peptide-containing resins in solid-phase peptide synthesis. Journal of
the American Chemical Society,102(17), 5463-5470.
[11] Saha, B., Iglesias, M., Dimming, I. W., & Streat, M. (2000). Sorption of trace heavy metals by thiol containing chelating resins. Solvent Extraction and Ion Exchange, 18(1), 133-167.
[12] Birinci, E., Gülfen, M., & Aydın, A. O. (2009). Separation and recovery of palladium (II) from base metal ions by melamine–formaldehyde–thiourea (MFT) chelating
resin. Hydrometallurgy, 95(1), 15-21.
[13]Jost, G., Martens-Habbena, W., Pollehne, F., Schnetger, B., & Labrenz, M. (2010). Anaerobic sulfur oxidation in the absence of nitrate dominates microbial chemoautotrophy beneath the pelagic chemocline of the eastern Gotland Basin, Baltic Sea. FEMS Microbiology
Ecology, 71(2), 226-236.

71
[14]Chen, C. Y., Lin, M. S., & Hsu, K. R. (2008). Recovery of Cu (II) and Cd (II) by a chelating
resin containing aspartate groups. Journal of Hazardous Materials, 152(3), 986-993.
[15]Sanchez, J. M., Hidalgo, M., & Salvado, V. (2001). The selective adsorption of gold (III) and palladium (II) on new phosphine sulphide-type chelating polymers bearing different spacer arms: Equilibrium and kinetic characterisation. Reactive and Functional Polymers, 46(3), 283-291.
[16] Rao Popuri, S., Jammala, A., Reddy, N. S., Venkata, K., & Abburi, K. (2007). Biosorption of hexavalent chromium using tamarind (Tamarindus indica) fruit shell-a comparative
study. Electronic Journal of Biotechnology,10(3), 358-367.
[17] Bessbousse, H., Rhlalou, T., Verchère, J. F., & Lebrun, L. (2008). Removal of heavy metal ions from aqueous solutions by filtration with a novel complexing membrane containing poly
(ethyleneimine) in a poly (vinyl alcohol) matrix. Journal of Membrane Science, 307(2), 249-259.
[18] Rivas, B. L., del Carmen Aguirre, M., & Pereira, E. (2007). Cationic water‐soluble polymers with the ability to remove arsenate through an ultrafiltration technique. Journal of Applied Polymer Science, 106(1), 89-94.
[19] Kaşgöz, H., Durmuş, A., & Kaşgöz, A. (2008). Enhanced swelling and adsorption properties
of AAm‐AMPSNa/clay hydrogel nanocomposites for heavy metal ion removal. Polymers for Advanced Technologies, 19(3), 213-220.
[20] Li, N., & Bai, R. (2005). A novel amine-shielded surface cross-linking of chitosan hydrogel beads for enhanced metal adsorption performance. Industrial & Engineering Chemistry
Research, 44(17), 6692-6700.
[21] Huang, S. H., & Chen, D. H. (2009). Rapid removal of heavy metal cations and anions from aqueous solutions by an amino-functionalized magnetic nano-adsorbent. Journal of Hazardous
Materials, 163(1), 174-179.
[22] Rafati, L., Mahvi, A. H., Asgari, A. R., & Hosseini, S. S. (2010). Removal of chromium (VI) from aqueous solutions using Lewatit FO36 nano ion exchange resin. International Journal of
Environmental Science & Technology, 7(1), 147-156.
[23] Rengaraj, S., Yeon, K. H., & Moon, S. H. (2001). Removal of chromium from water and
wastewater by ion exchange resins. Journal of Hazardous Materials, 87(1), 273-287.
[24] Gode, F., & Pehlivan, E. (2005). Removal of Cr (VI) from aqueous solution by two Lewatit-
anion exchange resins. Journal of Hazardous Materials,119(1), 175-182.
[25] Shi, T., Wang, Z., Liu, Y., Jia, S., & Changming, D. (2009). Removal of hexavalent chromium from aqueous solutions by D301, D314 and D354 anion-exchange resins. Journal of
Hazardous Materials, 161(2), 900-906.
[26] Hu, X. J., Wang, J. S., Liu, Y. G., Li, X., Zeng, G. M., Bao, Z. L., & Long, F. (2011). Adsorption of chromium (VI) by ethylenediamine-modified cross-linked magnetic chitosan resin:
isotherms, kinetics and thermodynamics. Journal of Hazardous Materials, 185(1), 306-314.
[27] Wang, T., & Li, Z. (2004). High-temperature reduction of chromium (VI) in solid
alkali. Journal of Hazardous Materials, 112(1), 63-69.

72
[28] Sharma, P., Mohapatra, B., Singh, P., Nayak, P., & Mishra, S. Trace and Rare Earth
Geochemistry in Chromiferous Ultramafic Complex of Sukinda and Their Genetic Implication.
[29] Pradhan, J., Das, S. N., & Thakur, R. S. (1999). Adsorption of hexavalent chromium from aqueous solution by using activated red mud. Journal of Colloid and Interface Science, 217(1),
137-141.
[30] Costa, M. (1997). Toxicity and carcinogenicity of Cr (VI) in animal models and
humans. Critical Reviews in Toxicology, 27(5), 431-442.
[31] Xu, Y. B., Xiao, H. H., & Sun, S. Y. (2005). Study on anaerobic treatment of wastewater
containing hexavalent chromium. Journal of Zhejiang University. Science. B, 6(6), 574.
[32] Gupta, V. K., Gupta, M., & Sharma, S. (2001). Process development for the removal of lead and chromium from aqueous solutions using red mud—an aluminium industry waste. Water
Research, 35(5), 1125-1134.
[33] Kiptoo, J. K., Ngila, J. C., & Sawula, G. M. (2004). Speciation studies of nickel and
chromium in wastewater from an electroplating plant. Talanta,64(1), 54-59.
[34] Bai, M. T., Ratnam, M. V., Rao, D. S., & Venkateswarlu, P. (2005). Removal of Chromium from Waste Water by Adsorption with Used Coffee Powder.Emerging Trends in Mineral
Processing and Extractive Metallurgy, 414.
[35] Esmaeili, A., & Vazirinejad, R. (2005). Chromium (III) removal and recovery from tannery
wastewater by precipitation process.
[36] Song, Z., Williams, C. J., & Edyvean, R. G. J. (2000). Sedimentation of tannery
wastewater. Water Research, 34(7), 2171-2176.
[37] Baral, A., & Engelken, R. D. (2002). Chromium-based regulations and greening in metal
finishing industries in the USA. Environmental Science & Policy, 5(2), 121-133.
[38] Pagana, A. E., Sklari, S. D., Kikkinides, E. S., & Zaspalis, V. T. (2008). Microporous ceramic membrane technology for the removal of arsenic and chromium ions from contaminated
water. Microporous and Mesoporous Materials, 110(1), 150-156.
[39] Moura, R. C., Bertuol, D. A., Ferreira, C. A., & Amado, F. D. (2012). Study of chromium removal by the electrodialysis of tannery and metal-finishing effluents. International Journal of
Chemical Engineering,
[40] Gherasim, C. V., & Bourceanu, G. (2013). Removal of chromium (VI) from aqueous solutions using a polyvinyl-chloride inclusion membrane: Experimental study and
modelling. Chemical Engineering Journal, 220, 24-34.
[41] Hasan, M. A., Selim, Y. T., & Mohamed, K. M. (2009). Removal of chromium from aqueous waste solution using liquid emulsion membrane. Journal of Hazardous Materials, 168(2), 1537-1541.
[42] Gueye, M., Richardson, Y., Kafack, F. T., & Blin, J. (2014). High efficiency activated carbons from African biomass residues for the removal of chromium (VI) from wastewater. Journal of Environmental Chemical Engineering, 2(1), 273-281.

73
[43] Arulkumar, M., Thirumalai, K., Sathishkumar, P., & Palvannan, T. (2012). Rapid removal of chromium from aqueous solution using novel prawn shell activated carbon. Chemical Engineering Journal, 185, 178-186.
[44] Zhang, H., Tang, Y., Cai, D., Liu, X., Wang, X., Huang, Q., & Yu, Z. (2010). Hexavalent chromium removal from aqueous solution by algal bloom residue derived activated carbon: equilibrium and kinetic studies. Journal of Hazardous Materials, 181(1), 801-808.
[45] Al-Othman, Z. A., Ali, R., & Naushad, M. (2012). Hexavalent chromium removal from aqueous medium by activated carbon prepared from peanut shell: adsorption kinetics,
equilibrium and thermodynamic studies. Chemical Engineering Journal, 184, 238-247.
[46] Ullah, I., Nadeem, R., Iqbal, M., & Manzoor, Q. (2013). Biosorption of chromium onto native
and immobilized sugarcane bagasse waste biomass. Ecological Engineering, 60, 99-107.
[47] Mona, S., Kaushik, A., & Kaushik, C. P. (2011). Biosorption of reactive dye by waste biomass of Nostoc linckia. Ecological Engineering, 37(10), 1589-1594.
[48] Sari A., & Tuzen, M. (2008). Biosorption of total chromium from aqueous solution by red algae (Ceramium virgatum): equilibrium, kinetic and thermodynamic studies. Journal of
Hazardous Materials, 160(2), 349-355.
[49] Uluozlu, O. D., Sari, A., Tuzen, M., & Soylak, M. (2008). Biosorption of Pb (II) and Cr (III) from aqueous solution by lichen (Parmelina tiliaceae) biomass. Bioresource Technology, 99(8),
2972-2980.
[50] Han, X., Wong, Y. S., Wong, M. H., & Tam, N. F. Y. (2007). Biosorption and bioreduction of
Cr (VI) by a microalgal isolate, Chlorella miniata. Journal of Hazardous Materials, 146(1), 65-72.
[51] Sari, A., Mendil, Durali., Tuzen, M., & Soylak, M. (2008). Biosorption of Cd (II) and Cr (III) from aqueous solution by moss (Hylocomium splendens) biomass: Equilibrium, kinetic and
thermodynamic studies. Chemical Engineering Journal, 144(1), 1-9.
[52] Pakzadeh, B., & Batista, J. R. (2011). Chromium removal from ion-exchange waste brines
with calcium polysulfide. Water Research, 45(10), 3055-3064.
[53] Petruzzelli, D., Passino, R., & Tiravanti, G. (1995). Ion exchange process for chromium removal and recovery from tannery wastes. Industrial & Engineering Chemistry
Research, 34(8), 2612-2617.
[54] Chmielewski, A. G., Urbański, T. S., & Migdał, W. (1997). Separation technologies for
metals recovery from industrial wastes. Hydrometallurgy,45(3), 333-344.
[55] Lin, S. H., & Kiang, C. D. (2003). Chromic acid recovery from waste acid solution by an ion exchange process: equilibrium and column ion exchange modeling. Chemical Engineering
Journal, 92(1), 193-199.
[56] Yalcin, S., Apak, R., Hizal, J., & Afşar, H. (2001). Recovery of copper (II) and chromium (III, VI) from electroplating-industry wastewater by ion exchange. Separation Science and
Technology, 36(10), 2181-2196.

74
[57] Rengaraj, S., Joo, C. K., Kim, Y., & Yi, J. (2003). Kinetics of removal of chromium from water and electronic process wastewater by ion exchange resins: 1200H, 1500H and IRN97H. Journal of Hazardous Materials, 102(2), 257-275.
[58] Cavaco, Sofia. A., Fernandes, S., Quina, M. M., & Ferreira, L. M. (2007). Removal of chromium from electroplating industry effluents by ion exchange resins. Journal of Hazardous Materials, 144(3), 634-638.
[59] Akcin & Gulten. (2013). Removal and recovery of chromium from solutions simulating tannery wastewater by strong acid cation exchanger. Journal of Chemistry, 2013.
[60] Gode, F., & Pehlivan, E. (2003). A comparative study of two chelating ion-exchange resins for the removal of chromium (III) from aqueous solution.Journal of Hazardous Materials, 100(1),
231-243.
[61] Guesmi, F., Harbi, S., Hannachi, C., & Hamrouni, B. (2014). Selective removal of chromium (VI) from water by Dowex 1X8: Optimization operating conditions. Journal of Selcuk University
Natural and Applied Science, 155-178.
[62] Rafati, L., Mahvi, A. H., Asgari, A. R., & Hosseini, S. S. (2010). Removal of chromium (VI) from aqueous solutions using Lewatit FO36 nano ion exchange resin. International Journal of
Environmental Science & Technology, 7(1), 147-156.
[63] Bajpai, S., Kushwaha, L., Narayanan, G. K., & Bajpai, V. Studies on removal of chromium
(iii) using SR1L NA resin.
[64] Rashid, J., Barakat, M. A., & Alghamdi, M. A. (2014). Adsorption of chromium (VI) from wastewater by anion exchange Resin. Journal of Advanced Catalytic Science and
Technology 1, 2-9.
[65] Rengaraj, S., Kim, Y., Joo, C. K., Choi, K., & Yi, J. (2004). Batch adsorptive removal of copper ions in aqueous solutions by ion exchange resins: 1200H and IRN97H. Korean Journal
of Chemical Engineering, 21(1), 187-194.
[66] Kabay, N., Arda, M., Saha, B., & Streat, M. (2003). Removal of Cr (VI) by solvent impregnated resins (SIR) containing aliquat 336. Reactive and Functional Polymers, 54(1), 103-
115.
[67] Bulai, P., Balan, C., Scripcariu, C., & Macoveanu, M. (2009). Equilibrium and kinetic studies of copper (II) removal on Purolite S930 resin. Environmental Engineering & Management
Journal (EEMJ), 8(5).
[68] Chahar, A., & Singh, A. V. (2014). Synthesis of novel tamarind 8-hydroxyquinoline-5-sulfonic acid (THQSA) resin and their application in industrial effluent treatment. International
Journal of Pharmacy and Pharmaceutical Sciences, 6(8), 340-344.
[69] Singh, A. V., Singh, R., & Borana, P. (2012). Synthesis and characterization of guar gum nitrilotriacetic acid (GNTAA) resin and its application in removal and recovery of toxic metal ions from effluent of Apex steel industry. Arabian Journal for Science and Engineering, 37(5), 1369-
1379.

75
[70] Zhang, Q., Gao, Y., Zhai, Y. A., Liu, F. Q., & Gao, G. (2008). Synthesis of sesbania gum supported dithiocarbamate chelating resin and studies on its adsorption performance for metal ions. Carbohydrate Polymers, 73(2), 359-363.
[71] Sarin, V., & Pant, K. (2006). Removal of chromium from industrial waste by using
eucalyptus bark. Bioresource Technology, 97(1), 15-20.
[72] Umpleby, R. J., Baxter, S. C., Bode, M., Berch, J. K., Shah, R. N., & Shimizu, K. D. (2001). Application of the Freundlich adsorption isotherm in the characterization of molecularly imprinted polymers. Analytica Chimica Acta, 435(1), 35-42.
[73] Rengaraj, S., Yeon, J. W., Kim, Y., Jung, Y., Ha, Y. K., & Kim, W. H. (2007). Adsorption characteristics of Cu (II) onto ion exchange resins 252H and 1500H: kinetics, isotherms and
error analysis. Journal of Hazardous Materials, 143(1), 469-477.
[74] Qureshi, I., Memon, S., & Yilmaz, M. (2009). Estimation of chromium (VI) sorption efficiency of novel regenerable p-tert-butylcalix [8] areneoctamide impregnated Amberlite resin. Journal of
Hazardous Materials, 164(2), 675-682.
[75] Demirbas, E., Kobya, M., Senturk, E., & Ozkan, T. (2004). Adsorption kinetics for the removal of chromium(VI) from aqueous solutions on the activated carbons prepared from
agricultural wastes. Water S. A., 30(4), 533-540.
[76] Chen, S., Yue, Q., Gao, B., Li, Q., Xu, X., & Fu, K. (2012). Adsorption of hexavalent chromium from aqueous solution by modified corn stalk: A fixed-bed column study. Bioresource
Technology, 113, 114-120.
[77] Malkoc, E., & Nuhoglu, Y. (2006). Fixed bed studies for the sorption of chromium (VI) onto
tea factory waste. Chemical Engineering Science, 61(13), 4363-4372.
[78] Liang, F. B., Song, Y. L., Huang, C. P., Zhang, J., & Chen, B. H. (2013). Adsorption of hexavalent chromium on a lignin-based resin: equilibrium, thermodynamics, and
kinetics. Journal of Environmental Chemical Engineering, 1(4), 1301-1308.
[79] Mesbah, F. H. G., Zewail, T. M., & Farag, H. A. Equilibrium and kinetic studies of Cr (VI)
removal from aqueous solution using DiaionSA20A exchange resin. Environment, 1, 2.
[80] Kumar, R., Ansari, M. O., & Barakat, M. A. (2013). DBSA doped polyaniline/multi-walled carbon nanotubes composite for high efficiency removal of Cr (VI) from aqueous
solution. Chemical Engineering Journal, 228, 748-755.
[81] Mulani, K., Daniels, S., Rajdeo, K., Tambe, S., & Chavan, N. (2013). Adsorption of chromium (VI) from aqueous solutions by coffee polyphenol-formaldehyde/acetaldehyde
resins. Journal of Polymers,
[82] Azira, S., Wong, T. N., Robiah, Y., & Chuah, T. G. (2004). Adsorption of methylene blue
onto palm kernel shell activated carbon. E Proceeding.
[83] Sharma, P., Singh, L., & Dilbaghi, N. (2009). Optimization of process variables for decolorization of Disperse Yellow 211 by Bacillus subtilis using Box–Behnken design. Journal of
Hazardous Materials, 164(2), 1024-1029.

76
[84] Tripathi, P., Srivastava, V. C., & Kumar, A. (2009). Optimization of an azo dye batch
adsorption parameters using Box–Behnken design. Desalination,249(3), 1273-1279.
[85] Yetilmezsoy, K., Demirel, S., & Vanderbei, R. J. (2009). Response surface modeling of Pb (II) removal from aqueous solution by Pistacia vera L.: Box–Behnken experimental
design. Journal of Hazardous Materials, 171(1), 551-562.
[86] Santhy, K., & Selvapathy, P. (2006). Removal of reactive dyes from wastewater by
adsorption on coir pith activated carbon. Bioresource Technology, 97(11), 1329-1336.
[87] Raghupathy, R., & Amirthagadeswaran, K. S. (2014). Optimization of casting process based on box behnken design and response surface methodology. International Journal for Quality Research, 8(4), 569–582
[88] Yet, Z. R., & Rahim, M. Z. A. (2014). Removal of Methyl Red from Aqueous Solution by Adsorption on Treated Banana Pseudo stem Fibers Using Response Surface Method (RSM). Malaysian Journal of Analytical Sciences,18(3), 592-603.
[89] Zhang, M., Li, A., Zhou, Q., Shuang, C., Zhou, Y., & Wang, M. (2013). Preparation and High Reusability of a Novel Acid-Resistant Magnetic Weak Acid Resin for Ni2+
Removal. Industrial & Engineering Chemistry Research,53(1), 340-345.
[90] Rajasimman, M., & Murugaiyan, K. (2010). Optimization of process variables for the biosorption of chromium using Hypnea valentiae. Nova Biotechnologica, 10(2), 107-115.
[91] Varala, S., Dharanija, B., Satyavathi, B., Rao, V. B., & Parthasarathy, R. (2016). New biosorbent based on deoiled karanja seed cake in biosorption studies of Zr (IV): Optimization using Box–Behnken method in response surface methodology with desirability
approach. Chemical Engineering Journal, 302, 786-800..
[92] Zulfadhly, Z., Mashitah, M. D., & Bhatia, S. (2001). Heavy metals removal in fixed-bed
column by the macro fungus Pycnoporus sanguineus.Environmental Pollution, 112(3), 463-470.
[93] Ghorai, S., & Pant, K. K. (2004). Investigations on the column performance of fluoride
adsorption by activated alumina in a fixed-bed. Chemical Engineering Journal, 98(1), 165-173.
[94] Palani, S., Gueorguieva, L., Rinas, U., Seidel-Morgenstern, A., & Jayaraman, G. (2011). Recombinant protein purification using gradient-assisted simulated moving bed hydrophobic interaction chromatography. Part I: Selection of chromatographic system and estimation of
adsorption isotherms. Journal of Chromatography A, 1218(37), 6396-6401.
[95] Choi, H. D., Jung, W. S., Cho, J. M., Ryu, B. G., Yang, J. S., & Baek, K. (2009). Adsorption of Cr (VI) onto cationic surfactant-modified activated carbon. Journal of Hazardous
Materials, 166(2), 642-646.
[96] Han, R., Wang, Y., Zhao, X., Wang, Y., Xie, F., Cheng, J., & Tang, M. (2009). Adsorption of methylene blue by phoenix tree leaf powder in a fixed-bed column: experiments and prediction
of breakthrough curves. Desalination, 245(1), 284-297.
[97] Aksu, Z., & Gönen, F. (2004). Biosorption of phenol by immobilized activated sludge in a continuous packed bed: prediction of breakthrough curves. Process Biochemistry, 39(5), 599-
613.

77
Dissemination
Conferences
1. Shreeparna Mishra and Susmita Mishra, “Preparation and characterization of CHBA resin for
removal of Cr+6 in drinking water” Conference Proceedings on Sustainable Technology for
Cleaner Environment (STCE-2016), N.I.T, Rourkela, Dec 12th -13th, 2015.
Journals (communicated)
1. Shreeparna Mishra and Susmita Mishra, “Preparation and adsorption kinetics of CHBA
resin for removal of Cr+6
from contaminated water” Journal of Hazardous
Materials.(communicated)
2. Shreeparna Mishra and Susmita Mishra, “ Fixed bed column study for Cr+6 removal from
aqueous solutions using Cassia-4-hydroxy benzoic acid resin” Journal of Environmental
Chemical Engineering.(communicated)


![Chemical Engineering Course Curriculum for the New ...Chemical Engineering courses CL152: Introduction to Chemical Engineering, [2 1 0 6] Historical overview of Chemical Engineering:](https://img.dokumen.tips/doc/110x75/5e962b5aae543b3a820d5617/chemical-engineering-course-curriculum-for-the-new-chemical-engineering-courses.jpg)