Embed Size (px)
Citation preview

WELDING INSPECTION SYSTEM
A THESIS SUBMITTED IN PARTIAL FULFILLMENT OF THE REQUIREMENTS
FOR THE DEGREE OF
Bachelor in Technology in
Industrial Design
By
K.Tejeswar Rao(111ID0153)
Under the supervision of
Prof. B.B.V.L. Deepak
Department of Industrial Design National
Institute of Technology, Rourkela
April 2015

ii
Declaration
We Hereby Declare That This Thesis Is Our Own Work And Effort. Throughout This Documentation
Wherever Contributions Of Others Are Involved, Every Endeavour Was Made To Acknowledge This
Clearly With Due Reference To Literature. This Work Is Being Submitted For Meeting The Partial
Fulfilment For The Degree Of Bachelor Of Technology In Industrial Design At National Institute Of
Technology, Rourkela For The Academic Session 2011 – 2015.
K.Tejeswar Rao (111ID0153)

iii
NATIONAL INSTITUTE OF TECHNOLOGY
ROURKELA 769008, INDIA
CERTIFICATE
This is to certify that the thesis titled “Laser Sensor Based Automatic Welding System” submitted
by K.Tejeswar Rao (111ID0153) in partial fulfillment of the requirements for the award of
BACHELOR OF TECHNOLOGY in INDUSTRIAL DESIGN at National Institute of
Technology, Rourkela is an original work carried out by him under my supervision and guidance.
The matter embodied in the thesis has not been submitted to any University/ Institute for the award
of any Degree.
Date: Prof. B.B.V.L Deepak
Assistant Professor
Department of Industrial Design
National Institute of Technology, Rourkela

iv
ACKNOWLEDGEMENT I take this opportunity to express our profound gratitude and deep regards to our guide and
mentor Prof. B.B.V.L Deepak, Assistant Professor, Department of Industrial Design, for his
exemplary guidance, monitoring and constant encouragement throughout the course of this
project. His invaluable guidance, immense help, hearted cooperation and fruitful discussions
throughout the semester are embodied in this dissertation.
I also express our sincere gratitude to Prof. Bibhuti Bhusan Biswal, Head of Department,
Department of Industrial Design, Prof. Mohd. Rajik Khan and Prof. B.B.V.L. Deepak for their
keen interest and unfailing inspiration throughout the course of the project.
I am obliged to the all the classmates for the valuable information provided by them and
acknowledge them for their cooperation during the period of our assignment.
I am extremely grateful to all lab maintenance staff for providing us assistance in various
hardware and software problems encountered during the course of our project.
I am also grateful to the institute’s library and other facilities for providing us with required
resources for the completion of this project. Finally, I thank all those who are involved, directly or indirectly, throughout the course of the
project.
K.Tejeswar Rao (111ID0153)

v
ABSTRACT
This Project aims at building an automated welding system that can track a weld seam, calculate
its area and depth and accordingly do the welding and also consider to keep the defects to a
minimum so that better quality of weld can be given as output. It consists of a laser sensor that
illuminates the weld seam so that the CCD/CMOS camera used can get the image of the weld
seam. Then this image is transferred to MATLAB for image processing where the image is
converted to grey scale and the grey scale image is then divided into two parts first part consists
of the seam section which is colored grey and have red dots and other sections is considered as
white section which don’t have any utilization till the welding starts. After the image processing
the part is carried to the welding section where the welding can be done with the help of the data
abstracted from the above methods and then it minimizes the defect of welding and produces the
output.
Keywords: - Laser sensor, image processing, defects

vi
CONTENTS
List of figures……………………………………………………………………………… (i)
List of Tables…………………………………………………………………………….…(ii)
List of Symbols…………………………………………………………………………… (iii)
1. Introduction……………………………………………………...............……… 1
1.1. History…...………………………………………….............………..…….........1
1.2. Benefits of Automated Welding............................................................................3
1.3. Types of Welding Process.................................................................................... 3
1.4. Types of welding defects......................................................................................3
1.5. Problem Statement................................................................................................5
1.6. Objective...............................................................................................................5
2. Literature review......................................................................................................6
2.1. Robust laser-stripe sensor for automated..............................................................6
Weld-seam-tracking in ship building
2.2. Laser Based Sensor.................................................................................................6
2.3. Image caption with camera and laser line projection…………………………....7
3. Methodology.............................................................................................................10
3.1. Setting up the camera and.................................................................................... 11
laser sensor at proper angles
3.2. Processing the setup and ......................................................................................12
getting required images.
3.3. Image Processing through MATLAB...................................................................12
3.3.1. MATLAB Code......................................................................................14
3.3.2. MATLAB graphical interface...................................................................17
4. Results and Discussions.............................................................................................19
5. Conclusions and scope of further work....................................................................20
References…………………………………………………………………………....22
Appendix......................................................................................................................24

vii
List of Figures
Fig.1 (a) Schematic of a sensor……………………………………………………… 6
Fig.1 (b) Design of sensor parameters based on laser triangulation ………………... 7
Fig.2 Position of camera and laser sensor over the weld…………………………… 8
Fig.3 G.Pristshow Concept…………………………………………………………. 8
Fig.4 Boris Regaard ,Stefan Kalerle and Reinhaart Poprawe Concept…………….. 9
Fig.5 F.B. Prinz and K.T. Cunnarsson Concept……………………………………. 9
Fig.6 Position and angle of incidence camera and laser sensor……………………. 11
Fig.7 Two metal parts already welded and its defects……………………………… 12
Fig.8 The image captured by the camera of the laser line projection………………...
on the weld surface, the right image show the projection on a plane
Surface.
12
Fig.9 Different grey threshold and Sobel filter on the image………………………. 13
Fig.10. Two different dilation values, and the imfill tool…………………………... 13
Fig.11 The points from the image translated and rotated……………………………. 14
Fig.12 The original graphical interface made in MATLAB…………………………. 17
Fig.13 Revision of the graphical interface made in MATLAB……………………… 18

viii
List of Tables
Table 1 Classification of weld discontinuities……………………………………… 4
Table 2 The Approximate distance from ……………………………………………
the weld to laser sensor and camera
8
ix
List of Symbols
CCD camera……………………..
Camera based on Charge Coupled
Devices technology CMOS……………………………
….
Complementary Metal Oxide Semiconductor
Flexcell controller………………..
Servo Robot Inc automatic weld
measure equipment I-P2-P1…………………………
The weld sample used in all tests in this report
Kt-value………………………..
A measure of the tension concentration in the
weld toe Leg length………...……………
Figure 1 The image shows a fillet weld and
explains the leg and throat of the weld MATLAB (Matlab)……………..
The MathWorks software with Image
processing toolbox MIG/MAG welding…………...
Metal Inert/Active Gas welding
Throat………………………..
Figure 1 The image shows a fillet weld and
explains the leg and throat of the weld Weld face…....…………………
The surface of the weld
Weld toe………...………………
The junction of the base material and the weld
face

1 | P a g e
CHAPTER 1
INTRODUCTION
Welding, as the most regularly utilized procedure for joining metals and plastic, is essential to the
economy a nation on the grounds that up to 50% of the gross national item is identified with
welding in somehow. Then again, welding is such a complex procedure, to the point that the
outwardly unmistakable nature of the weld is influenced by various methodology variables. The
potential weld abandons incredibly break down the mechanical properties of the welded structures
weld quality and subsequently, the dangers of part exhaustion, disappointment considerably fiasco
are essentially expanded. In this manner, so as to recognize the conceivable vicinity of distinctive
weld deformities, fitting sensing, observing and examination techniques are essential for quality
control. For the most part, there are two classes of techniques that are sought weld quality
investigation: on-line routines and disconnected from the net strategies. As welding is such a
complex procedure, there are various physical phenomena, for example, electromagnetic radiation,
optical and acoustic discharge and plasma era that will happen. Alongside these phenomena,
distinctive sorts of signs are created amid the welding procedure and typically these signs are
nearly connected with the weld quality. Subsequently, diverse on-line sensing systems have been
created to screen the weld quality and identify the weld deformities taking into account the marks
of the signs procured amid the welding methodology.
1.1 HISTORY
Welding is seemingly the most complex assembling process and is every now and again the
slightest caught on. An astounding number of organizations burn through a great many dollars to
mechanize get together while overlooking the welding methodology. Manual welding is still the
best process for some gatherings. On the other hand, numerous constructing agents are actualizing
computerized welding frameworks to expand quality, profitability and gainfulness. Welding
computerization can be separated into two essential classifications: self-loader and completely
programmed. In self-loader welding, an administrator physically stacks the parts into the welding
installation. A weld controller then keeps the welding procedure, movement of the light, and
stillness of the parts to preset parameters. After the weld is finished, the administrator uproots the
finished get together and the methodology starts once more.
In completely programmed welding, a custom machine, or arrangement of machines, loads the
work piece, lists the part or light into position, fulfills the weld, screens the nature of the joint and
empties the completed item. Extra "part set up" and last item quality checks might likewise be
outlined into the machine if fundamental. Contingent upon the operation, a machine administrator
may be essential.
1.2 Benefits of Automated Welding
Automated welding systems offer four main advantages: improved weld quality, increased output,
decreased scrap and decreased variable labor costs.

2 | P a g e
Weld quality comprises of two variables: weld uprightness and repeatability.
Computerized welding frameworks guarantee weld respectability through electronic weld
process controllers. Consolidating motorized light and part movements with electronic
review of welding parameters brings about a higher quality weld than can be finished
physically. This offers immediate quality control. Besides, on the grounds that a weld is
made just once, deserts are promptly unmistakable and discernible. People have a tendency
to "cover up" an error with the light, concealing absence of infiltration or a potentially
defective weld. Now and again, release testing and vision frameworks can be incorporated
into completely mechanized frameworks to give extra quality control.
Repeatability is an element of the nature of the weld process controller and of the designing
of the machine movements. Motorized welding gives repeatable info parameters to more
repeatable yield. Accepting the controller is working legitimately, the inquiry gets to be:
Can the systems of the machine position the parts or the light inside the predetermined
resistances for welding? The response to this inquiry will authenticate the nature of
framework bought. Computerizing the light or part movements, and part position,
diminishes the likelihood of human lapse. A weld happens just when all prerequisites are
fulfilled. With manual welding, reject welds regularly increment when welders get to be
exhausted. Contingent upon the estimation of the parts when they land at the welding
station, the expense investment funds in scrap alone may legitimize the buy of a robotized
welding framework. Mechanization ought to additionally be considered when constructing
agents need to minimize the danger of transportation an awful part to a client.
Lost opportunity costs are also significant. If a skilled welder fails to report to work, the
company’s variable costs skyrocket. Eight hours of production time is lost. Availability
of skilled labor for manual welding may also pose a challenge. Conversely, general
machine operators are more readily available and more affordable than skilled labor
1.3 Types of Welding Process
The main Types of welding used in industry and by home engineers are commonly referred to as
Mig welding, Arc welding, Gas welding, Tig welding and Laser Welding.
1. GMAW or Gas Metal Arc Welding: - More commonly called MIG welding this welding
type is the most widely used and perhaps the most easily mastered type of welding for
industry and home use. The GMAW process is suitable for fusing mild steel, stainless-steel
as well as aluminum.
2. GTAW or Tungsten Inert Gas:-TIG welding is comparable to oxy acetylene gas welding
and needs a lot more expertise from the operator. Employed for carrying out high-quality
work when a superior standard of finish is needed without making use of excessive clean
up by sanding or grinding.

3 | P a g e
3. Arc Welding or SMAW:-Generally known as stick or arc welding. Arc welding is the
most basic of all welding types, is easy to master in a home welding situation. Stick welding
can be used for manufacturing, construction and repairs, very much well suited for heavy
metal size 4 millimeters upwards. Thinner sheet metals and alloys are usually more suited
to the mig welding types.
4. Gas or Oxy Acetylene Welding:-Not used as widely for general welding of mild steel.
Consists of mixing oxygen and acetylene gas to great a flame capable of melting steels.
Mostly used today for maintenance work and gas metal cutting. Also common for brazing
softer metals such as copper and bronze. Can also be used for welding delicate aluminum
parts such as refrigeration pipes. Gas Cutting equipment for metal construction and
maintenance. The most accessible of thermal cutting gear is by oxy-acetylene gas cutting
and plasma cutting machines. Other methods include the use of a thermal cutting electrode
for use with the arc welder machine
5. Laser beam welding or LBW: - is a welding technique used to join multiple pieces of metal
through the use of a laser. The beam provides a concentrated heat source, allowing for
narrow, deep welds and high welding rates. The process is frequently used in high volume
applications, such as in the automotive industry.
1.4 Types of Welding Defects
In MIG/MAG Metal Inert/Active Gas welding, a few discontinuities generally show up. The
discontinuities are contrasted with the no doubt understood welding standard ISO 5817. There
are three weld quality levels B, C and D. B is the most stringent level and is connected on
aviation and weight vessel applications and it is not examined in this report. How the
irregularity can happen is specified yet there can be a few different reasons.
Root imperfection is the point at which the base material breaks around the weld. It is
permitted in little degree in level C and D. Root imperfection is a more regular
irregularity with MIG/MAG welding than with other welding techniques..
Absence of combination is the point at which the base material is not combined with
the weld, i.e. they don't liquefy together. This brokenness is likewise basic with
MIG/MAG welding and other combination welding sorts. Absence of combination is
not permitted at all in level C and in little degree in level D
Hardening chunky coke is regularly surface softening laughs to point of tears the weld.
On the off chance that the split is greater than smaller scale breaks (stature * length
<1mm^2) it is not acknowledged at all in any of the quality levels. This deformity is
material depending and frequently happens if the material contains contamination

4 | P a g e
Porosity is not a genuine weld irregularity unless there is an abnormal state of pores.
Circular pores are permitted from 4% in level B to 16% in level D of the anticipated
weld zone. Just level D acknowledges stretched pores. The pores can be surface braking
or non-surface breaking. Earth or lacking shield gas can bring about pores.
Spatter is a surface discontinuity and is accepted in all three quality levels and it is
application depending. Figure 3 shows a small amount of spatter.
Undercut is a surface intermittence and is acknowledged in each of the three levels, the
permitted profundity is reliant on the thickness of the base material. The move between
the weld and the surface must be smooth. The application figures out whether the
undercut is acknowledged or not. Figure 3 shows undercut in the weld.
The welding standard STD 181-0001 is utilized when welding as a part of steel sheets thicker
than 3 mm. This standard partitions the combination welds into four welding classes A to D.
The welding standard has one more level than the ISO welding standard however they have
likenesses welding class An is the most stringent and not examined in this report in light of the
fact that Volvo CE utilizes the C and D class, and sometimes the B class. Table 1 of the welding
standard determines shape deviation and external absconds in filet welds, which is most
intriguing in this report. The weigh length in the tables is situated to 200 mm in longitude
course. In the event that the weld length is shorter then 200 mm the necessity should be
identified with the weld length. Table 1 determines the B to D classes from the table 2 in the
STD 181-0001 standard, the external absconds and shape deviation.
.
Table 1 Classification of weld discontinuities
Type of defect Welding class
D C B
Crack Not permitted Not permitted Not permitted
Root defect Locally permitted Not permitted Not permitted
End crater, a
crater at the end of
the weld
Permitted but
no crack
Permitted but
no crack
Not permitted
Arc strikes i.e. the
arc ignite too
close or fare from
the base material
Occasional but
no crack
Not permitted Not permitted
Spatter Spatter is
permitted if it is
stuck
Occasional
globular spatter is
permitted if it’s
stuck
Not permitted

5 | P a g e
Surface pores Single pore
extension ≤ 0,2t
max 3 mm
porosity area
≤ 25mm2
t = thickness of
the base material
Single pore
extension ≤ 0,1t ,
max 1,5 mm.
porosity area
≤ 10mm2
Single pore
extension ≤ 0,1t ,
Undercut Locally A ≤ 0,2t
but max 2 mm.
A= depth of the
undercut
t = thickness of
the base material
Locally A ≤ 0,1t
but max 1 mm.
Locally A ≤ 0,05t
but max 0,5 mm.
Leg deviation A ≤ 2 + 0,2a
a = throat height
A = length of the
deviation
A ≤ 2 + 0,2a A ≤ 1,5 + 0,15a
Throat deviation Locally -0,2a
a = throat height
Locally -0,1a Throat must not be
less than specified.
1.5 Problem Statement
In the era of automation and technology, automated system plays a major role in making life of
people easy and comfortable. As welding is the most commonly used process for joining in
industries its automation is inevitable at large. For industries to increase cost effectiveness and
repeatability of the process with precision automatic welding system is required. So I arrived at
the problem statement of this project as Laser Sensor Based Automatic Welding Process.
1.6 Objective
Based on the problem statement mentioned above, here are the objectives of this research
To develop an automatic welding system.
To minimize the welding defects.
To check its consistency with other similar processes.

6 | P a g e
CHAPTER 2
LITERATURE REVIEW
Based on the study we received literatures on different topics. Literature review is an important
phenomenon for any research project. We gain different ideas and a very broad way of
thinking about the project by reviewing numerous topics. The search for literature includes
various websites, journals and books.
2.1 Robust sensor for automated weld-seam-tracking
Another laser stripe sensor framework for the mechanization of welding methodologies in
overwhelming businesses is exhibited. Traditional laser stripe sensors use costly multiprocessor
blocks with to six advanced sign processors (DSP) to adapt to the high information rate of 14
Mbyte/s conveyed by the sensor's CCD-cam. Another arrangement utilizing one and only
profoundly incorporated rationale IC (FPGA) has been produced offering the same execution as
multiprocessor arrangements at a radically lower value making laser stripe sensors alluring for
expense delicate applications in the substantial businesses. Incorporating the FPGA in the sensor
head encourages information transmission to the sensor PC as the information rate is diminished
by an element of 700 and can accordingly be transmitted as a powerful RS485 serial flag over
huge separations. For the identification of the area of the welding notch another strong fluffy
calculation has been produced that ensures a fantastic following result notwithstanding when the
welding hole geometry firmly shifts or is twisted by commotion. Utilizing this new strategy,
examinations did on modern examples from the boat building industry demonstrated that the
fluffy methodology had the capacity adapt to solid crease geometry varieties and ended up being
better than ordinary methodologies
2.2 Laser Based Sensor
As shown in Figure 1(a), a typical laser triangulation vision sensor consists of a laser generator, a
structured pattern generator, an image sensor, a focus lens and an optical filter.
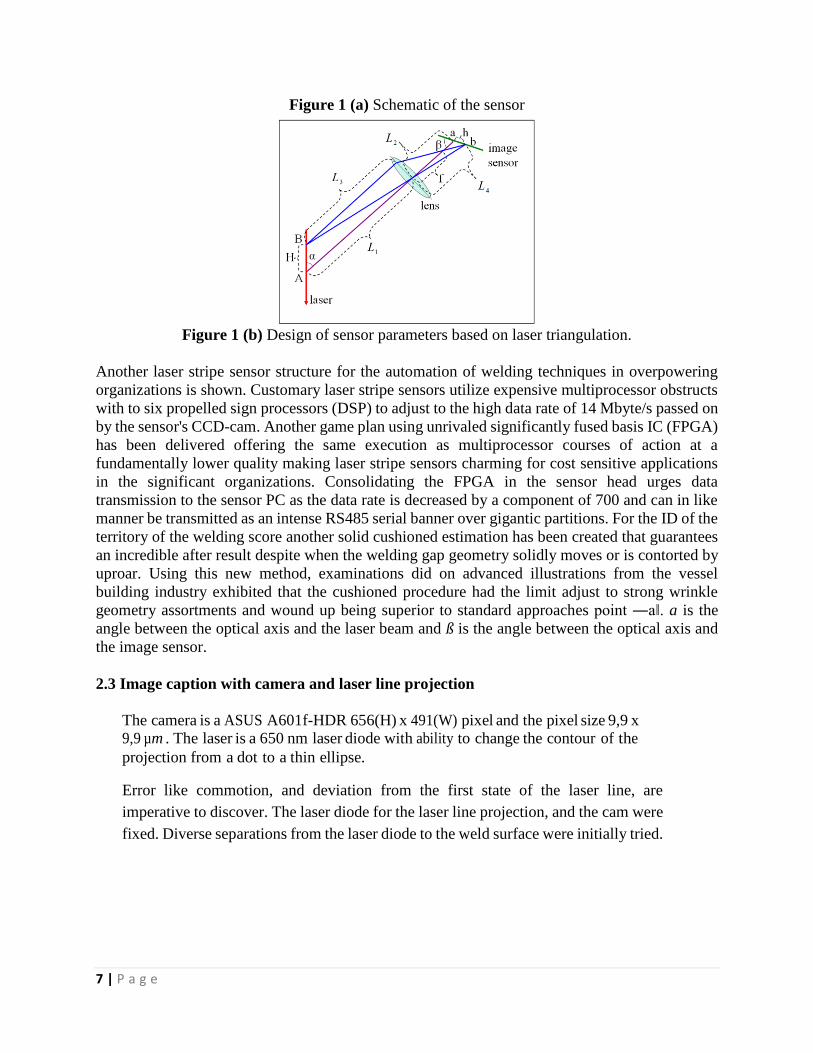
7 | P a g e
Figure 1 (a) Schematic of the sensor
Figure 1 (b) Design of sensor parameters based on laser triangulation.
Another laser stripe sensor structure for the automation of welding techniques in overpowering
organizations is shown. Customary laser stripe sensors utilize expensive multiprocessor obstructs
with to six propelled sign processors (DSP) to adjust to the high data rate of 14 Mbyte/s passed on
by the sensor's CCD-cam. Another game plan using unrivaled significantly fused basis IC (FPGA)
has been delivered offering the same execution as multiprocessor courses of action at a
fundamentally lower quality making laser stripe sensors charming for cost sensitive applications
in the significant organizations. Consolidating the FPGA in the sensor head urges data
transmission to the sensor PC as the data rate is decreased by a component of 700 and can in like
manner be transmitted as an intense RS485 serial banner over gigantic partitions. For the ID of the
territory of the welding score another solid cushioned estimation has been created that guarantees
an incredible after result despite when the welding gap geometry solidly moves or is contorted by
uproar. Using this new method, examinations did on advanced illustrations from the vessel
building industry exhibited that the cushioned procedure had the limit adjust to strong wrinkle
geometry assortments and wound up being superior to standard approaches point ―a‖. a is the
angle between the optical axis and the laser beam and ß is the angle between the optical axis and
the image sensor.
2.3 Image caption with camera and laser line projection
The camera is a ASUS A601f-HDR 656(H) x 491(W) pixel and the pixel size 9,9 x 9,9 µm . The laser is a 650 nm laser diode with ability to change the contour of the projection from a dot to a thin ellipse. Error like commotion, and deviation from the first state of the laser line, are
imperative to discover. The laser diode for the laser line projection, and the cam were
fixed. Diverse separations from the laser diode to the weld surface were initially tried.
8 | P a g e
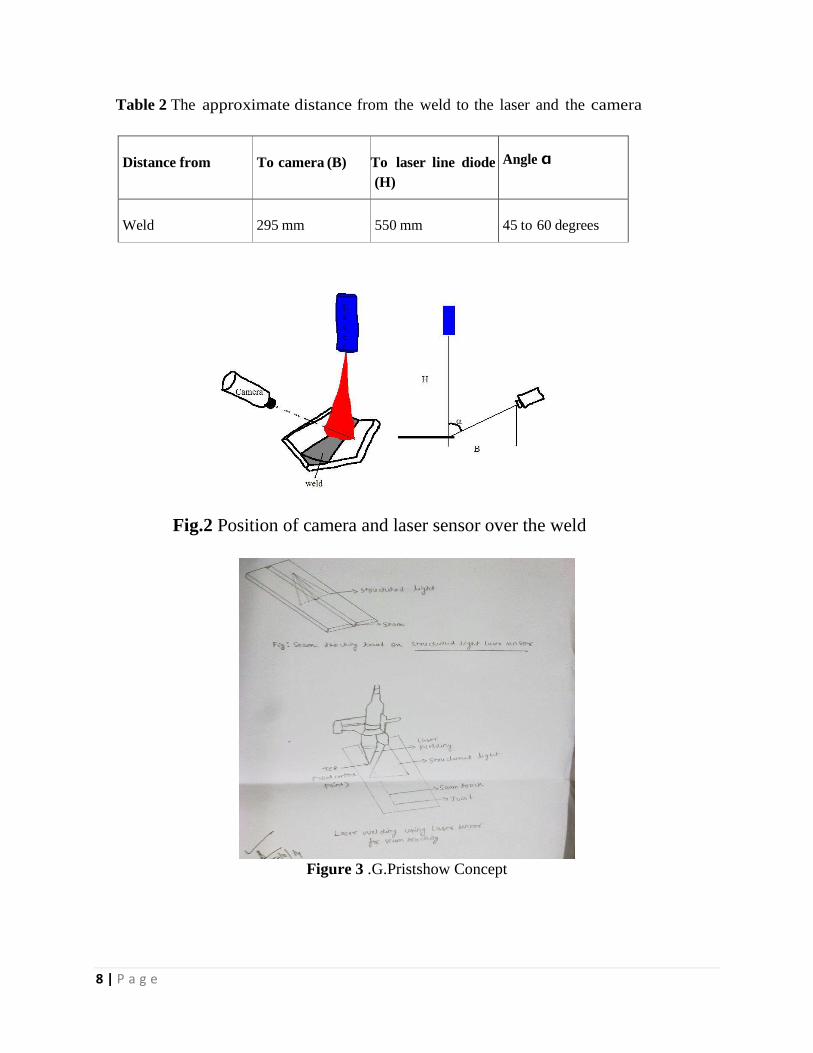
Table 2 The approximate distance from the weld to the laser and the camera
Distance from
To camera (B)
To laser line diode
(H)
Angle α
Weld
295 mm
550 mm
45 to 60 degrees
Fig.2 Position of camera and laser sensor over the weld
Figure 3 .G.Pristshow Concept

9 | P a g e
Figure 4.Boris Regaard ,Stefan Kalerle and Reinhaart Poprawe Concept
Figure 5. F.B. Prinz and K.T. Cunnarsson

10 | P a g e
CHAPTER 3
METHODOLOGY
The whole process of automatic welding process is divided into these broad categories:-
3.1 Setting up the camera and Laser sensor at proper angles
As indicated in Figure 2, the created vision sensor fuses an organized light laser generator, a GigE
cam, a lens and an optical channel. The organized light laser generator oppositely extends laser
plane with a wavelength of 657.9 nm onto the target weld. To gain the picture of the framed set
stripe that takes after the profile of the target weld, a GigE cam with an inserted CMOS picture
sensor is organized at the planned edge of ß regarding the optical pivot of the lens and a separation
of L concerning the lens. The strategy to guarantee the gathering precision of all the sensor parts
is first to portray the predesign geometrical plan of the segments with taking thought of their
geometric detail with CAD programming. At that point distinctive tooling machines are utilized
to process the metal plates to frame the sensor lodging in view of the CAD sketch. With precise
positions of screw gaps on the metal lodging, the sensor parts are then altered to the metal lodging
in predefined points and position. The CMOS picture sensor is a monochromatic sensor chip with

11 | P a g e
a 659 × 494 exhibit of eight-bit pixels. It can be utilized to procure grayscale picture with a light
force going from 0 to 255, while 0 speaks to the least light power, and 255 speaks to the most
astounding light force. The edge rate of the GigE cam is dependent upon 196 edges every second,
and the link length is dependent upon 100 m. Before the cam, the center lens with a central length
f is likewise exactly organized at the planned separation of L concerning the crossing point
between the laser pillar and the optical hub. The point between the optical hub and the laser stripe
is orchestrated at the planned edge of a. Likewise, a slender band optical channel focused at 658
nm is set before the centering lens. This optical channel will shut out incidental light created amid
the welding methodology.
Thusly, just the reflected laser stripe in the wavelength of 657.9 nm can go through the optical
channel to the picture sensor while light unsettling influence and commotion in different
wavelengths will be separated out. By correctly orchestrating distinctive parts inside the vision-
based sensor module at the composed optical parameters, the position data and the geometrical
highlights of the target weld can be acquired taking into account the scientific relationship inferred
previously. As demonstrated in Figure 2, the manufactured laser-construct vision sensor is
mounted in light of a vertically versatile slide over the worktable of the numerous hub movement
framework. With a specific end goal to perform weld quality examination, the movement
framework is controlled to accomplish development in 3D space and the profile of the weld then
can be examined along particular course. In this study, the pictures obtained by the vision sensor
are exchanged to a PC through an Ethernet link. A created picture preparing module that will
prepare the pictures and concentrate valuable quality data about the weld is point by point in the
accompanying segment
Figure 6. Position and angle of incidence camera and laser sensor

12 | P a g e
3.2 Processing the setup and getting required images
The separation between the laser diode and the weld is vital to make sufficiently long to
guarantee that the projection covers the weld and a portion of the base material. It is vital
keeping in mind the end goal to locate the cross-segment of the base material when the picture
is examined. The cross-area of the lines speaking to the base material is then utilized as the new
root of the projection from the weld. Appendix 1
Figure 7. Two metal parts already welded and its defects
\
Figure 8. The image captured by the camera of the laser line projection on the
weld surface, the right image show the projection on a plane surface.
3.3 Image Processing Through MATLAB
Matlab Image Processing Toolbox is utilized and imread opens the picture and harvests it with
imcrop to minimize information and after that the picture is dark scaled and Sobel sifted with the
13 | P a g e
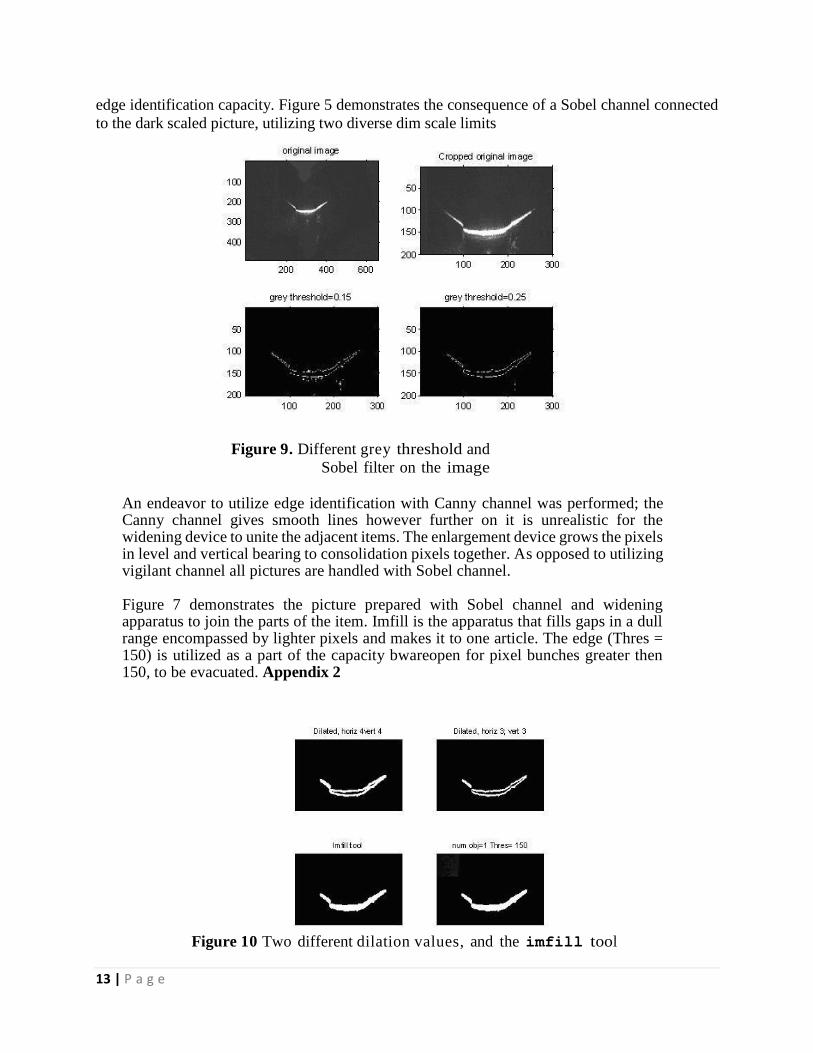
edge identification capacity. Figure 5 demonstrates the consequence of a Sobel channel connected
to the dark scaled picture, utilizing two diverse dim scale limits
Figure 9. Different grey threshold and
Sobel filter on the image
An endeavor to utilize edge identification with Canny channel was performed; the Canny channel gives smooth lines however further on it is unrealistic for the widening device to unite the adjacent items. The enlargement device grows the pixels in level and vertical bearing to consolidation pixels together. As opposed to utilizing vigilant channel all pictures are handled with Sobel channel. Figure 7 demonstrates the picture prepared with Sobel channel and widening apparatus to join the parts of the item. Imfill is the apparatus that fills gaps in a dull range encompassed by lighter pixels and makes it to one article. The edge (Thres = 150) is utilized as a part of the capacity bwareopen for pixel bunches greater then 150, to be evacuated. Appendix 2
Figure 10 Two different dilation values, and the imfill tool
14 | P a g e
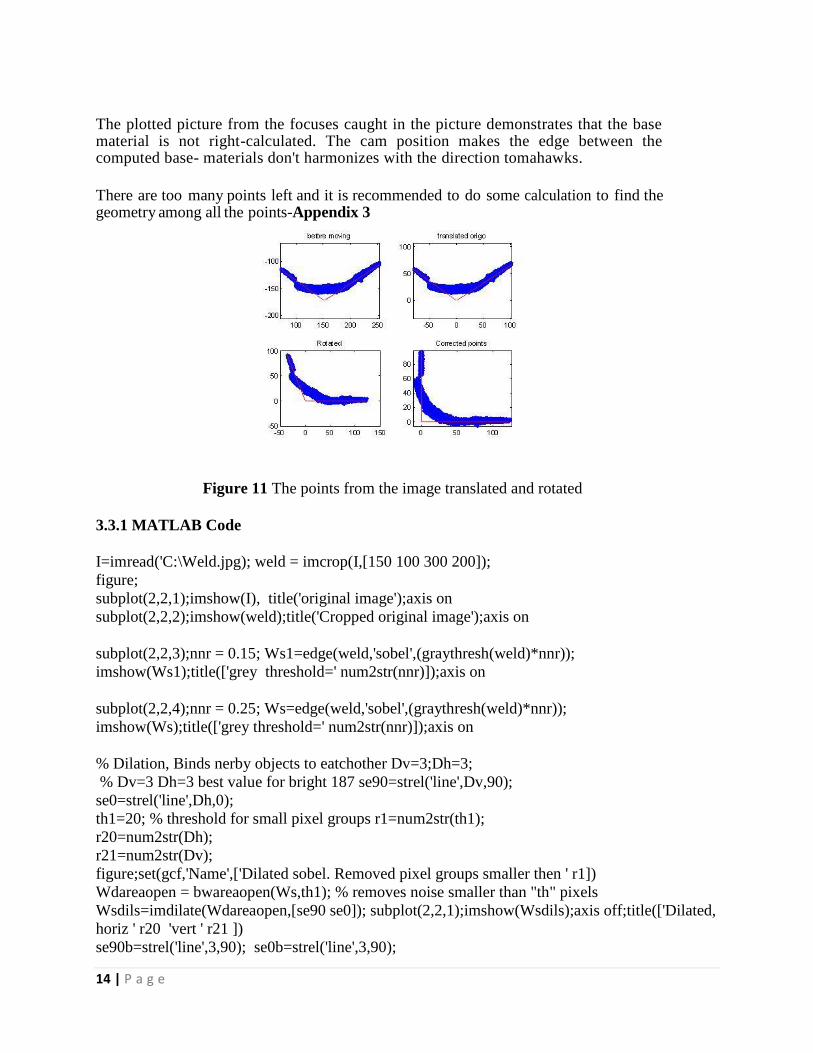
The plotted picture from the focuses caught in the picture demonstrates that the base material is not right-calculated. The cam position makes the edge between the computed base- materials don't harmonizes with the direction tomahawks.
There are too many points left and it is recommended to do some calculation to find the geometry among all the points-Appendix 3
Figure 11 The points from the image translated and rotated
3.3.1 MATLAB Code
I=imread('C:\Weld.jpg); weld = imcrop(I,[150 100 300 200]);
figure;
subplot(2,2,1);imshow(I), title('original image');axis on
subplot(2,2,2);imshow(weld);title('Cropped original image');axis on
subplot(2,2,3);nnr = 0.15; Ws1=edge(weld,'sobel',(graythresh(weld)*nnr));
imshow(Ws1);title(['grey threshold=' num2str(nnr)]);axis on
subplot(2,2,4);nnr = 0.25; Ws=edge(weld,'sobel',(graythresh(weld)*nnr));
imshow(Ws);title(['grey threshold=' num2str(nnr)]);axis on
% Dilation, Binds nerby objects to eatchother Dv=3;Dh=3;
% Dv=3 Dh=3 best value for bright 187 se90=strel('line',Dv,90);
se0=strel('line',Dh,0);
th1=20; % threshold for small pixel groups r1=num2str(th1);
r20=num2str(Dh);
r21=num2str(Dv);
figure;set(gcf,'Name',['Dilated sobel. Removed pixel groups smaller then ' r1])
Wdareaopen = bwareaopen(Ws,th1); % removes noise smaller than "th" pixels
Wsdils=imdilate(Wdareaopen,[se90 se0]); subplot(2,2,1);imshow(Wsdils);axis off;title(['Dilated,
horiz ' r20 'vert ' r21 ])
se90b=strel('line',3,90); se0b=strel('line',3,90);

15 | P a g e
subplot(2,2,2);imshow(imdilate(Wdareaopen,[se90b se0b]));title('Dilated, horiz 3; vert 3')
Wdfill=imfill(Wsdils, 'holes');
subplot(2,2,3);imshow(Wdfill);axis off; title('Imfill tool')
th2 = 150;% th2 = 150;
r10=num2str(th2);
Wdareaopen = bwareaopen(Wdfill,th2);
% Remove extra thicknes dinum=0; % dinum=1; Best value seD=strel('diamond',dinum);
Wfinal=imerode(Wdareaopen,seD);
[L,num] = bwlabeln(Wfinal,8); % L label of objects found, num= how many objects
NUM=num2str(num)
subplot(224);imshow(L),title(['num obj=' NUM ' Thres= ' r10])
rall = [];call = [];
% figure;set(gcf,'Name',['R,c for the different objects found ' image])
for ii = 1 : num % for all objects found:
[r c] = find(bwlabel((L)==ii)); assignin('base',['r_' num2str(ii)],r); assignin('base',['c_'
num2str(ii)],c);
hold on; subplot(2,2,ii);plot(c,-r);title(['Object nr ' num2str(ii)]);
a = axis; axis([a(1) a(2) -a(4) -a(3)])
axis('equal')
subplot(2,2,ii);
end
rall = [rall; r]; % take hold of all values call = [call; c];
subplot(2,2,num+1);
axis off; text(0,0,'Must only be 1 object found - change threshold or other features otherwise')
% Now I start with the rightmost part and study the last 100 elements in r
% and c:
npr = 150; % number of points from right npl = 200; % number of points from left rright =
rall(end-npr:end,:);
cright = call(end-npr:end,:);
% the angle in the figure to the right
kright = (rright(end)-rright(1))/(cright(end)-cright(1));
theta_right = atan(kright); % in radians
% same with left part rleft = rall(1:npl,:); cleft = call(1:npl,:);
% the angle in the figure to the right
16 | P a g e
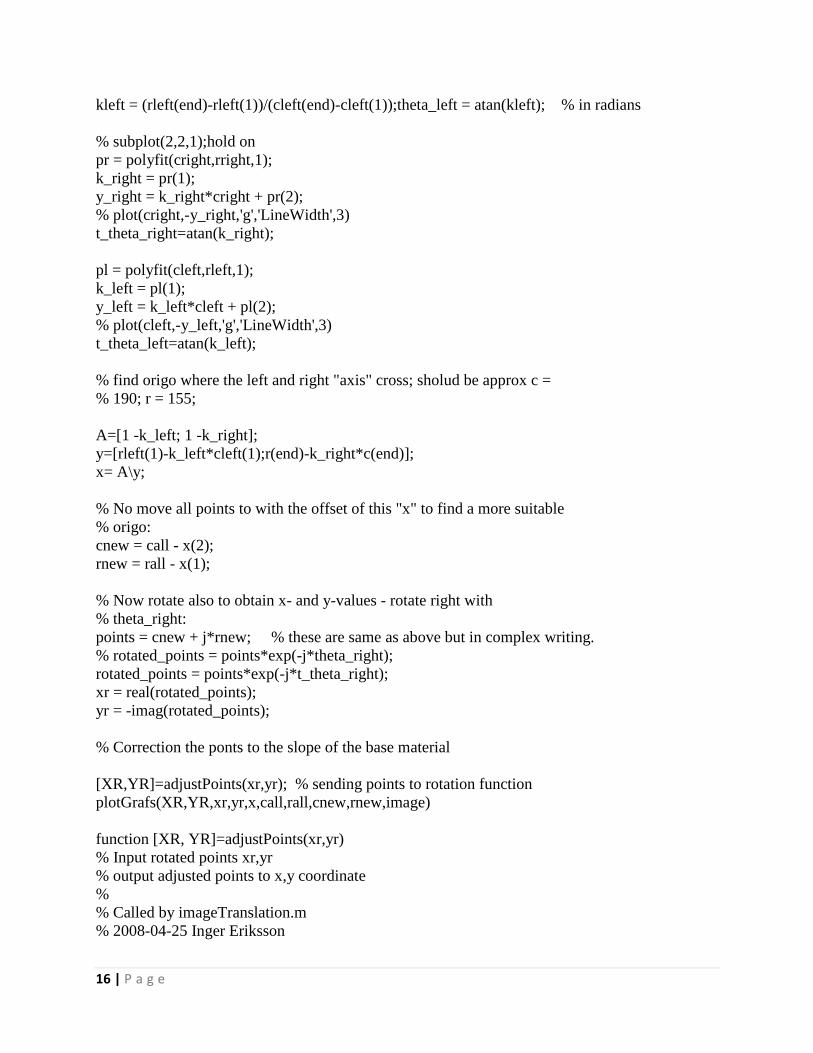
kleft = (rleft(end)-rleft(1))/(cleft(end)-cleft(1));theta_left = atan(kleft); % in radians
% subplot(2,2,1);hold on
pr = polyfit(cright,rright,1);
k_right = pr(1);
y_right = k_right*cright + pr(2);
% plot(cright,-y_right,'g','LineWidth',3)
t_theta_right=atan(k_right);
pl = polyfit(cleft,rleft,1);
k_left = pl(1);
y_left = k_left*cleft + pl(2);
% plot(cleft,-y_left,'g','LineWidth',3)
t_theta_left=atan(k_left);
% find origo where the left and right "axis" cross; sholud be approx c =
% 190; r = 155;
A=[1 -k_left; 1 -k_right];
y=[rleft(1)-k_left*cleft(1);r(end)-k_right*c(end)];
x= A\y;
% No move all points to with the offset of this "x" to find a more suitable
% origo:
cnew = call - x(2);
rnew = rall - x(1);
% Now rotate also to obtain x- and y-values - rotate right with
% theta_right:
points = cnew + j*rnew; % these are same as above but in complex writing.
% rotated_points = points*exp(-j*theta_right);
rotated_points = points*exp(-j*t_theta_right);
xr = real(rotated_points);
yr = -imag(rotated_points);
% Correction the ponts to the slope of the base material
[XR,YR]=adjustPoints(xr,yr); % sending points to rotation function
plotGrafs(XR,YR,xr,yr,x,call,rall,cnew,rnew,image)
function [XR, YR]=adjustPoints(xr,yr)
% Input rotated points xr,yr
% output adjusted points to x,y coordinate
%
% Called by imageTranslation.m
% 2008-04-25 Inger Eriksson

17 | P a g e
V=atan2(yr(1),xr(1)); dV=V-pi/2; v=atan2(yr,xr);
dv=-v/V*dV; Z=[]; F=size(dv); for i=1:F
M=[cos(dv(i)) -sin(dv(i));sin(dv(i)) cos(dv(i))];
Z(:,i)=M*[xr(i);yr(i)];
end
XR=Z(1,:);
YR=Z(2,:);
3.3.2 MATLAB Graphical Interface
The interface was intended to choose one area of focuses from the 3D filtered picture, at the time.
The weld utilized as a part of the previous undertaking did not have any scatter or undercut so the
interface did not identify these deviations. Figure 13 demonstrates the first graphical interface
made in Matlab. Appendix 4,5
Figure 12 The original graphical interface made in
MATLAB
In this form the test designer picks a cross segment from the 3D picture and the project then presents
information figurings of the weld in the x-bearing. The "Get area" catch attracts the bend the
window. The interface presents [2]:
• A figure on the chosen weld section
• The radius and angle of a circle drawn at the weld toe
• The weld throat
• The x-leg length of the weld
• The Kt-value

18 | P a g e
The Kt-quality is a measure of the strain fixation and can be assessed from the range
and the edge at the weld toe. Kt ought not be under 2,5 and the worth is subject to the
point and the sweep of the weld, see Appendix G (Calculation of the Kt-esteem). In the
interface it is workable for the test architect to adjust the line resilience, and number of
focuses in the estimation of the range and point of the weld toe. It is additionally
conceivable to pick the purpose of the weld begin.

19 | P a g e
CHAPTER 4
RESULTS AND DISCUSSIONS
Results from the measuring of the gauge block, presented in Section 3.2.3 (Accuracy),
gives that objects as small as 0,2 mm in the z-direction are possible to find. In the
technical data of the scanCONTROL the resolution in the z-direction is 0,04 mm.
There was no filter used in the test occasion and only one threshold.
The information from the picture tackled the anticipated laser line, from the laser
diode, was just transformed until the focuses were acclimated to the x- and y- hub
in the direction framework. The choice to that was the time furthest reaches of the
task and that the output CONTROL framework had arrived. Appendix 6
The graphical interface made in Matlab, portrayed in the past section, was altered
to allow the information from the scanCONTROL. The changes that was done from
the previous version:
• Select what data file to open
• Indicate which points that differ from line tolerance
• Find the y-leg of the weld
• Indicate the weld start on the y-leg
• Find spatter
• Calculate the theoretical leg length
Figure 13 The revision of the graphical interface made in Matlab

20 | P a g e
CHAPTER 5
CONCLUSIONS AND FURTHER WORK
The begin of this undertaking was finished with the investigation of different programmed welding
machines accessible in the business sector and subsequently we set forward the issue explanation.
Among all the diverse programmed welding frameworks we picked the welding framework which
is in view of laser sensor and CMOS Camera for precise area of the crease. The correct edge and
plan for the setup was done and the picture accumulated from the subsequent setup was placed in
the picture preparing strategy utilized for crease following and subsequently the crease was
followed and the welding was finished. After this the setup was contrasted with the most usually
utilized programmed welding machine as a part of the business scanCONTROL and their
highlights were recognized.
The principal investigation, with the cam and laser diode, was an experience to realize a percentage
of the settings of the cam, and to comprehend the impact of the edge between the cam and
anticipated line. The examination of the information from the pictures ceased then the focuses
were conformed to the direction framework, further examination obliges line fitting to discover
one bend among all focuses. The cam and laser diode framework obliges a great deal of work push
to concentrate and discover the geometry of the weld and conceivable imperfections. For this
situation the anticipated line was somewhat short so it just secured the weld and a short separation
of the base material. Keeping in mind the end goal to discover splash the laser line projection must
be more extensive to cover a greater amount of the base material.
The obtained ScanCONTROL framework has manufactured in programming in the sensor head
that concentrates the focuses from the projection of the laser line. The work that was performed
on the first trial, to concentrate focuses, is as of now done in this framework, and the further work
was to dissect the information. In the Matlab program that was audited and altered it was anything
but difficult to discover scatter, undercut, leg-length and toe edge.
So as to robotize the investigation of the weld geometry it is presumably a smart thought to utilize
another methodology. As opposed to ascertaining each bend in the examination programming, one
can utilize a database with put away bends for correlation. Neural system is perhaps an approach
to comprehend it, the neural system use calculations for example acknowledgment, and it figures
out how to perceive particular examples.
It is conceivable to discover the geometry of the weld and it is conceivable to discover
imperfections with laser line projection and cam. The gear is imperative keeping in mind the end
goal to concentrate information helpful for investigation. I need to suggest a buy of the

21 | P a g e
ScanCONTROL since it is now part of the way through the work. The focuses from the laser
projection are prepared to utilize either in the product acquired along the sensor, or created suitable
for the event. It should however be tried to be sufficiently hearty in the event that it might be
utilized on – line amid welding
22 | P a g e
REFERENCES
[1] Volvo AB, "The Volvo Group annual report 2006," Göteborg, 2007.
[2] T. Brochmann, "Automating the search for measurement data in 3D-image of weld
joint," Trollhättan: University West, 2005.
[3] G. Lindén and K. Weman, MIG welding guide. Cambridge: Woodhead, 2006.
[4] J. Noruk and J.-P. Boillot, "Quality is almost free - laser vision technology insures six
sigma level robotic welding quality is achieved," VDI Berichte, p.
245, 2006.
[5] J. Noruk, "Visual weld inspection enters the new millennium," Sensor Review,
vol. 21, pp. 278-282, 2001.
[6] K. Min-Goo, K. Min-Goo, K. Joon-Hong, P. Young-Jun, and A. G.-J. W.
Gap-Joo Woo, "Laser vision system for automatic seam tracking of stainless steel pipe welding
machine (ICCAS 2007)," in Control, Automation and Systems,
2007. ICCAS '07. International Conference on, 2007, pp. 1046-1051.
[7] A. C. Hall, C. V. Knorovsky, J. Robino, Brooks, M. D.O, Reece.M, and G.
Poulter, "Characterizing the microstructure of GTA weld in-process using high-speed, high
magnification, digital imaging.," Eleventh international conferance
on computer technology in welding, pp. 117-135, 2002.
[8] W. Pastorius, W. Pastorius, and M. Snow, "Smart laser vision sensors simplify
inspectionSmart laser vision sensors simplify inspection," Instrumentation & Measurement
Magazine, IEEE, vol. 9, pp. 33-38, 2006.
[9] P. Xu, X. Tang, and S. Yao, "Application of circular laser vision sensor (CLVS) on
welded seam tracking," Journal of Materials Processing Technology, vol. In Press, Corrected
Proof.
[10] L. Xiwen, W. Guorong, and S. Yonghua, "Image Processing of Welding Seam Based on
Single-stripe Laser Vision System," in Intelligent Systems Design and Applications, 2006.
ISDA '06. Sixth International Conference, 2006, pp. 463-470.
[11] Sensotest AB, "http://www.sensotest.se/," 22 June 2008.
23 | P a g e
[12] AB Volvo, "Volvo standard STD 181-0001," 2 ed, June 2007.
[13] R. C. Jain, B. G. Schunck, and R. Kasturi, Machine vision. New York ; London:
McGraw-Hill, 1995.
[14] MICRO-EPSILON, "Manual--scanCONTROL--en," 2000.
[15] MICRO-EPSILON, "Manual_scanCONTROL_demo-software," 2006.

24 | P a g e
APPENDIX
1. Otsu’ method in MATLAB clc clear all I=imread('C:/weld.jpg');
subplot(1,2,1),imshow(I);
title('initial image')
level=graythresh(I); % setting grey thresholding value
BW=im2bw(I,level);
subplot(1,2,2),imshow(BW);
title('Otsu’method segmentation ');
2. Histogram thresholding in MATLAB
I=imread('C:/weld.jpg'); I1=rgb2gray(I); figure;
subplot(2,2,1);
imshow(I1);
title('greyscaled image')
[m,n]=size(I1);
GP=zeros(1,256);
for k=0:255 GP(k+1)=length(find(I1==k))/(m*n);
end
subplot(2,2,2),bar(0:255,GP,'g') % display histogram diagram title('
Greyscaled histogram diagram ')
xlabel(' Grey value')
ylabel(' Probability of occurrence ')
I2=im2bw(I,45/255);
subplot(2,2,3),imshow(I2);
title('segmented image of thresholding value 45')
I3=im2bw(I,65/255);
subplot(2,2,4),imshow(I3); title(' segmented image of thresholding value 65')
3. K-means clustering in MATLAB I_rgb =
imread('C:/weld.jpg');
subplot(1,2,1),imshow(I_rgb);
title(' initial image ');
C = makecform('srgb2lab'); I_lab =
applycform(I_rgb, C); ab =
double(I_lab(:,:,2:3)); nrows =
size(ab,1);
ncols = size(ab,2); ab = reshape(ab,nrows*ncols,2);
nColors = 3; % initial cluster centers

25 | P a g e
[cluster_idx cluster_center] = K-
means(ab,nColors,'distance','sqEuclidean','Replicates',3);
% iteration loops
pixel_labels = reshape(cluster_idx,nrows,ncols); subplot(1,2,2),imshow(pixel_labels,[]),
title('K-means clustering segmentation');
imwrite(pixel_labels,'KC:/weld.jpg','quality',100);
5. Edge detection in MATLAB I=imread('C:/weld.jpg'); subplot(2,3,1);
imshow(I); title('initial
image'); I1=im2bw(I);
I2=edge(I1,'roberts');
subplot(2,3,2); imshow(I2);
title(' detection by roberts operator ');
I3=edge(I1,'sobel');
subplot(2,3,3);
imshow(I3);
title(' detection by sobel operator ');
I4=edge(I1,'Prewitt'); subplot(2,3,4);
imshow(I4);
title(' detection by Prewitt operator ');
I5=rgb2gray(I);
I6=edge(I5,'canny');
subplot(2,3,6); imshow(I6);
title(' detection by canny operator ');
6. Image evaluation in MATLAB file_name='1';
a=double(imread(file_name));
M=size(a,1);
file_name='O1';
b=double(imread(file_name));
N=size(b,2);
sum1=0;
for i=1:M;
for j=1:N;
sum1=sum1+(a(i,j)b(i,j))^2;
end;
end;
mseValue=sum1/(M*N); % calculate MSE
sum2=0;
for i=1:M;
for j=1:N;
sum2=sum2+(a(i,j))^2;
end; end;
P=sum2;

26 | P a g e
snrValue=10*log10(P/mseValue); % calculate SNR
psnrValue=10*log10(255^2/mseValue); % calculate PSNR
sum3=0;
for i=1:M;
for j=1:N;
sum3=sum3+abs(a(i,j)b(i,j));
end; end;
Q=sum3;
maeValue=Q/(M*N);% calculate MSE
fprintf('\n MSE/SNR/PSNR/MAE of comparative image are %f / %f / %f/ %f
separately.\n',mseValue,snrValue,psnrValue,maeValue);
%display the MSE/SNR/PSNR/MAE
7. Image enhancement in MATLAB I=imread('C:/weld.jpg');
subplot(1,2,1),imshow(I);
title('initial image') I1=rgb2gray(I);
J=imadjust(I1,[0.1 0.5],[]);
% transform the range of grey value from [0.1 0.5]to[0 1]
k2=medfilt2(J,[5,5]); % median filtering in 5*5
I2=histeq(k2); % image equalization
subplot(1,2,2),imshow(I2);
title('image enhancement');