Embed Size (px)
Citation preview

Data for Vertical Alignment Partners
Region 6, Sam Houston State University & Lone Star College
All AVATAR artifacts :
http://www.ntp16.notlb.com/avatar

Purpose of AVATAR Module XData Sources for
Vertical Alignment Partners
• Provide data available from TEA and THECB websites: Career and College Readiness in Region 6
• Work with local institutional research (IR) officers to collect data


AEIS Data from TEAHuntsville High School, 2010-11
• Student Body:Student Group Number
TOTAL 1,609
Grade 9 404
Grade 10 450
Grade 11 399
Grade 12 356
Graduating class (2010) 361
% Minimum curriculum 9.4
% Recommended curriculum 90.6
*State Comparison:Minimum 17.3%Recommended 87.2%

AEIS Data from TEAWillis High School, 2010-11
• Student Body:Student Group Number
TOTAL 1,730
Grade 9 467
Grade 10 458
Grade 11 433
Grade 12 372
Graduating class (2010) 389
% Minimum curriculum 8.5%
% Recommended curriculum 91.5%

AEIS Data from TEAMagnolia West High School, 2010-11
• Student Body:Student Group Number
TOTAL 1,755
Grade 9 526
Grade 10 456
Grade 11 414
Grade 12 359
Graduating class (2010) 346
% Minimum curriculum 13.3%
% Recommended curriculum 86.7%
AEIS Data from TEAHuntsville High School, 2010-11
• Ethnicity of Student Body in Percentages:Ethnic Group Percentage
African American 25.7
Hispanic 26.5
White 44.9
American Indian 0.4
Asian 1.9
Pacific Islander 1.0
2 or more races 1.5

AEIS Data from TEAWillis High School, 2010-11
• Ethnicity of Student Body in Percentages:Ethnic Group Percentage
African American 8.3
Hispanic 26.2
White 62.4
American Indian 0.4
Asian 0.6
Pacific Islander 0.1
2 or more races 2.0

AEIS Data from TEAMagnolia West High School, 2010-11
• Ethnicity of Student Body in Percentages:Ethnic Group Percentage
African American 2.6
Hispanic 24.4
White 70.9
American Indian 0.7
Asian 0.3
Pacific Islander 0.0
2 or more races 1.1

AEIS Data from TEAHuntsville High School, 2010-11
• Other Descriptors of Student Body in Percentages:Demographic groups Percentage
Economically disadvantaged 48.5
Limited English Proficient (LEP) 5.8
With disciplinary placements 8.3
At risk* 48.7
Mobility (2009-10) 19.9
*At risk of dropping out of school based on performance and status indicators listed in the AEIS Glossary.

AEIS Data from TEAWillis High School, 2010-11
• Other Descriptors of Student Body in Percentages:Demographic groups Percentage
Economically disadvantaged 50.2
Limited English Proficient (LEP) 6.1
With disciplinary placements (2009-2010) 1.6
At risk* 42.3
Mobility (2009-10) 16.5
*At risk of dropping out of school based on performance and status indicators listed in the AEIS Glossary.

AEIS Data from TEAMagnolia West High School, 2010-11
• Other Descriptors of Student Body in Percentages:Demographic groups Percentage
Economically disadvantaged 38.7
Limited English Proficient (LEP) 2.2
With disciplinary placements (2009-2010) 2.6
At risk* 41.5
Mobility (2009-10) 14.7
*At risk of dropping out of school based on performance and status indicators listed in the AEIS Glossary.

AEIS Data from TEAHuntsville High School, 2010-11
• Percent Enrolled in Advanced Course/Dual Enrollment:
Year All African-American
Hispanic White Amer.Indian
Asian PacificIsland
Two/More
2009-10 23.3 18.1 17.0 28.4 50.0 62.5 * 34.52008-09 23.5 17.1 20.1 28.2 20.0 n/a n/a n/a

AEIS Data from TEAWillis High School, 2010-11
• Percent Enrolled in Advanced Course/Dual Enrollment:
Year All African-American
Hispanic White Amer.Indian
Asian PacificIsland
Two/More
2009-10 26.5 8.1 25.2 29.4 12.5 27.3 * 36.12008-09 25.8 13.9 24.8 27.4 22.2 n/a n/a n/a

AEIS Data from TEAMagnolia West High School, 2010-11
• Percent Enrolled in Advanced Course/Dual Enrollment:
Year All African-American
Hispanic White Amer.Indian
Asian PacificIsland
Two/More
2009-10 49.2 54.3 42.5 51.4 33.3 * * 28.62008-09 11.8 13.5 3.6 13.7 0.0 n/a n/a n/a

AEIS Data from TEAHuntsville High School, 2010-11
• AP/IB Percentage Tested– IP PercenAP/IP Percentage Tested– tage TestedAP/IP Percentage Tested– AP/IP Percentage Tested• AP/IB Percent Examinees Met or Exceeded Criteria
Year All African-American
Hispanic White Amer.Indian
Asian PacificIsland
Two/More
2009-10 32.2 18.7 19.9 43.3 * 66.7 - 33.3
2008-09 15.0 5.3 6.3 22.7 * n/a n/a n/a
Year All African-American
Hispanic White Amer.Indian
Asian PacificIsland
Two/More
2009-10 35.7 11.8 40.0 40.0 * 50.0 - *
2008-09 51.9 20.0 22.2 59.8 - n/a n/a n/a

AEIS Data from TEAWillis High School, 2010-11
• AP/IB Percentage TestedYear All African-
AmericanHispanic White Amer.
IndianAsian Pacific
IslandTwo/More
2009-10 9.2 0.0 17.5 6.4 18.2 0.0 * 5.9
2008-09 13.5 5.6 27.0 9.3 * n/a n/a n/a
• AP/IB Percent Examinees Met or Exceeded CriteriaYear All African-
AmericanHispanic White Amer.
IndianAsian Pacific
IslandTwo/More
2009-10 49.3 - 61.8 34.5 * - - *
2008-09 41.5 * 55.3 31.0 * n/a n/a n/a

AEIS Data from TEAMagnolia West High School, 2010-11
• AP/IB Percentage TestedYear All African-
AmericanHispanic White Amer.
IndianAsian Pacific
IslandTwo/More
2009-10 28.0 38.9 16.3 30.7 * * - *
2008-09 26.1 36.4 6.7 30.4 * n/a n/a n/a
• AP/IB Percent Examinees Met or Exceeded CriteriaYear All African-
AmericanHispanic White Amer.
IndianAsian Pacific
IslandTwo/More
2009-10 60.2 28.6 38.1 64.1 * * - *
2008-09 45.3 * * 45.5 - n/a n/a n/a
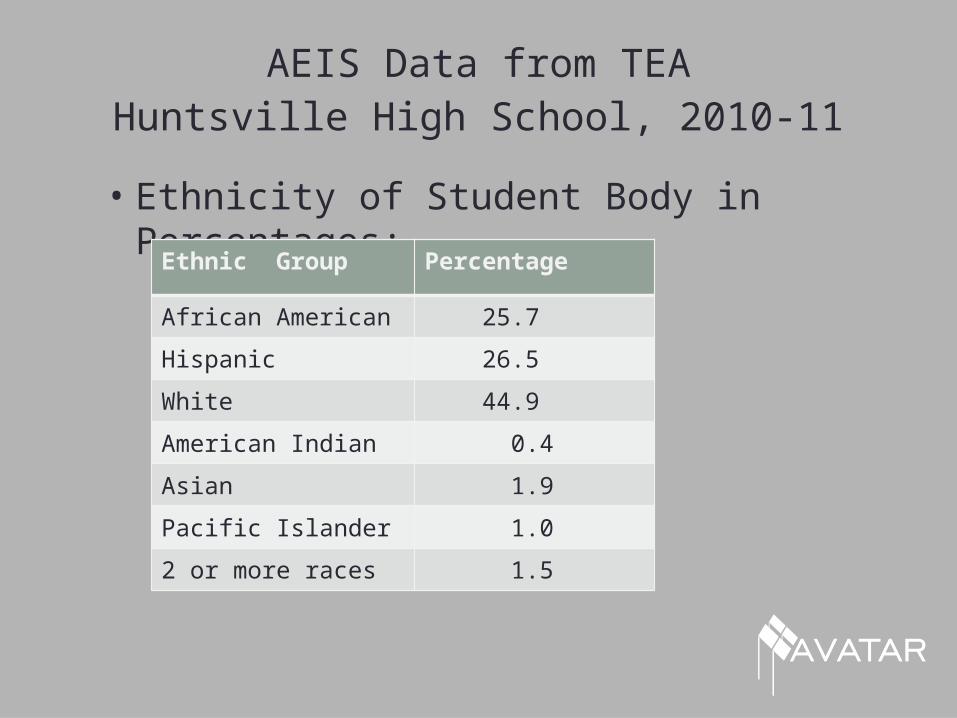
AEIS Data from TEAHuntsville High School, 2010-11
• Texas Success Initiative, English Lang Arts, Percent Passing
• Texas Success Initiative, Math, Percent Passing
Year All African-American
Hispanic White Amer.Indian
Asian PacificIsland
Two/More
2011 62 45 58 72 * * * *
2010 66 51 52 78 * >99 * 75
Year All African-American
Hispanic White Amer.Indian
Asian PacificIsland
Two/More
2011 62 45 53 75 * * * *
2010 59 47 48 70 * 63 * 50

AEIS Data from TEAWillis High School, 2010-11
• Texas Success Initiative, English Lang Arts, Percent Passing
Year All African-American
Hispanic White Amer.Indian
Asian PacificIsland
Two/More
2011 58 50 51 60 * * * 90
2010 43 8 37 49 60 * * 33
• Texas Success Initiative, Math, Percent PassingYear All African-
AmericanHispanic White Amer.
IndianAsian Pacific
IslandTwo/More
2011 72 63 64 76 * * * 89
2010 62 21 62 68 40 * * 38

AEIS Data from TEAMagnolia West High School, 2010-11
• Texas Success Initiative, English Lang Arts, Percent Passing
Year All African-American
Hispanic White Amer.Indian
Asian PacificIsland
Two/More
2011 73 73 59 76 80 * * *
2010 67 99 55 70 * * * *
• Texas Success Initiative, Math, Percent PassingYear All African-
AmericanHispanic White Amer.
IndianAsian Pacific
IslandTwo/More
2011 66 75 55 69 60 * * *
2010 56 29 38 62 * * * *

AEIS Data from TEAHuntsville High School, 2010-11
• Percentage College Ready Graduates, Class of 2010
Subject All African-American
Hispanic White Amer.Indian
Asian PacificIsland
Two/More
English 65 51 56 77 * 40 * *
Math 64 47 58 74 * 60 * *
Both 52 33 42 66 * 40 * *

AEIS Data from TEAWillis High School, 2010-11
• Percentage College Ready Graduates, Class of 2010
Subject All African-American
Hispanic White Amer.Indian
Asian PacificIsland
Two/More
English 55 45 53 56 * * * 71
Math 58 38 55 60 * * * 71
Both 42 29 34 46 * * * 57

AEIS Data from TEAMagnolia West High School, 2010-11
• Percentage College Ready Graduates, Class of 2010
Subject All African-American
Hispanic White Amer.Indian
Asian PacificIsland
Two/More
English 76 80 54 80 * * * *
Math 66 60 40 71 * * * *
Both 57 50 30 63 * * * *

P-16 Data from THECBHuntsville High School, 2011
Institution of Enrollment, Class of 2011 Students
Sam Houston State University 58
Lone Star College - Montgomery 29
Texas A&M University 12
Blinn College 11
Stephen F. Austin State University 8
University of Texas at Tyler 6
Other Public/Ind 4-year (14) 22
Other Public/Ind 2-year (9) 13
Not trackable 20
Not found 189Total high school graduates 368
Slide 8

P-16 Data from THECBWillis High School, 2011
Institution of Enrollment, Class of 2011 Students
Sam Houston State University 22
Lone Star College - Montgomery 71
Texas A&M University 15
Blinn College 10
UT Austin 5
Other Public/Ind 4-year (18) 32
Other Public/Ind 2-year (5) 13
Not trackable 15
Not found 170Total high school graduates 350

P-16 Data from THECBMagnolia West High School, 2011
Institution of Enrollment, Class of 2011 Students
Sam Houston State University 12
Lone Star College - Montgomery 6
Texas A&M University 12
Blinn College 10
Lone Star College - Tomball 91
Other Public/Ind 4-year (16) 28
Other Public/Ind 2-year (8) 8
Not trackable 19
Not found 173Total high school graduates 359

P-16 Data from THECBHuntsville High School, 2011
• Public Higher Education First Year Grades of High School Graduates in FY 2010
IHE type
N <2.0 2.0-2.49 2.5-2.99 3.0-3.49 >3.5 Unk
4-year 133 27 25 30 28 21 2
2-year 70 24 12 18 7 2 7Slide 9

P-16 Data from THECBWillis High School, 2011
• Public Higher Education First Year Grades of High School Graduates in FY 2010
IHE type
N <2.0 2.0-2.49 2.5-2.99 3.0-3.49 >3.5 Unk
4-year 66 15 12 17 13 9 0
2-year 119 40 22 8 22 12 15Slide 9

P-16 Data from THECBMagnolia West High School, 2011
• Public Higher Education First Year Grades of High School Graduates in FY 2010
IHE type
N <2.0 2.0-2.49 2.5-2.99 3.0-3.49 >3.5 Unk
4-year 54 8 6 10 16 14 0
2-year 133 45 22 9 27 19 11Slide 9

Participation Data from THECBLone Star College, 2011
Sam Houston State University, 2011
• Enrollment by Year; 2011 by Ethnicity PercentageInstitution 2010 2011Lone Star College System (LSC) 57,015 60,285
Lone Star Montgomery 11,154 11,830
Sam Houston State University (SHSU) 17,236 17,527
Lone Star Tomball 10,791 11,334
Institution White Hispanic African American
Multi-Racial
Asian/Pacific
Inter’l Other/Unk
LSC System 39.6 29.1 16.4 .6 5.5 1.8 7.0
LSC Montgomery 58.2 20.9 9.8 .5 3.0 2.3 5.4
SHSU 61.4 16.5 15.5 0.3 1.3 1.6 3.2
LSC Tomball 51.0 22.3 12.6 0.5 5.8 1.5 6.2
Slide 10

Online Institutional Resumes: THECBLone Star College, 2011
Sam Houston State University, 2011
• Graduation/Completion NumbersDegrees and Certificates Awarded 2011LSC System Associate’s 3271 Certificate 1 804 Certificate 2 112LSC Mont Associate’s 510 Certificate 1 121 Certificate 2 23SHSU Bachelor’s 3013 Master’s 875 Doctorate 43
Slide 11

Online Institutional Resumes: THECBLone Star College, 2011
Sam Houston State University, 2011
• Graduation/Completion Numbers (cont)Degrees and Certificates Awarded 2011LSC Tomball Associate’s 425 Certificate 1 147 Certificate 2 18
Slide 11
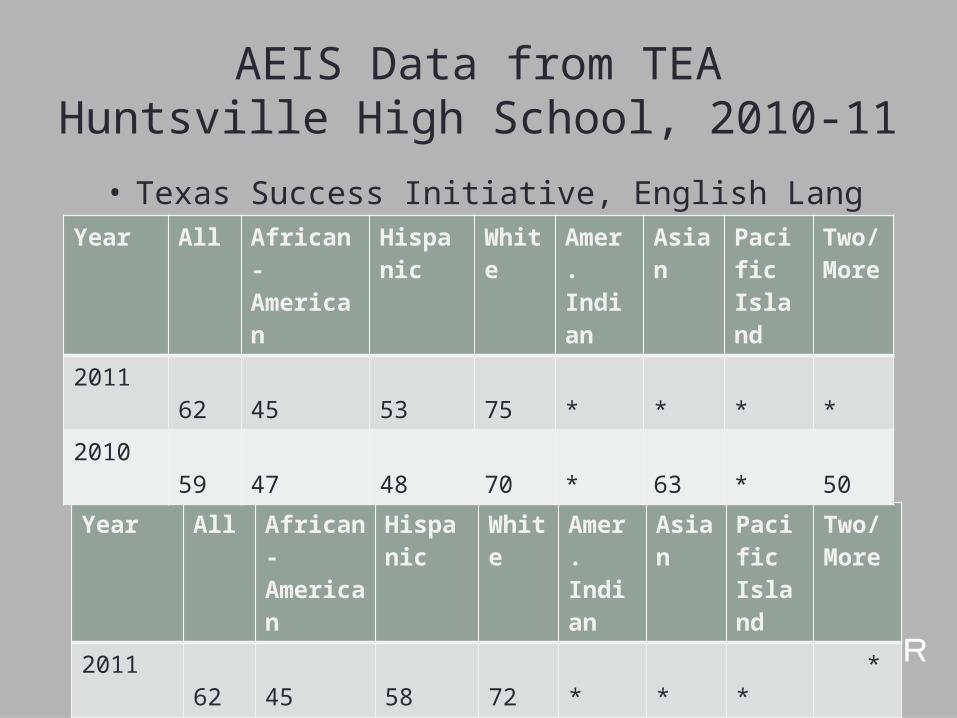
P-16 Data from THECBLone Star College Montgomery, 2011Sam Houston State University, 2011
Lone Star College Tomball, 2011
• Dual Credit Enrollment
Dual Credit Enrollment 2011 (# of Students)
Lone Star College Montgomery 978
Sam Houston State University 0
Lone Star College Tomball 1,256
Slide 12

Participation Data from THECBLone Star College Montgomery, 2011
Developmental Education, Fall 2008 Cohort Tracked for 2 years
FTIC Students Requiring Dev. Ed.
N % AttemptingCollege Courses
% Attempting and Completing
Math 710 19.6 64.0
Reading 174 69.0 74.2
Writing 90 56.7 66.7
FTIC Students Not Needing Dev. Ed.
N % AttemptingCollege Courses
% Attempting and Completing
LSC Montgomery 1,931
Math 56.8 54.7
Reading 90.6 54.6
Writing 86.4 52.2
13

Student Migration Data from THECBLone Star College Montgomery, 2011
Fall 2009 to Fall 2010
Non-graduates N % at Same
% at Other 2-yr
% at 4-yr % not found
Academic 7,441
38.9 9.1 15.1 36.9
Technical 1,165
38.4 13.6 6.4 41.7
Tech-prep 897 39.4 16.8 5.5 38.4
Graduates by program
N % at Same
% at Other 2-yr
% at 4-yr % notfound
Academic 275 18.9 3.6 42.5 34.9
Technical 122 19.7 5.7 4.9 69.7
Tech-Prep 50 18.0 8.0 18.0 56.0
14
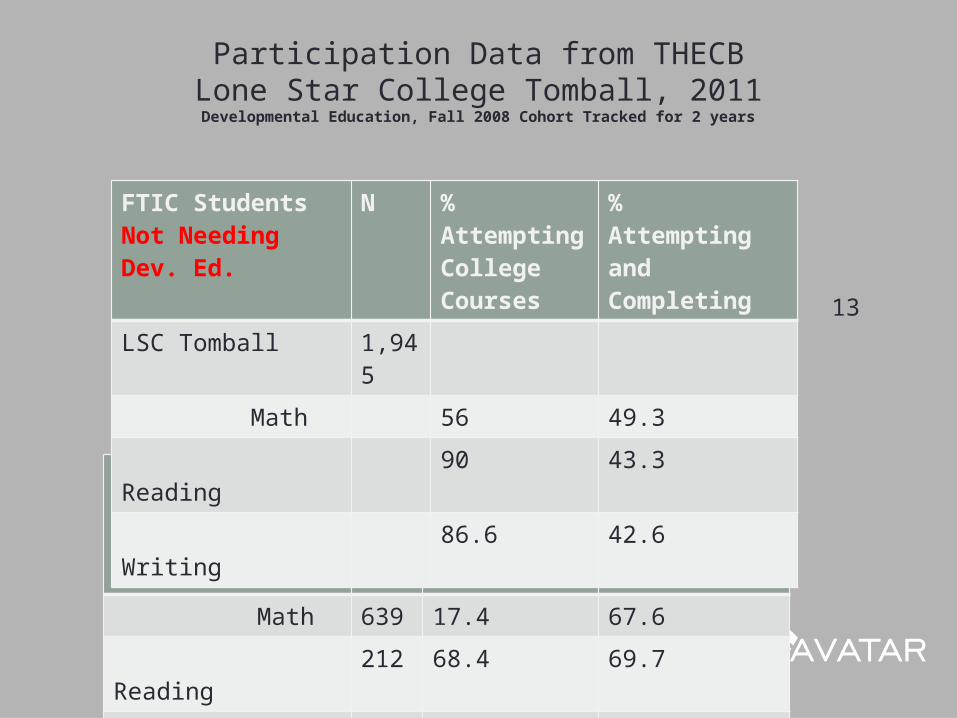
Participation Data from THECBLone Star College Tomball, 2011Developmental Education, Fall 2008 Cohort Tracked for 2 years
FTIC Students Requiring Dev. Ed.
N % AttemptingCollege Courses
% Attempting and Completing
Math 639 17.4 67.6
Reading 212 68.4 69.7
Writing 110 65.5 54.2
FTIC Students Not Needing Dev. Ed.
N % AttemptingCollege Courses
% Attempting and Completing
LSC Tomball 1,945
Math 56 49.3
Reading 90 43.3
Writing 86.6 42.6
13

Student Migration Data from THECBLone Star College Tomball, 2011
Fall 2009 to Fall 2010
Non-graduates N % at Same
% at Other 2-yr
% at 4-yr % not found
Academic 7,051 35.3 13.3 15.2 36.2
Technical 1,004 33.1 18.3 5.6 43.0
Tech-prep 950 36.4 17.9 5.4 40.3
Graduates by program
N % at Same
% at Other 2-yr
% at 4-yr % notfound
Academic 207 14 8.2 34.3 43.5
Technical 65 10.8 18.5 7.7 63.1
Tech-Prep 84 16.7 4.8 8.3 70.2
14

Academic Performance of Transfer Students fromLone Star College Montgomery, 2011
Developmental Education vs. No Developmental Education, Fall 2009
No Developmental Education
N <2.0 2.0-2.49
2.5-2.99
3.0-3.49
>3.5 Unk EnrollFall’10
Sam Houston 206 84 8 14 11 26 24 1 72
Texas A&M 25 14 0 0 6 6 2 0 14
Other public 4-yr 24 11 2 0 2 2 4 1 7
Developmental Education prior to Transfer
Total N <2.0
2.0-2.49
2.5-2.99
3.0-3.49
>3.5 Unk Enroll Fall ’10
Sam Houston 206 122 15 26 26 21 27 7 97
Texas A&M 25 11 2 2 4 1 2 0 9
Other public 4-yr 24 13 3 2 2 4 2 0 8
15

Academic Performance of Transfer Students fromLone Star College Tomball, 2011
Developmental Education vs. No Developmental Education, Fall 2009
No Developmental Education
N <2.0 2.0-2.49
2.5-2.99
3.0-3.49
>3.5 Unk EnrollFall’10
Sam Houston 108 45 4 7 9 11 13 1 39
Texas A&M 15 11 1 1 1 5 3 0 10
Other public 4-yr 24 13 2 2 0 5 4 0 9
Developmental Education prior to Transfer
Total N <2.0
2.0-2.49
2.5-2.99
3.0-3.49
>3.5 Unk Enroll Fall ’10
Sam Houston 108 63 9 8 15 18 13 0 55
Texas A&M 15 4 0 2 2 0 0 0 4
Other public 4-yr 24 11 2 0 1 5 3 0 9
15
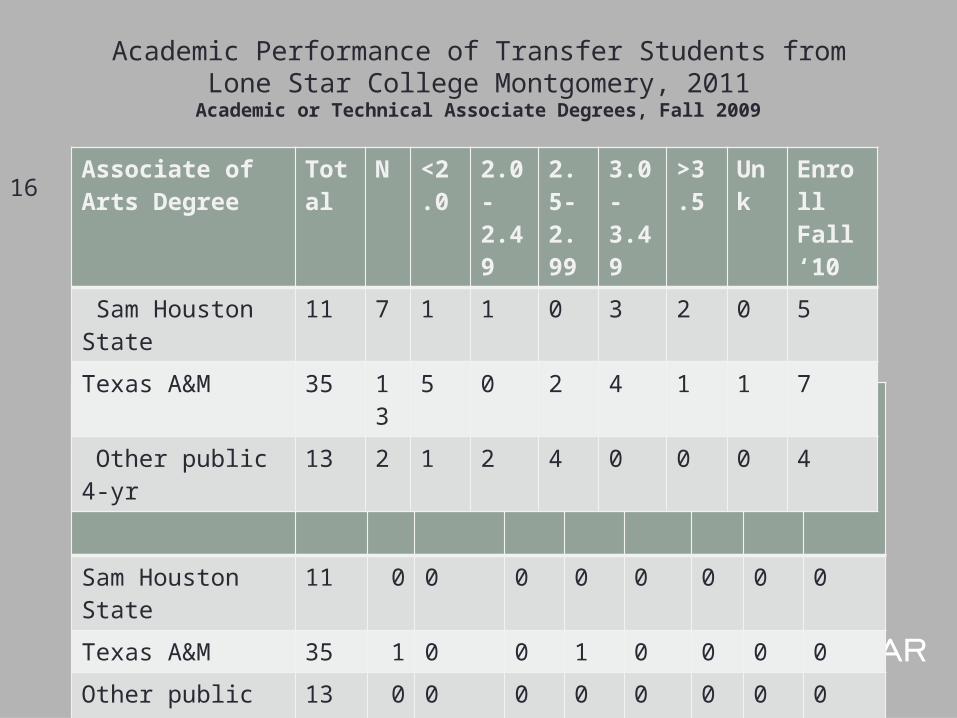
Academic Performance of Transfer Students fromLone Star College Montgomery, 2011Academic or Technical Associate Degrees, Fall 2009
Technical Associate Degree
Total N <2.0 2.0-2.49
2.5-2.99
3.0-3.49
>3.5
Unk EnrollFall‘10
Sam Houston State 11 0 0 0 0 0 0 0 0
Texas A&M 35 1 0 0 1 0 0 0 0
Other public 4-yr 13 0 0 0 0 0 0 0 0
Associate of Arts Degree
Total N <2.0
2.0-2.49
2.5-2.99
3.0-3.49
>3.5
Unk Enroll Fall ‘10
Sam Houston State 11 7 1 1 0 3 2 0 5
Texas A&M 35 13 5 0 2 4 1 1 7
Other public 4-yr 13 2 1 2 4 0 0 0 4
16

Academic Performance of Transfer Students fromLone Star College Tomball, 2011
Academic or Technical Associate Degrees, Fall 2009
Technical Associate Degree
Total N <2.0 2.0-2.49
2.5-2.99
3.0-3.49
>3.5
Unk EnrollFall‘10
Sam Houston State 108 1 0 0 0 0 1 0 1
Texas A&M 15 0 0 0 0 0 0 0 0
Other public 4-yr 24 1 0 1 0 0 0 0 1
Associate of Arts Degree
Total N <2.0
2.0-2.49
2.5-2.99
3.0-3.49
>3.5
Unk Enroll Fall ‘10
Sam Houston State 108 16 1 1 3 6 5 0 14
Texas A&M 15 3 0 0 0 2 1 0 3
Other public 4-yr 24 4 0 0 0 0 4 0 4
16

Academic Performance of Transfer Students fromSam Houston State University University, 2011
Developmental Education vs. No Developmental Education, Fall 2009
No Developmental Education
N <2.0 2.0-2.49
2.5-2.99
3.0-3.49
>3.5 Unk EnrollFall‘10
Texas Tech 11 1 0 0 0 1 0 0 1
West Texas A&M 35 5 1 1 1 0 2 0 4
Other public 4-yr 13 2 0 1 1 0 0 0 2
Developmental Education prior to Transfer
Total N <2.0 2.0-2.49
2.5-2.99
3.0-3.49
>3.5 Unk Enroll Fall ‘10
Lone Star College (Montgomery)
206 122 15 26 26 21 27 7 97
Blinn College 364 221 42 58 40 53 21 7 178
Houston Community College
54 33 10 6 4 6 6 1 24
Lone Star College (Cy –Fair)
81 50 7 15 5 14 8 1 42
Lone Star College (Kingwood)
80 41 7 7 3 12 11 1 32
Lone Star College (N. Harris)
66 41 9 8 6 7 7 4 34
Lone Star College (Tomball)
108 63 9 8 15 18 13 0 55
All Other Public 160 82 27 12 16 12 9 6 49
17

Academic Performance of Transfer Students fromSam Houston State University, 2011
Developmental Education vs. No Developmental Education, Fall 2009
No Developmental Education
N <2.0 2.0-2.49
2.5-2.99
3.0-3.49
>3.5 Unk EnrollFall‘10
Texas Tech 11 1 0 0 0 1 0 0 1
West Texas A&M 35 5 1 1 1 0 2 0 4
Other public 4-yr 13 2 0 1 1 0 0 0 2
No Developmental Education
Total N <2.0 2.0-2.49
2.5-2.99
3.0-3.49
>3.5 Unk Enroll Fall ‘10
Lone Star College (Montgomery)
206 84 8 14 11 26 24 1 72
Blinn College 364 143 19 24 36 34 24 6 111
Houston Community College
54 21 5 4 1 8 3 0 16
Lone Star College (Cy-Fair)
81 31 6 5 8 5 7 0 23
Lone Star College (Kingwood)
80 39 7 4 4 10 13 1 28
Lone Star College (N. Harris)
66 25 5 1 5 5 9 0 21
Lone Star College (Tomball)
108 45 4 7 9 11 13 1 39
All Other Public 160 78 11 12 14 19 16 6 57
18

Academic Performance of Transfer Students fromSam Houston State University, 2011
Core Curriculum Completed Prior to Transfer, Fall 2009
No Developmental Education
N <2.0 2.0-2.49
2.5-2.99
3.0-3.49
>3.5 Unk EnrollFall‘10
Texas Tech 11 1 0 0 0 1 0 0 1
West Texas A&M 35 5 1 1 1 0 2 0 4
Other public 4-yr 13 2 0 1 1 0 0 0 2
Core Complete Total N <2.0 2.0-2.49
2.5-2.99
3.0-3.49
>3.5 Unk Enroll Fall ‘10
Lone Star College (Montgomery)
206 63 4 8 11 15 24 1 60
Blinn College 364 0 0 0 0 0 0 0 0
Houston Community College
54 7 2 0 1 3 1 0 4
Lone Star College (Cy-Fair)
81 19 2 3 4 6 4 0 16
Lone Star College (Kingwood)
80 29 1 4 4 8 10 2 23
Lone Star College (N. Harris)
66 21 4 3 4 5 3 2 16
Lone Star College (Tomball)
108 23 2 0 8 6 7 0 22
All Other Public 160 16 3 0 2 6 3 2 12
19

Academic Performance of Transfer Students fromSam Houston State University, 2011
Earned Associate of Arts Degree Prior to Transfer, Fall 2009
No Developmental Education
N <2.0 2.0-2.49
2.5-2.99
3.0-3.49
>3.5 Unk EnrollFall‘10
Texas Tech 11 1 0 0 0 1 0 0 1
West Texas A&M 35 5 1 1 1 0 2 0 4
Other public 4-yr 13 2 0 1 1 0 0 0 2
Core Complete Total N <2.0 2.0-2.49
2.5-2.99
3.0-3.49
>3.5 Unk Enroll Fall ‘10
Lone Star College (Montgomery)
206 48 7 9 8 10 12 2 42
Blinn College 364 54 7 10 15 12 9 1 43
Houston Community College
54 6 0 1 1 3 1 0 4
Lone Star College (Cy-Fair)
81 15 2 2 3 4 4 0 12
Lone Star College (Kingwood)
80 25 2 3 2 8 8 2 18
Lone Star College (N. Harris)
66 18 3 4 2 3 4 2 14
Lone Star College (Tomball)
108 16 1 1 3 6 5 0 14
All Other Public 160 20 2 3 2 6 5 2 13
20

Success Data from THECBSam Houston State University, 2011
Developmental Education, Fall 2008 Cohort Tracked for 2 years
FTIC Students Requiring Dev. Ed.
N % AttemptingCollege Courses
% Attempting and Completing
Math 50 64 43.8
Reading 4 25 100
Writing 6 33.3 50
FTIC Students Not Needing Dev. Ed.
N % AttemptingCollege Courses
% Attempting and Completing
SHSU 1,851
Math 92.9 55.4
Reading 95.1 90.5
Writing 94.2 90
21

Success Data from THECBLone Star College, 2011
Percent of Students Transferred or Employed with Peer Comparison
Transferred with < 30 SCH
Transferred with > 30 SCH
Employed StillEnrolled
Enrolled & Employed
LSC Montgomery
FY 2010 10.6 18.1 54.7 11.8 19.5
FY 2011 10.3 17.8 n/a n/a n/a
Peers (2010) 7.7 16.1 55.5 11.5 16.2
• Student Transfer and Completer Percentages
22

Success Data from THECBLone Star College, 2011
Percent of Students Transferred or Employed with Peer Comparison
Transferred with < 30 SCH
Transferred with > 30 SCH
Employed StillEnrolled
Enrolled & Employed
LSC Tomball
FY 2010 11.3 16.4 56.5 11.0 15.4
FY 2011 12.4 15.8 n/a n/a n/a
Peers (2010) 7.7 16.1 55.5 11.3 16.2
• Student Transfer and Completer Percentages
22

Success Data from THECBSam Houston State University, 2011
Graduation Rate of First-time, Full-Time Degree-seeking Students
4-year rate 5-year rate 6-year rateSam Houston State University
Same institution 27.1 44.7 49.3
Other institution 3.0 7.7 8.6
Total 30.1 52.4 57.9
• Student Baccalaureate Success Rate
23

Data Sources
• Texas Education Agency, Testing and Accountability, AEIS. See handout for details.
• Texas Higher Education Coordinating Board, Data Resources and Tools. See handout for details. The county of the institution is needed for retrieving some items.

Considerations for LocalData Collection
• Collection of data from students requires consideration of FERPA. Institutional Research officers recommend that you secure IRB approval and informed consent.
• Data warehouses are constantly improving. Be sure to ask whether the data you want are available.

AVATAR Data Follow-up
• Paul Carney invites AVATAR participants to his website https://www.centerforcollegereadiness.org/
• Mary Harris invites AVATAR data gatherers to consult at [email protected] or 940 565-4327.
• Introduce yourself and your team to local Institutional Research officers.