Embed Size (px)
Citation preview

4th International Conference on Earthquake Geotechnical Engineering
June 25-28, 2007 Paper No. 1276
CYCLIC DEGRADATION IN STRENGTH AND STIFFNESS OF NON-PLASTIC SILT BASED ON VOLUME DECREASE POTENTIAL
Byungwoong SONG1, Kazuya YASUHARA2, Masanori HAMADA3, and Innjoon Park4
ABSTRACT Following case studies for earthquake-induced liquefaction damage, it can be known that liquefaction had happened on the sand or sandy soil. But it occurs in sand or sandy soil and moreover it comes out in a weathered soil or silt. During 1995 Great Hansin Earthquake liquefaction happened in the weathered soil as called Masado and it came into the spotlight from the world. Many scholars and engineers have worked hard to find out characteristics of a weathered soil. In the mean time, Tottoriken-Seibu Earthquake in Japan, 1999 made liquefaction occur in non-plastic silt. But researches for liquefaction in non-plastic silt are not well known in the world. Thereupon this study focused to investigate cyclic characteristics for non-plastic silt. The apparatus of NGI-type cyclic direct simple shear test (DSST) was used to be aware of cyclic characteristic on non-plastic silt. The tested results compared with three soils were sand, Masado (weathered soil), and clay. Clay was used to contrast characteristics of strength and stiffness of non-plastic soil with those of plastic soil. Through comparing results from cyclic DSST, cyclic strength degradation of non-plastic silt was faster although cyclic strength was smaller. Although its maximum stiffness was not smaller than others, stiffness softening with increasing number of cycle loading was more remarkable. Totally, it is known that non-plastic silt has very high liquefaction feasibility based on terms of the volume decrease potential. Keywords: Direct Simple Shear Test, Volume Decrease Potential, Non-plastic Silt, Strength, Stiffness
INTRODUCTION According to investigation of earthquake-induced liquefaction damage, it is known that liquefaction does not happen to only sands or sandy soils any longer. During 1989 Loma Prieta Earthquake in America, liquefaction and lateral flow reported on soil contained fine near Moss Landing Marine Laboratory at California (Boulanger et al., 1998). Through Northridge Earthquake, 1994 in America lateral flow after liquefaction on silty sand spreaded widely (Holzer et al., 1999). The earthquake, magnitude 6.9 on January 16, 1995 in Kobe, Japan caused sand or Masado including small gravel to originate extensive liquefaction and lateral flow (Hamada et al., 1996). Furthermore, during 2000 Tottori-Seibu Earthquake in Japan liquefaction took place on even non-plastic silt had understood that liquefaction would not occur (JGS, 2002). 1 Researcher, Graduate School of Science and Engineering, Waseda University, Japan, Email: [email protected] 2 Professor, Department of Urban and Civil Engineering, Ibaraki University, Japan. Email: [email protected] 3 Professor, Department Civil and Environmental Engineering, Waseda University, Japan. Email: [email protected] 4 Assistant Professor, Department Civil Engineering, Hanseo University, Korea. Email: [email protected]

Through the case histories mentioned above, the damage of liquefaction induced by earthquake maybe not only sandy soils but also silt and weathered soil. Especially, liquefaction and lateral flow about non-plastic silt did not widely examined in the world. Besides, research for cyclic characteristics of non-plastic silt does not become generally rather than sand, clay and even weathered soil. Accordingly, this study focused the decreasing characteristics of strength and stiffness on non-plastic silt with DSST to help to comprehend characteristics of non-plastic silt.
CONCEPT OF SOIL TEST AND DEFINITION OF WORDS Direct Simple Shear Test (DSST) was used to find out characteristics for cyclic strength and stiffness of non-plastic silt, and those compared with those of other soils as sand, Masado and clay. Besides, the definition of Volume Decrease Potential eVDP applied to explain the cyclic degradation characteristics of non-plastic silt with those of other three soils. Equipment and soil characteristic The used apparatus of NGI-type DSST had been in Ibaraki University. The soils for comparison are DL Clayey Silt (called DL Silt; non-plastic silt) manufactured in Japan, Keuper Marl Silty Clay (called KM Clay; clay) came from England, Hitachi Sand (sand) gathered at house complex in Hitachi City, Japan, and Kobe Sand (weathered soil) collected at Port Island in Kobe Port liquefied by the Great Hansin Earthquake, 1995. Equipment Figure 1 illustrates NGI-type apparatus of DSST. It is composed as a vertical and a horizontal stress can apply to each specimen are up to 5 MPa by air pressure and 2 MPa by oil pressure, respectively. A vertical and a horizontal displacement can be measured up to 10 mm by strain gauges. Specimen with 30 mm height and 70 mm diameter is held in wire-reinforced membrane. Therefore, the NGI-type DSS apparatus is capable of performing tests under the K0-condition (Song, 2003; Song et al., 2004).
VerticalDisplacementGauge 1
VerticalDisplacementGauge 2
VerticalLoad Cell
Oil Compressor
ActuatorGap Sensor
Specimen inWire Membrane
AirCompressor
HorizontalLoad Cell
Balance Pressure Regulator
VerticalPressureRegulator
MotorBalance Pressure LayerVertical Pressure Layer
HorizontalDisplacementGauge (Small)HorizontalDisplacementGauge (Large)
RingFrame
0
20
40
60
80
100
0.001 0.01 0.1 1 10 100
Pass
ing
perc
enta
ge (%
)
Clay Silt Sand Gravel
Grain size (mm)
Feasible liquefaction
Very Feasible liquefaction
KM ClayDL SiltHitachi SandKobe Sand
0
20
40
60
80
100
0.001 0.01 0.1 1 10 100
Pass
ing
perc
enta
ge (%
)
Clay Silt Sand Gravel
Grain size (mm)
Feasible liquefaction
Very Feasible liquefaction
KM ClayDL SiltHitachi SandKobe Sand
KM ClayDL SiltHitachi SandKobe Sand
KM ClayDL SiltHitachi SandKobe Sand
Figure 1. Direct Simple Shear Test (NGI type) Figure 2. Particle size curve Soil Characteristics Figure 2 shows particle size curve for four soils, respectively (JGS, 1993). Ranges are also illustrated to know whether soils have a potential to be liquefied or not. From figure 2 it is known that Hitachi Sand and Kobe Sand have a very feasible liquefaction. Kobe Sand as weathered soil holds a few fines among four soils. Meanwhile, DL Silt appears a possibility of liquefaction even if it is smaller than those of Hitachi Sand and Kobe Sand. In addition KM Clay seems to not have it. Table 1 shows characteristics of soils used in this study. Particle densities ρs for four soils distribute between 2.64 and 2.79. And effective friction angles φ’ show within 23 and 31.5 degree. Maximum and minimum void ratios for all soils except KM Clay has plasticity are shown in Table 1. All of specimens are reconstructed under normal consolidation condition.

Table 1. Soil characteristics
KM Clay DL Silt Hitachi Sand Kobe Sand
Particle Density ρs (g/cm3) 2.79 2.64 2.69 2.64
Effective friction angle φ' (Deg.) 25 23 31.5 30
Maximum void ratio emax - 1.47 1.45 0.81
Minimum void ratio emin - 0.71 1.03 0.47
Coefficient of uniformity Uc 4 24 100 33
Coefficient of curvature Uc’ 1.4 8.6 30.3 5
Manufacture of specimen and soil test conditions Specimens for Hitachi Sand and Kobe Sand produced following JIS A 1224 (JGS, 2000). On the other hand, it was very hard to determine maximum and minimum void ratio of DL Silt with minimum and maximum density since there is no testing method for non-plastic silt. Therefore, Minimum and maximum density of non-plastic silt obtained through D4254(C) of ASTM (JGS, 2000), and JIS A 1210 (JGS, 2000), respectively. Manufacture of specimen Table 2 shows testing conditions for specimen with DSST. Non-plastic soils as are Hitachi Sand, Kobe Sand and DL Silt compared each others for relative density Dr and volume decrease potential eVDP. Void ratio e is used to compare non-plastic soils with plastic soil of KM Clay.
Table 2. Condition of specimen after confining pressure
Items KM Clay DL Silt Hitachi Sand Kobe Sand
Confined Stress (kPa) 196 196 98 98
Void Ratio after Confining 0.63 0.94 1.05 0.61
Relative Density (%) - 70 96 59
Volume Decrease Potential - 0.23 0.01 0.14 Ishihara and Watanabe (1972) read a paper on volume decrease potential eVDP. Equation (1) and figure 3(a) show a definition of it.
( ) ( )minmaxmin 1 eeDeee rVDP −⋅−=−= (1) where e is void ratio, emin is a minimum void ratio, emax is a maximum void ratio, and Dr is a relative density. It is well known that the higher relative density Dr is, the larger strength and stiffness of soil becomes in the world. But Ishihara and Watanabe (1972) took up the position that volume decrease potential eVDP is more important than relative density Dr when dynamic characteristics of soil is estimated. Figure 3(b) shows to explain the necessity of volume decrease potential eVDP with contrast two soils those have same relative density and void ratio. In figure 3(b) it can be easily understood the definition of the volume decrease potential eVDP. Ishihara and Watanabe (1972) insisted that even though soils have same relative density Dr, soil behaviors of them will not become similar each other because it is determined by volume decrease potential eVDP not relative density Dr. In this study the concept of volume decrease potential eVDP used to estimate through contrasting characteristics of strength and stiffness on non-plastic silt with other plastic and non-plastic soils.

emax emine
VDPeminmax
max
eeeeDr −
−=
emax emine
VDPeminmax
max
eeeeDr −
−=
Aemax,
SandA :Aemin,e%75=rD
Bemax, Bemin,e
%75=rDSandB :
AVDPe ,
BVDPe ,
Aemax,Aemax,
SandA :Aemin, Aemin,e%75=rD %75=rD %75=rD
Bemax,Bemax, Bemin,Bemin,e
%75=rD %75=rD %75=rDSandB :
AVDPe ,
BVDPe ,
(a) Definition of Volume Decrease Potential (b) Comparison of two sands using eVDP
Figure 3. Definition of Volume Decrease Potential Soil test conditions Table 3 shows cyclic DSST conditions. The vertical pressure confined until 98 kPa or 196 kPa with velocity of 196 kPa/hr. Cyclic loading under stress control applied until 50 maximum number of cycle with sinusoid of 0.1 Hz. In addition, DSST performed until shear strain of ±20% (Song, 2003; Song et al., 2004 (a), (b)).
Definition of words Figure 4 explains definition of words in this study. Figure 4(a) explains peak shear strain γp, double amplitude of shear strain γDA, and number of cycle Nc (JGS, 2000). In figure 4(a) ratio on number of cycle NcR is determined as eq. (2).
t (sec)
γ(%
)
Ni
γ (N
i)
( )iNDAp γγγ ==
( )
( ) ( )i
NN
Nc NN
ii
i +×−
−=
+
5.05.0 γγγγ
γ (N
i+0.
5)
γ (N
i+1)
Ni+1
Ni+0.5
t (sec)
γ(%
)
Ni
γ (N
i)
( )iNDAp γγγ ==
( )
( ) ( )i
NN
Nc NN
ii
i +×−
−=
+
5.05.0 γγγγ
γ (N
i+0.
5)
γ (N
i+1)
Ni+1
Ni+0.5
(a) peak shear strain
γ
τ
1Geq
minγ maxγ
maxτ
minτ
minmax
minmax
γγττ
−−
=eqG
22minmax DA
SAγγγγ =
−=
γ
τ
1Geq
minγ minγ maxγ maxγ
maxτ maxτ
minτ minτ
minmax
minmax
γγττ
−−
=eqG
22minmax DA
SAγγγγ =
−=
0.0
1.0
0 25 50
Number of cycle Nc
0.5
Nc(Γ=0.5)
1
0.0
1.0
0 25 50
0.51
Nc(Γ=0.5)
Γ(Nc=25)
Nor
mal
ized
equ
ival
ent s
tiffn
ess Γ
RDΓ50
RDΓ50
0.0
1.0
0 25 50
Number of cycle Nc
0.5
Nc(Γ=0.5)
1
0.0
1.0
0 25 50
0.51
Nc(Γ=0.5)
Γ(Nc=25)
Nor
mal
ized
equ
ival
ent s
tiffn
ess Γ
RDΓ50
RDΓ50
( ) ( ) 15.0
11
5.05.0
5.050 −
=−
Γ−=Γ
ΓΓ cc NNDR ( )( )05.050 ≤Γ =cN
( )
( )
( )
1251
11 25
25
2550 −
Γ−=
−
Γ−=Γ == cc N
c
N
NDR ( )( )05.050 >Γ =cN
(b) equivalent stiffness ratio (c) Decrement of normalized equivalent stiffness Figure 4. Definitions of word
Table 3. Cyclic DSST conditions
KM Clay / DL Silt / Hitachi Sand / Kobe Sand
Velocity of vertical consolidation pressure 196 kPa/hr
Input wave 0.1 Hz Sinusoid
Maximum number of cycle 50
Control method Stress control
Maximum shear strain ±20%

( ) ( )%1% cxcc NNRN = (2) where Nc(x%) is 1, 2, 5, 7.5, 10% shear strain, respectively, and Nc(1%) is 1% shear strain. Figure 4(b) clarifies the meaning of equivalent stiffness ratio Geq is well known. Since the cyclic loading could not apply under the same confining pressure, equivalent stiffness Geq could not directly compared with each others. Therefore, it is necessary for equivalent stiffness Geq to normalize to compare stiffness decreasing tendency of four soils as eq. (3).
( )1==ΓcNeqeq GG (3)
The decrement of normalized equivalent stiffness DRΓ50 expresses the decreasing tendency of the normalized equivalent stiffness Γ with increasing number of cycle Nc in figure 4(c). The decrement of normalized equivalent stiffness DRΓ50 decided as the slope between the first normalized equivalent stiffness Γ(1) and its half. If the normalized equivalent stiffness did not reduced until its half, the slope between the normalized equivalent stiffness Γ at the 25th number of cycle and the first number of cycle was calculated as figure 4(c). In the mean time excess pore water pressures under different confining pressures could not be also contrasted each others. Therefore, ratio of excess pore water pressure (RPP) came out as eq. (4).
'vcuRPP σΔ= (4)
In this study cyclic stress ratio R also need to explain cyclic test results, but it came from cyclic triaxial test not DSST. Thereupon cyclic shear stress ratio (CSSR) RDSS under cyclic DSST is defined as eq. (5).
'vccyDSSR στ= (5)
A concept of the normalized cyclic shear stress ratio NRDSS is adapted to draw a comparison of strength about four soils as eq. (6).
( ) ( )%1%10 ===pp DSSDSSDSS RRNR γγ (6)
CYCLIC STRENGTH AND STIFFNESS OF NON-PLASTIC SITL The characteristics of cyclic strength and stiffness for non-plastic silt were researched by the cyclic DSST, and those were compared with those of sand, weathered soil, and clay. The definition of volume decrease potential eVDP applied to contrast non-plastic silt with other three soils. Time histories with Shear strain and excess pore water pressure Figure 5 shows a result of DSST for four soils. Cyclic load under cyclic shear stress ratio RDSS of about 0.1 applied specimens to coming about excess pore water pressure until number of cycles of 50. In figure 5 shear strain of Hitachi Sand increases gradually with an increase in number of cyclic stress, but that of Kobe Sand took place immediately. The reason might depend on amount of fines in the soils. Hitachi Sand has more fines than Kobe Sand (figure 2) and it has saturated with water before DSST. Therefore, shear strain of Hitachi Sand must take place harder than that of Kobe Sand. Shear strain of KM Clay showed few shear strain until maximum number of cycles. On the other hand, DL Silt showed interesting result that shear strain came about suddenly during cyclic stress, and it is the fastest among them.

25
0
-25-20 -10 0 10 20
τ t,c
y(k
Pa)
γ (%)
25
0
-250 50 100
τ t,c
y(k
Pa)
σ’v (kPa)
100
50
0
RPP
(kPa
)
t (sec)0 250 500
RPP = 95%25
0
-25-20 -10 0 10 20
τ t,c
y(k
Pa)
γ (%)
25
0
-250 50 100
τ t,c
y(k
Pa)
σ’v (kPa)
100
50
0
RPP
(kPa
)
t (sec)0 250 500
25
0
-25-20 -10 0 10 20
τ t,c
y(k
Pa)
γ (%)
25
0
-250 50 100
τ t,c
y(k
Pa)
σ’v (kPa)
100
50
0
RPP
(kPa
)
t (sec)0 250 500
RPP = 95%
(a) KM Clay (RDSS = 0.1)
RPP = 95%25
0
-25-20 -10 0 10 20
τ t,c
y(k
Pa)
γ (%)
25
0
-250 50 100
τ t,c
y(k
Pa)
σ’v (kPa)
100
50
0
RPP
(kPa
)
t (sec)0 250 500
RPP = 95%RPP = 95%25
0
-25-20 -10 0 10 20
τ t,c
y(k
Pa)
γ (%)
25
0
-250 50 100
τ t,c
y(k
Pa)
σ’v (kPa)
100
50
0
RPP
(kPa
)
t (sec)0 250 500
25
0
-25-20 -10 0 10 20
τ t,c
y(k
Pa)
γ (%)
25
0
-250 50 100
τ t,c
y(k
Pa)
σ’v (kPa)
100
50
0
RPP
(kPa
)
t (sec)0 250 500
(b) DL Silt (RDSS = 0.097)
RPP = 95%25
0
-25-20 -10 0 10 20
τ t,c
y(k
Pa)
γ (%)
25
0
-250 50 100
τ t,c
y(k
Pa)
σ’v (kPa)
100
50
0
RPP
(kPa
)
t (sec)0 250 500
RPP = 95%25
0
-25-20 -10 0 10 20
τ t,c
y(k
Pa)
γ (%)
25
0
-250 50 100
τ t,c
y(k
Pa)
σ’v (kPa)
100
50
0
RPP
(kPa
)
t (sec)0 250 500
25
0
-25-20 -10 0 10 20
τ t,c
y(k
Pa)
γ (%)
25
0
-250 50 100
τ t,c
y(k
Pa)
σ’v (kPa)
100
50
0
RPP
(kPa
)
t (sec)0 250 500
(c) Hitachi Sand (RDSS = 0.1)
25
0
-25-20 -10 0 10 20
τ t,c
y(k
Pa)
γ (%)
25
0
-250 50 100
τ t,c
y(k
Pa)
σ’v (kPa)
100
50
0
RPP
(kPa
)
t (sec)0 250 500
RPP = 95%25
0
-25-20 -10 0 10 20
τ t,c
y(k
Pa)
γ (%)
25
0
-250 50 100
τ t,c
y(k
Pa)
σ’v (kPa)
100
50
0
RPP
(kPa
)
t (sec)0 250 500
25
0
-25-20 -10 0 10 20
τ t,c
y(k
Pa)
γ (%)
25
0
-250 50 100
τ t,c
y(k
Pa)
σ’v (kPa)
100
50
0
RPP
(kPa
)
t (sec)0 250 500
RPP = 95%
(d) Kobe Sand (RDSS = 0.097)
Figure 5. Results fro cyclic DSST ( : start point, : end point) Excess pore water pressure RPP for Hitachi Sand and Kobe Sand originated about 95%. And that for DL Silt also rapidly took place about 95% at six times of cyclic stress, but shear strain of DL Silt did not occur largely close to RPP of 95%. Meanwhile, KM Clay of plastic soil showed excess pore water pressure of about 20% until number of cycles of 50 times. Cyclic strength Figure 6 shows decrement of cyclic shear stress ratio RDSS with increasing number of cycle Nc for four soils. The peak shear strain γp for DL Silt happened rapidly with an increment in number of cycles Nc in figure 6. The peak shear strains γp of Hitachi Sand and Kobe Sand revealed time interval until peak shear strain γp of 5% but both arise immediately till peak shear stain γp.of 10%. But it was hard for KM Clay to originate shear strain until peak shear strain γp of 10% as for other soils.

0.00
0.10
0.20
0.30
0.1 1 10 100 1000Number of cycle Nc
CSS
R R
DSS γp = 1%
γp = 2%γp = 5%γp = 7.5%γp = 10%
0.00
0.10
0.20
0.30
0.1 1 10 100 1000Number of cycle Nc
CSS
R R
DSS
0.00
0.10
0.20
0.30
0.1 1 10 100 1000Number of cycle Nc
CSS
R R
DSS γp = 1%
γp = 2%γp = 5%γp = 7.5%γp = 10%
γp = 1%γp = 2%γp = 5%γp = 7.5%γp = 10%
0.00
0.10
0.20
0.30
0.1 1 10 100 1000Number of cycle Nc
CSS
R R
DSS
γp = 1%γp = 2%γp = 5%γp = 7.5%γp = 10%NPP = 0.95
0.00
0.10
0.20
0.30
0.1 1 10 100 1000Number of cycle Nc
CSS
R R
DSS
0.00
0.10
0.20
0.30
0.1 1 10 100 1000Number of cycle Nc
CSS
R R
DSS
γp = 1%γp = 2%γp = 5%γp = 7.5%γp = 10%NPP = 0.95
γp = 1%γp = 2%γp = 5%γp = 7.5%γp = 10%NPP = 0.95
(a) KM Clay (RDSS = 0.1) (b) DL Silt (RDSS = 0.097)
0.00
0.10
0.20
0.30
0.1 1 10 100 1000Number of cycle Nc
CSS
R R
DSS
γp = 1%γp = 2%γp = 5%γp = 7.5%γp = 10%NPP = 0.95
0.00
0.10
0.20
0.30
0.1 1 10 100 1000Number of cycle Nc
CSS
R R
DSS
0.00
0.10
0.20
0.30
0.1 1 10 100 1000Number of cycle Nc
CSS
R R
DSS
γp = 1%γp = 2%γp = 5%γp = 7.5%γp = 10%NPP = 0.95
γp = 1%γp = 2%γp = 5%γp = 7.5%γp = 10%NPP = 0.95
0.00
0.10
0.20
0.30
0.1 1 10 100 1000Number of cycle Nc
CSS
R R
DSS
γp = 1%γp = 2%γp = 5%γp = 7.5%γp = 10%NPP = 0.95
0.00
0.10
0.20
0.30
0.1 1 10 100 1000Number of cycle Nc
CSS
R R
DSS
0.00
0.10
0.20
0.30
0.1 1 10 100 1000Number of cycle Nc
CSS
R R
DSS
γp = 1%γp = 2%γp = 5%γp = 7.5%γp = 10%NPP = 0.95
γp = 1%γp = 2%γp = 5%γp = 7.5%γp = 10%NPP = 0.95
(c) Hitachi Sand (RDSS = 0.1) (d) Kobe Sand (RDSS = 0.097)
Figure 6. Relation between cyclic shear stress ratio and number of cycle
0.0
0.5
1.0
1.5
2.0
2.5
DL Silt
Hitachi SandKobe Sand Sirasu
Glass beads
Soil types
Max
imum
and
min
imum
void
ratio
em
ax, e
min
emaxeminemax-emin
0.0
0.5
1.0
1.5
2.0
2.5
DL Silt
Hitachi SandKobe Sand Sirasu
Glass beads
Soil types
Max
imum
and
min
imum
void
ratio
em
ax, e
min
emaxeminemax-emin
emaxemaxemineminemax-eminemax-emin
1.0
1.1
1.2
1.3
1.4
1.5
1.6
1 10
KM ClayDL SiltHitachi SandKobe Sand
Peak Shear Strain γp (%)
Rat
io o
n nu
mbe
r of c
ycle
NcR
2 3 4 5 6 7 8 9
RDSS = 0.1
1.0
1.1
1.2
1.3
1.4
1.5
1.6
1 10
KM ClayDL SiltHitachi SandKobe Sand
KM ClayDL SiltHitachi SandKobe Sand
Peak Shear Strain γp (%)
Rat
io o
n nu
mbe
r of c
ycle
NcR
2 3 4 5 6 7 8 9
RDSS = 0.1
Figure 7. Comparison of maximum and minimumvoid ratio for soils
Figure 8. Relation between Nc and γp
Figure 7 shows maximum and minim void ratio emax, emin for some soils. Sirasu is an white sand at Kagoshima, Japan. And it is very famous soil in the western Japan. Sirasu is sediment of weathered pyroclastic rock. It breaks easily and has porous soil. It is easy for Sirasu to bring about slope failure according to earthquake or heavy rain (JGS, 2000). In figure 7 since DL Silt shows large difference between maximum and minimum void ratio emax, emin as Sirasu, cyclic degradation in strength and stiffness of DL Silt must be markedly. On the other hand, cyclic softening of Kobe Sand will be smaller than that of DL Silt because Kobe Sand shows a small difference of void ratio in figure 7. In figure 8 the ratio on number of cycle NcR increased with an increase in peak shear strain γp. Figure 8 indicates which one takes place rapidly the peak shear strain of 10% within four soils under cyclic shear stress ratio RDSS of about 0.1 from figure 6. The ratio on number of cycle NcR presented in eq.(2). In figure 8 DL Silt shows up that large shear strain comes rapidly out with increment of number of cycle Nc. On the contrary KM Clay shows to be harder to take place large shear strain than other soils. From figure 8 the ratio on number of cycle NcR increases with an increase in peak shear strain γp and it exhibits almost straightly except Hitachi Sand.
1.0
1.1
1.2
1.3
1.4
-0.4 -0.2 0 0.2 0.4Volume Decrease Potential eVDP
Nor
mal
ized
cyc
lic sh
ear s
tress
NR
DSS
Nc = 5, γp = 10%
DL Silt(Dr = 70%)
Hitachi Sand(Dr = 96%)
Kobe Sand(Dr = 59%)
KM Clay(Dr = non)
1.0
1.1
1.2
1.3
1.4
-0.4 -0.2 0 0.2 0.4Volume Decrease Potential eVDP
Nor
mal
ized
cyc
lic sh
ear s
tress
NR
DSS
Nc = 5, γp = 10%
DL Silt(Dr = 70%)
Hitachi Sand(Dr = 96%)
Kobe Sand(Dr = 59%)
KM Clay(Dr = non)
0
10
20
30
40
50
60
70
-0.3 -0.2 -0.1 0 0.1 0.2 0.3Volume decrease potential eVDP
Num
ber o
f cyc
le N
c
KM Clay (0.2)
Kobe Sand (0.97)
Hitachi Sand (0.93)
DL Silt (0.94): ( ) : RPP
Estimated
0
10
20
30
40
50
60
70
-0.3 -0.2 -0.1 0 0.1 0.2 0.3Volume decrease potential eVDP
Num
ber o
f cyc
le N
c
KM Clay (0.2)
Kobe Sand (0.97)
Hitachi Sand (0.93)
DL Silt (0.94): ( ) : RPP
Estimated: ( ) : RPP
Estimated
Figure 9. Relation between NRDSS and eVDP
Figure 10. Relation between Nc and eVD
(eVDP for KM Clay supposed in figure 8)
KM ClayDL SiltHitachi SandKobe Sand
Number of cycle Nc
CSS
R R
DSS
0.01
0.10
0.30
1 10 100
(γp = 10%) (Γ≒ 0)KM ClayDL SiltHitachi SandKobe Sand
IncreasingeVDP
KM ClayDL SiltHitachi SandKobe Sand
Number of cycle Nc
CSS
R R
DSS
0.01
0.10
0.30
1 10 100
(γp = 10%) (Γ≒ 0)KM ClayDL SiltHitachi SandKobe Sand
IncreasingeVDP
0.01
0.10
0.40
1 10 100Number of cycle Nc
Cyc
lic sh
ear s
tress
ratio
RD
SS γp=7.5%
KM Clay (ρsat = 1.98 g/cm3)DL Silt (ρsat = 1.85 g/cm3)Hitachi Sand (ρsat = 1.86 g/cm3)Kobe Sand (ρsat = 1.98 g/cm3)Toyoura Sand (ρsat = 1.93 g/cm3) Luzon (Sand, ρsat = 1.95 g/cm3)Loma Prieta (Sand, ρd = 1.52 g/cm3)
0.01
0.10
0.40
1 10 100Number of cycle Nc
Cyc
lic sh
ear s
tress
ratio
RD
SS γp=7.5%
KM Clay (ρsat = 1.98 g/cm3)DL Silt (ρsat = 1.85 g/cm3)Hitachi Sand (ρsat = 1.86 g/cm3)Kobe Sand (ρsat = 1.98 g/cm3)Toyoura Sand (ρsat = 1.93 g/cm3) Luzon (Sand, ρsat = 1.95 g/cm3)Loma Prieta (Sand, ρd = 1.52 g/cm3)
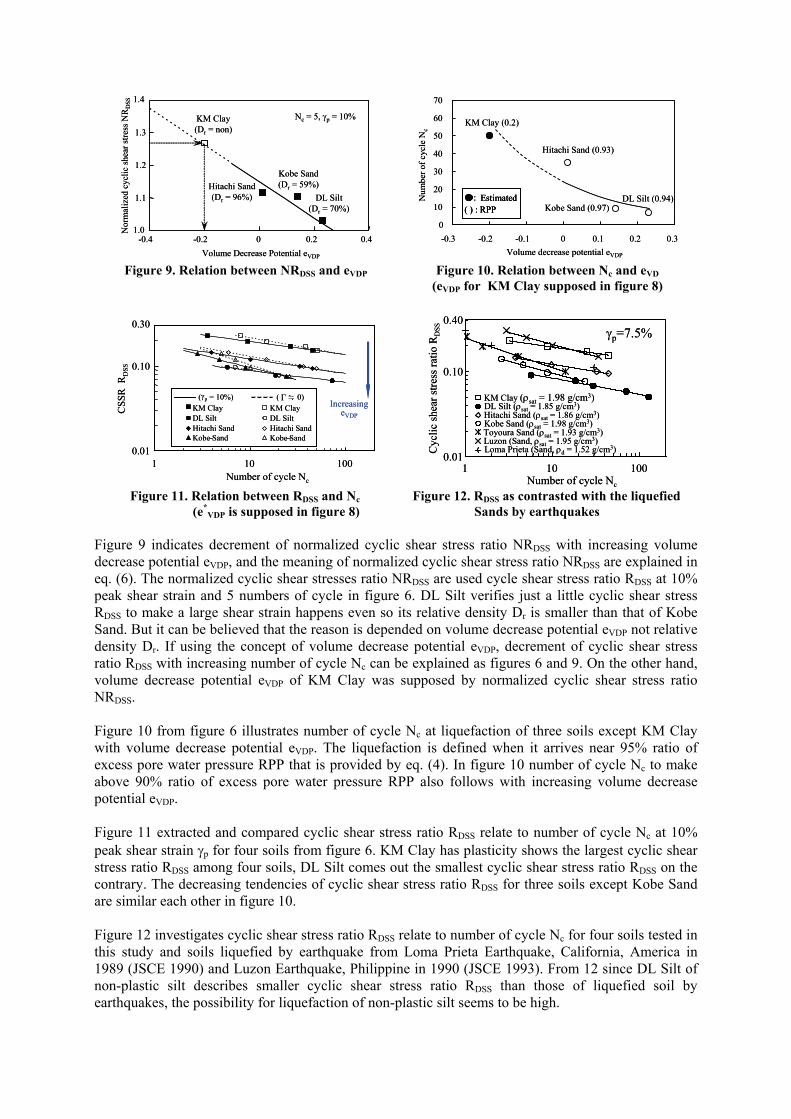
Figure 11. Relation between RDSS and Nc
(e*VDP is supposed in figure 8)
Figure 12. RDSS as contrasted with the liquefied Sands by earthquakes
Figure 9 indicates decrement of normalized cyclic shear stress ratio NRDSS with increasing volume decrease potential eVDP, and the meaning of normalized cyclic shear stress ratio NRDSS are explained in eq. (6). The normalized cyclic shear stresses ratio NRDSS are used cycle shear stress ratio RDSS at 10% peak shear strain and 5 numbers of cycle in figure 6. DL Silt verifies just a little cyclic shear stress RDSS to make a large shear strain happens even so its relative density Dr is smaller than that of Kobe Sand. But it can be believed that the reason is depended on volume decrease potential eVDP not relative density Dr. If using the concept of volume decrease potential eVDP, decrement of cyclic shear stress ratio RDSS with increasing number of cycle Nc can be explained as figures 6 and 9. On the other hand, volume decrease potential eVDP of KM Clay was supposed by normalized cyclic shear stress ratio NRDSS. Figure 10 from figure 6 illustrates number of cycle Nc at liquefaction of three soils except KM Clay with volume decrease potential eVDP. The liquefaction is defined when it arrives near 95% ratio of excess pore water pressure RPP that is provided by eq. (4). In figure 10 number of cycle Nc to make above 90% ratio of excess pore water pressure RPP also follows with increasing volume decrease potential eVDP. Figure 11 extracted and compared cyclic shear stress ratio RDSS relate to number of cycle Nc at 10% peak shear strain γp for four soils from figure 6. KM Clay has plasticity shows the largest cyclic shear stress ratio RDSS among four soils, DL Silt comes out the smallest cyclic shear stress ratio RDSS on the contrary. The decreasing tendencies of cyclic shear stress ratio RDSS for three soils except Kobe Sand are similar each other in figure 10. Figure 12 investigates cyclic shear stress ratio RDSS relate to number of cycle Nc for four soils tested in this study and soils liquefied by earthquake from Loma Prieta Earthquake, California, America in 1989 (JSCE 1990) and Luzon Earthquake, Philippine in 1990 (JSCE 1993). From 12 since DL Silt of non-plastic silt describes smaller cyclic shear stress ratio RDSS than those of liquefied soil by earthquakes, the possibility for liquefaction of non-plastic silt seems to be high.

0.0
0.2
0.4
0.6
0.8
1.0
0 10 20 30 40 50
RDSS ≒ 0.1
Number of cycle Nc
Γ KM ClayDL SiltHitachi SandKobe Sand
(-0.2)(0.23)(0.01)(0.14)
eVDP
0.0
0.2
0.4
0.6
0.8
1.0
0 10 20 30 40 50
RDSS ≒ 0.1
Number of cycle Nc
Γ KM ClayDL SiltHitachi SandKobe Sand
(-0.2)(0.23)(0.01)(0.14)
eVDPKM ClayDL SiltHitachi SandKobe Sand
(-0.2)(0.23)(0.01)(0.14)
eVDP
0
20
40
60
80
100
0.001 0.01 0.1 1 10Particle size (mm)
Perc
enta
ge P
assi
ng (
%)
SpecimenAfter consolidationAfter cyclic test
0
20
40
60
80
100
0.001 0.01 0.1 1 10Particle size (mm)
Perc
enta
ge P
assi
ng (
%)
SpecimenAfter consolidationAfter cyclic test
SpecimenSpecimenAfter consolidationAfter consolidationAfter cyclic testAfter cyclic test
Figure 13. Normalized equivalent stiffness Figure 14. Particle size distribution chart
0.0
0.2
0.4
0.6
0.8
1.0
0 10 20 30 40 50
0.10.1530.1710.1970.228
RDSS
Number of cycle Nc
Nor
mal
ized
equ
ival
ent s
tiffn
ess
Γ
0.0
0.2
0.4
0.6
0.8
1.0
0 10 20 30 40 50
0.10.1530.1710.1970.228
RDSS
Number of cycle Nc
Nor
mal
ized
equ
ival
ent s
tiffn
ess
Γ
0.0
0.2
0.4
0.6
0.8
1.0
0 10 20 30 40 50
0.0470.0610.0730.097
RDSS
Nor
mal
ized
equ
ival
ent s
tiffn
ess
Γ
Number of cycle Nc
0.0
0.2
0.4
0.6
0.8
1.0
0 10 20 30 40 50
0.0470.0610.0730.097
RDSS
Nor
mal
ized
equ
ival
ent s
tiffn
ess
Γ
Number of cycle Nc
(a) KM Clay (b) DL Silt
0.0
0.2
0.4
0.6
0.8
1.0
0 10 20 30 40 50
0.0940.1000.1190.146
RDSS
Nor
mal
ized
equ
ival
ent s
tiffn
ess
Γ
Number of cycle Nc
0.0
0.2
0.4
0.6
0.8
1.0
0 10 20 30 40 50
0.0940.1000.1190.146
RDSS
Nor
mal
ized
equ
ival
ent s
tiffn
ess
Γ
Number of cycle Nc
0.0
0.2
0.4
0.6
0.8
1.0
0 10 20 30 40 50
0.0760.0970.1190.14
RDSS
Nor
mal
ized
equ
ival
ent s
tiffn
ess
Γ
Number of cycle Nc
0.0
0.2
0.4
0.6
0.8
1.0
0 10 20 30 40 50
0.0760.0970.1190.14
RDSS
Nor
mal
ized
equ
ival
ent s
tiffn
ess
Γ
Number of cycle Nc
(c) Hitachi Sand (d) Kobe Sand
Figure 15. Influence of RDSS against decrement of equivalent stiffness
Cyclic stiffness For investigating decrement of equivalent stiffness Geq with increasing number of cycle Nc four soils under the condition of about 0.1 cyclic shear stress ratio RDSS are contrasted. Since the confining stress did not pressured on specimens of four soils, it was impossible to compare immediately decreasing equivalent stiffness Geq. Thereupon, to recognize tendency against decrement of equivalent stiffness Geq on soils the equivalent stiffness Geq is normalized by the first effective vertical stress Geq(Nc=1) as figure 13. The definition of the normalized equivalent stiffness Γ is shown in eq. (3). DL Silt and Kobe Sand bare radical decrement of stiffness in figure 13. Because DL Silt has a large difference between maximum void ratio emax and minimum void ratio emin (Table 1), it can be estimated that soil particle are rearranged by cyclic stress (Song et al., 2004(b)). And Masado (weathered soil) as Kobe Sand has special characteristics those are collapse phenomenon and fragmentation becomes generally known in Japan (Fukuda, 1978). Fukuda (1978) made public that Masado (weather soil) had high strength and stiffness under dry condition, but its soil structure can be easily collapsed with containing water, and it is collapse phenomenon.

In addition, since Masado has nature that easily crushed by shock, particle size distribution charts are drawn after making specimen, after confining pressure, and after cyclic DSST. Figure 14 shows the particle size distribution charts of every soil test step. It can be known that not fragmentation but collapse of Kobe Sand has an effect to degradation in stiffness in figure 13. Figure 15 shows decrement of normalized equivalent stiffness Γ with increment of number of cycle Nc under some different cyclic shear stress ratio RDSS for four soils. Black circle ( ) means the results tested for four soils under about 0.1 cyclic shear stress ratio RDSS. Though stiffness of KM Clay diminishes a little under 0.1 cyclic shear stress ratio RDSS, stiffness dwindles abruptly away with increasing number of cycle above 0.1 cyclic shear stress ratio RDSS. Hitachi Sand shows similar pattern as KM Clay. Both DL Silt and Kobe Sand are analogous to decreasing stiffness pattern and to proving that it happens fast. Figure 16 contrasts velocity of decreasing stiffness among the soils. The definition on decrement of normalized equivalent stiffness RDΓ50 is used to compare it as shown in figure 4(c). Stiffness of DL Silt has the largest volume decrease potential eVDP among four soils drops down. Decreasing velocity of stiffness with increasing cyclic shear stress ratio RDSS for four soils reveals in figure 17. Even decrements of normalized equivalent stiffness RDΓ50 for four soils were predicted as straight line under small cyclic shear stress ratio RDSS, all of soils exhibits sudden stiffness decrement with increasing cyclic shear stress ratio RDSS. Figure 17 shows that characteristics on stiffness decrement of soil with increasing cyclic stress are similar with relation static stress and strain whether a soil has plasticity or not. In addition, the stiffness of soil reduces quickly with increasing volume decrease potential eVDP.
0.00
0.05
0.10
0.15
-0.3 -0.2 -0.1 0 0.1 0.2 0.3Volume Decrease Potential eVDP
Dec
rem
ent o
f nor
mal
ized
equi
vale
nt st
iffne
ss R
DΓ 5
0
KM ClayDL SiltHitachi SandKobe Sand
0.00
0.05
0.10
0.15
-0.3 -0.2 -0.1 0 0.1 0.2 0.3Volume Decrease Potential eVDP
Dec
rem
ent o
f nor
mal
ized
equi
vale
nt st
iffne
ss R
DΓ 5
0
KM ClayDL SiltHitachi SandKobe Sand
KM ClayDL SiltHitachi SandKobe Sand
KM ClayDL SiltHitachi SandKobe Sand
0.00
0.05
0.10
0.15
0.20
0.25
0.30
0.35
0.01 0.1 1
Increasing eVDP
Cyclic Shear stress Ratio RDSS
Dec
rem
ent o
f nor
mal
ized
equi
vale
nt st
iffne
ss R
DΓ 50
eVDP= 0.23
eVDP= 0.14
eVDP= 0.01
e*VDP= -0.2
KM ClayDL SiltHitachi SandKobe Sand
KM ClayDL SiltHitachi SandKobe Sand
0.00
0.05
0.10
0.15
0.20
0.25
0.30
0.35
0.01 0.1 1
Increasing eVDP
Cyclic Shear stress Ratio RDSS
Dec
rem
ent o
f nor
mal
ized
equi
vale
nt st
iffne
ss R
DΓ 50
eVDP= 0.23
eVDP= 0.14
eVDP= 0.01
e*VDP= -0.2
Figure 16. Decrement of normalized equivalent Stiffness to volume decrease potential
Figure 17. Decrement of normalized equivalent Stiffness to cyclic stress ratio
0.01
0.10
0.40
1 10 100Number of cycle Nc
CSS
R R
DSS
γp=7.5%
KM Clay (ρsat = 1.98 g/cm3)DL Silt (ρsat = 1.85 g/cm3)Hitachi Sand (ρsat = 1.86 g/cm3)Kobe Sand (ρsat = 1.98 g/cm3)Toyoura Sand (ρsat = 1.93 g/cm3) Luzon (Sand, ρsat = 1.95 g/cm3)Loma Prieta (Sand, ρd = 1.52 g/cm3)
0.01
0.10
0.40
1 10 100Number of cycle Nc
CSS
R R
DSS
γp=7.5%
KM Clay (ρsat = 1.98 g/cm3)DL Silt (ρsat = 1.85 g/cm3)Hitachi Sand (ρsat = 1.86 g/cm3)Kobe Sand (ρsat = 1.98 g/cm3)Toyoura Sand (ρsat = 1.93 g/cm3) Luzon (Sand, ρsat = 1.95 g/cm3)Loma Prieta (Sand, ρd = 1.52 g/cm3)
0.00
0.05
0.10
0.15
0.20
-0.2 -0.1 0 0.1 0.2 0.3Volume Decrease potential eVDP
Cyc
lic sh
ear s
tress
ratio
RD
SS
Γ≒ 0γp =10%
KM Clay
Hitachi Sand
Kobe Sand
DL Silt
Assumption
0.00
0.05
0.10
0.15
0.20
-0.2 -0.1 0 0.1 0.2 0.3Volume Decrease potential eVDP
Cyc
lic sh
ear s
tress
ratio
RD
SS
Γ≒ 0γp =10%Γ≒ 0γp =10%
KM Clay
Hitachi Sand
Kobe Sand
DL Silt
Assumption
Figure 18. RDSS-Nc at γp =10% and Γ≒0
Figure 19. liquefaction strength at γp =10% and Γ≒0

Figure 18 plots relation between cyclic shear stress ratio RDSS and number of cycle Nc at the normalized equivalent stiffness Γ is closed to zero, and compares that at 10% peak shear strain γp form figure 11. All of soils show that 10% peak shear strain γp prior to stiffness fade occurs. From figure 18 the larger volume decrease potential eVDP is, the more the stiffness is near zero after 10% peak shear strain γp. Figure 19 shows liquefaction strength RDSS20 at 20 number of cycle Nc from figure 18. Surely liquefaction strength drops down with increment of volume decrease potential eVDP. And the occurring difference between 10% peak shear strain γp and when stiffness Γ is closed to zero can simply be understood.
CONCLUSION This study focused on clarifying that the cyclic degradation in strength and stiffness of non-plastic silt. Clay, sand, weathered soils are employed to help to comprehend characteristics of non-plastic silt. The apparatus of Direct Simple Shear Test (DSST) of NGI-type has been in Ibaraki University was used to investigate it. The used soils are DL Clayey Silt (called DL Silt; non-plastic silt), Keuper Marl Silty Clay (called KM Clay; clay), Hitachi Sand (sand), and Kobe Sand (weathered soil). But it was very hard to compare results of DSST directly because any soil had been not experimented under identical testing conditions. Therefore, there is no choice except normalizing to compare test results as strength and stiffness. Shear strain of Non-plastic silt took place rapidly within a few number of cyclic stress and excess pore water pressure was immediately generated, too. The weathered soil shows also characteristic that is similar to behavior of non-plastic silt. But it was slower than that of non-plastic silt even though relative density of weathered soil is smaller than that of non-plastic silt. Meanwhile cyclic degradation in strength and stiffness of clay and sand happened slowly with increasing number of cyclic stress. In the relation between cyclic shear stress ratio and number of cycle, a peak shear strain of non-plastic silt took place until 10% of shear strain at once unlike other soils. And cyclic shear stress ratio RDSS of non-plastic silt to number of cycle Nc is the smallest among clay, weathered soil, and sands tested and liquefied by earthquakes. It is considered that volume decrease potential eVDP not relative density Dr is mainly reasonable for the fastest decreasing strength with increasing number of cyclic stress. Besides, it can be known that is not fragmentation but collapse of Kobe Sand has an effect to degradation in stiffness through investigating particle size distribution charts of every DSST step. For four soils equivalent stiffness Geq per each cycle were investigated to know deceasing tendency of stiffness and it was normalized to compare with other soils. Cyclic softening of Non-plastic silt and weathered soil with increasing number of cycle occurred quickly. From the DSST it is acquired that decreasing velocity of stiffness is depend on volume decease potential, and all of four soils have yielding point to show rapid stiffness decrement with increasing cyclic shear stress ratio RDSS. Through making a comparative investigation it was recognized that all of soils show that 10% of peak shear strain γp prior to stiffness fade occurs. The larger volume decrease potential eVDP is, the more the stiffness is near zero after 10% of peak shear strain γp. Liquefaction strength RDSS20 at 20 of number of cycle Nc dropped down with increment of volume decrease potential eVDP. From the mentioned above, it is known that liquefaction feasibility of non-plastic silt is very high based on terms of the volume decrease potential, and cyclic degradation in strength and stiffness of soils relys on volume decrease potential not relative density.

AKNOWLDGEMENTS
The authors would like to thank the Japan Society for the Promotion of Science (JSPS) for their support of this work.
REFERENCES Boulanger, M. W., Meyers, L., H., Mejia, L., H. and Idriss, I. M., Behavior of a fine-grained soil
during the Loma Prieta Earthquake, Canadian Geotechnical Journal, Vol. 35, No. 1, pp. 146-158, 1998.
Seismic Engineering Committee of JSCE, Report on earthquake damage according to 1989 Loma Prieta Earthquake, Journal of JSCE, No. 424, Vol. III-14, pp.19-68, 1990 (in Japanese).
Hamada, M., Isoyama, R., and Wakamatsu, K., Liquefaction-induced ground displacement and its related damage to lifeline facilities, Special Issue of Soils and Foundations, pp. 81-97, 1996.
Holzer, T. L., Bennett, M., J., Ponti, D. J., and Tinsley, J., Liquefaction and Soil Failure During 1994 Northridge Earthquake, Journal of Geotechnical and Geoenvironmental Engineering, Vol. 125, No. 6, pp. 438-452, 1999.
Fukuda, M. Shear resistance of soil under flooding and slope stability analysis - for weathered soil as Masado, Soils and Foundations, Vol. 18, No. 3, pp.75-83, 1978.
Ishihara, K. and Watanabe, T. An influence of grain size and volume decrease potential affect to liquefaction of saturated sand. The 7th Japan National Conference on Soil Mech. and Foundation Eng., Hiroshima, Japan, pp.313-316, 1972 (in Japanese).
JGS, From investigation, design for countermeasure of liquefaction to construction – Soils and Foundations Series to engineer, JGS, 1993 (in Japanese).
JGS, Method and explain for soil test – modification for the 1st version, JGS, 2000 (in Japanese). JGS, Report on Investigation of 2000 Tottoriken-Seibu Earthquake, 2002 (CD-ROM, in Japanese). JSCE, Report on damage according to 1990 Luzon Earthquake, Philippine, 1993 (in Japanese). Song, B. The influence of initial static shear stress on post-cyclic degradation of non-plastic silt, Low
Land Technology International, Vol. 5, No. 1, pp.14-24, 2003. Song, B., Yasuhara, K., and Murakami, S., Direct simple shear testing for post-cyclic degradation in
stiffness on nonplastic silt, Geotechnical testing journal, ASTM, Vol. 27, No. 6, pp. 6071-613, 2004(a).
Song, B., Yasuhara, K., Murakami, S., and Komine, H., An evaluation for cyclic softening on non-plastic silt using the concept of volume decrease potential, Journal of JSCE, No. 764., Vol. III-67, pp.11-24, 2004(b).