Embed Size (px)
Citation preview

4th International Conference on Earthquake Geotechnical Engineering
June 25-28, 2007 Paper No. 1626
EVALUATING LIQUEFACTION POTENTIAL BY SEISMIC DILATOMETER (SDMT) ACCOUNTING FOR AGING/STRESS HISTORY
Paola MONACO 1 and Silvano MARCHETTI 2
ABSTRACT
The seismic dilatometer (SDMT) permits to obtain two parallel independent estimates of liquefaction resistance CRR, one from the horizontal stress index KD and one from the shear wave velocity VS. The use of VS for evaluating CRR is well known. Correlations CRR-KD have been developed in the last two decades, stimulated by the recognized sensitivity of KD to factors which are known to increase liquefaction resistance – stress history, prestraining/aging, cementation, structure – and its correlation to relative density and state parameter. This paper provides further insight into the ability of KD to reflect aging in sands, a factor that recent research has indicated as having a first order of magnitude influence on liquefaction behaviour. In addition, recent SDMT experience has pointed out the high sensitivity of KD to "non-textbook" OCR crusts in NC sands. These findings lend additional support to a well-based CRR-KD correlation.
Keywords: Liquefaction, Aging, Seismic Dilatometer, Horizontal Stress Index, Shear Wave Velocity
INTRODUCTION The seismic dilatometer (SDMT), initially conceived for research, is gradually entering into use in current site investigation practice. SDMT routinely provides, among other measurements, pairs of profiles of two parameters – the horizontal stress index KD and the shear wave velocity VS – that previous experience has indicated as bearing a significant relationship with the liquefaction resistance of sands. Hence SDMT permits to obtain two parallel independent estimates of CRR from KD and VS, using CRR-KD and CRR-VS correlations, where CRR is the cyclic liquefaction resistance – a basic input in the commonly used Seed and Idriss (1971) simplified procedure. The use of VS for liquefaction is well known. Correlations CRR-KD have been developed in the last two decades, stimulated by the recognized sensitivity of KD to a number of factors which are known to increase liquefaction resistance – difficult to sense by other tests – such as stress history, prestraining/aging, cementation, structure, and by KD's relationship with relative density and state parameter. A summary of the available knowledge on the subject and the latest version of the CRR-KD correlation, based on all previous data, can be found in Monaco et al. (2005). Comparisons of CRR values predicted by CRR-KD and CRR-VS correlations were presented by Maugeri and Monaco (2006). This paper provides further insight into the ability of the SDMT, in particular the KD parameter, to reflect aging, stress history and other characteristics that have a major influence on the liquefaction resistance of natural sand deposits, as emphasized by recent research.
THE SEISMIC DILATOMETER (SDMT) The seismic dilatometer (SDMT) is a combination of the standard flat dilatometer (DMT) equipment (Marchetti 1980, TC16 2001) with a seismic module for the down-hole measurement of the shear wave velocity VS. First introduced by Hepton (1988), the SDMT was subsequently improved at Georgia Tech, Atlanta, USA (Martin and Mayne 1997, 1998, Mayne et al. 1999). 1 Assistant Professor, Dept. of Structural Hydraulic and Geotechnical Engineering, University of L'Aquila, Italy, Email: [email protected] 2 Professor, Dept. of Structural Hydraulic and Geotechnical Engineering, University of L'Aquila, Italy

A new "true-interval" SDMT system (Figure 1) has been recently developed in Italy. The seismic module (Figure 1a) is a cylindrical element placed above the DMT blade, equipped with two receivers located at 0.5 m distance. The signal is amplified and digitized at depth. The shear wave source at the surface (Figure 1b) is a pendulum hammer which hits horizontally a steel rectangular base pressed vertically against the soil and oriented with its long axis parallel to the axis of the receivers, so that they can offer the highest sensitivity to the generated shear wave. The "true-interval" two-receiver test configuration avoids possible inaccuracy in the determination of the "zero time" at the hammer impact, sometimes observed in the "pseudo-interval" one-receiver configuration. Moreover, the couple of seismograms recorded by the two receivers at a given test depth (Figure 1b) corresponds to the same hammer blow and not to different blows in sequence, not necessarily identical. Hence the repeatability of VS measurements is considerably improved (observed VS repeatability about 1 m/s). The shear wave velocity VS (Figure 1b) is obtained as the ratio between the difference in distance between the source and the two receivers (S2 - S1) and the delay of the arrival of the impulse from the first to the second receiver (∆t). VS measurements are obtained every 0.5 m of depth. The determination of the delay from the seismograms obtained by SDMT is generally well-conditioned (Figure 1c). VS measurements obtained by SDMT have been validated by comparison with VS obtained by other methods at various test sites. As an example, Figure 2 shows good agreement between the profiles of VS obtained by SDMT and by seismic cone (SCPT), cross-hole and SASW at the site of Fucino (Italy), a well-documented NC clay research test site, extensively investigated at the end of the '80s (AGI 1991).
a) b) c) Figure 1. (a) DMT blade and seismic module. (b) Schematic layout of the seismic dilatometer test. (c)
Example of seismograms obtained by SDMT at various test depths at the site of Fucino, Italy − as recorded and re-phased according to the calculated delay.
Figure 2. Comparison of VS profiles obtained by SDMT and by other in situ seismic tests (AGI
1991) at the research site of Fucino, Italy
AGI (1991)
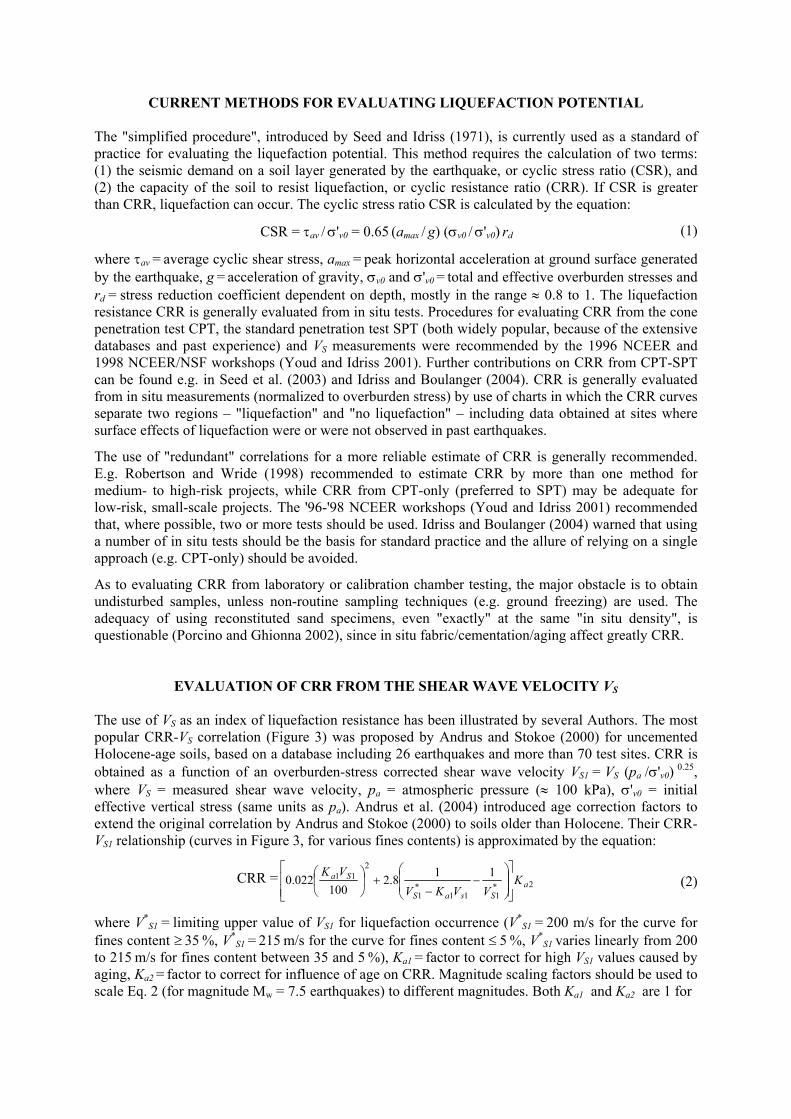
CURRENT METHODS FOR EVALUATING LIQUEFACTION POTENTIAL The "simplified procedure", introduced by Seed and Idriss (1971), is currently used as a standard of practice for evaluating the liquefaction potential. This method requires the calculation of two terms: (1) the seismic demand on a soil layer generated by the earthquake, or cyclic stress ratio (CSR), and (2) the capacity of the soil to resist liquefaction, or cyclic resistance ratio (CRR). If CSR is greater than CRR, liquefaction can occur. The cyclic stress ratio CSR is calculated by the equation:
CSR = τav / σ'v0 = 0.65 (amax / g) (σv0 / σ'v0) rd (1)
where τav = average cyclic shear stress, amax = peak horizontal acceleration at ground surface generated by the earthquake, g = acceleration of gravity, σv0 and σ'v0 = total and effective overburden stresses and rd = stress reduction coefficient dependent on depth, mostly in the range ≈ 0.8 to 1. The liquefaction resistance CRR is generally evaluated from in situ tests. Procedures for evaluating CRR from the cone penetration test CPT, the standard penetration test SPT (both widely popular, because of the extensive databases and past experience) and VS measurements were recommended by the 1996 NCEER and 1998 NCEER/NSF workshops (Youd and Idriss 2001). Further contributions on CRR from CPT-SPT can be found e.g. in Seed et al. (2003) and Idriss and Boulanger (2004). CRR is generally evaluated from in situ measurements (normalized to overburden stress) by use of charts in which the CRR curves separate two regions – "liquefaction" and "no liquefaction" – including data obtained at sites where surface effects of liquefaction were or were not observed in past earthquakes.
The use of "redundant" correlations for a more reliable estimate of CRR is generally recommended. E.g. Robertson and Wride (1998) recommended to estimate CRR by more than one method for medium- to high-risk projects, while CRR from CPT-only (preferred to SPT) may be adequate for low-risk, small-scale projects. The '96-'98 NCEER workshops (Youd and Idriss 2001) recommended that, where possible, two or more tests should be used. Idriss and Boulanger (2004) warned that using a number of in situ tests should be the basis for standard practice and the allure of relying on a single approach (e.g. CPT-only) should be avoided.
As to evaluating CRR from laboratory or calibration chamber testing, the major obstacle is to obtain undisturbed samples, unless non-routine sampling techniques (e.g. ground freezing) are used. The adequacy of using reconstituted sand specimens, even "exactly" at the same "in situ density", is questionable (Porcino and Ghionna 2002), since in situ fabric/cementation/aging affect greatly CRR.
EVALUATION OF CRR FROM THE SHEAR WAVE VELOCITY VS The use of VS as an index of liquefaction resistance has been illustrated by several Authors. The most popular CRR-VS correlation (Figure 3) was proposed by Andrus and Stokoe (2000) for uncemented Holocene-age soils, based on a database including 26 earthquakes and more than 70 test sites. CRR is obtained as a function of an overburden-stress corrected shear wave velocity VS1 = VS (pa /σ'v0) 0.25, where VS = measured shear wave velocity, pa = atmospheric pressure (≈ 100 kPa), σ'v0 = initial effective vertical stress (same units as pa). Andrus et al. (2004) introduced age correction factors to extend the original correlation by Andrus and Stokoe (2000) to soils older than Holocene. Their CRR-VS1 relationship (curves in Figure 3, for various fines contents) is approximated by the equation:
CRR = 2*111
*1
211 118.2
100022.0 a
SsaS
Sa KVVKV
VK
−
−+
(2)
where V*S1 = limiting upper value of VS1 for liquefaction occurrence (V*
S1 = 200 m/s for the curve for fines content ≥ 35 %, V*
S1 = 215 m/s for the curve for fines content ≤ 5 %, V*S1 varies linearly from 200
to 215 m/s for fines content between 35 and 5 %), Ka1 = factor to correct for high VS1 values caused by aging, Ka2 = factor to correct for influence of age on CRR. Magnitude scaling factors should be used to scale Eq. 2 (for magnitude Mw = 7.5 earthquakes) to different magnitudes. Both Ka1 and Ka2 are 1 for

C
yclic
Stre
ss R
atio
CSR
or
Cyc
lic R
esis
tanc
e R
atio
CR
R
0.6
0.4
0.2
0 0 100 200 300
Stress-Corrected Shear Wave Velocity VS1 (m/s) Figure 3. Curves for evaluating CRR from shear wave velocity VS for clean, uncemented soils
with liquefaction data from compiled case histories (Andrus and Stokoe 2000) uncemented soils of Holocene age. For older soils, suggested Ka1 values (mostly in the range 0.6 to 0.8) are derived from SPT-VS1 relationships (e.g. Ohta and Goto 1978, Rollins et al. 1998, or site specific). Lower-bound values of Ka2 (1.1 to 1.5) are based on the study by Arango et al. (2000). Andrus et al. (2004) remarked, however, the high associated uncertainty and the need of additional work to quantify the influence of age on CRR, as well as on VS.
EVALUATION OF CRR FROM THE DMT HORIZONTAL STRESS INDEX KD Marchetti (1982) and later studies (Robertson and Campanella 1986, Reyna and Chameau 1991) suggested that the horizontal stress index KD from DMT (KD = (p0 - u0) / σ'v0) is a suitable index parameter of liquefaction resistance. Comparative studies have indicated that KD is noticeably reactive to stress history, prestraining/aging, cementation, structure – all factors increasing liquefaction resistance (scarcely felt by qc from CPT, see e.g. Huang and Ma 1994, and in general by cylindrical-conical probes). As noted by Robertson and Campanella (1986), it is not possible to separate the individual contribution of each factor on KD. On the other hand, a low KD signals that none of the above factors is high, i.e. the sand is loose, uncemented, in a low K0 environment and has little stress history. A sand under these conditions may liquefy or develop large strains under cyclic loading. The most significant findings supporting a well-based CRR-KD correlation (Monaco et al. 2005) are:
Sensitivity of DMT in monitoring soil densification The high sensitivity of the DMT in monitoring densification, demonstrated by several studies (e.g. Schmertmann et al. 1986 and Jendeby 1992 found DMT ≈ twice more sensitive than CPT), suggests that the DMT may also sense sand liquefiability. A liquefiable sand may be regarded as a "negatively compacted" sand, plausibly the DMT sensitivity holds both in the positive and the negative range.
Sensitivity of DMT to prestraining CC research by Jamiolkowski and Lo Presti (1998) has shown that KD is much more sensitive to cyclic prestraining – one of the most difficult effects to detect by any method – than penetration resistance. Given the strong link of prestraining with aging, this point is discussed in more detail in the Section "Sensitivity of KD to aging".
Correlation KD - Relative density The correlation by Reyna and Chameau (1991) for deriving the relative density DR from KD in NC uncemented sands (Figure 4a) has been strongly confirmed by subsequent research, in particular by additional KD -DR datapoints (shaded areas in Figure 4a) obtained by Tanaka and Tanaka (1998) at the sites of Ohgishima and Kemigawa, where DR was determined on high quality frozen samples.
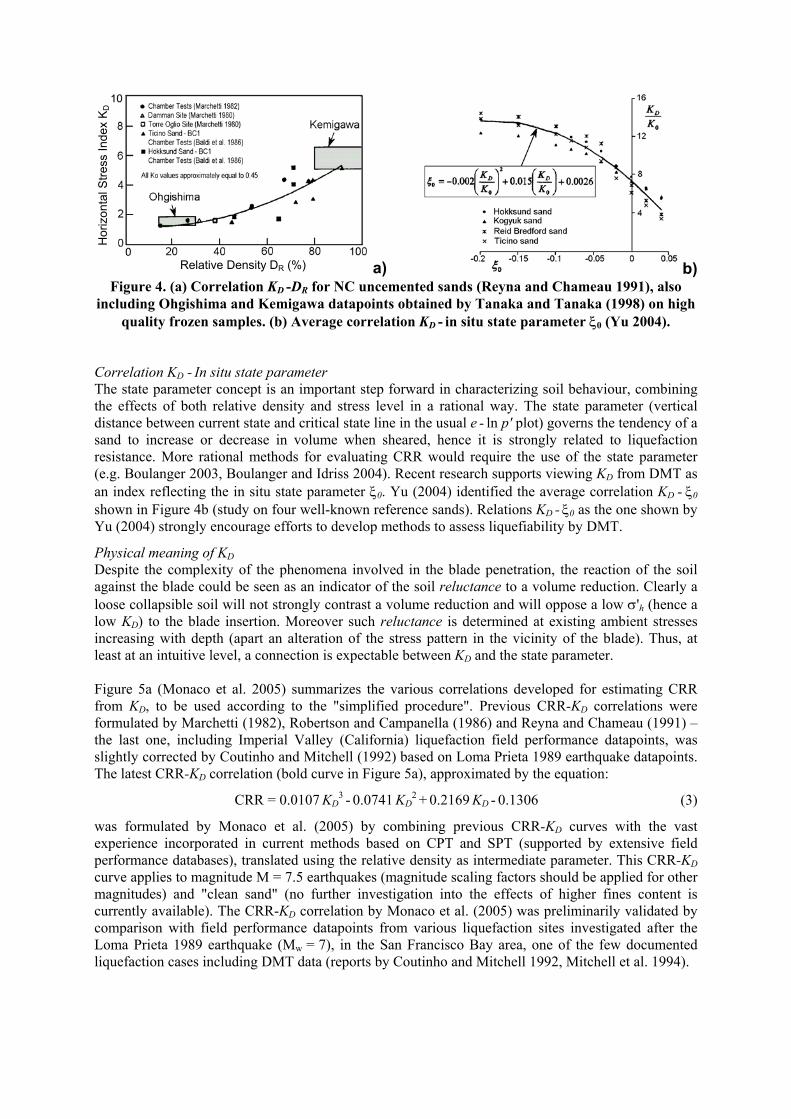
a) b) Figure 4. (a) Correlation KD -DR for NC uncemented sands (Reyna and Chameau 1991), also
including Ohgishima and Kemigawa datapoints obtained by Tanaka and Tanaka (1998) on high quality frozen samples. (b) Average correlation KD - in situ state parameter ξ0 (Yu 2004).
Correlation KD - In situ state parameter The state parameter concept is an important step forward in characterizing soil behaviour, combining the effects of both relative density and stress level in a rational way. The state parameter (vertical distance between current state and critical state line in the usual e - ln p' plot) governs the tendency of a sand to increase or decrease in volume when sheared, hence it is strongly related to liquefaction resistance. More rational methods for evaluating CRR would require the use of the state parameter (e.g. Boulanger 2003, Boulanger and Idriss 2004). Recent research supports viewing KD from DMT as an index reflecting the in situ state parameter ξ0. Yu (2004) identified the average correlation KD - ξ0 shown in Figure 4b (study on four well-known reference sands). Relations KD - ξ0 as the one shown by Yu (2004) strongly encourage efforts to develop methods to assess liquefiability by DMT.
Physical meaning of KD Despite the complexity of the phenomena involved in the blade penetration, the reaction of the soil against the blade could be seen as an indicator of the soil reluctance to a volume reduction. Clearly a loose collapsible soil will not strongly contrast a volume reduction and will oppose a low σ'h (hence a low KD) to the blade insertion. Moreover such reluctance is determined at existing ambient stresses increasing with depth (apart an alteration of the stress pattern in the vicinity of the blade). Thus, at least at an intuitive level, a connection is expectable between KD and the state parameter. Figure 5a (Monaco et al. 2005) summarizes the various correlations developed for estimating CRR from KD, to be used according to the "simplified procedure". Previous CRR-KD correlations were formulated by Marchetti (1982), Robertson and Campanella (1986) and Reyna and Chameau (1991) – the last one, including Imperial Valley (California) liquefaction field performance datapoints, was slightly corrected by Coutinho and Mitchell (1992) based on Loma Prieta 1989 earthquake datapoints. The latest CRR-KD correlation (bold curve in Figure 5a), approximated by the equation:
CRR = 0.0107 KD3
- 0.0741 KD2
+ 0.2169 KD - 0.1306 (3)
was formulated by Monaco et al. (2005) by combining previous CRR-KD curves with the vast experience incorporated in current methods based on CPT and SPT (supported by extensive field performance databases), translated using the relative density as intermediate parameter. This CRR-KD curve applies to magnitude M = 7.5 earthquakes (magnitude scaling factors should be applied for other magnitudes) and "clean sand" (no further investigation into the effects of higher fines content is currently available). The CRR-KD correlation by Monaco et al. (2005) was preliminarily validated by comparison with field performance datapoints from various liquefaction sites investigated after the Loma Prieta 1989 earthquake (Mw = 7), in the San Francisco Bay area, one of the few documented liquefaction cases including DMT data (reports by Coutinho and Mitchell 1992, Mitchell et al. 1994).
Hor
izon
tal S
tress
Inde
x K D
Relative Density DR (%)

0
0.1
0.2
0.3
0.4
0.5
0 2 4 6 8 10
0
0.1
0.2
0.3
0.4
0.5
0 2 4 6 8 10
LIQUEFACTION SITES Port of Richmond POR2 Port of Oakland POO7-2 Port of Oakland POO7-3 Alameda Bay - South Loop Rd. NON CLASSIFIED SITES Port of Richmond - Hall Ave.
Figure 5. (a) CRR-KD curves for evaluating liquefaction resistance from DMT (Monaco et al. 2005). (b) Comparison of CRR-KD curve by Monaco et al. (2005) and Loma Prieta 1989
earthquake liquefaction datapoints (after Mitchell et al. 1994) Figure 5b shows that datapoints obtained at sites where liquefaction had occurred (mostly in hydraulic sandfills) are correctly located in the "liquefaction" side. One datapoint relevant to a non classified site, with uncertain liquefaction evidence, plots very close to the CRR-KD boundary curve (scaled for Mw = 7). The convergence in a narrow band of the more recent CRR-KD curves, compared to earlier curves, in Figure 5a encourages the use of KD to estimate CRR. However, since the CRR-KD correlation is based on a limited real liquefaction case history database, considerable additional verification is needed.
INFLUENCE OF AGING / STRESS HISTORY ON LIQUEFACTION RESISTANCE Several investigators have noted that the liquefaction resistance increases markedly with age. Aging in sands is generally attributed to chemical factors (formation of post-sedimentation cementing bonds at particle contacts) and mechanical factors (slippage of grains during secondary consolidation). The '96-'98 NCEER workshops (Youd and Idriss 2001) noted however that, though qualitative time-dependent increases have been documented, few quantitative data have been collected. Hence, in absence of verified correction factors for age, "engineering judgment is required to estimate the liquefaction resistance of sediments more than a few thousand years old".
Pyke (2003) observed that "overconsolidation and aging are likely to have a much greater effect on increasing liquefaction resistance than they do on penetration resistance. Thus soils that are even lightly OC or more than several decades old may have a greater resistance to liquefaction than indicated by the current correlations, which are heavily weighted by data from hydraulic fills and very recent streambed deposits".
Leon et al. (2006) explicitly highlighted the importance of aging when assessing liquefaction potential. Similarly to Pyke (2003), they pointed out that commonly used correlations for estimating CRR (from SPT, CPT, VS) were derived mostly for young or freshly deposited sands – where the aging effect is negligible or small, anyway smaller than in older soils – and are not strictly valid in older sands. They also observed that penetration resistance is a poor indicator of the in situ conditions of sand deposits when aging is found. The poor ability of SPT and CPT to capture the effects of aging is ascribed by Leon et al. (2006) to their insufficient sensitivity to detect minor changes in soil fabric that can increase liquefaction resistance, since the disturbance during these tests may destroy or seriously
LIQUEFACTION
NO LIQUEFACTION
CRR-KD curve (Monaco et al. 2005)
KD
Cyc
lic S
tress
Rat
io C
SR o
r C
yclic
Res
ista
nce
Rat
io C
RR
b)
Robertson & Campanella 1986
Reyna & Chameau 1991
Marchetti 1982
M = 7.5
NO LIQUEFACTION
Range of curves derived from SPT
Range of curves derived from CPT
Proposed CRR-KD curve (Monaco et al. 2005)
KD
Cyc
lic S
tress
Rat
io C
SR o
r C
yclic
Res
ista
nce
Rat
io C
RR
LIQUEFACTION
a)

damage the microstructure effects that result from aging. The inability of SPT and CPT to capture the effects of aging may lead to excessively conservative estimates of liquefaction resistance. In the sand deposits studied by Leon et al. (2006), ignoring aging effects and using a CRR evaluated from in situ tests insensitive to aging (SPT, CPT, VS) underestimated CRR by a large 60 % (a huge underestimation, even in geotechnical engineering). Similarly, Lewis et al. (1999) remarked that the use of empirical correlations developed for young soil deposits – which do not account for increased resistance with increased age – in older sands will, at best, result in very conservative and uneconomical design, at worst in very costly remedial measures or cancellation of a project.
As observed by Monaco and Schmertmann (2007), giving insufficient weight to aging, or disregarding aging, is equivalent to omitting a primary parameter in a CRR correlation. No wonder, then, that such an omission leads to possibly overconservative CRR values. Also, the omission of the parameter aging may be an important contributor of the frequently observed dispersion of the CRR predictions, ultimately leading to the generally accepted recommendation "evaluate CRR by as many methods as possible" (e.g. Youd and Idriss 2001).
A way out to take into account the effects of aging, proposed by various Authors (including e.g. Andrus et al. 2004 for CRR-VS), is to correct current CRR correlations, developed for young soils, by means of correction factors depending on the age of the deposit. The method proposed by Leon et al. (2006), using correction factors based on sand sites in South Carolina, rightly yields less conservative CRR predictions in these soils. However, for other deposits, specific factors should in general be developed, because the CRR gain due to aging can depend on many ambient factors and thus can vary widely from site to site. A desirable alternative would be using a testing tool appreciably more sensitive to aging – besides being sensitive to the various factors that are known to increase CRR. It is of interest to note that Jamiolkowski et al. (1985) had already pointed out, many years ago, that "reliable predictions of liquefaction resistance of sand deposits having complex stress-strain history would require the development of some new in situ device [other than CPT or SPT], more sensitive to the effects of past stress-strain histories".
SENSITIVITY OF KD TO AGING The higher sensitivity of the DMT to aging (see Monaco and Schmertmann 2007) was demonstrated by the large calibration chamber research work by Jamiolkowski and Lo Presti (1998). They showed (Figure 6) that KD is much more sensitive to cyclic prestraining than the penetration resistance qD of the DMT blade, and presumably also of the CPT cone. The increase in KD caused by prestraining was found ≈ 3 to 7 times the increase in qD. Two calibration chamber experiments involved stage testing and an extrapolation: (a) Filling and K0 pressurization of the chamber. (b) Blade penetration and measuring qD and KD every 100 mm penetration to mid-chamber depth. (c) Five cycles of prestressing/prestraining the sand in the chamber. (d) Repeating (b) for the remaining depth of the chamber. (e) Down and up extrapolation for the qD and KD values at mid depth. (f) Comparing the values before and after the prestraining. The prestraining consisted of increasing both the vertical and horizontal stress according to the stress paths in Figure 6, then removing both increases and thereby returning to the same initial stress state before the DMT testing.
Cycles of prestrain may be viewed as a type of "simulated aging" (at least for the mechanical "non-chemical" mechanism responsible of aging, consisting in the grains gradually slipping into a more stable configuration). Prestrain just speeds the slippage of particles vs. that which would otherwise take place over long periods of time. It is also well known that cyclic prestrain, just as aging, increases the liquefaction resistance, due to the similarity of the mechanism (e.g. Triantafyllidis et al. 2004). Arguably KD is much more sensitive to aging than penetration resistance. It is possible that current CRR correlations based on KD, or future refined versions, will not need the introduction of "age correction factors", because part of the aging effects are already "incorporated" in KD. On the other hand KD is, at the same time, sensitive to factors such as stress history and cementation, long recognized as important to liquefaction behaviour.

CC TEST N. 216 IN TICINO SAND CC TEST N. 241 IN TICINO SAND
KD increase +20% qD increase +3%
KD increase +39% qD increase +11%
Figure 6. Calibration chamber test results (prestraining cycles) showing the higher sensitivity of KD to prestraining than penetration resistance qD (Jamiolkowski and Lo Presti 1998)
COMPARISONS OF CRR-KD AND CRR-VS OBTAINED BY SDMT AT VARIOUS SITES Maugeri and Monaco (2006) presented a comparison of CRR-KD and CRR-VS correlations based on a large amount of parallel measurements of KD and VS obtained by SDMT at several sandy sites. They found that current methods for evaluating CRR from VS and KD would provide, in general, substantially different predictions (generally CRR from VS was found less conservative or "more optimistic" than CRR from KD). They also showed that no evident correlation, not even site specific, exists between VS and KD in sands (as one could expect, considering the intended use of both for predicting CRR). Hence VS and KD seem to reflect, besides possibly CRR, other properties and are not interchangeable for predicting CRR, likely resulting in different CRR estimates. The above opens the question "which CRR should be given greater weight" when parallel analyses by KD and VS produce contradictory results. The considerations which follow are intended to provide a contribution to a possible discussion on this topic.
OCR and KD crusts in sand The KD profile generally shows some ability to reflect OCR in sands, often resulting from a complex history of preloading, desiccation and/or other effects. "Crust-like" KD profiles (see example in Figure 7), very similar to the typical KD profiles found in OC desiccation crusts in clay, have been found at the top of most of the investigated sand deposits. In many cases the KD values in the shallow crusts were found much higher than KD ≈ 6-7, corresponding to DR = 100 % according to the KD -DR correlation by Reyna and Chameau (1991) for NC uncemented sands (Figure 4a). These values confirm that part of KD is due to overconsolidation or cementation or aging, rather than to DR. Note in Figure 7 that, while the existence of a shallow crust is well highlighted by the KD profile, the profile of VS is much more uniform and does not appear to reflect the shallow crust at all. Such capability of KD to reflect stress history is important for liquefaction. The fact that OCR crusts – believed by far not liquefiable – are unequivocally depicted by the high KDs, but are almost unfelt by VS, suggests a lesser ability of VS to profile liquefiability.
Role of the interparticle bonding The data in Figure 8 (Cassino, Italy) are somehow anomalous, in that relatively high VS coexist with very low values of KD and soil moduli M. Many volcanic sands in that area (pozzolana) are known to be active in developing interparticle bonding. A possible explanation could be the following. The shear wave travels fast in those sands thanks to the interparticle bonding, that is preserved at small strains. By contrast KD is "low" because it reflects a different material, where the interparticle bonding has been at least partly destroyed by the blade penetration. As noted by Andrus and Stokoe (2000), one concern when using VS to evaluate liquefaction resistance is that VS measurements are made at

Figure 7. SDMT results at the site of Catania (San Giuseppe La Rena), Italy
Figure 8. SDMT results at the site of Cassino, Italy
Figure 9. SDMT results at the site of Zelazny Most tailing dam, Poland
KD crust
MATERIAL INDEX
CONSTRAINED MODULUS
UNDRAINED SHEAR STRENGTH
HORIZONTAL STRESS INDEX
SHEAR WAVE VELOCITY
CLAY SILT SAND
CLAY SILT SAND
MATERIAL INDEX
CONSTRAINED MODULUS
UNDRAINED SHEAR STRENGTH
HORIZONTAL STRESS INDEX
SHEAR WAVE VELOCITY
MATERIAL INDEX
CONSTRAINED MODULUS
UNDRAINED SHEAR STRENGTH
HORIZONTAL STRESS INDEX
SHEAR WAVE VELOCITY
CLAY SILT SAND

small strains, whereas pore-pressure build up and liquefaction are medium- to high-strain phenomena. This concern is significant for cemented/bonded soils, because small-strain measurements are highly sensitive to weak interparticle bonding that is eliminated at medium-high strains (range of KD measurement). Weak interparticle bonding can increase VS, while not necessarily increasing CRR. Thus, for liquefiability, the KD indications could possibly be more relevant. Very light earthquakes, however, may not destroy bonding, then CRR evaluated by VS may be appropriate in this case.
Limiting values of VS1 and KD for liquefaction occurrence Another difference in the correlations CRR-VS and CRR-KD may be noted in the limiting values of VS1 and KD for which liquefaction occurrence can be definitely excluded, even in case of strong earthquakes (asymptotes of the CRR-VS1 curve in Figure 3 and CRR-KD curve in Figure 5a). Such values are respectively V*
S1 = 215 m/s and K*D = 5.5 (see Maugeri and Monaco 2006), for clean sands
and Mw = 7.5. In the example shown in Figure 9 (Zelazny Most tailing dam, Poland), while VS1 values (mostly > 215 m/s) suggest "no liquefaction" for any earthquake, KD values (≈ 1.5-2) indicate that liquefaction may occur above a certain seismic stress level (high CSR).
CRR from VS vs. CRR from other methods Various Authors have discussed the accuracy of CRR evaluated from VS compared to CRR by other methods (SPT, CPT). Seed et al. (2003) commented that VS based correlations provide less reliable estimates of CRR than SPT-CPT, due to the smaller field case history database and to the poor correlation of the small-strain VS measurement with the large-strain liquefaction phenomenon. Idriss and Boulanger (2004) observed that SPT, CPT and VS are differently sensitive to the relative density of the soil, one of the major factors influencing CRR, being the SPT the most sensitive and VS the least sensitive. (Accordingly Maugeri and Monaco 2006 showed that KD is more sensitive to DR than VS). Idriss and Boulanger (2004) remarked the persisting need for an improved understanding of CRR-VS correlations and recommended that greater weight should be given to CRR from SPT or CPT, in case of contradictory predictions by SPT, CPT and VS. In the writers' view, a crucial aspect, when assessing the accuracy of different CRR correlations, is the sensitivity of the testing tool, besides to relative density, to factors – above all aging and stress history – which play a primary role in increasing liquefaction resistance (for a given DR).
CONCLUSIONS The seismic dilatometer (SDMT) offers an alternative or integration to current methods for evaluating the liquefaction resistance of sands based on CPT-SPT. Two parallel independent evaluations of liquefaction resistance CRR can be obtained from the horizontal stress index KD and from the shear wave velocity VS, by means of the CRR-KD and CRR-VS correlations shown in Figure 5a and in Figure 3, to be used in the framework of the Seed and Idriss (1971) simplified procedure. This possibility appears attractive, since "redundancy" in the evaluation of CRR by more than one method is generally recommended. The use of VS for evaluating CRR is well known. Correlations CRR-KD have been developed in the last two decades, stimulated by the recognized sensitivity of KD to prestraining/aging, combined with the ability of KD to reflect a number of factors which are known to increase liquefaction resistance – stress history, cementation, structure – and the correlation of KD to relative density and state parameter.
Recent research has definitely shown that accounting for aging is not a refinement, but a necessity for economical design, because aging has a first order of magnitude influence on liquefaction behaviour. Ignoring aging effects and using current CRR correlations, developed for young or freshly deposited sands and based on in situ tests (SPT, CPT, VS) poorly sensitive to aging, would result in many cases in overconservative design. A desirable alternative, seemingly better than relying on an "average" from correlations missing the aging factor, would be to use a testing tool significantly more sensitive to aging.
CC research by Jamiolkowski and Lo Presti (1998) has shown that KD is much more sensitive to cyclic prestraining – a sort of "simulated aging" – than penetration resistance. On the other hand, it is well

known that cyclic prestrain, just as aging, increases the liquefaction resistance, due to the similarity of the mechanism. Therefore the results of the above CC research suggest that KD is much more sensitive to aging than penetration resistance. It is possible that current CRR correlations based on KD, or future refined versions, will not need the introduction of "age correction factors", because part of the aging effects are already "incorporated" in KD. Moreover KD is sensitive to factors such as stress history and cementation, long recognized as important to liquefaction behaviour. Using an in situ testing tool also more sensitive to aging effects, such as the DMT/SDMT, could possibly lead to better correlations to obtain CRR.
The aptness of the KD parameter to evaluate CRR has been reinforced by the experience gained with a large number of tests performed in the recent years with the SDMT. A clear feature emerging from many comparisons of the KD and VS profiles is the clarity with which "Stress History crusts" (which are not "Relative Density crusts") are evidenced by KD, while such crusts are barely recognizable in the VS profiles. Such capability of KD to reflect stress history is important. In fact, in addition to the sensitivity to aging, the evaluation of any alternative method to evaluate liquefaction resistance would be incomplete without also checking its ability to account for other stress history effects.
Comparisons based on parallel measurements of KD and VS obtained by SDMT at several sandy sites have shown that VS and KD would provide, in general, substantially different estimates of CRR, leaving open the question "which CRR should be given greater weight" when parallel analyses by KD and VS produce contradictory predictions. In principle, the authors would propend to give greater weight to CRR by KD for the following reasons: – Shallow OC crusts (believed to be very unlikely to liquefy), found at the top of most sand deposits,
are unequivocally depicted by high KD values but almost "unfelt" by VS. This suggests a lesser ability of VS to profile liquefiability.
– VS is measured at small strains, whereas pore-pressure build up and liquefaction are medium- to high-strain phenomena. In cemented/bonded soils VS can be "misleadingly" high due to interparticle bonding, largely destroyed at higher strains (range of KD measurement). Thus the KD indications could possibly be more relevant for liquefiability. Very light earthquakes, however, may not destroy bonding, then CRR evaluated by VS may be appropriate in this case.
– Many indications suggest at least some link between KD and state parameter, which is probably one of the closest proxy of liquefiability.
– KD is more sensitive than VS to relative density DR and to other factors that greatly increase liquefaction resistance, such as stress history, aging, cementation, structure (which, incidentally, are felt considerably more than by penetration resistance).
The above obviously deserves considerable additional verification, supported by well documented real-life liquefaction case histories.
REFERENCES AGI (1991). "Geotechnical Characterization of Fucino Clay". Proc. X ECSMFE, Firenze, 1, 27-40. Andrus, R.D. and Stokoe, K.H., II. (2000). "Liquefaction resistance of soils from shear-wave velocity". Jnl GGE, ASCE,
126(11), 1015-1025. Andrus, R.D., Stokoe, K.H., II and Juang, C.H. (2004). "Guide for Shear-Wave-Based Liquefaction Potential Evaluation".
Earthquake Spectra, 20(2), 285-305. Arango, I., Lewis, M.R. and Kramer, C. (2000). "Updated liquefaction potential analysis eliminates foundation retrofitting of
two critical structures". Soil Dyn. Earthquake Engrg., 20, 17–25. Boulanger, R.W. 2003. "High overburden stress effects in liquefaction analysis". Jnl GGE, ASCE, 129(12), 1071-1082. Boulanger, R.W. and Idriss, I.M. (2004). "State normalization of penetration resistance and the effect of overburden stress on
liquefaction resistance". Proc. 11th Int. Conf. on Soil Dynamics and Earthquake Engrg. and 33d Int. Conf. on Earthquake Geotech. Engrg., Berkeley, 484-491.
Coutinho, R.Q. and Mitchell, J.K. (1992). "Evaluation of Dilatometer Based Methods for Liquefaction Potential Assessment Using Loma Prieta Earthquake Data". Internal Report of Research Project (unpublished).
Hepton, P. (1988). "Shear wave velocity measurements during penetration testing". Proc. Penetration Testing in the UK, ICE, 275-278.
Huang, A.B. and Ma, M.Y. (1994). "An analytical study of cone penetration tests in granular material". Canadian Geotech. Jnl, 31(1), 91-103.
Idriss, I.M. and Boulanger, R.W. (2004). "Semi-empirical procedures for evaluating liquefaction potential during earthquakes". Proc. 11th Int. Conf. on Soil Dyn. and Earthquake Engrg. and 33d Int. Conf. on Earthquake Geotech. Engrg., Berkeley, 32-56.
Jamiolkowski, M., Baldi, G., Bellotti, R., Ghionna, V. and Pasqualini, E. (1985). "Penetration resistance and liquefaction of sands". Proc. XI ICSMFE, San Francisco, 4, 1891-1896.
Jamiolkowski, M. and Lo Presti, D.C.F. (1998). "DMT research in sand. What can be learned from calibration chamber tests". 1st Int. Conf. on Site Characterization ISC'98, Atlanta. Oral presentation.
Jendeby, L. (1992). "Deep Compaction by Vibrowing". Proc. Nordic Geot. Meeting NGM-92, 1, 19-24. Leon, E., Gassman, S.L. and Talwani, P. (2006). "Accounting for Soil Aging When Assessing Liquefaction Potential". Jnl
GGE, ASCE, 132(3), 363-377. Lewis, M.R., Arango, I., Kimball, J.K. and Ross, T. E. (1999). "Liquefaction resistance of old sand deposits". Proc. 11th
Panam. Conf. on Soil Mech. and Geot. Engrg., Foz do Iguassu, 2, 821-833. Marchetti, S. (1980). "In Situ Tests by Flat Dilatometer". Jnl GED, ASCE, 106(GT3), 299-321. Marchetti, S. (1982). "Detection of liquefiable sand layers by means of quasi-static penetration tests". Proc. 2nd European
Symp. on Penetration Testing, Amsterdam, 2, 689-695. Martin, G.K. and Mayne, P.W. (1997). "Seismic Flat Dilatometer Tests in Connecticut Valley Varved Clay". ASTM Geotech.
Testing Jnl, 20(3), 357-361. Martin, G.K. and Mayne, P.W. (1998). "Seismic flat dilatometer in Piedmont residual soils". Proc. 1st Int. Conf. on Site
Characterization ISC'98, Atlanta, 2, 837-843. Maugeri, M. and Monaco, P. (2006). "Liquefaction Potential Evaluation by SDMT". Proc. 2nd Int. Conf. on the Flat
Dilatometer, Washington D.C., 295-305. Mayne, P.W., Schneider, J.A. and Martin, G.K. (1999). "Small- and large-strain soil properties from seismic flat dilatometer
tests". Proc. 2nd Int. Symp. on Pre-Failure Deformation Characteristics of Geomaterials, Torino, 1, 419-427. Monaco, P., Marchetti, S., Totani, G. and Calabrese, M. (2005). "Sand liquefiability assessment by Flat Dilatometer Test
(DMT)". Proc. XVI ICSMGE, Osaka, 4, 2693-2697. Monaco, P. and Schmertmann, J.H. (2007). Discussion of "Accounting for Soil Aging When Assessing Liquefaction
Potential" by Leon, E. et al. (in Jnl GGE, ASCE, 2006, 132 (3), 363-377). Accepted for publication in ASCE Jnl GGE. Mitchell, J.K., Lodge, A.L., Coutinho, R.Q., Kayen, R.E., Seed, R.B., Nishio, S. and Stokoe, K.H. (1994). "Insitu test results
from four Loma Prieta earthquake liquefaction sites: SPT, CPT, DMT and shear wave velocity". Report No. UCB/EERC-94/04, Univ. of California, Berkeley.
Ohta, Y. and Goto, N. (1978). "Empirical shear wave velocity equations in terms of characteristic soil indexes". Earthquake Engrg. Struct. Dyn., 6, 167-187.
Pyke, R. (2003). Discussion of "Liquefaction Resistance of Soils: Summary Report from the 1996 NCEER and 1998 NCEER/NSF Workshops on Evaluation of Liquefaction Resistance of Soils" by Youd, T.L. et al. (in Jnl GGE, ASCE, 2001, 127(10), 817-833). Jnl GGE, ASCE, 129(3), 283-284.
Porcino, D. and Ghionna, V.N. (2002). "Liquefaction of coarse grained sands by laboratory testing on undisturbed frozen samples" (in Italian). Proc. Annual Meeting It. Geot. Res. IARG 2002, Naples.
Reyna, F. and Chameau, J.L. (1991). "Dilatometer Based Liquefaction Potential of Sites in the Imperial Valley". Proc. 2nd Int. Conf. on Recent Adv. in Geot. Earthquake Engrg. and Soil Dyn., St. Louis, 385-392.
Robertson, P.K. and Campanella, R.G. (1986). "Estimating Liquefaction Potential of Sands Using the Flat Plate Dilatometer". ASTM Geotechn. Testing Journal, 9(1), 38-40.
Robertson, P.K. and Wride, C.E. (1998). "Evaluating cyclic liquefaction potential using the cone penetration test". Canadian Geot. Jnl, 35(3), 442-459.
Rollins, K.M., Diehl, N.B. and Weaver, T.J. (1998). "Implications of VS-BPT (N1)60 correlations for liquefaction assessment in gravels". Geotech. Earthquake Engineering and Soil Dynamics III, ASCE Geotech. Special Publ. No. 75, I, 506-517.
Schmertmann, J.H., Baker, W., Gupta, R. and Kessler, K. (1986). "CPT/DMT Quality Control of Ground Modification at a Power Plant". Proc. In Situ '86, ASCE Spec. Conf. on "Use of In Situ Tests in Geot. Engrg.", Virginia Tech, Blacksburg, ASCE Geotech. Special Publ. No. 6, 985-1001.
Seed, R.B., Cetin, K.O., Moss, R.E.S., Kammerer, A.M., Wu, J., Pestana, J.M., Riemer, M.F., Sancio, R.B., Bray, J.D., Kayen, R.E. and Faris, A. (2003). "Recent advances in soil liquefaction engineering: a unified and consistent framework". Keynote Presentation, 26th Annual ASCE Los Angeles Geotechnical Spring Seminar, Long Beach. Report No. EERC 2003-06.
Seed, H.B. and Idriss, I.M. (1971). "Simplified procedure for evaluating soil liquefaction potential". Jnl GED, ASCE, 97(9), 1249-1273.
Tanaka, H. and Tanaka, M. (1998). "Characterization of Sandy Soils using CPT and DMT". Soils and Foundations, 38(3), 55-65.
TC16 (2001). "The Flat Dilatometer Test (DMT) in Soil Investigations - A Report by the ISSMGE Committee TC16". May 2001, 41 pp. Reprinted in Proc. 2nd Int. Conf. on the Flat Dilatometer, Washington D.C., 7-48.
Triantafyllidis, Th., Wichtmann, T. and Niemunis, A. (2004). "On the determination of cyclic strain history". Proc. Int. Conf. on Cyclic Behaviour of Soils and Liquef. Phenomena, Bochum, 321-334.
Youd, T.L. and Idriss, I.M. (2001). "Liquefaction Resistance of Soils: Summary Report from the 1996 NCEER and 1998 NCEER/NSF Workshops on Evaluation of Liquefaction Resistance of Soils". Jnl GGE, ASCE, 127(4), 297-313.
Yu, H.S. (2004). "In situ soil testing: from mechanics to interpretation". 1st J.K. Mitchell Lecture, Proc. 2nd Int. Conf. on Site Characterization ISC-2, Porto, 1, 3-38.