Embed Size (px)
Citation preview
1
Crystal Growth of Ternary Compound Semiconductors in Low Gravity Environment
Ching-Hua SuNASA/Marshall Space Flight Center
November 2014Collaborative Conference on Crystal Growth (3CG)
2
A low gravity material science experiment has been prepared to be performed in the Low Gradient Furnace (LGF) in the Material Science Research Rack (MSRR) on International Space Station (ISS).
There are two sections of the flight experiment: (I) Investigation toward crystal growth by physical vapor
transport (PVT): the growth of ZnSe and related ternary compounds, such as ZnSeS, ZnCdSe, and ZnSeTe,
(II) Investigation on the melt growth of CdTe and CdZnTe by directional solidification.
Crystal Growth of Ternary Compound Semiconductors
3
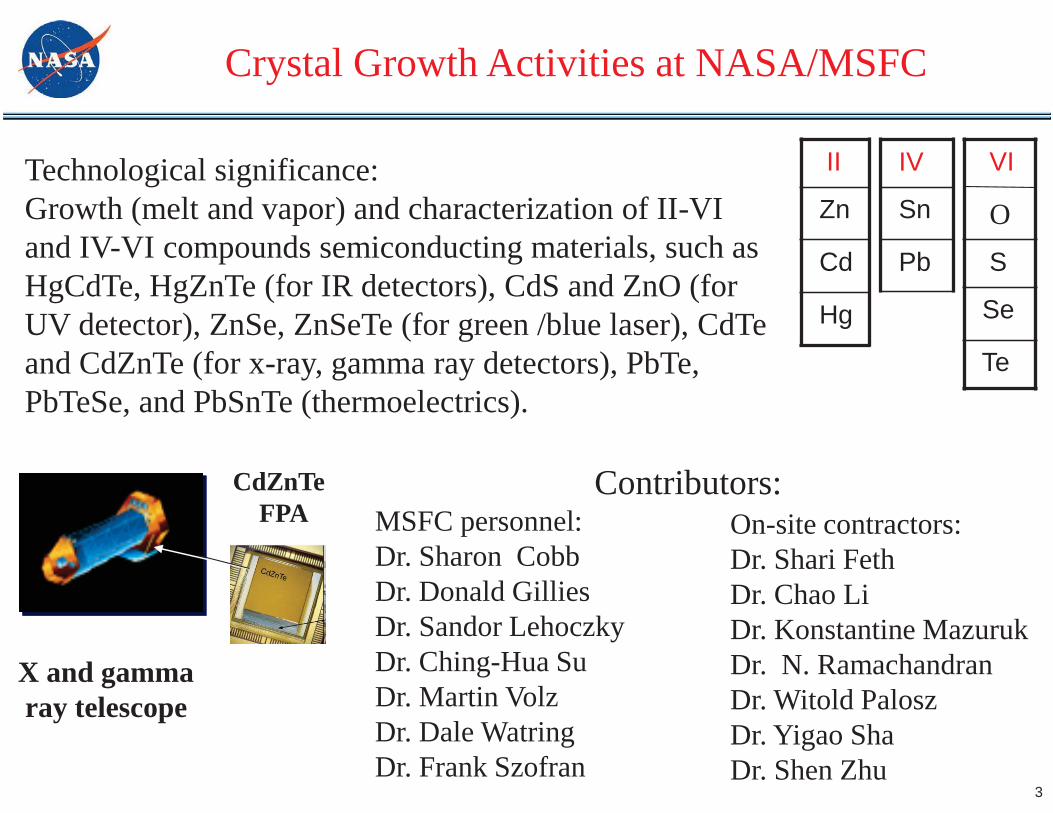
Technological significance:Growth (melt and vapor) and characterization of II-VI and IV-VI compounds semiconducting materials, such as HgCdTe, HgZnTe (for IR detectors), CdS and ZnO (for UV detector), ZnSe, ZnSeTe (for green /blue laser), CdTeand CdZnTe (for x-ray, gamma ray detectors), PbTe, PbTeSe, and PbSnTe (thermoelectrics).
Contributors:MSFC personnel:Dr. Sharon CobbDr. Donald GilliesDr. Sandor LehoczkyDr. Ching-Hua SuDr. Martin VolzDr. Dale WatringDr. Frank Szofran
On-site contractors:Dr. Shari FethDr. Chao LiDr. Konstantine MazurukDr. N. RamachandranDr. Witold PaloszDr. Yigao ShaDr. Shen Zhu
II
Zn
Cd
Hg
VI
S
Se
Te
O
Crystal Growth Activities at NASA/MSFC
X and gamma ray telescope
CdZnTeFPA
IV
Sn
Pb
4
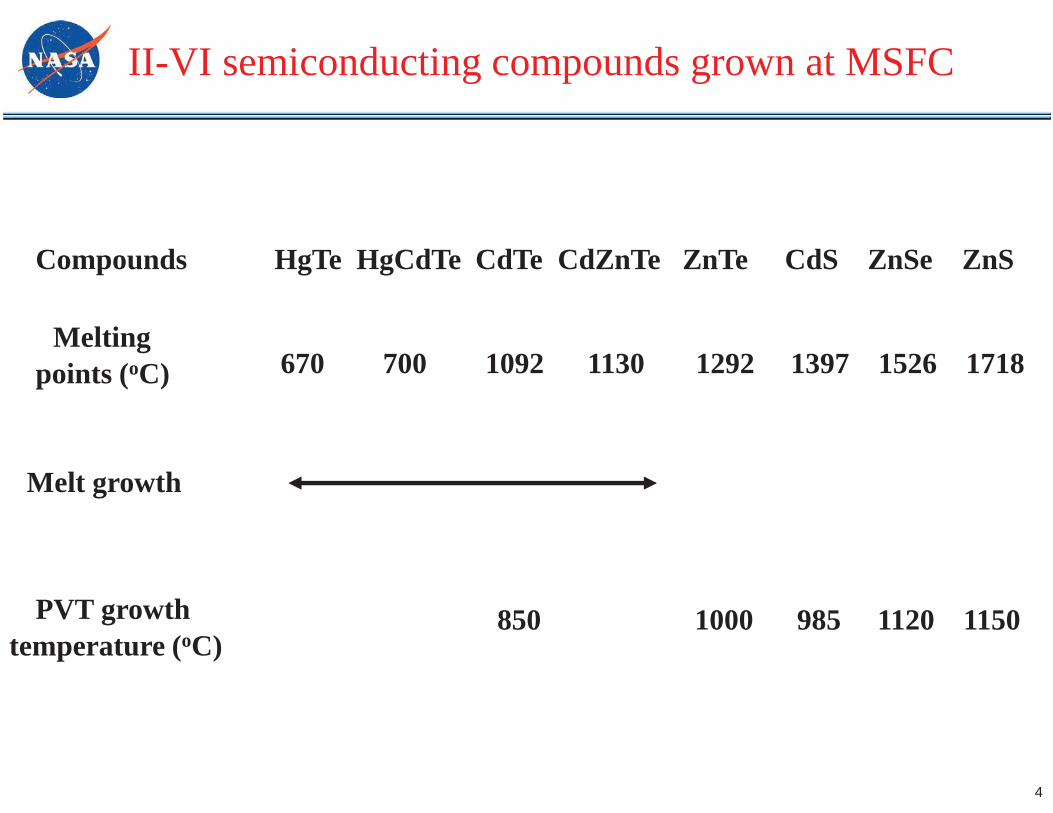
II-VI semiconducting compounds grown at MSFC
Compounds HgTe HgCdTe CdTe CdZnTe ZnTe CdS ZnSe ZnS
Meltingpoints (oC) 670 700 1092 1130 1292 1397 1526 1718
PVT growthtemperature (oC)
850 1000 985 1120 1150
Melt growth
5
1. To establish the relative contributions of gravity-driven fluid flows, both in liquid and vapor, to (1) the non-uniform incorporation of impurities and defects and (2) the deviation from stoichiometry and (3) the compositional variation observed in the grown crystals.
2. To assess the self-induced strain developed during processing at elevated temperatures and retained on cooling caused by the weight of the crystals.
3. The relation between fluid phase processes and the generation of defects in a grown crystal is an outstanding problem in materials growth. Studies in microgravity will be compared with modeling and will lead to a greater understanding of the processes involved.
Scientific Objectives
6
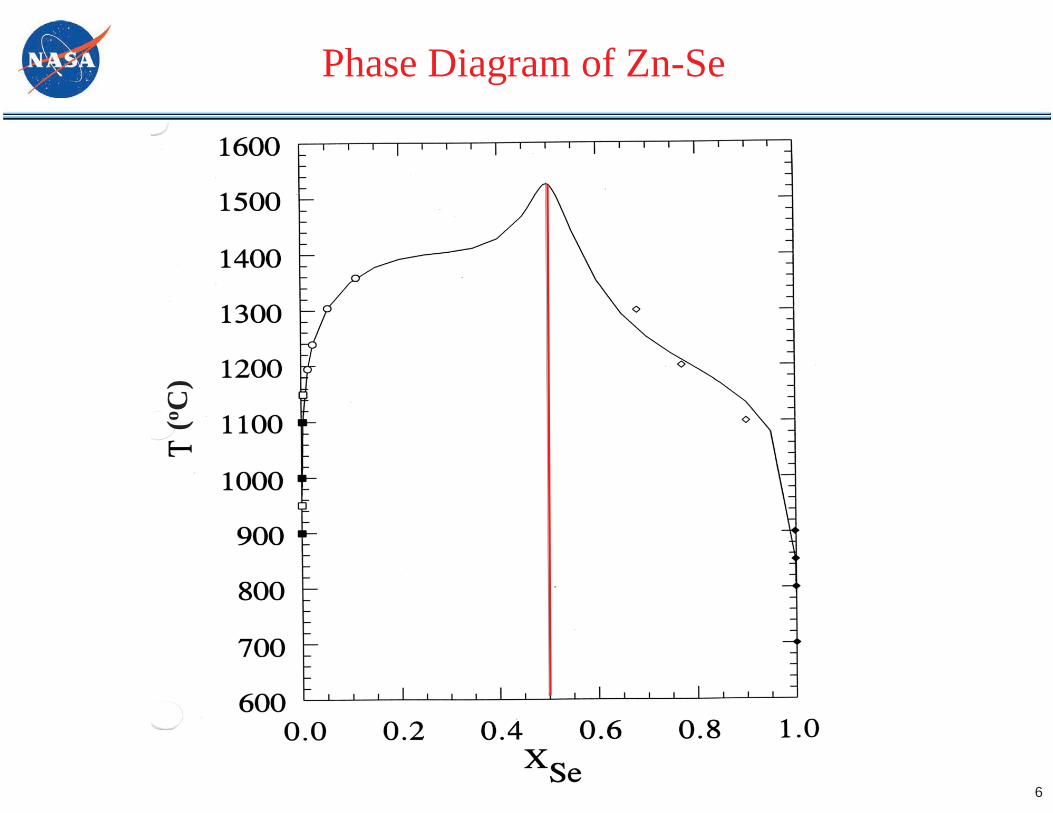
Phase Diagram of Zn-Se
(o C)
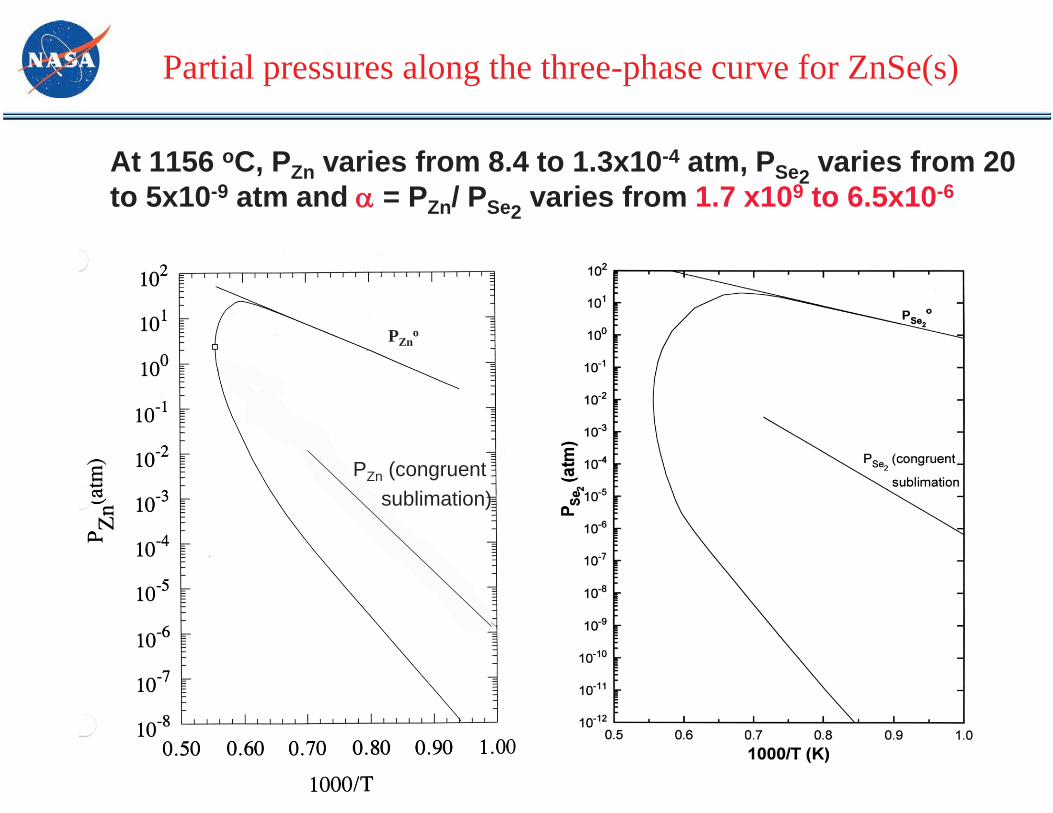
Partial pressures along the three-phase curve for ZnSe(s)
At 1156 oC, PZn varies from 8.4 to 1.3x10⁻⁴ atm, PSe2 varies from 20 to 5x10⁻⁹ atm and = PZn/ PSe2 varies from 1.7 x10⁹ to 6.5x10⁻⁶
PZno
PZn (congruent sublimation)
8
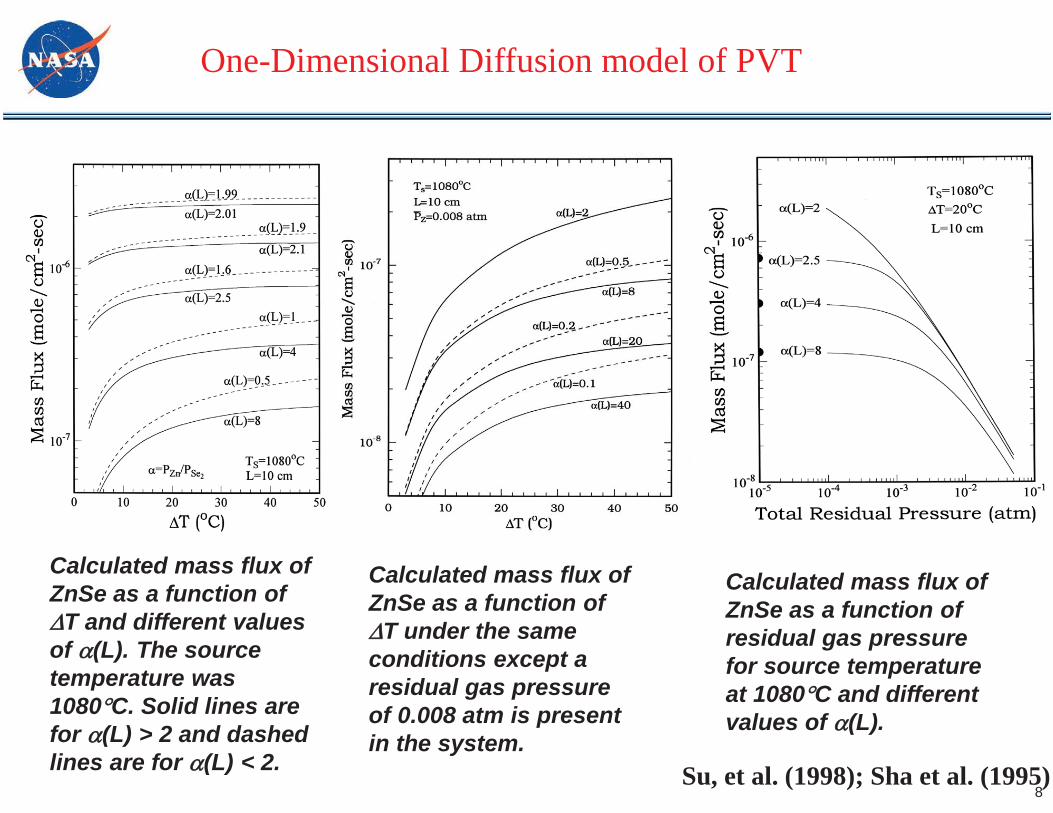
Calculated mass flux of ZnSe as a function of
T and different values of (L). The source temperature was 1080 C. Solid lines are for (L) > 2 and dashed lines are for (L) < 2.
Calculated mass flux of ZnSe as a function of
T under the same conditions except a residual gas pressure of 0.008 atm is present in the system.
Calculated mass flux of ZnSe as a function of residual gas pressure for source temperature at 1080 C and different values of (L).
One-Dimensional Diffusion model of PVT
Su, et al. (1998); Sha et al. (1995)
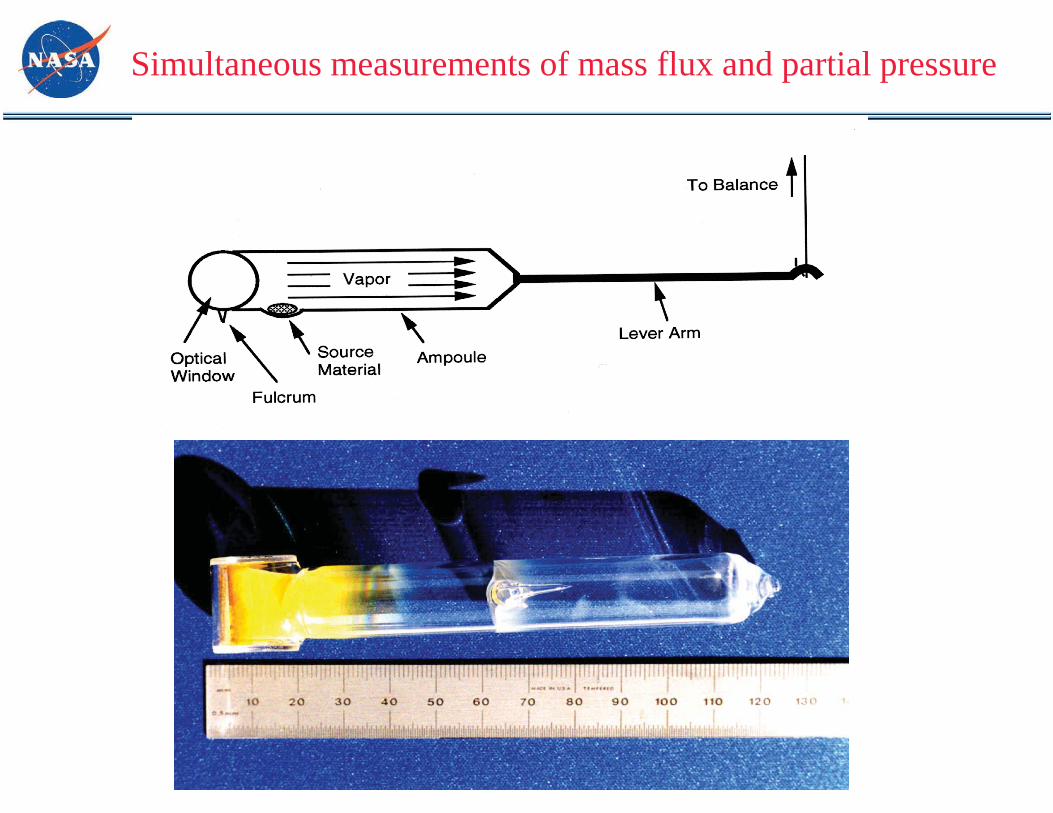
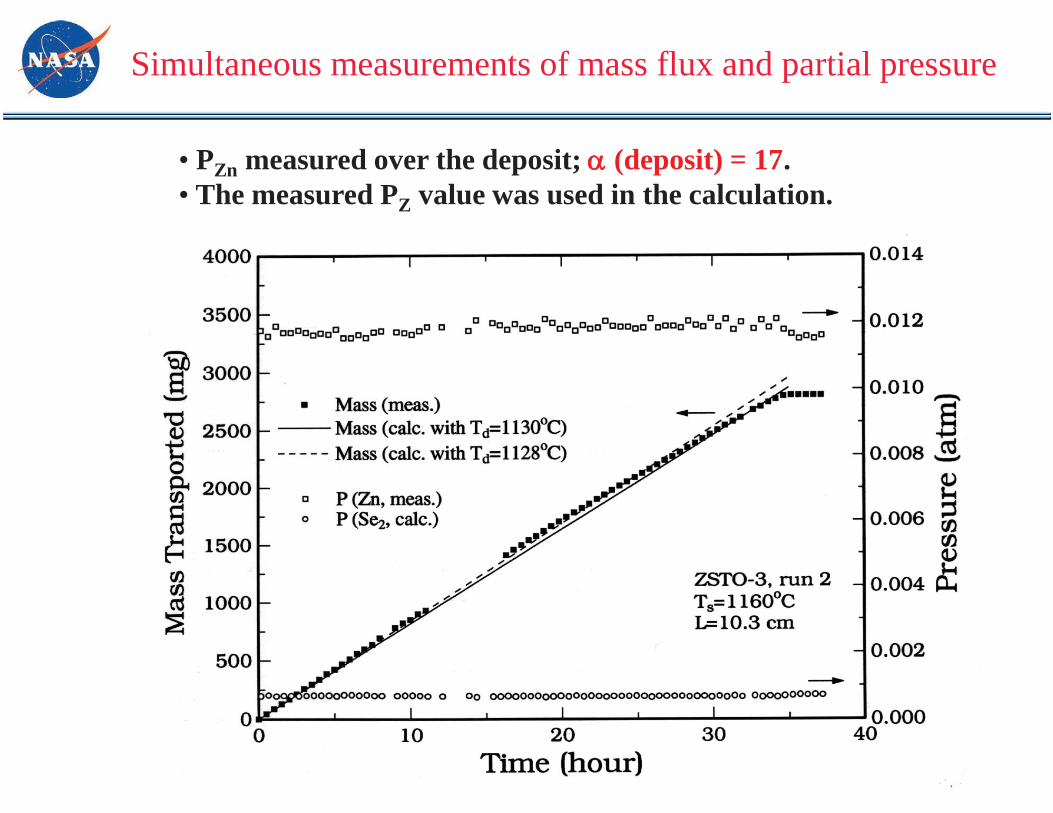
Simultaneous measurements of mass flux and partial pressure
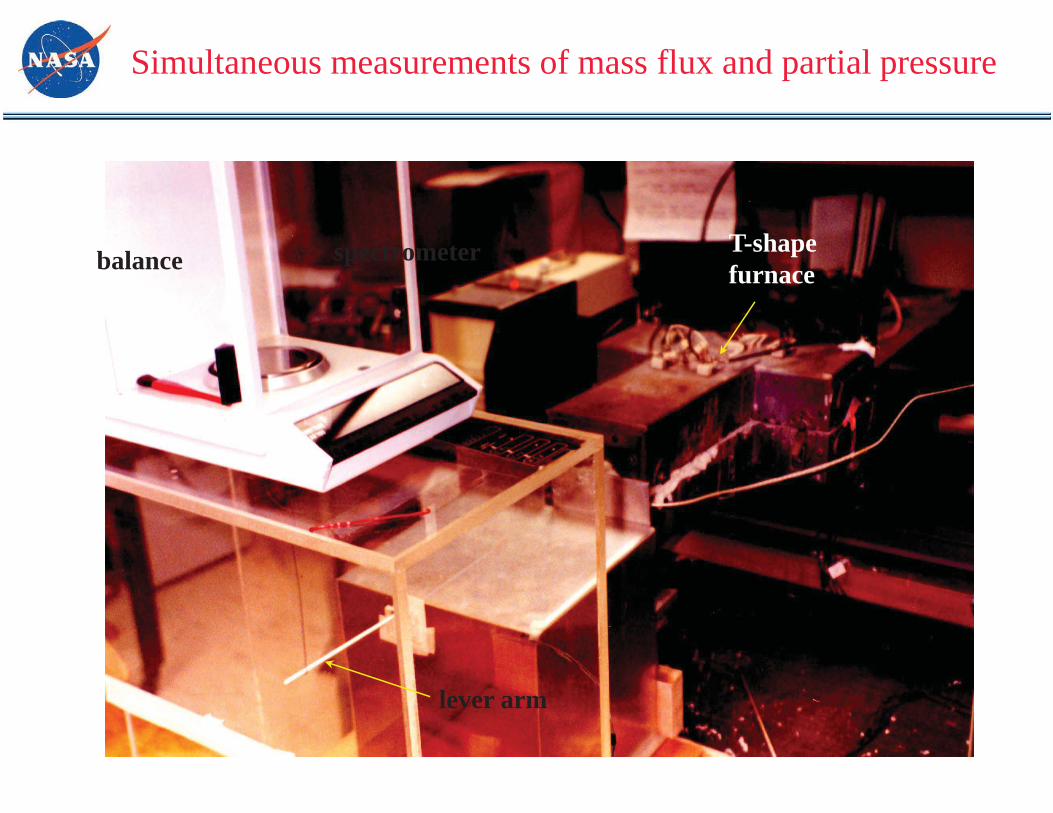
balanceT-shapefurnace
spectrometer
lever arm
Simultaneous measurements of mass flux and partial pressure
Simultaneous measurements of mass flux and partial pressure
• PZn measured over the deposit; (deposit) = 17. • The measured PZ value was used in the calculation.
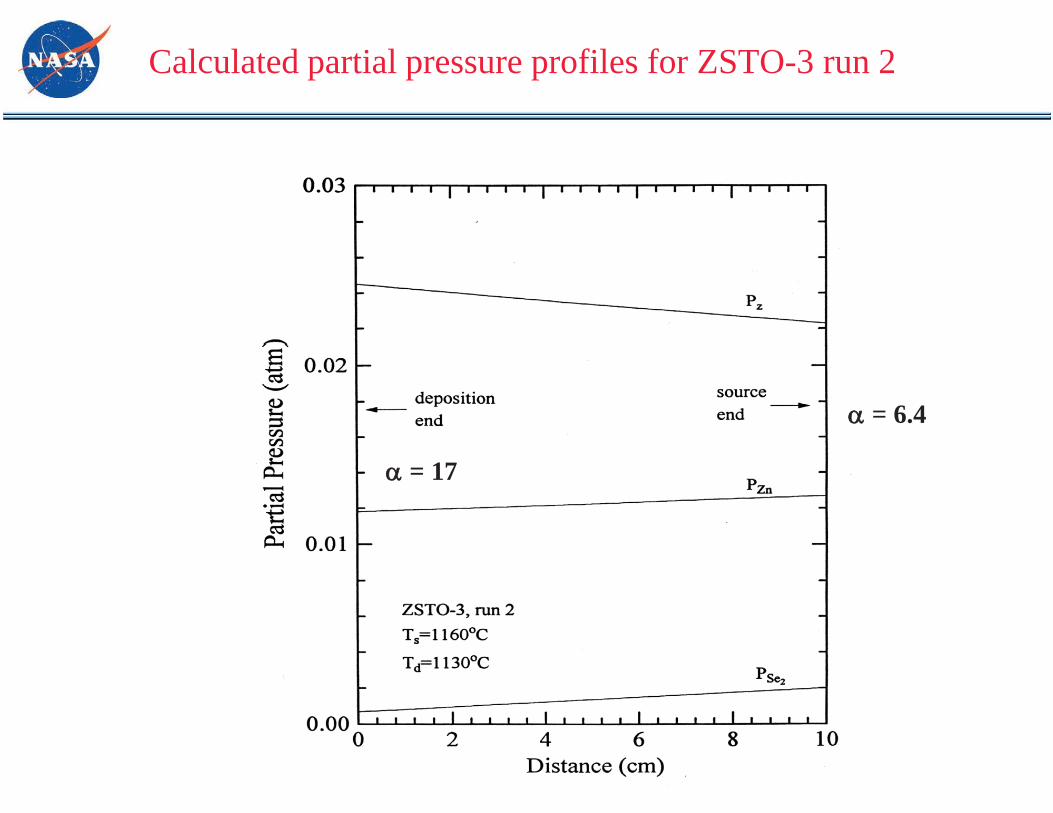
Calculated partial pressure profiles for ZSTO-3 run 2
= 17
= 6.4
13
• Four experimentally adjustable parameters, the source temperature, the deposition temperature, the partial pressure ratio over source and the residual gas pressure, determine the diffusive mass flux of a PVT system.
• However, two of these four parameters, the partial pressure ratio over source and the residual gas pressure, are more critical than the others. As will be shown, these two parameters are critically dependent on the proper heat treatments of the starting materials for optimum mass flux.
Summary of one dimensional diffusion analysis
14
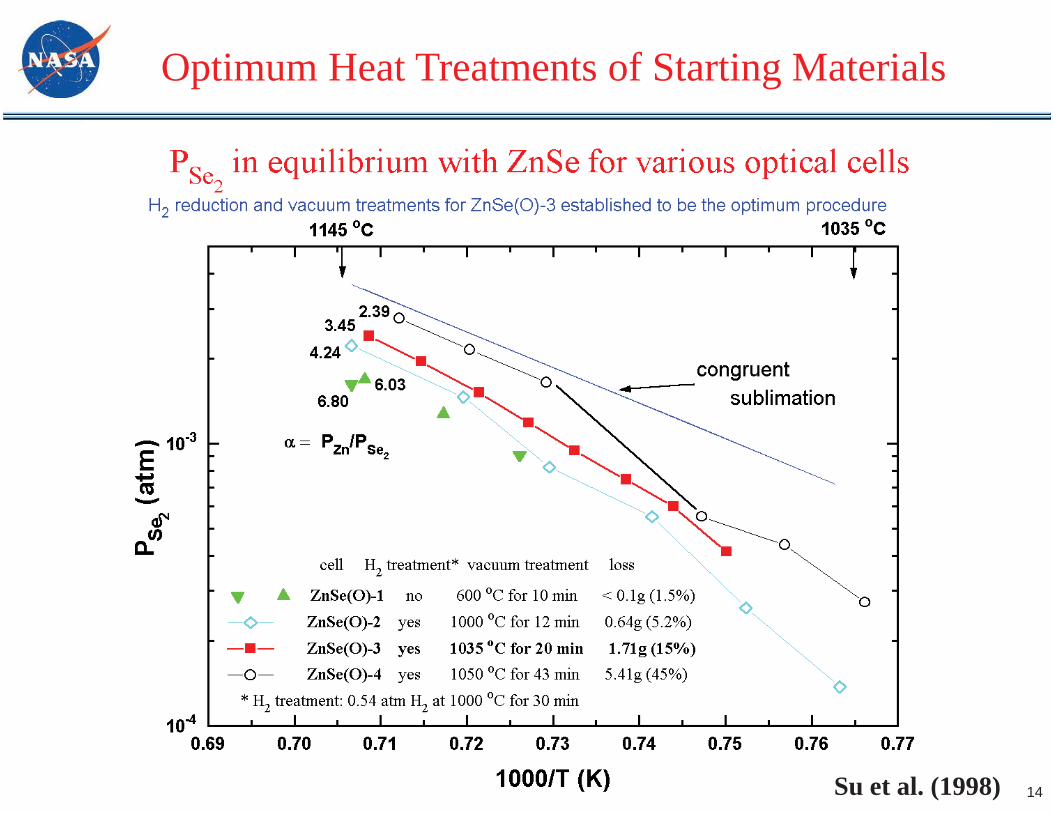
Optimum Heat Treatments of Starting Materials
Su et al. (1998)
15
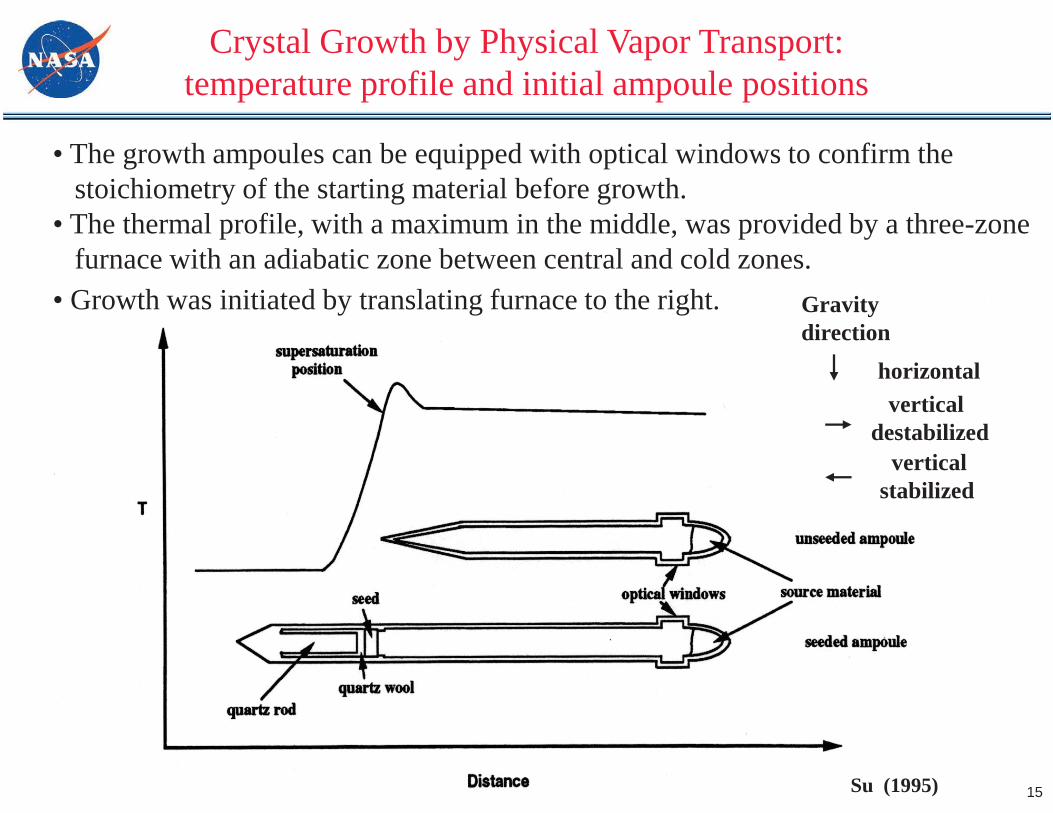
Crystal Growth by Physical Vapor Transport: temperature profile and initial ampoule positions
• The growth ampoules can be equipped with optical windows to confirm the stoichiometry of the starting material before growth.• The thermal profile, with a maximum in the middle, was provided by a three-zone
furnace with an adiabatic zone between central and cold zones.• Growth was initiated by translating furnace to the right.
Su (1995)
horizontalvertical
destabilizedvertical
stabilized
Gravitydirection
16
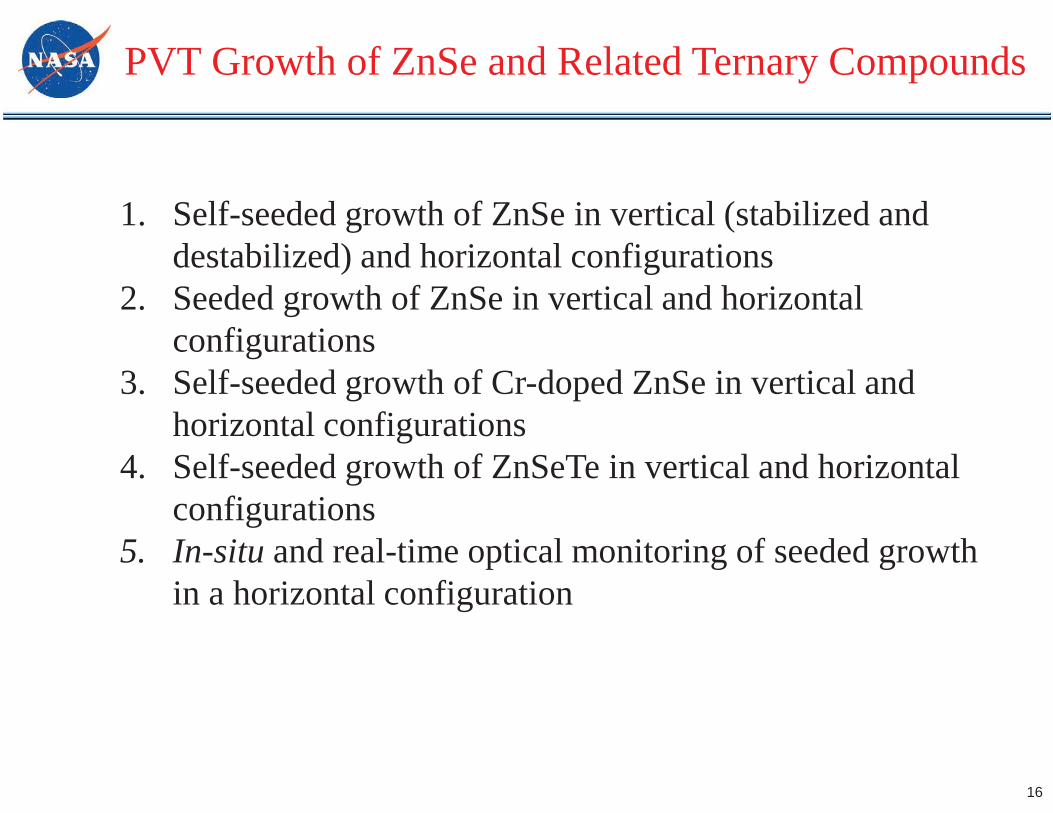
1. Self-seeded growth of ZnSe in vertical (stabilized and destabilized) and horizontal configurations
2. Seeded growth of ZnSe in vertical and horizontal configurations
3. Self-seeded growth of Cr-doped ZnSe in vertical and horizontal configurations
4. Self-seeded growth of ZnSeTe in vertical and horizontal configurations
5. In-situ and real-time optical monitoring of seeded growth in a horizontal configuration
PVT Growth of ZnSe and Related Ternary Compounds
17
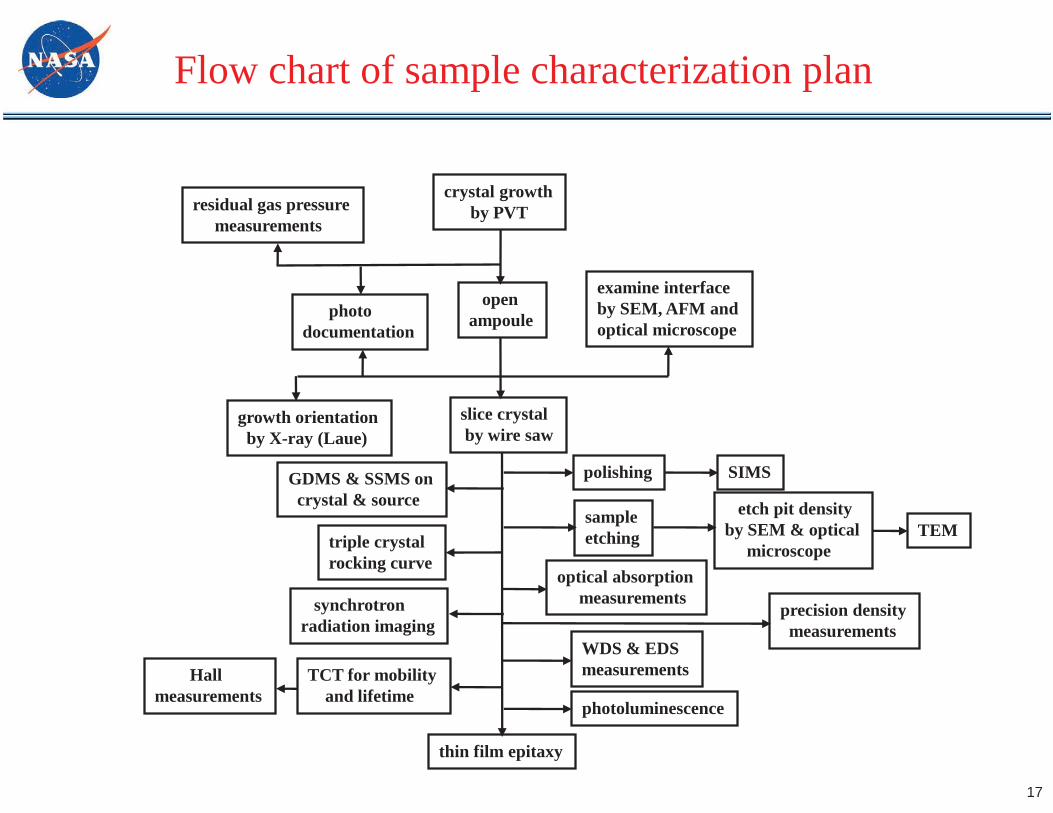
GDMS & SSMS oncrystal & source
precision densitymeasurements
thin film epitaxy
slice crystalby wire saw
triple crystalrocking curve
synchrotronradiation imaging
polishing SIMS
sampleetching
etch pit densityby SEM & optical
microscopeTEM
optical absorptionmeasurements
WDS & EDSmeasurements
photoluminescence
examine interface by SEM, AFM andoptical microscope
openampoule
growth orientationby X-ray (Laue)
crystal growthby PVT
photodocumentation
residual gas pressuremeasurements
TCT for mobilityand lifetime
Hallmeasurements
Flow chart of sample characterization plan
18
Effects were studied by comparing the following characteristics of horizontally and vertically grown ZnSe crystals in :
• Grown crystal morphology : contactless growth for the horizontal configuration.
• Surface morphology of the grown crystals was examined by SEM and AFM. (growth was terminated by stopping furnace translation, lowering the source temperature by 10 oC and then cooling the thermal profile at the same rate)
• Segregation and distribution of defects and impurities in the grown crystals was determined by photoluminescence, SIMS and precision density measurements.
Gravity Effects on the Grown Crystals
19
Gravity Effects on the Grown Crystals
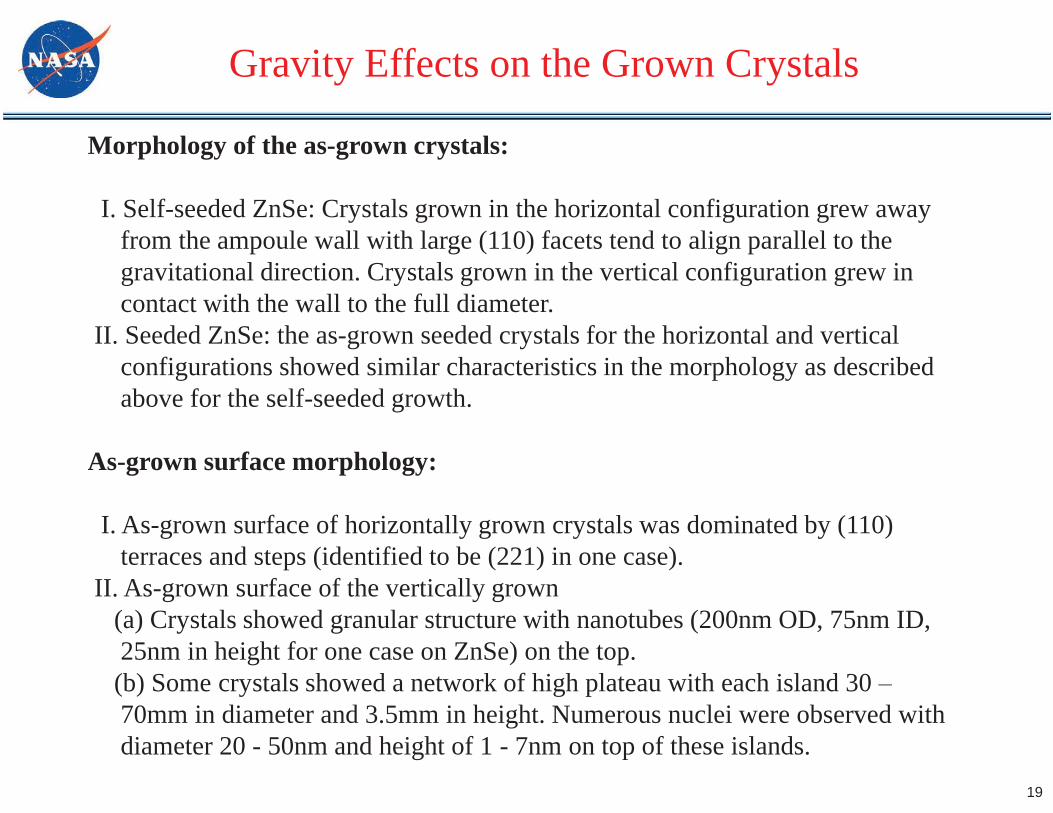
Morphology of the as-grown crystals:
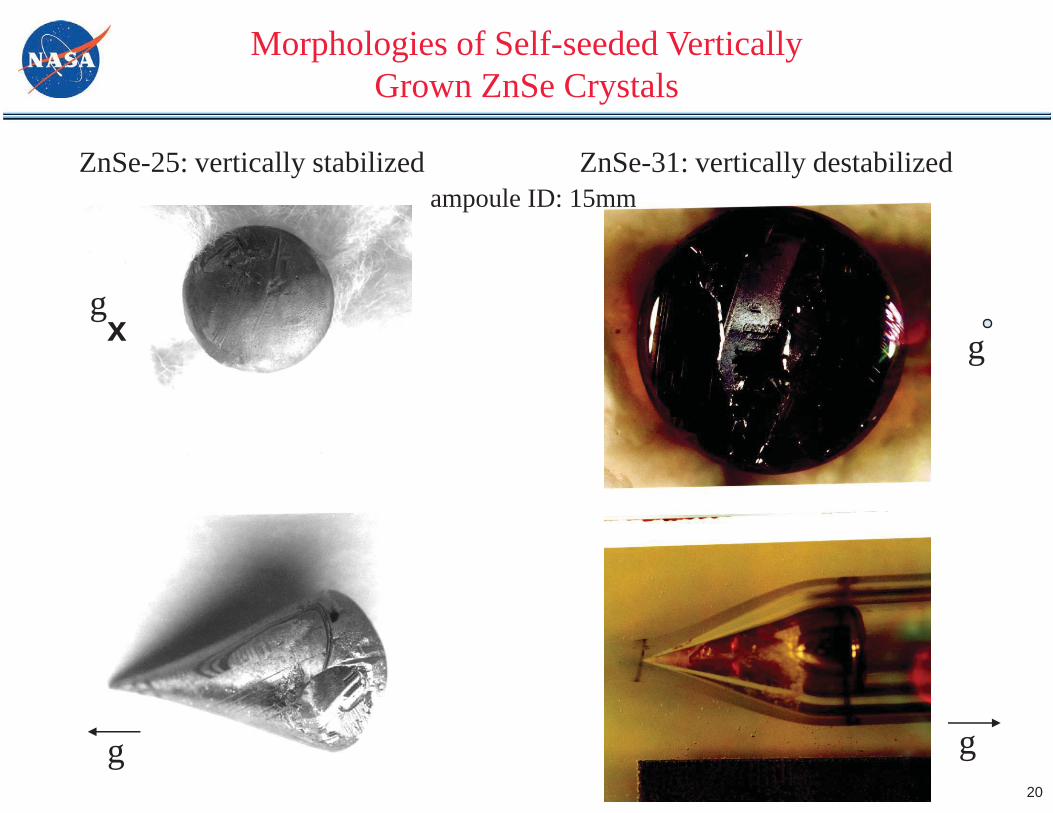
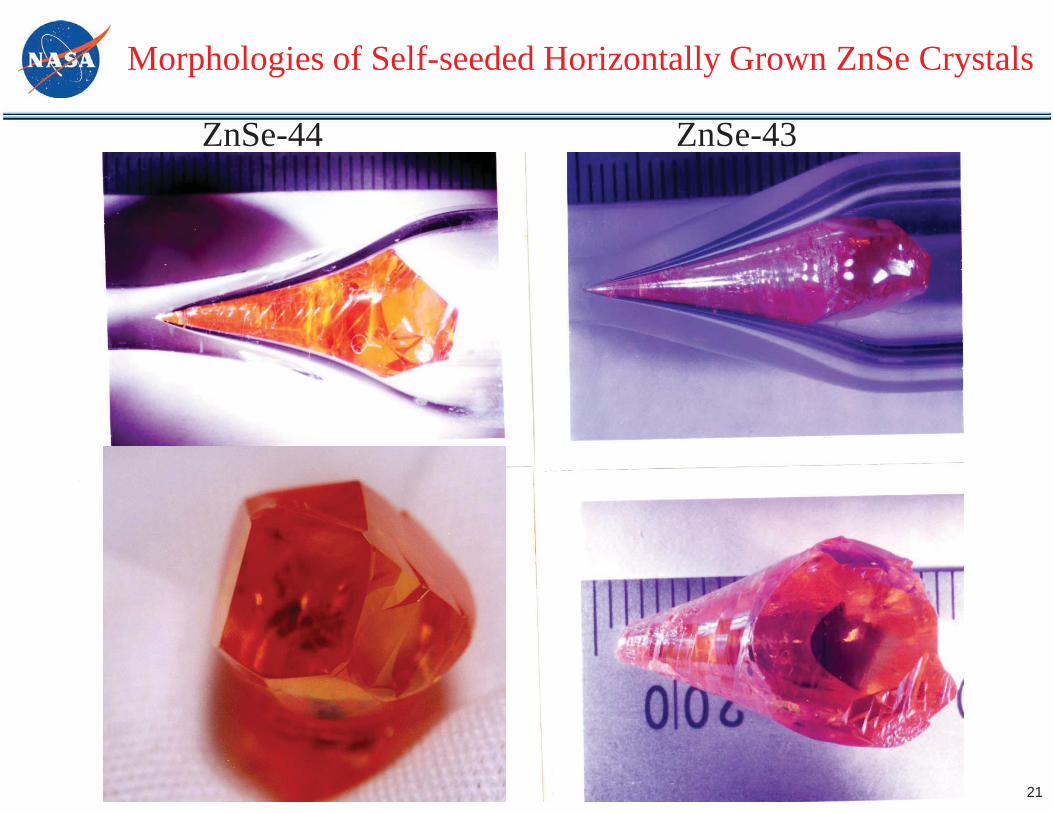
I. Self-seeded ZnSe: Crystals grown in the horizontal configuration grew away from the ampoule wall with large (110) facets tend to align parallel to the gravitational direction. Crystals grown in the vertical configuration grew in contact with the wall to the full diameter.
II. Seeded ZnSe: the as-grown seeded crystals for the horizontal and vertical configurations showed similar characteristics in the morphology as described above for the self-seeded growth.
As-grown surface morphology:
I. As-grown surface of horizontally grown crystals was dominated by (110) terraces and steps (identified to be (221) in one case).
II. As-grown surface of the vertically grown (a) Crystals showed granular structure with nanotubes (200nm OD, 75nm ID, 25nm in height for one case on ZnSe) on the top.(b) Some crystals showed a network of high plateau with each island 30 –70mm in diameter and 3.5mm in height. Numerous nuclei were observed with diameter 20 - 50nm and height of 1 - 7nm on top of these islands.
20
Morphologies of Self-seeded Vertically Grown ZnSe Crystals
ZnSe-25: vertically stabilized ZnSe-31: vertically destabilizedampoule ID: 15mm
xg
g
g g
21
ZnSe-44 ZnSe-43
Morphologies of Self-seeded Horizontally Grown ZnSe Crystals
22
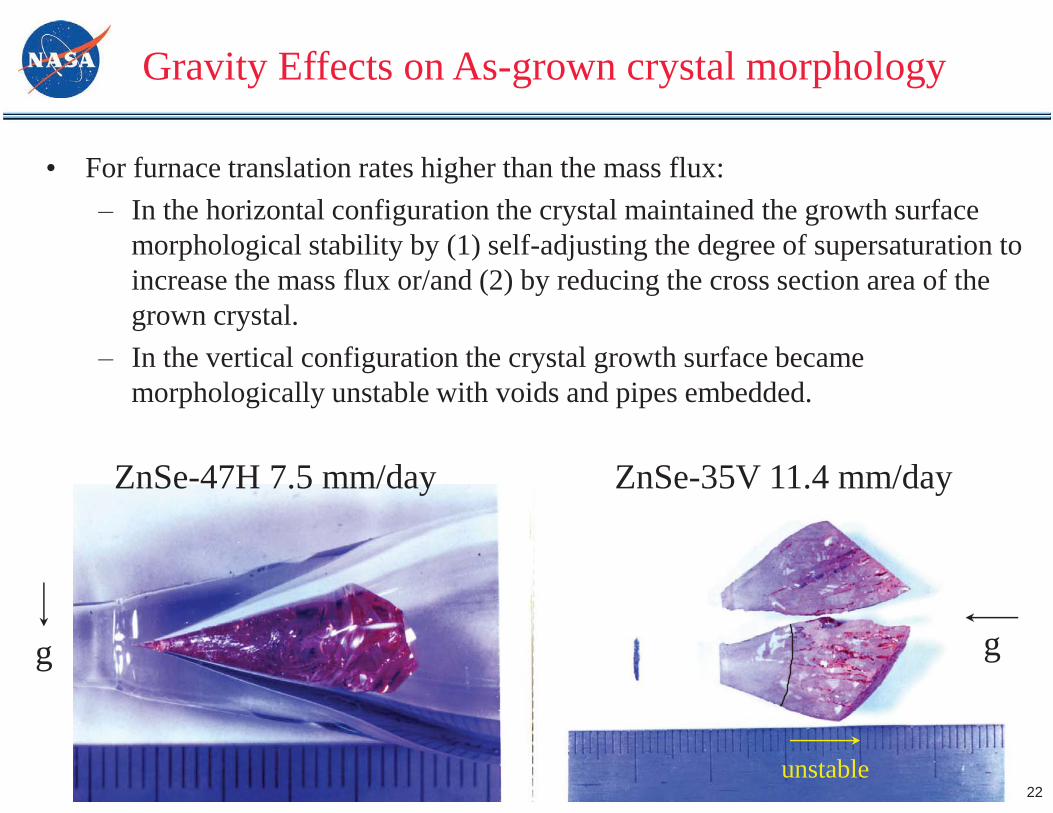
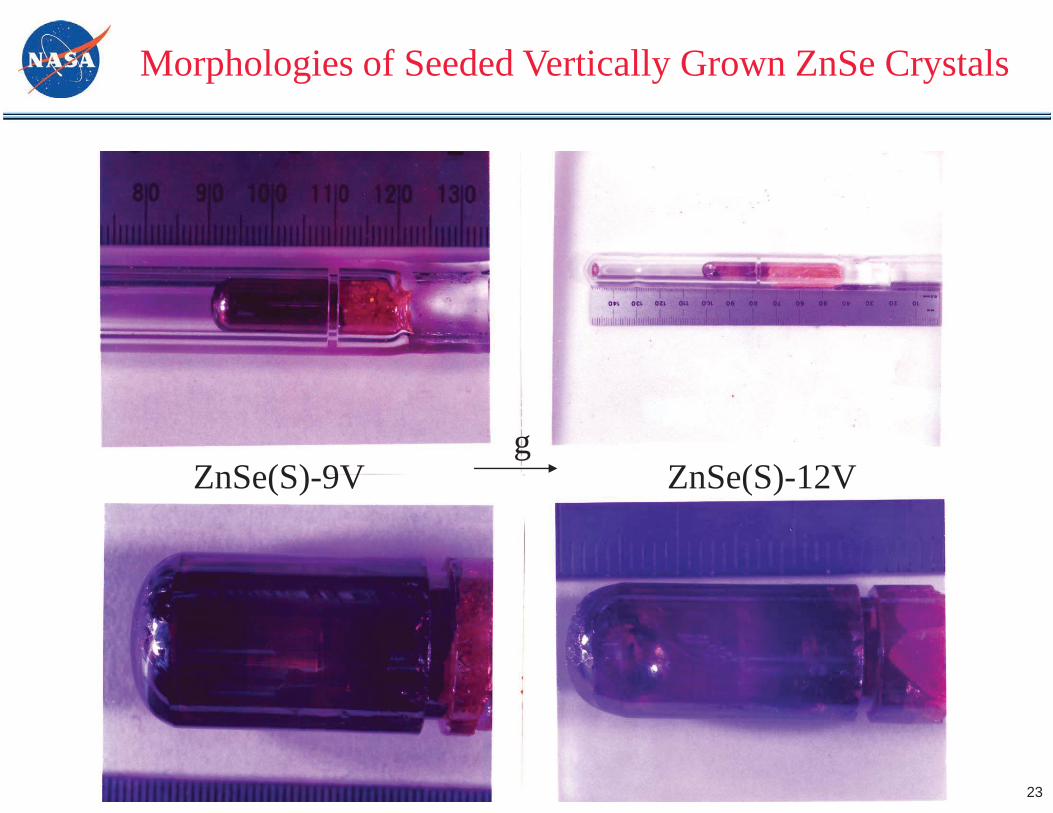
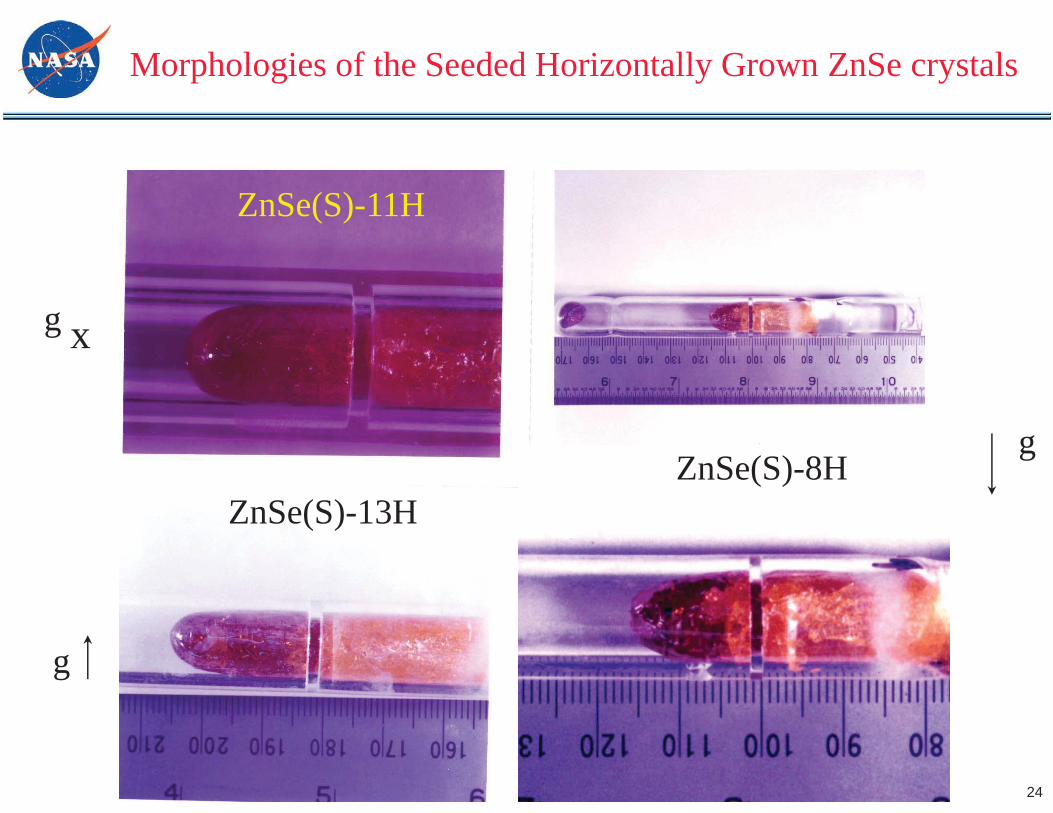
• For furnace translation rates higher than the mass flux:– In the horizontal configuration the crystal maintained the growth surface
morphological stability by (1) self-adjusting the degree of supersaturation to increase the mass flux or/and (2) by reducing the cross section area of the grown crystal.
– In the vertical configuration the crystal growth surface became morphologically unstable with voids and pipes embedded.
g
ZnSe-47H 7.5 mm/day ZnSe-35V 11.4 mm/day
unstable
Gravity Effects on As-grown crystal morphology
g
23
Morphologies of Seeded Vertically Grown ZnSe Crystals
ZnSe(S)-9V ZnSe(S)-12Vg
24
Morphologies of the Seeded Horizontally Grown ZnSe crystals
ZnSe(S)-8H
ZnSe(S)-11H
ZnSe(S)-13H
g
xg
g
25
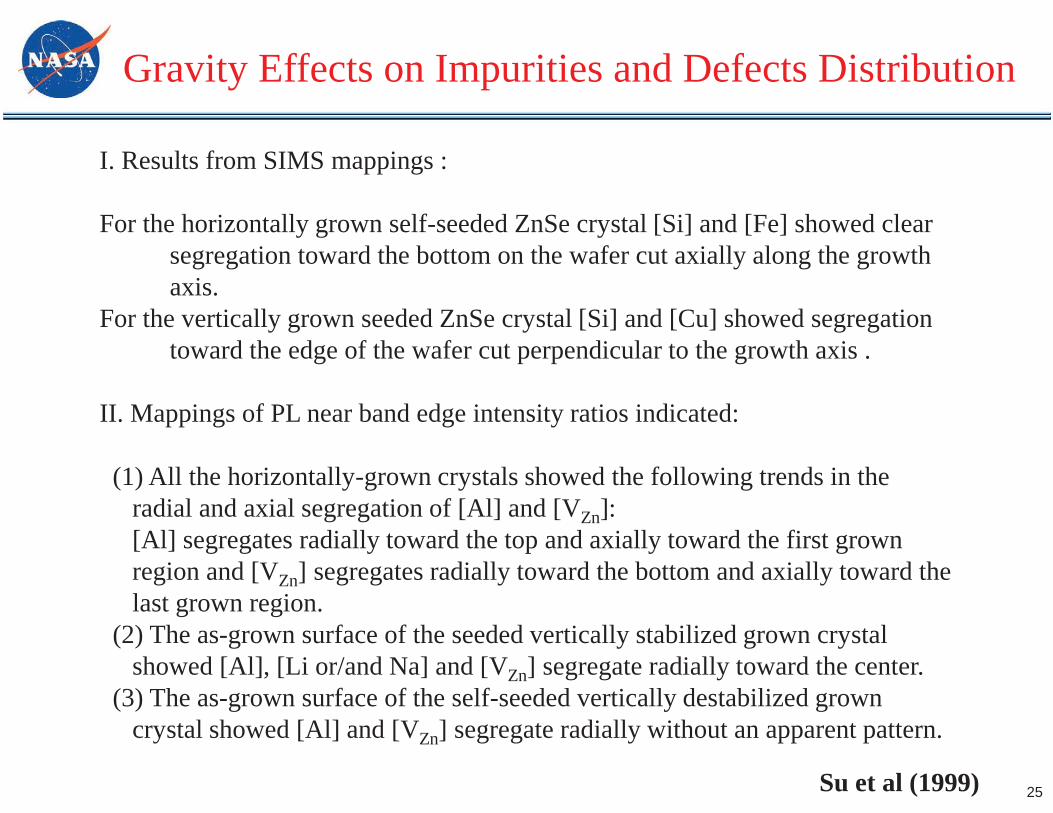
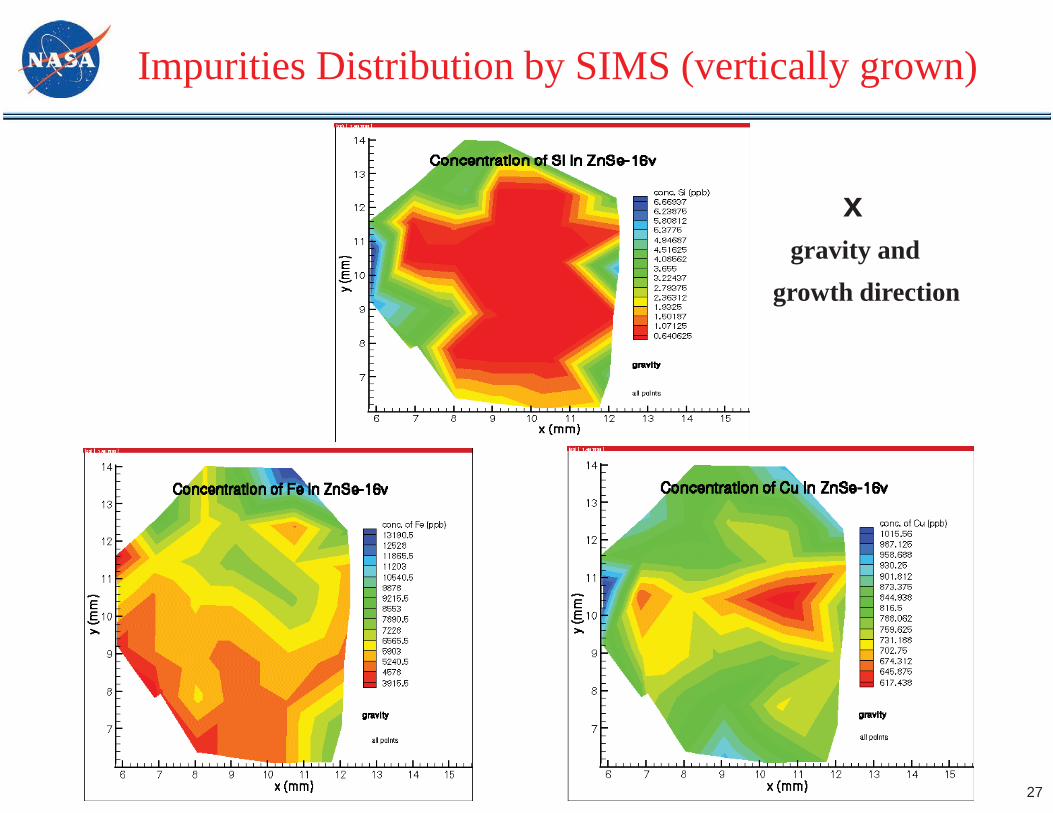
I. Results from SIMS mappings :
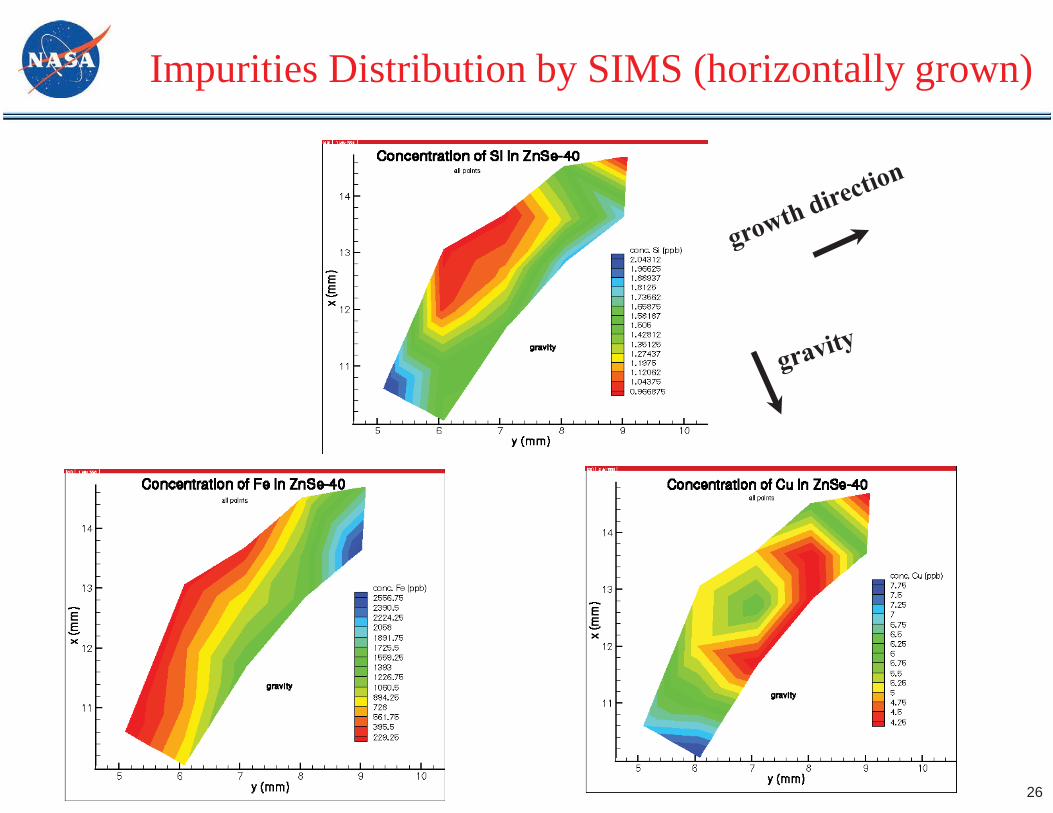
For the horizontally grown self-seeded ZnSe crystal [Si] and [Fe] showed clear segregation toward the bottom on the wafer cut axially along the growth axis.
For the vertically grown seeded ZnSe crystal [Si] and [Cu] showed segregation toward the edge of the wafer cut perpendicular to the growth axis .
II. Mappings of PL near band edge intensity ratios indicated:
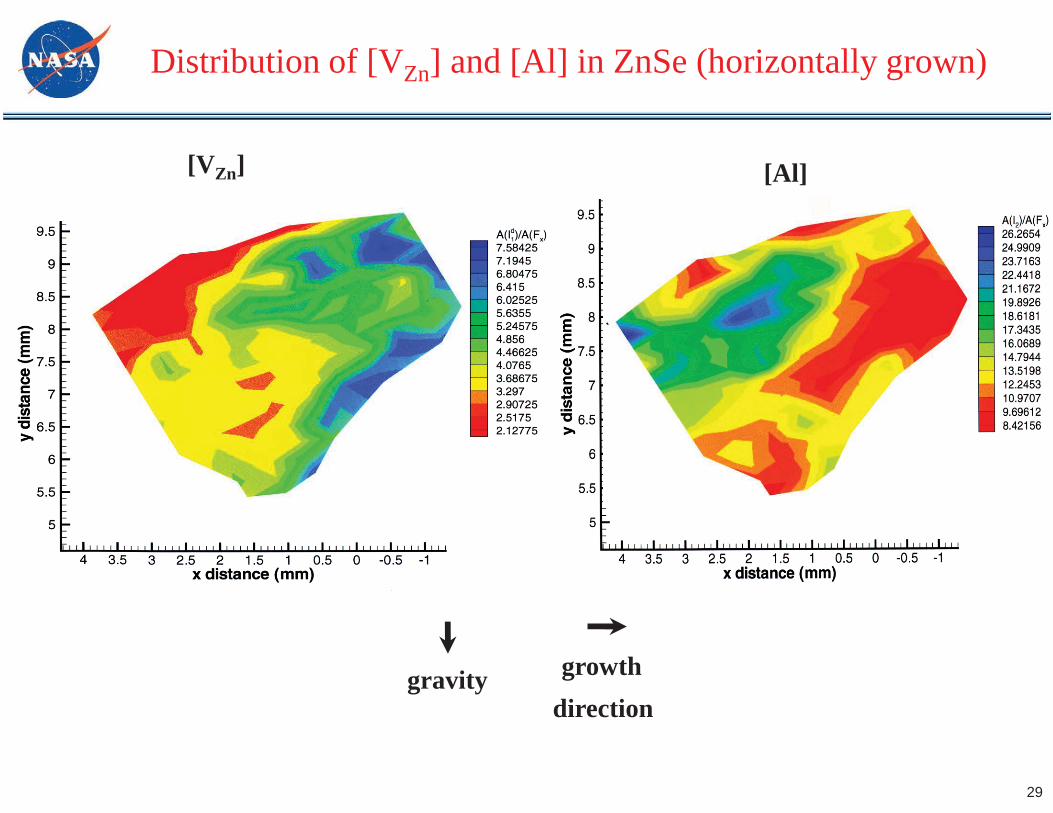
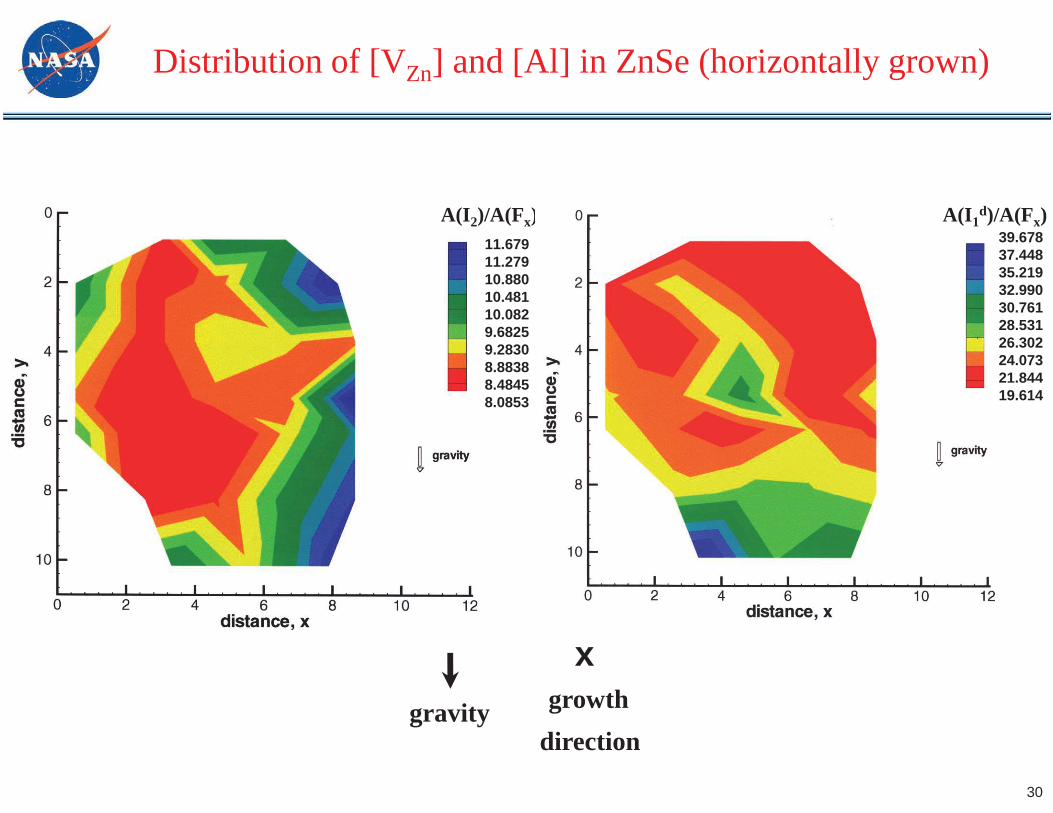
(1) All the horizontally-grown crystals showed the following trends in the radial and axial segregation of [Al] and [VZn]:[Al] segregates radially toward the top and axially toward the first grown region and [VZn] segregates radially toward the bottom and axially toward the last grown region.
(2) The as-grown surface of the seeded vertically stabilized grown crystal showed [Al], [Li or/and Na] and [VZn] segregate radially toward the center.
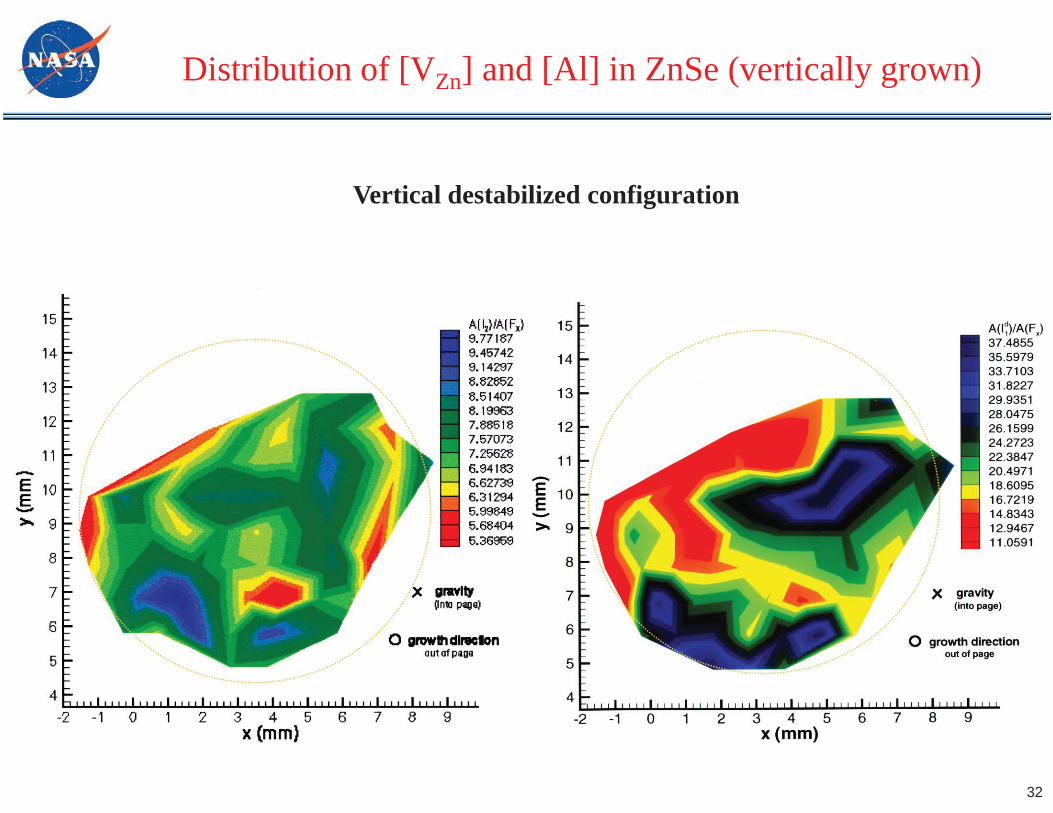
(3) The as-grown surface of the self-seeded vertically destabilized grown crystal showed [Al] and [VZn] segregate radially without an apparent pattern.
Gravity Effects on Impurities and Defects Distribution
Su et al (1999)
26
Impurities Distribution by SIMS (horizontally grown)
27
Impurities Distribution by SIMS (vertically grown)
xgravity and
growth direction
28
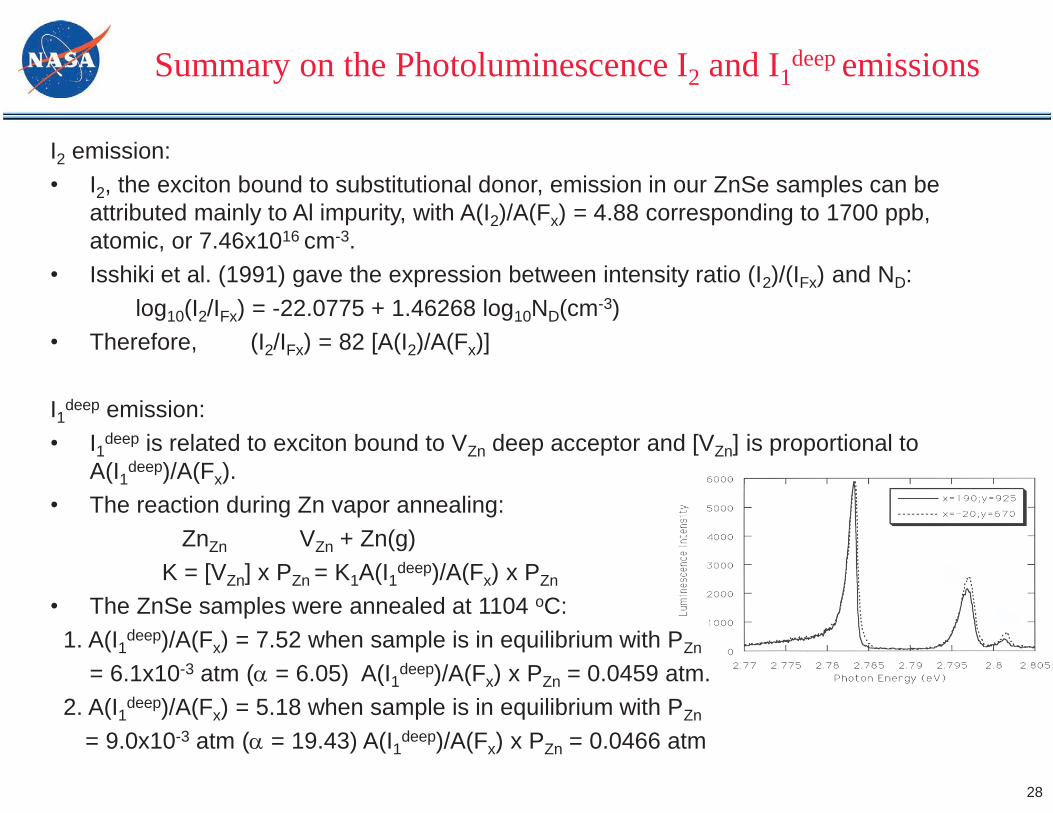
Summary on the Photoluminescence I2 and I1deep emissions
I2 emission:• I2, the exciton bound to substitutional donor, emission in our ZnSe samples can be
attributed mainly to Al impurity, with A(I2)/A(Fx) = 4.88 corresponding to 1700 ppb, atomic, or 7.46x1016 cm-3.
• Isshiki et al. (1991) gave the expression between intensity ratio (I2)/(IFx) and ND:log10(I2/IFx) = -22.0775 + 1.46268 log10ND(cm-3)
• Therefore, (I2/IFx) = 82 [A(I2)/A(Fx)]
I1deep emission:• I1deep is related to exciton bound to VZn deep acceptor and [VZn] is proportional to
A(I1deep)/A(Fx).• The reaction during Zn vapor annealing:
ZnZn VZn + Zn(g)K = [VZn] x PZn = K1A(I1deep)/A(Fx) x PZn
• The ZnSe samples were annealed at 1104 oC:1. A(I1deep)/A(Fx) = 7.52 when sample is in equilibrium with PZn
= 6.1x10⁻³ atm ( = 6.05) A(I1deep)/A(Fx) x PZn = 0.0459 atm.2. A(I1deep)/A(Fx) = 5.18 when sample is in equilibrium with PZn
= 9.0x10⁻³ atm ( = 19.43) A(I1deep)/A(Fx) x PZn = 0.0466 atm
29
gravity growthdirection
[VZn] [Al]
Distribution of [VZn] and [Al] in ZnSe (horizontally grown)
30
A(I2)/A(Fx)11.679 11.27910.880 10.48110.082 9.68259.2830 8.8838 8.4845 8.0853
39.67837.44835.21932.99030.76128.53126.30224.07321.84419.614
A(I1d)/A(Fx)
gravity
xgrowth
direction
Distribution of [VZn] and [Al] in ZnSe (horizontally grown)
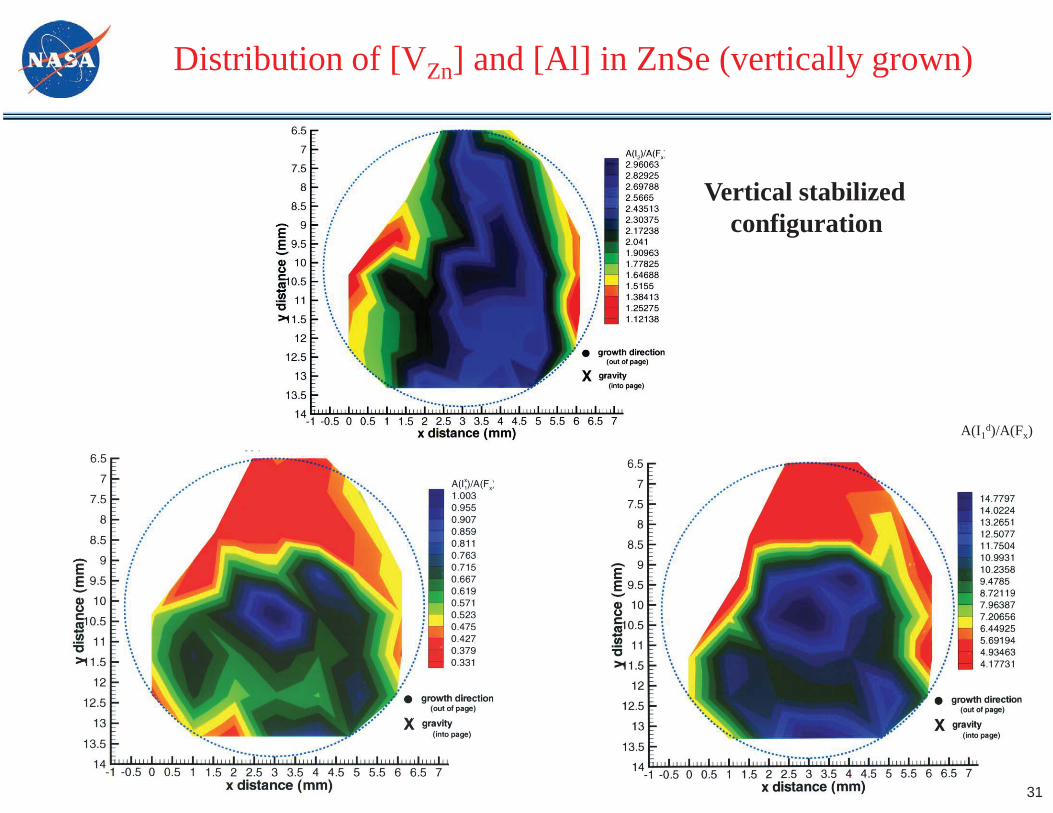
31
Vertical stabilizedconfiguration
A(I1d)/A(Fx)
Distribution of [VZn] and [Al] in ZnSe (vertically grown)
32
Distribution of [VZn] and [Al] in ZnSe (vertically grown)
Vertical destabilized configuration
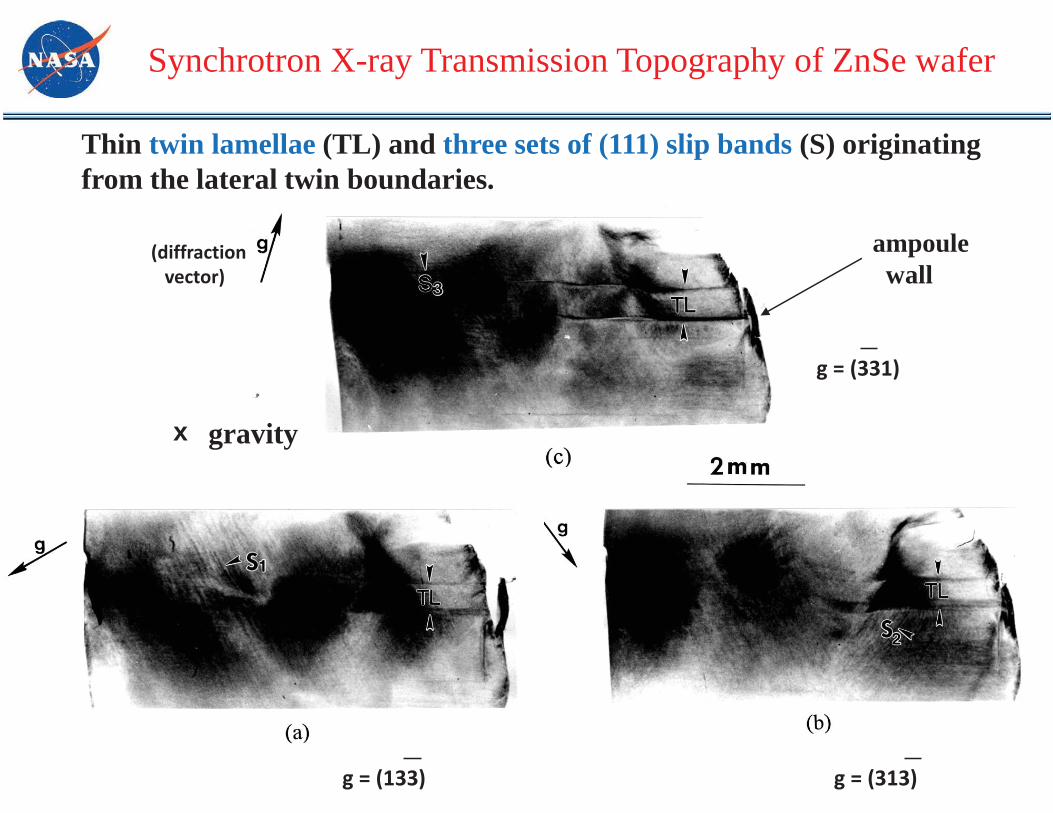
Thin twin lamellae (TL) and three sets of (111) slip bands (S) originating from the lateral twin boundaries.
g = (313)g = (133)
g = (331)
(diffractionvector)
Synchrotron X-ray Transmission Topography of ZnSe wafer
ampoulewall
x gravity
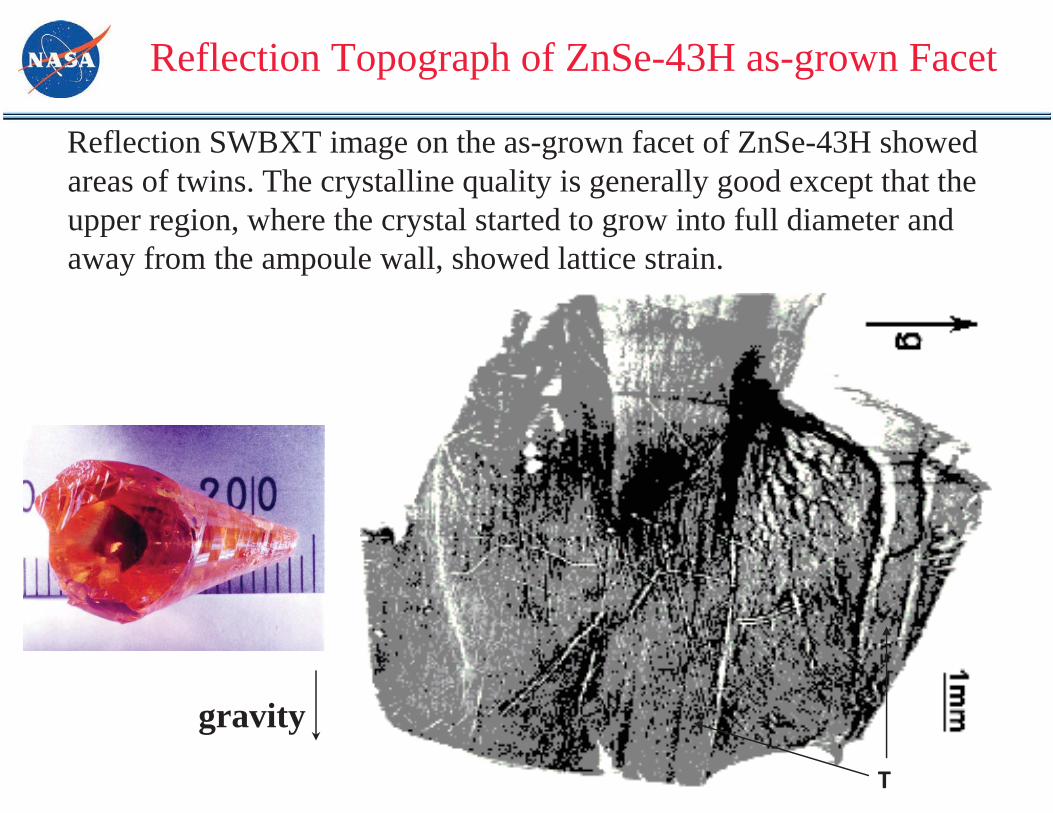
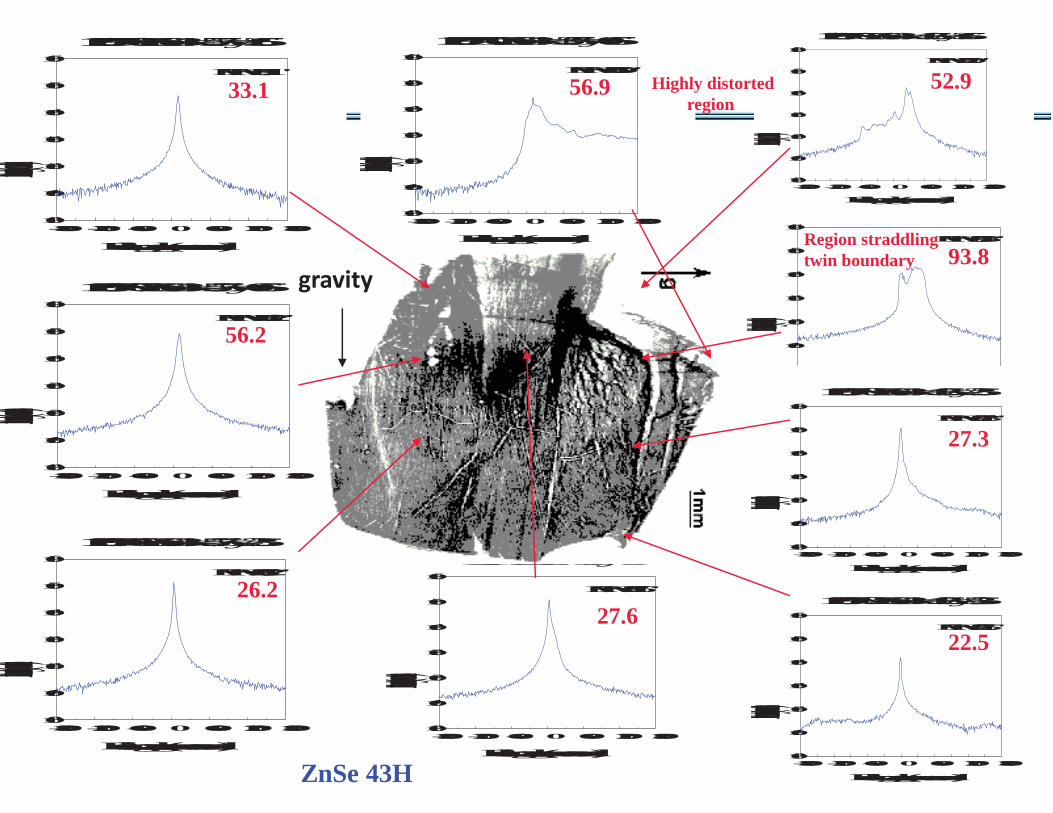
Reflection Topograph of ZnSe-43H as-grown Facet
Reflection SWBXT image on the as-grown facet of ZnSe-43H showed areas of twins. The crystalline quality is generally good except that the upper region, where the crystal started to grow into full diameter and away from the ampoule wall, showed lattice strain.
gravity
T
112097.X04 ZnSe-43 x=+1.25/y=+0.65
Rocking angle (arcseconds)-1800-1200-600 0 600 12001800
Intensity (counts)
100
101
102
103
104
105
106
FWHM = 93.8"
112097.X05 ZnSe-43 x=+1.25/y=+3.65
Rocking angle (arcseconds)-1800-1200-600 0 600 12001800
Intensity (counts)
100
101
102
103
104
105
106
FWHM = 52.9"
112097.X10 ZnSe-43 x=+3.75/y=+0.65
Rocking angle (arcseconds)
-1800-1200-600 0 600 12001800
Intensity (counts)
100
101
102
103
104
105
106
FWHM = 56.9"
112097.X03 ZnSe-43 x=+1.25/y=-2.35
Rocking angle (arcseconds)-1800-1200-600 0 600 12001800
Intensity (counts)
100
101
102
103
104
105
106
FWHM = 27.3"
112097.X02 ZnSe-43 x=+1.25/y=-5.35
Rocking angle (arcseconds)-1800-1200-600 0 600 12001800
Intensity (counts)100
101
102
103
104
105
106
FWHM = 22.5"
112097.X06 ZnSe-43 x=-5.75/y=-2.35
Rocking angle (arcseconds)
-1800-1200-600 0 600 12001800
Intensity (counts)
100
101
102
103
104
105
106
FWHM = 26.2"
112097.X07 ZnSe-43 x=-5.75/y=+0.65
Rocking angle (arcseconds)
-1800-1200-600 0 600 12001800
Intensity (counts)
100
101
102
103
104
105
106
FWHM = 56.2"
112097.X08 ZnSe-43 x=-5.75/y=+2.65
Rocking angle (arcseconds)
-1800-1200-600 0 600 12001800
Intensity (counts)
100
101
102
103
104
105
106
FWHM = 33.1"
112097.X09 ZnSe-43 x=-2.25/y=+0.65
Rocking angle (arcseconds)
-1800-1200-600 0 600 12001800
Intensity (counts)
100
101
102
103
104
105
106
FWHM = 27.6"
33.1
56.2
26.227.6
22.5
27.3
52.9
93.8Region straddlingtwin boundary
Highly distortedregion
gravity
56.9
ZnSe 43H
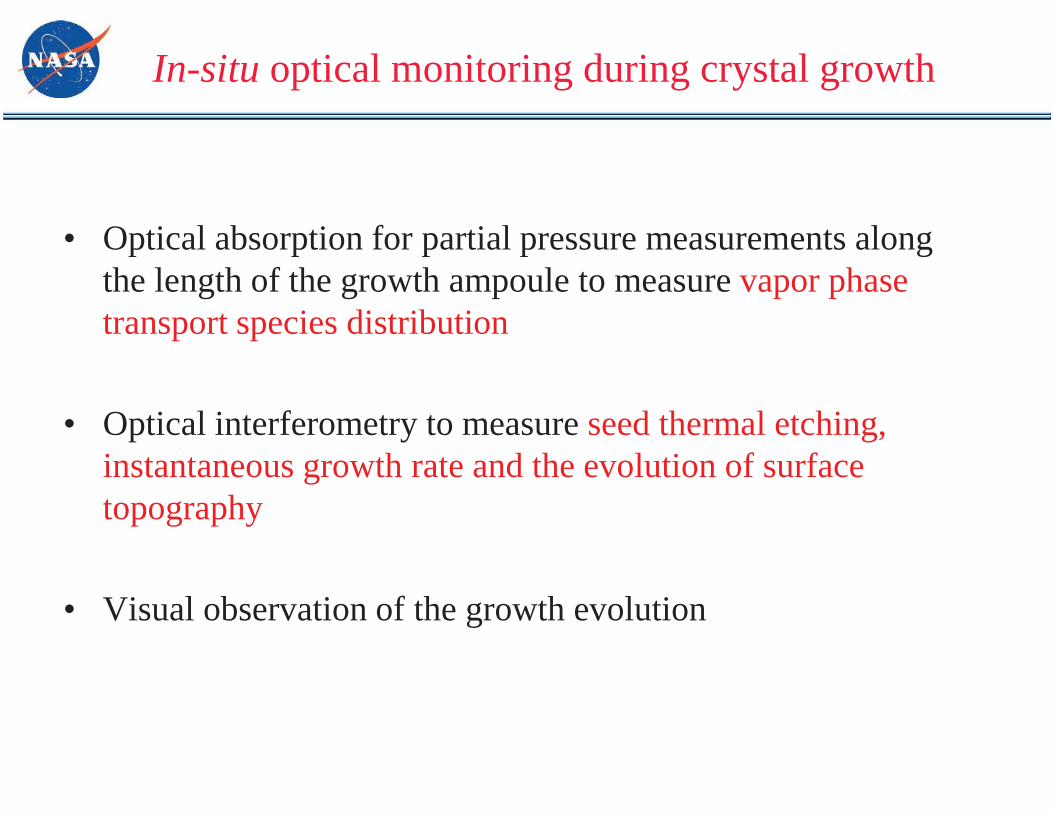
In-situ optical monitoring during crystal growth
• Optical absorption for partial pressure measurements along the length of the growth ampoule to measure vapor phase transport species distribution
• Optical interferometry to measure seed thermal etching, instantaneous growth rate and the evolution of surface topography
• Visual observation of the growth evolution
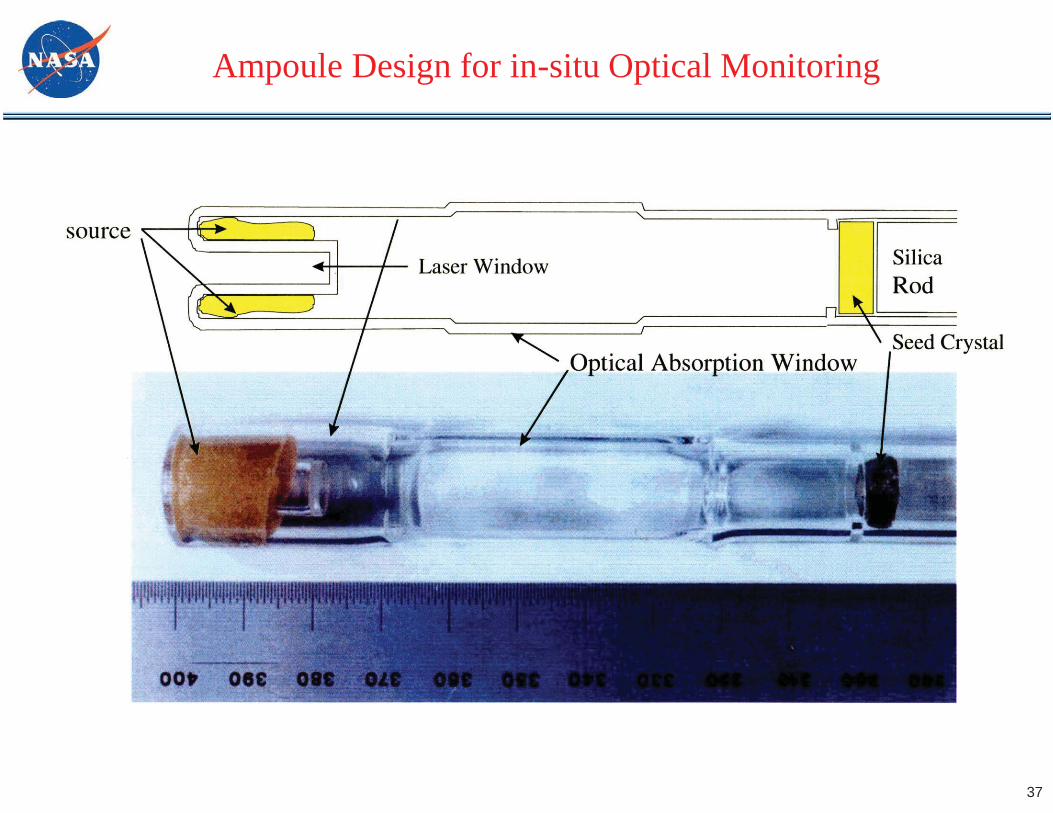
Ampoule Design for in-situ Optical Monitoring
37
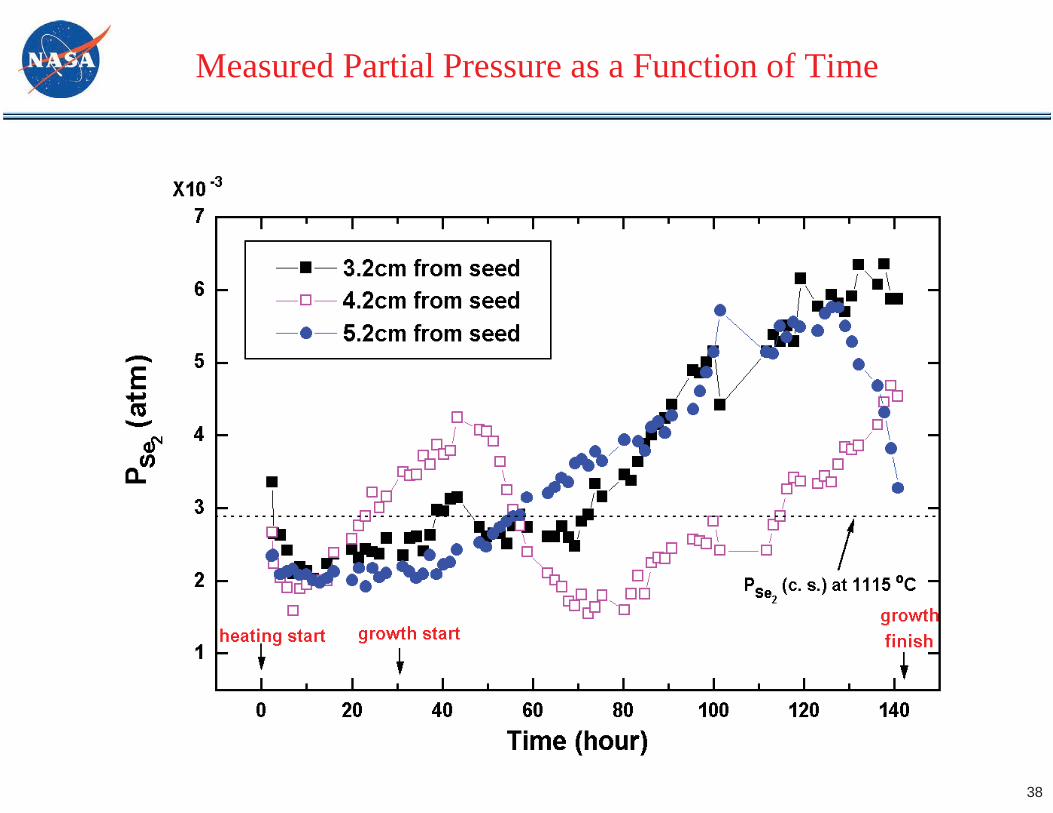
Measured Partial Pressure as a Function of Time
38
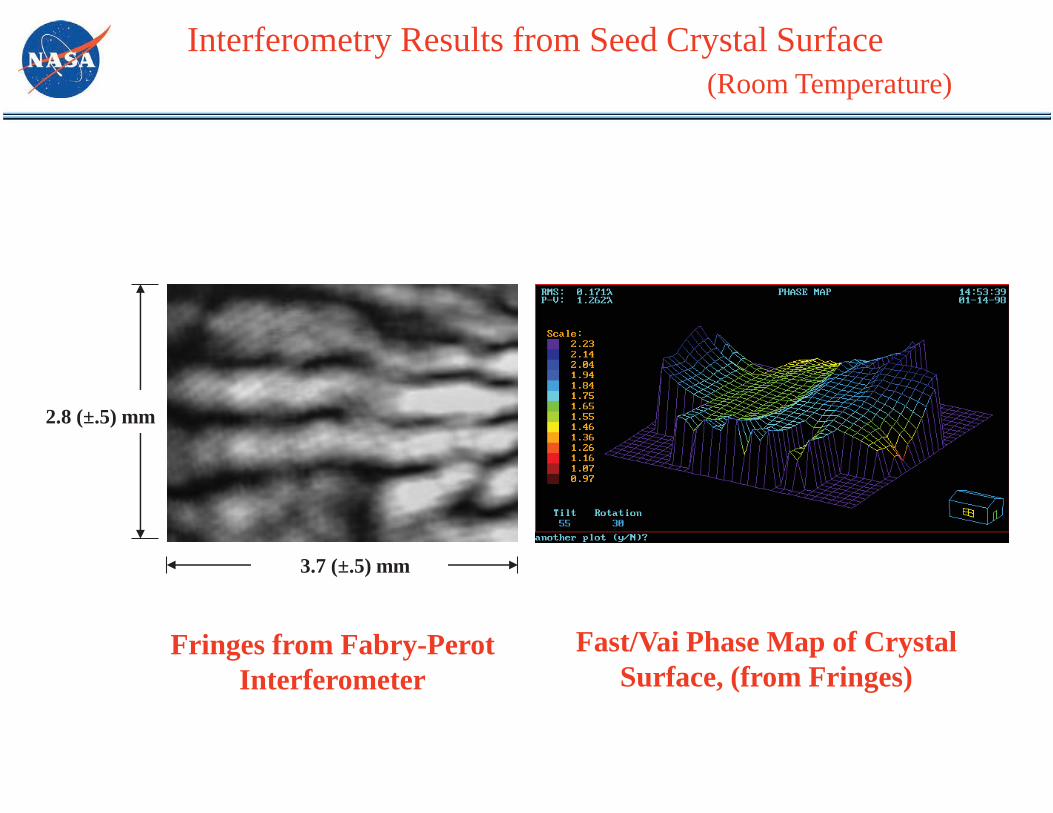
Fringes from Fabry-PerotInterferometer
Fast/Vai Phase Map of CrystalSurface, (from Fringes)
Interferometry Results from Seed Crystal Surface (Room Temperature)
3.7 (±.5) mm
2.8 (±.5) mm
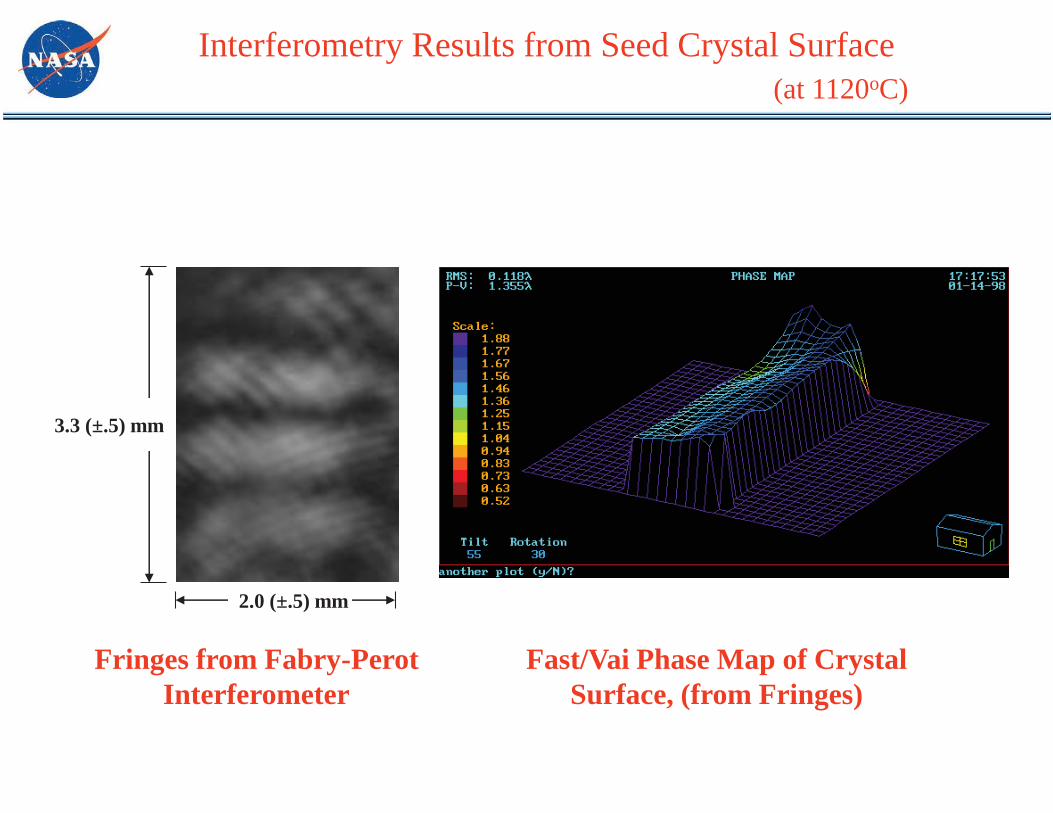
Fringes from Fabry-PerotInterferometer
Fast/Vai Phase Map of CrystalSurface, (from Fringes)
2.0 (±.5) mm
3.3 (±.5) mm
Interferometry Results from Seed Crystal Surface (at 1120oC)
41
0 1000 2000 3000 4000 5000
0
200
400
600
800
1000
1200
0.004
0
0.008
0.012
0.016
0.020
0.024
Expansion (mm
)
Temperature Expansion
T (o C)
Time (sec)
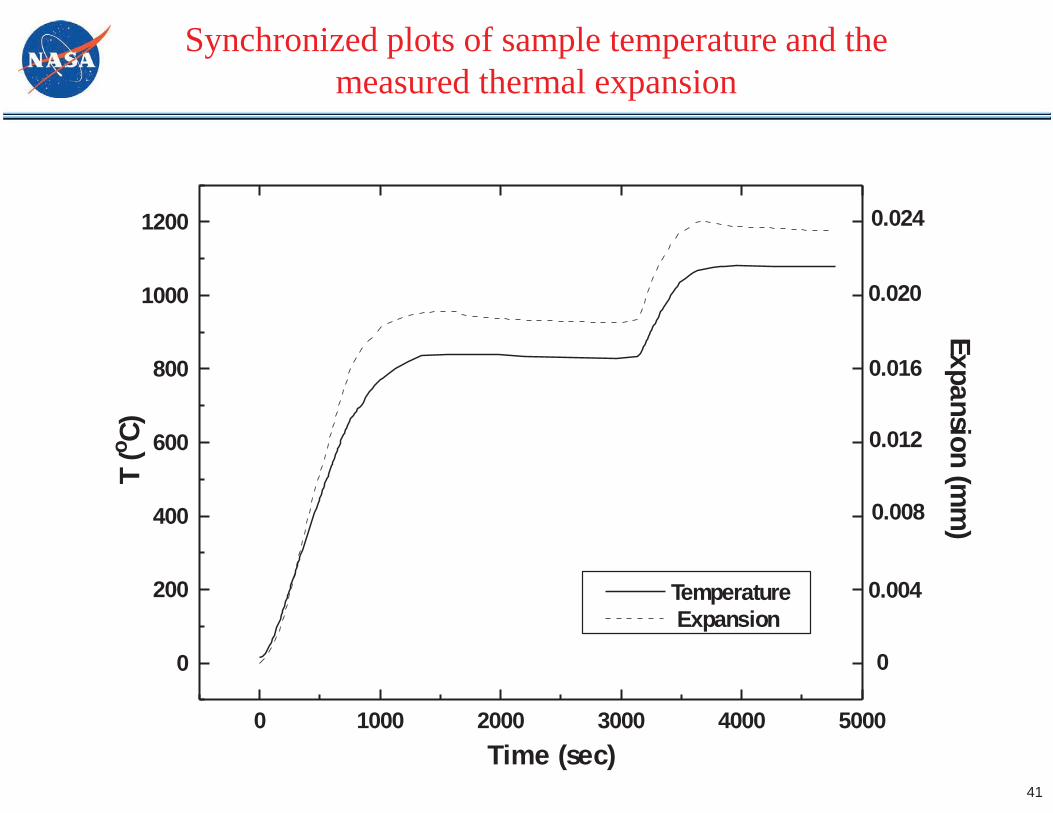
Synchronized plots of sample temperature and the measured thermal expansion
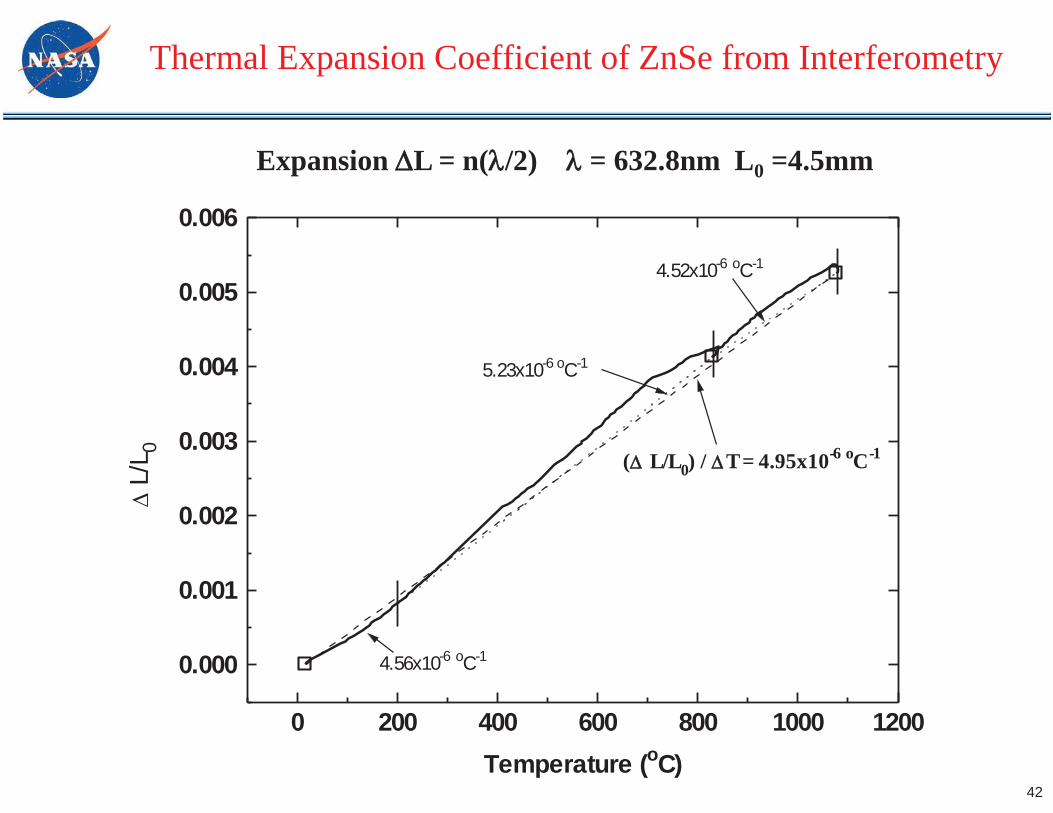
Thermal Expansion Coefficient of ZnSe from Interferometry
42
0 200 400 600 800 1000 1200
0.000
0.001
0.002
0.003
0.004
0.005
0.006
4.52x10⁻⁶ oC-1
5.23x10⁻⁶ oC-1
4.56x10⁻⁶ oC-1
( L/L0) / T = 4.95x10⁻⁶ oC-1
L/L
0
Temperature (oC)
Expansion L = n( /2) = 632.8nm L0 =4.5mm
43
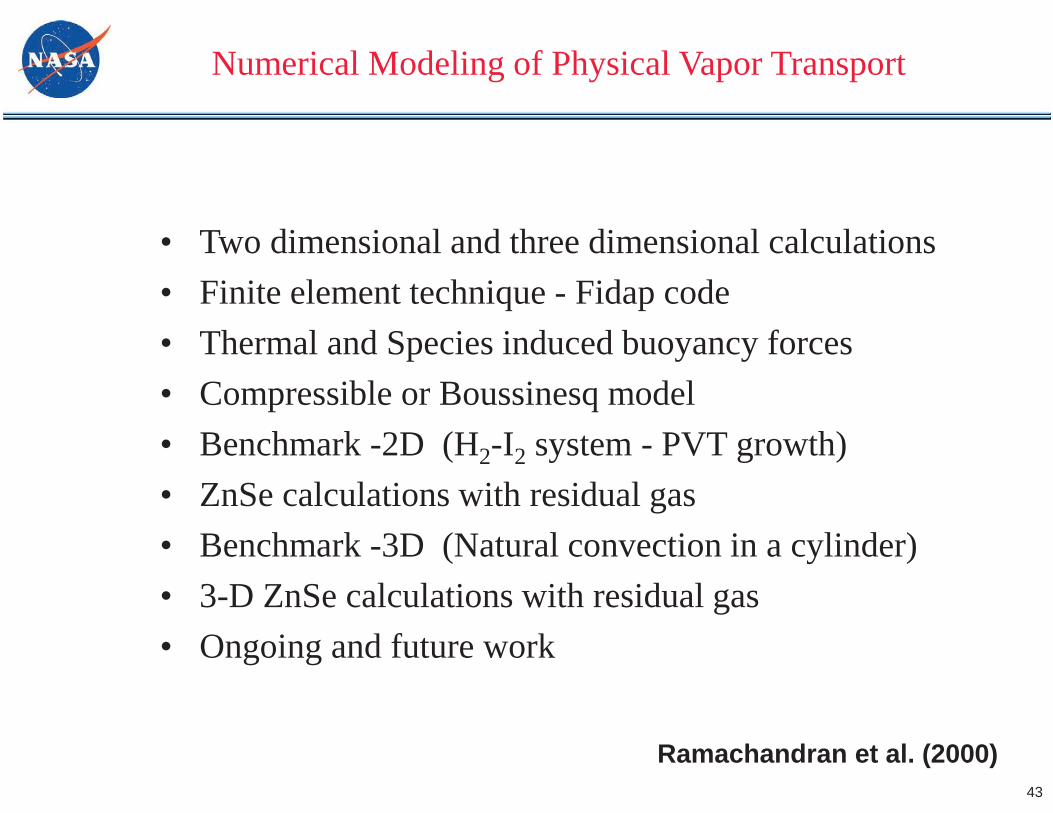
Numerical Modeling of Physical Vapor Transport
• Two dimensional and three dimensional calculations• Finite element technique - Fidap code• Thermal and Species induced buoyancy forces• Compressible or Boussinesq model• Benchmark -2D (H2-I2 system - PVT growth)• ZnSe calculations with residual gas• Benchmark -3D (Natural convection in a cylinder)• 3-D ZnSe calculations with residual gas• Ongoing and future work
Ramachandran et al. (2000)
44
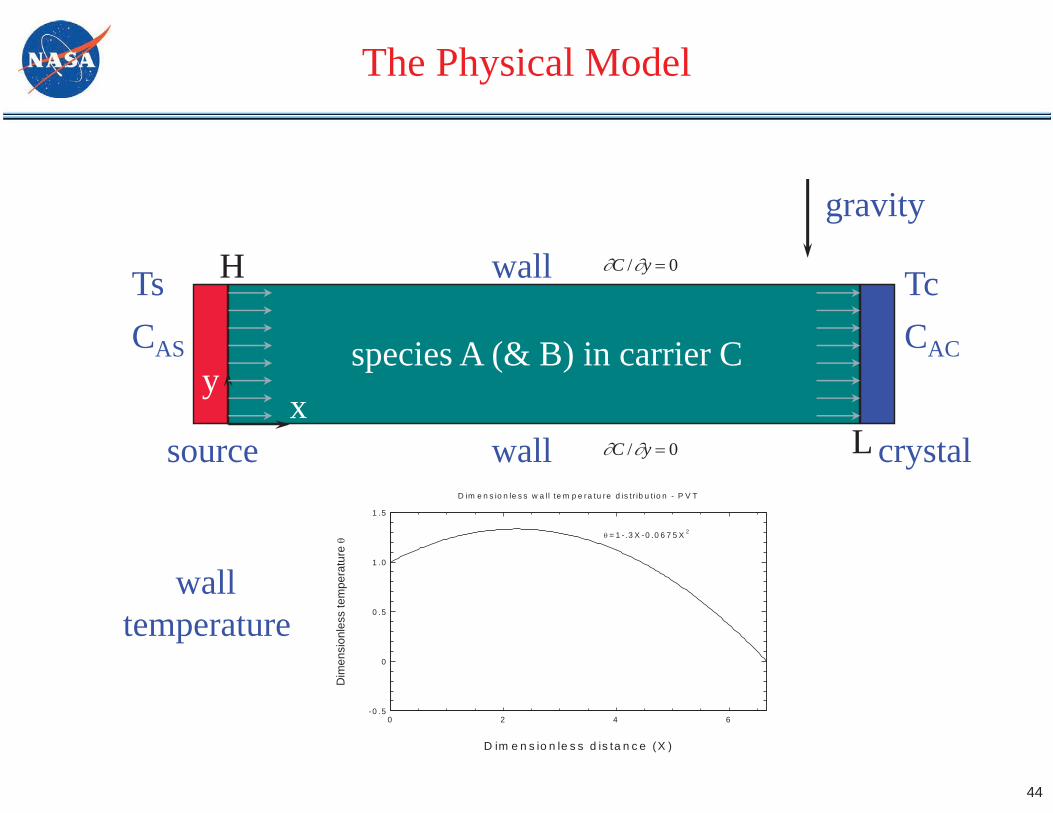
The Physical Model
source crystalx
y
gravity
species A (& B) in carrier C
wall
wallTs TcCAS CAC
0/ yC
0/ yC L
H
-0 .5
0
0 .5
1 .0
1 .5
0 2 4 6
= 1 - .3 X -0 .0 6 7 5 X 2
D im e n s io n le s s d is ta n c e (X )
Dim
ensi
onle
ss te
mpe
ratu
re
D im e n s io n le s s w a ll te m p e ra tu re d is tr ib u t io n - P V T
walltemperature
45
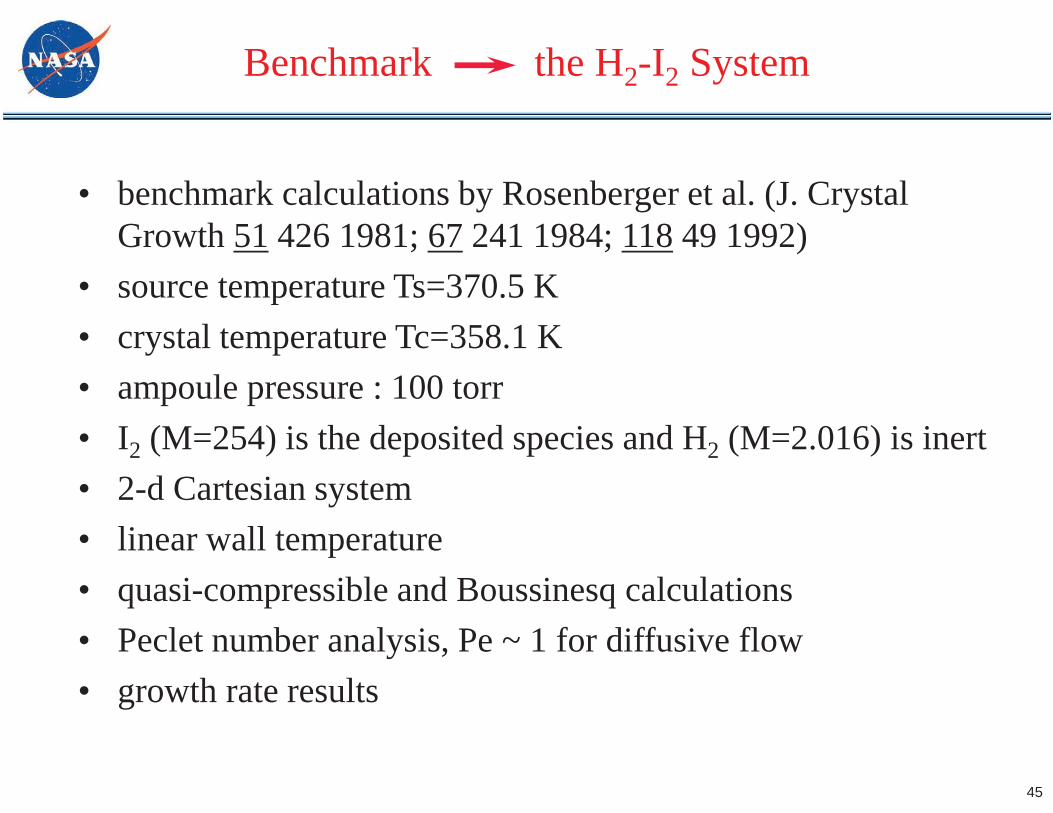
Benchmark the H2-I2 System
• benchmark calculations by Rosenberger et al. (J. Crystal Growth 51 426 1981; 67 241 1984; 118 49 1992)
• source temperature Ts=370.5 K• crystal temperature Tc=358.1 K• ampoule pressure : 100 torr• I2 (M=254) is the deposited species and H2 (M=2.016) is inert• 2-d Cartesian system• linear wall temperature• quasi-compressible and Boussinesq calculations• Peclet number analysis, Pe ~ 1 for diffusive flow• growth rate results
46
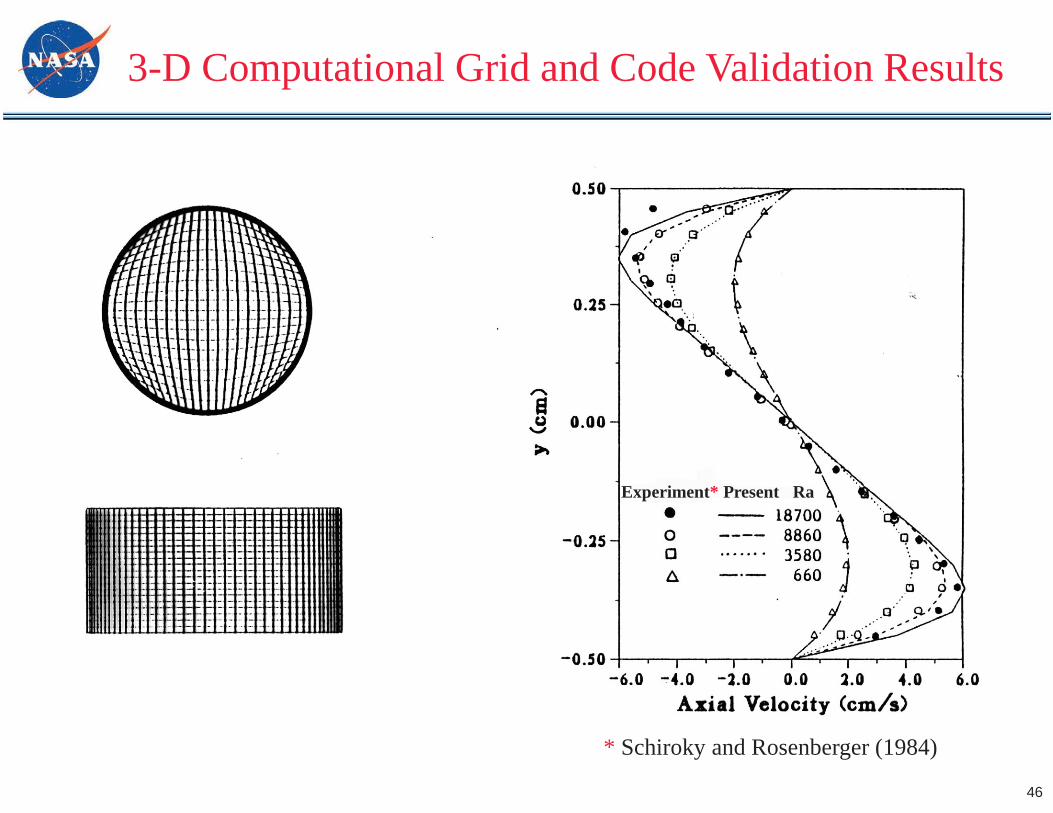
3-D Computational Grid and Code Validation Results
Experiment* Present Ra
* Schiroky and Rosenberger (1984)
47
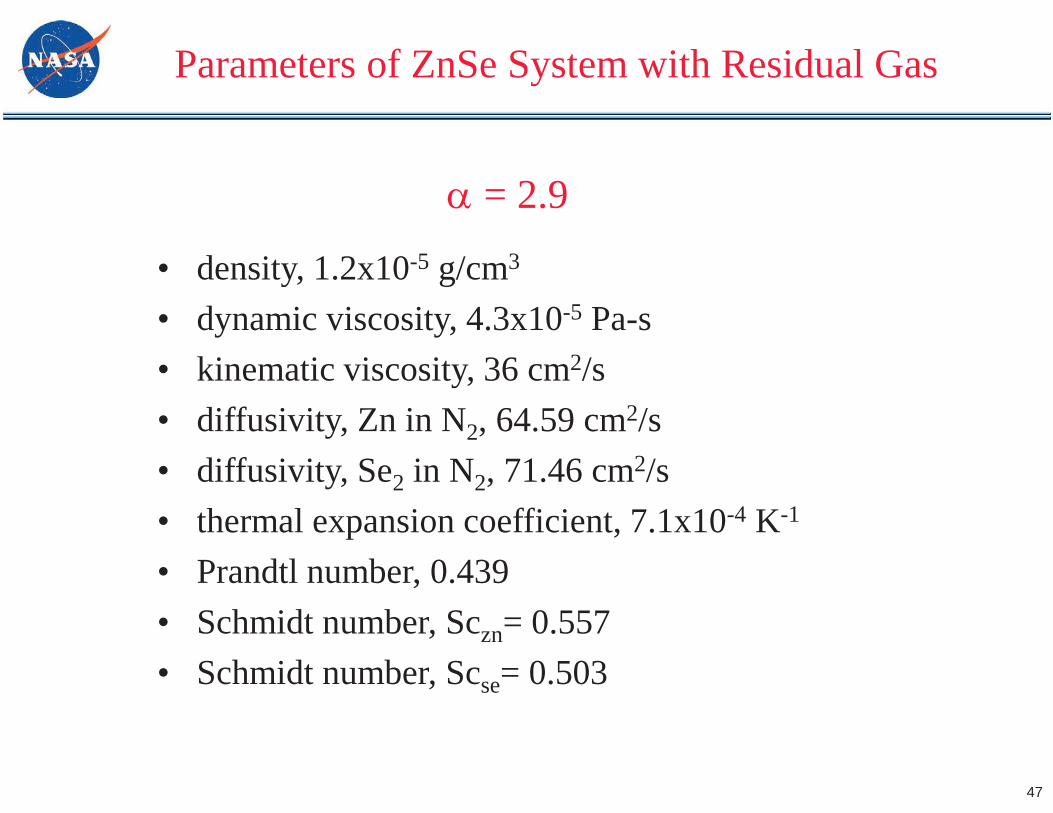
Parameters of ZnSe System with Residual Gas
• density, 1.2x10⁻⁵ g/cm3
• dynamic viscosity, 4.3x10⁻⁵ Pa-s• kinematic viscosity, 36 cm2/s• diffusivity, Zn in N2, 64.59 cm2/s• diffusivity, Se2 in N2, 71.46 cm2/s• thermal expansion coefficient, 7.1x10⁻⁴ K-1
• Prandtl number, 0.439• Schmidt number, Sczn= 0.557• Schmidt number, Scse= 0.503
= 2.9
48
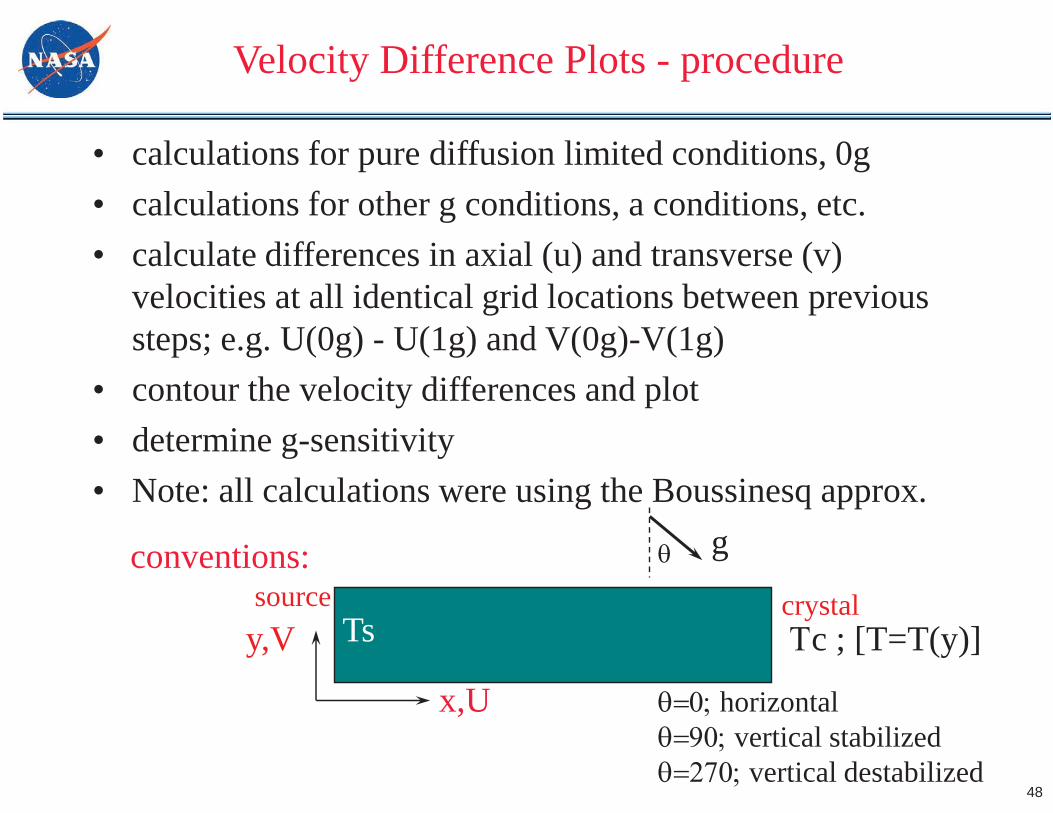
Velocity Difference Plots - procedure
• calculations for pure diffusion limited conditions, 0g• calculations for other g conditions, a conditions, etc.• calculate differences in axial (u) and transverse (v)
velocities at all identical grid locations between previous steps; e.g. U(0g) - U(1g) and V(0g)-V(1g)
• contour the velocity differences and plot• determine g-sensitivity• Note: all calculations were using the Boussinesq approx.
source crystaly,V
x,U
g
horizontalvertical stabilized
vertical destabilized
conventions:
c ; [T=T(y)]Ts
49
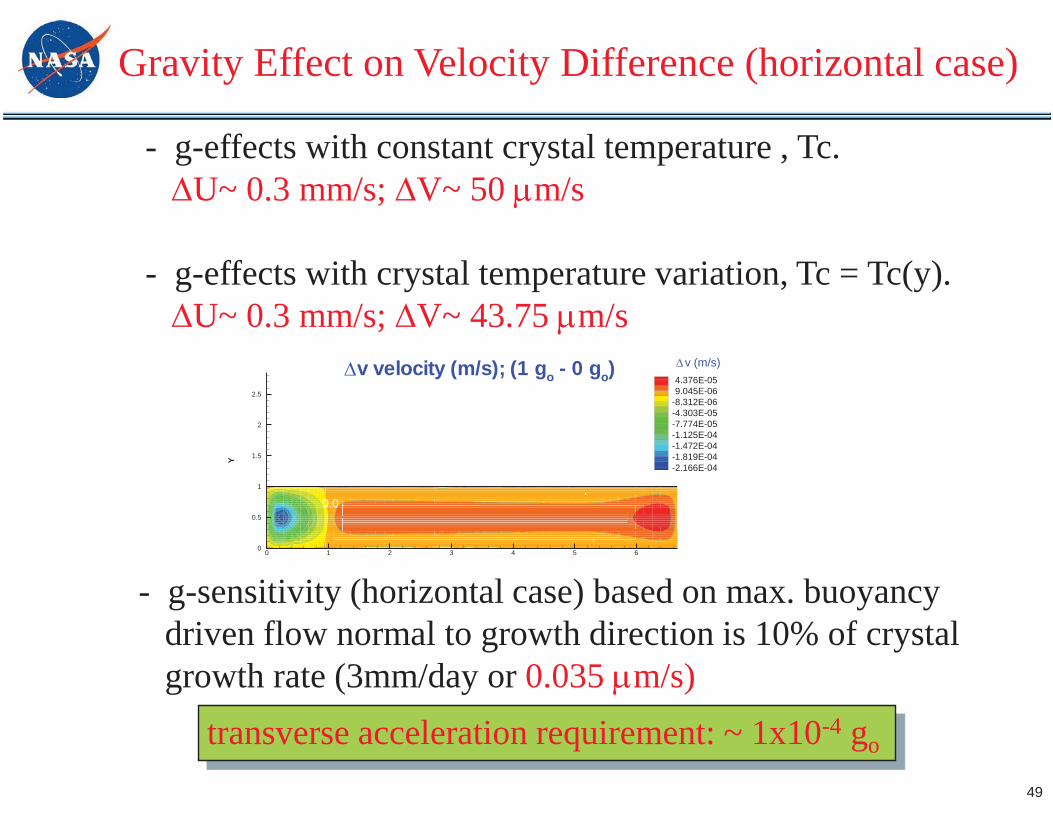
Gravity Effect on Velocity Difference (horizontal case)
- g-effects with constant crystal temperature , Tc.U~ 0.3 mm/s; V~ 50 m/s
- g-effects with crystal temperature variation, Tc = Tc(y).U~ 0.3 mm/s; V~ 43.75 m/s
- g-sensitivity (horizontal case) based on max. buoyancydriven flow normal to growth direction is 10% of crystalgrowth rate (3mm/day or 0.035 m/s)
transverse acceleration requirement: ~ 1x10⁻⁴ go
Y
0 1 2 3 4 5 60
0.5
1
1.5
2
2.5
4.376E-059.045E-06
-8.312E-06-4.303E-05-7.774E-05-1.125E-04-1.472E-04-1.819E-04-2.166E-04
v velocity (m/s); (1 go - 0 go)
0.0
v (m/s)
50
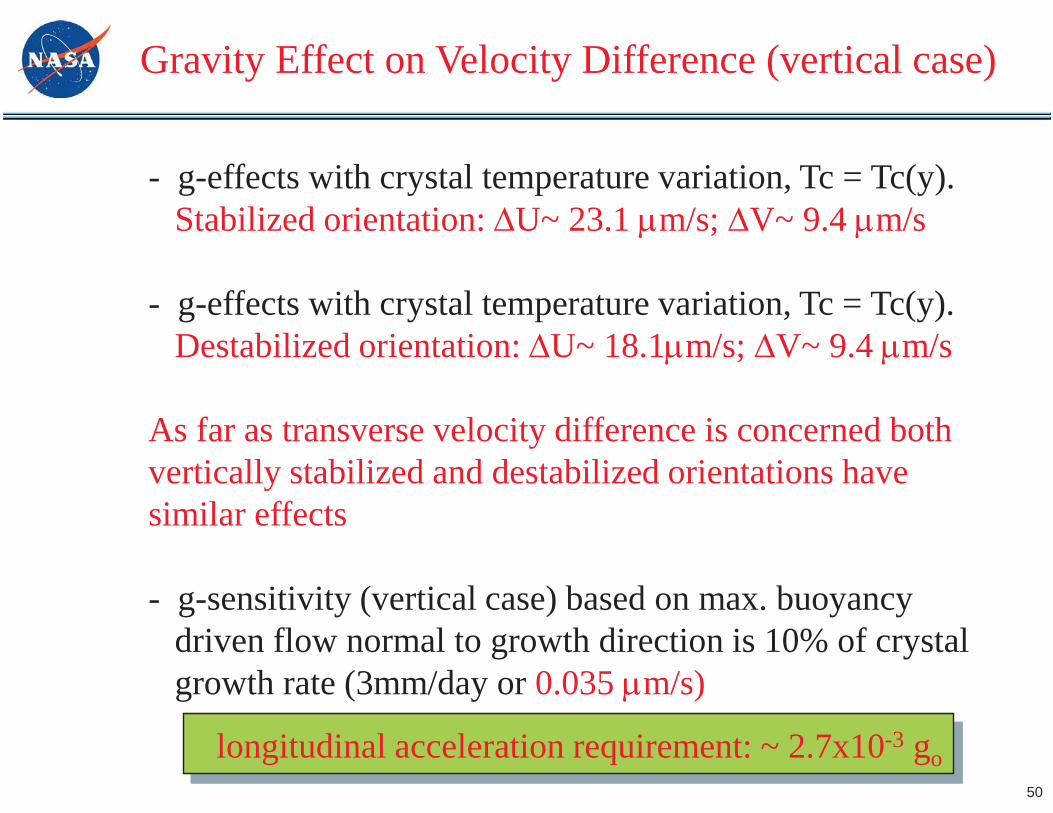
- g-effects with crystal temperature variation, Tc = Tc(y). Stabilized orientation: U~ 23.1 m/s; V~ 9.4 m/s
- g-effects with crystal temperature variation, Tc = Tc(y).Destabilized orientation: U~ 18.1 m/s; V~ 9.4 m/s
As far as transverse velocity difference is concerned both vertically stabilized and destabilized orientations have similar effects
- g-sensitivity (vertical case) based on max. buoyancydriven flow normal to growth direction is 10% of crystalgrowth rate (3mm/day or 0.035 m/s)
longitudinal acceleration requirement: ~ 2.7x10⁻³ go
Gravity Effect on Velocity Difference (vertical case)
51
ZnSe with Residual Gas - 3D Calculation Results
• significant flow observed along the ampoule axis (z-direction) indicative of more deposition in the central area than near the walls
• velocity contours in the cross planes(x-y) show appreciable variation only near the end walls (source and crystal)
• species (Zn and Se2) show fairly uniform distributions in the cross planes
• predicted crystal growth rate from 2-D and 3-D calculations are in fair agreement
52
Summary of Theoretical Calculation
• 2D and 3D calculations performed for ZnSe system• Residual gas effects considered• Calculations show that shear flow velocities of 10 to 50
microns/s are induced by buoyancy effects (290 to 1400 times growth rate)
• g-level requirements established based on time scale analysis required transverse g level: < 1.2x10⁻⁴gorequired longitudinal g level < 8.5x10⁻³ go
• It is noted that the Boussinesq model used in the calculations tend to underpredict velocities
Flight Experiments on International Space Station
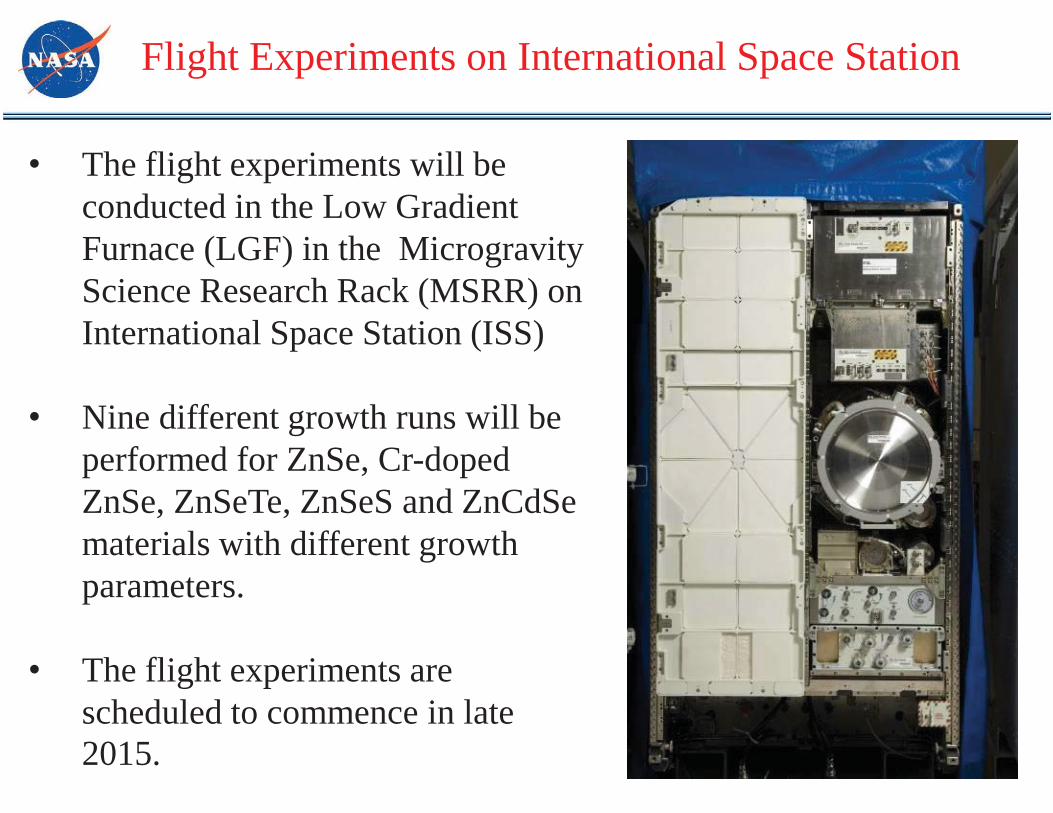
• The flight experiments will be conducted in the Low Gradient Furnace (LGF) in the Microgravity Science Research Rack (MSRR) on International Space Station (ISS)
• Nine different growth runs will be performed for ZnSe, Cr-doped ZnSe, ZnSeTe, ZnSeS and ZnCdSematerials with different growth parameters.
• The flight experiments are scheduled to commence in late 2015.
54
"Growth Rate of CdS by Vapor Transport in a Closed Ampoule." J. Crystal Growth, 80 333-342 (1987).
"Growth and Characterization of CdS Crystals". J. Crystal Growth, 101 221-225 (1990).
"Vibronic Spectra of Cu+2 in ZnTe". Phys. Rev. B, 46 76-82 (1992)."Growth of ZnTe by Physical Vapor Transport and Traveling Heater Method". J.
Crystal Growth, 128 627-632 (1993)."Thermodynamic Analysis and Mass Flux of the HgZnTe-HgI2 Chemical Vapor
Transport System". J. Crystal Growth, 131 574-588 (1993)."Characterization of Growth Defects in ZnTe Single Crystals". Mater. Res. Soc.
Symp. Proc., Infrared Detectors - Materials, Processing, and Devices, A. Applebaum and L. R. Dawson (eds.) 299 203-208 (1994).
"Photoluminescence of Vapor and Solution Grown ZnTe Single Crystals". J. Crystal Growth, 138 219-224 (1994).
"Synchrotron Topography Characterization of ZnTe Single Crystals". Mater. Sci. & Eng. B27, 143 -153 (1994).
"Mass Flux of ZnSe by Physical Vapor Transport". J. Crystal Growth, 146 42-48 (1995).
Refereed Publications on Vapor Growth
55
“CdTe I: Solidus Curve and Composition-Temperature-Tellurium Partial Pressure Data for Te-Rich CdTe(s) from Optical Density Measurements”. J. Phys. Chem. Solids 57 443-450 (1995).
“CdTe II: Defect Chemistry”. J. Phys. Chem. Solids 57 451-460 (1995)."Selenium Precipitation in ZnSe Crystal Grown by Physical Vapor Transport". J.
Crystal Growth 147 292-296 (1995)."Post-growth Annealing of CdS Crystal Grown by Physical Vapor Transport". J.
Crystal Growth 166 721-735 (1996).“Partial Pressures of Zn and Se2 over ZnSe(s) from Optical Density
Measurements”. High Temp. and Mater. Sci. 35 215-237 (1996)."Mass Flux and Partial Pressures of ZnSe by Physical Vapor Transport". J.
Crystal Growth 166 736-744 (1996).“Analysis of the Zn-Se System”. J. Phase Equilibria 17 495-501 (1996)."Mass Flux of ZnSe1-xSx and ZnSe1-xTex by Physical Vapor Transport". J. Crystal
Growth 171 516-524 (1997).“Vapor Phase Stoichiometry and Heat Treatment of CdTe Starting Material for
Physical Vapor Transport”. J. Crystal Growth 183 519-524 (1998).
Refereed Publications on Vapor Growth
56
“Segregation Coefficients of Impurities in Selenium by Zone Refining”. J. Crystal Growth 187 569-572 (1998).
“Characterization of Semi-insulating CdTe Crystals Grown by Horizontal Seeded Physical Vapor Transport”, J. Crystal growth 191 377-386 (1998).
“Heat Treatment of ZnSe Starting Materials for Physical Vapor Transport”, To be published on J. Crystal Growth. Ching-Hua Su, W. Palosz, S. Feth and S. L. Lehoczky, “Heat Treatment of ZnSe Starting Materials for Physical Vapor Transport”, J. Crystal Growth. 192 386-394 (1998).
“Point Defect Distributions in ZnSe Crystals: Effects of Gravity Vector Orientation during Physical Vapor Transport”, J. Crystal Growth 204 41-51 (1999).
“Vapor Growth and Characterization of Cr-doped ZnSe Crystals”, J. Crystal Growth 207 35-42 (1999).
“Characterization of ZnSe Single Crystals Grown by Physical Vapor Transport”, J. Crystal Growth 208 237-247 (2000).
"Modeling Studies of PVT Growth of ZnSe: Current Status and Future Course", J. Crystal Growth 208 269-281 (2000).
“In-situ Partial Pressure Measurements and Visual Observation during Crystal Growth of ZnSe by Seeded Physical Vapor Transport”, J. Crystal Growth 209 687-694 (2000).
Refereed Publications on Vapor Growth
57
“Contactless Growth of ZnSe Single Crystals by Physical Vapor Transport”, J. Crystal Growth 213 267-275 (2000).
“Vapor Growth and Characterization of ZnSeTe Solid Solutions”, J. Crystal Growth 216 104-112 (2000).
“Optical Characterization of Bulk ZnSeTe Solid Solutions”, J. Appl. Phys. 88 5148-5152 (2000).
“Photoluminescence Studies of ZnSe Starting Materials and Vapor Grown Bulk Crystals”, J. Crystal Growth 224 32-40 (2001).
“The Preparation Conditions of Chromium doped ZnSe and Their Effect on the Infrared Luminescence Properties”, J. Crystal Growth 225 249-256 (2001).
“Beer Law Constants and Vapor Pressures of HgI2 over HgI2(s,l)”, J. Crystal Growth 235 313-319 (2002).
“Band Anticrossing in Highly Mismatched Compound Semiconductor Alloys”, Proceeding of the 28th International Symposium on Compound Semiconductors (ISCS2001).
”Partial Pressures of Te2 and Thermodynamic Properties of Ga-Te system”, Thermochimi. Acta. 390 21-29 (2002).
“Partial Pressures of In-Se from Optical Absorbance of the Vapor”, J. Phase Equilibria 23 397-408 (2002).
Refereed Publications on Vapor Growth
58
“Composition Dependence of the Hydrostatic Pressure Behavior of the Bandgap of ZnSeTe Alloys”, Phys. Rev. B, 68 033206(1-4) (2003).
“Origin of the Large Bandgap Bowing in Highly Mismatched Semiconductor Alloys”, Phys. Rev. B, 67 035207(1-5) (2003).
“Thermal expansion coefficient of ZnSe crystal between 17 and 1080 °C by interferometry”, Materials Letters, Vol. 63, 1475-1477 (2009).
Refereed Publications on Vapor Growth


![Dissertation - qucosa.de · zinc blende form of 12 III–V binary compound semiconductors (points) and some of their random ternary alloys (curves) ... [5,8,10]. Band anti-crossing](https://img.dokumen.tips/doc/110x75/5b0d76207f8b9a2c3b8d3294/dissertation-blende-form-of-12-iiiv-binary-compound-semiconductors-points.jpg)