Embed Size (px)
DESCRIPTION
Tauc Plot is described.
Citation preview

LAAN-A-UV-E023
No.A428Spectrophotometr ic Analys is
Measurements of Band Gap in Compound Semiconductors- Band Gap Determination from Diffuse Reflectance Spectra -
The determination of band gap in materials is important to obtain the basic solid state physics. Band gap indicates the difference in energy between the top of the valence band filled with electrons and the bottom of the conduction band devoid of electrons. The bandgap is related to the electric conductivity of the materials. There is generally no band gap in metals, but the band gap value in insulators is known to be large, and that in semiconductors is typically
intermediate between these two.Here we introduce band gap determination from Tauc plots obtained from diffuse reflectance spectra of samples consisting of compound semiconductor materials, which in this case were provided by the Wada Laboratory, Faculty of Science and Technology, Ryukoku University. The experiments were also conducted with the cooperation of the Wada Laboratory, Ryukoku University .
Fig. 1 Sample Placed on BaSO4 Powder
Fig. 2 Sample Spread on BaSO4 PowderFig. 4 Diffuse Reflectance Spectra
(Red: CuGaSe2, Blue: CuIn0.5Ga0.5Se2, Black: CuInSe2)
Fig. 3 Sample Set in ISR-3100 Integrating Sphere
Sample
Light
n Samples, Instrument and Attachment Used for MeasurementThree kinds of powder samples (CuInSe2, CuIn0.5Ga0.5Se2, and CuGaSe2), which consisted of copper (Cu), indium (In), selenium (Se) and gallium (Ga) were used as the samples. These compounds are currently receiving attention as compound semiconductors in solar battery. The samples were prepared for measurement by piling a small amount on a layer of barium sulfate powder, after which the sample powder was spread into a thin uniform layer using a glass rod. The sample preparation and final sample state as prepared for measurement are shown in Fig. 1 and Fig. 2.The ISR-3100 integrating sphere attachment was mounted in the UV-3600 UV-VIS-NIR spectrophotometer as shown in Fig. 3, and diffuse reflectance spectra of the prepared samples were recorded. Barium sulfate was used as a standard. The obtained UV-VIS-NIR spectra are shown in Fig. 4, and the measurement conditions are shown in Table 1. It is clear that there are differences in the position of the absorption edge (position at which reflectance decreases). This difference indicates the difference of the band gap between samples.
Table 1 Analytical Conditions
Measurement Wavelength Range : 600 nm to 1800 nmScan Speed : MediumSampling Pitch : 1.0 nmPhotometric Value : ReflectanceSlit Width : (20) nmGrating Switching Wavelength : 720 nmDetector Switching Wavelength : 830 nm
R%
SHIMADZU CORPORATION. International Marketing Division3. Kanda-Nishikicho 1-chome, Chiyoda-ku, Tokyo 101-8448, Japan Phone: 81(3)3219-5641 Fax. 81(3)3219-5710
No.A428
n Calculation of Band Gap Using Tauc PlotThe Tauc plot is a method that is widely used for the determination of band gap. Shown next is the procedure for determining the band gap from a diffuse reflectance spectrum using the Tauc plot.
n Process for Obtaining Band Gap Using Tauc Plot(1) The following relational expression proposed by Tauc, Davis, and Mott is
used.(hνα)1/n = A(hν - Eg) ····································································· (1)
Where:h: Planck's constant, ν: frequency of vibration, α: absorption coefficient, Eg: band gap, A: proportional constantThe value of the exponent n denotes the nature of the sample transition.
For direct allowed transition· ············ n = 1/2For direct forbidden transition ·········· n = 3/2For indirect allowed transition ·········· n = 2For indirect forbidden transition ······· n = 3
Since the direct allowed sample transition is used in this experiment, n = 1/2 is used for these samples.
(2) The acquired diffuse reflectance spectrum is converted to Kubelka-Munk function. Thus, the vertical axis is converted to quantity F(R∞), which is proportional to the absorption coefficient. The α in the Tauc equation is substituted with F(R∞). Thus, in the actual experiment, the relational expression becomes:
(hνF(R∞))2 = A(hν - Eg) ······························································· (2)(3) Using the Kubelka-Munk function, the (hνF(R∞))2 was plotted against the
hν. The curve that plots the value of (hν - (hνF(R∞))2) on the horizontal axis hν and vertical axis (hνF(R∞))2 is drawn.Here, the unit for hν is eV (electron volts), and its relationship to the wavelength λ (nm) becomes hν = 1239.7/λ.
(4) A line is drawn tangent to the point of inflection on the curve of step (3), and the hν value at the point of intersection of the tangent line and the horizontal axis is the band gap Eg value.
Note: The point of inflection is found by taking the first derivative of the curve. The point at which the value of the first derivative coefficient begins to decrease after increasing is the point of inflection.
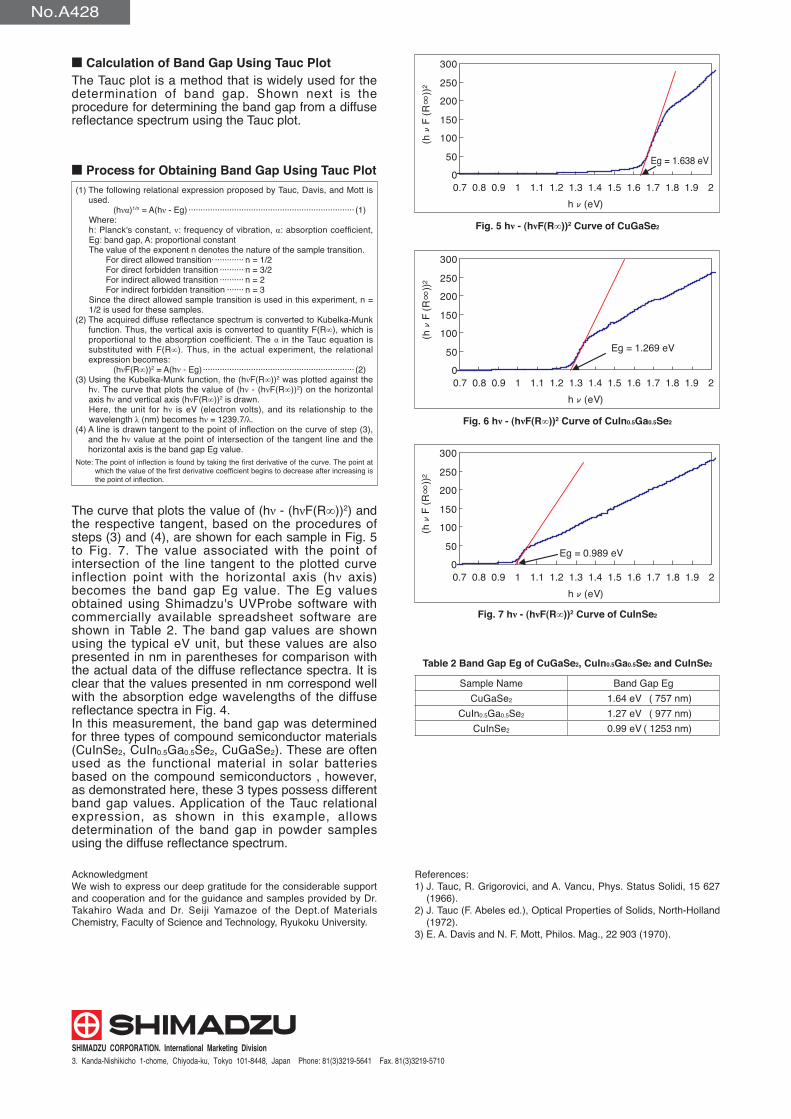
The curve that plots the value of (hν - (hνF(R∞))2) and the respective tangent, based on the procedures of steps (3) and (4), are shown for each sample in Fig. 5 to Fig. 7. The value associated with the point of intersection of the line tangent to the plotted curve inflection point with the horizontal axis (hν axis) becomes the band gap Eg value. The Eg values obtained using Shimadzu's UVProbe software with commercially available spreadsheet software are shown in Table 2. The band gap values are shown using the typical eV unit, but these values are also presented in nm in parentheses for comparison with the actual data of the diffuse reflectance spectra. It is clear that the values presented in nm correspond well with the absorption edge wavelengths of the diffuse reflectance spectra in Fig. 4.In this measurement, the band gap was determined for three types of compound semiconductor materials (CuInSe2, CuIn0.5Ga0.5Se2, CuGaSe2). These are often used as the functional material in solar batteries based on the compound semiconductors , however, as demonstrated here, these 3 types possess different band gap values. Application of the Tauc relational expression, as shown in this example, allows determination of the band gap in powder samples using the diffuse reflectance spectrum.
AcknowledgmentWe wish to express our deep gratitude for the considerable support and cooperation and for the guidance and samples provided by Dr. Takahiro Wada and Dr. Seiji Yamazoe of the Dept.of Materials Chemistry, Faculty of Science and Technology, Ryukoku University.
References:1) J. Tauc, R. Grigorovici, and A. Vancu, Phys. Status Solidi, 15 627
(1966).2) J. Tauc (F. Abeles ed.), Optical Properties of Solids, North-Holland
(1972).3) E. A. Davis and N. F. Mott, Philos. Mag., 22 903 (1970).
0.7 0.8 0.9 1 1.1 1.2 1.3 1.4 1.5 1.6 1.7 1.8 1.9 2hν(eV)
0
50
100
150
200
250
300
(hν
F (R∞
))2
Eg = 1.638 eV
Eg = 1.269 eV
0.7 0.8 0.9 1 1.1 1.2 1.3 1.4 1.5 1.6 1.7 1.8 1.9 2hν(eV)
0
50
100
150
200
250
300
(hν
F (R∞
))2
Eg = 0.989 eV
0.7 0.8 0.9 1 1.1 1.2 1.3 1.4 1.5 1.6 1.7 1.8 1.9 2hν(eV)
0
50
100
150
200
250
300
(hν
F (R∞
))2
Fig. 5 hν - (hνF(R∞))2 Curve of CuGaSe2
Fig. 6 hν - (hνF(R∞))2 Curve of CuIn0.5Ga0.5Se2
Fig. 7 hν - (hνF(R∞))2 Curve of CuInSe2
Table 2 Band Gap Eg of CuGaSe2, CuIn0.5Ga0.5Se2 and CuInSe2
Sample Name Band Gap EgCuGaSe2 1.64 eV ( 757 nm)
CuIn0.5Ga0.5Se2 1.27 eV ( 977 nm)CuInSe2 0.99 eV ( 1253 nm)