Embed Size (px)
Citation preview

CREEP DEFORMATION OF AMORPHOUS
POLYMER (POLYURETHANES)
CHUA NGEAH BOON
DISSERTATION SUBMITTED IN FULFILMENT OF THE REQUIREMENTS FOR THE DEGREE
OF MASTER OF SCIENCE
FACULTY OF SCIENCE UNIVERSITY OF MALAYA
KUALA LUMPUR
APRIL 2008
ABSTRACT Polyurethanes (PU) based on two different molecular weight, poly(tetramethylene
oxide) polyol, PTMO-1000 and PTMO-2000 and three different diisoscyanates, TDI
(toluene diisocyanate), IPDI (isophorone diisocyanate), HDI (hexamethylene
diisocyanate) with chain extender BDO (butanediol) have been synthesised by a
two-step polymerization. The effect of soft segment chain length and the effect of
hard segment structures on creep behaviour of four different type polyurethanes;
PU1-TDI, PU2-TDI, PU1-IPDI and PU1-HDI have been investigated. The PUs
obtained were characterized by Dynamic Mechanical Analysis (DMA), Differential
Scanning Calorimetry (DSC), X-Ray Diffraction (XRD) and Scanning Electron
Microscopy (SEM). The creep studies mainly involve variable load constant-
temperature creep measurement. Outstanding creep resistance was observed at
the long-term creep test at room temperature for PU1-TDI, PU2-TDI and PU1-HDI.
No failure occurred for all these three PUs until the end of the creep test. The
mechanical studied reveals that PU1-TDI has the highest tensile strength whereas
PU1-HDI showed the highest modulus properties. The increase of molecular
weight of polyol causes an observed decrease in tensile strength and elastic
modulus and leads to increase in strain at maximum. From the DMA and DSC
results, PU1-HDI show the lowest Tg value indicated that the degree of microphase
separation of PU1-HDI is the highest which will lead to the better mechanical
properties. PU1-HDI exhibits multiphase morphologies whereas the morphologies
of the PU1-TDI and PU2-TDI are relatively homogenous. The XRD results indicate
that crystallinity decreased from aliphatic to aromatic based diisocyanates of PUs.
I

ABSTRAK Polyurethanes (PU) disintesis dengan menggunakan kaedah pempolimeran dua
langkah berasaskan berat molekul poly(tetramethylene oxide) poliol yang berbeza,
PTMO-1000 dan PTMO-2000 dan tiga jenis diisoscyanates yang berbeza, TDI
(toulene diisocyanate), IPDI (isophorone diisocyanate), HDI (hexamethylene
diisocyanate) dengan rantai pemanjangan, BDO (butanediol). Kesan daripada
panjang rantaian segmen lembut dan struktur segmen keras terhadap sifat
rayapan empat jenis PU dikaji; PU1-TDI, PU2-TDI, PU1-IPDI dan PU1-HDI.
Sampel PU yang diperolehi dicirikan dengan menggunakan Analisis Mekanikal
Dinamik (DMA), Kalorimetri Pengimbasan Pembezaan (DSC), Penyerakan Sinar-X
(XRD) dan Mikroskopi Elektron Pengimbas (SEM). Kajian rayapan terutamanya
melibatkan pengukuran rayapan beban berubah dengan suhu malar. Kerintangan
rayapan yang baik dapat diperhatikan melalui kajian rayapan jangka masa panjang
pada suhu bilik bagi sampel PU1-TDI, PU2-TDI dan PU1-HDI. Tiada kegagalan
diperhatikan bagi ketiga-tiga sampel PU sehingga tamat kajian rayapan. Kajian
mekanikal menunjukkan bahawa sampel PU1-TDI mempunyai kekuatan tegangan
tertinggi manakala sampel PU1-HDI menunjukkan sifat modulus tertinggi.
Penambahan berat molekul poliol menyebabkan penurunan kekuatan tegangan
dan modulus kenyal dan seterusnya menyebabkan peningkatan maksimum pada
terikan. Daripada keputusan-keputusan DMA dan DSC, sampel PU1-HDI
menunjukkan nilai suhu kekaca yang terendah menandakan bahawa darjah
pemisahan fasa mikro bagi sampel PU1-HDI adalah tertinggi dan memberikan sifat
mekanikal yang lebih baik. Sampel PU1-HDI mempamerkan morfologi pelbagai
II
fasa yang mana morfologi bagi sampel PU1-TDI dan PU2-TDI adalah
homogenous. Keputusan XRD menunjukkan sifat kehabluran PU berasaskan
diisocyanate alifatik berkurang kepada aromatik.
III

ACKNOWDLEGEMENTS I would like to express sincere gratitude to my supervisor, Dr. Zurina Osman for her
incessant motivation, support and valuable guidance.
Special thanks are given to my ex-supervisor, Dr. Abu Bakar Ahmad for his
valuable suggestion, ideas, great patience and encouragement to make this work
started to roll.
I would also like to thank Miss Thamil Selvi Velayutham for her valuable
suggestions and helps. Gratitude is also extended to the lab assistance, Mr. Salleh
Zakaria for his helps and advices.
The generous financial support, which was received from Sponsored Research
Unit, Institute of Research Management and Consultancy, University of Malaya,
had made this study possible.
Last but not least, I would like to thank my parents, siblings, Kwong Chen and
friends, who gave moral supports and cares. It was so wonderful to have those
people in my life in accomplishing my master course.
IV

CONTENTS
Page
ABSTRACT............................................................................................................................I
ABSTRAK............................................................................................................................ II
ACKNOWDLEGEMENTS ...............................................................................................IV
CONTENTS ......................................................................................................................... V
List of Figures ................................................................................................................... VII
List of Tables ........................................................................................................................ X
List of Abbreviations ..........................................................................................................XI
CHAPTER 1: INTRODUCTION ....................................................................................... 1
1.1 Overview....................................................................................................................... 1
1.2 Scope and Objective of the Study................................................................................. 2
1.3 Dissertation Layout....................................................................................................... 3
CHAPTER 2: LITERATURE REVIEW ........................................................................... 5
2.1 Description of Polyurethane ......................................................................................... 5
2.1.1 History and Development ...................................................................................... 5
2.1.2 Properties and Applications ................................................................................... 6
2.2 Mechanical Properties of Polymeric Materials........................................................... 10
2.2.1 Stress-Strain Behaviour ....................................................................................... 11
2.2.2 Creep Properties................................................................................................... 17
2.2.3 Interpretation and Application of Creep Data...................................................... 24
2.3 Polymer Characterization ........................................................................................... 29
2.3.1 Dynamic Mechanical Analysis (DMA) ............................................................... 29
2.3.2 Differential Scanning Calorimetry (DSC) ........................................................... 32
2.3.3 X-Ray Diffraction (XRD).................................................................................... 35
2.3.4 Scanning Electron Microscopy (SEM) ................................................................ 40
CHAPTER 3: EXPERIMENTAL METHODS ............................................................... 43
3.1 Materials Description.................................................................................................. 43
3.2 Sample Preparation..................................................................................................... 43
V

3.3 Conventional Static Creep Tests................................................................................. 47
3.3.1 Testing Apparatus ................................................................................................ 47
3.3.2 Specimen Preparation .......................................................................................... 48
3.3.3 Static Creep Test Procedure................................................................................. 50
3.4 Tensile Tests ............................................................................................................... 51
3.4.1 Testing Apparatus and Test Procedure ................................................................ 51
3.4.2 Specimen Preparation .......................................................................................... 53
3.5 Dynamic Mechanical Analysis (DMA) ...................................................................... 54
3.5.1 Testing Apparatus ................................................................................................ 54
3.5.2 Specimen Preparation .......................................................................................... 55
3.6 Other Characterization Methods............................................................................. 56
3.6.1 Differential Scanning Calorimetry (DSC) ........................................................... 56
3.6.2 X-ray Diffraction (XRD) ..................................................................................... 58
3.6.3 Scanning Electron Microscopy (SEM) ................................................................ 60
CHAPTER 4: RESULTS AND DISCUSSIONS.............................................................. 62
4.1 Static Creep Test Results ............................................................................................ 62
4.2 Tensile Test Results.................................................................................................... 74
4.3 Dynamic Mechanical Analysis (DMA) Test Results ................................................. 80
4.4 DSC Results................................................................................................................ 88
4.5 XRD Results ............................................................................................................... 93
4.6 SEM Results ............................................................................................................... 96
CHAPTER 5: CONCLUSION AND RECOMMENDATIONS................................... 100
REFERENCES ................................................................................................................. 104
VI
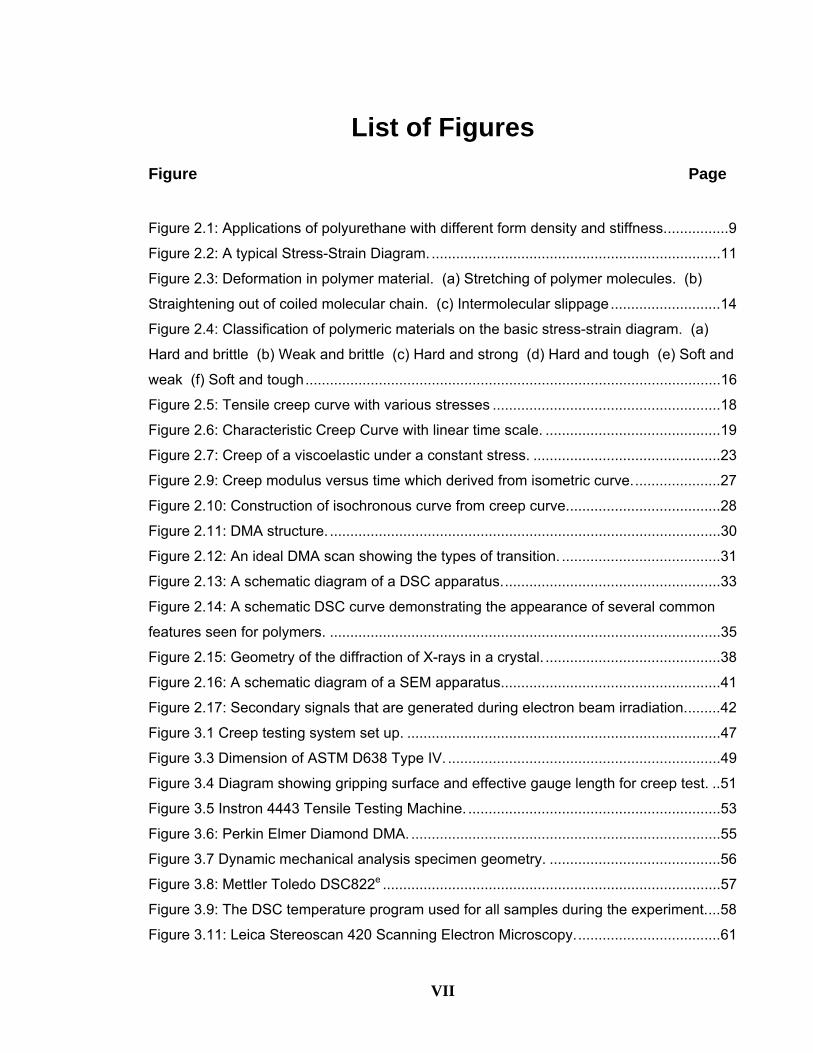
List of Figures Figure Page
...............9 Figure 2.1: Applications of polyurethane with different form density and stiffness.
.......................................................................11 Figure 2.2: A typical Stress-Strain Diagram.
Figure 2.3: Deformation in polymer material. (a) Stretching of polymer molecules. (b)
Straightening out of coiled molecular chain. (c) Intermolecular slippage...........................14 Figure 2.4: Classification of polymeric materials on the basic stress-strain diagram. (a)
Hard and brittle (b) Weak and brittle (c) Hard and strong (d) Hard and tough (e) Soft and
weak (f) Soft and tough......................................................................................................16 ........................................................18 Figure 2.5: Tensile creep curve with various stresses
...........................................19 Figure 2.6: Characteristic Creep Curve with linear time scale.
..............................................23 Figure 2.7: Creep of a viscoelastic under a constant stress.
.....................27 Figure 2.9: Creep modulus versus time which derived from isometric curve.
.....................................28 Figure 2.10: Construction of isochronous curve from creep curve.
................................................................................................30 Figure 2.11: DMA structure.
.......................................31 Figure 2.12: An ideal DMA scan showing the types of transition.
.....................................................33 Figure 2.13: A schematic diagram of a DSC apparatus.
Figure 2.14: A schematic DSC curve demonstrating the appearance of several common
features seen for polymers. ................................................................................................35 ...........................................38 Figure 2.15: Geometry of the diffraction of X-rays in a crystal.
.....................................................41 Figure 2.16: A schematic diagram of a SEM apparatus.
........42 Figure 2.17: Secondary signals that are generated during electron beam irradiation.
.............................................................................47 Figure 3.1 Creep testing system set up.
...................................................................49 Figure 3.3 Dimension of ASTM D638 Type IV.
..51 Figure 3.4 Diagram showing gripping surface and effective gauge length for creep test.
..............................................................53 Figure 3.5 Instron 4443 Tensile Testing Machine.
............................................................................55 Figure 3.6: Perkin Elmer Diamond DMA.
..........................................56 Figure 3.7 Dynamic mechanical analysis specimen geometry.
...................................................................................57 Figure 3.8: Mettler Toledo DSC822e
...58 Figure 3.9: The DSC temperature program used for all samples during the experiment.
...................................61 Figure 3.11: Leica Stereoscan 420 Scanning Electron Microscopy.
VII

Figure 4.1: Creep strain of PU1-TDI as a function of (a) linear and (b) logarithmic time at
various stresses. .................................................................................................................66 Figure 4.2: Creep strain of PU2-TDI as a function of (a) linear and (b) logarithmic time at
various stresses. .................................................................................................................67 Figure 4.3: Creep strain of PU1-IPDI as a function of (a) linear and (b) logarithmic time at
various stresses. .................................................................................................................68 Figure 4.4: Creep strain of PU1-HDI as a function of (a) linear and (b) logarithmic time at
various stresses. .................................................................................................................69 ..............70 Figure 4.5: Isochronous curve of PU1-TDI obtained from the data of Figure 4.1.
..................................................71 Figure 4.6: Isometric curve of PU1-TDI at strain = 545%.
.....................................................72 Figure 4.7: Effect of stress on creep modulus PU1-TDI.
...............................................72 Figure 4.8: Effect of stress on creep modulus for PU2-TDI.
...................................................73 Figure 4.9: Effect of stress on creep modulus PU1-IPDI.
..................................................73 Figure 4.10: Effect of stress on creep modulus PU1-HDI.
Figure 4.11: Stress-strain curve of two different molecular weight of soft segments in
polyurethanes. ....................................................................................................................78 Figure 4.12: Stress-strain curve of three different diisocyanates structure in polyurethanes.
............................................................................................................................................79 Figure 4.13: Loss factor (tan delta) versus temperature of two various molecular weights of
soft segment in polyurethanes. ...........................................................................................84 Figure 4.14: Loss factor (tan delta) versus temperature of three different diisocyanates
structure in polyurethanes...................................................................................................85 ..............................................86 Figure 4.15: Storage modulus as a function of temperature.
..............................................87 Figure 4.16: Dependence of Loss modulus on temperature.
.........................................................................90 Figure 4.17: DSC thermogram of PU1-TDI
.........................................................................90 Figure 4.18: DSC thermogram of PU2-TDI
........................................................................91 Figure 4.19: DSC thermogram of PU1-IPDI
.........................................................................91 Figure 4.20: DSC thermogram of PU1-HDI
..............................................92 Figure 4.21: DSC thermograms of 4 various polyurethanes.
...............................................................................94 Figure 4.22: XRD pattern for PU1-TDI.
...............................................................................94 Figure 4.23: XRD pattern for PU2-TDI.
..............................................................................95 Figure 4.24: XRD pattern for PU1-IPDI.
...............................................................................95 Figure 4.25: XRD pattern for PU1-HDI.
....................................................97 Figure 4.26: SEM micrograph of PU1-TDI (Mag.=500x).
VIII

....................................................98 Figure 4.27: SEM micrograph of PU2-TDI (Mag.=500x).
...................................................98 Figure 4.28: SEM micrograph of PU1-IPDI (Mag.=500x).
...................................................99 Figure 4.29: SEM micrograph of PU1-HDI (Mag.=500x).
IX

List of Tables Table Page Table 2.1: Characteristic Features of Stress-Strain Curves as It Relates to Polymer
Properties [15].....................................................................................................................15 ...........................................................45 Table 3.1: The materials used in synthesizing PUs.
.......................................................46 Table 3.2: Compositions of the prepared PU samples.
.......................................................46 Table 3.2: Compositions of the prepared Pu samples.
.............................60 Table 3.3: The specifications of XRD Diffractometer -Siemens D5000.
Table 4.1 Tensile properties of two different molecular weight of soft segments in
polyurethanes. ....................................................................................................................77 ..77 Table 4.2 Tensile properties of three different diisocyanates structure in polyurethanes.
.........................................................................................................81 Table 4.3: DMA Data.
......................................89 Table 4.4: DSC and DMA Thermal Transitions of polyurethanes.
....................................................96 Table 4.5: Scherrer length calculated from XRD results.
X
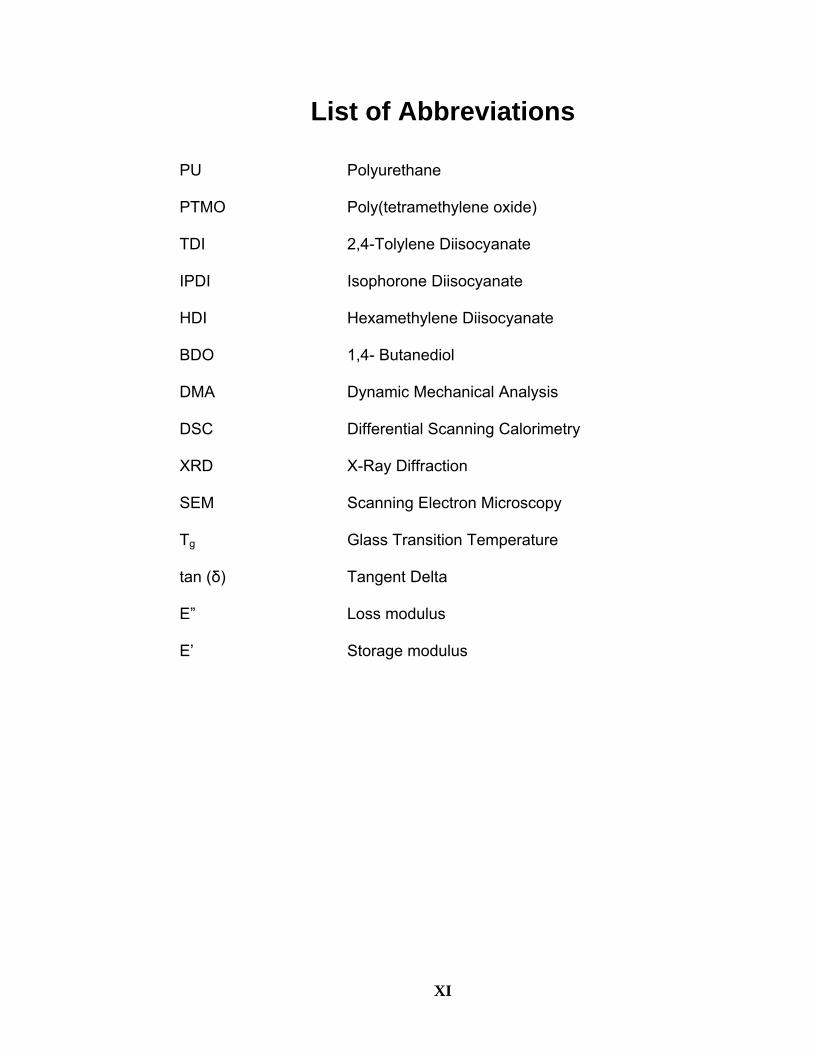
List of Abbreviations
PU Polyurethane
PTMO Poly(tetramethylene oxide)
TDI 2,4-Tolylene Diisocyanate
IPDI Isophorone Diisocyanate
HDI Hexamethylene Diisocyanate
BDO 1,4- Butanediol
DMA Dynamic Mechanical Analysis
DSC Differential Scanning Calorimetry
XRD X-Ray Diffraction
SEM Scanning Electron Microscopy
T Glass Transition Temperature g
Tangent Delta tan (δ)
Loss modulus E”
Storage modulus E’
XI
Chapter 1: Introduction
Creep Deformation of Amorphous Polymer (Polyurethanes) Page 1
CHAPTER 1: INTRODUCTION
1.1 Overview
Polymers, example polyethylene, polypropylene and polyurethanes are being
utilized in an increasing number of long term, load bearing applications, used under
severe high-temperature, and high-pressure conditions.
The mechanical properties of polymers are time-dependent, in order to intelligently
design a product for a specific applications, it is necessary to know how these
materials will respond to stress and deformation well below the nominal yield stress
or strain of the material which may be applied to the product for periods of years or
decades.
Properties that are particularly important for extended service are creep resistance
and stress relaxation. When an instantaneous load is applied to a plastic part, the
resulting deformation can be roughly predicted by the tensile modulus of the
plastic. Deformation then continues at a slower rate indefinitely until the part
ruptures. Upon removal of the load, some portion of the part's original dimensions
will be recovered. Some portion of the deformation will remain permanent. This
time, temperature and load dependent deformation is called creep and it is a result
of the viscoelasctic nature of plastic materials. In the other words, creep occurs

Chapter 1: Introduction
Creep Deformation of Amorphous Polymer (Polyurethanes) Page 2
when a constant force is continuously applied on a component, causing it to deform
gradually.
When loading is more than momentary, creep data must be considered for
purposes of material selection and design. The creep modulus represents the
modulus of a material at a specific stress level and temperature over a specified
period of time. By substituting the time, temperature, load dependent creep or
apparent modulus for the instantaneous modulus in appropriate design equations,
creep can be predicted.
1.2 Scope and Objective of the Study
From the above introduction, it can be noted that creep behaviour of polyurethanes
is an important consideration for their industrial application. While the creep
behaviour of steel and alloy has been studied by many researchers, the study on
creep behaviour of polyurethanes has been relatively limited. The scope of the
present study involved discussion on the time-dependent deformation mechanism
and strain components associated with creep processes as well as the mechanism
of creep. Creep measurements involved variable load constant-temperature.
Others characterizations also have been carried out by using Dynamic Mechanical
Analysis (DMA), Differential Scanning Calorimetry (DSC), X-Ray Diffraction (XRD),
and Scanning Electron Microscopy (SEM).

Chapter 1: Introduction
Creep Deformation of Amorphous Polymer (Polyurethanes) Page 3
1.3 Dissertation Layout
The dissertation encompasses a detailed study of the mechanical properties of
polyurethanes with the focus on creep deformation. It is organized into five
chapters which include introduction, literature review, experimental methods,
results and discussion, and conclusion. The followings give brief description of
each chapter.
Chapter one is an introduction of this project. It gives an overview of polyurethanes
and shows the importance of creep study.
Literature review of the project is discussed in chapter two. This chapter includes a
general review on history and development of polyurethanes, outline background
information about the material properties and theory applied to the creep behaviour
of polyurethanes. An in-depth analysis of the mechanical properties of the
polymers – polyurethanes is also presented in this chapter.
Chapter three focuses on experimental methods, where the experimental
apparatus for the static creep test and the tensile test, DMA, DSC, XRD and SEM
are discussed. This chapter discusses the experimental procedures for the
specimen preparation and testing.
Chapter four presents a discussion of the experimental results from the static creep
test, tensile test, DMA, DSC, XRD and SEM.

Chapter 1: Introduction
Creep Deformation of Amorphous Polymer (Polyurethanes) Page 4
Finally, chapter five concludes the research findings and highlights the problems
encountered during the research study. This chapter also includes the features of
the limitations as well as the weaknesses of the static creep test system and
recommendations for future work.

Chapter 2: Literature Review
Creep Deformation of Amorphous Polymer (Polyurethanes) Page 5
CHAPTER 2: LITERATURE REVIEW
2.1 Description of Polyurethane
2.1.1 History and Development
The foundation of the polyurethane (PU) industry was laid in 1937 with the
discovery of the polyaddition reaction between diisocyanate and diols to form PU
by Otto Bayer in Germany [1].
PU is produced by exothermic reaction of molecules containing two or more
isocyanate groups with polyol molecules containing two or more hydroxyl groups
[1,2]. Catalyst was included in the polyol blend to control the rate at which the liquid
mixture reacts to become solid. A key factor in the preparation of polyurethane is
the reactivity of the isocyanates. Aromatic diisocyanates are more reactive than
aliphatic diisocyanate [3].
During World War II, polyurethane coatings were used in the manufacturing of
mustard gas resistant garments, high-gloss airplane finishes, chemical and
corrosion resistant coatings. By the 40’s, polyurethanes could be found in coatings
and adhesives, elastomers and rigid foams for the first commercial applications.
With the development of a low-cost polyether polyol in the 50’s, flexible foams had

Chapter 2: Literature Review
Creep Deformation of Amorphous Polymer (Polyurethanes) Page 6
opened the door to the upholstery and automotive applications. PU is playing a
vital role in many industries - from aerospace to marine and automotive to medical.
A global market for polyurethanes is currently expanding at a very fast rate. As
demand for products grows, major suppliers of polyurethane raw materials are
currently setting up new world-scale production facilities to establish a strong
technical service and a long term supply base for their customers throughout the
entire region. This will also bring opportunities to develop new products and
applications for polyurethanes, which is without doubt one of the most versatile
materials.
Nowadays, Chinese PU market is the largest market followed by the Indian PU
market. The total Chinese consumption of PU products rose from 2.104 million
tones in 2003, up to 2.59 million tones in 2004 and 3 million tones in 2005 [4]. The
rapid growth is due to the quick growth of PU coatings, thermoplastic polyurethane
(TPU), spandex and synthetic leather resins [4].
2.1.2 Properties and Applications
In order to produce a consistent end product, the ingredient chemicals have to be
mixed in precise ratio and maintain the appropriate processing temperature. In
addition, good formulation selection, appropriate processing parameters and mould
geometry are needed to obtain an optimum PU end product.

Chapter 2: Literature Review
Creep Deformation of Amorphous Polymer (Polyurethanes) Page 7
PU can be manufactured in wide range of grades in densities from 6 to 1220 kg/m3
and polymer stiffness from flexible elastomers to rigid or hard plastics. PU appears
in variety forms, making them the most versatile of any family of plastic materials
[5]. Figure 2.1 illustrates the broad range of PU with reference to density and
stiffness.
Plastic materials tend to have high modulus and tensile strength properties, but low
elongation whereas rubber materials tend to have high elongation but low modulus
and tensile strength. However, PU elastomer gives high modulus, high tensile
strength and high elongation. PU elastomers can be formulated to cover a wide
hardness range, from 30 Shore A to 85 Shore D. Most rubbers fall between 30 and
80 on the A scale and structural plastics begin at 55 on the D scale. Beside that,
PU also can elongate up to 800% and returns to its' original dimension without a
significant loss of memory.
PU is the materials of choice for application requiring unique physical properties
such as cut and tear resistance, resistance to abrasive wear [6, 7] and high load-
bearing capacity. High load-bearing capacity, coupled with the superior abrasion
resistance, is a very important advantage in applications like press-on tires, caster
wheels, industrial rolls, and press brake or punch press die forming pads.
Rigid PU foam is one of the most effective practical thermal insulation materials,
used in applications ranging from domestic refrigerators to large industrial

Chapter 2: Literature Review
Creep Deformation of Amorphous Polymer (Polyurethanes) Page 8
buildings. Comfortable, durable mattresses, automotive and domestic seating are
manufactured from flexible foam. Items such as shoe soles, sports equipment, and
car bumpers are produced from different forms of PU elastomers [8].
Highly demanding medical applications use biocompatible PU for artificial joints
and implant coatings because of their excellent biocompatibility and mechanical
properties[9, 10]. PU coatings protect floors and bridges from damage and
corrosion whereas adhesives are used in the construction of items as small as an
electronic circuit board and as large as an aircraft. Advanced glass and carbon
fibre reinforced composites are being evaluated in the automotive and aerospace
industries.

Creep Deformation of Amorphous Polymer (Polyurethanes) Page 9
Figure 2.1: Applications of polyurethane with different range of density and stiffness [11].
Chapter 2: Literature Review

Chapter 2: Literature Review
Creep Deformation of Amorphous Polymer (Polyurethanes) Page 10
2.2 Mechanical Properties of Polymeric Materials
The mechanical properties of polymeric materials are critical because all service
conditions and applications of the end products involve mechanical loading. The
materials selection and the design of product for a variety of applications are
usually based on mechanical properties such as elongation, modulus, tensile
strength, abrasion resistance, load-bearing capacity and impact strength.
In polymeric materials, mechanical behaviour is dominated by viscoelastic
phenomena. For a viscoelastic material, the mechanical response of the polymeric
material will be intermediate between an ideal elastic and viscous liquid [12]. If a
weight is suspended from a polymeric material, the polymeric material will deform
quickly to a strain predicted by the stress-strain modulus. Then, it continues to
deform slowly with time indefinitely until rupture or yielding causes failure. This is
due to molecular rearrangement in the solid induced by the stress. The
phenomenon of deformation under a constant load with time is called creep. It is a
manifestation of viscoelastic material [13].
Polymers are viscoelastic at all temperatures. So, when considering the strain
induced in service, it is always required to take into account not only the stress, but
the time for which it is applied. The viscoelastic properties are also highly
temperature-dependent. In practical applications, polymers are seldom subjected
to a single, steady deformation without the presence of other adverse factors such

Chapter 2: Literature Review as environment condition. So, the reported mechanical properties of polymers are
not suitable to be used in real application since they are generated under standard
test conditions.
2.2.1 Stress-Strain Behaviour
Figure 2.2 shows the stress-strain behaviour of polymer, which is measured at a
constant rate of loading. The curves obtained from other loading conditions, such
as compression or shear, are quite similar in appearance except that the
magnitude and the extent to which the curve is followed are different.
Creep Deformation of Amorphous Polymer (Polyurethanes) Page 11
Stress(σ)
Figure 2.2: A typical Stress-Strain Diagram [14].
Tensile modulus
Yield C
B
A
Break
0
XElongation at failure
D
Ultimate strength
Strain(ε)

Chapter 2: Literature Review
Creep Deformation of Amorphous Polymer (Polyurethanes) Page 12
The initial portion o B is linear. For an
he deformation between BC is associated with a straightening out of a coiled
Figure 2.3. These deformations do not
f the stress-strain curve between points A and
elastic material, the stress is proportional to the strain which follows the Hooke’s
Law. Point B is the proportional limit at which the actual curve deviates from the
straight linear [15]. The behaviour of polymer below this point is elastic in nature
and therefore the deformation is recoverable. Up to point A, the deformation is
small and is associated with bending or stretching of the inter-atomic bonds
between atoms of the polymer molecules. This type of deformation is nearly
instantaneous and no permanent displacement of the molecules relative to each
other.
T
portion of the molecular chains if loaded in tension. There is no intermolecular
slippage occurring and the deformation is recoverable ultimately but not
instantaneously. Hence, this is analogous to that of a non-linear spring. The
extension that occurs beyond the point C is called yield point or elastic limit, which
the material is not recoverable. The yield point is the first point on the stress-strain
curve at which an increase in strain occurs without the increase in stress [15].
Beyond this point extensions occur by displacement of molecules with respect
each other, as in Newtonian flow of liquid. This displaced molecules have no
tendency to slip back, therefore this deformation is permanent.
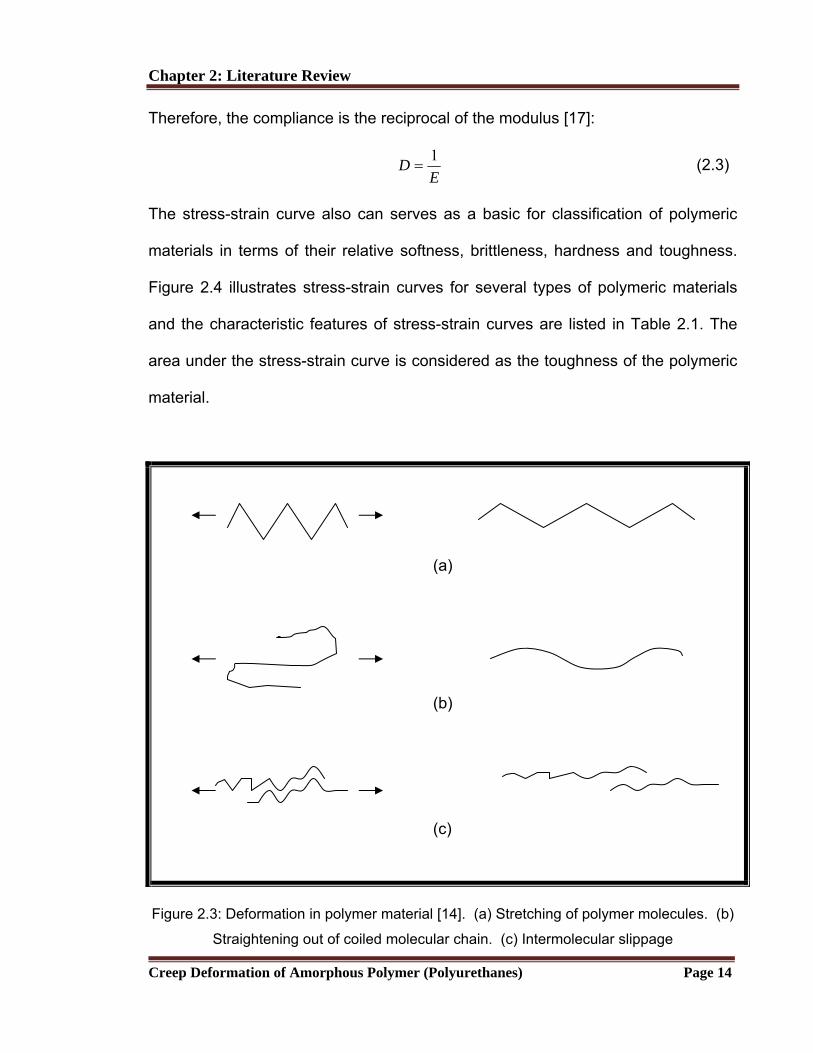
Three types of deformations are shown in
occur separately but are superimposed on each other. The bonding and the

Chapter 2: Literature Review stretching of the interatomic bonds are almost instantaneous. But, the molecular
uncoiling is relatively slow. Molecular slippage effects are the slowest of all three
deformations [16].
The deformations can be further explained by using a mechanical model combines
ooke’s law for an ideal elastic solid provides a relationship between stress and
a spring and a dashpot, known as the Maxwell Model. The spring is perfectly
elastic or Hookean behaviour. The deformations that occur because of the bending
and stretching of the interatomic bonds are analogous to the spring extension. The
nonlinear spring is similar to the deformation of uncoiling of portions of molecular
chains. Whereas the extension in the dashpot which is not recoverable and
correspond to the permanent set can represents the result of intermolecular
slippage.
H
strain for tensile deformation as [17]:
εσ E= (2.1)
where the proportionality factor, E, is c
alled the tensile modulus or Young’s
modulus. As shown in Figure 2.2, only the initial portion of the plot follows Hookean
behaviour. Conversely, the strain and the stress are related by the tensile
compliance, D, defined as:
σε D= (2.2)
Creep Deformation of Amorphous Polymer (Polyurethanes) Page 13
Chapter 2: Literature Review Therefore, the compliance is the reciprocal of the modulus [17]:
Creep Deformation of Amorphous Polymer (Polyurethanes) Page 14
E
D 1= (2.3)
The stress-strain curve also can serves as a basic for classification of polymeric
materials in terms of their relative softness, brittleness, hardness and toughness.
Figure 2.4 illustrates stress-strain curves for several types of polymeric materials
and the characteristic features of stress-strain curves are listed in Table 2.1. The
area under the stress-strain curve is considered as the toughness of the polymeric
material.
(a)
(b)
(c)
Figure 2.3: Deformation in polymer material [14]. (a) Stretching of polymer molecules. (b)
Straightening out of coiled molecular chain. (c) Intermolecular slippage

Chapter 2: Literature Review
Creep Deformation of Amorphous Polymer (Polyurethanes) Page 15
Table 2.1: Characteristic Features of
Properties [
polymer
stress strength
t
break
Stress-Strain Curves as It Relates to Polymer
15].
Description of Modulus Yield Ultimate Elongation a
Soft Low
L Mo , weak
Soft, tough
Weak, brittle
Hard, brittle
Hard, strong
Hard, tough
Low
Low
High
High
High
Low
Low
None
None
High
High
ow
Moderate
Low
Moderate
High
High
derate
High
Low
Low
Moderate
High

Chapter 2: Literature Review
Creep Deformation of Amorphous Polymer (Polyurethanes) Page 16
Figure 2.4: Classification of polymeric materials on the basic stress-strain diagram [14], [15]. (a) Hard and brittle (b) Weak and
brittle (c) Hard and strong (d) Hard and tough (e) Soft and weak (f) Soft and tough
0 0 0
0 0 0
Strain(ε)
Stress(σ) Stress(σ)
Stress(σ) Stress(σ) Stress(σ)
Strain(ε) Strain(ε)
Strain(ε) Strain(ε) Strain(ε)
(a) (b) (c)
(d) (e)
Stress(σ)
(f)

Chapter 2: Literature Review
Creep Deformation of Amorphous Polymer (Polyurethanes) Page 17
2.2.2 Creep Properties
The long-term stress-strain behaviour of polymers is generally more important than
short-term properties where the product is expected to sustain a stress or strain in
service. Not like most of the metals which only exhibit creep at higher
temperatures, polymeric materials possess significant creep even at room
temperature.
Polymers are used in applications that demand high performance and extreme
reliability. Many components, conventionally made from metals, are now made
from polymers. Thorough studies on the behaviour of polymer under long-term load
and varying temperatures are needed.
When a polymer is subjected to a constant load, it deforms quickly to a strain
roughly predicted by its stress-strain modulus, and then continues to deform slowly
with time-dependant response until rupture or yielding causes failure, sometimes
described as the primary, secondary and tertiary phase of creep [15]. This
phenomenon of deformation under constant load over time is called creep. The
secondary phase is dominant and is essentially combined with the primary phase
in engineering models for engineering applications. The tertiary phase is important
as an indication of initial rupture [18]. At high stresses, the rupture occurs sooner
than at lower stresses. However, at low enough stresses failure may never occur
[19]. All polymers creep to certain extent which its degree depends upon several

Chapter 2: Literature Review factors, such as amount of load, loading time, temperature, types of plastic, the
component geometry and fabrication method [20]. Figure 2.5 showed the effect of
stresses on creep curves.
As mentioned previously, the long-term properties are more useful, the short-term
stress-strain data is of little practical value in actual designing the part, since such
data does not take into account the effect of long-term loading on plastics. Creep
behaviour varies considerably among types of plastics; however, under proper
stress and temperature conditions, all plastics will exhibit a characteristic type of
creep behaviour. One such generalized creep curve is shown in Figure 2.6.
Creep Deformation of Amorphous Polymer (Polyurethanes) Page 18
Log time
σ1 σ2
σ3
σ4
σ5
σ1 >σ2> σ3> σ4> σ5
Stra
in p
erce
nt
Figure 2.5: Tensile creep curve with various stresses [21].

Chapter 2: Literature Review
Creep Deformation of Amorphous Polymer (Polyurethanes) Page 19
Figure 2.6: Characteristic Creep Curve with linear time scale [22].
The response of the specimen loaded by σ0 at time t=0 can be divided into an
elastic and a plastic part as
),()( 0
00 T
TE p σεσ
ε += (2.4)
Where E(T) is the modulus of elasticity. The creep strain in Figure 2.6 can then be
expressed according to
(2.5) kc tt αεεε 0)( −=
Where k <1 in the primary, k=1 in the secondary and k>1 in the tertiary creep
stage. These terms correspond to a decreasing, constant and increasing strain
rate, respectively, and were introduced by Betten [22] and Andrade [23].
A
B
C
D
II
ε0
III
Time
Rupture
E
Stra
in p
erce
nt
I

Chapter 2: Literature Review
Creep Deformation of Amorphous Polymer (Polyurethanes) Page 20
The result of equations (2.4) and (2.5) from the creep test justified a classification
of material behaviour in three disciplines: elasticity, plasticity and creep mechanics.
The creep curve in Figure 2.6 shows that there is typically an almost instantaneous
elastic strain AB followed by a time-dependent strain, which divided into three
stages: primary or transient creep, BC (stage I), secondary or steady-state creep,
CD (stage II) and tertiary or accelerated creep, DE (stage III) [14]. The initial strain,
AB represents the instantaneous elastic deformation. In primary stage, the strain
occurs rapidly but at a decreasing rate. The dislocation microstructure develops to
reduce strain rate at this stage. It is essentially similar in mechanism to retarded
elasticity and as such, is recoverable if the stress is removed.
The straight portion of the curve (CD) is characterized by a constant rate of creep.
The strain rate during this state is commonly referred to as the creep rate. It
determines the useful life of the material. The equilibrium of deformation and
recovery mechanisms is established to maintain this constant rate of creep. This
process is also called “cold flow”. It is non-recoverable because it is essentially
viscous in character. The stage III is marked by an increase in creep rate as an
increase in the true stress due to the cross section reduces (necking) and leading
to failure or creep rupture typically logarithmic curve [15].
If the applied load is released before the creep rupture occurs, an immediate
elastic recovery, substantially equal to elastic deformation followed by a period of

Chapter 2: Literature Review
Creep Deformation of Amorphous Polymer (Polyurethanes) Page 21
slow recovery is observed. The material in most cases does not recover to the
original shape and permanent set remains. The magnitude of the permanent set
depends upon length of the time, amount of stress applied, and temperature [15].
The total mechanical response of a specimen includes perfect elasticity (related
with the instantaneous strain in Figure 2.7), a coupling of elastic and viscous
components, called anelasticity and a total irreversible flow [24]. The creep
behaviour of a polymer can be represented by an appropriate combination of
mechanical models of Maxwell and Voight element. Although there are no discrete
molecular structures which behave like the individual elements of the models, but
they aid in understanding the response of polymer materials.
In the creep test, the creep values are obtained by applying constant load to test
specimen rapidly in tension, compression, or flexure and measuring the
deformation as a function of time at a constant temperature. These terms are most
commonly referred to as tensile creep, compressive creep, and flexural creep.
The creep test is more common and probably simpler since dead weight loading
can be used with multiple creep stations. The uniaxial tensile test is considered
most useful for producing accurate and consistent results that can be easily
interpreted [25]. Creep data is usually obtained for a number of different stresses,
as creep modulus will only independent of stress over limited ranges. It may also
be important to obtain data as a function of temperature. Commonly, isochronous

Chapter 2: Literature Review stress-strain curves are derived from the creep curves at different stress levels as a
useful way of displaying the information.
Tensile creep measurements are made by applying the constant load to a tensile
test specimen and measuring its extension as a function of time. The extension
measurement can be carried out in several different ways. The simplest way is to
make two gauge marks on the tensile specimen and measure the distance
between the marks at specified time intervals. The percent creep strain is
determined by dividing the extension by initial gauge length and multiplying by 100.
For a linear viscoelastic material, the effect of an applying stress, σ to the strain,
ε(t) can be divided into three parts by assuming linearity [12]:
(I) ε , an essentially instantaneous response, similar to that of an elastic solid; 1
(II) ε (t), which tends to a constant value as t tends to ∞; and 2
(III) ε (t) which is linear in time. 3
So, a time-dependent creep compliance, J(t) can be defined as [12]:
)()()()()()( 321
321 tJtJJttttJ ++=++==
σσσσε εεε (2.6)
The creep percentage is plotted against time to obtain a tensile creep curve as
illustrated in Figure 2.7. The J3(t) corresponds to flow and will be assumed as zero.
The term J1 corresponds to a response that is faster than can be observed
experimentally, rather than an instantaneous one. The strain ε1 can be called the
unrelaxed response, in contrast to the relaxed response observed at long time
Creep Deformation of Amorphous Polymer (Polyurethanes) Page 22
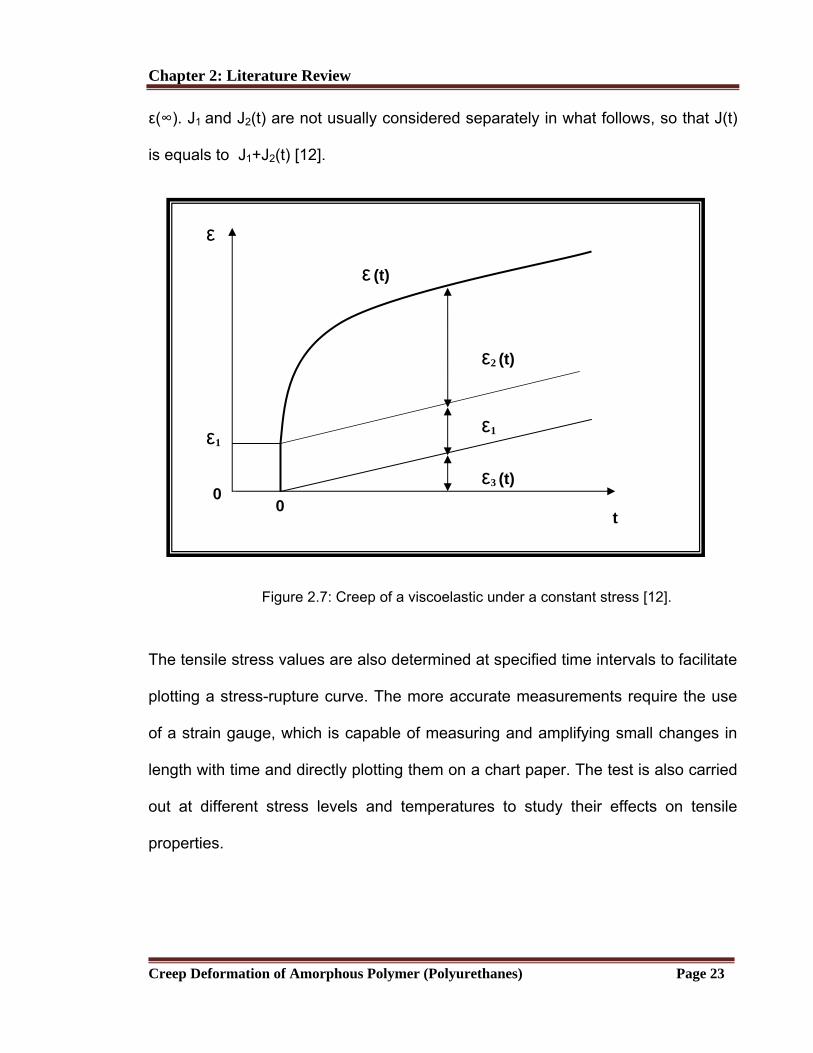
Chapter 2: Literature Review ε(∞). J and J1 2(t) are not usually considered separately in what follows, so that J(t)
is equals to J +J (t) [12]. 1 2
Creep Deformation of Amorphous Polymer (Polyurethanes) Page 23
ε
ε1
ε3 (t)
t
ε1
ε2 (t)
ε (t)
0 0
Figure 2.7: Creep of a viscoelastic under a constant stress [12].
The tensile stress values are also determined at specified time intervals to facilitate
plotting a stress-rupture curve. The more accurate measurements require the use
of a strain gauge, which is capable of measuring and amplifying small changes in
length with time and directly plotting them on a chart paper. The test is also carried
out at different stress levels and temperatures to study their effects on tensile
properties.

Chapter 2: Literature Review
Creep Deformation of Amorphous Polymer (Polyurethanes) Page 24
2.2.3 Interpretation and Application of Creep Data
Although the most common method to display the interdependence of stress, strain
and time is the earlier creep curve as illustrated in Figure 2.5. But, it is not
completely satisfied. The creep data presented in terms of strain is not convenient
to be used in design or for the purpose of comparing materials, especially when
different stress levels are used for different materials.
There are other methods which may be useful in particular applications and readily
useable. Isometric graph can be obtained by taking a constant strain section
through the creep curves and re-plotting the data as stress versus time, as shown
in Figure 2.8. Isometric curve indicates the relaxation of stress in the material when
the strain is kept constant. This isometric curve is often used as a good
approximation of stress relaxation in a polymer since stress relaxation has less
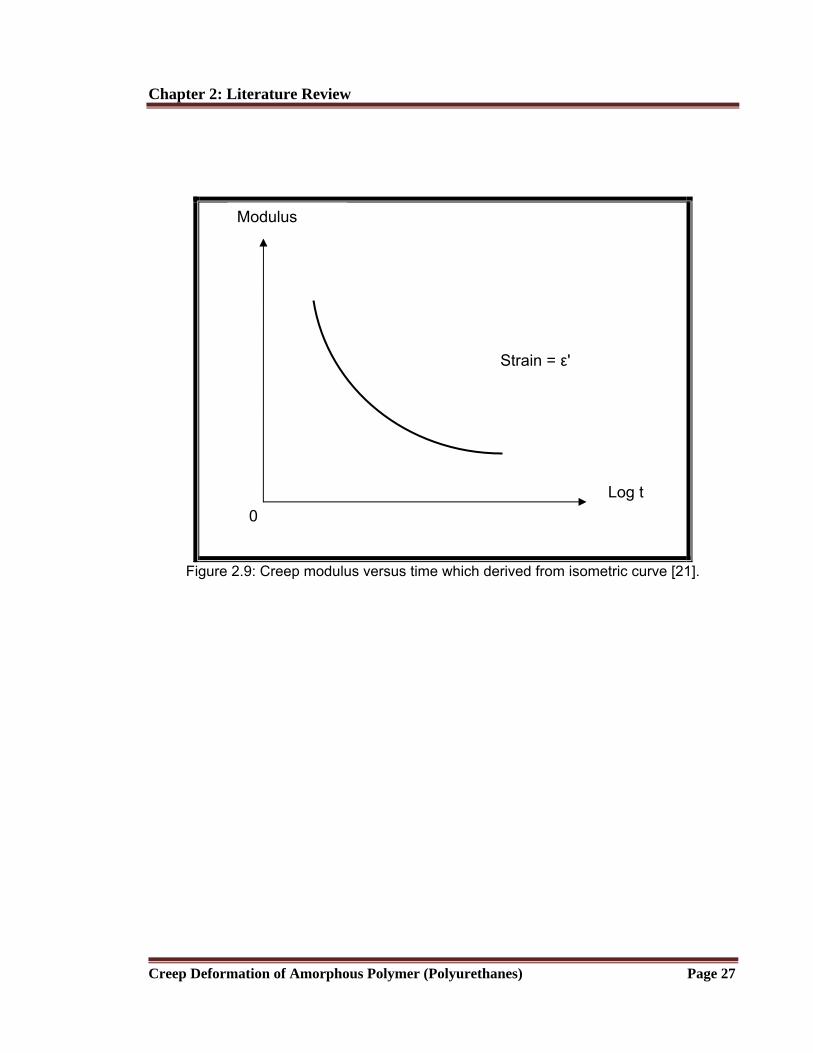
experimental procedure than creep testing. In addition, if the stress (vertical axis in
isometric curve) is divided by the strain, ε’, then a graph of modulus against time
can be obtained as shown in Figure 2.9. This is a good illustration of the time-
dependent variation of modulus.
Isochronous curve is another preferred method because it is less time-consuming
and requires less specimen preparation than creep testing. This isochronous curve
can be obtained by taking a constant time section through the creep curves and
plotting stress versus strain as shown in Figure 2.10. Isochronous test method is
quite similar to the conventional incremental loading test. The differences are the

Chapter 2: Literature Review
Creep Deformation of Amorphous Polymer (Polyurethanes) Page 25
presence of creep is recognized and the “memory”, which the material has for its
stress history is overcame by the recovery periods. Quite often isochronous data is
presented on log-log scales. The use of log-log scale will usually give a straight-line
graph and the slope indicates the linearity of the material. The slope will be 45° if it
is perfectly linear whereas non-linear material has the slope less than 45°.

Creep Deformation of Amorphous Polymer (Polyurethanes) Page 26
Figure 2.8: Construction of isometric graphs from creep curve [21].
Chapter 2: Literature Review
Chapter 2: Literature Review
Creep Deformation of Amorphous Polymer (Polyurethanes) Page 27
Figure 2.9: Creep modulus versus time which derived from isometric curve [21]
.
0
Modulus
Strain = ε'
Log t

Creep Deformation of Amorphous Polymer (Polyurethanes) Page 28
Figure 2.10: Construction of isochronous curve from creep curve [21].
Chapter 2: Literature Review

Chapter 2: Literature Review
Creep Deformation of Amorphous Polymer (Polyurethanes) Page 29
2.3 Polymer Characterization
2.3.1 Dynamic Mechanical Analysis (DMA)
DMA is becoming more and more commonly seen in the analytical laboratory to
study the deformation and flow of materials, namely rheology. DMA is more
sensitive than DSC and easily reveals the thermal transition of both soft and hard
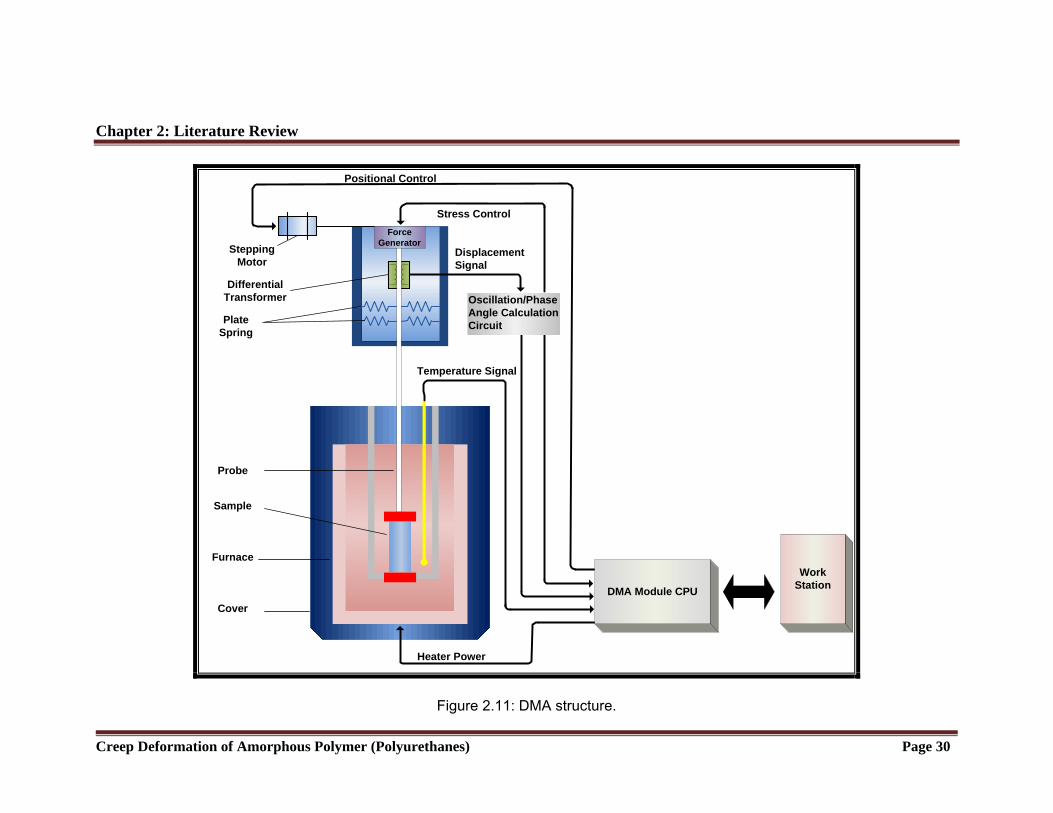
segment phases [26, 27]. DMA can be simply described as applying an oscillating
force to a sample and analyzing the material’s response to that force. Figure 2.11
shows the Diamond DMA operation principle and system structure.
The force motor applies the oscillatory force to the sample and the deformation is
detected by using the linear differential transformer. The relevant signal for
viscoelasticity is assessed from the relationship between stress and strain. The
length deformation caused by creep and thermal expansion of the sample is
compensated through the stepping motor.
DMA measures the modulus and damping properties of materials as they deform
under dynamic stress [28]. The modulus is dependent on the temperature and the
applied stress [29]. The modulus indicates how well a material will work in specific
application in the real world. In DMA, a complex modulus (E*), an elastic modulus
(E’), and an imaginary modulus (E”) are calculated from the material response to
the sine wave which show the ability of the material to store energy, lose energy
and the ratio of these effects (tan delta).
Creep Deformation of Amorphous Polymer (Polyurethanes) Page 30
WorkStationDMA Module CPU
Differential Transformer
SteppingMotor
Positional Control
Stress Control
DisplacementSignal
Heater Power
Temperature Signal
Probe
Sample
Furnace
Cover
Force Generator
Oscillation/Phase Angle Calculation CircuitPlate
Spring
Figure 2.11: DMA structure.
Chapter 2: Literature Review

Chapter 2: Literature Review Figure 2.12 shows an idealized temperature scan of a polymer. Starting at low
temperature the modulus decreases as the molecules gain more free volume,
resulting in more molecular motion. This shows main curve as divided into six
regions which correspond to local motions (1), bond bending and stretching (2),
movements in the side chain or adjacent atoms in the main chain (3), the region of
Tg (4), coordinated movements in the amorphous portion of the chain (5), and the
melting region (6) [29].
Creep Deformation of Amorphous Polymer (Polyurethanes) Page 31
(6) Tm-melting
Figure 2.12: An ideal DMA scan showing the types of transition [29].
(4)
(5) Rubbery Plateau E’ /
Pa
Temperature/ K
Tγ(1)
(2)
(3) Tα or Tg
Tβ
Beta transitions are often related to the toughness.
Rubbery plateau is related to the molecular weight between cross-links or entanglements.
For thermosets, no Tm occurs.
In purely crystalline materials, no Tg occurs.
Tg is related to the molecular mass up to a limiting value.
(2) Bend and stretch
(3) Side groups
(4) Gradual main chain
(5) Large scale chain
(6) Chain slippage
(1) Local motion

Chapter 2: Literature Review The Tg is very dependent on the degree of polymerization up to a value known as
the critical T or the critical molecular weight. The Tg g represents a major transition
for many polymers, as physical properties change drastically as the material goes
from hard glassy to rubbery state. The Tg value can be obtained from the peak or
onset of the tan delta curve, the onset of the storage modulus drops, and the onset
or the peak of the loss modulus curve [29]. The values obtained from these
methods can differ up to 25°C from each other on the same run. In additional, a 10-
20°C difference from the DSC is also seen in many materials.
Many methods on dynamic mechanical measurements have been described [29,
30]. In this study, the samples have been scanned at different temperatures with
constant frequency to detect the transitions in materials.
2.3.2 Differential Scanning Calorimetry (DSC)
DSC is a technique which records the difference in temperature between a sample
and a reference material against either time or temperature as the two specimens
are subjected to identical temperature conditions in an environment heated or
cooled at a controlled rate [31].
If unit mass of a substance is heated at constant pressure in such a way that the
rate of supply of energy, Q is dQ/dt and the rate of rise of temperature, T is dT/dt,
the specific heat of the substance at constant pressure C is given by [12]: p
Creep Deformation of Amorphous Polymer (Polyurethanes) Page 32

Chapter 2: Literature Review
dtdTdtdQdTdQC p /
// == (2.7)
There are two pans in DSC, one is the sample pan where the sample is put and the
other one is the reference pan which will be left empty as shown in Figure 2.13.
The instrument allows the common temperature of the two pans to be changed at a
constant rate dT/dt, while the two pans are ideally maintained at the same
temperature by a feedback loop. Extra energy Q must be supplied to the sample
pan at a rate dQ/dt to maintain its temperature to be the same as the reference
pan. This rate is registered by the instrument and plotted either against
temperature, T or against time, t.
Creep Deformation of Amorphous Polymer (Polyurethanes) Page 33
Figure 2.13: A schematic diagram of a DSC apparatus [12].
It is generally possible to assume that, away from any transition in the sample, the
sample and the sample pan are at the same temperature and that the sample and
Reference Pan
Sample Sample
Pan
Individual Heaters
Computer to monitor the temperature and regulate
heat flow Temperature
Sensor

Chapter 2: Literature Review reference pan are identical. It then follows that dQ/dt = mCp, where m is the mass
of the sample and C is the specific heat per unit mass [12]. p
Figure 2.14 shows the DSC trace that often seen for polymers. On warming, at a
certain temperature called the glass transition temperature, Tg, an amorphous
polymer starts to soften. When the polymer is cooled below this temperature, it
becomes hard and brittle, like glass.
Glass transition may occur as the temperature of an amorphous solid is increased.
The heat flow shifts upward suddenly at Tg as shown in Figure 2.14 at a constant
heat rate. This is due to the sample undergoing a change in heat capacity; no
formal phase change occurs.
Above the Tg, polymer chains have a lot of mobility [12]. If the polymer is linear, it
will flow, although the viscosity may be very high. When they reach the right
temperature, the molecules may obtain enough freedom of motion to move into a
very ordered arrangement, which we call crystalline form. This is known as
crystallization temperature, Tc. When polymers fall into crystalline form, they give
off heat. It is an exothermic process and results in a peak in the DSC curve as can
be seen in Figure 2.14. If the polymer is cross-linked, then it never flows and never
really becomes a liquid, but remains a soft amorphous solid like rubber.
Creep Deformation of Amorphous Polymer (Polyurethanes) Page 34

Chapter 2: Literature Review When the polymer is keep heating up after Tc, the temperature will continue to
increase until it reaches its melting temperature, Tm; then the temperature remains
constant until it has completely melted. The melting process results in an
endothermic peak in the DSC curve as can be seen in Figure 2.14.
Creep Deformation of Amorphous Polymer (Polyurethanes) Page 3
Figure 2.14: A schematic DSC curve demonstrating the appearance of several common
features seen for polymers [12].
2.3.3 X-Ray Diffraction (XRD)
An X-ray diffraction illuminates a sample of material with x-rays of known
wavelength, moving the sample and detector in order to measure the intensity of
Melting
TmTg Tc
Cold Crystallisation
Temperature
Heat Flow
5
Chapter 2: Literature Review the diffracted radiation as a function of beam and sample orientation. From the
resulting intensity versus angle plot much can be inferred about the structure of the
material. When an X-ray monochromatic beam hits on a sample, two processes
can be observed [31]:
i) If the sample has a periodic structure (crystalline regions) the X-ray is
scattered coherently. This process occurs without change of wavelength and
without loss of phase relationship between the incident and scattered rays.
This process is called a diffraction X-ray effect and is measured by wide-
angle X-ray diffraction.
ii) If the sample has an unperiodic structure which posses different electronic
densities (crystalline and amorphous regions), the X-ray is scattered
incoherently (Compton Scattering). This inelastic scattering process occurs
with change of wavelength and change of phase relationship between the
incident and the scattered rays. This process is called a diffuse X-ray
diffraction effect and is measured by small-angle X-ray scattering.
Diffracted waves from different atoms can interfere with each other and the
resultant intensity distribution is strongly modulated by this interaction. If the atoms
are arranged in a periodic order, as in crystals, the diffracted wave will consist of
sharp interference maxima with the same symmetry as in the distribution of atoms.
Creep Deformation of Amorphous Polymer (Polyurethanes) Page 36

Chapter 2: Literature Review Measuring the diffraction pattern therefore allows us to deduce the distribution of
atoms in a material.
The peaks in the x-ray diffraction pattern are directly related to the atomic
distances. Figure 2.15 shows the geometry of the diffraction of X-rays in a crystal.
Crystals diffract X-rays coherently according to Bragg’s Law, giving sharp peaks,
while amorphous materials scatter X-rays incoherently giving a diffuse halo [32].
For a set of lattice plane with an inter-plane distance of d (hkl) , the condition for a
diffraction to occur can be simply written as [31, 33]:
nλ = 2 d sin θ (2.8) (hkl)
which is known as the Bragg’s Law. In the equation, n is an integer 0, 1, 2, 3, …,
called the order, λ is the X-ray wavelength, d (hkl) is the distance between adjacent
planes in the crystal, and θ is one-half the angle of deviation of the diffracted rays
from the incident X-rays.
Creep Deformation of Amorphous Polymer (Polyurethanes) Page 37

Chapter 2: Literature Review
Creep Deformation of Amorphous Polymer (Polyurethanes) Page 3
λ
Figure 2.15: Geometry of the diffraction of X-rays in a crystal [31].
X-ray diffraction permits an accurate description of the statistical distribution of the
atoms showing disordered structure, if the substance is homogeneous, the forces
of interaction are isotropic and the substance is monatomic or made up of
molecules of known structure whose orientation is completely random [34]. If the
internal structure of the molecule is unknown and complex, the interpretation of the
pattern become difficult because intramolecular interference adds to the
intermolecular interference and it is impossible to separate the two effects.
The degree of crystallinity can be determined if the crystalline and amorphous
scattering in the diffraction pattern can be separated from each other. The degree
d (hkl)2θθθ
Diffracted X-rays Incident X-rays
Atoms
(hkl)
(hkl)
d (hkl)
(hkl)
8

Chapter 2: Literature Review of crystalline, cχ is equal to the ratio of the integrated crystalline scattering , both
crystalline and amorphous, and is given by [31]:
∫
∫∞
∞
=
0
2
0
2
)(
)(
dssIS
dssIS c
cχ (2.9)
Where S is the magnitude of the reciprocal lattice vector and is given by:
S= (2 sin θ)/ λ (2.10)
θ is one-half the angle of deviation of the diffracted rays from the incident X-rays,
λ is the X-ray wavelength, I(s) is the intensity of coherent X-ray scatter from a
specimen (both crystalline and amorphous), and Ic(s) is the intensity of coherent X-
ray scatter from the crystalline region.
Beside that, the Scherrer equation also is the basis of the XRD method for the
determination of the crystallinity [35]. The Scherrer equation in its general form is
written as [33, 35- 37]:
(2.11) θβ
λcosKL =
Where L is the mean dimension of the crystallites composing the powder, K equals
to 0.9 is the Scherrer constant approximately equal to unity, λ is the radiation
wavelength, θ is the angular position of the peak of interest and β is the full angular
width at half-maximum intensity of the reflection in radians.
Creep Deformation of Amorphous Polymer (Polyurethanes) Page 39
Chapter 2: Literature Review 2.3.4 Scanning Electron Microscopy (SEM)
SEM is a microscope that uses electrons instead of light to form an image. Figure
2.16 shows a schematic diagram of a typical SEM and how it works.
The micrographs obtained from the SEM provide a lot of important information of a
sample such as the morphology, the surface features, composition and the
crystallographic information of the sample. The shape and size of the particles
making up the sample and the direct relation between these structures and
materials properties such as ductility, strength and reactivity then can be evaluated.
How the atoms are arranged in the object also has direct relation to the material
properties like conductivity, electrical properties and its strength.
A beam of electrons is produced at the top of the microscope by an electron gun.
The electron beams follows a vertical path through the microscope, which is held
within a vacuum. The electron beam travels through electromagnetic fields and
lenses, which focus the beam down toward the sample.
Once the beam hits the sample, electrons and X-rays are ejected from the sample
as shown in Figure 2.17. These X-ray, backscattered electrons and secondary
electrons will be collected by the detector and then converted into the signal. This
produces the final image.
Creep Deformation of Amorphous Polymer (Polyurethanes) Page 40

Chapter 2: Literature Review
Figure 2.16: A schematic diagram of a SEM apparatus [38].
Magnification is controlled by adjusting the dimensions of the raster on the
specimen and the display screen. Scan time for examination and recording are
important. Longer scan time give better signal-to-noise characteristics than the
short scan time.
Creep Deformation of Amorphous Polymer (Polyurethanes) Page 41

Chapter 2: Literature Review
Creep Deformation of Amorphous Polymer (Polyurethanes) Page 4
Sample
Primary Backscattered
Secondary Electrons
Incident Beam X-rays
Auger Electrons
Figure 2.17: Secondary signals that are generated during electron beam irradiation [38].
The SEM has many advantages over traditional microscopes. It has a large depth
of field, which allows more of a specimen to be in focus at one time and it also has
much higher resolution.
2
Chapter 3: Experimental Methods
Creep Deformation of Amorphous Polymer (Polyurethanes) Page 43
CHAPTER 3: EXPERIMENTAL METHODS
3.1 Materials Description
The polyurethanes were synthesized from poly(tetramethylene oxide) (PTMO),
2,4-Tolylene Diisocyanate (TDI), Isophorone Diisocyanate (IPDI), Hexamethylene
Diisocyanate (HDI), and 1,4- Butanediol (BDO) by 2-step polyaddition reaction.
Chemicals used in the synthesis of polyurethanes are described in Table 3.1.
PTMO of molecular masses 1000 g/mol and 2000 g/mol were purchased from
Aldrich. The polyol was dried at 75-80°C under reduced pressure (vacuum) for 2
hours before use. TDI from Fluka, and IPDI from Aldrich were used. BDO from
Aldrich was dried at 75-80°C under reduced pressure for 2 hours before use.
3.2 Sample Preparation
Polyol and BDO were demoistured under reduced pressure. Demoistured polyol
was then reacted with diisocyanates viz. TDI, HDI or IPDI in the temperature range
of 75 to 80°C. The mixture was stirred continuously for half an hour to one hour to
get the pre-polymer with terminal NCO groups. The pre-polymer was further
reacted with BDO and the mixture was stirred continuously for 15 minutes. The
reaction mixture was poured into a glass die, which was coated with a mould-
releasing agent. The die was kept in a vacuum oven for degassing at 55°C for 48
hours for TDI base polyurethane and 10 days for IPDI-based polyurethane to

Chapter 3: Experimental Methods
Creep Deformation of Amorphous Polymer (Polyurethanes) Page 44
obtain the solid cured sheets, which were subjected to characterization after proper
conditioning at room temperature. The ratio of diisocyanate/ polyol/ chain extender
was used according to the compositions as described in Table 3.2.
Polyurethane elastomers are block copolymers which consist of soft segments and
hard segments [39]. The hard segments are made from diisocyanete by addition of
a chain extender like butanediol [40- 42]. The soft segments consist of the long
flexible polyether or polyester chains which interconnect two hard segments [39].
The soft segment provides elastomeric character for the polymer, while hard
segment provides dimensional stability [43] and particularly affects the modulus,
hardness and tear strength [44] .
Chapter 3: Experimental Methods
Creep Deformation of Amorphous Polymer (Polyurethanes) Page 45
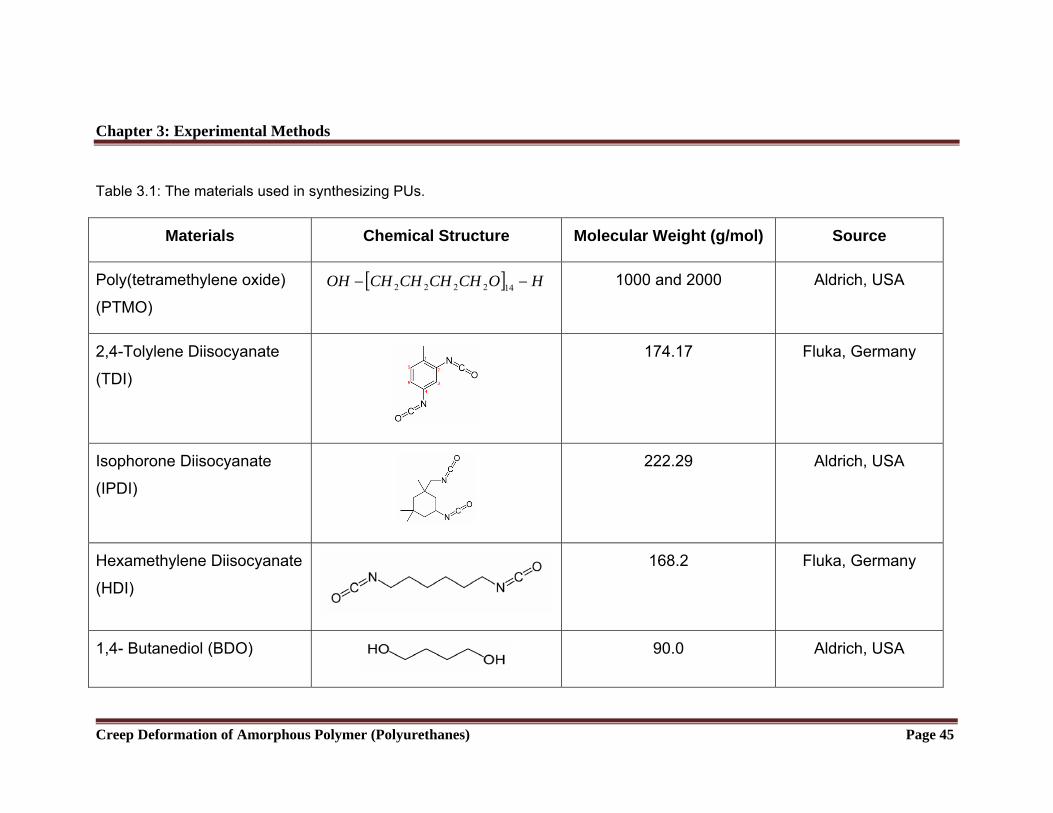
Table 3.1: The materials used in synthesizing PUs.
Materials Chemical Structure Molecular Weight (g/mol) Source
[ ] HOCHCHCHCHOH −− 142222Poly(tetramethylene oxide)
(PTMO)
1000 and 2000 Aldrich, USA
2,4-Tolylene Diisocyanate
(TDI)
174.17 Fluka, Germany
Isophorone Diisocyanate
(IPDI)
222.29 Aldrich, USA
Hexamethylene Diisocyanate
(HDI)
168.2 Fluka, Germany
1,4- Butanediol (BDO) 90.0 Aldrich, USA

Creep Deformation of Amorphous Polymer (Polyurethanes) Page 46
Table 3.2: Compositions of the prepared PU samples.
Composition
Samples Diisocyanate
(3.2 Mol)
Polyol
(1.0 Mol)
Chain Extender
(2.0 Mol)
BDO
BDO
BDO
BDO
PU1-TDI
PU2-TDI
PU1-IPDI
PU1-HDI
TDI
TDI
IPDI
HDI
PTMO (Mw=1000)
PTMO (Mw=2000)
PTMO (Mw=1000)
w=1000) PTMO (M
Chapter 3: Experimental Methods

Chapter 3: Experimental Methods
3.3 Conventional Static Creep Tests
3.3.1 Testing Apparatus
A measurement set-up system as in Figure 3.1 was used for the conventional
creep testing. The apparatus consists of extension measurement, sample holder,
weight and weight holder. This measurement set-up system was made according
to ASTM D2990 requirements [45].
Creep Deformation of Amorphous Polymer (Polyurethanes) Page 47
Sample Frame
Ruler
Figure 3.1 Creep testing system set up.

Chapter 3: Experimental Methods The specimen is attached by pins to two grips, one of which is suspended from a
stable frame and the end of the other grip is then loaded by hanging to the weight.
The grip surfaces are deeply serrated with a coarse of single-cut file, serrations
about 3/32 in. apart and about 1/16 in. deep to prevent slippage of the specimen. A
ruler is attached to the apparatus to measure the extension of the specimen. An
electronic balance is used to measure the weights applied to the specimen.
3.3.2 Specimen Preparation
The prepared polyurethane sheets were stamped out using a punch die and
hydraulic system into dog-bone shape or also known as dumbbell shape. See
Figure 3.2.
Creep Deformation of Amorphous Polymer (Polyurethanes) Page 48
Figure 3.2 Dumbbell shape cutter with ASTM D638 standard.

Chapter 3: Experimental Methods These dumbbell shape specimens were dimensioned according to ASTM D638
Type IV requirements as shown in Figure 3.3 [45]. Thickness measurements were
made on the individual specimens and actual thickness were found to range from
1.400 mm to 1.800 mm. The specimens were stored under ambient temperature
and humidity conditions; there was no other conditioning of the specimens before
testing.
Figure 3.3 Dimension of ASTM D638 Type IV [45].
Creep Deformation of Amorphous Polymer (Polyurethanes) Page 49

Chapter 3: Experimental Methods
Creep Deformation of Amorphous Polymer (Polyurethanes) Page 50
3.3.3 Static Creep Test Procedure
The apparatus which was used to conduct the creep test was shown in the
previous section. The procedures to do the creep test are as following.
1. Five pieces of specimens with approximate same thickness from the range
1.40 mm to 1.80 mm were tested at each stress level.
2. The width and thickness of each specimen were measured at both end and
at the centre of the effective gauge length before the test. The values
measured were averaged for calculations. All measurements are made in SI
unit.
3. The effective gauge length and clamp area were measured and marked so
that the measurement can be made correctly and all the specimens are
clamped in approximately same length. See Figure 3.4.
4. Test specimen was clamped properly by the grip to minimize eccentric
loading of the specimen. The grips had been tightened evenly and firmly to
the degree necessary to prevent slippage of the specimen during the test
but not to the point where the specimen would be crushed.
5. The load cell was weighed and recorded. The stress that will be applied to
the specimen was calculated based on the cross-sectional area of the
specimen.
6. The load cell was applied to the specimen quickly but very gently.
7. Test temperature was maintained at room temperature. The temperature
and relative humidity were recorded by using thermometer.

Chapter 3: Experimental Methods
8. The strain readings were taken by following the interval thereafter: 5s, 10s,
15s, 20s, 25s, 30s and 60min, then every one minute to 1 hour; every 24
hour to 500 hour; and then every 48 hour to 1000 hour.
Figure 3.4 Diagram showing gripping surface and effective gauge length for creep test.
3.4 Tensile Tests
3.4.1 Testing Apparatus and Test Procedure
Tensile test were performed by using an Instron model 4443 testing machine as
shown in Figure 3.5 on four different types of polyurethanes. It is a constant-rate-
of-crosshead movement tensile machine. A controlled-velocity drive mechanism is
used.
Creep Deformation of Amorphous Polymer (Polyurethanes) Page 51

Chapter 3: Experimental Methods
Creep Deformation of Amorphous Polymer (Polyurethanes) Page 52
The Instron Testing System consists a load frame into which a specimen of the
test material is mounted and a control console. The load frame applies a tensile
load to the specimen, while the control console provides calibration, test setup and
test operating controls.
The load frame provides a rigid mounting structure capable of applying a load to a
specimen by means of a moving crosshead. It has an essentially stationary
member carrying one grip and a movable member carrying another grip. Self-
aligning grips employed for holding the test specimen between the two members
prevent alignment problems. A load cell mounted in the frame provides accurate
measurement of the force applied to the specimens.
The control console comprises the main control panel for the system. It has
provision for an IEEE-488 General Purpose Instrument Bus which allows remote
supervisory control of test procedures through a programmable computer.
The samples were tested in the speed of 500 mm/min. The tests were conducted
under ambient temperature and humidity condition. Five pieces of specimens with
approximate same thickness were tested for each sample.

Chapter 3: Experimental Methods 3.4.2 Specimen Preparation
The specimens were prepared according to ASTM D638 Type IV requirements as
stated in Section 3.3.2. The specimens were stored under ambient temperature
and humidity conditions; there was no other conditioning of the specimens before
testing.
Figure 3.5 Instron 4443 Tensile Testing Machine.
Creep Deformation of Amorphous Polymer (Polyurethanes) Page 53

Chapter 3: Experimental Methods
Creep Deformation of Amorphous Polymer (Polyurethanes) Page 54
3.5 Dynamic Mechanical Analysis (DMA)
3.5.1 Testing Apparatus
DMA is an analyzer which can be use to characterize the material in term of its
behaviour and to study the performance of the material under condition as close as
possible to real.
The Perkin Elmer Diamond DMA was used in this study to determine the glass
transition temperature, Tg by monitor the dynamical mechanical response as a
function of temperature. DMA was also used to determine the damping factor (tan
δ), the dynamic storage modulus (E’) and loss modulus (E”) of PU. Upon passing
through the glass transition, E’ changes up to three orders of magnitude, E” and
tan δ have maxima value. Tg is taken to be the temperature corresponding to one
of these maxima. But usually, they have slightly different. Figure 3.6 shows the
picture of the Perkin Elmer Diamond DMA.
The DMA experiments were carried out by using the tensile mode at a fixed
frequency of 1Hz. Storage modulus, loss modulus and tan delta were determined
during heating over the temperature range from -100 °C to 150 °C at a heating rate
of 2 °C /min.

Chapter 3: Experimental Methods
Figure 3.6: Perkin Elmer Diamond DMA.
3.5.2 Specimen Preparation
The fabricated polyurethane sheets were stamped out using a punch die and
hydraulic system into a rectangular cross section bar as shown in Figure 3.7.
Thickness measurements were made on the individual specimens and actual
thickness were found to range from 1.55 to 2.00mm. The effective gauge length is
20.0mm. The specimens were stored under ambient temperature and humidity
conditions; there was no other conditioning of the specimens before testing.
Creep Deformation of Amorphous Polymer (Polyurethanes) Page 55

Chapter 3: Experimental Methods
Creep Deformation of Amorphous Polymer (Polyurethanes) Page 56
Figure 3.7 Dynamic mechanical analysis specimen geometry.
3.6 Other Characterization Methods
3.6.1 Differential Scanning Calorimetry (DSC)
Differential Scanning Calorimetry experiments were performed by using a
METTLER TOLEDO DSC822e as shown in Figure 3.8 equipped with an intra-
cooler which allows furnace cool to -60°. The system was automated with a sample
robot. STAR e software was used to connect application between instrument and
computer system. The resulting endotherm data was also analyzed using STAR e
software.

Chapter 3: Experimental Methods The samples were weighted around 10.0 to 13.0 mg for each experiment in a
hermetically sealed atmosphere. The self-generated atmosphere was obtained by
piercing a 50 μm hole in the aluminium lid of a sealed crucible.
The samples were measured with the following temperature program:
Creep Deformation of Amorphous Polymer (Polyurethanes) Page 57
(i) Heating the sample from -60 oC to 150 o oC at 5 C/min
(ii) Cooling from 150 oC to -60 oC at 5 oC/min
(iii) Heating from -60 oC to 200 o oC at 5 C/min (the actual measurement)
Figure 3.8: Mettler Toledo DSC822e
The DSC temperature program ran dynamically as shown in Figure 3.9 under
nitrogen condition with a flow rate of 50 ml/min. The first heating was done to

Chapter 3: Experimental Methods eliminate or equalize the thermal history of the samples because the first heating
will show the effects that related to the different thermal history of the sample.
Therefore, the second heating was used for the evaluation purpose.
Creep Deformation of Amorphous Polymer (Polyurethanes) Page 58
Figure 3.9: The DSC temperature program used for all samples during the experiment.
3.6.2 X-ray Diffraction (XRD)
XRD experiments were carried out on Siemens D5000 x-ray diffractometer as
shown in Figure 3.10. All experiments were carried out on samples of approximate
1.50 mm thickness at room temperature. Table 3.3 shows the details of the XRD
Diffractometer (Siemens D5000).
-60
0
150
Time/min
Temperature, oC

Chapter 3: Experimental Methods The radiation emanating from the line focus of the X-ray tube is diffracted at the
sample and recorded by the detector. The sample rotates at a constant angular
velocity such that the angle of incidence of primary beam changes whilst the
detector rotates at double angular velocity around the sample. The diffraction angle
is thus always equal to twice the glancing angle.
The detector and the connected measuring electronic measure the intensity of the
reflected radiation; the angular position of the reflections is displayed at the
controller.
Creep Deformation of Amorphous Polymer (Polyurethanes) Page 59
Figure 3.10: Siemens D5000 x-ray diffractometer.

Chapter 3: Experimental Methods
Creep Deformation of Amorphous Polymer (Polyurethanes) Page 60
Table 3.3: The specifications of XRD Diffractometer -Siemens D5000.
Source Copper (Cu) Kα
Source wavelength 1.54056 Å
Power supply Voltage: 20-40kV Current: 20-40mA
Step mode Continuous scan
Range size 0-120°
Step size 0.1°
Step time 1.0s
Glancing angle 2.0°
Scanning mode Detector scan
3.6.3 Scanning Electron Microscopy (SEM)
Morphology study was carried out using a Leica Stereoscan 420 instrument as
shown in Figure 3.11. The samples were mounted on a double-sided adhesive and
then stick on a disc. The surface of the sample must be electrically conductive. A
very thin metallic surface coating such as gold must be sputtered to avoid build-up
charge.
The surface of the sample is scanned with an electron beam and the reflected
beam of electrons is collected. The image that appears on the screen, which may
be photographed and represents the surface features of the specimen.

Chapter 3: Experimental Methods
Creep Deformation of Amorphous Polymer (Polyurethanes) Page 61
Figure 3.11: Leica Stereoscan 420 Scanning Electron Microscopy.

Chapter 4: Results and Discussions
Creep Deformation of Amorphous Polymer (Polyurethanes) Page 62
CHAPTER 4: RESULTS AND DISCUSSIONS
4.1 Static Creep Test Results
In this study, creep test has been conducted over a range of stresses to fully
characterize the creep behaviour of PUs. It can be used directly to determine the
time at which a given strain is reached under various stresses. The test was carried
out at room temperature and humidity for 1.0x10⁷ seconds. The percent creep
strains were plotted as a function of linear and logarithmic time to obtain a tensile
creep curve.
Figure 4.1 to Figure 4.4 show the creep curves for all four PUs. This may be useful
information since the failure criterion is usually expressed in the terms of a limiting
strain and thus, knowing the stress, the materials durability can be determined. In
order to predict the response of a certain polymer to a very long period like years or
tens of years, these curves must be extrapolated over a wide time interval.
As the stress increases, the deformation of sample will increase too, as should be
expected from all the samples. The effect of stresses to the creep behaviour of
PU1-TDI is illustrated in Figure 4.1. The elastic strain of PU1-TDI increased with
the increase of applied stress from 2 MPa to 8 MPa. The strain increased more
rapidly in the first few hours followed by a reduce rate of creep later in the
Chapter 4: Results and Discussions
Creep Deformation of Amorphous Polymer (Polyurethanes) Page 63
experiment. The creep strain approached a steady state after 29 hours for the
applied stress of 8 MPa and prolong to 300 hours for the applied stress of 2 MPa.
Approximately 550% to 582% strain was achieved by sample PU1-TDI at 1.0x10⁷
seconds.
For PU2-TDI, approximately 410% to 525% strain was achieved at 1.0x10⁷
seconds. PU2-TDI showed a lower creep strain compare to the PU1-TDI. Creep
strains accumulate at a decreasing rate and no third stage creep is observed for
both PU1-TDI and PU2-TDI. No failure occurred for both samples until the end of
the creep test as show in Figure 4.1 and 4.2. From the creep test, it can be seen
that the molecular weight affects the mechanical properties of PUs [27].
PU1-IPDI showed the highest creep deformation among the four samples. PU1-
IPDI failed in 1.62x10⁴ seconds for an applied stress of 2 MPa after it went through
a shortest steady stage compare to PU1-TDI, PU2-TDI and PU1-HDI. For the
applied stresses of 4 MPa, 6 MPa and 8 MPa, PU1-IPDI failed in a more brittle
manner within 1.8x10³ seconds. No obvious steady-state creep was found for
these three several of applied stresses on PU1-IPDI. The creep curves in Figure
4.3 show that PU1-IPDI is a soft and weak material.
As PU1-TDI and PU2-TDI, PU1-HDI showed a high creep strain rate at the start of
the creep and decreased with time. It exhibited a longer primary stage which took

Chapter 4: Results and Discussions
Creep Deformation of Amorphous Polymer (Polyurethanes) Page 64
about 7.0x10⁶ seconds to proceed to steady stage. PU1-HDI showed the highest
creep strain among four samples, approaching approximately 550% to 635% of
strain at 1.0x10⁷ seconds. No third stage creep is observed for PU1-HDI during the
creep test.
The isochronous method allows the plotting stress-strain curve of PU1-TDI as
plotted in Figure 4.5, which permits the strain interpolation for different stress levels
at a specific time of loading pertinent to particular application. These are obtained
by plotting constant time lines on creep curves from Figure 4.1 and reading off the
combination of stresses required to produce a specified strain. It also can be used
to evaluate the deformational behaviour of a sample because the data presentation
is similar to the conventional tensile test data. Figure 4.5 reports the isochronous
curves for time 100s, 1000s, 10000s and 100000s and proved the non-linearity
strain of the materials.
The Figure 4.6 shows the isometric curve of PU1-TDI at strain equivalent to 545%.
This isometric curve is obtained by plotting constant strain lines on creep curves at
various stresses and constant temperature. This isometric stress-time curve
enables the time required to reach a particular strain to be read off for a specified
stress and temperature. This data can be used as an approximation of stress
relaxation since stress relaxation test is a less common experimental procedure
than creep testing. As can be seen from the Figure 4.6, the stress needed for the

Chapter 4: Results and Discussions
Creep Deformation of Amorphous Polymer (Polyurethanes) Page 65
PU1-TDI to reach the strain of 545% at 1x10⁴ s is 4 MPa.
For the purpose of comparison among the materials, the plot of creep modulus
versus time not only realistically ranks materials but also provides modulus values
for use in many design equations. Besides, creep modulus can be calculated by
dividing the initial stress by the strain at certain time to estimate the stress
relaxation. Figure 4.7 to 4.10 show the logarithmic creep modulus versus time at
various stress levels for all four samples. The creep modulus is directly affected by
the increase in the level of stress. The creep modulus being highest for the highest
applied stress.

Chapter 4: Results and Discussions
Creep Deformation of Amorphous Polymer (Polyurethanes) Page 66
(a)
0.0 2.0x10⁶ 4.0x10⁶ 6.0x10⁶ 8.0x10⁶ 1.0x107500
510
520
530
540
550
560
570
580
590
600
Stra
in/ %
Time/ sec
2MPa 4MPa 6MPa 8MPa
(b)
100 101 102 103 104 105 106 107500
510
520
530
540
550
560
570
580
590
600
Stra
in/ %
Time/ sec
2MPa 4MPa 6MPa 8MPa
Figure 4.1: Creep strain of PU1-TDI as a function of (a) linear and (b) logarithmic time at various stresses.

Chapter 4: Results and Discussions
Creep Deformation of Amorphous Polymer (Polyurethanes) Page 67
(a)
0.0 2.0x10⁶ 4.0x10⁶ 6.0x10⁶ 8.0x10⁶ 1.0x107340
360
380
400
420
440
460
480
500
520
540
Stra
in/%
T ime / sec
2MPa 4MPa 6MPa 8MPa
(b)
100 101 102 103 104 105 106 107340
360
380
400
420
440
460
480
500
520
540
Stra
in/%
Time / sec
2MPa 4MPa 6MPa 8MPa
Figure 4.2: Creep strain of PU2-TDI as a function of (a) linear and (b) logarithmic time at
various stresses.

Chapter 4: Results and Discussions
Creep Deformation of Amorphous Polymer (Polyurethanes) Page 68
(a)
0.0 5.0x10³ 1.0x10⁴ 1.5x10⁴ 2.0x104480
490
500
510
520
530
540
550
560
570
580
590
600
Stra
in/ %
Time/ sec
2MPa 4MPa 6MPa 8MPa
(b)
100 101 102 103 104 105 106 107480
490
500
510
520
530
540
550
560
570
580
590
600
Stra
in/ %
Time/ sec
2MPa 4MPa 6MPa 8MPa
Figure 4.3: Creep strain of PU1-IPDI as a function of (a) linear and (b) logarithmic time at
various stresses.
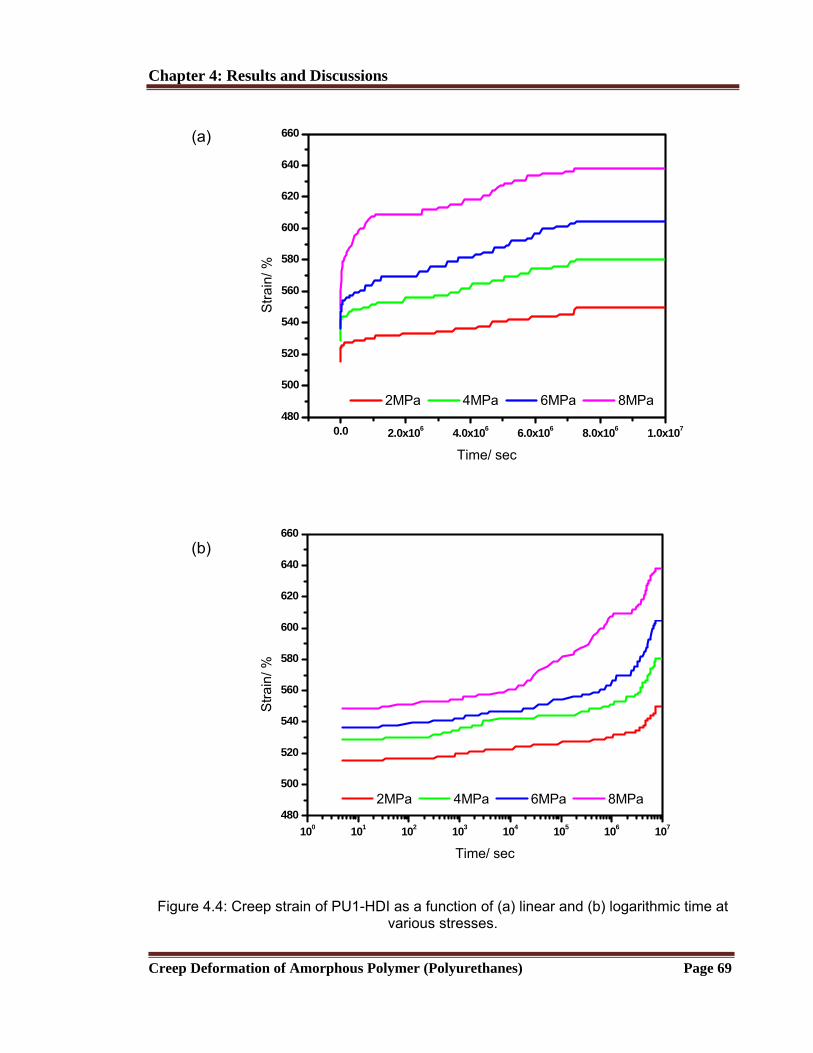
Chapter 4: Results and Discussion
s
Creep Deformation of Amorphous Polymer (Polyurethanes) Page 69
Figure 4.4: Creep strain of PU1-HDI as a function of (a) linear and (b) logarithmic time at various stresses.
(b)
(a)
0.0 2.0x10⁶ 4.0x10⁶ 6.0x10⁶ 8.0x10⁶ 1.0x107480
500
520
540
560
580
600
620
640
660
Stra
in/ %
Time/
sec
100 101 102 103 104 105 106 107480
500
520
540
560
580
600
620
640
660
Stra
in/ %
Time/ sec
2MPa
2MPa
4MPa
4MPa 6MPa 8MPa
6MPa 8MPa
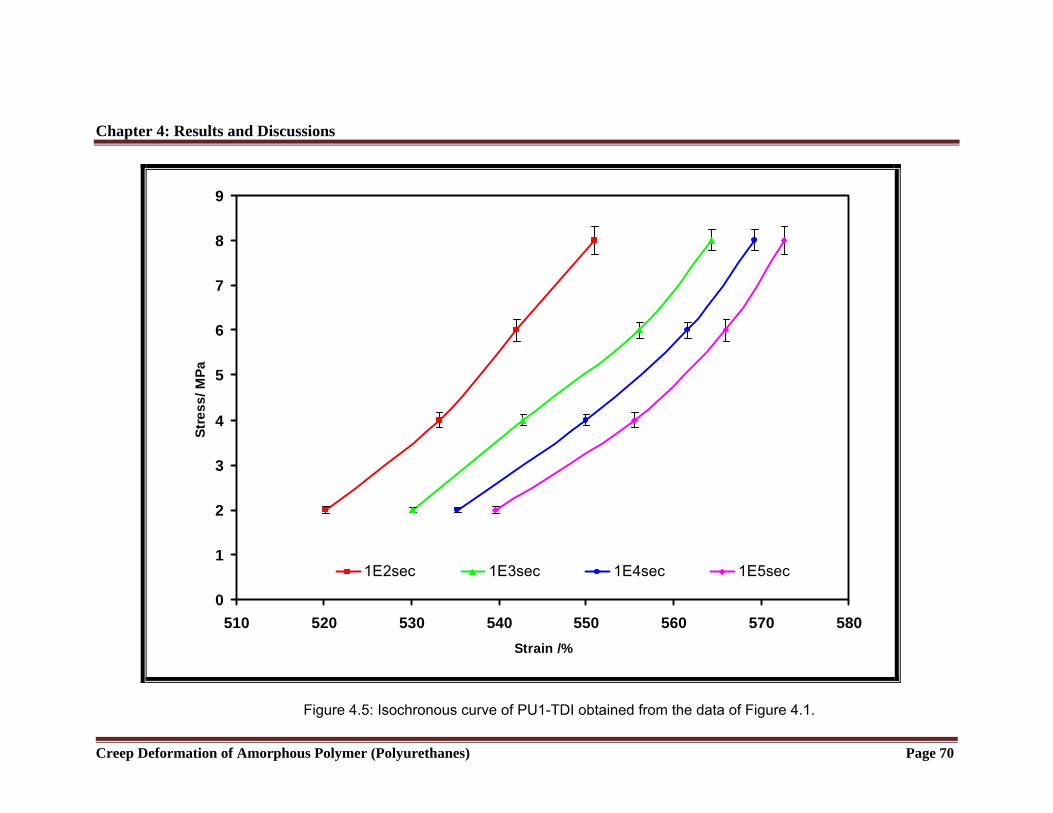
Chapter 4: Results and Discussions
0
1
2
3
4
5
6
7
8
9
510 520 530 540 550 560 570 580Strain /%
Stre
ss/ M
Pa
1E2sec 1E3sec 1E4sec 1E5sec
Figure 4.5: Isochronous curve of PU1-TDI obtained from the data of Figure 4.1.
Creep Deformation of Amorphous Polymer (Polyurethanes) Page 70
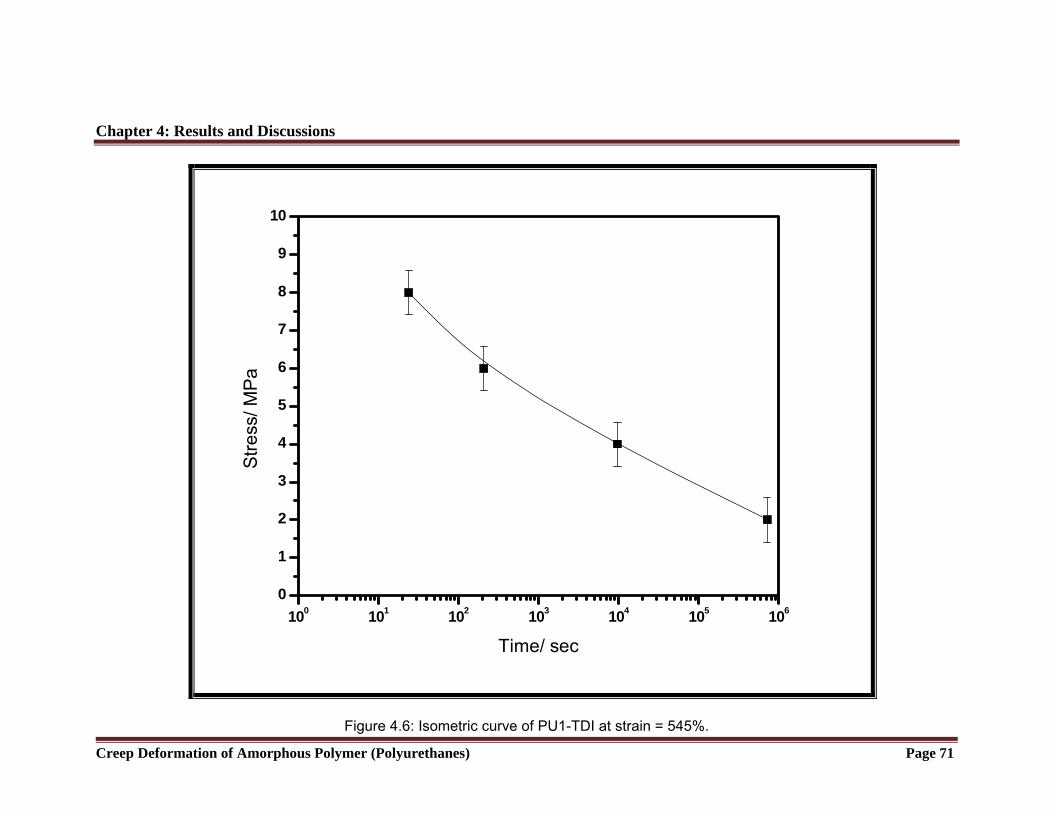
s
Creep Deformation of Amorphous Polymer (Polyurethanes) Page 71
100 101 102 103 104 105 1060
1
2
3
4
5
6
7
8
9
10
Stre
ss/ M
Pa
Time/ sec
Figure 4.6: Isometric curve of PU1-TDI at strain = 545%.
Chapter 4: Results and Discussion
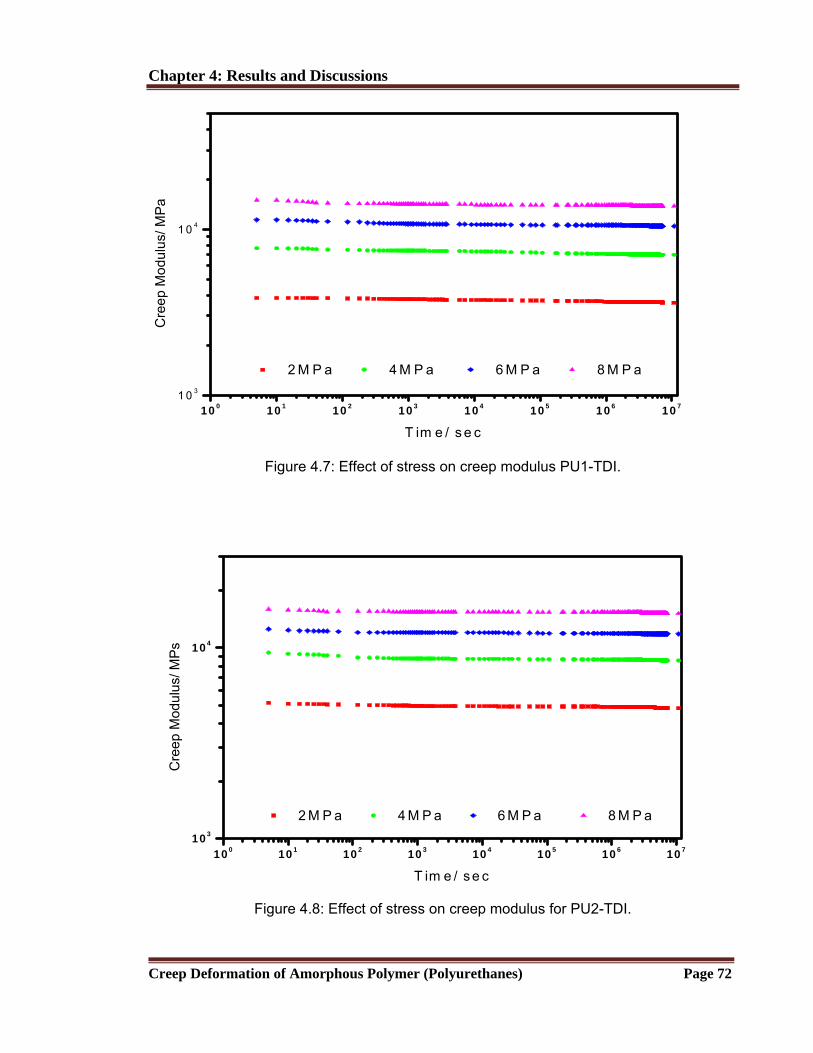
Chapter 4: Results and Discussions
10 0 10 1 10 2 10 3 10 4 10 5 10 6 10 71 0 3
1 0 4
Cre
ep M
odul
us/ M
Pa
T im e / s e c
2 M P a 4 M P a 6 M P a 8 M P a
Figure 4.7: Effect of stress on creep modulus PU1-TDI.
100 10 1 10 2 10 3 10 4 10 5 10 6 10 7103
104
Cre
ep M
odul
us/ M
Ps
T im e / se c
2 M P a 4 M P a 6 M P a 8 M P a
Figure 4.8: Effect of stress on creep modulus for PU2-TDI.
Creep Deformation of Amorphous Polymer (Polyurethanes) Page 72

Chapter 4: Results and Discussions
10 0 10 1 10 2 10 3 10 4 10 510 3
10 4
Cre
ep M
odul
us/ M
Pa
T im e / s e c
2 M P a 4 M P a 6 M P a 8 M P a
Figure 4.9: Effect of stress on creep modulus PU1-IPDI.
100 101 102 103 104 105 106 107103
104
Cre
ep M
odul
us/ M
Pa
T im e / se c
2 M P a 4 M P a 6 M P a 8 M P a
Figure 4.10: Effect of stress on creep modulus PU1-HDI.
Creep Deformation of Amorphous Polymer (Polyurethanes) Page 73

Chapter 4: Results and Discussions
Creep Deformation of Amorphous Polymer (Polyurethanes) Page 74
4.2 Tensile Test Results
Tensile properties of two different molecular weight (Mw) of soft segment in
polyurethanes (Mw=1000 g/mol and 2000 g/mol) were calculated and shown in
Table 4.1. Table 4.2 shows the three different diisocyanates that were used to
compare the effect of molecular structure on tensile properties.
Chain extender plays an important role in the mechanical properties which can lead
to high elongation. 1,4-Butanediol is the chain extender that had been added to all
the four samples. All the PUs exhibited more than 700% elongation at a stretching
rate of 500 mm/min.
Necking phenomena was not observed for all the PUs at this stretching rate. The
tensile properties of PU were compositions dependent [40, 46]. As it can be seen
from Table 4.1, an improvement in mechanical properties was observed upon
reducing the glycol molecular weight at constant hard segment content. The
decrease of molecular weight of PTMO causes an observed increase in tensile
strength, elastic modulus and ultimate elongation. Tensile strength of PU1-TDI and
PU2-TDI were 25.59 MPa and 18.09 MPa respectively as listed in Table 4.1.
Figure 4.11 shows the stress-strain curve of PU1-TDI and PU2-TDI. It can be
observed that PU1-TDI with lower molecular weight of polyol has a higher tensile
strength. As the increase of molecular weight of polyol, more softness and flexible
chain was obtained. This result is analogous to that reported by Bajsic and his co-

Chapter 4: Results and Discussions
Creep Deformation of Amorphous Polymer (Polyurethanes) Page 75
workers [40]. For PU1-TDI and PU2-TDI, the strains at maximum load were 847.88
and 856.91% respectively. When the molecular weight of PTMO increases, the
block length of the soft segment will increase, but the length of hard segment does
not vary. A higher modulus and a weaker elongation at failure were observed when
the polyol molecular weight decreases. It has been observed by many authors [47,
48] that the molecular weight of polyol will influence the mechanical properties of
PUs.
From Figure 4.12 and Table 4.2, TDI-based polyurethane exhibits the best tensile
strength. Being an aromatic isocyanate, TDI is more reactive than the aliphatic
isocyanate namely HDI which results from delocalization of negative charge on –
NCO by its aromatic structure [3]. The mechanical properties of the elastomers are
significantly dependant on the crosslink density of the elastomeric networks [49]. A
higher extent of reaction on the –NCO group will result a higher magnitude for
crosslink density in TDI-based polyurethane. Besides that, higher rigidity of TDI-
based polyurethane was due to the direct association of diisocyanate group with
the phenyl ring.
IPDI-based polyurethane has the lowest tensile strength compared to the TDI and
HDI-based polyurethanes. IPDI-based polyurethane has a cyclic structure which is
lack of delocalization of the negative charge on –NCO group compared to TDI-
based polyurethane. Beside that, IPDI polymer without catalyst also showed a low
reactivity.

Chapter 4: Results and Discussion
s
Creep Deformation of Amorphous Polymer (Polyurethanes) Page 76
HDI-based polyurethane showed a lower tensile strength compared to TDI-based
polyurethane due to the lack of rigidity in its backbone chain. HDI-based
polyurethane showed the highest modulus properties compared to the former
diisocyanates. Modulus of HDI-based polyurethane is 855% higher than IPDI-
based polyurethane and 1640% higher than TDI-based polyurethane. This
substantially high value is due to the presence of hydrogen bonding between two
polymeric chains. This is facilitated by the even number of methylene groups
present in diisocyanate as well as in the chain extender. The methylene sequence
of HDI together with that of butanediol forms a tight crystalline structure, hence it
shows the highest modulus properties [50].

Chapter 4: Results and Discussions Table 4.1 Tensile properties of two different molecular weight of soft segments in polyurethanes. Samples Molecular
Weight
Tensile Strength
Auto. (MPa)
Strain at Max.
Load (%)
Modulus
(ManYoung)
Modulus
(AuntYoung)
Load at Auto.
Break (kN) 1 2
(MPa) (MPa)
PU1-TDI 1000 25.59 847.88 2.54 8.21 0.23
PU2-TDI 2000 18.09 856.91 2.27 5.84 0.15
Table 4.2 Tensile properties of three different diisocyanates structure in polyurethanes. Samples Tensile Strength
Auto. (MPa)
Strain at Max.
Load (%)
Modulus
(ManYoung) (MPa)
Modulus
(AuntYoung) (MPa)
Load at Auto.
Break (kN)
PU1-TDI 25.59 847.88 2.54 8.21 0.15
PU1-HDI 23.08 1109.09 41.71 43.50 0.09
PU1-IPDI 21.80 736.67 4.88 7.43 0.24
1 Modulus(ManYoung)- the ratio of stress to corresponding strain below the proportional limit of a material. It is also known as elastic
modulus or Young Modulus. 2 Modulus(AuntYoung)- the ratio of stress to corresponding strain beyond the proportional limit of a material before rupture.
Creep Deformation of Amorphous Polymer (Polyurethanes) Page 77

Chapter 4: Results and Discussions
0 200 400 600 8000
5
10
15
20
25
Stre
ss (M
Pa)
S tra in (% )
(a ) P U 1 -T D I (b ) P U 2 -T D I
(a )
(b )
Figure 4.11: Stress-strain curve of two different molecular weight of soft segments in polyurethanes.
Creep Deformation of Amorphous Polymer (Polyurethanes) Page 78

s
Creep Deformation of Amorphous Polymer (Polyurethanes) Page 79
0 200 400 600 800 10000
5
10
15
20
25
S
tress
(MP
a)
S tra in (% )
(a ) P U 1 -H D I (b ) P U 1 -IP D I (c ) P U 1 -T D I
(b )
(c )
(a )
Figure 4.12: Stress-strain curve of three different diisocyanates structure in polyurethanes.
Chapter 4: Results and Discussion
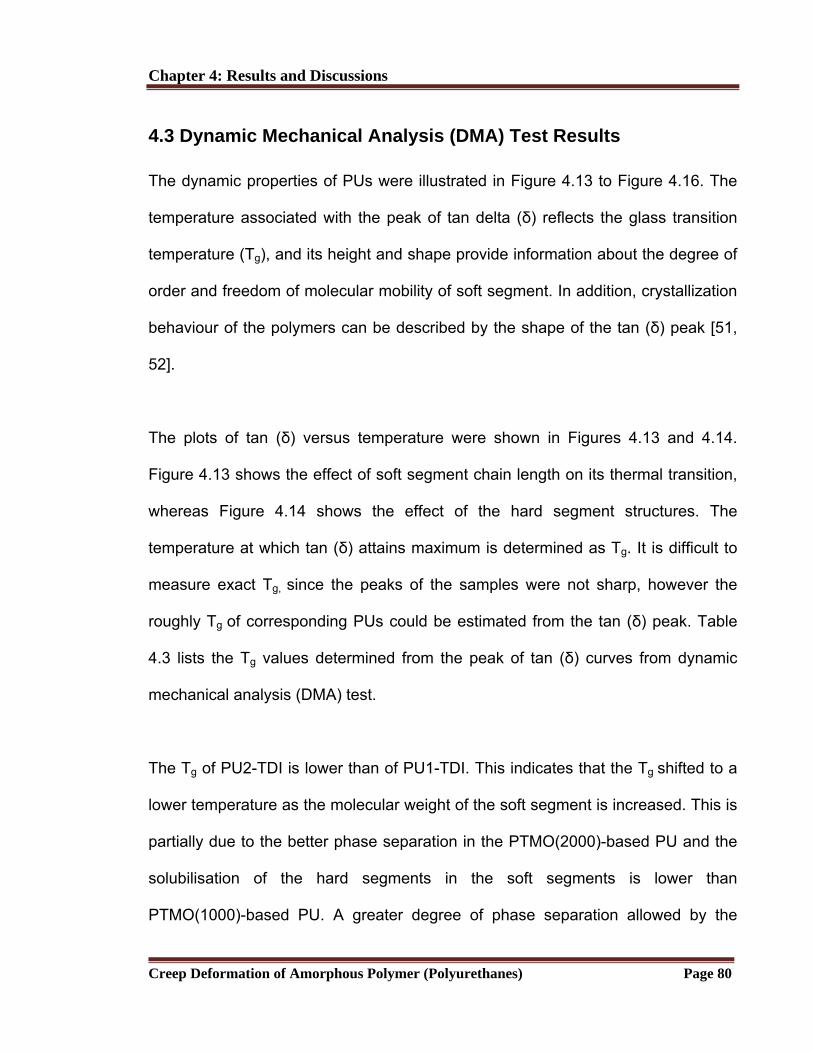
Chapter 4: Results and Discussions
Creep Deformation of Amorphous Polymer (Polyurethanes) Page 80
4.3 Dynamic Mechanical Analysis (DMA) Test Results
The dynamic properties of PUs were illustrated in Figure 4.13 to Figure 4.16. The
temperature associated with the peak of tan delta (δ) reflects the glass transition
temperature (Tg), and its height and shape provide information about the degree of
order and freedom of molecular mobility of soft segment. In addition, crystallization
behaviour of the polymers can be described by the shape of the tan (δ) peak [51,
52].
The plots of tan (δ) versus temperature were shown in Figures 4.13 and 4.14.
Figure 4.13 shows the effect of soft segment chain length on its thermal transition,
whereas Figure 4.14 shows the effect of the hard segment structures. The
temperature at which tan (δ) attains maximum is determined as Tg. It is difficult to
measure exact Tg, since the peaks of the samples were not sharp, however the
roughly Tg of corresponding PUs could be estimated from the tan (δ) peak. Table
4.3 lists the Tg values determined from the peak of tan (δ) curves from dynamic
mechanical analysis (DMA) test.
The Tg of PU2-TDI is lower than of PU1-TDI. This indicates that the Tg shifted to a
lower temperature as the molecular weight of the soft segment is increased. This is
partially due to the better phase separation in the PTMO(2000)-based PU and the
solubilisation of the hard segments in the soft segments is lower than
PTMO(1000)-based PU. A greater degree of phase separation allowed by the

Chapter 4: Results and Discussions longer soft segment lengths resulting in a lower Tg value as reported by many
researchers [40, 48, 53].
Table 4.3: DMA Data.
Creep Deformation of Amorphous Polymer (Polyurethanes) Page 81
Samples ( T taken at peak of tan (δ) 0.10C ) ±g
PU1-TDI + 6.5
PU2-TDI -26.4
PU1-IPDI - 2.0
PU1-HDI -58.8
PU1-TDI and PU1-IPDI show T close to each other. PU1-TDI shows higher Tg g
because of higher rigidity compare to that imparted by PU1-IPDI and is in
agreement to that reported by Pandya and his co-workers [50]. Moreover, PU1-
IPDI offers no crosslinking and imparts higher flexibility [50]. PU1-HDI shows the
lowest Tg is due to the maximum flexibility imparted by methylene sequence which
also found in agreement to that reported by Pandya and his co-workers [50]. The
increasing crystalline domain probably restricts the solubilization of the hard
segments in the soft segments and causes the T value to decrease [51]. The Tg g
values for all the PUs are substantially below the pure PTMO homopolymer [54] of
89°C. This indicates that some phase mixing of hard and soft segments occurs in
these polymers [55, 56].

Chapter 4: Results and Discussions
Creep Deformation of Amorphous Polymer (Polyurethanes) Page 82
Figure 4.13 shows that the tan (δ) peak shifted to lower temperature as the
molecular weight of the soft segment is increased. Figure 4.13 and 4.14 show that
tan (δ) peak shifted to lower temperature and its amplitude becomes smaller
according to the following order: PU1-TDI > PU1-IPDI > PU2-TDI > PU1-HDI. This
phenomenon is attributed to the decrease of degree of freedom for segmental
mobility of the polymer. For PU1-TDI sample, the glass transition occurs within a
narrow temperature range whereas for others samples, it occurs over a much
broader tan (δ) peak. Tan (δ) value of PU1-TDI is the highest among four samples
indicate greater mobility of the polymer chains, while PU1-HDI shows the lowest
tan (δ).
Storage modulus (E’) as a function of temperature is shown in Figure 4.15. Below
the glass transition temperature, Tg, all the samples exhibit similar storage modulus
of approximately 3 GPa except for PU1-TDI. PU1-TDI shows the highest storage
modulus among the four samples.
From Figure 4.15, it can be seen that once the Tg was reached, the modulus
begins to decrease rapidly (inflection point). The inflection point corresponds to
maximum in tan (δ) versus temperature graph as it can be seen from Figure 4.13
and Figure 4.14. The modulus for samples with lower crosslink density and
crystallinity decreased at a lower temperature and at a faster rate than the samples
with higher crosslink density and crystallinity [57].

Chapter 4: Results and Discussion
s
Creep Deformation of Amorphous Polymer (Polyurethanes) Page 83
Beside, the Tg value can be obtained from the peak of the loss modulus curves
change with temperature as shown in Figure 4.16. However, the Tg value for PU1-
IPDI could not be identified as there is no peak was seen.

Chapter 4: Results and Discussions
Creep Deformation of Amorphous Polymer (Polyurethanes) Page 84
-100 -50 0 50 100
0.0
0.2
0.4
0.6
0.8
1.0
T e m p e ra tu re ( 0C )
tan
delta
P U 1 -T D I P U 2 -T D I
Figure 4.13: Loss factor (tan delta) versus temperature of two various molecular weights of soft segment in polyurethanes.

Chapter 4: Results and Discussions
Creep Deformation of Amorphous Polymer (Polyurethanes) Page 85
-100 -50 0 50 100
0 .0
0 .2
0 .4
0 .6
0 .8
1 .0
tan
delta
T e m p e ra tu re ( 0C )
P U 1 -T D I P U 1 -IP D I P U 1 -H D I
Figure 4.14: Loss factor (tan delta) versus temperature of three different diisocyanates structure in polyurethanes.

Chapter 4: Results and Discussions
Creep Deformation of Amorphous Polymer (Polyurethanes) Page 86
-100 -75 -50 -25 0 25 50 75 100 125 150 1751
10
100
1000
T e m p e ra tu re (0C )
E' (M
Pa)
P U 1 -T D I P U 2 -T D I P U 1 -IP D I P U 1 -H D I
Figure 4.15: Storage modulus as a function of temperature.

s
Creep Deformation of Amorphous Polymer (Polyurethanes) Page 87
-7 5 -5 0 -2 5 0 2 5 5 0 7 5 1 0 0 1 2 5 1 5 0
1
1 0
1 0 0
P U 1 -T D I P U 2 -T D I P U 1 -IP D I P U 1 -H D I
T e m p e ra tu re ( 0C )
E" (
MP
a)
Figure 4.16: Dependence of Loss modulus on temperature.
Chapter 4: Results and Discussion

Chapter 4: Results and Discussions
Creep Deformation of Amorphous Polymer (Polyurethanes) Page 88
4.4 DSC Results
Thermal transitions of the PUs were measured by DSC. In order to avoid the
influence of different thermal history of the samples, all the samples were heated
from -60°C to 150°C, cooled to -60°C and then reheated to 200°C at 5°C/min.
Figure 4.17 to 4.20 illustrate DSC scans for reheated samples and the data were
summarized in Table 4.4. When reheating the samples, PU1-TDI and PU1-HDI
showed a sharp exothermic peak at 101°C and 105 °C respectively. PU2-TDI
showed two sharp exothermic peaks at 88°C and 104°C whereas PU1-IPDI
showed a small peak at 121°C.
From Figure 4.21, PU2-HDI showed an endothermic peak at the temperature
around 155°C. Without proper compound data, it would be difficult to assign the
observed melting endotherm unambiguously. No significant endothermic peak
appeared for PU1-TDI, PU2-TDI and PU1-IPDI which indicated the absence of
crystallinity in these materials.
The DSC and DMA data presented in Table 4.4 shows that the Tg values obtained
from DSC are in good agreement with those obtained from DMA. The Tg values
obtained from DSC and DMA differ somewhat may be attributed to the frequency
dependence of the transition phenomenon [19, 43, 58]

Chapter 4: Results and Discussions Segmented polyurethane elastomers with rubbery soft-sgments are microphase
separated and the degree of microphase separation was usually evaluated by
means of the Tg values [59, 60]. When there are hard segments disperse in the soft
segments, the Tg value will increase. From the DMA and DSC results, PU1-TDI
shows the highest Tg value. In keeping with these observations it is expected that
there would be more hard-soft segment mixing in PU1-TDI sample.
Table 4.4: DSC and DMA Thermal Transitions of polyurethanes.
Samples T from DSC Results T from DMA Results g g
(T ± 0.01°C) (T ± 0.1°C) g g
PU1-TDI 6.81 6.5
PU2-TDI -25.80 -26.4
PU1-IPDI 1.88 -2.0
PU1-HDI -50.31 -58.8
Creep Deformation of Amorphous Polymer (Polyurethanes) Page 89
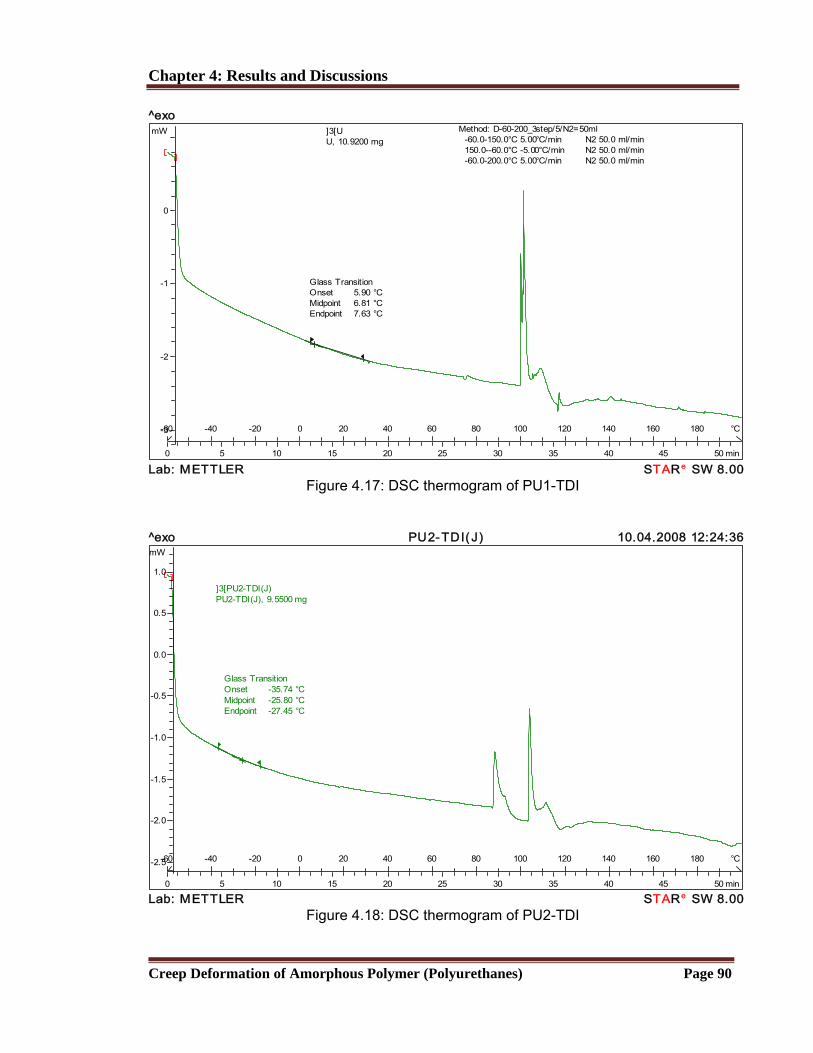
Chapter 4: Results and Discussions
Method: D-60-200_3step/5/N2=50ml -60.0-150.0°C 5.00°C/min N2 50.0 ml/min 150.0--60.0°C -5.00°C/min N2 50.0 ml/min -60.0-200.0°C 5.00°C/min N2 50.0 ml/min
Glass TransitionOnset 5.90 °CMidpoint 6.81 °CEndpoint 7.63 °C
]3[UU, 10.9200 mg
mW
-3
-2
-1
0
min
°C-60 -40 -20 0 20 40 60 80 100 120 140 160 180
0 5 10 15 20 25 30 35 40 45 50
^exo
SW 8.00
Creep Deformation of Amorphous Polymer (Polyurethanes) Page 90
eRTASLab: METTLER Figure 4.17: DSC thermogram of PU1-TDI
Glass TransitionOnset -35.74 °CMidpoint -25.80 °CEndpoint -27.45 °C
]3[PU2-TDI(J)PU2-TDI(J), 9.5500 mg
mW
-2.5
-2.0
-1.5
-1.0
-0.5
0.0
0.5
1.0
min
°C-60 -40 -20 0 20 40 60 80 100 120 140 160 180
0 5 10 15 20 25 30 35 40 45 50
^exo PU2-TDI( J) 10.04.2008 12:24:36
SW 8.00eRTASLab: METTLER Figure 4.18: DSC thermogram of PU2-TDI

Chapter 4: Results and Discussion
s
Creep Deformation of Amorphous Polymer (Polyurethanes) Page 91
Glass TransitionOnset 1.79 °CMidpoint 1.88 °CEndpoint 1.85 °C
Method: D-60+200/3step/5/N2=50ml -60.0-150.0°C 5.00°C/min N2 50.0 ml/min 150.0--60.0°C -5.00°C/min N2 50.0 ml/min -60.0-200.0°C 5.00°C/min N2 50.0 ml/min
]3[A2A2, 10.2600 mg
mW
-2.5
-2.0
-1.5
-1.0
-0.5
0.0
0.5
min
°C120 140 160 180
35 40 45 50
SW 8.00
-60 -40 -20 0 20 40 60 80 100
0 5 10 15 20 25 30
^exo
SLab: METTLER eRTA
^exo
Method: D-60-200_3step/5/N2=50ml -60.0-150.0°C 5.00°C/min N2 50.0 ml/min 150.0--60.0°C -5.00°C/min N2 50.0 ml/min -60.0-200.0°C 5.00°C/min N2 50.0 ml/min
Glass TransitionOnset -53.36 °CMidpoint -50.31 °CEndpoint -50.57 °C
Figure 4.19: DSC thermogram of PU1-IPDI
]3[PU1-HDI(H)PU1-HDI(H), 9.4900 mg
mW
-3
-2
-1
0
1
min
°C-60 -40 -20 0 20 40 60 80 100 120 140 160 180
0 5 10 15 20 25 30 35 40 45 50
SW 8.00SLab: METTLERFigure 4.20: DSC thermogram of PU1-HDI
eRTA

s
Creep Deformation of Amorphous Polymer (Polyurethanes) Page 92
-0.35
-0.3
-0.25
-0.2
-0.15
-0.1
-0.05
0
0.05
0.1
0.15
-75 -25 25 75 125 175
Temperature (°C)
Hea
t Flo
w (W
/g)
PU1-TDI PU2-TDI
PU1-IPDI PU1-HDI
Figure 4.21: DSC thermograms of 4 various polyurethanes.
Chapter 4: Results and Discussion

Chapter 4: Results and Discussions
Creep Deformation of Amorphous Polymer (Polyurethanes) Page 93
4.5 XRD Results
The X-ray diffraction patterns of the PUs are shown in Figure 4.22 to Figure 4.25.
All the PUs showed no explicit diffraction peak but a broad scattering peak with a
maximum at around 20° of 2θ and a halo spreading over 30° to 60° of 2θ.
Additionally, PU1-HDI exhibited a peak at 24° of 2θ and a sharper upper half peak
height area which indicates that this sample has much bigger crystal particles. It
means that the degree of crystallinity of the PU1-HDI is the highest among all Pus.
Table 4.5 showed the Scherrer length, L of all four samples. PU1-HDI showed the
highest of Scherrer length, whereas PU2-TDI showed the lowest value of Scherrer
length. This study showed that the crystillinity depends on the structure of
diisocyanates and it also agreed with that reported by Zia that the crystallinity
decreased from aliphatic to aromatic characters of diisocyanates used in the PU
[61]. The methylene sequence of HDI together with that of butanediol forms a tight
crystalline structure in the HDI-based polyurethane; hence it shows the highest
degree of crystallinity. Due to this, PU1-HDI also shows the highest modulus
properties among the four samples.
Beside that, in case of aliphatic diisocyanate such as PU1-HDI, the chain flexibility
showed maximum degree of freedom for hard segment to get organized crystalline
form. This degree of freedom decrease to cyclo-aliphatic based PU (PU1-IPDI) and
the main effect was observed in aromatic PU (PU1-TDI and PU2-TDI).

Chapter 4: Results and Discussions
0 10 20 30 40 50 60 70 80 90
0
50
100
150
200
2θ
Inte
nsity
(Cps
)
Figure 4.22: XRD pattern for PU1-TDI.
Creep Deformation of Amorphous Polymer (Polyurethanes) Page 94
0 10 20 30 40 50 60 70 80 90
0
50
100
150
200
2θ
Inte
nsity
(Cps
)
Figure 4.23: XRD pattern for PU2-TDI.

Chapter 4: Results and Discussions
0 10 20 30 40 50 60 70 80 90
0
50
100
150
200
2θ
Inte
nsity
(Cps
)
Figure 4.24: XRD pattern for PU1-IPDI.
0 10 20 30 40 50 60 70 80 90
0
50
100
150
200
2θ
Inte
nsity
(Cps
)
Figure 4.25: XRD pattern for PU1-HDI.
Creep Deformation of Amorphous Polymer (Polyurethanes) Page 95

Chapter 4: Results and Discussions
Creep Deformation of Amorphous Polymer (Polyurethanes) Page 96
Table 4.5: Scherrer length calculated from XRD results.
Samples Scherrer Length, L (Å)
PU1-TDI 9.75 ± 0.01
PU2-TDI 9.04 ± 0.01
PU1-IPDI 10.25 ± 0.01
PU1-HDI 11.83 ± 0.01
4.6 SEM Results
Figure 4.26 to 4.29 show the SEM results for all the four samples with
magnification of 500. It is seen from the figure that the PU1-TDI and PU2-TDI show
almost the same morphology, but PU2-TDI shows more amounts of particles with
bigger size compared to PU1-TDI. From the Figure 4.28, PU1-IPDI shows the most
amounts of particles with the biggest size.
The morphology of the PU1-TDI and PU2-TDI are relatively homogenous compare
with other samples, indicating a relatively dense architecture in the inner structure.
This implies that a strong intermolecular interaction has occurred between the hard
segments and soft segment for PU1-TDI and PU2-TDI, leading to a good
miscibility.

Chapter 4: Results and Discussions PU1-HDI shows a very different morphology among the four samples, which can
be seen from Figure 4.29. It shows that PU1-HDI exhibits multiphase
morphologies. From the DMA and DSC results, PU1-HDI showed the lowest Tg
value and indicated that the degree of microphase separation of PU1-HDI is the
highest. It has been observed by many authors that better physical properties are
achieved when microphase segregation between soft and hard segment increases
[43, 62]. It is obvious from tensile test and creep test that PU1-HDI showed the
highest modulus properties which is also agree with the work done by other
researchers as mentioned above.
Figure 4.26: SEM micrograph of PU1-TDI (Mag.=500x).
Creep Deformation of Amorphous Polymer (Polyurethanes) Page 97

Chapter 4: Results and Discussions
Figure 4.27: SEM micrograph of PU2-TDI (Mag.=500x).
Figure 4.28: SEM micrograph of PU1-IPDI (Mag.=500x).
Creep Deformation of Amorphous Polymer (Polyurethanes) Page 98

Chapter 4: Results and Discussions
Figure 4.29: SEM micrograph of PU1-HDI (Mag.=500x).
Creep Deformation of Amorphous Polymer (Polyurethanes) Page 99

Chapter 5: Conclusion and Recommendations
Creep Deformation of Amorphous Polymer (Polyurethanes) Page 100
CHAPTER 5: CONCLUSION AND RECOMMENDATIONS
In the present work, the creep behaviour of four types PU samples has been
studied. The three different isocyanates which are TDI, IPDI and HDI were selected
to synthesis three types of polyurethanes. PTMO of molecular masses 1000
mg/mol and 2000 mg/mol were selected to study their effect on mechanical
properties.
Polyurethane elastomers are block copolymers which consist of polyol sequences
(soft segments) and diisocyanate sequences (hard segments). The compositions
and the conditions of processing are the main factors which influence the chemical
structure and their mechanical properties.
The study on mechanical properties reveals that PU1-TDI has the highest tensile
strength. Its tensile strength is 25.59 MPa whereas PU1-HDI is 23.08 MPa, PU1-
IPDI is 21.80 MPa and PU2-TDI is 18.09 MPa. PU2-TDI showed a lower tensile
strength compare to PU1-TDI due to the difference of the molecular weight of
polyol. The increase of molecular weight of polyol causes an observed decrease in
tensile strength and elastic modulus and leads to increase in strain at maximum.
HDI-based polyurethane showed the highest modulus properties (41.71 MPa) due
to the presence of hydrogen bonding between polymeric chains. The methylene

Chapter 5: Conclusion and Recommendations
Creep Deformation of Amorphous Polymer (Polyurethanes) Page 101
sequence of HDI together with that of butanediol forms a tight crystalline structure.
As the XRD results also indicated that PU1-HDI showed the highest degree of
crystallinity. From the Scherrer length calculation, it can be said that the crystallinity
decreased from aliphatic to aromatic characters of the diisocyanates used in
synthesis PUs.
The Tg values obtained from the DMA are in good agreement with those obtained
from DSC. The DMA and DSC results showed the effect of soft segment chain
length and the effect of hard segment structure respectively. The Tg shifted to a
lower temperature as the molecular weight of the soft segment is increased. A
greater degree of phase separation allowed by the longer segment lengths results
in greater phase purity and the lower Tg observed.
PU1-TDI shows higher Tg because of higher rigidity compared to that imparted by
PU1-IPDI. Moreover, PU1-IPDI offers no crosslinking and imparts higher flexibility.
PU1-HDI showed the lowest Tg is obviously due to maximum flexibility imparted by
methylene.
SEM analysis shows that PU1-HDI exhibits multiphase morphologies whereas the
morphologies of the PU1-TDI and PU2-TDI are relatively homogenous. From the
DMA and DSC results, PU1-HDI shows the lowest Tg value and indicated that the
degree of microphase separation of PU1-HDI is the highest. It is obvious from
tensile test and creep test that PU1-HDI shows the highest modulus properties. It
Chapter 5: Conclusion and Recommendations
Creep Deformation of Amorphous Polymer (Polyurethanes) Page 102
can be said that better physical properties are achieved when microphase
segregation between soft and hard segment increases.
Polyurethanes can be fabricated to a range of toughness and softness values to
meet various applications by varying the amount or the types of diisocyanate,
polyol and chain extender. As can be seen from the tensile stress-strain graph in
chapter four, all four types of polyurethanes show different range of toughness and
softness.
From the long-term creep test, it can be observed that all four types of
polyurethanes showed the viscoelastic behaviour, as such, exhibit time dependent
strain. The non-linearity strain of the PU also had been proved by the isochronous
curves in Figure 4.5. The results obtained from the creep test showed that PU1-
HDI exhibited the highest creep strain among the four samples. PU1-IPDI shows
the highest creep deformation among the four samples. PU1-IPDI failed within
1.8x10³ seconds for the applied stresses of 2 MPa, 4 MPa, 6 MPa and 8 MPa. No
failure occurred for PU1-TDI, PU2-TDI and PU1-HDI until the end of the creep test.
As can be concluded that, PU1-IPDI exhibited the poorest mechanical properties
among the four samples.
The mechanical properties of PUs depend upon several factors like molecular
weight, types of polyol and diisocyanate, effect of NCO/OH ratio, synthesis
conditions and thermal history. The used of different polyols, NCO/OH ratio and
Chapter 5: Conclusion and Recommendations
Creep Deformation of Amorphous Polymer (Polyurethanes) Page 103
chain extender should be considered in an attempt to improve the mechanical
properties.
In the addition of the mentioned mechanical properties test, there are certain other
areas of testing and theoretical analysis that can be performed on the
polyurethanes to determine their properties and evaluate their structural behaviour
over time. Creep experiment can be run by varying the temperature with constant
load to study the effect of the temperature on creep. Then, the creep data can be
analyzed in terms of time-temperature superposition formalism to prove the
equivalence of time and temperature.
In the creep test, the cross sectional area of the sample decreases as the
elongation increases. So, the true stress applied to the sample increases with the
creep time. The load during the test should be decreased with the increase of the
elongation of the specimen to minimize this error.
For further research, it is suggested that the effect of different NCO:OH ratio can
also be investigated. Other characterization techniques such as Atomic Force
Microscopy (AFM), Fourier Transform Infrared Spectroscopy (FTIR), and Nuclear
Magnetic Resonance (NMR) can also be carried out in order to study the surface
morphology and structural of the prepared samples.

References
Creep Deformation of Amorphous Polymer (Polyurethanes) Page 104
REFERENCES [1] J.M.Buist, "Developments in Polyurethane-1," Elsevier Applied Science
Publishers Ltd., 1978.
[2] E. S. Wilks, "Industrial Polymers Handbook- Products, Processess,
Applications (Volume 1)," Wiley-VCH, 2000.
[3] D.Braun, H.Cherdon, and H.Ritter, Polymer Synthesis: Theory and Practice,
3rd ed., 2001.
[4] W. Hanyuan, "Asia Market Report," in Polyurethanes Magazine
International. vol. 4, 2007, pp. 142-146.
[5] T. Padmavathy and K. S. V. Srinivasan, "Synthesis and Properties of
Segmented Main-Chain Liquid-Crystalline Polyurethanes with a High Aspect
Ratio Mesogenic Diol as a Chain Extender," Journal of Applied Polymer
Science: Part A: Chemistry, vol. 40, pp. 1527-1538, 2002.
[6] J. Z. Jiangning Chen, Tongyang Zhu, Zichun Hua, Qingmin Chen, Xuehai
Yu, "Blends of Thermoplastic Polyurethane and Polyether-polyimide:
Preparation and Properties," Polymer, vol. 42, pp. 1493-1500, 2001.
[7] C. S. S. R.d.a. Paulmer, M.J. Patni, M.V. Pandya, "Effect of Crosslinking
Agents on the Structure and Properties of Polyurethane Millable Elastomer
Composites," Journal of Applied Polymer Science, vol. 43, pp. 1953-`959,
1991.
[8] Pathiraja A. Gunatillake, Gordon F. Meijs, Ezio Rizzardo, Ronald C.
Chatelier, Simon J. McCarthy, Arthur Brandwood, and K. Schindhelm,
References
Creep Deformation of Amorphous Polymer (Polyurethanes) Page 105
"Polyurethane Elastomers Based on Novel Polyether Macrodiols and MDI:
Synthesis, Mechanical Properties, and Resistance to Hydrolysis and
Oxydation," Journal of Applied Polymer Science, vol. 46, pp. 319-328, 1992.
[9] Yakai Feng and C. Li, "Study on Oxidative Degradation Behaviours of
Polyesterurethane Network," Polymer Degradation and Stability, vol. 91, pp.
1711-1716, 2006.
[10] Elizabeth M. Christenson, Mahrokh Dadsetan, Michael Wiggins, James M.
Anderson, and A. Hiltner, "Poly(carbonate urethane) and poly(ether
urethane) biodegradation: In vivo studies," Journal of Biomedical Materials
Research Part A, vol. 69A, pp. 407-416, 2004.
[11] David Randall and S. Lee, "The Polyurethanes Book," John Wiley, 2003.
[12] D. I.Bower, An Introduction to Polymer Physics: Cambridge University
Press, 2002.
[13] N.G. Mccrum, C.P.Buckley, and C.B.bucknall, Principles of Polymer
Engineering: Oxford University Press, 1988.
[14] Manas Chanda and S. K. Roy, Plastics Technology Handbook, 4 ed.: CRC,
2006.
[15] V. Shah, Handbook of Plastics Testing Technology, 2 ed.: John Wiley &
Sons Inc, 1998.
[16] G. F. Kinney, Engineering Properties and Applications. New York: John
Wiley & Sons, 1957.
References
Creep Deformation of Amorphous Polymer (Polyurethanes) Page 106
[17] J. R. Fried, Polymer Science and Technology: Prentice Hall International,
1995.
[18] Gerry Trantina and R. Nimmer, Structural Analysis of Thermoplastic
Components 1ed.: McGraw-Hill Professional, 1993.
[19] Tim A. Osswald and G. Menges, Materials Science of Polymers for
Engineers. Munich: Hanse, 1996.
[20] Jan Kolarik, Luca Fambri, Alessandro Pegoretti, Amabile Penati, and P.
Goberti, "Prediction of Creep of Heterogeneous Polymer Blends: Rubber-
toughed Polypropylene/Poly(Styrene-co-Acrylonitrile)," Polymer Engineering
and Science, vol. 42, pp. 161-169, 2002.
[21] R.J.Crawford, Plastic Engineering, 2nd ed.: Pergamon Press, 1987.
[22] J. Betten, Creep Mechanics, 2 ed.: Springer, 2005.
[23] E. Andrade, The viscous flow in metals and allied phenomena: Proc. Roy.
Soc. London, 1910.
[24] J.F. Mano, V. Sencadas, A. Mello Costa, and S. Lanceros-Mendez,
"Dynamic Mechanical Analysis and Creep Behaviour of β-PVDF Films.,"
Materials Science and Engineering, vol. 370, pp. 336-340, 2004.
[25] J. Moalli, Plastics Failure Analysis and Prevention Plastics Design Library,
2001.
[26] Qi Cao, Yuanli Cai, Bo Jing, and P. Liu, "Structure and Mechanical
Properties of Thermoplastic Polyurethane, Based on Hyperbranched

References
Creep Deformation of Amorphous Polymer (Polyurethanes) Page 107
Polyesters," Journal of Applied Polymer Science, vol. 102, pp. 5266-5273,
2006.
[27] H.N. Ng, A.E. Allegrezza, R.W. Seymour, and S. L. Cooper, "Effect of
Segment Size and Polydispersity on the Properties of Polyurethane Block
Polymers," Polymer, vol. 14, pp. 255-261, 1973.
[28] B. Twombly, "Dynamic Mechanical Analysis of Silver/ Glass Die Attach
Material," in Electronic Components and Technology Conference, 1995.
Proceedings., 45th, Las Vegas, NV, USA, 1995.
[29] K. P. Menard, Dynamic Mechanical Analysis- A Practical Introduction: CRC
Press, 1999.
[30] J.D.Ferry, Viscoelastic Properties of Polymers, 3rd ed. New york: John
Wiley, 1980.
[31] J. F. Rabek, Experimental Methods in Polymer Chemistry -Physical
Principles and Applications: John Wiley and Sons Ltd., 1980.
[32] Frank H. Chung and R. W. Scott, "A New Approach to the Determination of
Crystallinity of Polymers by X-ray Diffraction," Journal of Applied Cryst., vol.
6, pp. 225-230, 1973.
[33] H. P. Klug and L. E. Alexander, X-Ray Diffraction Procedures for
Polycrystalline and Amorhous Materials: A Wiley-Interscience Publication,
1974.
[34] A. Guinier, X-Ray Diffraction in Crystals, Imperfect Crystals, and Amorhous
Bodies. New York: Dover Publications, INC, 1963.

References
Creep Deformation of Amorphous Polymer (Polyurethanes) Page 108
[35] F. R. Feret, "Determination of the Crystallinity of Calcined and Graphitic
Cokes by X-Ray Diffraction," Analyst, vol. 123, pp. 595-600, 1998.
[36] H. Kumazawa, S. Annen, and E. Sada, "Hydrothermal Synthesis of Barium
Titanate Fine Particles from Amorphous and Crystalline Titania," Journal of
Materials Science, vol. 30, pp. 4740-4744, 1995.
[37] Craig J. Kennedy, Karin Von Lerber, and T. J. Wess, "Measuring
Crystallinity of Laser Cleaned Silk by X-Ray Diffraction," e-Preservation
Science, vol. 2, pp. 31-37, 2005.
[38] M. S. a. E. D. a. I. S. University, "The world of Scanning Electron
Microscopy ".
[39] V. Rek, M. Bravar, E. Govorcin, and M. Suceska, "Mechanical and Structural
Studies of Photo-degraded Polyurethane," Polymer Degradation and
Stability, vol. 24, pp. 399-411, 1989.
[40] E. Govorcin Bajsic, A. S. V. Rek, V. Sendijarevic, and K. C. Frish, "The
effect of different molecular weight of soft segments in polyurethanes on
photooxidative stability, Polymer Degradation and Stability," Polymer
Degradation and Stability, vol. 52, pp. 223-233, 1996.
[41] Katshuhiko Nakamae, Takashi Nishino, Seiji Asaoka, and Sudaryanto,
"Microphase Seperation and Surface Properties of Segmented Polyurethane
- Effect of Hard Segment Content," Int. J. Adhesion and Adhensives, vol. 16,
pp. 233-239, 1996.
[42] A. R. Achim Frick, "Characterization of TPU-elastomer by Thermal Analysis
(DSC)," Polymer Testing, vol. 23, pp. 413-417, 2004.

References
Creep Deformation of Amorphous Polymer (Polyurethanes) Page 109
[43] Sonal Desai, I.M. Thakore, B.D. Sarawade, and S. Devi, "Effect of Polyals
and Diisocyanates on Thermo-mechanical and Morphological Proprties of
Polyurethans," European Polymer Journal, vol. 36, pp. 711-725, 2000.
[44] M. Rogulska, Wawrzyniec Podkoscielny, Anna Kultys, Stanislaw Pikus, and
E. Pozdzik, "Studies on Thermoplastic Polyurethanes Based on New
Diphenylethane-DerivativeDiols. 1. Synthesis and Characterizaion of
Nonsegmented Polyurethanes from HDI and MDI," European Polymer
Journal, vol. 42, pp. 1786-1797, 2006.
[45] American Society for Testing and Materials, Annual Book of ASTM
Standards Part 27, Plastics- General Methods of Testing, Nomenclature,
1973.
[46] Augustin T. Chen, Richard R. Wells, and J. M. O'Connor, "TPU from
Aliphatic Diisocyanates," in Rubber world. vol. 212, April 1995, p. 31.
[47] Raju Adhikari, Patjiraja A. Gunatillake, and M. Bown, "Effect of
Polydimethylsiloxane Macrodiol Molecular Weight on Properties and
Morphology of Polyurethane and Polyurethaneurea," Journal of Applied
Polymer Science, vol. 90, pp. 1567-1573, 2003.
[48] Wen-Yen Chiang and D.-M. Chang, "Syntheses and Properties of AB Cross-
Linked Polymers: Vinyl-Terminated Polyurethanes/ Allyl Novolac Resin,"
Advances in Polymer Technology, vol. 15, pp. 327-335, 1996.
[49] V. Sekkar, S. Gopalakrishnan, and K. A. Devi, "Studies on allophanate-
urethane networks based on hydroxyl terminated polybutadiene: effect of
isocyanate type on the network characterictics," European Polymer Journal
vol. 39, pp. 1281-1290, 2003.

References
Creep Deformation of Amorphous Polymer (Polyurethanes) Page 110
[50] M. V. Pandya, D. D. Deshpane, and D. G. Hundiwale, "Effect of
Diisocyanete Structure on Viscoelastic, Thermal. Mechanical and Electrical
Properties of Cast Polyurethanes," Journal of applied polymer science, vol.
32, pp. 4959-4969 1986.
[51] S. Mondal and J. L. Hu, "Structural characterization and mass transfer
properties of nonporous-segmented polyurethane membrane: Influence of
the hydrophilic segment content and soft segment melting temperature.,"
Journal of Membrane Science, vol. 276, pp. 16-22, 2006.
[52] Ming Zeng and L. Zhang, "Effects of Reaction and Cure Temperatures on
Morphology and Properties of Poly(ester-urethane)," Journal of applied
polymer science, vol. 100, pp. 708-714, 2006.
[53] P.N. Lan, S. Corneillie, E. Schacht, M. D. &, and A. Shard, "Synthesis and
Characterization of Segmented Polyurethanes based on Amphiphilic
Polyether diols," Biomaterials, vol. 17, pp. 2273-2280, 1996.
[54] C.B. Wang and S. L. Cooper, "Morphology and Properties of Segmented
Polyurethaneureas," Macromolecules, vol. 16, pp. 775-786, 1983.
[55] James H. Silver, John W. Marchant, and S. L. Cooper, "Effect of Polyol Type
on the Physical Properties and Thrombogenicity of Sulfonate-containing
Polyurethanes," Journal of Biomedical Materials Research, vol. 27, pp.
1443-1457, 1993.
[56] T.G. Grasel and S. L. Cooper, "Surface Properties and Blood Compatibility
of Polyurethaneureas," Biomaterials, vol. 7, pp. 315-328, 1986.

References
Creep Deformation of Amorphous Polymer (Polyurethanes) Page 111
[57] Hamid Yeganeh, Moslem Mansour Lakouraj, and S. Jamshidi, "Synthesis
and Properties of Biodegradable elastomeric epoxy modified polyurethanes
based on poly(e-caprolactone) and poly(ethylene glycol)," European
Polymer Journal, vol. 41, pp. 2370-2379, 2005.
[58] R.J. Zdrahala, R.M. Gerkin, S.L. Hager, and F. E. Critchfield, "Polyether-
Based Thermoplastic Polyurethanes. I. Effect of the Hard-Segment
Content," Journal of Applied Polymer Science, vol. 24, pp. 2041-2050, 1979.
[59] Peng Ping, Wenshou Wang, Xuesi Chen, and X. Jing, "The Influence of
Hard-Segments on Two-Phase Structure and Shape Memory Properties of
PCL-Based Segmented Polyurethanes," Journal of Polymer Science: Part B:
Polymer Physics, vol. 45, pp. 557-570, 2007.
[60] T.R.Hesketh, J.W.C.Van Bogart, and S.L.Cooper, "Differential Scanning
Calorimetry Analysis of Morphological Changes in Segmented Elastomer,"
Polymer Engineering and Science, vol. 20, pp. 190-197, 1980.
[61] Khalid Mahmood Zia, Ijaz Ahmad Bhatti, Mehdi Barikani, Mohammad Zuber,
and M. A. Sheikh, "XRD Studies of Chitin Based Polyurethane Elastomers,"
in International Journal of Biological Macromolecules, vol.43, pp. 136-141,
2008.
[62] Sonia Faria Zawadzki and L. Akcelrud, "HTPB-based Polyurethanes: A
Cprrelation Study between Morphology and Machanical Behaviour,"
Polymer International, vol. 42, pp. 422-428, 1997.