Embed Size (px)
Citation preview

Contract No.: 53-3198-9-008 MPR Reference No.: 8659-316
Technical Working Paper Creation of the November 1999 MATH SIPP Microsimulation Model and Database October 2003 Author: Mike Bloom
Submitted to:
U.S. Department of Agriculture Food and Consumer Service 3101 Park Center Drive Room 1014 Alexandria, VA 22302
Project Officer:
Jenny Genser
Submitted by:
Mathematica Policy Research, Inc. 600 Maryland Ave., SW, Suite 550 Washington, DC 20024-2512 Telephone: (202) 484-9220 Facsimile: (202) 863-1763
Project Director:
Carole Trippe

PAGE IS INTENTIONALLY LEFT BLANK TO ALLOW FOR DOUBLE-SIDED COPYING
iii
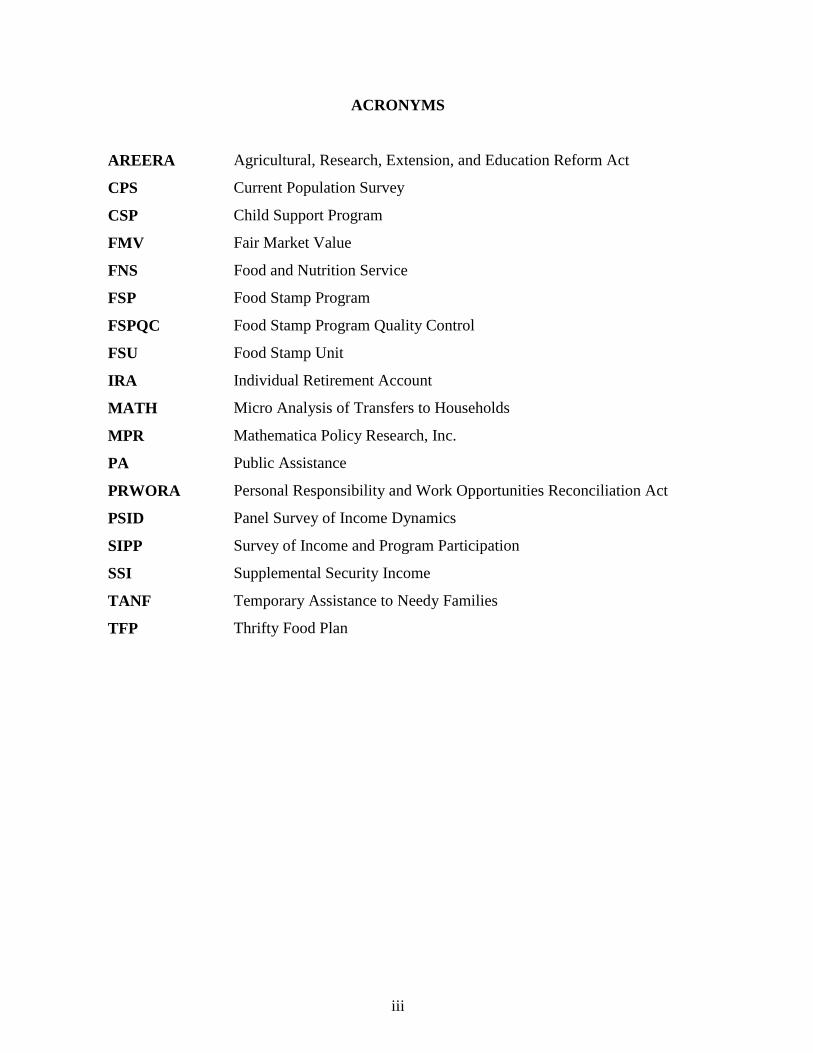
ACRONYMS
AREERA Agricultural, Research, Extension, and Education Reform Act
CPS Current Population Survey
CSP Child Support Program
FMV Fair Market Value
FNS Food and Nutrition Service
FSP Food Stamp Program
FSPQC Food Stamp Program Quality Control
FSU Food Stamp Unit
IRA Individual Retirement Account
MATH Micro Analysis of Transfers to Households
MPR Mathematica Policy Research, Inc.
PA Public Assistance
PRWORA Personal Responsibility and Work Opportunities Reconciliation Act
PSID Panel Survey of Income Dynamics
SIPP Survey of Income and Program Participation
SSI Supplemental Security Income
TANF Temporary Assistance to Needy Families
TFP Thrifty Food Plan
PAGE IS INTENTIONALLY LEFT BLANK TO ALLOW FOR DOUBLE-SIDED COPYING
v
CONTENTS
Chapter Page
I INTRODUCTION ........................................................................................................... 1 A. OVERVIEW OF PROCESSING STEPS............................................................. 2 B. MAJOR CHANGES............................................................................................. 3
1. Treatment of Noncitizens in Reforms ......................................................... 3 2. Household Composition Algorithm Improved............................................ 3 3. Disability Definition More Restrictive........................................................ 3 4. Updated FSP Parameters............................................................................. 4
C. OTHER REFERENCE MATERIAL ................................................................... 5
1. 1999 MATH SIPP Programmer’s Guide .................................................... 5 2. 1996 MATH SIPP User’s Guide................................................................. 5
II THE SURVEY OF INCOME AND PROGRAM PARTICIPATION........................... 7 A. THE SIPP ............................................................................................................. 7 B. WEAKNESSES OF THE SIPP............................................................................ 8 III CREATING THE MODEL DATABASE..................................................................... 15
A. EXTRACT DATA FOR NOVEMBER 1999 .................................................... 15 B. CONVERT SIPP DATA INTO MATH DATABASE....................................... 15 C. EXTRACT AND MERGE DISABILITY DATA.............................................. 16 D. EXTRACT AND MERGE CITIZENSHIP DATA............................................ 17 E. EXTRACT AND MERGE FOURTH-REFERENCE-MONTH DATA............ 17 F. EXTRACT AND MERGE ASSETS AND EXPENSES ................................... 17 G. IMPUTE MISSING EXPENSES AND VEHICLES ......................................... 20
CONTENTS (continued) Chapter Page
vi
IV SIMULATING THE FSP.............................................................................................. 27
A. CLASSIFY PEOPLE INTO FOOD STAMP UNITS ........................................ 27 B. SIMULATE FSP ELIGIBILITY AND BENEFITS .......................................... 31
1. Determine Income Eligibility.................................................................... 32 2. Determine Asset Eligibility....................................................................... 33 3. Determine Food Stamp Benefit................................................................. 35
C. SELECT PROGRAM PARTICIPANTS............................................................ 35 D. FSP SIMULATION RESULTS ......................................................................... 36
REFERENCES 57
vii
TABLES AND FIGURE
Table Page II.1 TOPICAL MODULES OF THE 1996 PANEL ............................................................ 10 II.2 INTERVIEW AND REFERENCE MONTHS FOR WAVE 12................................... 11 II.3 SIPP SAMPLE SIZES FOR NOVEMBER 1999.......................................................... 12 II.4 COMPARISON OF ADMINISTRATIVE DATA AND REPORTED
PARTICIPATION IN SIPP........................................................................................... 13 III.1 ASSIGNMENT OF SHELTER EXPENSES AND DEPENDENT CARE
EXPENSES.................................................................................................................... 23 III.2 SHELTER EXPENSE IMPUTATION SELECTION CRITERIA ............................... 24 III.3 DEPENDENT CARE EXPENSE IMPUTATION SELECTION CRITERIA ............. 25 III.4 VEHICULAR ASSETS IMPUTATION SELECTION CRITERIA............................. 26 IV.1 FSP SPLITTING RULES AND RATES ...................................................................... 38 IV.2 PERCENT OF ABLE-BODIED ADULTS EXEMPT FROM TIME LIMITS,
FOR THOSE REPORTING FOOD STAMP RECEIPT.............................................. 39 IV.3 LIST OF REFUGEE COUNTRIES ............................................................................. 40 IV.4 FSP ELIGIBILITY PARAMETERS FOR NOVEMBER 1999 ................................... 41 IV.5 STANDARD UTILITY ALLOWANCE IN NOVEMBER 1999 FOR STATES
THAT DO NOT VARY THE ALLOWANCE BY HOUSEHOLD SIZE.................. 43 IV.6 STANDARD UTILITY ALLOWANCE IN NOVEMBER 1999 FOR STATES
THAT VARY THE ALLOWANCE BY HOUSEHOLD SIZE .................................. 44 IV.7 REGRESSION EQUATIONS FOR IMPUTING WHOLESALE FMV FOR
VEHICLES.................................................................................................................... 45 IV.8 2000 FSPQC TARGETS FOR THE NOVEMBER 1999 MATH SIPP .................... 46

TABLES (continued) Table Page
viii
IV.9 COMPARISON OF FSPQC DATA AND MATH SIPP MODEL FOR NOVEMBER 1999..................................................................................................... 47
IV.10 SUMMARY OF FOODS STAMP PROGRAM ........................................................ 48 IV.11 DISTRIBUTION OF ELIGIBLE AND PARTICIPATING FOOD STAMP
UNITS BY GROSS INCOME RELATIVE TO POVERTY AND UNIT SIZE--BASELAW .................................................................................................................. 49
IV.12 CHARACTERISTICS OF ELIGIBLE FOOD STAMP UNITS................................ 50 IV.13 CHARACTERISTICS OF PARTICIPATING FOOD STAMP UNITS .................... 51 IV.14 WELFARE STATUS OF ELIGIBLE FOOD STAMP UNITS ................................. 52 IV.15 WELFARE STATUS OF PARTICIPATING FOOD STAMP UNITS ..................... 53 IV.16 DEDUCTIONS OF ELIGIBLE FOOD STAMP UNITS ........................................... 54 IV.17 DEDUCTIONS OF PARTICIPATING FOOD STAMP UNITS ............................... 55 Figure
III.1 FLOWCHART OF PROGRAMS ................................................................................ 21

1
I. INTRODUCTION
The Food Stamp Program (FSP) is the largest domestic food and nutrition assistance
program administered by the U.S. Department of Agriculture’s Food and Nutrition Service.
Policymakers want to know how well the Food Stamp Program (FSP) is reaching the intended
population. For example, they want answers to the following: Are all of the eligible households
being served by this program? What percent are not being served? How do the nonparticipants
differ from the participants? Could outreach efforts be tailored so that more nonparticipants
would participate?
Policymakers also want to understand the impact of changes in the eligibility rules on FSP
caseload and costs. One way to learn this is by using a simulation model that evaluates the effect
of the change on a representative sample of households. In this way, policymakers can estimate
whether a change will be relatively small or significantly large. Using such a model,
policymakers would know whether an increase of $1,000 in the FSP asset limit would increase
program costs by $1,000 or $1 billion.
To meet these needs, Mathematica Policy Research, Inc. (MPR) developed two
microsimulation models for the Food and Nutrition Service (FNS). These models use different
surveys as their underlying databases. The first model, called the MATH� CPS model, uses the
Current Population Survey (CPS) as its underlying database. The second model, called the
MATH SIPP model, uses data from the Survey of Income and Program Participation (SIPP).
Both models simulate FSP eligibility by applying the eligibility guidelines to each household.
Both provide policymakers with an estimate of the number of eligible individuals and a
description of which eligible individuals tend to participate. Both models also simulate FSP
2
participation because the CPS and SIPP surveys tend to underreport the true number of
participants.
Every few years these models and underlying databases are updated. This report documents
the process of creating the 1999 MATH SIPP database and model. In this introductory chapter,
we briefly explain the processing steps and identify the major changes since the 1997 MATH
SIPP model (Sykes and Castner, 2002). Chapter II describes the SIPP. Chapter III describes the
creation of the model database. Chapter IV describes the simulation of the FSP. Tables fall at
the end of each chapter.
A. OVERVIEW OF PROCESSING STEPS
Since the required SIPP data are contained in several data products, the data processing
involves more than simply executing the model on more recent data. It involves:
• Extracting data about the households, families, and persons in the SIPP universe in November 1999, contained in the 1996 SIPP Panel Wave 12 Core file.1
• Converting the data into MATH format, which is a hierarchical database of households, families, and persons
• Extracting data about disability (most of which are contained in the 1996 SIPP Panel Wave 1 Core file) and merging this information onto the MATH database
• Extracting data about citizenship (contained in the 1996 SIPP Panel Wave 2 Topical Module file) and merging this information onto the MATH database
• Extracting data about the household composition and tenure in the fourth reference month (contained in the 1996 SIPP Panel Wave 12 Core file) and merging this information onto the MATH database
• Extracting data about living expenses and asset holdings (contained in the 1996 SIPP Panel Wave 12 Topical Module file) and merging this information onto the MATH database
1 We used the re-released SIPP Wave 12 Core file dated 8/4/2002.

3
• Imputing expenses and asset holdings for those households and persons who are present in the SIPP universe in November but are not in the universe when these data were collected (December through March)
• Simulating FSP eligibility and participation
B. MAJOR CHANGES
We made a number of important changes to the processing procedures and FSP simulation,
which make this version of the model different from the 1997 MATH SIPP model.
1. Treatment of Noncitizens in Reforms
The 1999 MATH SIPP Model allows us to study the impact of reforms on the noncitizen
population. In previous versions of the model, aliens living in households reporting FSP receipt
but not receiving benefits themselves were excluded in reforms. The 1999 model allows alien
non-reporters to participate under a reform by initially assigning them to a food stamp unit,
usually with their family or subfamily members, which will be used if alien restrictions are lifted.
2. Household Composition Algorithm Improved
We modified the household composition algorithm in the 1999 MATH SIPP model to make
it more consistent with the algorithm in the 2000 MATH CPS Model. This algorithm separates
out elderly households first, recognizing they have more opportunities to split than other
households do. We continue to separate households by the presence of unrelated persons, receipt
of TANF, and presence of children. Households are split based on patterns seen in the Food
Stamp Program Quality Control (FSPQC) data.
3. Disability Definition More Restrictive
We modified the current disability determinations to be more restrictive. A person needs to
not be working and have what appears to be a permanent or long-term illness to be subject to the
4
higher asset threshold and be allowed medical deductions. In general, the 1999 SIPP model only
classifies a person as disabled if they are receiving:
• SSI for self
• Veteran’s benefits for any reason (disability, survivor, pension, other) as long as they are not currently working due to a disability.
• Social Security for self, and due to a disability, and not currently working due to a disability.
• Pension from a company or union, federal, state, local, military, or other due to a disability.
• Disability, and not currently working due to a disability.
• Black Lung payments or Rail Benefits (for disability) and not currently working due to a disability.
4. Updated FSP Paramaters
We updated the FSP parameters to reflect the FSP eligibility rules as of November 1999.
These parameters were changed:
• Vehicle threshold
• Gross and net income screens
• Standard deduction
• Dependent care expense deduction
• Excess shelter expense deduction
• Standard utility allowances
• Maximum benefit amount
• Percent of nondisabled, nonelderly adults without children (reporters and non-reporters) eligible for Food Stamps.
5
C. OTHER REFERENCE MATERIAL
Two other documents further describe the MATH SIPP models:
1. 1999 MATH SIPP Programmer’s Guide
The 1999 MATH SIPP Programmer’s Guide (Bloom, et. al., 2003) provides programmers
and analysts with a tool to assist them in developing and maintaining the 1999 MATH SIPP
model. It describes all of the programs that create the baseline MATH database. It also describes
the various parts of the model, how they relate to each other, and the options available to the
user.
2. 1996 MATH SIPP User’s Guide
The 1996 MATH SIPP User’s Guide (Schechter, 2001) describes how to use the MATH
SIPP user interface to execute the model.

PAGE IS INTENTIONALLY LEFT BLANK TO ALLOW FOR DOUBLE-SIDED COPYING
7
II. THE SURVEY OF INCOME AND PROGRAM PARTICIPATION
SIPP provides monthly information on household composition, income, and participation in
various government programs, as well as periodic information on asset holdings, household
expenses, and citizenship status. Since the determination of FSP eligibility is based on this
information, SIPP becomes an ideal starting point for simulating eligibility. In this chapter, we
describe how SIPP is administered and what kind of data it provides. We also describe the
weaknesses of using SIPP and the changes to SIPP since the 1997 MATH SIPP model.
A. THE SIPP
SIPP is a nationally representative longitudinal survey providing detailed monthly
information on household composition, income, labor force activity, and participation in various
government programs, such as Medicaid, TANF, SSI, and the FSP. The interviewed population
is based on a multistage stratified sample of the noninstitutionalized resident population of the
United States. This includes persons living in households, as well as those persons living in
group quarters such as college dormitories and rooming houses. Inmates of institutions, such as
homes for the aged, and persons living abroad are not included. Persons residing in military
barracks, although part of the noninstitutionalized population, are also excluded. Other armed
forces personnel are included, as long as they are living in a housing unit on or off base (U.S.
Census Bureau, 2003).
For this version of the MATH SIPP model, we used data from the 1996 Panel of SIPP. In
that panel, people were interviewed every 4 months over a 4-year period. To ease the
administrative burden of interviewing such a large sample, the Census Bureau divided the panel
into four rotation groups. Only one rotation group was interviewed each month. In each round
8
(wave) of interviewing, persons age 15 or older were asked a set of core questions about their
demographic characteristics, income, program participation, and children for each of the
preceding four months. These core questions were supplemented with a set of questions on
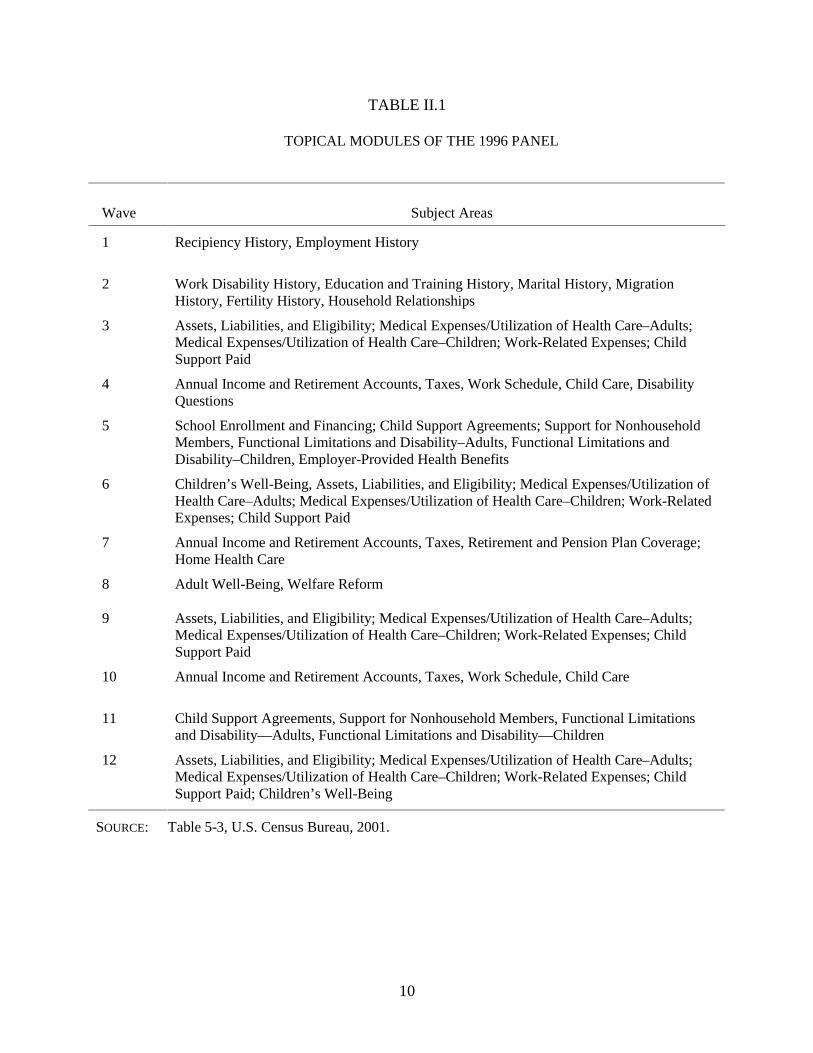
topical issues, which vary from wave to wave, as shown in Table II.1.
In Wave 12, information about financial asset balances, vehicle data, shelter expenses,
medical expenses, and dependent care expenses, which are needed to assess FSP eligibility, were
collected in the topical module. Therefore, we decided to focus on people who were in the SIPP
sample in the common reference month of Wave 12, which was November 1999, as shown in
Table II.2.
In November 1999, the Census Bureau successfully interviewed 28,214 households and
73,205 people for the SIPP. Weighted, this represents 104,527,101 households and 268,351,958
people, as shown in Table II.3. The use of computer-assisted interviewing to record
respondent’s answers enabled immediate consistency checks among reported information.
B. WEAKNESSES OF THE SIPP
By focusing on November 1999, however, we encountered three shortcomings. First, the
topical module questions were asked with respect to the household composition as of the fourth
reference month, not for each of the retrospective four months. So, people who were present in
November but not in the fourth reference month will not have any information about vehicles,
assets, or expenses. We overcame this omission by imputing the information using a statistical
matching technique. Second, some questions about why someone receives government transfers,
which are needed to determine food stamp disability status, were administered when the person
initially entered the SIPP universe, not every month. We overcame this problem by augmenting
the data with disability data taken from Wave 1, which is the initial interview for most people.
9
Third, the questions about citizenship were administered in the Wave 2 Topical Module. We
overcame this problem by merging the topical module information onto the database.
SIPP, like most household surveys, underreports the number of persons participating in
government programs. As shown in Table II.4, SIPP reported 15.9 million persons receiving
food stamps in November 1999, while the FSP Statistical Summary of Operations (hereafter
referred to as FSP Program Operations Data) reported 17.6 million. This reflects an
underreporting of 10 percent. The amount of underreporting increases to 13 percent when we
compare the number of food stamp units.
10
TABLE II.1
TOPICAL MODULES OF THE 1996 PANEL
Wave Subject Areas
1 Recipiency History, Employment History
2 Work Disability History, Education and Training History, Marital History, Migration History, Fertility History, Household Relationships
3 Assets, Liabilities, and Eligibility; Medical Expenses/Utilization of Health Care–Adults; Medical Expenses/Utilization of Health Care–Children; Work-Related Expenses; Child Support Paid
4 Annual Income and Retirement Accounts, Taxes, Work Schedule, Child Care, Disability Questions
5 School Enrollment and Financing; Child Support Agreements; Support for Nonhousehold Members, Functional Limitations and Disability–Adults, Functional Limitations and Disability–Children, Employer-Provided Health Benefits
6 Children’s Well-Being, Assets, Liabilities, and Eligibility; Medical Expenses/Utilization of Health Care–Adults; Medical Expenses/Utilization of Health Care–Children; Work-Related Expenses; Child Support Paid
7 Annual Income and Retirement Accounts, Taxes, Retirement and Pension Plan Coverage; Home Health Care
8 Adult Well-Being, Welfare Reform
9 Assets, Liabilities, and Eligibility; Medical Expenses/Utilization of Health Care–Adults; Medical Expenses/Utilization of Health Care–Children; Work-Related Expenses; Child Support Paid
10 Annual Income and Retirement Accounts, Taxes, Work Schedule, Child Care
11 Child Support Agreements, Support for Nonhousehold Members, Functional Limitations and Disability—Adults, Functional Limitations and Disability—Children
12 Assets, Liabilities, and Eligibility; Medical Expenses/Utilization of Health Care–Adults; Medical Expenses/Utilization of Health Care–Children; Work-Related Expenses; Child Support Paid; Children’s Well-Being
SOURCE: Table 5-3, U.S. Census Bureau, 2001.

11
TABLE II.2
INTERVIEW AND REFERENCE MONTHS FOR WAVE 12
Reference Months
Interview Month
Rotation Group
Aug 1999
Sep 1999
Oct 1999
Nov 1999
Dec 1999
Jan 2000
Feb 2000
Dec 1999 1 X X X X
Jan 2000 2 X X X X
Feb 2000 3 X X X X
Mar 2000 4 X X X X
SOURCE: Table 2-2, U.S. Census Bureau, 2001.

12
TABLE II.3
SIPP SAMPLE SIZES FOR NOVEMBER 1999
Unweighted
Weighted (Using Household
and Person Weights)
Weighted (Using Household
Weight)
Households 28,214 104,527,101 104,527,101
Persons 73,205 273,465,182 268,351,958
SOURCE: Tabulations of 1996 SIPP Panel Wave 12 Core File. NOTE: When tabulating the number of households and persons read and written, the MATH SIPP
Model uses the household weight.

13
TABLE II.4
COMPARISON OF ADMINISTRATIVE DATA AND REPORTED PARTICIPATION IN SIPP
Persons (1,000)
Units (1,000)
Administrative Data
FSP 17,568 7,449 SSI 6,275 6,275 TANF 6,848 2,558 SIPP Data FSP 15,901 6,497 SSI 6,798 6,538 TANF 4,377 1,793 Underreporting FSP 9.5% 12.8% SSI -8.3% -4.2% TANF 36.1% 29.9%
SOURCES: November 1999 FSP Program Operations Data, December 1999 Federal SSI Benefits
Awarded from the 2002 SSI Annual Report, Average monthly TANF caseload from the Green Book (FY 2003), and 1996 SIPP Panel Wave 12 Core File.

PAGE IS INTENTIONALLY LEFT BLANK TO ALLOW FOR DOUBLE-SIDED COPYING
15
III. CREATING THE MODEL DATABASE
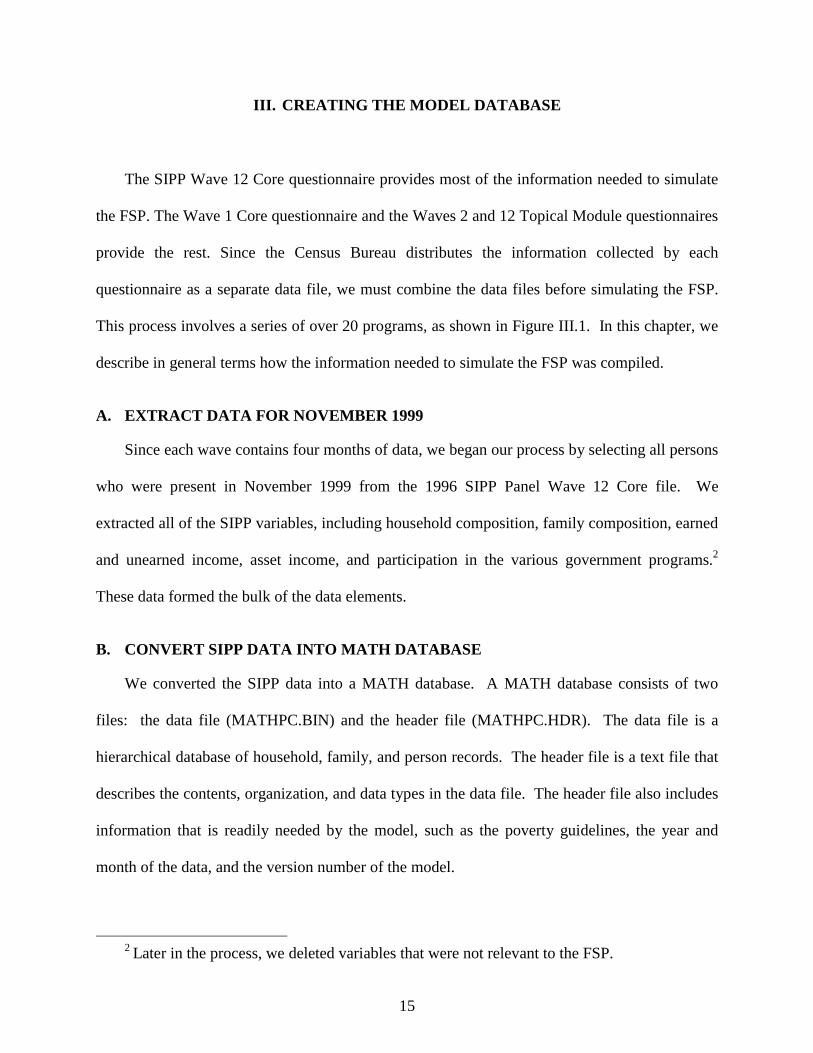
The SIPP Wave 12 Core questionnaire provides most of the information needed to simulate
the FSP. The Wave 1 Core questionnaire and the Waves 2 and 12 Topical Module questionnaires
provide the rest. Since the Census Bureau distributes the information collected by each
questionnaire as a separate data file, we must combine the data files before simulating the FSP.
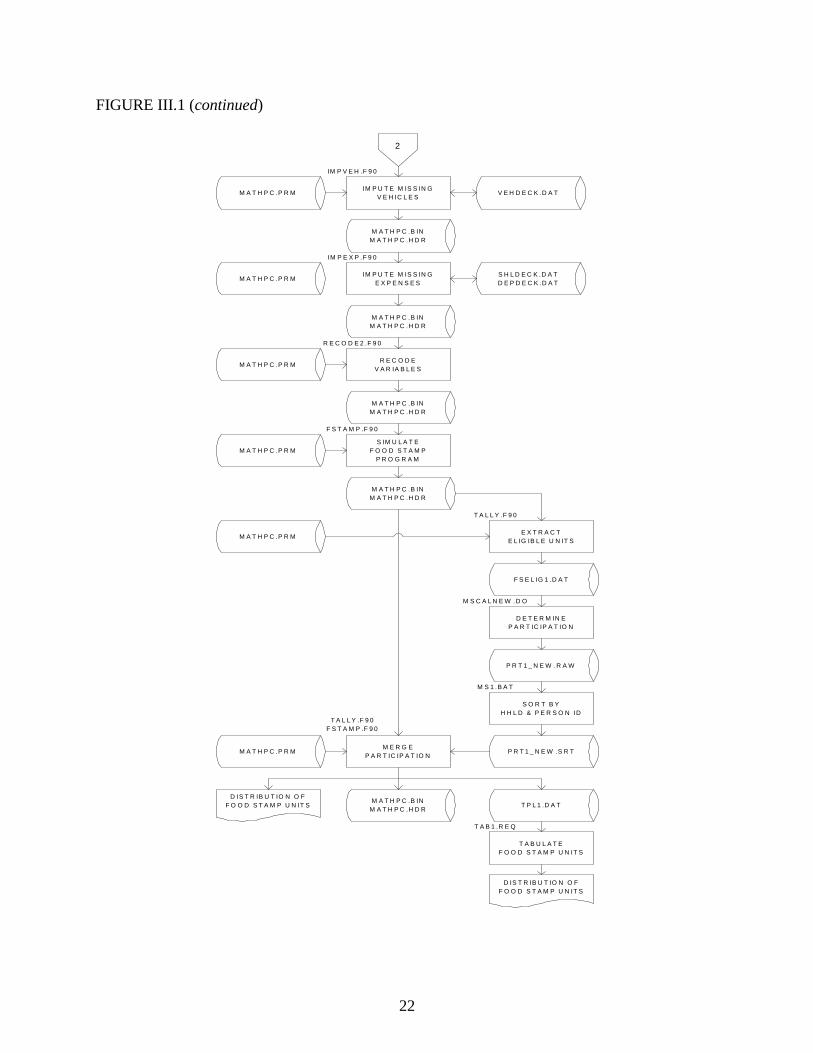
This process involves a series of over 20 programs, as shown in Figure III.1. In this chapter, we
describe in general terms how the information needed to simulate the FSP was compiled.
A. EXTRACT DATA FOR NOVEMBER 1999
Since each wave contains four months of data, we began our process by selecting all persons
who were present in November 1999 from the 1996 SIPP Panel Wave 12 Core file. We
extracted all of the SIPP variables, including household composition, family composition, earned
and unearned income, asset income, and participation in the various government programs.2
These data formed the bulk of the data elements.
B. CONVERT SIPP DATA INTO MATH DATABASE
We converted the SIPP data into a MATH database. A MATH database consists of two
files: the data file (MATHPC.BIN) and the header file (MATHPC.HDR). The data file is a
hierarchical database of household, family, and person records. The header file is a text file that
describes the contents, organization, and data types in the data file. The header file also includes
information that is readily needed by the model, such as the poverty guidelines, the year and
month of the data, and the version number of the model.
2 Later in the process, we deleted variables that were not relevant to the FSP.
16
C. EXTRACT AND MERGE DISABILITY DATA
The FSP considers persons under age 60 to be disabled if they receive SSI or if they receive
certain types of other unearned income due to a disability. Households containing disabled
persons are then subjected to different FSP eligibility rules. This usually makes the household
eligible for more benefits than it would have been if it did not contain a disabled person.
The Wave 12 Core questionnaire includes information about how much a person received
from SSI, Social Security, government pensions, railroad retirement, veteran's benefits, workers’
compensation, black lung payments, sickness benefits, and disability payments.
We extract people who reported receiving the income as well as the reason why they
received it from the Wave 1 Core file. We then merged the Wave 1 information onto the MATH
database.
Using the information from Wave 1 and the information from November 1999, we
determined if a person was classified as disabled by the FSP. Nonelderly persons receiving SSI
were automatically classified as disabled.3 The disability status of those not receiving SSI was
based on the reason why the person received the other types of unearned income. If the person
received the income in either Wave 1 or November 1999 due to a disability, the person was
classified as disabled. If the person started receiving the income between Wave 1 and November
1999, disability was inferred based on the presence of Medicare coverage or the presence of a
work-limiting condition that precluded the person from participating in the labor force. We
determined that 3.2 million persons in November 1999 were disabled according to the FSP
standards.
3 Nonelderly persons can receive SSI only if they are disabled.
17
D. EXTRACT AND MERGE CITIZENSHIP DATA
Due to the Personal Responsibility and Work Opportunities Reconciliation Act (PRWORA),
most types of noncitizens are now excluded from the FSP. In November 1999, noncitizens who
met the work history or veteran requirements were exempt, as were refugees.
The Wave 2 Topical Module questionnaire asked about citizenship and migration of each
adult. We extracted this information and merged it onto the MATH database.
E. EXTRACT AND MERGE FOURTH-REFERENCE-MONTH DATA
Asset holdings and expenses are needed to simulate the FSP. This information is collected
in the Wave 12 Topical Module questionnaire. But, some of this information pertains to the
household as defined in the fourth reference month, which may not be the same as the household
as defined in November 1999.4 The accuracy of the topical module information, consequently,
depends on whether the person is living in the same household, whether the household has
changed its location, and whether the household composition has changed between November
and the fourth reference month. Thus, we extracted information about each person’s household
as of the fourth reference month and merged it onto the MATH database.
F. EXTRACT AND MERGE ASSETS AND EXPENSES
As the previous section mentioned, asset holdings and expenses are needed to simulate the
FSP. Assets holdings, such as financial assets and vehicular assets, are subjected to the FSP
asset test. Expenses incurred for medical care, dependent care, shelter, and child support
payments are deducted from FSP gross income.
4 Prior to the 1996 SIPP Panel, this information pertained to the household as defined in the
interview month.
18
The Wave 12 Topical Module questionnaire asked about asset holdings and those expenses.
Some questions were presented to every adult. Some were presented only to the household
reference person, who responded on behalf of all of the individuals in the household as of the
fourth reference month. The way the question was asked dictated how we processed the
information.
Questions about financial assets, medical care expenses, and child support payments were
presented to each working-age person (age 15 or older). Thus, we simply extracted the
information and merged it onto the MATH database.
Questions about shelter and dependent care expenses were presented only to the household
reference person. We extracted this information, but merging it onto the MATH database is not
as straightforward as it appears. The data represent the household composition as of the fourth
reference month, not as of November 1999, which is the date of the MATH database. Thus, the
household reference person in the fourth reference month may not be the same as the household
reference person in the MATH database. Consider the following scenarios:
• What if the reference person in the fourth reference month was not in the sample in the MATH database? Should that information be assigned, even though other persons in that household are in the sample in the MATH database?
• What if the household reference person in the fourth reference month lives in a different dwelling unit or has a different tenure status (owner versus renter) compared to the status in the MATH database? Do the shelter and utility expenses still apply?
• What if the reference person in the MATH database is not present in the fourth reference month? How should expenses be assigned to that household?
We designed our approach to meet these challenges. If the reference person in the MATH
database was also a reference person in a fourth reference month, we assumed the information
reported in the fourth reference month was valid for the MATH database. If the reference person
in the MATH database was not a reference person in the fourth reference month or if the

19
reference person in the fourth reference month was a non-interview (and therefore the Census
Bureau imputed all of the information), we imputed the shelter and dependent care expenses
(described later in this chapter). We also assumed, for shelter expenses, that if the reference
person in the MATH database lived at the same address in the fourth reference month, the
household expenses as reported by someone else in that household would apply to the household
in the MATH database even though a different person acted as the reference person.5
As shown in Table III.1, 98 percent of the households in the MATH database contain a
household reference person who lives in the same household in the fourth reference month and
acts as the household reference person in both periods. Only 2 percent of the households in the
MATH database had their data completely imputed by the Census Bureau or had a change in
their household circumstances, such as a different household reference person, a different
address, or a different number of persons living at that address. Less than 100 households (0.3
percent) needed expenses imputed.
Questions about vehicle ownership were also presented only to the household reference
person, but in this case the reference person identified who owned each vehicle, whether the
vehicle was used for work or to transport disabled persons, the FMV of the vehicle, and how
much was owed on the vehicle. Thus, unlike the household expenses, the vehicle data
corresponded to individuals. So, merging the vehicle data was not as restrictive as merging the
expense data. One scenario, however, needs special consideration:
• What if a son lived with his parents during the fourth reference month but did not live with them in November? Should the son’s vehicles, which were reported by his parents, be assigned to the son, even though he doesn’t live with his parents anymore?
5 An example is when a son lives with his parents in January (the father is the reference
person) and the father sells the house to his son before the interview month (now the son is the reference person).

20
We assumed the vehicle information was valid even though the son had moved. If,
however, a person was not present in the fourth reference month (and therefore no one had
information about that person’s vehicle(s)) or if the reference person in the fourth reference
month was a non-interview (and therefore the Census Bureau imputed all of the information), we
imputed his/her vehicle data (see next section). 6
G. IMPUTE MISSING EXPENSES AND VEHICLES
We used a statistical matching technique known as the hot-deck imputation method to
impute missing expenses and vehicles. The hot-deck method matches households for which data
are missing with households that report data based on characteristics that are highly correlated
with the missing data.
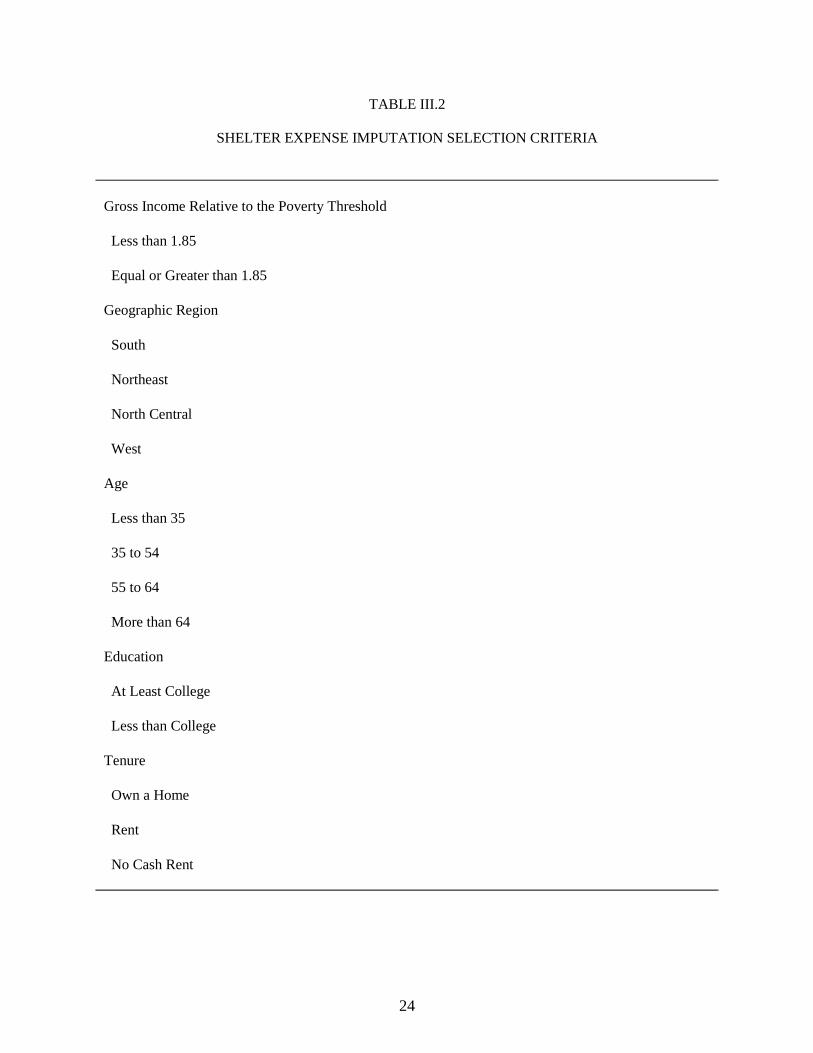
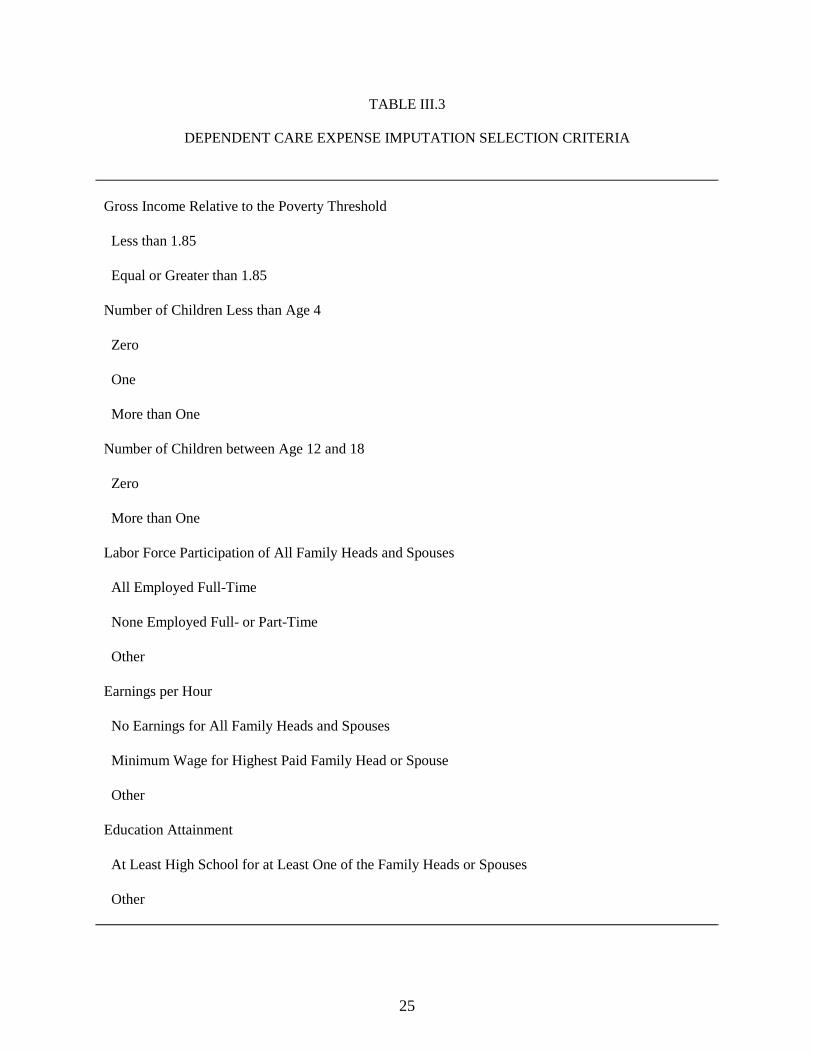
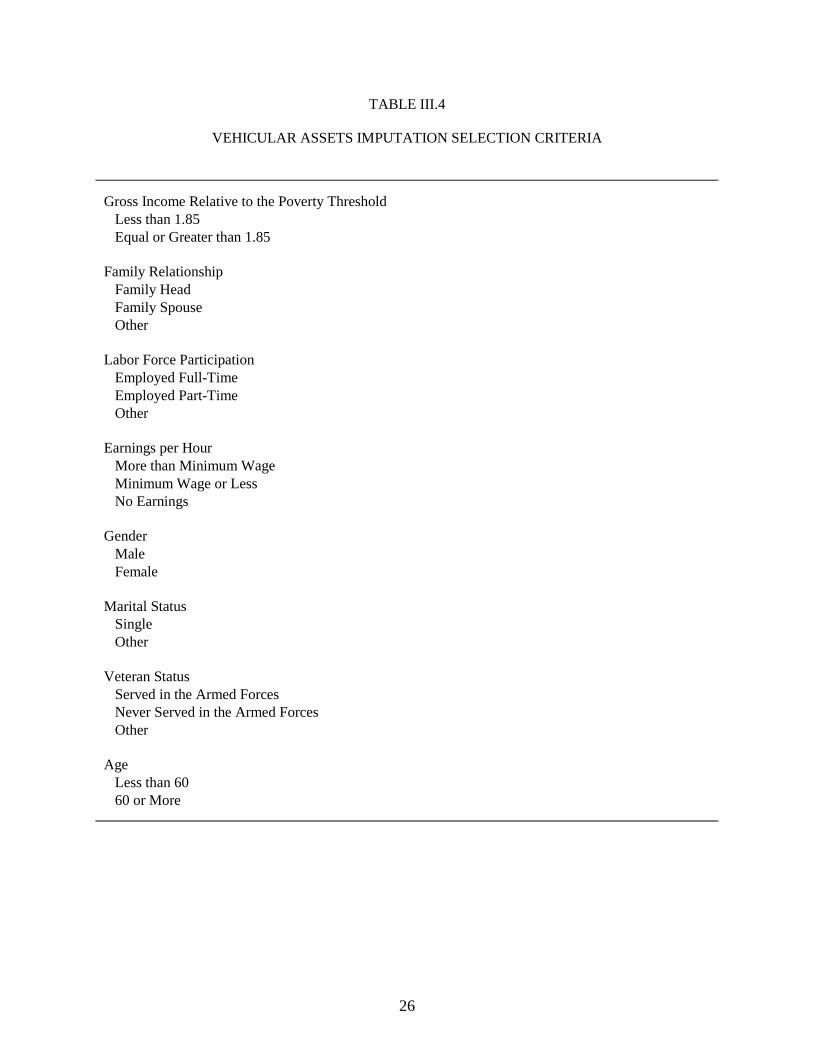
The characteristics that are highly correlated with the missing data differ according to the
data that are being imputed. For shelter expenses, we used the following characteristics:
household poverty status, geographic region, age and education of the reference person, and
tenure status (Table III.2). For dependent care expenses, we used the following criteria:
household poverty status, presence of children under age 4, presence of children between the
ages of 12 and 18, employment and education level of all of the parents in the household, and
earnings of the highest paid parent (Table III.3). For vehicle ownership, we used the following:
household poverty status; the individual's relationship to the household head; and the individual's
employment status, earnings, gender, marital status, veteran's status, and age (Table III.4).
6 People who are non-interviews have EPPINTVW= 3 or 4.

21
FIGURE III.1
FLOWCHART OF PROGRAMS
EXTRACTNOV 1999
EXTRPER.F90
XTPERW12.PER
SORT BYHHLD & FAM ID
SRTPERW12.BAT
XTPERW12.SRT
CONVERT TOBINARY FORMAT
CONV2BIN.F90
XTPERW12.BIN
MAKE MATHSIPPDATA FILE
MAKESIPP.F90
MATHPC.BIN
MAKE MATHSIPPHEADER FILE
MAKEHEAD.F90
SIP96W12D.TXT
MATHPC.HDR
RECODEVARIABLES
RECODE.F90
MATHPC.BINMATHPC.HDR
MATHPC.PRM
MERGEDISABILITY
TALLY.F90
MATHPC.BINMATHPC.HDR
EXTRACTDISABILITY
1996 SIPPWAVE 1 CORE
W1CORE96.ASC
EXTRWAV1.PER
1999 SIPPWAVE 12 CORE
W12CORE96.ASC
MATHPC.PRM
MERGECITIZENSHIP
MATHPC.BINMATHPC.HDR
EXTRACTCITIZENSHIP
1996 SIPPWAVE 2 TOPMOD
W2TOP96.ASC
EXTRW2TM.PERMATHPC.PRM
EXTRWAV2.F90
1
MERGEMONTH 4 INFO
MATHPC.BINMATHPC.HDR
EXTRACTMONTH 4 INFO
1996 SIPPWAVE 12 CORE
W12CORE96.ASC
XTMON4.PERMATHPC.PRM
EXTRPER4.F90
TALLY.F90
MERGEPERSON-LEVEL
ASSETS & EXPENSES
MATHPC.BINMATHPC.HDR
EXTRACTPERSON-LEVEL
ASSETS & EXPENSES
1996 SIPPWAVE 12 TOPMODP96PUTM12.DAT
XTASTW12.PERMATHPC.PRM
EXTRW3AS.F90
TALLY.F90
MERGEHOUSEHOLD-LEVEL
ASSETS & EXPENSES
MATHPC.BINMATHPC.HDR
EXTRACTHOUSEHOLD-LEVEL
ASSETS & EXPENSES
1996 SIPPWAVE 12 TOPMODP96PUTM12.DAT
XTREFW12T.PER
MATHPC.PRM
XTRW12REF.F90
TALLY.F90
SORT BY PERSON ID
XTREFW12T.SRT
SRTREFW3.BAT
1
2
EXTRWAV1.F90
EXTRWAV2.F90
TPLA.BIN
TABULATE JOINT ASSETS
TAB1.REQ
DISTRIBUTION OFJOINT ASSETS
22
FIGURE III.1 (continued)
M A T H P C .P R MR E C O D E
V A R IA B L E S
M A T H P C .B INM A T H P C .H D R
R E C O D E 2 .F 9 0
2
M A T H P C .P R MS IM U L A T E
F O O D S T A M PP R O G R A M
M A T H P C .B INM A T H P C .H D R
F S T A M P .F 9 0
M A T H P C .P R ME X T R A C T
E L IG IB L E U N IT S
F S E L IG 1 .D A T
T A L L Y .F 9 0
D E T E R M IN EP A R T IC IP A T IO N
P R T 1 _ N E W .R A W
M S C A L N E W .D O
S O R T B YH H L D & P E R S O N ID
P R T 1 _ N E W .S R T
M S 1 .B A T
M E R G EP A R T IC IP A T IO N
M A T H P C .B INM A T H P C .H D R
T A L L Y .F 9 0F S T A M P .F 9 0
M A T H P C .P R M
T P L 1 .D A T
T A B U L A T EF O O D S T A M P U N IT S
T A B 1 .R E Q
D IS T R IB U T IO N O FF O O D S T A M P U N IT S
D IS T R IB U T IO N O FF O O D S T A M P U N IT S
IM P U T E M IS S IN GV E H IC L E S
V E H D E C K .D A TM A T H P C .P R M
IM P V E H .F 9 0
M A T H P C .B INM A T H P C .H D R
IM P U T E M IS S IN GE X P E N S E S
S H L D E C K .D A TD E P D E C K .D A T
M A T H P C .P R M
IM P E X P .F 9 0
M A T H P C .B INM A T H P C .H D R

23
TABLE III.1
ASSIGNMENT OF SHELTER EXPENSES AND DEPENDENT CARE EXPENSES
Unweighted
Number Percent Total Households in MATH Database
28,214 100.0
Assignment Accuracy of Shelter Expenses
Reference person in MATH database is the reference person in the fourth reference month and lives at the same address
27,790 98.5
Reference person in MATH database is the reference person in the fourth reference month but lives at a different address and yet the tenure status (own versus rent) is the same as the previous address
210 0.7
Reference person in MATH database is the reference person in the fourth reference month but lives at a different address and the tenure status (own versus rent) is different
119 0.4
Reference person in MATH database lives at the same address but is not a reference person in the fourth reference month
7 0.0
Reference person in MATH database lives at a different address and is not a reference person in the fourth reference month
81 0.3
Assignment Accuracy of Dependent Care Expenses
Reference person in MATH database is the reference person in the fourth reference month and lives with the same number of persons
27,587 97.7
Reference person in MATH database is the reference person in the fourth reference month but lives with a different number of persons (and reports no dependent care expenses)
505 1.8
Reference person in MATH database is the reference person in the fourth reference month but lives with a different number of persons (and reports dependent care expenses)
27 0.1
Reference person in MATH database but is not a reference person in the fourth reference month
88 0.3
SOURCE: 1999 MATH SIPP database
24
TABLE III.2
SHELTER EXPENSE IMPUTATION SELECTION CRITERIA
Gross Income Relative to the Poverty Threshold Less than 1.85 Equal or Greater than 1.85 Geographic Region South Northeast North Central West Age Less than 35 35 to 54 55 to 64 More than 64 Education At Least College Less than College Tenure Own a Home Rent No Cash Rent
25
TABLE III.3
DEPENDENT CARE EXPENSE IMPUTATION SELECTION CRITERIA
Gross Income Relative to the Poverty Threshold Less than 1.85 Equal or Greater than 1.85 Number of Children Less than Age 4 Zero One More than One Number of Children between Age 12 and 18 Zero More than One Labor Force Participation of All Family Heads and Spouses All Employed Full-Time None Employed Full- or Part-Time Other Earnings per Hour No Earnings for All Family Heads and Spouses Minimum Wage for Highest Paid Family Head or Spouse Other Education Attainment At Least High School for at Least One of the Family Heads or Spouses Other
26
TABLE III.4
VEHICULAR ASSETS IMPUTATION SELECTION CRITERIA
Gross Income Relative to the Poverty Threshold Less than 1.85 Equal or Greater than 1.85 Family Relationship Family Head Family Spouse Other Labor Force Participation Employed Full-Time Employed Part-Time Other Earnings per Hour More than Minimum Wage Minimum Wage or Less No Earnings Gender Male Female Marital Status Single Other Veteran Status Served in the Armed Forces Never Served in the Armed Forces Other Age Less than 60 60 or More

27
IV. SIMULATING THE FSP
Once the information needed to simulate the FSP was compiled, we simulated the FSP
eligibility rules and selected participants. This chapter describes the eligibility simulation, which
classifies people into food stamp units and identifies if the unit is eligible for a benefit.7 It also
describes the way in which participants were selected and the simulation results.
A. CLASSIFY PEOPLE INTO FOOD STAMP UNITS
Persons who customarily purchase and prepare food together form a food stamp unit. In
most cases, the food stamp unit includes all members of the household. In some cases, however,
people may form a separate food stamp unit from other members of the household, as long as
they purchase and prepare food separately. Some exceptions are:
• Spouses must apply together.
• Parents and their children under age 22 must apply together, even if the children have a spouse or child of their own.
• Persons who are both elderly and disabled, along with their spouses, are allowed to form a food stamp unit separate from other members of the household regardless of food purchase and preparation practices, provided that the total income of the other household members does not exceed 165 percent of poverty.
Since FSP eligibility rules apply only to persons in the food stamp unit, deciding who
belongs in the food stamp unit is of utmost importance. Unfortunately, the SIPP data do not
contain detailed food purchasing and preparation information. We can, however, infer which
7 The discussion that follows is an overview of how we modeled the regulations that govern
FSP eligibility and benefits. We omit from this discussion aspects of the FSP that were not modeled. The complete regulations appear in the Code of Federal Regulations (FCR, parts 270-273).
28
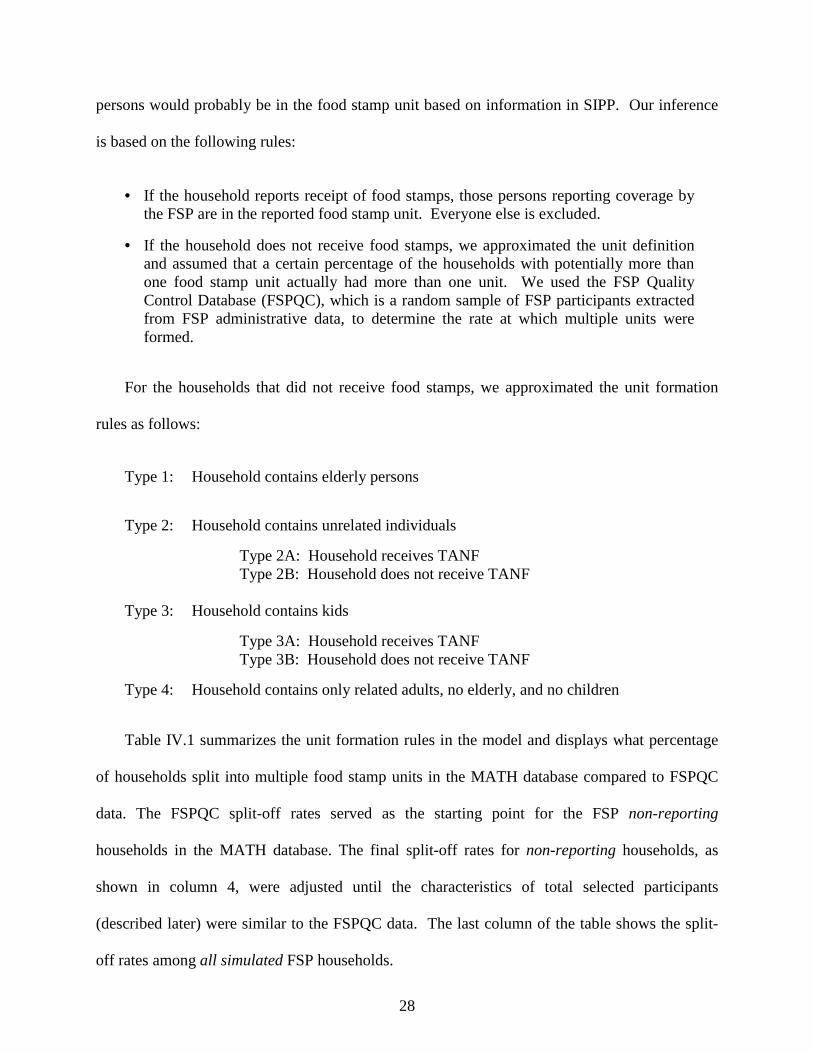
persons would probably be in the food stamp unit based on information in SIPP. Our inference
is based on the following rules:
• If the household reports receipt of food stamps, those persons reporting coverage by the FSP are in the reported food stamp unit. Everyone else is excluded.
• If the household does not receive food stamps, we approximated the unit definition and assumed that a certain percentage of the households with potentially more than one food stamp unit actually had more than one unit. We used the FSP Quality Control Database (FSPQC), which is a random sample of FSP participants extracted from FSP administrative data, to determine the rate at which multiple units were formed.
For the households that did not receive food stamps, we approximated the unit formation
rules as follows:
Type 1: Household contains elderly persons
Type 2: Household contains unrelated individuals
� Type 2A: Household receives TANF � Type 2B: Household does not receive TANF
Type 3: Household contains kids
� Type 3A: Household receives TANF � Type 3B: Household does not receive TANF
Type 4: Household contains only related adults, no elderly, and no children
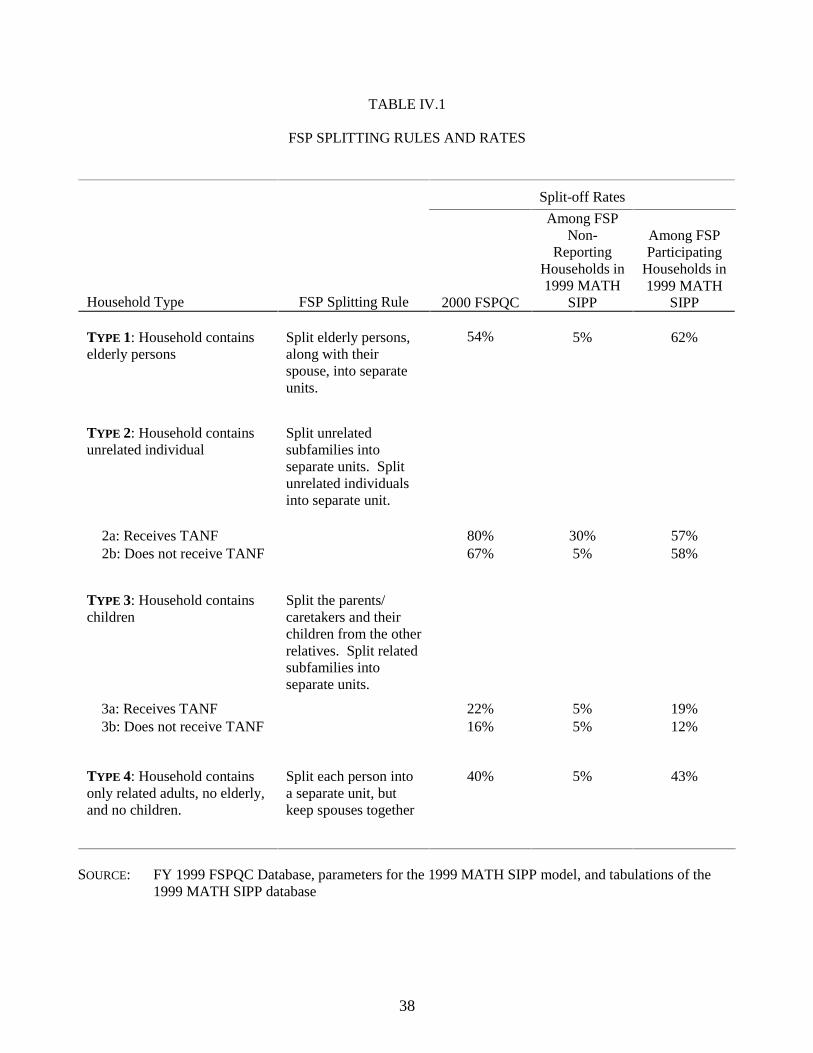
Table IV.1 summarizes the unit formation rules in the model and displays what percentage
of households split into multiple food stamp units in the MATH database compared to FSPQC
data. The FSPQC split-off rates served as the starting point for the FSP non-reporting
households in the MATH database. The final split-off rates for non-reporting households, as
shown in column 4, were adjusted until the characteristics of total selected participants
(described later) were similar to the FSPQC data. The last column of the table shows the split-
off rates among all simulated FSP households.

29
There are a number of exceptions to the aforementioned unit formation rules. First, persons
living in California who receive SSI are excluded from the food stamp unit because California’s
SSI program includes a special monetary supplement in lieu of food stamps. We excluded these
people even if the SIPP reported them as being in the food stamp unit.
Second, postsecondary students are excluded from the food stamp unit. These are people
who are 17 to 50 years of age, physically and mentally fit for work, and enrolled more than 50
percent of the time in postsecondary education. They are exempt from this exclusion if they also
work 20 or more hours per week, receive TANF, or are a single parent of a child under age 12.
Third, persons living in group quarters are excluded from the FSP, even though in actuality
persons living in group arrangements can apply for food stamps if their living arrangement meets
certain criteria. Unfortunately, SIPP does not include the data needed to model these criteria, so
we cannot determine whether the persons in group quarters actually are eligible. Since this group
is small, we decided to be conservative and exclude all persons in group quarters from the FSP.
Fourth, unmarried partners of household reference persons are put in the same food stamp
unit as the household reference person.8 Family members, such as children, of the unmarried
partner are also put in the household reference person’s food stamp unit.
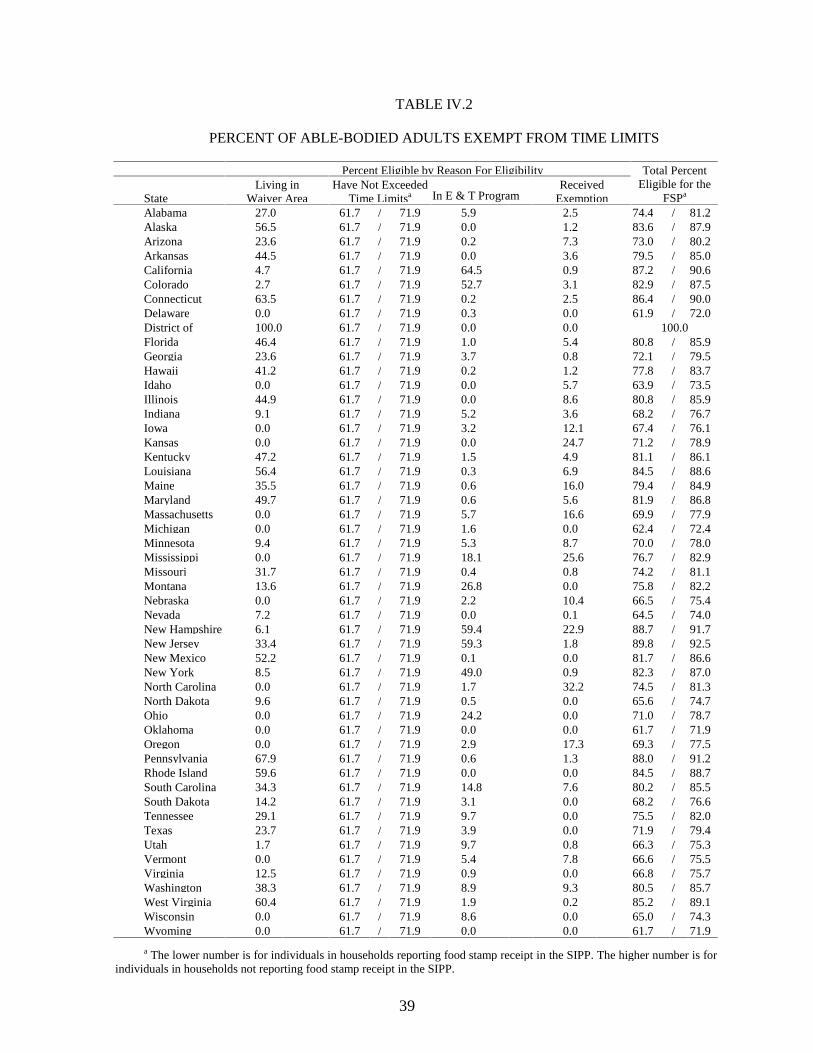
Fifth, the Personal Responsibility and Work Opportunities Reconciliation Act (PRWORA)
set time limits for many able-bodied adults without children. Individuals age 18 to 49, who are
mentally and physically able to work, not living with children, and not exempt from the FSP
work registration requirements, must meet certain work requirements. If they do not meet the
work requirements, they are limited to 3 months of benefits in any 36-month period. To meet the
8 With the 1996 Panel, the identification of unmarried partners is now possible.
9 This percentage is based on the percentage measured in the Panel Survey of Income Dynamics (PSID) data.
30
work requirements, they must be working at least 20 hours per week (or be paid an equivalent of
20 hours per week at minimum wage) or participate in an employment and training program. Of
those who do not meet the work requirements, some remain eligible because of waivers and
others are in their first three months of FSP receipt. In the model, we randomly chose some able-
bodied 18- to 49-year-olds, with no children in the family, who were also not students or
receiving unemployment compensation to be eligible.10 We chose some to be eligible because
they are in their first 3 months, and some because of the waiver areas. The percentages used for
each of these categories are shown in Table IV.2, by state.11
Sixth, in 1996, PRWORA disqualified many noncitizens from the FSP allowing only those
with sufficient work history, those who were current or former members of the U.S. Armed
Forces, and refugees who had been in the United States for less than five years to be eligible,
along with their families. In 1998, the Agricultural Research Extension and Education Reform
Act (AREERA) restored eligibility to noncitizen children, elderly, and disabled noncitizens who
had been in the United States since 1996. AREERA also extended the eligibility period for
refugees from five years to seven years.
In the SIPP, we only know citizenship from Wave 2, or in early 1996. Thus, each person on
the file whose year of entry was known, arrived in 1996 or earlier. Instead of assuming that all
noncitizen children, elderly, and disabled were eligible, we required them to have been in the
United States for at least three years. We determine the child’s year of arrival in the United
10 The students and individuals receiving unemployment compensation are exempt from
work registration.
11 We use different percentages for individuals in their first 3 months of participation, based on current participation in the FSP, accounting for the fact that current participants are more likely to have 3 months of participation than non-participants.
31
States based on the mother’s year of arrival. If there is no mother, we use the father’s year of
arrival. If there is no parent, the year of arrival of the closest relative is used.
Refugees are not identifiable in the SIPP data. To model the exception for refugees who
have been living in the United States less than 7 years, we assumed that noncitizens emigrating
within the past 7 years from countries with a large refugee population (see Table IV.3) met this
exception. PRWORA also made an exception for noncitizens who accumulated forty quarters of
work (in combination with their spouse and parents) or who were U.S. veterans. To simplify
matters, we assumed that a certain percentage (17.8%) of noncitizens who did not have their
eligibility restored by the AREERA provisions described above would be categorically eligible
for the FSP due to work history or veteran requirements.12 The remaining noncitizens were
excluded from the FSP but were required to deem a pro-rata share of their income and all of their
assets to the people in the household who could receive food stamps.
B. SIMULATE FSP ELIGIBILITY AND BENEFITS
The MATH SIPP model replicates the FSP eligibility criteria in effect in November 1999. In
a sense, the model acts as an FSP caseworker. On a case-by-case basis, it determines whether
the food stamp unit is eligible for food stamps, a function of both available cash income and
assets. If the unit is income eligible and asset eligible, the model then determines the amount of
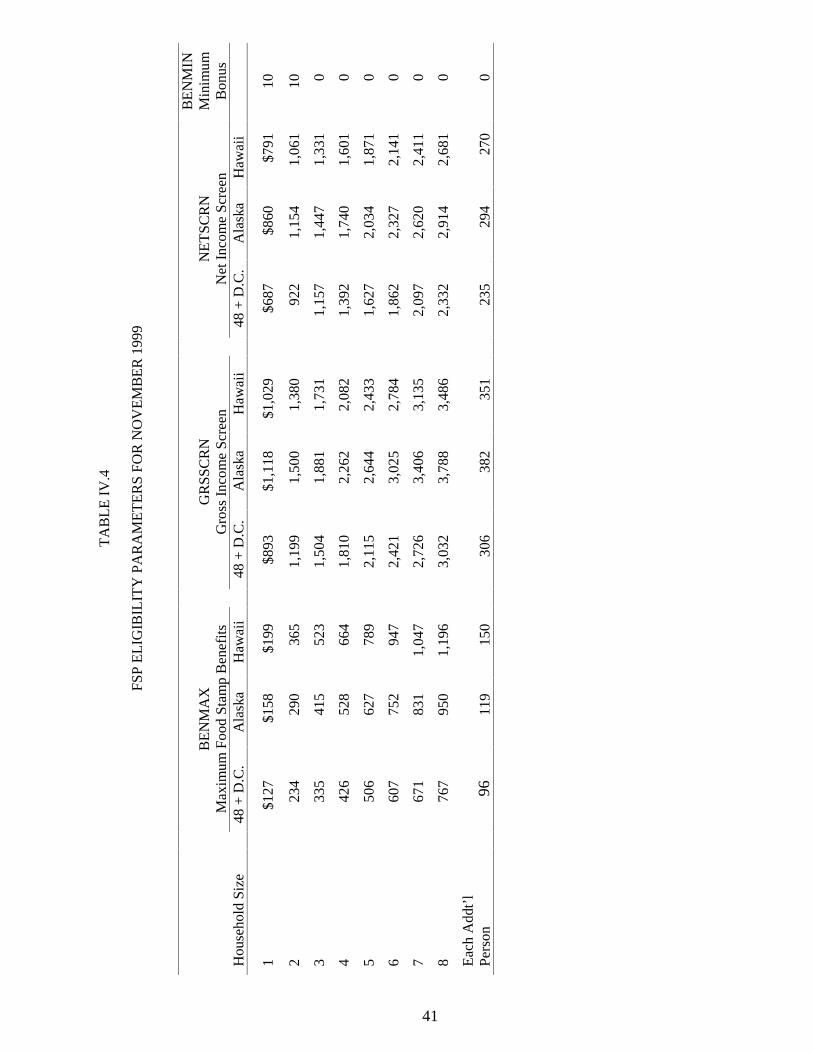
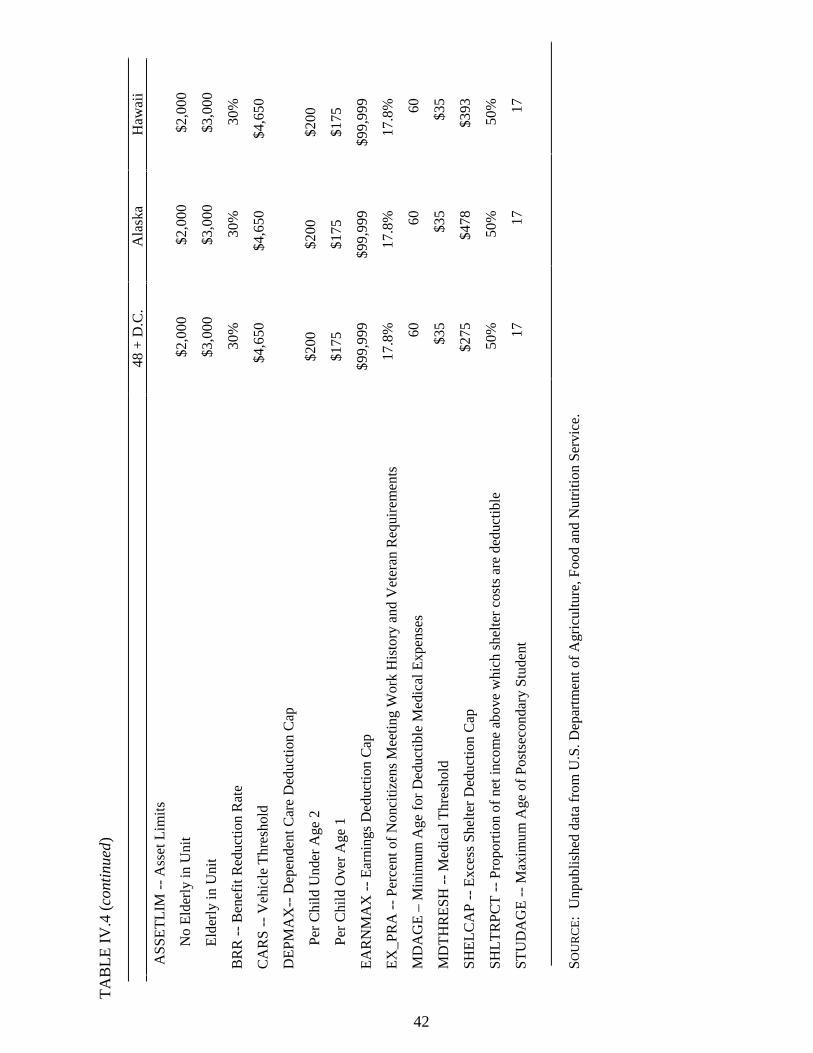
food stamp benefit for which the unit is entitled. Table IV.4 summarizes the FSP eligibility
parameters in effect in November 1999.
12 This percentage is based on the percentage measured in the Panel Survey of Income
Dynamics (PSID) data.
32
1. Determine Income Eligibility
To be income eligible, the unit’s gross income must not exceed 130 percent of the Federal
poverty guideline and the unit’s net income (gross income less certain deductions) must not
exceed 100 percent of the Federal poverty guideline.13 There are two exceptions to these rules.
First, if the unit contains an elderly or disabled person, it is exempt from the gross income
screen. Second, if the unit contains only persons on public assistance (PA) (e.g. only persons
with TANF, SSI, GA, other welfare, or foster care), the unit is automatically income eligible
regardless of the amount of its income. These PA programs have more restrictive eligibility
guidelines than the FSP, so presumably the unit would already be income eligible.
Gross income is all cash income, including all earned cash income (salary, self-employment,
moonlighting, and, depending on the amount, miscellaneous income and income from family and
friends) and most sources of unearned income, such as TANF, SSI, GA, and Social Security.
Since PA units do not necessarily match the food stamp unit, we distribute the PA income
equally over all members of the respective PA unit. Then, for each food stamp unit, we add each
food stamp member�s pro-rata share of PA income to the food stamp unit’s gross income.
Earned income tax credits, energy assistance, education assistance, and the earnings of high
school students are examples of the kinds of income not included.
PRWORA requires that the income of aliens who have been disqualified from participation
in the FSP be allocated, in part, to the remaining members of the food stamp unit. We pro-rate
both the earned and unearned income of the disqualified alien and return it to the unit. The unit’s
deductions are then determined off the total unit income.
13 The poverty guidelines are based on the official monthly poverty guidelines published by
the U.S. Department of Health and Human Services, which are adjusted each year to account for inflation. These guidelines and other FSP parameters are generally the same for the 48 contiguous states and the District of Columbia and vary slightly for Alaska and Hawaii.

33
After some discussions with FNS and a review of the FSP regulations, we modified
unearned income to include or exclude certain types of income, depending on the amount of the
income. Miscellaneous income and income from friends and family are counted as earned
income when the amount is greater than $10 per month ($30 per quarter) and unearned income
otherwise. Charity income is unearned income when it is more than $100 per month (or $300
per quarter) and a financial asset otherwise. Lump sum retirement is now counted as assets
instead of unearned income.
Net income is gross income less the following five deductions:
• Standard deduction of $134 (continental U.S.), $229 (Alaska), or $189 (Hawaii).
• Earnings deduction equaling 20 percent of earnings, in recognition of taxes and work-related expenses
• Dependent care expense deduction of no more than $200 per dependent under age 2 and $175 per dependent age 2 or older.
• Medical expense deduction equaling sum of the unit’s total medical expenses in excess of $35, as long as these expenses were incurred by elderly (age 60 or older) or disabled persons.
• Child support payment expense deduction equaling the amount of the expense.
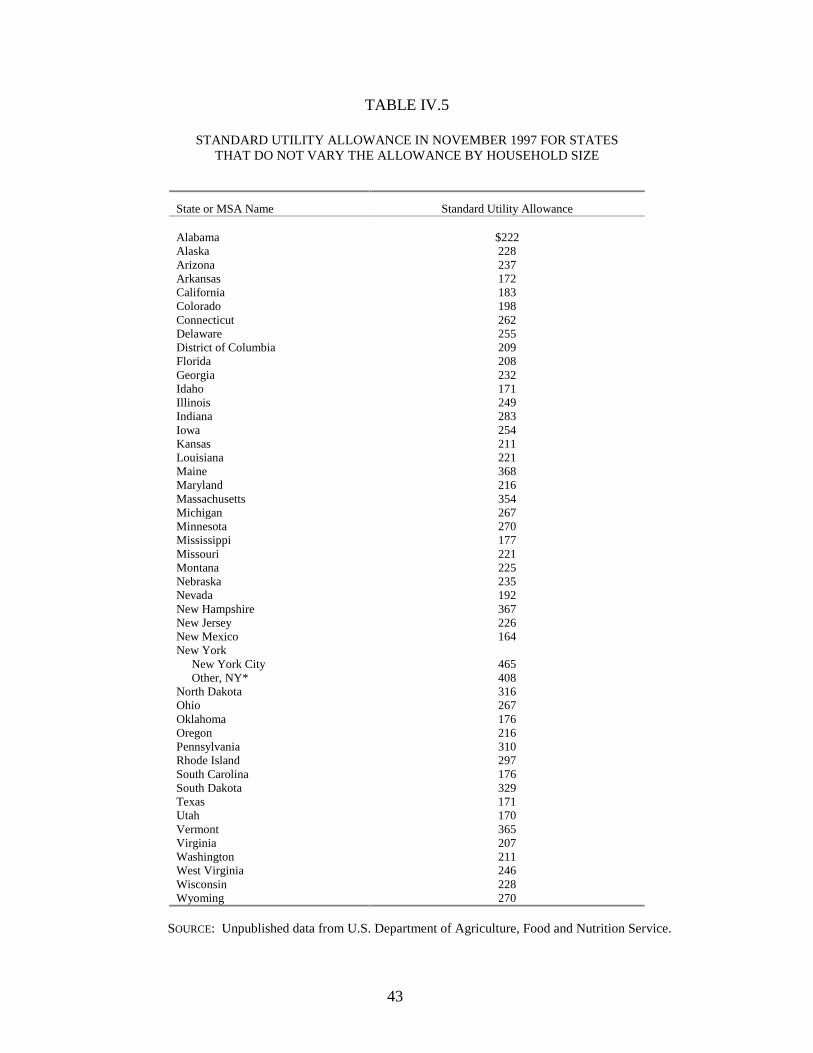
• Excess shelter deduction equaling the unit’s shelter expense in excess of 50 percent of the unit’s net income after the previous five deductions are taken. For those units without an elderly or disabled person, this deduction is subject to a cap of $275 (continental U.S.), $478 (Alaska), or $393 (Hawaii). The shelter expense includes the larger of the unit’s reported utility expenses and the standard utility allowance. These utility allowances vary by state and are listed in Tables IV.5 and IV.6.
2. Determine Asset Eligibility
The food stamp unit can have no more than $2,000 in countable assets. If the food stamp
unit contains an elderly person, the limit increases to $3,000. If the food stamp unit contains
only persons on public assistance (SSI, TANF, or GA), the unit is automatically identified as
asset-eligible regardless of the amount of its countable assets. Presumably, these units that

34
contain only persons on public assistance would already be asset-eligible for the FSP, since those
programs have more restrictive asset guidelines than the FSP.
Countable assets include financial and vehicular assets. Most financial and nonfinancial
assets are considered countable. For example, countable financial assets include money in
savings accounts, money markets, certificates of deposit, interest-earning checking accounts,
stock and mutual funds, and money in IRAs and KEOGH accounts (less an early withdrawal
penalty fee). As described earlier, a few income sources can now be counted as assets. Charity
income is considered an asset if it is less than $100 per month. Lump sum retirement and
severance pay are now counted as assets. The assets of noncitizens are counted, too. In contrast,
selected pieces of property such as the principal home, adjacent land, and most household goods
are excluded. The assets of TANF and/or SSI persons are also excluded.
In most instances, assets are counted at their equity value (i.e., value minus debt). One
principal exception is the treatment of vehicular assets. Vehicles used for producing income
(such as a taxi or ice cream truck) or for transporting disabled individuals are not counted.
Vehicles required for work-related travel are valued at the FMV of the vehicle in excess of
$4,650. One additional car per household is valued at the FMV of the vehicle in excess of
$4,650. All other vehicles owned by members of the food stamp unit are valued at the larger of
(1) the FMV of the vehicle in excess of $4,650 or (2) the equity value. SIPP data do not identify
which vehicles are used for work-related travel. Therefore, we had to infer which vehicles were
required for work-related travel by determining how many commuters were present in the
household. We defined commuters as persons age 16 and over who have wages. For each
commuter found in the household, we select a vehicle (in order of highest equity to lowest
equity) and value it at the FMV of the vehicle in excess of $4,650.
35
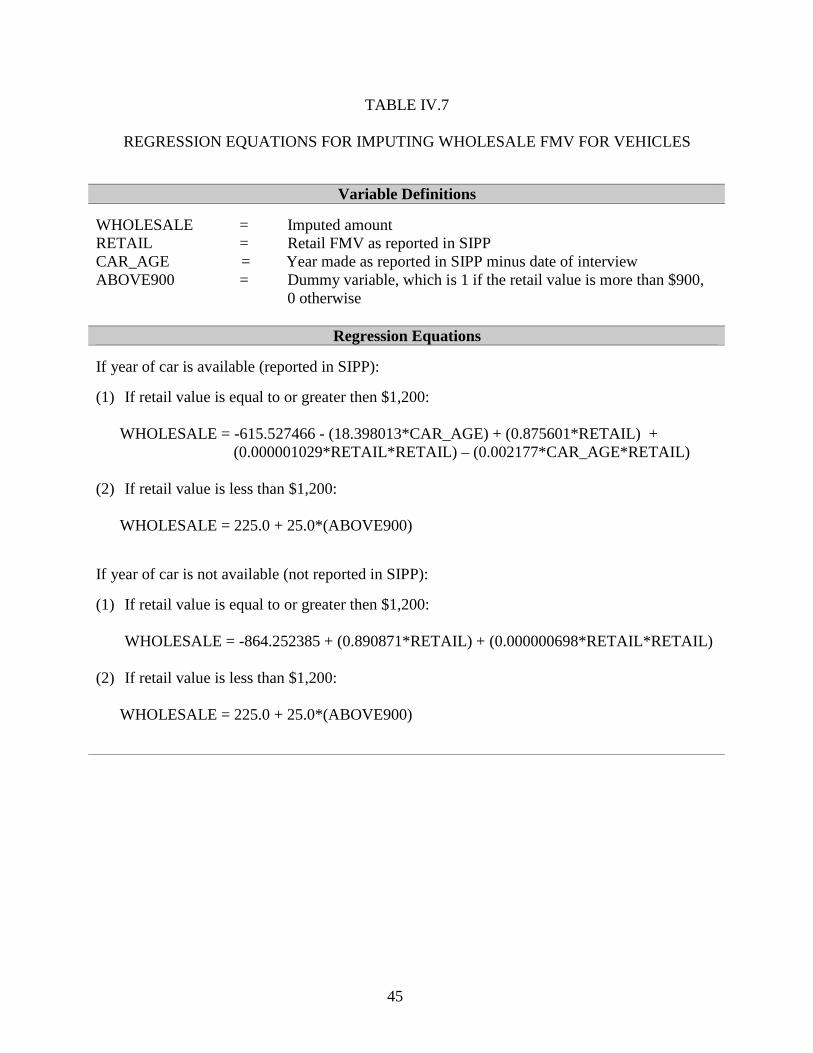
The FMV of a vehicle refers to the wholesale FMV. Wholesale refers to the average trade-
in value for a vehicle. SIPP data, however, include the retail FMV. Retail refers not to the
trade-in value but to the price the owner could garner selling the vehicle him/herself on the open
market. To estimate the wholesale FMV, we used two sets of two regression equations (Table
IV.7). The first set includes the age of the vehicle, when it is present on the file, while the
second set does not. Both sets have two equations, one is used when the retail value is greater
than or equal to $1,200, and the other is used when the retail value is under $1,200. We assumed
the wholesale equity value is simply the wholesale FMV less the amount owed on the vehicle.
3. Determine Food Stamp Benefit
If the unit is income and asset eligible, it must also be eligible for a food stamp benefit to be
considered officially eligible for the FSP. The food stamp benefit equals the maximum food
stamp benefit less 30 percent of the unit’s net income. The maximum benefit is 100 percent of
the Thrifty Food Plan (TFP), which represents the United States Department of Agriculture’s
lowest-cost food plan. Since eligibility is based on federal poverty guidelines and not the TFP,
some units may be eligible for zero benefits. However, units containing one or two persons are
guaranteed a minimum $10 benefit. Larger units are not guaranteed a minimum benefit, so these
units may qualify for zero benefits. When this happens, we consider these units to be technically
ineligible for food stamps, since they cannot possibly participate in the FSP.
C. SELECT PROGRAM PARTICIPANTS
The final step in the food stamp simulation is the selection of FSP participants from the pool
of simulated eligibles. We used an algorithm that selects participants in such a way that the
overall simulated FSP caseload as well as the characteristics of the simulated FSP population
would compare well with FSP administrative data.

36
The selection algorithm contains the following processing steps:
1. Select a set of key characteristics for which simulated participants are supposed to resemble FSP administrative data. As shown in Table IV.8, we selected FSP caseload size, TANF participation, SSI participation, the presence of children in the unit, earnings in the unit, elderly in the unit, unit size, gross income relative to the poverty level, and the FSP benefit size.
2. Tabulate the FSPQC data to get the control totals by the key characteristics for November 1999.
3. Extract eligible food stamp units from the MATH SIPP database.
4. Use a “raking” procedure to classify the eligible food stamp units by the key characteristics and to determine what proportion of each group needs to be selected in order to reach the FSPQC targets.
5. Use a probit maximum likelihood function to estimate the probability of FSP participation for each eligible food stamp unit. This probability function is a function of the key characteristics and whether the unit reported receiving food stamps in the SIPP.
6. Give eligible food stamp unit a propensity score indicating its likelihood of FSP participation. Units reporting FSP always have a higher score than non-reporters within each group of eligible units.
7. Within each group, sort by the propensity score. Starting with the unit with the highest propensity score, select participants until the FSPQC targets have been reached. In the event that more units report FSP participation than are required to meet the target, do not select them to participate. Given the way in which the propensity scores were created, reporting units will be selected to participate before any non-reporting units are selected within a given group.
8. Generate a logit equation of participation based on the simulated participants. This equation will be used to predict participation for newly eligible units during reform simulations.
D. FSP SIMULATION RESULTS
Table IV.9 compares the simulation results to the FSPQC data. The simulated caseload in
the 1999 MATH SIPP model is about 12 percent lower than the caseload in the FSPQC data.
However, we were more interested in simulating units with the characteristics of the FSP than
with matching the absolute numbers. Overall, the characteristics of the MATH SIPP simulated
population closely match those of the FSPQC data characteristics. The difference between the
simulated characteristic and the FSPQC target is less than five percent for most characteristics.
37
Only four characteristics deviate from their target by five to ten percent; and only one
characteristic (average medical deduction) deviates by more than ten percent. The simulated
average medical deduction is $91 compared with $124 in the FSPQC data.
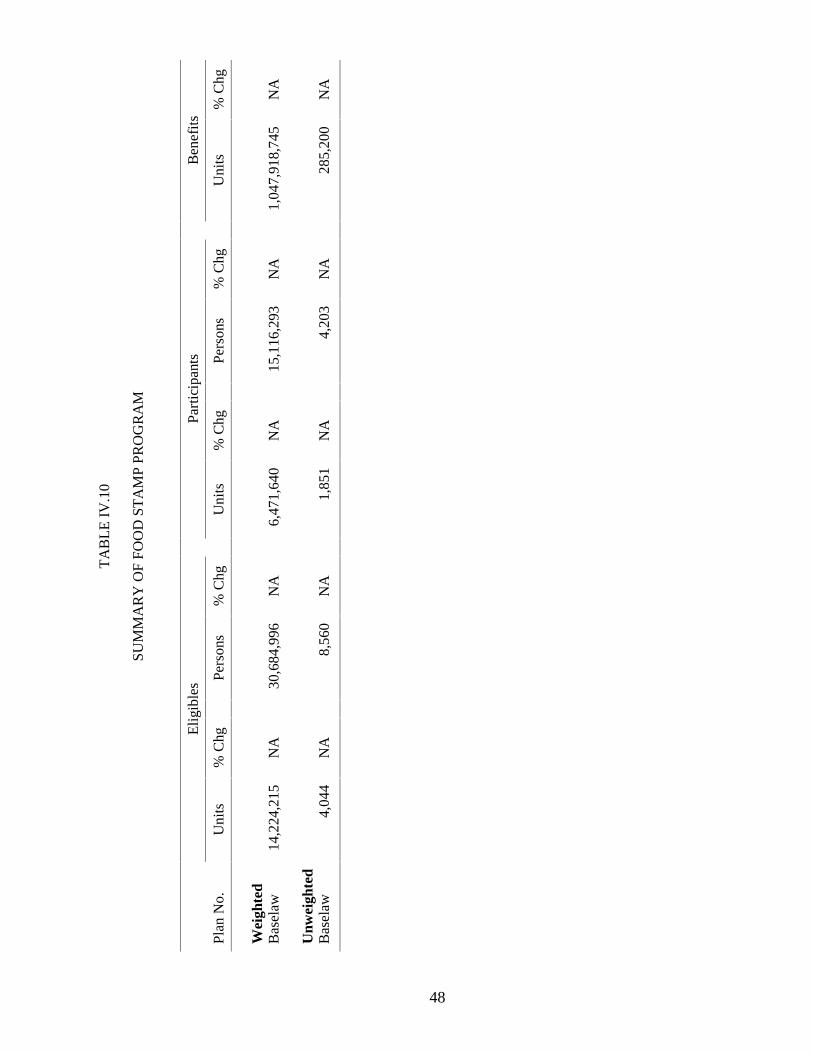
Table IV.10 displays the overall simulation results. The total number of simulated
participants is 6.5 million units and 15.1 million persons. The total of the benefits simulated to
be paid to these participants is approximately $1 billion.
Table IV.11 displays the distribution of eligible and participating food stamp units by gross
income relative to poverty and unit size.
Tables IV.12 and IV.13 display the characteristics of eligible and participating food stamp
units, respectively.
Tables IV.14 and IV.15 display the welfare status of eligible and participating food stamp
units, respectively.
Tables IV.16 and IV.17 display the deductions of eligible and participating food stamp units,
respectively.
38
TABLE IV.1
FSP SPLITTING RULES AND RATES
Split-off Rates
Household Type FSP Splitting Rule 2000 FSPQC
Among FSP Non-
Reporting Households in 1999 MATH
SIPP
Among FSP Participating
Households in 1999 MATH
SIPP TYPE 1: Household contains elderly persons
Split elderly persons, along with their spouse, into separate units.
54%
5%
62%
TYPE 2: Household contains unrelated individual
Split unrelated subfamilies into separate units. Split unrelated individuals into separate unit.
2a: Receives TANF 80% 30% 57% 2b: Does not receive TANF 67% 5% 58%
TYPE 3: Household contains children
Split the parents/ caretakers and their children from the other relatives. Split related subfamilies into separate units.
3a: Receives TANF 22% 5% 19% 3b: Does not receive TANF 16% 5% 12%
TYPE 4: Household contains only related adults, no elderly, and no children.
Split each person into a separate unit, but keep spouses together
40% 5% 43%
SOURCE: FY 1999 FSPQC Database, parameters for the 1999 MATH SIPP model, and tabulations of the
1999 MATH SIPP database
39
TABLE IV.2
PERCENT OF ABLE-BODIED ADULTS EXEMPT FROM TIME LIMITS
Percent Eligible by Reason For Eligibility State
Living in Waiver Area
Have Not Exceeded Time Limitsa In E & T Program
Received Exemption
Total Percent Eligible for the
FSPa Alabama 27.0 61.7 / 71.9 5.9 2.5 74.4 / 81.2 Alaska 56.5 61.7 / 71.9 0.0 1.2 83.6 / 87.9 Arizona 23.6 61.7 / 71.9 0.2 7.3 73.0 / 80.2 Arkansas 44.5 61.7 / 71.9 0.0 3.6 79.5 / 85.0 California 4.7 61.7 / 71.9 64.5 0.9 87.2 / 90.6 Colorado 2.7 61.7 / 71.9 52.7 3.1 82.9 / 87.5 Connecticut 63.5 61.7 / 71.9 0.2 2.5 86.4 / 90.0 Delaware 0.0 61.7 / 71.9 0.3 0.0 61.9 / 72.0 District of 100.0 61.7 / 71.9 0.0 0.0 100.0 Florida 46.4 61.7 / 71.9 1.0 5.4 80.8 / 85.9 Georgia 23.6 61.7 / 71.9 3.7 0.8 72.1 / 79.5 Hawaii 41.2 61.7 / 71.9 0.2 1.2 77.8 / 83.7 Idaho 0.0 61.7 / 71.9 0.0 5.7 63.9 / 73.5 Illinois 44.9 61.7 / 71.9 0.0 8.6 80.8 / 85.9 Indiana 9.1 61.7 / 71.9 5.2 3.6 68.2 / 76.7 Iowa 0.0 61.7 / 71.9 3.2 12.1 67.4 / 76.1 Kansas 0.0 61.7 / 71.9 0.0 24.7 71.2 / 78.9 Kentucky 47.2 61.7 / 71.9 1.5 4.9 81.1 / 86.1 Louisiana 56.4 61.7 / 71.9 0.3 6.9 84.5 / 88.6 Maine 35.5 61.7 / 71.9 0.6 16.0 79.4 / 84.9 Maryland 49.7 61.7 / 71.9 0.6 5.6 81.9 / 86.8 Massachusetts 0.0 61.7 / 71.9 5.7 16.6 69.9 / 77.9 Michigan 0.0 61.7 / 71.9 1.6 0.0 62.4 / 72.4 Minnesota 9.4 61.7 / 71.9 5.3 8.7 70.0 / 78.0 Mississippi 0.0 61.7 / 71.9 18.1 25.6 76.7 / 82.9 Missouri 31.7 61.7 / 71.9 0.4 0.8 74.2 / 81.1 Montana 13.6 61.7 / 71.9 26.8 0.0 75.8 / 82.2 Nebraska 0.0 61.7 / 71.9 2.2 10.4 66.5 / 75.4 Nevada 7.2 61.7 / 71.9 0.0 0.1 64.5 / 74.0 New Hampshire 6.1 61.7 / 71.9 59.4 22.9 88.7 / 91.7 New Jersey 33.4 61.7 / 71.9 59.3 1.8 89.8 / 92.5 New Mexico 52.2 61.7 / 71.9 0.1 0.0 81.7 / 86.6 New York 8.5 61.7 / 71.9 49.0 0.9 82.3 / 87.0 North Carolina 0.0 61.7 / 71.9 1.7 32.2 74.5 / 81.3 North Dakota 9.6 61.7 / 71.9 0.5 0.0 65.6 / 74.7 Ohio 0.0 61.7 / 71.9 24.2 0.0 71.0 / 78.7 Oklahoma 0.0 61.7 / 71.9 0.0 0.0 61.7 / 71.9 Oregon 0.0 61.7 / 71.9 2.9 17.3 69.3 / 77.5 Pennsylvania 67.9 61.7 / 71.9 0.6 1.3 88.0 / 91.2 Rhode Island 59.6 61.7 / 71.9 0.0 0.0 84.5 / 88.7 South Carolina 34.3 61.7 / 71.9 14.8 7.6 80.2 / 85.5 South Dakota 14.2 61.7 / 71.9 3.1 0.0 68.2 / 76.6 Tennessee 29.1 61.7 / 71.9 9.7 0.0 75.5 / 82.0 Texas 23.7 61.7 / 71.9 3.9 0.0 71.9 / 79.4 Utah 1.7 61.7 / 71.9 9.7 0.8 66.3 / 75.3 Vermont 0.0 61.7 / 71.9 5.4 7.8 66.6 / 75.5 Virginia 12.5 61.7 / 71.9 0.9 0.0 66.8 / 75.7 Washington 38.3 61.7 / 71.9 8.9 9.3 80.5 / 85.7 West Virginia 60.4 61.7 / 71.9 1.9 0.2 85.2 / 89.1 Wisconsin 0.0 61.7 / 71.9 8.6 0.0 65.0 / 74.3 Wyoming 0.0 61.7 / 71.9 0.0 0.0 61.7 / 71.9
a The lower number is for individuals in households reporting food stamp receipt in the SIPP. The higher number is for individuals in households not reporting food stamp receipt in the SIPP.

40
TABLE IV.3
LIST OF REFUGEE COUNTRIES
SOURCE: U.S. Immigration and Naturalization Service, Statistical Yearbook of the
Immigration and Naturalization Service, 1999, U.S. Government Printing Office: Washington, DC 2002.
Country
Cuba
Ethiopia
Haiti
Iran
Iraq
Laos
USSR
Vietnam
Yugoslavia
TA
BL
E I
V.4
FSP
EL
IGIB
ILIT
Y P
AR
AM
ET
ER
S FO
R N
OV
EM
BE
R 1
999
BE
NM
AX
M
axim
um F
ood
Stam
p B
enef
its
G
RSS
CR
N
Gro
ss I
ncom
e Sc
reen
NE
TSC
RN
N
et I
ncom
e Sc
reen
BE
NM
IN
Min
imum
B
onus
H
ouse
hold
Siz
e
48 +
D.C
. A
lask
a H
awai
i
48 +
D.C
. A
lask
a H
awai
i
48 +
D.C
. A
lask
a H
awai
i
1
$127
$1
58
$199
$893
$1
,118
$1
,029
$687
$8
60
$791
10
2
234
290
365
1,
199
1,50
0 1,
380
92
2 1,
154
1,06
1 10
3
335
415
523
1,
504
1,88
1 1,
731
1,
157
1,44
7 1,
331
0
4
426
528
664
1,
810
2,26
2 2,
082
1,
392
1,74
0 1,
601
0
5
506
627
789
2,
115
2,64
4 2,
433
1,
627
2,03
4 1,
871
0
6
607
752
947
2,
421
3,02
5 2,
784
1,
862
2,32
7 2,
141
0
7
671
831
1,04
7
2,72
6 3,
406
3,13
5
2,09
7 2,
620
2,41
1 0
8
767
950
1,19
6
3,03
2 3,
788
3,48
6
2,33
2 2,
914
2,68
1 0
Eac
h A
ddt’
l Pe
rson
96
119
150
30
6 38
2 35
1
235
294
270
0
41
42
TA
BL
E I
V.4
(co
ntin
ued)
48
+ D
.C.
Ala
ska
Haw
aii
ASS
ET
LIM
--
Ass
et L
imit
s
N
o E
lder
ly in
Uni
t $2
,000
$2
,000
$2
,000
E
lder
ly in
Uni
t $3
,000
$3
,000
$3
,000
BR
R -
- B
enef
it R
educ
tion
Rat
e 30
%
30%
30
%
CA
RS
-- V
ehic
le T
hres
hold
$4
,650
$4
,650
$4
,650
DE
PMA
X--
Dep
ende
nt C
are
Ded
uctio
n C
ap
Per
Chi
ld U
nder
Age
2
$200
$2
00
$200
Per
Chi
ld O
ver
Age
1
$175
$1
75
$175
EA
RN
MA
X -
- E
arni
ngs
Ded
uctio
n C
ap
$99,
999
$99,
999
$99,
999
EX
_PR
A -
- Pe
rcen
t of
Non
citiz
ens
Mee
ting
Wor
k H
isto
ry a
nd V
eter
an R
equi
rem
ents
17
.8%
17
.8%
17
.8%
MD
AG
E –
Min
imum
Age
for
Ded
uctib
le M
edic
al E
xpen
ses
60
60
60
MD
TH
RE
SH -
- M
edic
al T
hres
hold
$3
5 $3
5 $3
5
SHE
LC
AP
-- E
xces
s Sh
elte
r D
educ
tion
Cap
$2
75
$478
$3
93
SHL
TR
PCT
--
Prop
orti
on o
f ne
t inc
ome
abov
e w
hich
she
lter
cost
s ar
e de
duct
ible
50
%
50%
50
%
STU
DA
GE
--
Max
imum
Age
of
Post
seco
ndar
y St
uden
t 17
17
17
SO
UR
CE:
Unp
ublis
hed
data
fro
m U
.S. D
epar
tmen
t of
Agr
icul
ture
, Foo
d an
d N
utri
tion
Serv
ice.
43
TABLE IV.5
STANDARD UTILITY ALLOWANCE IN NOVEMBER 1997 FOR STATES THAT DO NOT VARY THE ALLOWANCE BY HOUSEHOLD SIZE
State or MSA Name Standard Utility Allowance Alabama
$222
Alaska 228 Arizona 237 Arkansas 172 California 183 Colorado 198 Connecticut 262 Delaware 255 District of Columbia 209 Florida 208 Georgia 232 Idaho 171 Illinois 249 Indiana 283 Iowa 254 Kansas 211 Louisiana 221 Maine 368 Maryland 216 Massachusetts 354 Michigan 267 Minnesota 270 Mississippi 177 Missouri 221 Montana 225 Nebraska 235 Nevada 192 New Hampshire 367 New Jersey 226 New Mexico 164 New York
New York City 465 Other, NY* 408
North Dakota 316 Ohio 267 Oklahoma 176 Oregon 216 Pennsylvania 310 Rhode Island 297 South Carolina 176 South Dakota 329 Texas 171 Utah 170 Vermont 365 Virginia 207 Washington 211 West Virginia 246 Wisconsin 228 Wyoming 270
SOURCE: Unpublished data from U.S. Department of Agriculture, Food and Nutrition Service.

44
TABLE IV.6
STANDARD UTILITY ALLOWANCE IN NOVEMBER 1997 FOR STATES THAT VARY THE ALLOWANCE BY HOUSEHOLD SIZE
Household Size
State Name 1 2 3 4 5 6 7 8 9 10+
Hawaii 153 170 187 204 221 237 251 251 251 251
Kentucky 208 208 236 236 253 253 253 253 253 253
North Carolina
152 175 203 203 240 240 240 240 240 240
Tennessee 210 219 226 226 233 240 247 254 262 270
SOURCE: Unpublished data from U.S. Department of Agriculture, Food and Nutrition Service.
45
TABLE IV.7
REGRESSION EQUATIONS FOR IMPUTING WHOLESALE FMV FOR VEHICLES
�
Variable Definitions
WHOLESALE = Imputed amount RETAIL = Retail FMV as reported in SIPP CAR_AGE = Year made as reported in SIPP minus date of interview ABOVE900 = Dummy variable, which is 1 if the retail value is more than $900, 0 otherwise
Regression Equations
If year of car is available (reported in SIPP):
(1) If retail value is equal to or greater then $1,200: WHOLESALE = -615.527466 - (18.398013*CAR_AGE) + (0.875601*RETAIL) +
(0.000001029*RETAIL*RETAIL) – (0.002177*CAR_AGE*RETAIL) (2) If retail value is less than $1,200: WHOLESALE = 225.0 + 25.0*(ABOVE900)
If year of car is not available (not reported in SIPP):
(1) If retail value is equal to or greater then $1,200: WHOLESALE = -864.252385 + (0.890871*RETAIL) + (0.000000698*RETAIL*RETAIL) (2) If retail value is less than $1,200: WHOLESALE = 225.0 + 25.0*(ABOVE900)

46
TABLE IV.8
1999 FSPQC TARGETS FOR THE NOVEMBER 1999 MATH SIPP
Characteristic FSPQC Targeta
Total FSP Caseload 7,402,220
FSP units with TANF 1,943,171
FSP units with SSI 2,345,208
FSP units with Children 3,991,490
FSP units with Earnings Deduction > 0% and < 10% of the poverty level 821,763
FSP units with Earnings Deduction > 10% and < 20% of the poverty level 962,785
FSP units with Earnings Deduction > 20% of the poverty level 232,754
FSP units with Elderly 1,570,146
FSP unit size = 2 1,481,594
FSP unit size > 3 2,780,135
FSP gross income > 50% and < 100% of the poverty level 4,161,207
FSP gross income > 100% of the poverty level 807,957
FSP Benefit�> 50% and less than 100% of the maximum benefit 2,892,826
FSP Benefit�> 100% of the maximum benefit 1,446,132
FSP units with noncitizens 469,919
FSP units with medical deduction > 0 305,796
SOURCE: 1999 FSPQC Database aThe FSPQC target numbers are based on a three-month average (October, November, December 1999), excluding Guam and the Virgin Islands.

47
TABLE IV.9
COMPARISON OF FSPQC DATA AND MATH SIPP MODEL FOR NOVEMBER 1999
Characteristic of Participating FSP Unit FY 2000
FSPQC Dataa
Simulated Participants in
1999 SIPP Model Difference Total Participants (in 1000s)
Total Units 7,335 6,472 -12% Total Persons 17,091 15,116 -12% Total Benefits
1,159,008 1,047,919 -10%
Unit Size Distribution 1 43% 45% 2 points 2 20% 19% -1 point 3-5 33% 32% -1 point 6+
4% 4% 0 points
Gross Income Relative to Poverty 0 - 50% 33% 33% 0 points >50 - 100% 56% 57% 1 point > 100-130% 10% 8% -2 points >131%
1% 3% 2 points
Income Sources With Earnings 27% 27% 0 points With TANF 26% 22% -4 points With SSI 32% 32% 0 points With GA 5% 3% -2 points With Public Assistance
57% 51% -6 points
Average Benefit/Income Amounts Avg Gross Income $620 $619 0% Avg Net Income $355 $356 0% Avg Benefit (per Unit)
$158 $162 3%
Deductions Earnings Deduction $150 $150 0% Percent with Deduction
27% 27% 0 points
Dependent Care Deduction $125 $136 9% Percent with Deduction
4% 4% 0 points
Medical Deduction $124 $91 -27% Percent with Deduction
4% 4% 0 points
Shelter Deduction $186 $190 2% Percent with Deduction
59% 64% 5 points
SOURCE: 2000 FSPQC Data and 1999 MATH SIPP Model.
aThe 2000 FSPQC results are based on a three-month average (October, November, December) and do not include Guam and the Virgin Islands.
TA
BL
E I
V.1
0
SUM
MA
RY
OF
FOO
D S
TA
MP
PRO
GR
AM
E
ligi
bles
Part
icip
ants
Ben
efit
s
Plan
No.
U
nits
%
Chg
Pers
ons
% C
hg
U
nits
%
Chg
Pers
ons
% C
hg
U
nits
%
Chg
Wei
ghte
d
Bas
elaw
14
,224
,215
N
A
30
,684
,996
N
A
6,
471,
640
NA
15,1
16,2
93
NA
1,04
7,91
8,74
5 N
A
U
nwei
ghte
d
B
asel
aw
4,04
4 N
A
8,
560
N
A
1,
851
NA
4,20
3
NA
285,
200
NA
48
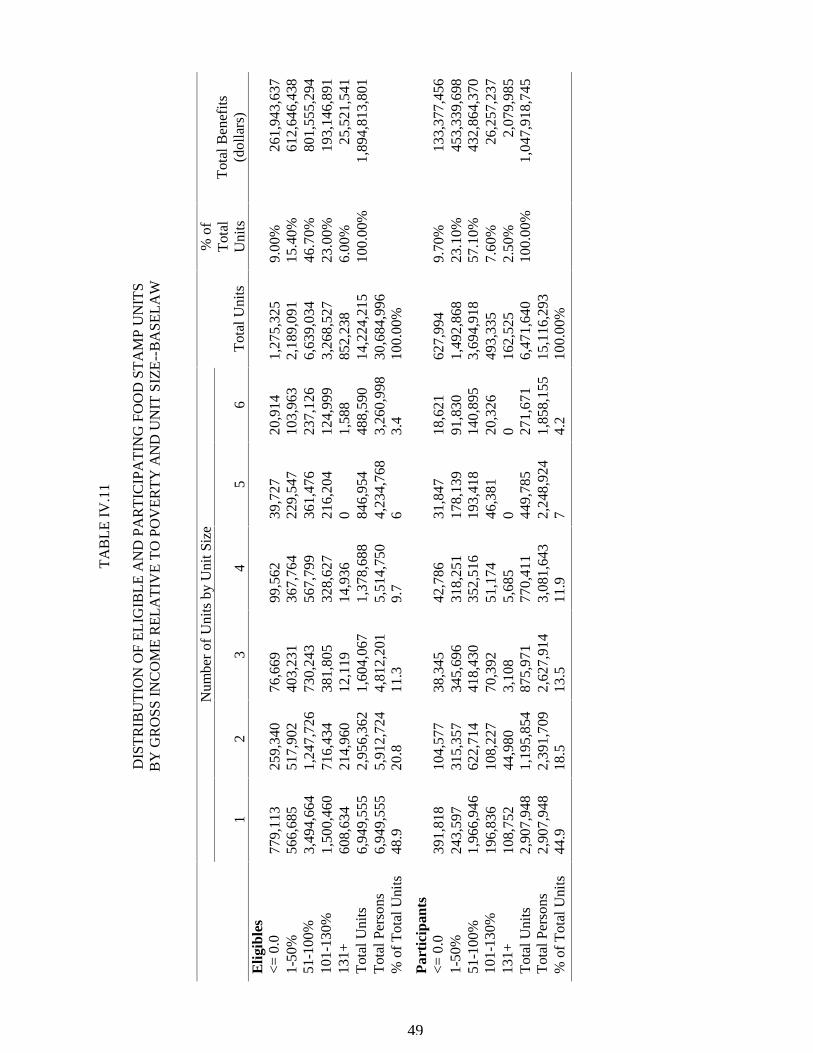
TA
BL
E I
V.1
1
DIS
TR
IBU
TIO
N O
F E
LIG
IBL
E A
ND
PA
RT
ICIP
AT
ING
FO
OD
ST
AM
P U
NIT
S B
Y G
RO
SS I
NC
OM
E R
EL
AT
IVE
TO
PO
VE
RT
Y A
ND
UN
IT S
IZE
--B
ASE
LA
W
N
umbe
r of
Uni
ts b
y U
nit S
ize
1 2
3 4
5 6
Tot
al U
nits
% o
f T
otal
U
nits
T
otal
Ben
efits
(d
olla
rs)
Elig
ible
s
<=
0.0
77
9,11
3 25
9,34
0 76
,669
99
,562
39
,727
20
,914
1,
275,
325
9.00
%
261,
943,
637
1-50
%
566,
685
517,
902
403,
231
367,
764
229,
547
103,
963
2,18
9,09
1 15
.40%
61
2,64
6,43
8 51
-100
%
3,49
4,66
4 1,
247,
726
730,
243
567,
799
361,
476
237,
126
6,63
9,03
4 46
.70%
80
1,55
5,29
4 10
1-13
0%
1,50
0,46
0 71
6,43
4 38
1,80
5 32
8,62
7 21
6,20
4 12
4,99
9 3,
268,
527
23.0
0%
193,
146,
891
131+
60
8,63
4 21
4,96
0 12
,119
14
,936
0
1,58
8 85
2,23
8 6.
00%
25
,521
,541
T
otal
Uni
ts
6,94
9,55
5 2,
956,
362
1,60
4,06
7 1,
378,
688
846,
954
488,
590
14,2
24,2
15
100.
00%
1,
894,
813,
801
Tot
al P
erso
ns
6,94
9,55
5 5,
912,
724
4,81
2,20
1 5,
514,
750
4,23
4,76
8 3,
260,
998
30,6
84,9
96
% o
f T
otal
Uni
ts
48.9
20
.8
11.3
9.
7 6
3.4
100.
00%
Par
tici
pant
s
<=
0.0
39
1,81
8 10
4,57
7 38
,345
42
,786
31
,847
18
,621
62
7,99
4 9.
70%
13
3,37
7,45
6 1-
50%
24
3,59
7 31
5,35
7 34
5,69
6 31
8,25
1 17
8,13
9 91
,830
1,
492,
868
23.1
0%
453,
339,
698
51-1
00%
1,
966,
946
622,
714
418,
430
352,
516
193,
418
140,
895
3,69
4,91
8 57
.10%
43
2,86
4,37
0 10
1-13
0%
196,
836
108,
227
70,3
92
51,1
74
46,3
81
20,3
26
493,
335
7.60
%
26,2
57,2
37
131+
10
8,75
2 44
,980
3,
108
5,68
5 0
0 16
2,52
5 2.
50%
2,
079,
985
Tot
al U
nits
2,
907,
948
1,19
5,85
4 87
5,97
1 77
0,41
1 44
9,78
5 27
1,67
1 6,
471,
640
100.
00%
1,
047,
918,
745
Tot
al P
erso
ns
2,90
7,94
8 2,
391,
709
2,62
7,91
4 3,
081,
643
2,24
8,92
4 1,
858,
155
15,1
16,2
93
% o
f T
otal
Uni
ts
44.9
18
.5
13.5
11
.9
7 4.
2 10
0.00
%
49
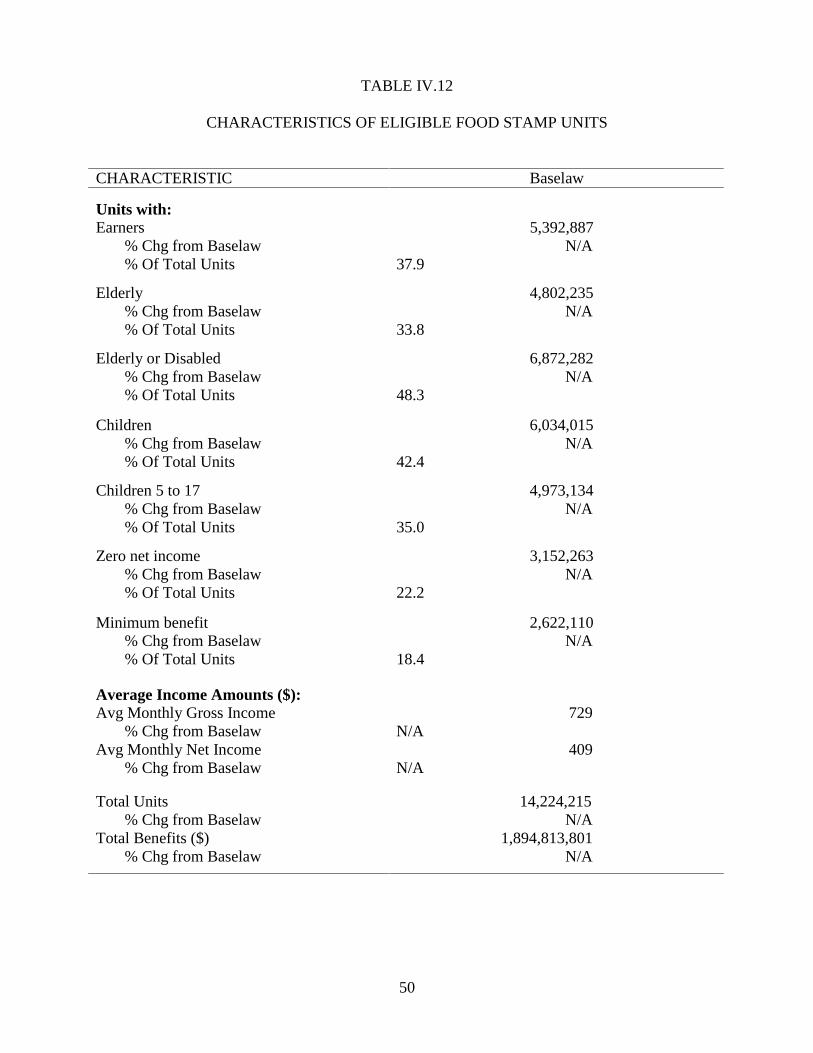
50
TABLE IV.12
CHARACTERISTICS OF ELIGIBLE FOOD STAMP UNITS CHARACTERISTIC Baselaw
Units with:
Earners 5,392,887 % Chg from Baselaw N/A % Of Total Units 37.9
Elderly 4,802,235 % Chg from Baselaw N/A % Of Total Units 33.8
Elderly or Disabled 6,872,282 % Chg from Baselaw N/A % Of Total Units 48.3
Children 6,034,015 % Chg from Baselaw N/A % Of Total Units 42.4
Children 5 to 17 4,973,134 % Chg from Baselaw N/A % Of Total Units 35.0
Zero net income 3,152,263 % Chg from Baselaw N/A % Of Total Units 22.2
Minimum benefit 2,622,110 % Chg from Baselaw N/A % Of Total Units 18.4
Average Income Amounts ($): Avg Monthly Gross Income 729 % Chg from Baselaw N/A Avg Monthly Net Income 409 % Chg from Baselaw N/A
Total Units 14,224,215 % Chg from Baselaw N/A Total Benefits ($) 1,894,813,801 % Chg from Baselaw N/A
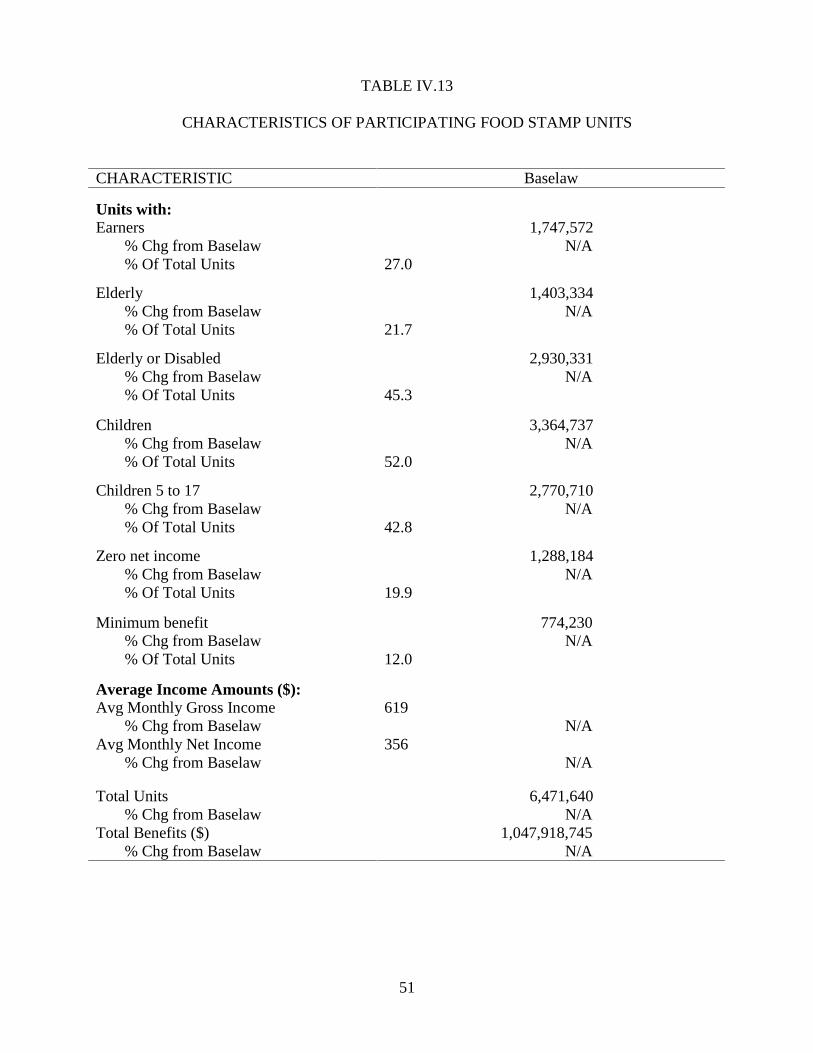
51
TABLE IV.13
CHARACTERISTICS OF PARTICIPATING FOOD STAMP UNITS CHARACTERISTIC Baselaw
Units with:
Earners 1,747,572 % Chg from Baselaw N/A % Of Total Units 27.0
Elderly 1,403,334 % Chg from Baselaw N/A % Of Total Units 21.7
Elderly or Disabled 2,930,331 % Chg from Baselaw N/A % Of Total Units 45.3
Children 3,364,737 % Chg from Baselaw N/A % Of Total Units 52.0
Children 5 to 17 2,770,710 % Chg from Baselaw N/A % Of Total Units 42.8
Zero net income 1,288,184 % Chg from Baselaw N/A % Of Total Units 19.9
Minimum benefit 774,230 % Chg from Baselaw N/A % Of Total Units 12.0
Average Income Amounts ($): Avg Monthly Gross Income 619 % Chg from Baselaw N/A Avg Monthly Net Income 356 % Chg from Baselaw N/A
Total Units 6,471,640 % Chg from Baselaw N/A Total Benefits ($) 1,047,918,745 % Chg from Baselaw N/A
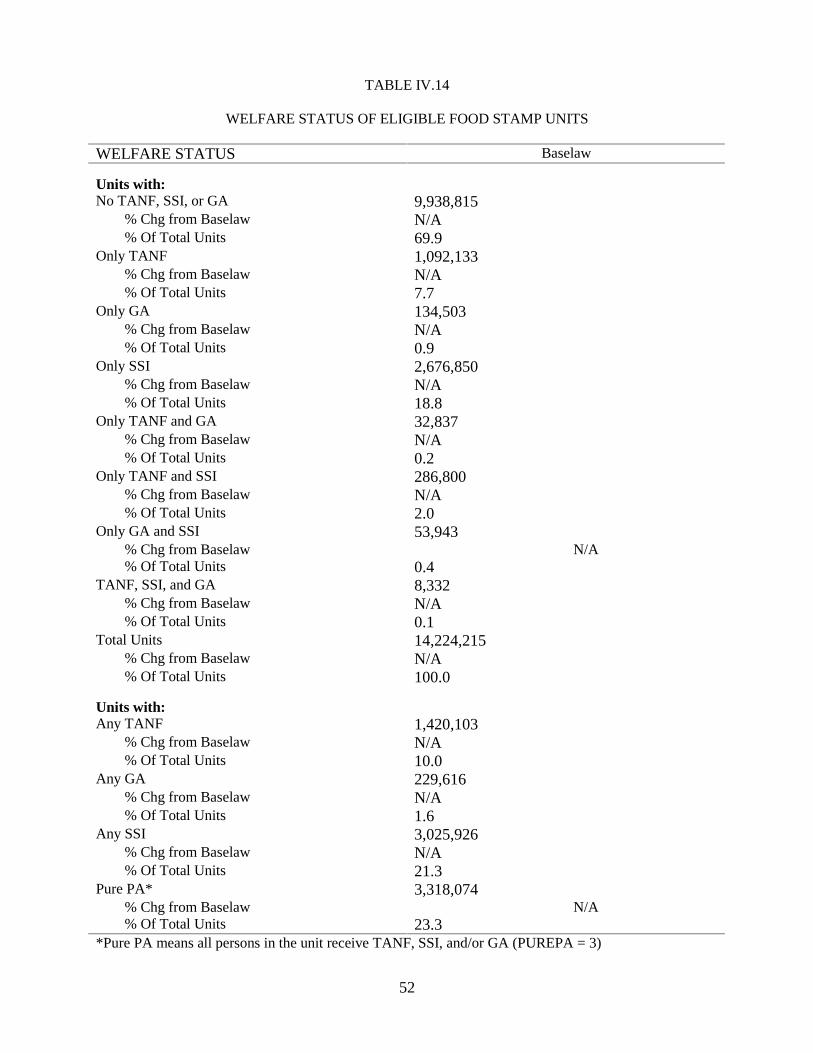
52
TABLE IV.14
WELFARE STATUS OF ELIGIBLE FOOD STAMP UNITS WELFARE STATUS Baselaw
Units with:
No TANF, SSI, or GA 9,938,815 % Chg from Baselaw N/A % Of Total Units 69.9 Only TANF 1,092,133 % Chg from Baselaw N/A % Of Total Units 7.7 Only GA 134,503 % Chg from Baselaw N/A % Of Total Units 0.9 Only SSI 2,676,850 % Chg from Baselaw N/A % Of Total Units 18.8 Only TANF and GA 32,837 % Chg from Baselaw N/A % Of Total Units 0.2 Only TANF and SSI 286,800 % Chg from Baselaw N/A % Of Total Units 2.0 Only GA and SSI 53,943 % Chg from Baselaw N/A % Of Total Units 0.4 TANF, SSI, and GA 8,332 % Chg from Baselaw N/A % Of Total Units 0.1 Total Units 14,224,215 % Chg from Baselaw N/A % Of Total Units 100.0
Units with:
Any TANF 1,420,103 % Chg from Baselaw N/A % Of Total Units 10.0 Any GA 229,616 % Chg from Baselaw N/A % Of Total Units 1.6 Any SSI 3,025,926 % Chg from Baselaw N/A % Of Total Units 21.3 Pure PA* 3,318,074 % Chg from Baselaw N/A % Of Total Units 23.3 *Pure PA means all persons in the unit receive TANF, SSI, and/or GA (PUREPA = 3)
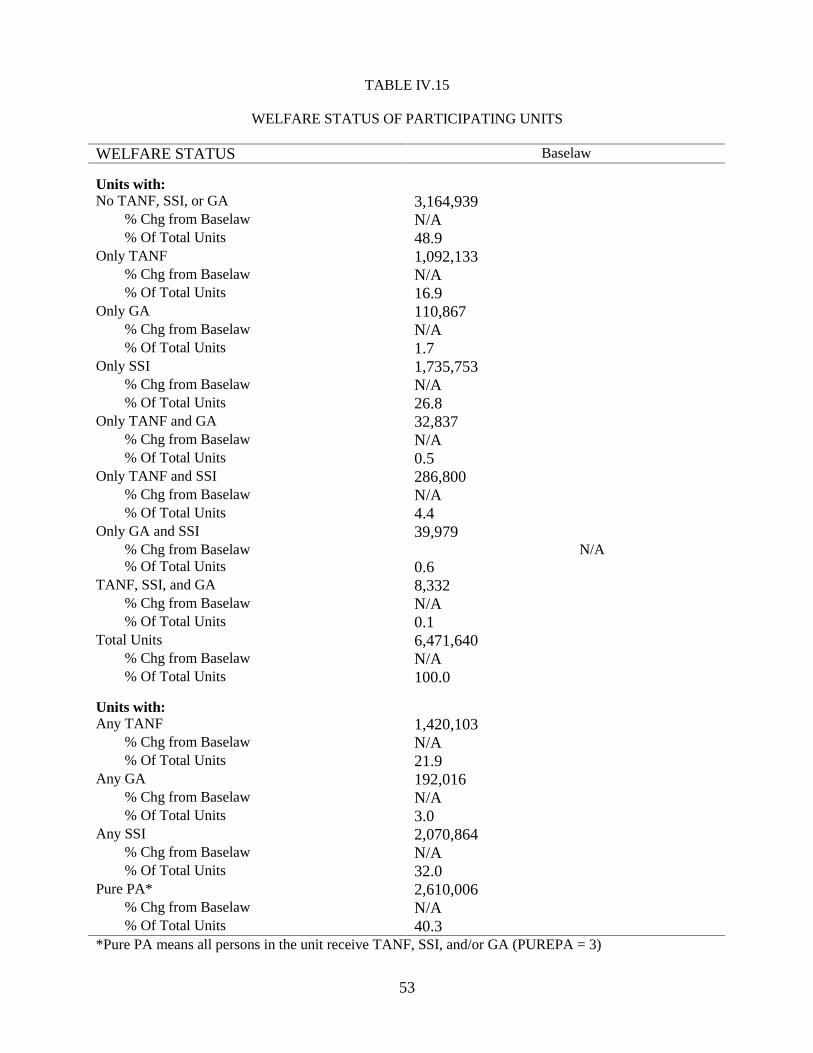
53
TABLE IV.15
WELFARE STATUS OF PARTICIPATING UNITS WELFARE STATUS Baselaw
Units with:
No TANF, SSI, or GA 3,164,939 % Chg from Baselaw N/A % Of Total Units 48.9 Only TANF 1,092,133 % Chg from Baselaw N/A % Of Total Units 16.9 Only GA 110,867 % Chg from Baselaw N/A % Of Total Units 1.7 Only SSI 1,735,753 % Chg from Baselaw N/A % Of Total Units 26.8 Only TANF and GA 32,837 % Chg from Baselaw N/A % Of Total Units 0.5 Only TANF and SSI 286,800 % Chg from Baselaw N/A % Of Total Units 4.4 Only GA and SSI 39,979 % Chg from Baselaw N/A % Of Total Units 0.6 TANF, SSI, and GA 8,332 % Chg from Baselaw N/A % Of Total Units 0.1 Total Units 6,471,640 % Chg from Baselaw N/A % Of Total Units 100.0
Units with:
Any TANF 1,420,103 % Chg from Baselaw N/A % Of Total Units 21.9 Any GA 192,016 % Chg from Baselaw N/A % Of Total Units 3.0 Any SSI 2,070,864 % Chg from Baselaw N/A % Of Total Units 32.0 Pure PA* 2,610,006 % Chg from Baselaw N/A % Of Total Units 40.3 *Pure PA means all persons in the unit receive TANF, SSI, and/or GA (PUREPA = 3)
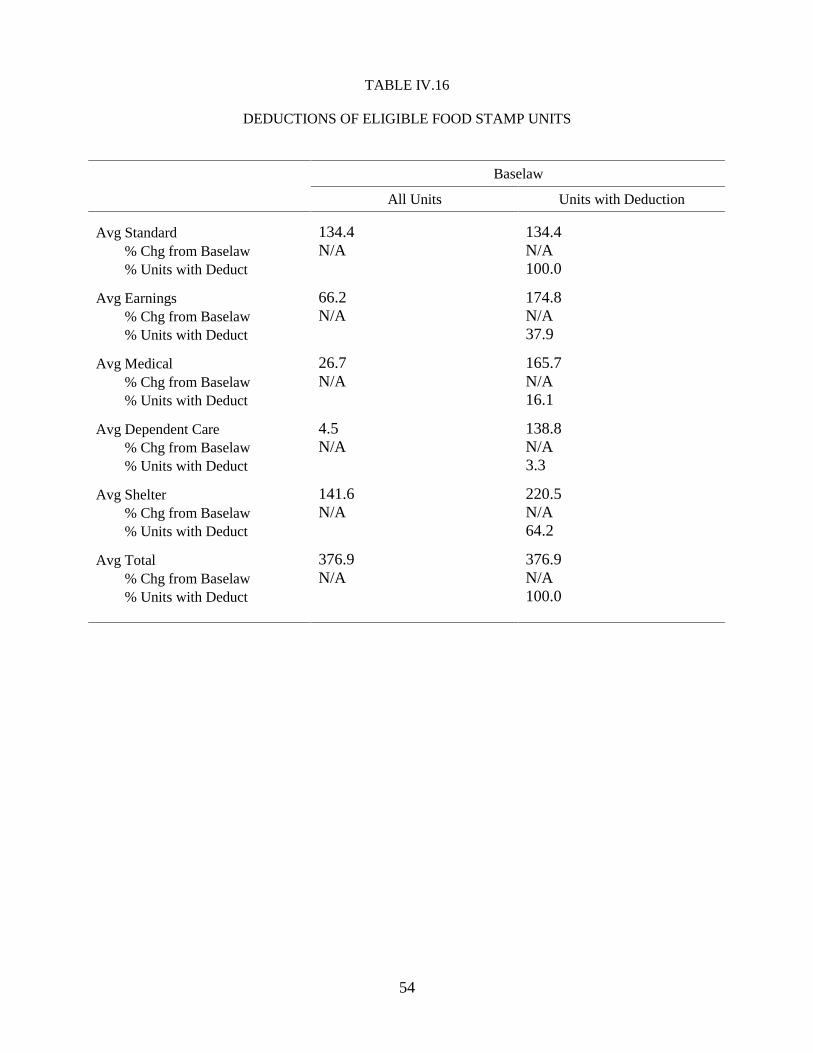
54
TABLE IV.16
DEDUCTIONS OF ELIGIBLE FOOD STAMP UNITS
Baselaw
All Units Units with Deduction
Avg Standard 134.4 134.4 % Chg from Baselaw N/A N/A % Units with Deduct 100.0
Avg Earnings 66.2 174.8 % Chg from Baselaw N/A N/A % Units with Deduct 37.9
Avg Medical 26.7 165.7 % Chg from Baselaw N/A N/A % Units with Deduct 16.1
Avg Dependent Care 4.5 138.8 % Chg from Baselaw N/A N/A % Units with Deduct 3.3
Avg Shelter 141.6 220.5 % Chg from Baselaw N/A N/A % Units with Deduct 64.2
Avg Total 376.9 376.9 % Chg from Baselaw N/A N/A % Units with Deduct 100.0

55
TABLE IV.17
DEDUCTIONS OF PARTICIPATING FOOD STAMP UNITS
Baselaw
All Units Units with Deduction
Avg Standard 134.5 134.5 % Chg from Baselaw N/A N/A % Units with Deduct 100.0
Avg Earnings 40.4 150.0 % Chg from Baselaw N/A N/A % Units with Deduct 26.9
Avg Medical 3.2 91.2 % Chg from Baselaw N/A N/A % Units with Deduct 3.5
Avg Dependent Care 4.8 135.9 % Chg from Baselaw N/A N/A % Units with Deduct 3.5
Avg Shelter 122.2 190.3 % Chg from Baselaw N/A N/A % Units with Deduct 64.2
Avg Total 306.7 306.7 % Chg from Baselaw N/A N/A % Units with Deduct 100.0

PAGE IS INTENTIONALLY LEFT BLANK TO ALLOW FOR DOUBLE-SIDED COPYING
57
REFERENCES
National Archives and Records Administration. Code of Federal Regulations. Washington, DC: www.access.gpo.gov/nara/crf.
Bloom, Michael, Laura Castner, and Bruce Schechter. "1999 MATH SIPP Programmer’s Guide, Technical Description and Codebook." Washington, DC: Mathematica Policy Research, Inc., October 2003.
Schechter, Bruce. "1996 MATH SIPP User’s Guide." Washington, DC: Mathematica Policy Research, Inc., August 2001.
Sykes, Julie, and Laura Castner. “Technical Working Paper Creation of the November 1997. MATH SIPP Microsimulation Model and Database.” Washington DC: Mathematica Policy Research Inc., February 2002.
U.S. Census Bureau. Survey of Income and Program Participation 1996 Panel, Wave 2. Topical Module Microdata File Technical Documentation. Washington, DC : U.S. Census Bureau, December, 2000.
U.S. Census Bureau. Survey of Income and Program Participation 1996 Panel, Wave 2. Topical Module Microdata File Technical Documentation. Washington, DC : U.S. Census Bureau, April, 2001.
U.S. Census Bureau. Survey of Income and Program Participation 1996 Panel, Wave 12 Topical Module Microdata File Technical Documentation. Washington, DC: U.S. Census Bureau, January, 2003.
U.S. Census Bureau. Survey of Income and Program Participation User’s Guide. Washington, DC: U.S. Census Bureau, 2001.