Embed Size (px)
Citation preview

CPV y protocolos de monitorización de procesos. Adaptación al nuevo Anexo 15 de las GMPsDe la estadística al control de procesos.
Como integrar los requisitos del anexo 15 dentro de una herramienta informática robusta
Leon Rebolledo20-Oct-2015
2
IT should be responsible to deliver an integration framework and an application that should :
“Embrace the complexity of an OPV program delivering the simplicity required to run a day to day business application”
Quote on Process validation :
"It is so counter-productive when the 'process' becomes the job vs. the 'process' of doing the job.”, Unknown.
Quote on statistics:
“Statistics are like bikinis. What they reveal is suggestive, but what the conceal is vital”, Aaron Levenstein.

3
Objectives:
❖ Understand if your IT information network is ready to support OPV.
❖ Understand the required IT infrastructure to run a OPV program.
❖ Understand the system and data integration requirements to successfully implement an OPV application.
4
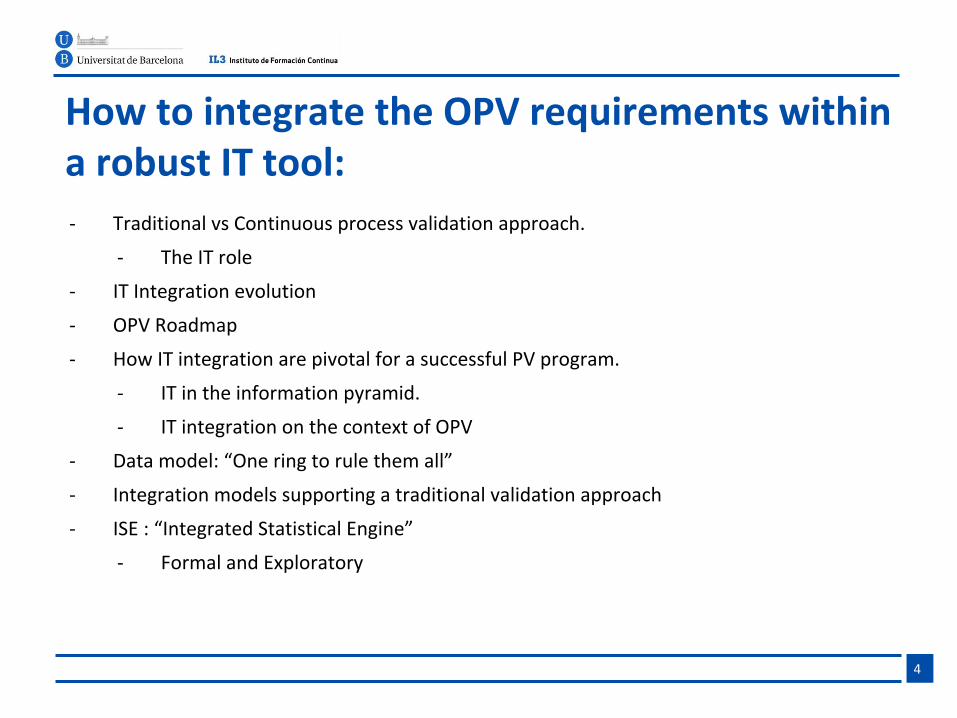
How to integrate the OPV requirements within a robust IT tool:- Traditional vs Continuous process validation approach.
- The IT role
- IT Integration evolution
- OPV Roadmap
- How IT integration are pivotal for a successful PV program.
- IT in the information pyramid.
- IT integration on the context of OPV
- Data model: “One ring to rule them all”
- Integration models supporting a traditional validation approach
- ISE : “Integrated Statistical Engine”
- Formal and Exploratory

5
How to integrate the OPV requirements within a robust IT tool:- Ongoing Process verification
- “Readiness check” from IT perspective.
- Dashboard-base monitoring vs Report-base monitoring.
- Integration between OPV and APR/PQR
- IT Systems:
- “Home-grown” vs “Product”
- 5 Forces that will prevent a successful implementation of an IT solution
- IT System scope
- Practical case – App demo -
- Implementation of IT applications to support PV.
- Internal manufacturing process performance collaboration.
- OPV Objects.
- CPV and Big Data
- Beyond step3

6
Traditional vs Continuous process validation approach.
.
Pro
du
ct li
fe c
ycle
New productdesign space based on
science
Ongoing process verification
Ongoing process verification
Fragmented electronic, data based, process foot print.
Full electronic, data based, process foot print
Control strategy based on current process and product understanding.
Trad
itio
nal
pro
cess
val
idat
ion C
on
tin
uo
us
pro
cess
va
lidat
ion

7
Traditional vs Continuous process validation approach, the IT role
.
Ongoing process verification
Ongoing process verificationCo
nti
nu
ou
s p
roce
ss v
alid
atio
n
Fragmented electronic, data based, process foot print.
Full electronic, data based, process foot print
Trad
itio
nal
pro
cess
val
idat
ion
Pro
du
ct li
fe c
ycle
New productdesign space based on
science
Control strategy based on current process and product understanding.
To provide a validated system to
capture and integrate the details
of the design space into the OPV Application.
To provide a validated tool to
capture and integrate the details
of the control strategy into the OPV Application.
To enable and validate
an IT infrastructure,
systems and controls
to support the ongoing
process verification application.
An application and platform to maintain the
lasting process control evidence of a produce life cycle.

8
Evolution of IT integration in the Life Science industry
9
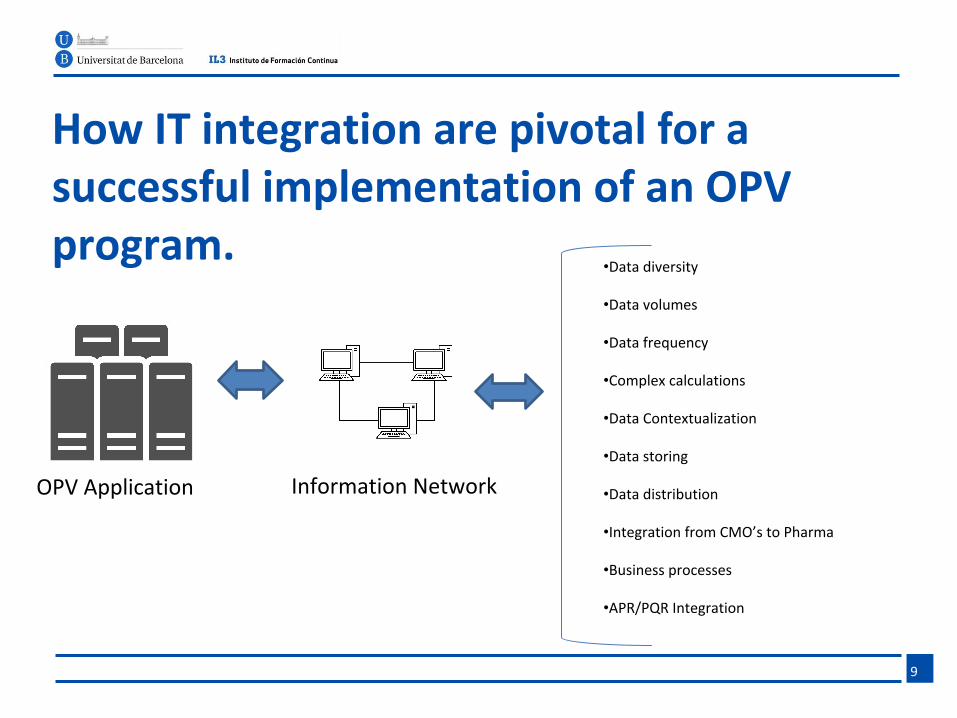
How IT integration are pivotal for a successful implementation of an OPV program.
•Data diversity
•Data volumes
•Data frequency
•Complex calculations
•Data Contextualization
•Data storing
•Data distribution
•Integration from CMO’s to Pharma
•Business processes
•APR/PQR Integration
Information Network OPV Application

10
Roadmap OPV

11
OPV Roadmap in summary...
11
Step One CQA-based control
strategy
o Standardization of CPV processeso Deployment of enterprise
applicationo Alignment of statistical analysis
across the enterprise.o Integration with APR/PQR.o Based on risk assessments.
Step Two3-deep down control strategy
o Integration of CPP datao Batch tree’s for CMA’so Integration of CIPC’so Integration with Equipment and
facilities.o Integration with Analytical
method validation
Step ThreeState of control achieved /
Design space exist
o Continued verification of the state of control.
o Single source of truth.o Integrated Manufacturing DWo Data-based and ISE-based
(Integrated statistical Engine) root cause analysis
o Basis to rollout the continuous process verification
Traditional Validation Continuous PV (CPV)
• Real-time Batch release
• Real-time OOS/OOE’s
• State of control monitored On-line.
• Process integrated APR/PQR
• And beyond.
Ongoing Process verification application

12
How IT Integration stands in the information pyramid.
•Product Life Cycle•Supply Chain•Production Planning•EBR•Shop Floor integration•Manufacturing Process
Inte
grat
ion
Process understanding
IT
PLC’s
Scada’s
Shop-Floor systems
ERP
PLMSystems / QA events
Point to point
LAN
WLAN

13
IT integration in the context of OPV
• OPV• App
•Risk assessment•ERP•Production process, Batch Tree and QC•Manufacturing Execution systems•PLCs and SCADA’s
CPP
’s /
CIP
C’s
Process understanding
CQ
A’s
/ C
MA
’s
Master DataInspection plansInspection ControlInspection resultsBatch tree
Process Data points
Manufacturing Data contextualization
Risk assessment
Monitoring
Risk assessment
Monitoring
IT integration maturity

Data model : “One ring to rule them all”
Step IIISample TextSample Text
CPV
Step ISample TextSample Text
Step IISample TextSample Text
Data ModelSample TextSample Text
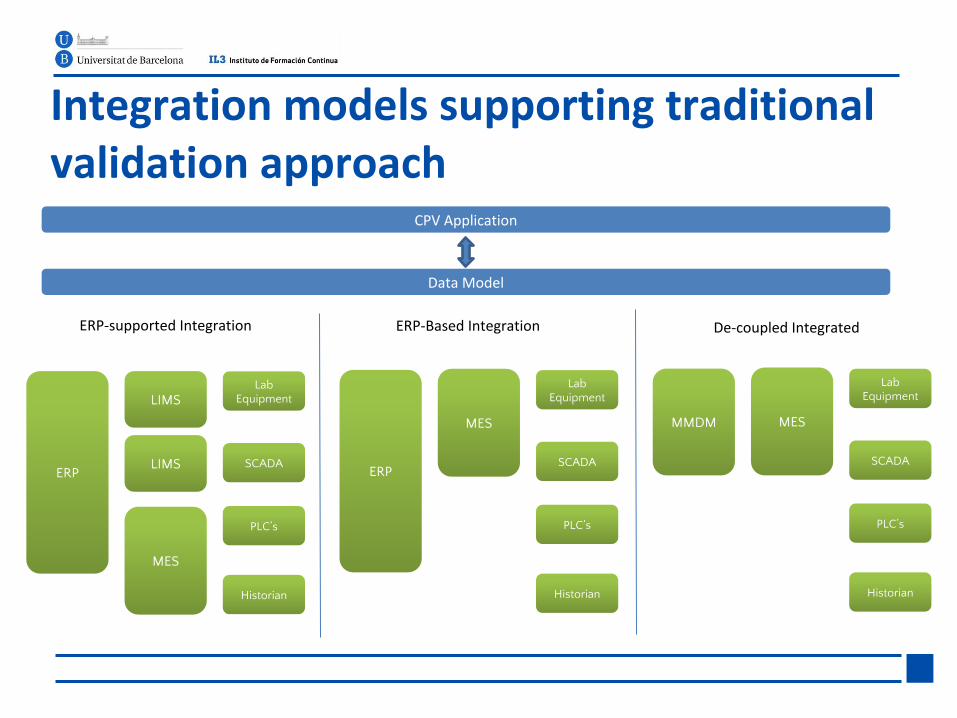
Integration models supporting traditional validation approach
15
ERP
LIMSLab
Equipment
SCADA
MES
Historian
PLC’s
ERP
Lab Equipment
SCADA
MES
Historian
PLC’s
ERP-Based Integration
MMDM
Lab Equipment
SCADA
MES
Historian
PLC’s
De-coupled Integrated
LIMS
Data Model
CPV Application
ERP-supported Integration

ISE : Integrated Statistical Engine
•Data collection
•Statistical Engine
•Presentation
What is an integrated statistical engine:
• It is a recognized statistical application or library set that delivers the required standardized calculations and plotting mechanisms to support OPV.
• It is integrated within the confines of the application itself, validated and intrinsically linked to the data acquisition.
• It delivers calculations and plotting mechanisms without jeopardizing or risking the data integrity.
• It is a tool that can provide extended statistical features, whilst connecting to the data sources, outside of a validated environment.

ISE : Integrated Statistical Engine : Formal / Exploratory, options and validation
Manufacturing Data Warehouse
MVDA tool
R- WidgetsOther ISE’s* &
Dashboarding
gxp
non gxp
Data sources
Formal OPV
Exploratory
OPV
OPV App

GMP Annex 15: Readiness check listIT tools
Ongoing(Continued)
Non-US marketStep I
Ongoing(Continued)US market
Step II
Continuous
Step III
An electronic integrated PAT system
A system to capture consistently inspection results in a unified manner
ISE for the cross organization agreed evaluations
Master data centrally managed in a validated single application (raw materials, Vendors, products)
An standardized reporting tool for ongoing verification.
A system to capture electronically quality events. (changes, deviations, etc.)
An EBR system or connectivity to PLCs / SCADA’s to collect PP’s
A historian / measurements archival system
Equipment management is electronically captured and integrated to the ERP and MES
An electronic record SOP’s system
An electronic project and change control system to maintain CSV details
Required Suggested
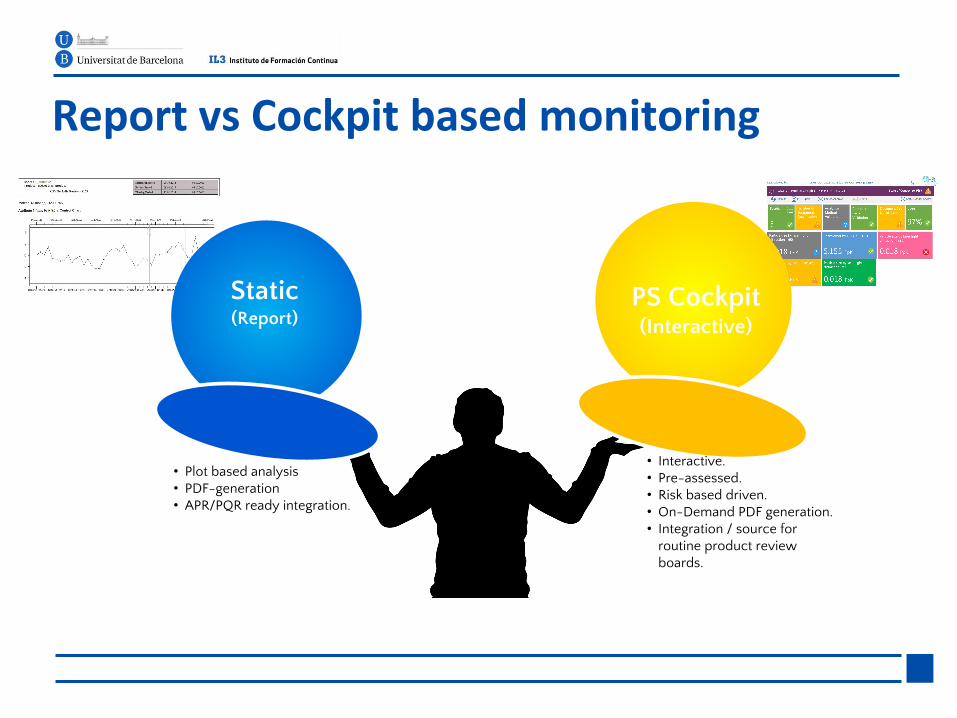
Report vs Cockpit based monitoring
PS Cockpit(Interactive)
Static (Report)
• Plot based analysis• PDF-generation• APR/PQR ready integration.
• Interactive.• Pre-assessed.• Risk based driven.• On-Demand PDF generation.• Integration / source for
routine product review boards.

OPV and APR/PQR Integration
Requirements
• The Annual Product Review (APR) - Product Quality Review (PQR) reports are the first documents reviewed by health authorities while inspecting a manufacturing facility.
• The importance of this report is such that even a small error in reported data may have severe impact on product quality and patient safety.
• Considering its criticality and importance, organizations must try to eliminate errors through process standardization and automation.
Objective • The objective of an APR-PQR report is to document key aspects of drug manufacturing process and derive
improvement areas to assure continued suitability and capability of processes
Current reporting process
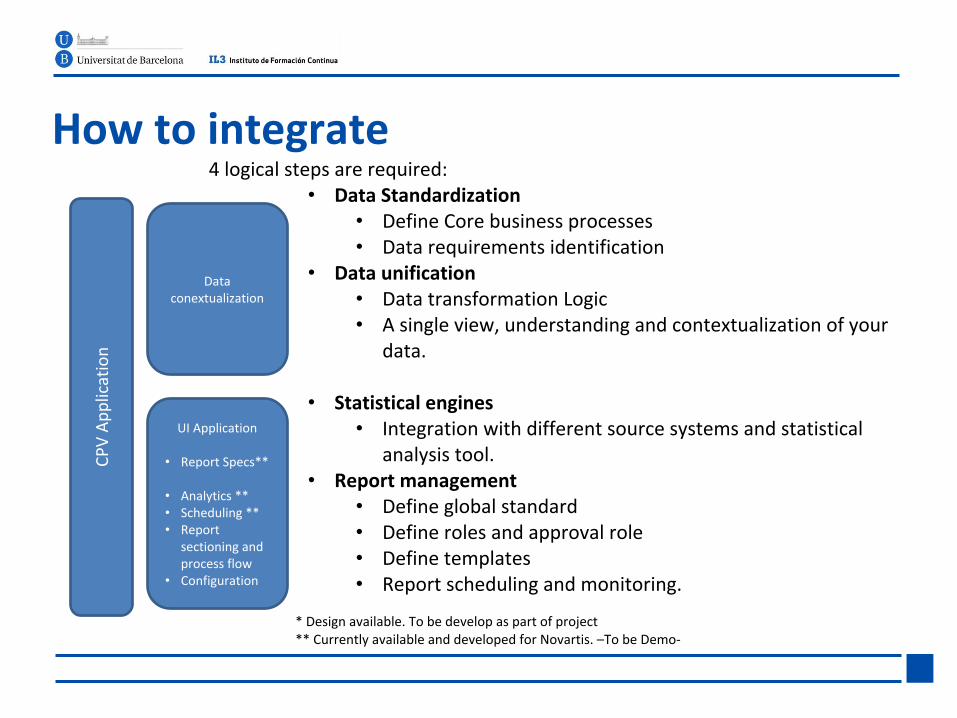
How to integrate4 logical steps are required:
• Data Standardization• Define Core business processes• Data requirements identification
• Data unification• Data transformation Logic• A single view, understanding and contextualization of your
data.
• Statistical engines• Integration with different source systems and statistical
analysis tool.• Report management
• Define global standard• Define roles and approval role• Define templates • Report scheduling and monitoring.
Data conextualization
UI Application
• Report Specs**
• Analytics **• Scheduling **• Report
sectioning and process flow
• Configuration
CPV
Ap
plic
atio
n
* Design available. To be develop as part of project** Currently available and developed for Novartis. –To be Demo-
22
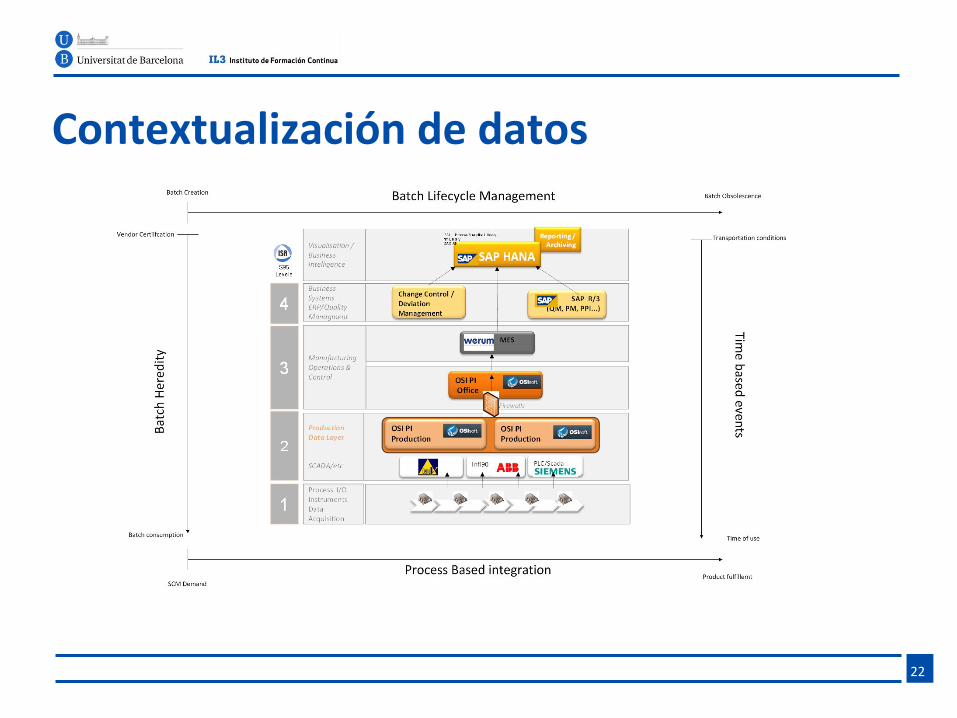
Contextualización de datos
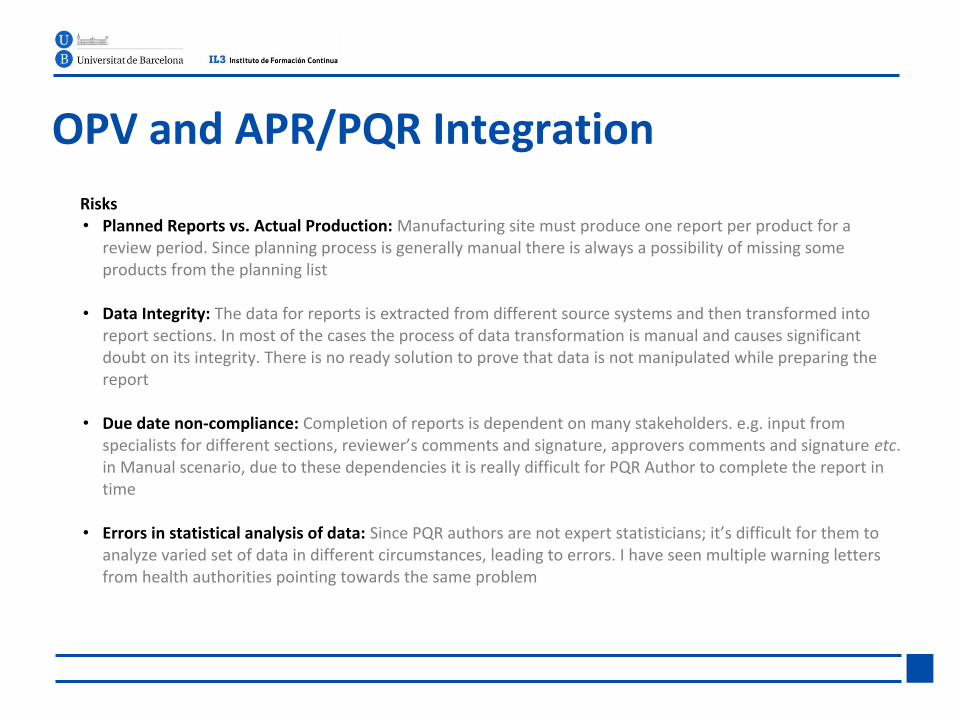
Risks• Planned Reports vs. Actual Production: Manufacturing site must produce one report per product for a
review period. Since planning process is generally manual there is always a possibility of missing some products from the planning list
• Data Integrity: The data for reports is extracted from different source systems and then transformed into report sections. In most of the cases the process of data transformation is manual and causes significant doubt on its integrity. There is no ready solution to prove that data is not manipulated while preparing the report
• Due date non-compliance: Completion of reports is dependent on many stakeholders. e.g. input from specialists for different sections, reviewer’s comments and signature, approvers comments and signature etc. in Manual scenario, due to these dependencies it is really difficult for PQR Author to complete the report in time
• Errors in statistical analysis of data: Since PQR authors are not expert statisticians; it’s difficult for them to analyze varied set of data in different circumstances, leading to errors. I have seen multiple warning letters from health authorities pointing towards the same problem
OPV and APR/PQR Integration

24
IT Systems: “Home grown” vs “Off the shelf”
•Home Grown•Make-to own requirements.•Longer knowledge curve•Continuous maintenance, changes and enhancements.•Apparent initial low cost. Lowe ROI•Could run risk of localized solutions.•90-100 requirements met
•Off-the-shelf•Standard functionality•80-20 requirements met•Higher cost up front. Better ROI.•Higher cost on customizations, if required.•Maintenance cost•Upgrades delivered as part of license.

5 forces that prevent a successful implementation of a CPV Program
2525
The absence of an enterprise IT solution
for CPV
Data Dispersion and
lack of integrity
Lack of a consistentData model
Not cleared ownership
Business Process not
aligned.
Lack of governance
Why a CPV program can fail:
• Lack of an enterprise IT solution:• Local/customized solution support the
execution of individual local reports, but prevents growth and strategical thinking around CPV.
• Process improvements and savings are lost in the details
• Data dispersion and lack of integrity:• Information is not concentrated in fit for
purpose solutions.• Home-grown solutions.• Lack of IT tools.• Manual processes.
• Lack of standards:• Agreed enterprise wide statistical analysis.
• Ownership : • Organizational gaps and lack of clarity.
• Business process not aligned, lack of governance
CPV Program

26
Standardization
Data Source mapping,
correlation, transitory conversion
Data unification
Smart Data Contextualization.
Metadata
Cross functional correlation
Data Sources
RFC
Messaging
CSV upload
ODBC
OLAP, etc.
Data integration
to continuous
process monitoring
Data standardization for continued
monitoring (APR/PQR and
CPV)*
IT Systems scope

Demo
27
IT Systems: Demo
Home grown : Novartis MONITOR system, r5.0.
Off the shelf : PharmaXpert™ mCQA ready / Discoverant / Atris. Panda
28
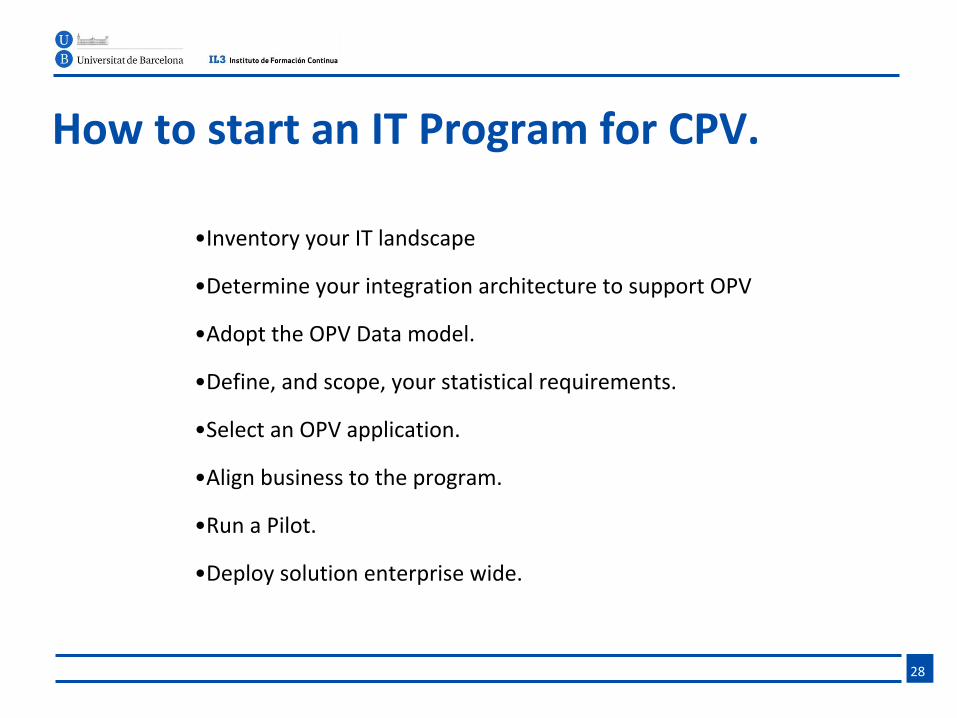
How to start an IT Program for CPV.
•Inventory your IT landscape
•Determine your integration architecture to support OPV
•Adopt the OPV Data model.
•Define, and scope, your statistical requirements.
•Select an OPV application.
•Align business to the program.
•Run a Pilot.
•Deploy solution enterprise wide.

29
• Preparation of the user stories.• Review previous reports, identify contributors• Identify business process work flows and dependencies• Review statistical analysis methods used• Map relevant IT landscape, including network and resources• Identify data sources and options for data retrieval• Map data transformation and aggregation requirements• Create data validation plan• Identify pilot users• Create User Acceptance plan
• Install & configure needed IT resources• Implement data capture flows• Configure data mapping in PharmaXpert • Work with pilot users / product stewards to create report spec definition.• Run trial data analysis & plotting; review, evaluate, revise data aggregation, analysis & presentation• Configure workflow processes• Execute workflow with simulated reviewers/approvers• Review, evaluate, revise workflow and resulting final reports• Complete User Acceptance review
• Execute and monitor operations.
• Determine list of improvements for follow up releases
• Schedule regional and global release
• Kick off implementation project.
- Pilot with a single product & site- Go-live and rollout to additional products/sites not in scope
Implementation Step (est. 3 months)Preparatory Step (est. 2 months) Pilot Release and monitoring.
Scope of potential Pilot Project

30

31
Internal manufacturing process performance collaboration.
OPV Reports
OPV Cockpit
Product Performance Review Board
Participants :• QA• Production• Product Stewards
or Product Steward head
Statistical
calculation results
integrated to the
board
Electronic recording of evaluations.
Electronic record of the overall evaluation.
APR/PQR
Annual OPV commented Report,
signed by QA.
32
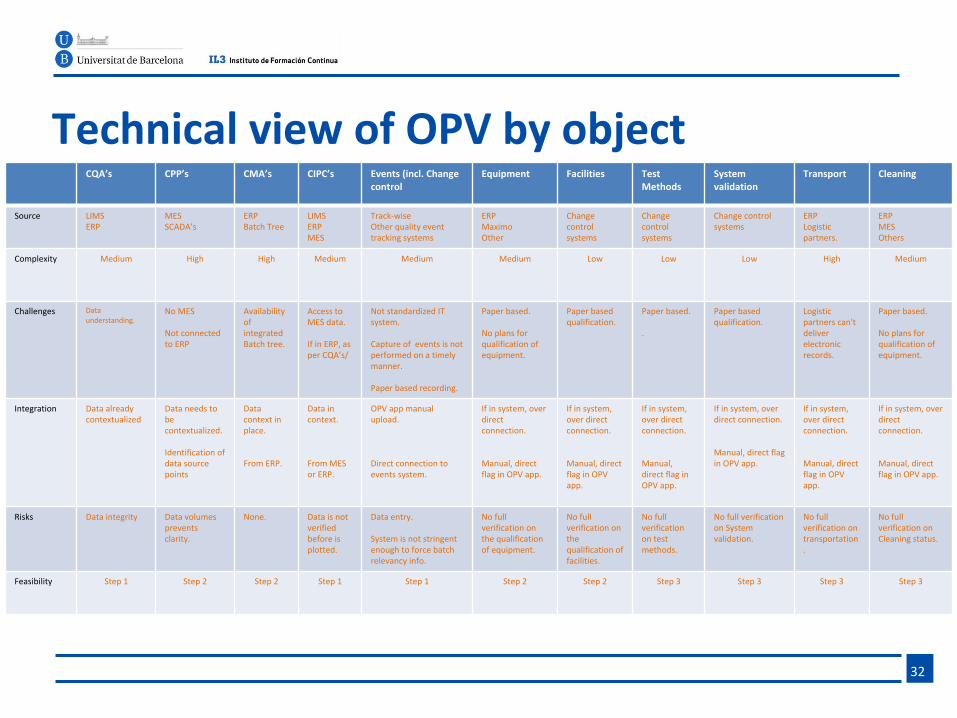
Technical view of OPV by objectCQA’s CPP’s CMA’s CIPC’s Events (incl. Change
controlEquipment Facilities Test
MethodsSystem validation
Transport Cleaning
Source LIMSERP
MESSCADA’s
ERPBatch Tree
LIMSERPMES
Track-wiseOther quality event tracking systems
ERPMaximo Other
Change control systems
Change control systems
Change control systems
ERPLogistic partners.
ERPMESOthers
Complexity Medium High High Medium Medium Medium Low Low Low High Medium
Challenges Data understanding.
No MES
Not connected to ERP
Availability of integrated Batch tree.
Access to MES data.
If in ERP, as per CQA’s/
Not standardized IT system.
Capture of events is not performed on a timely manner.
Paper based recording.
Paper based.
No plans for qualification of equipment.
Paper based qualification.
Paper based.
.
Paper based qualification.
Logistic partners can't deliver electronic records.
Paper based.
No plans for qualification of equipment.
Integration Data already contextualized
Data needs to be contextualized.
Identification of data source points
Data context in place.
From ERP.
Data in context.
From MES or ERP.
OPV app manual upload.
Direct connection to events system.
If in system, over direct connection.
Manual, direct flag in OPV app.
If in system, over direct connection.
Manual, direct flag in OPV app.
If in system, over direct connection.
Manual, direct flag in OPV app.
If in system, over direct connection.
Manual, direct flag in OPV app.
If in system, over direct connection.
Manual, direct flag in OPV app.
If in system, over direct connection.
Manual, direct flag in OPV app.
Risks Data integrity Data volumes prevents clarity.
None. Data is not verified before is plotted.
Data entry.
System is not stringent enough to force batch relevancy info.
No full verification on the qualification of equipment.
No full verification on the qualification of facilities.
No full verification on test methods.
No full verification on System validation.
No full verification on transportation.
No full verification on Cleaning status.
Feasibility Step 1 Step 2 Step 2 Step 1 Step 1 Step 2 Step 2 Step 3 Step 3 Step 3 Step 3
33
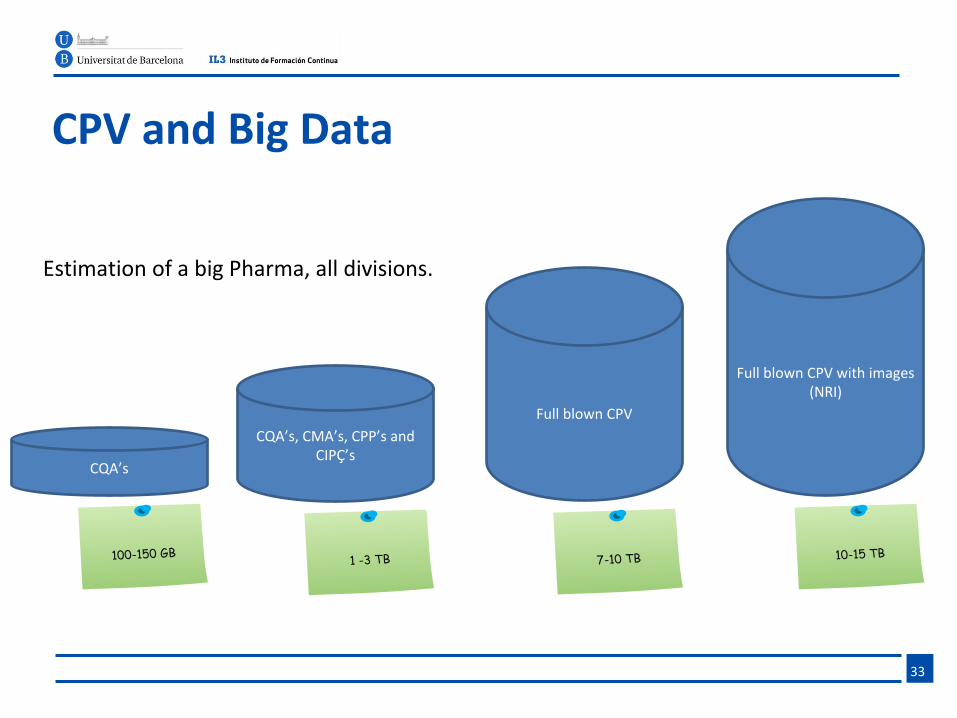
CPV and Big Data
CQA’s
100-150 GB
CQA’s, CMA’s, CPP’s and CIPÇ’s
1 -3 TB
Full blown CPV
7-10 TB
Full blown CPV with images (NRI)
10-15 TB
Estimation of a big Pharma, all divisions.

It is estimated that for a full CPV, including OPV app, in a large Pharma, this program will take the next 3-5 years.
34
Beyond CPV Step III.
It is estimated that for a full CPV program, including OPV app, in a large Pharma, will take the next 3-5 years.
Product lifecycle“Hearth beat”
2015
2020
2023
2025
Real-time release is a applicable.
Design-space based products are in continuous manufacturing.
Product life cycle monitoring is achieved.

www.il3.ub.edu