Embed Size (px)
Citation preview

COT:Reportable Non-Commercial
Net Positions(Futures Only)
Yardeni Research, Inc.
June 1, 2018
Dr. Edward Yardeni516-972-7683
Mali Quintana480-664-1333
Please visit our sites atwww.yardeni.comblog.yardeni.com
thinking outside the box

Table Of Contents Table Of ContentsTable Of Contents
June 1, 2018 / COT: Reportable Non-Commercial Net Positions (Futures Only) www.yardeni.com
Yardeni Research, Inc.
Commitments of Traders:Large Speculators 3-6
Currencies:US Dollar Index 7Australian Dollar 8Canadian Dollar 9Euro 10Yen 11
Energy:Crude Oil 12Gasoline 13Heating Oil 14Natural Gas 15
Grains:Corn 16Soybeans 17Soybean Meal 18Soybean Oil 19Wheat 20
Interest Rates:Eurodollar 21Fed Funds Rate 22Treasury Notes (10-Year) 23Treasury Notes (2-Year) 24
Metals:Copper 25Gold 26Silver 27
Stocks:Nikkei 28S&P 500 29

2000 2001 2002 2003 2004 2005 2006 2007 2008 2009 2010 2011 2012 2013 2014 2015 2016 2017 2018 2019 2020-80000
-60000
-40000
-20000
0
20000
40000
60000
80000
-80000
-60000
-40000
-20000
0
20000
40000
60000
80000
5/29
S&P 500(number of positions X $250)
Large Speculators
Source: Haver Analytics.
Figure 1.
2000 2001 2002 2003 2004 2005 2006 2007 2008 2009 2010 2011 2012 2013 2014 2015 2016 2017 2018 2019 2020-500000
0
500000
1000000
-500000
0
500000
1000000
5/29
10-YEAR US TREASURY NOTES(contracts of $100,000 face value)
Large Speculator
Source: Haver Analytics.
yardeni.com
Figure 2.
Large Speculators
Page 3 / June 1, 2018 / COT: Reportable Non-Commercial Net Positions (Futures Only) www.yardeni.com
Yardeni Research, Inc.

2000 2001 2002 2003 2004 2005 2006 2007 2008 2009 2010 2011 2012 2013 2014 2015 2016 2017 2018 2019 2020-50000
0
50000
100000
-50000
0
50000
100000
5/29
COPPER GRADE(contracts of 25,000 lbs)
Large Speculator
Source: Haver Analytics.
yardeni.com
Figure 3.
2000 2001 2002 2003 2004 2005 2006 2007 2008 2009 2010 2011 2012 2013 2014 2015 2016 2017 2018 2019 2020-100000
0
100000
200000
300000
400000
-100000
0
100000
200000
300000
400000
5/29
GOLD(contracts of 100 Troy oz)
Source: Haver Analytics.
Large Speculator
yardeni.com
Figure 4.
Large Speculators
Page 4 / June 1, 2018 / COT: Reportable Non-Commercial Net Positions (Futures Only) www.yardeni.com
Yardeni Research, Inc.

Figure 5.
00 01 02 03 04 05 06 07 08 09 10 11 12 13 14 15 16 17 18 19 20-40000
-20000
0
20000
40000
60000
80000
100000
5/29
US DOLLAR INDEX(US dollar index x $1,000)
00 01 02 03 04 05 06 07 08 09 10 11 12 13 14 15 16 17 18 19 20-150000
-100000
-50000
0
50000
100000
150000
5/29
POUND STERLING(contracts of 62,500 Pound Sterling)
00 01 02 03 04 05 06 07 08 09 10 11 12 13 14 15 16 17 18 19 20-250000
-200000
-150000
-100000
-50000
0
50000
100000
150000
200000
5/29
EURO FX(contracts of 125,000 Euros)
00 01 02 03 04 05 06 07 08 09 10 11 12 13 14 15 16 17 18 19 20-100000
-50000
0
50000
100000
150000
5/29
CANADIAN DOLLAR(contracts of 100,000 Canadian Dollars)
00 01 02 03 04 05 06 07 08 09 10 11 12 13 14 15 16 17 18 19 20-200000
-150000
-100000
-50000
0
50000
100000
5/29
JAPANESE YEN(contracts of 12,500,000 Japanese Yen)
Source: Haver Analytics.Source: Haver Analytics.
00 01 02 03 04 05 06 07 08 09 10 11 12 13 14 15 16 17 18 19 20-100000
-75000
-50000
-25000
0
25000
50000
75000
100000
125000
5/29
AUSTRALIAN DOLLAR(contracts of 100,000 Australian Dollars)
yardeni.com
Large Speculators
Page 5 / June 1, 2018 / COT: Reportable Non-Commercial Net Positions (Futures Only) www.yardeni.com
Yardeni Research, Inc.

Figure 6.
2000 2001 2002 2003 2004 2005 2006 2007 2008 2009 2010 2011 2012 2013 2014 2015 2016 2017 2018 2019 2020-100000-50000050000100000150000200000250000300000350000400000450000500000550000600000650000700000750000800000
-100000-50000
050000
100000150000200000250000300000350000400000450000500000550000600000650000700000750000800000
5/29
LIGHT SWEET CRUDE OIL (WTI)(contracts of 1,000 barrels)
2000 2001 2002 2003 2004 2005 2006 2007 2008 2009 2010 2011 2012 2013 2014 2015 2016 2017 2018 2019 2020-50000
0
50000
100000
150000
-50000
0
50000
100000
150000
5/29
GASOLINE(contracts of 42,000 US gallons)
2000 2001 2002 2003 2004 2005 2006 2007 2008 2009 2010 2011 2012 2013 2014 2015 2016 2017 2018 2019 2020-150000
-100000
-50000
0
50000
100000
150000
200000
250000
300000
350000
-150000
-100000
-50000
0
50000
100000
150000
200000
250000
300000
350000
5/29
SOYBEANS(contracts of 5,000 bushels)
Source: Haver Analytics.
yardeni.com
Large Speculators
Page 6 / June 1, 2018 / COT: Reportable Non-Commercial Net Positions (Futures Only) www.yardeni.com
Yardeni Research, Inc.

Figure 7.
2000 2001 2002 2003 2004 2005 2006 2007 2008 2009 2010 2011 2012 2013 2014 2015 2016 2017 2018 2019 2020-22000
-18000
-14000
-10000
-6000
-2000
2000
6000
10000
14000
-22000
-18000
-14000
-10000
-6000
-2000
2000
6000
10000
14000
5/29
US DOLLAR INDEX(US dollar index x $1,000)
Total Reportable Net Position(Long position minus short position)
2000 2001 2002 2003 2004 2005 2006 2007 2008 2009 2010 2011 2012 2013 2014 2015 2016 2017 2018 2019 2020-120000
-100000
-80000
-60000
-40000
-20000
0
20000
40000
60000
-120000
-100000
-80000
-60000
-40000
-20000
0
20000
40000
60000
5/29
Commercial Hedger
2000 2001 2002 2003 2004 2005 2006 2007 2008 2009 2010 2011 2012 2013 2014 2015 2016 2017 2018 2019 2020-40000
-20000
0
20000
40000
60000
80000
100000
-40000
-20000
0
20000
40000
60000
80000
100000
5/29
Large Speculator
2000 2001 2002 2003 2004 2005 2006 2007 2008 2009 2010 2011 2012 2013 2014 2015 2016 2017 2018 2019 2020-6000-300003000600090001200015000180002100024000
-6000-3000
0300060009000
1200015000180002100024000
5/29
Small Trader
Source: New York Board of Trade, Commodity Futures Trading Commission.
yardeni.com
US Dollar Index
Page 7 / June 1, 2018 / COT: Reportable Non-Commercial Net Positions (Futures Only) www.yardeni.com
Yardeni Research, Inc.
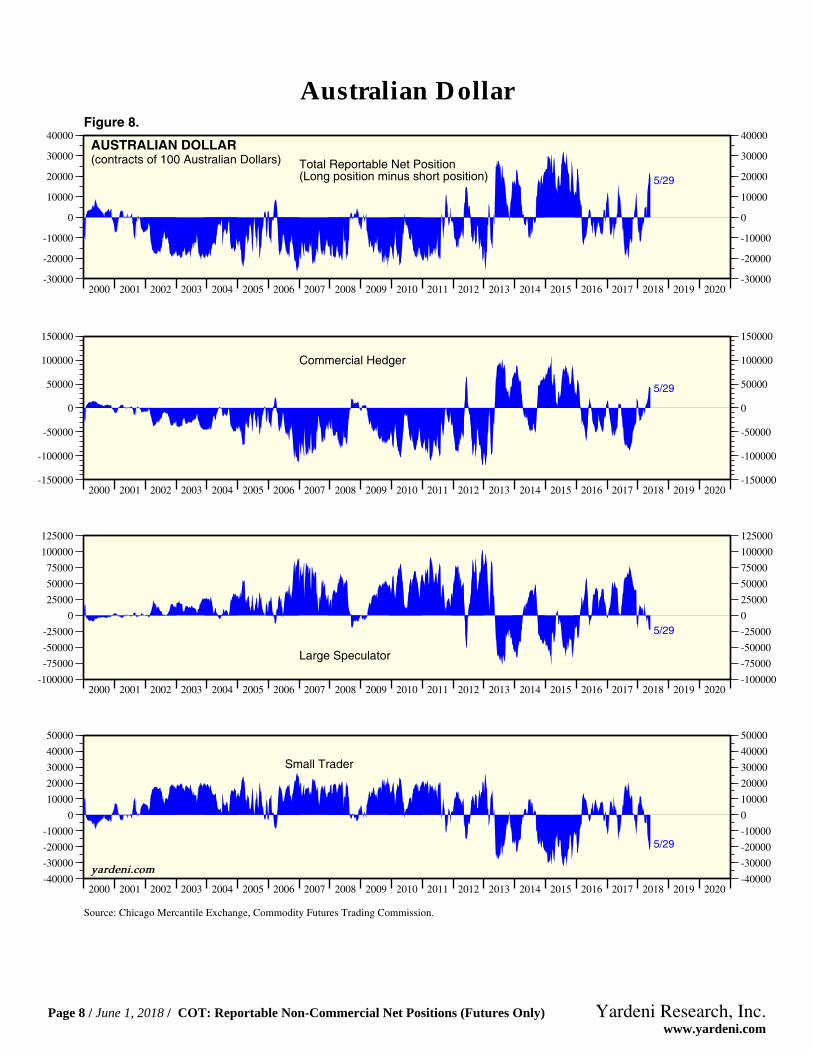
Figure 8.
2000 2001 2002 2003 2004 2005 2006 2007 2008 2009 2010 2011 2012 2013 2014 2015 2016 2017 2018 2019 2020-30000
-20000
-10000
0
10000
20000
30000
40000
-30000
-20000
-10000
0
10000
20000
30000
40000
5/29
AUSTRALIAN DOLLAR(contracts of 100 Australian Dollars) Total Reportable Net Position
(Long position minus short position)
2000 2001 2002 2003 2004 2005 2006 2007 2008 2009 2010 2011 2012 2013 2014 2015 2016 2017 2018 2019 2020-150000
-100000
-50000
0
50000
100000
150000
-150000
-100000
-50000
0
50000
100000
150000
5/29
Commercial Hedger
2000 2001 2002 2003 2004 2005 2006 2007 2008 2009 2010 2011 2012 2013 2014 2015 2016 2017 2018 2019 2020-100000
-75000
-50000
-25000
0
25000
50000
75000
100000
125000
-100000
-75000
-50000
-25000
0
25000
50000
75000
100000
125000
5/29
Large Speculator
2000 2001 2002 2003 2004 2005 2006 2007 2008 2009 2010 2011 2012 2013 2014 2015 2016 2017 2018 2019 2020-40000
-30000
-20000
-10000
0
10000
20000
30000
40000
50000
-40000
-30000
-20000
-10000
0
10000
20000
30000
40000
50000
5/29
Small Trader
yardeni.com
Source: Chicago Mercantile Exchange, Commodity Futures Trading Commission.
Australian Dollar
Page 8 / June 1, 2018 / COT: Reportable Non-Commercial Net Positions (Futures Only) www.yardeni.com
Yardeni Research, Inc.

Figure 9.
2000 2001 2002 2003 2004 2005 2006 2007 2008 2009 2010 2011 2012 2013 2014 2015 2016 2017 2018 2019 2020-40000
-20000
0
20000
-40000
-20000
0
20000
5/29
CANADIAN DOLLAR(contracts of 100 Canadian Dollars) Total Reportable Net Position
(Long position minus short position)
2000 2001 2002 2003 2004 2005 2006 2007 2008 2009 2010 2011 2012 2013 2014 2015 2016 2017 2018 2019 2020-150000
-100000
-50000
0
50000
100000
150000
-150000
-100000
-50000
0
50000
100000
150000
5/29
Commercial Hedger
2000 2001 2002 2003 2004 2005 2006 2007 2008 2009 2010 2011 2012 2013 2014 2015 2016 2017 2018 2019 2020-100000
-75000
-50000
-25000
0
25000
50000
75000
100000
125000
-100000
-75000
-50000
-25000
0
25000
50000
75000
100000
125000
5/29
Large Speculator
2000 2001 2002 2003 2004 2005 2006 2007 2008 2009 2010 2011 2012 2013 2014 2015 2016 2017 2018 2019 2020-30000
-20000
-10000
0
10000
20000
30000
40000
-30000
-20000
-10000
0
10000
20000
30000
40000
5/29
Small Trader
yardeni.com
Source: Chicago Mercantile Exchange, Commodity Futures Trading Commission.
Canadian Dollar
Page 9 / June 1, 2018 / COT: Reportable Non-Commercial Net Positions (Futures Only) www.yardeni.com
Yardeni Research, Inc.
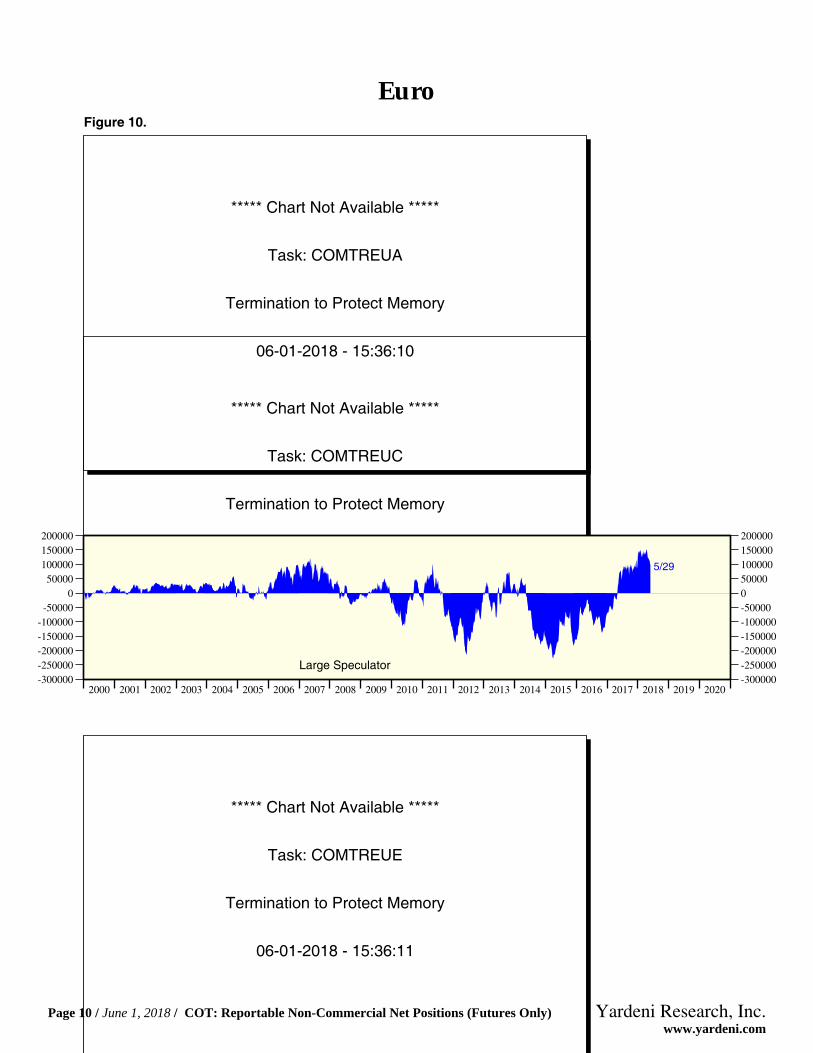
Figure 10.
***** Chart Not Available *****
Task: COMTREUA
Termination to Protect Memory
06-01-2018 - 15:36:10
***** Chart Not Available *****
Task: COMTREUC
Termination to Protect Memory
06-01-2018 - 15:36:11
2000 2001 2002 2003 2004 2005 2006 2007 2008 2009 2010 2011 2012 2013 2014 2015 2016 2017 2018 2019 2020-300000-250000-200000-150000-100000-50000050000100000150000200000
-300000-250000-200000-150000-100000-50000
050000
100000150000200000
5/29
Large Speculator
***** Chart Not Available *****
Task: COMTREUE
Termination to Protect Memory
06-01-2018 - 15:36:11
Euro
Page 10 / June 1, 2018 / COT: Reportable Non-Commercial Net Positions (Futures Only) www.yardeni.com
Yardeni Research, Inc.

Figure 11.
***** Chart Not Available *****
Task: COMTRJYA
Termination to Protect Memory
06-01-2018 - 15:36:11
***** Chart Not Available *****
Task: COMTRJYC
Termination to Protect Memory
06-01-2018 - 15:36:11
2000 2001 2002 2003 2004 2005 2006 2007 2008 2009 2010 2011 2012 2013 2014 2015 2016 2017 2018 2019 2020-200000
-150000
-100000
-50000
0
50000
100000
150000
-200000
-150000
-100000
-50000
0
50000
100000
150000
5/29
Large Speculator
***** Chart Not Available *****
Task: COMTRJYE
Termination to Protect Memory
06-01-2018 - 15:36:11
Yen
Page 11 / June 1, 2018 / COT: Reportable Non-Commercial Net Positions (Futures Only) www.yardeni.com
Yardeni Research, Inc.

Figure 12.
2000 2001 2002 2003 2004 2005 2006 2007 2008 2009 2010 2011 2012 2013 2014 2015 2016 2017 2018 2019 2020-100000
-80000
-60000
-40000
-20000
0
20000
40000
60000
-100000
-80000
-60000
-40000
-20000
0
20000
40000
60000
5/29
LIGHT SWEET CRUDE OIL (WTI)(contracts of 1,000 barrels)
Total Reportable Net Position(Long position minus short position)
2000 2001 2002 2003 2004 2005 2006 2007 2008 2009 2010 2011 2012 2013 2014 2015 2016 2017 2018 2019 2020-850000-750000-650000-550000-450000-350000-250000-150000-5000050000150000
-850000-750000-650000-550000-450000-350000-250000-150000-5000050000
150000
5/29Commercial Hedgers
2000 2001 2002 2003 2004 2005 2006 2007 2008 2009 2010 2011 2012 2013 2014 2015 2016 2017 2018 2019 2020-75000
45000
165000
285000
405000
525000
645000
765000
-75000
45000
165000
285000
405000
525000
645000
765000
5/29Large Speculators
2000 2001 2002 2003 2004 2005 2006 2007 2008 2009 2010 2011 2012 2013 2014 2015 2016 2017 2018 2019 2020-60000
-40000
-20000
0
20000
40000
60000
-60000
-40000
-20000
0
20000
40000
60000
5/29
Small Traders yardeni.com
Source: New York Mercantile Exchange, Commodity Futures Trading Commission.
Crude Oil
Page 12 / June 1, 2018 / COT: Reportable Non-Commercial Net Positions (Futures Only) www.yardeni.com
Yardeni Research, Inc.

Figure 13.
2000 2001 2002 2003 2004 2005 2006 2007 2008 2009 2010 2011 2012 2013 2014 2015 2016 2017 2018 2019 2020-20000
-15000
-10000
-5000
0
5000
10000
15000
20000
-20000
-15000
-10000
-5000
0
5000
10000
15000
20000
5/29
GASOLINE BLENDSTOCK(contracts of 42,000 US gallons) Total Reportable Net Position
(Long position minus short position)
2000 2001 2002 2003 2004 2005 2006 2007 2008 2009 2010 2011 2012 2013 2014 2015 2016 2017 2018 2019 2020-130000
-110000
-90000
-70000
-50000
-30000
-10000
10000
30000
-130000
-110000
-90000
-70000
-50000
-30000
-10000
10000
30000
5/29Commercial Hedgers
2000 2001 2002 2003 2004 2005 2006 2007 2008 2009 2010 2011 2012 2013 2014 2015 2016 2017 2018 2019 2020-50000
0
50000
100000
150000
-50000
0
50000
100000
150000
5/29
Large Speculators
2000 2001 2002 2003 2004 2005 2006 2007 2008 2009 2010 2011 2012 2013 2014 2015 2016 2017 2018 2019 2020-10000
-5000
0
5000
10000
15000
20000
25000
-10000
-5000
0
5000
10000
15000
20000
25000
5/29
Small Traders
yardeni.com
Source: New York Mercantile Exchange, Commodity Futures Trading Commission.
Gasoline
Page 13 / June 1, 2018 / COT: Reportable Non-Commercial Net Positions (Futures Only) www.yardeni.com
Yardeni Research, Inc.
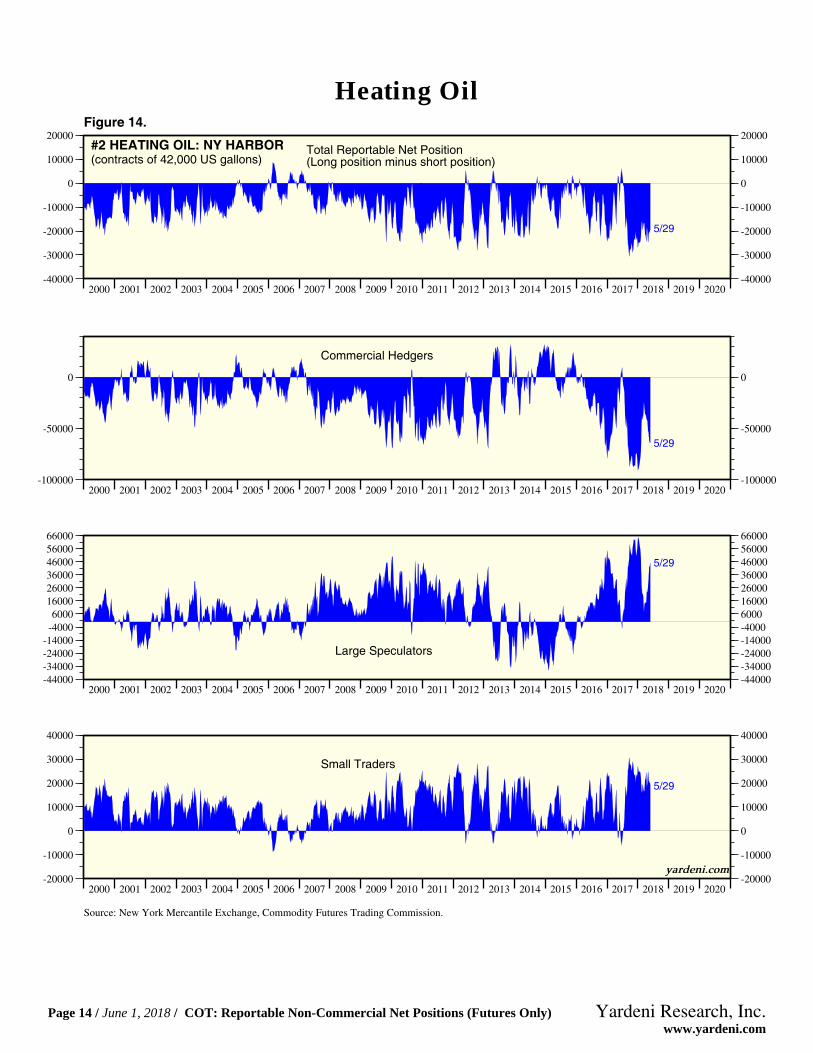
Figure 14.
2000 2001 2002 2003 2004 2005 2006 2007 2008 2009 2010 2011 2012 2013 2014 2015 2016 2017 2018 2019 2020-40000
-30000
-20000
-10000
0
10000
20000
-40000
-30000
-20000
-10000
0
10000
20000
5/29
#2 HEATING OIL: NY HARBOR(contracts of 42,000 US gallons)
Total Reportable Net Position(Long position minus short position)
2000 2001 2002 2003 2004 2005 2006 2007 2008 2009 2010 2011 2012 2013 2014 2015 2016 2017 2018 2019 2020-100000
-50000
0
-100000
-50000
0
5/29
Commercial Hedgers
2000 2001 2002 2003 2004 2005 2006 2007 2008 2009 2010 2011 2012 2013 2014 2015 2016 2017 2018 2019 2020-44000-34000-24000-14000-40006000160002600036000460005600066000
-44000-34000-24000-14000-40006000
160002600036000460005600066000
5/29
Large Speculators
2000 2001 2002 2003 2004 2005 2006 2007 2008 2009 2010 2011 2012 2013 2014 2015 2016 2017 2018 2019 2020-20000
-10000
0
10000
20000
30000
40000
-20000
-10000
0
10000
20000
30000
40000
5/29
Small Traders
yardeni.com
Source: New York Mercantile Exchange, Commodity Futures Trading Commission.
Heating Oil
Page 14 / June 1, 2018 / COT: Reportable Non-Commercial Net Positions (Futures Only) www.yardeni.com
Yardeni Research, Inc.

Figure 15.
2000 2001 2002 2003 2004 2005 2006 2007 2008 2009 2010 2011 2012 2013 2014 2015 2016 2017 2018 2019 2020-100000
-60000
-20000
20000
-100000
-60000
-20000
20000
5/29
NATURAL GAS(contracts of 10,000 MMBTUs)
Total Reportable Net Position(Long position minus short position)
2000 2001 2002 2003 2004 2005 2006 2007 2008 2009 2010 2011 2012 2013 2014 2015 2016 2017 2018 2019 2020-100000
-50000
0
50000
100000
150000
200000
250000
-100000
-50000
0
50000
100000
150000
200000
250000
5/29
Commercial Hedgers
2000 2001 2002 2003 2004 2005 2006 2007 2008 2009 2010 2011 2012 2013 2014 2015 2016 2017 2018 2019 2020-275000
-225000
-175000
-125000
-75000
-25000
25000
75000
-275000
-225000
-175000
-125000
-75000
-25000
25000
75000
5/29
Large Speculators
2000 2001 2002 2003 2004 2005 2006 2007 2008 2009 2010 2011 2012 2013 2014 2015 2016 2017 2018 2019 2020-10000
0
10000
20000
30000
40000
50000
60000
-10000
0
10000
20000
30000
40000
50000
60000
5/29
Small Traders
yardeni.com
Source: New York Mercantile Exchange, Commodity Futures Trading Commission.
Natural Gas
Page 15 / June 1, 2018 / COT: Reportable Non-Commercial Net Positions (Futures Only) www.yardeni.com
Yardeni Research, Inc.

Figure 16.
2000 2001 2002 2003 2004 2005 2006 2007 2008 2009 2010 2011 2012 2013 2014 2015 2016 2017 2018 2019 2020-100000
0
100000
200000
300000
400000
-100000
0
100000
200000
300000
400000
5/29
CORN(contracts of 5,000 bushels) Total Reportable Net Position
(Long position minus short position)
2000 2001 2002 2003 2004 2005 2006 2007 2008 2009 2010 2011 2012 2013 2014 2015 2016 2017 2018 2019 2020-600000
-400000
-200000
0
200000
400000
600000
-600000
-400000
-200000
0
200000
400000
600000
5/29
Commercial Hedger
2000 2001 2002 2003 2004 2005 2006 2007 2008 2009 2010 2011 2012 2013 2014 2015 2016 2017 2018 2019 2020-400000
-200000
0
200000
400000
600000
800000
-400000
-200000
0
200000
400000
600000
800000
5/29
Large Speculator
2000 2001 2002 2003 2004 2005 2006 2007 2008 2009 2010 2011 2012 2013 2014 2015 2016 2017 2018 2019 2020-300000
-200000
-100000
0
100000
200000
-300000
-200000
-100000
0
100000
200000
5/29
Small Trader
Source: Chicago Board of Trade, Commodity Futures Trading Commission.
yardeni.com
Corn
Page 16 / June 1, 2018 / COT: Reportable Non-Commercial Net Positions (Futures Only) www.yardeni.com
Yardeni Research, Inc.

Figure 17.
2000 2001 2002 2003 2004 2005 2006 2007 2008 2009 2010 2011 2012 2013 2014 2015 2016 2017 2018 2019 2020-100000
0
100000
200000
-100000
0
100000
200000
5/29
SOYBEANS(contracts of 5,000 bushels) Total Reportable Net Position
(Long position minus short position)
2000 2001 2002 2003 2004 2005 2006 2007 2008 2009 2010 2011 2012 2013 2014 2015 2016 2017 2018 2019 2020-400000
-200000
0
200000
-400000
-200000
0
200000
5/29
Commercial Hedger
2000 2001 2002 2003 2004 2005 2006 2007 2008 2009 2010 2011 2012 2013 2014 2015 2016 2017 2018 2019 2020-100000
0
100000
200000
300000
-100000
0
100000
200000
300000
5/29
Large Speculator
2000 2001 2002 2003 2004 2005 2006 2007 2008 2009 2010 2011 2012 2013 2014 2015 2016 2017 2018 2019 2020-200000
-100000
0
100000
-200000
-100000
0
100000
5/29
Small Trader
Source: Chicago Board of Trade, Commodity Futures Trading Commission.
yardeni.com
Soybeans
Page 17 / June 1, 2018 / COT: Reportable Non-Commercial Net Positions (Futures Only) www.yardeni.com
Yardeni Research, Inc.

Figure 18.
2000 2001 2002 2003 2004 2005 2006 2007 2008 2009 2010 2011 2012 2013 2014 2015 2016 2017 2018 2019 2020-40000
-30000
-20000
-10000
0
10000
20000
-40000
-30000
-20000
-10000
0
10000
20000
5/29
SOYBEAN MEAL(contracts of 100 tons)
Total Reportable Net Position(Long position minus short position)
2000 2001 2002 2003 2004 2005 2006 2007 2008 2009 2010 2011 2012 2013 2014 2015 2016 2017 2018 2019 2020-200000
-100000
0
100000
-200000
-100000
0
100000
5/29Commercial Hedger
2000 2001 2002 2003 2004 2005 2006 2007 2008 2009 2010 2011 2012 2013 2014 2015 2016 2017 2018 2019 2020-50000
0
50000
100000
150000
200000
-50000
0
50000
100000
150000
200000
5/29Large Speculator
2000 2001 2002 2003 2004 2005 2006 2007 2008 2009 2010 2011 2012 2013 2014 2015 2016 2017 2018 2019 2020-10000
0
10000
20000
30000
40000
-10000
0
10000
20000
30000
40000
5/29
Small Trader
Source: Chicago Board of Trade, Commodity Futures Trading Commission.
yardeni.com
Soybean Meal
Page 18 / June 1, 2018 / COT: Reportable Non-Commercial Net Positions (Futures Only) www.yardeni.com
Yardeni Research, Inc.
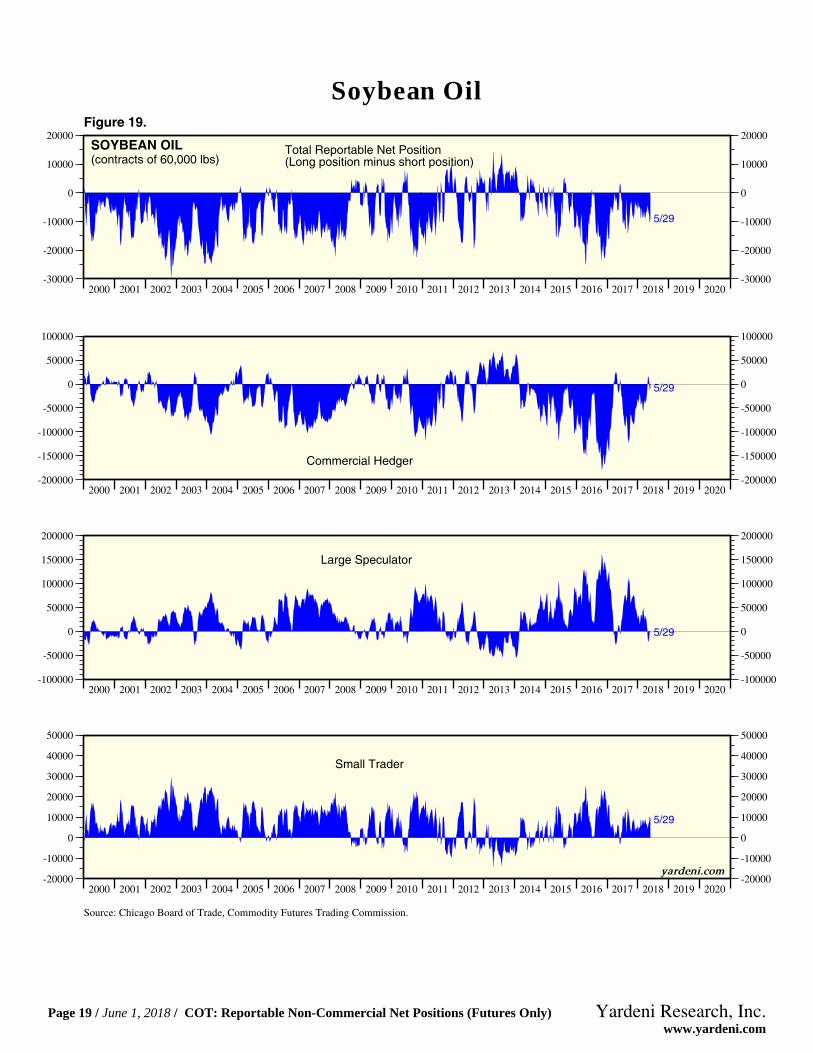
Figure 19.
2000 2001 2002 2003 2004 2005 2006 2007 2008 2009 2010 2011 2012 2013 2014 2015 2016 2017 2018 2019 2020-30000
-20000
-10000
0
10000
20000
-30000
-20000
-10000
0
10000
20000
5/29
SOYBEAN OIL(contracts of 60,000 lbs)
Total Reportable Net Position(Long position minus short position)
2000 2001 2002 2003 2004 2005 2006 2007 2008 2009 2010 2011 2012 2013 2014 2015 2016 2017 2018 2019 2020-200000
-150000
-100000
-50000
0
50000
100000
-200000
-150000
-100000
-50000
0
50000
100000
5/29
Commercial Hedger
2000 2001 2002 2003 2004 2005 2006 2007 2008 2009 2010 2011 2012 2013 2014 2015 2016 2017 2018 2019 2020-100000
-50000
0
50000
100000
150000
200000
-100000
-50000
0
50000
100000
150000
200000
5/29
Large Speculator
2000 2001 2002 2003 2004 2005 2006 2007 2008 2009 2010 2011 2012 2013 2014 2015 2016 2017 2018 2019 2020-20000
-10000
0
10000
20000
30000
40000
50000
-20000
-10000
0
10000
20000
30000
40000
50000
5/29
Small Trader
Source: Chicago Board of Trade, Commodity Futures Trading Commission.
yardeni.com
Soybean Oil
Page 19 / June 1, 2018 / COT: Reportable Non-Commercial Net Positions (Futures Only) www.yardeni.com
Yardeni Research, Inc.

Figure 20.
2000 2001 2002 2003 2004 2005 2006 2007 2008 2009 2010 2011 2012 2013 2014 2015 2016 2017 2018 2019 2020-50000
0
50000
100000
-50000
0
50000
100000
5/29
WHEAT(contracts of 5,000 bushels) Total Reportable Net Position
(Long position minus short position)
2000 2001 2002 2003 2004 2005 2006 2007 2008 2009 2010 2011 2012 2013 2014 2015 2016 2017 2018 2019 2020-100000
0
100000
200000
-100000
0
100000
200000
5/29
Commercial Hedger
2000 2001 2002 2003 2004 2005 2006 2007 2008 2009 2010 2011 2012 2013 2014 2015 2016 2017 2018 2019 2020-200000
-100000
0
100000
-200000
-100000
0
100000
5/29
Large Speculator
2000 2001 2002 2003 2004 2005 2006 2007 2008 2009 2010 2011 2012 2013 2014 2015 2016 2017 2018 2019 2020-50000
-25000
0
25000
50000
-50000
-25000
0
25000
50000
5/29
Small Trader
Source: Chicago Board of Trade, Commodity Futures Trading Commission.
yardeni.com
Wheat
Page 20 / June 1, 2018 / COT: Reportable Non-Commercial Net Positions (Futures Only) www.yardeni.com
Yardeni Research, Inc.

Figure 21.
2000 2001 2002 2003 2004 2005 2006 2007 2008 2009 2010 2011 2012 2013 2014 2015 2016 2017 2018 2019 2020-400000
-200000
0
200000
400000
600000
800000
1000000
-400000
-200000
0
200000
400000
600000
800000
1000000
5/29
3-MONTH EURODOLLARS(contracts of $1,000,000Face Value)
Total Reportable Net Position(Long position minus short position)
2000 2001 2002 2003 2004 2005 2006 2007 2008 2009 2010 2011 2012 2013 2014 2015 2016 2017 2018 2019 2020-2000000
0
2000000
4000000
6000000
-2000000
0
2000000
4000000
6000000
5/29Commercial Hedger
2000 2001 2002 2003 2004 2005 2006 2007 2008 2009 2010 2011 2012 2013 2014 2015 2016 2017 2018 2019 2020-5000000
-4000000
-3000000
-2000000
-1000000
0
1000000
2000000
-5000000
-4000000
-3000000
-2000000
-1000000
0
1000000
2000000
5/29Large Speculator
2000 2001 2002 2003 2004 2005 2006 2007 2008 2009 2010 2011 2012 2013 2014 2015 2016 2017 2018 2019 2020-1000000
-800000
-600000
-400000
-200000
0
200000
400000
-1000000
-800000
-600000
-400000
-200000
0
200000
400000
5/29Small Trader
yardeni.com
Source: Chicago Mercantile Exchange, Commodity Futures Trading Commission.
Eurodollar
Page 21 / June 1, 2018 / COT: Reportable Non-Commercial Net Positions (Futures Only) www.yardeni.com
Yardeni Research, Inc.
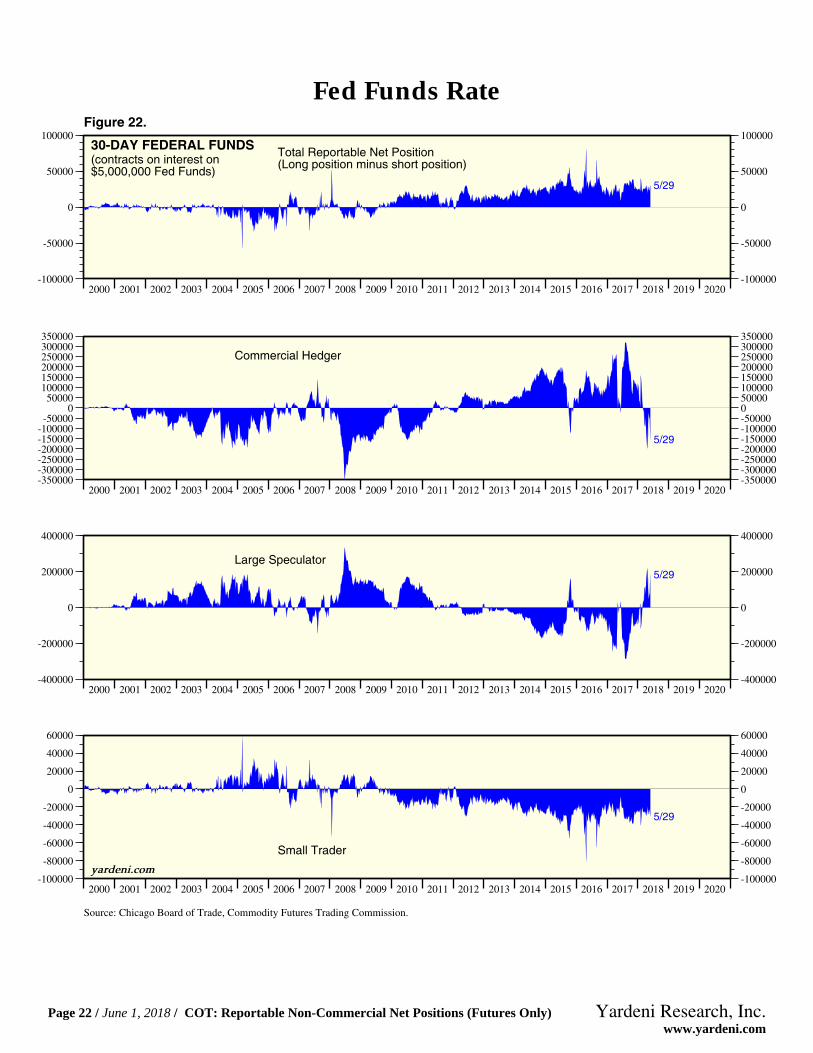
Figure 22.
2000 2001 2002 2003 2004 2005 2006 2007 2008 2009 2010 2011 2012 2013 2014 2015 2016 2017 2018 2019 2020-100000
-50000
0
50000
100000
-100000
-50000
0
50000
100000
5/29
30-DAY FEDERAL FUNDS(contracts on interest on$5,000,000 Fed Funds)
Total Reportable Net Position(Long position minus short position)
2000 2001 2002 2003 2004 2005 2006 2007 2008 2009 2010 2011 2012 2013 2014 2015 2016 2017 2018 2019 2020-350000-300000-250000-200000-150000-100000-50000050000100000150000200000250000300000350000
-350000-300000-250000-200000-150000-100000-50000
050000
100000150000200000250000300000350000
5/29
Commercial Hedger
2000 2001 2002 2003 2004 2005 2006 2007 2008 2009 2010 2011 2012 2013 2014 2015 2016 2017 2018 2019 2020-400000
-200000
0
200000
400000
-400000
-200000
0
200000
400000
5/29Large Speculator
2000 2001 2002 2003 2004 2005 2006 2007 2008 2009 2010 2011 2012 2013 2014 2015 2016 2017 2018 2019 2020-100000
-80000
-60000
-40000
-20000
0
20000
40000
60000
-100000
-80000
-60000
-40000
-20000
0
20000
40000
60000
5/29
Small Trader
yardeni.com
Source: Chicago Board of Trade, Commodity Futures Trading Commission.
Fed Funds Rate
Page 22 / June 1, 2018 / COT: Reportable Non-Commercial Net Positions (Futures Only) www.yardeni.com
Yardeni Research, Inc.

Figure 23.
2000 2001 2002 2003 2004 2005 2006 2007 2008 2009 2010 2011 2012 2013 2014 2015 2016 2017 2018 2019 2020-100000
0
100000
200000
300000
400000
500000
-100000
0
100000
200000
300000
400000
500000
5/29
10-YEAR US TREASURY NOTES(contracts of $100,000 face value) Total Reportable Net Position
(Long position minus short position)
2000 2001 2002 2003 2004 2005 2006 2007 2008 2009 2010 2011 2012 2013 2014 2015 2016 2017 2018 2019 2020-800000
-600000
-400000
-200000
0
200000
400000
600000
800000
-800000
-600000
-400000
-200000
0
200000
400000
600000
800000
5/29Reportable CommercialNet Long Position
2000 2001 2002 2003 2004 2005 2006 2007 2008 2009 2010 2011 2012 2013 2014 2015 2016 2017 2018 2019 2020-500000
0
500000
1000000
-500000
0
500000
1000000
5/29
Reportable NoncommercialNet Long Position
2000 2001 2002 2003 2004 2005 2006 2007 2008 2009 2010 2011 2012 2013 2014 2015 2016 2017 2018 2019 2020-500000
-400000
-300000
-200000
-100000
0
100000
-500000
-400000
-300000
-200000
-100000
0
100000
5/29Total NonreportableNet Long Position
yardeni.com
Source: Commodity Futures Trading Commission.
Treasury Notes (10-Year)
Page 23 / June 1, 2018 / COT: Reportable Non-Commercial Net Positions (Futures Only) www.yardeni.com
Yardeni Research, Inc.

Figure 24.
2000 2001 2002 2003 2004 2005 2006 2007 2008 2009 2010 2011 2012 2013 2014 2015 2016 2017 2018 2019 2020-200000
-100000
0
100000
200000
-200000
-100000
0
100000
200000
5/29
2-YEAR US TREASURY NOTES(contracts of $200,000 face value)
Total Reportable Net Position(Long position minus short position)
2000 2001 2002 2003 2004 2005 2006 2007 2008 2009 2010 2011 2012 2013 2014 2015 2016 2017 2018 2019 2020-302000
-182000
-62000
58000
178000
298000
418000
-302000
-182000
-62000
58000
178000
298000
418000
5/29
Commercial Hedger
2000 2001 2002 2003 2004 2005 2006 2007 2008 2009 2010 2011 2012 2013 2014 2015 2016 2017 2018 2019 2020-400000
-300000
-200000
-100000
0
100000
200000
300000
-400000
-300000
-200000
-100000
0
100000
200000
300000
5/29
Large Speculator
2000 2001 2002 2003 2004 2005 2006 2007 2008 2009 2010 2011 2012 2013 2014 2015 2016 2017 2018 2019 2020-150000
-100000
-50000
0
50000
100000
150000
-150000
-100000
-50000
0
50000
100000
150000
5/29
Small Trader
yardeni.com
Source: Commodity Futures Trading Commission.
Treasury Notes (2-Year)
Page 24 / June 1, 2018 / COT: Reportable Non-Commercial Net Positions (Futures Only) www.yardeni.com
Yardeni Research, Inc.

Figure 25.
2000 2001 2002 2003 2004 2005 2006 2007 2008 2009 2010 2011 2012 2013 2014 2015 2016 2017 2018 2019 2020-20000
-15000
-10000
-5000
0
5000
10000
15000
-20000
-15000
-10000
-5000
0
5000
10000
15000
5/29
COPPER(contracts of 25,000 lbs)
Total Reportable Net Position(Long position minus short position)
2000 2001 2002 2003 2004 2005 2006 2007 2008 2009 2010 2011 2012 2013 2014 2015 2016 2017 2018 2019 2020-80000
-30000
20000
-80000
-30000
20000
5/29
Commercial Hedger
2000 2001 2002 2003 2004 2005 2006 2007 2008 2009 2010 2011 2012 2013 2014 2015 2016 2017 2018 2019 2020-60000
-40000
-20000
0
20000
40000
60000
80000
-60000
-40000
-20000
0
20000
40000
60000
80000
5/29
Large Speculator
2000 2001 2002 2003 2004 2005 2006 2007 2008 2009 2010 2011 2012 2013 2014 2015 2016 2017 2018 2019 2020-20000
-10000
0
10000
20000
30000
-20000
-10000
0
10000
20000
30000
5/29
Small Trader
yardeni.com
Source: Commodity Exchange Inc., Commodity Futures Trading Commission.
Copper
Page 25 / June 1, 2018 / COT: Reportable Non-Commercial Net Positions (Futures Only) www.yardeni.com
Yardeni Research, Inc.

Figure 26.
2000 2001 2002 2003 2004 2005 2006 2007 2008 2009 2010 2011 2012 2013 2014 2015 2016 2017 2018 2019 2020-80000
-60000
-40000
-20000
0
20000
40000
60000
-80000
-60000
-40000
-20000
0
20000
40000
60000
5/29
GOLD(contracts of 100 Troy oz) Total Reportable Net Position
(Long position minus short position)
2000 2001 2002 2003 2004 2005 2006 2007 2008 2009 2010 2011 2012 2013 2014 2015 2016 2017 2018 2019 2020-400000
-300000
-200000
-100000
0
100000
200000
-400000
-300000
-200000
-100000
0
100000
200000
5/29
Commercial Hedger
2000 2001 2002 2003 2004 2005 2006 2007 2008 2009 2010 2011 2012 2013 2014 2015 2016 2017 2018 2019 2020-100000
0
100000
200000
300000
400000
-100000
0
100000
200000
300000
400000
5/29
Large Speculator
2000 2001 2002 2003 2004 2005 2006 2007 2008 2009 2010 2011 2012 2013 2014 2015 2016 2017 2018 2019 2020-40000
-20000
0
20000
40000
60000
80000
-40000
-20000
0
20000
40000
60000
80000
5/29
Small Trader
yardeni.com
Source: Commodity Exchange Inc., Commodity Futures Trading Commission.
Gold
Page 26 / June 1, 2018 / COT: Reportable Non-Commercial Net Positions (Futures Only) www.yardeni.com
Yardeni Research, Inc.

Figure 27.
2000 2001 2002 2003 2004 2005 2006 2007 2008 2009 2010 2011 2012 2013 2014 2015 2016 2017 2018 2019 2020-50000
-40000
-30000
-20000
-10000
0
10000
20000
-50000
-40000
-30000
-20000
-10000
0
10000
20000
5/29
SILVER(contracts of 5,000 Troy oz)
Total Reportable Net Position(Long position minus short position)
2000 2001 2002 2003 2004 2005 2006 2007 2008 2009 2010 2011 2012 2013 2014 2015 2016 2017 2018 2019 2020-150000
-130000
-110000
-90000
-70000
-50000
-30000
-10000
10000
30000
-150000
-130000
-110000
-90000
-70000
-50000
-30000
-10000
10000
30000
5/29
Commercial Hedger
2000 2001 2002 2003 2004 2005 2006 2007 2008 2009 2010 2011 2012 2013 2014 2015 2016 2017 2018 2019 2020-30000
-15000
0
15000
30000
45000
60000
75000
90000
105000
-30000
-15000
0
15000
30000
45000
60000
75000
90000
105000
5/29
Large Speculator
2000 2001 2002 2003 2004 2005 2006 2007 2008 2009 2010 2011 2012 2013 2014 2015 2016 2017 2018 2019 2020-5000050001000015000200002500030000350004000045000
-50000
50001000015000200002500030000350004000045000
5/29
Small Trader
yardeni.com
Source: Commodity Exchange Inc., Commodity Futures Trading Commission.
Silver
Page 27 / June 1, 2018 / COT: Reportable Non-Commercial Net Positions (Futures Only) www.yardeni.com
Yardeni Research, Inc.

Figure 28.
2000 2001 2002 2003 2004 2005 2006 2007 2008 2009 2010 2011 2012 2013 2014 2015 2016 2017 2018 2019 2020-10000
-5500
-1000
3500
8000
12500
17000
21500
26000
30500
-10000
-5500
-1000
3500
8000
12500
17000
21500
26000
30500
5/29
NIKKEI(# of positions of Nikkei Index X $5)
Total Reportable Net Position(Long position minus short position)
2000 2001 2002 2003 2004 2005 2006 2007 2008 2009 2010 2011 2012 2013 2014 2015 2016 2017 2018 2019 2020-20000
-10000
0
10000
20000
30000
40000
50000
-20000
-10000
0
10000
20000
30000
40000
50000
5/29
Commercial Hedger
2000 2001 2002 2003 2004 2005 2006 2007 2008 2009 2010 2011 2012 2013 2014 2015 2016 2017 2018 2019 2020-45000
-35000
-25000
-15000
-5000
5000
15000
25000
-45000
-35000
-25000
-15000
-5000
5000
15000
25000
5/29
Large Speculator
2000 2001 2002 2003 2004 2005 2006 2007 2008 2009 2010 2011 2012 2013 2014 2015 2016 2017 2018 2019 2020-27000
-22000
-17000
-12000
-7000
-2000
3000
8000
13000
-27000
-22000
-17000
-12000
-7000
-2000
3000
8000
13000
5/29
Small Trader
yardeni.com
Source: Chicago Mercantile Exchange, Commodity Futures Trading Commission.
Nikkei
Page 28 / June 1, 2018 / COT: Reportable Non-Commercial Net Positions (Futures Only) www.yardeni.com
Yardeni Research, Inc.

Figure 29.
2000 2001 2002 2003 2004 2005 2006 2007 2008 2009 2010 2011 2012 2013 2014 2015 2016 2017 2018 2019 2020-150000
-100000
-50000
0
50000
100000
-150000
-100000
-50000
0
50000
100000
5/29S&P 500(# of positions of S&P 500 X $250)
Total Reportable Net Position(Long position minus short position)
2000 2001 2002 2003 2004 2005 2006 2007 2008 2009 2010 2011 2012 2013 2014 2015 2016 2017 2018 2019 2020-150000
-100000
-50000
0
50000
100000
150000
-150000
-100000
-50000
0
50000
100000
150000
5/29
Commercial Hedger
2000 2001 2002 2003 2004 2005 2006 2007 2008 2009 2010 2011 2012 2013 2014 2015 2016 2017 2018 2019 2020-100000
-50000
0
50000
100000
-100000
-50000
0
50000
100000
5/29
Large Speculator
2000 2001 2002 2003 2004 2005 2006 2007 2008 2009 2010 2011 2012 2013 2014 2015 2016 2017 2018 2019 2020-100000
-50000
0
50000
100000
150000
-100000
-50000
0
50000
100000
150000
5/29
Small Trader
yardeni.com
Source: Chicago Mercantile Exchange, Commodity Futures Trading Commission.
S&P 500
Page 29 / June 1, 2018 / COT: Reportable Non-Commercial Net Positions (Futures Only) www.yardeni.com
Yardeni Research, Inc.

http://blog.yardeni.com
http://blog.yardeni.com
Copyright (c) Yardeni Research, Inc. 2018. All rights reserved. The informationcontained herein has been obtained from sources believed to be reliable, but is notnecessarily complete and its accuracy cannot be guaranteed. No representation orwarranty, express or implied, is made as to the fairness, accuracy, completeness, orcorrectness of the information and opinions contained herein. The views and the otherinformation provided are subject to change without notice. All reports posted onwww.yardeni.com, blog.yardeni.com, and YRI’s Apps for iPads and iPhones are issuedwithout regard to the specific investment objectives, financial situation, or particular needsof any specific recipient and are not to be construed as a solicitation or an offer to buy or sellany securities or related financial instruments. Past performance is not necessarily a guideto future results. Company fundamentals and earnings may be mentioned occasionally, butshould not be construed as a recommendation to buy, sell, or hold the company’s stock.Predictions, forecasts, and estimates for any and all markets should not be construed asrecommendations to buy, sell, or hold any security--including mutual funds, futurescontracts, and exchange traded funds, or any similar instruments.
The text, images, and other materials contained or displayed on any Yardeni Research, Inc.product, service, report, email or website are proprietary to Yardeni Research, Inc. andconstitute valuable intellectual property. No material from any part of www.yardeni.com, blog.yardeni.com, and YRI’s Apps for iPads and iPhones may be downloaded, transmitted,broadcast, transferred, assigned, reproduced or in any other way used or otherwisedisseminated in any form to any person or entity, without the explicit written consent ofYardeni Research, Inc. All unauthorized reproduction or other use of material from YardeniResearch, Inc. shall be deemed willful infringement(s) of this copyright and other proprietaryand intellectual property rights, including but not limited to, rights of privacy. YardeniResearch, Inc. expressly reserves all rights in connection with its intellectual property,including without limitation the right to block the transfer of its products and services and/orto track usage thereof, through electronic tracking technology, and all other lawful means,now known or hereafter devised. Yardeni Research, Inc. reserves the right, without furthernotice, to pursue to the fullest extent allowed by the law any and all criminal and civilremedies for the violation of its rights.
The recipient should check any email and any attachments for the presence of viruses.Yardeni Research, Inc. accepts no liability for any damage caused by any virus transmittedby this company’s emails, website, blog and Apps. Additional information available onrequest.