Embed Size (px)
Citation preview

Market Briefing:Commodity Prices
Yardeni Research, Inc.
June 29, 2018
Dr. Edward Yardeni516-972-7683
Mali Quintana480-664-1333
Please visit our sites atwww.yardeni.comblog.yardeni.com
thinking outside the box
Table Of Contents Table Of ContentsTable Of Contents
June 29, 2018 / Commodity Prices www.yardeni.com
Yardeni Research, Inc.
Commodity Price Indexes 1-2Energy 3-4Basic Metals 5Lumber 6Precious Metals 7-8Agriculture 9-10Misc: CRB Index 11-12Misc: Energy 13-14Misc: Agriculture 15Misc: Precious Metals 16Misc: Grains 17-18

95 96 97 98 99 00 01 02 03 04 05 06 07 08 09 10 11 12 13 14 15 16 17 18 19 20200
300
400
500
600
200
300
400
500
600
6/28
CRB SPOT COMMODITY PRICE INDEX: ALL COMMODITIES*(1967=100)
Source: Commodity Research Bureau.
* Includes hides, tallow, copper scrap, lead scrap, steel scrap, zinc, tin, burlap, cotton, print cloth, wool tops, rosin, rubber, hogs, steers, lard, butter,soybean oil, cocoa, corn, Kansas City wheat, Minneapolis wheat, and sugar.
yardeni.com
Figure 1.
95 96 97 98 99 00 01 02 03 04 05 06 07 08 09 10 11 12 13 14 15 16 17 18 19 20200
300
400
500
600
700
200
300
400
500
600
700
6/28
CRB RAW INDUSTRIALS SPOT PRICE INDEX*(1967=100, daily)
* Includes copper scrap, lead scrap, steel scrap, tin, zinc, burlap, cotton, print cloth, wool tops, hides, rosin, rubber, and tallow.Source: Commodity Research Bureau.
yardeni.com
Figure 2.
Commodity Price Indexes
Page 1 / June 29, 2018 / Commodity Prices www.yardeni.com
Yardeni Research, Inc.

95 96 97 98 99 00 01 02 03 04 05 06 07 08 09 10 11 12 13 14 15 16 17 18 19 20150
250
350
450
550
650
750
850
950
1050
1150
150
250
350
450
550
650
750
850
950
1050
1150
6/28
6/28
CRB RAW INDUSTRIALS SPOT PRICE INDEXES(1967=100)
CRB Raw IndustrialsSpot Price Index (514.0)Metals Component* (925.0)
* Includes scrap copper, lead scrap, steel scrap, tin, and zinc.Source: Haver Analytics.
yardeni.com
Figure 3.
95 96 97 98 99 00 01 02 03 04 05 06 07 08 09 10 11 12 13 14 15 16 17 18 19 2075
175
275
375
475
575
675
75
175
275
375
475
575
675
6/28
6/29
COMMODITY PRICES(1967=100)
CRB Price Indexes
CRB FuturesCRB Raw Industrials Spot
Source: Haver Analytics.
yardeni.com
Figure 4.
Commodity Price Indexes
Page 2 / June 29, 2018 / Commodity Prices www.yardeni.com
Yardeni Research, Inc.

2004 2005 2006 2007 2008 2009 2010 2011 2012 2013 2014 2015 2016 2017 2018 201910
20
30
40
50
60
70
80
90
100
110
120
130
140
150
160
10
20
30
40
50
60
70
80
90
100
110
120
130
140
150
160
6/28
BRENT CRUDE OIL FUTURES PRICE*(dollars per barrel)
Price (77.85)
200-day moving average* Nearby futures price.
Source: Haver Analytics.
yardeni.com
Figure 5.
2007 2008 2009 2010 2011 2012 2013 2014 2015 2016 2017 2018 2019.3
.9
1.5
2.1
2.7
3.3
3.9
4.5
.3
.9
1.5
2.1
2.7
3.3
3.9
4.5
6/29
GASOLINE FUTURES PRICE*(dollars per gallon)
Price (2.15)
* Nearby contract.Source: Haver Analytics.
200-day moving average
yardeni.com
Figure 6.
Energy
Page 3 / June 29, 2018 / Commodity Prices www.yardeni.com
Yardeni Research, Inc.

2002 2003 2004 2005 2006 2007 2008 2009 2010 2011 2012 2013 2014 2015 2016 2017 2018 2019.2
.6
1.0
1.4
1.8
2.2
2.6
3.0
3.4
3.8
4.2
4.6
.2
.6
1.0
1.4
1.8
2.2
2.6
3.0
3.4
3.8
4.2
4.6
6/29
HEATING OIL FUTURES PRICE*(dollar per gallon)
Price (2.21)
200-day moving average* Nearby contract.
Source: Haver Analytics.
yardeni.com
Figure 7.
90 91 92 93 94 95 96 97 98 99 00 01 02 03 04 05 06 07 08 09 10 11 12 13 14 15 16 17 18 19 20 210
2
4
6
8
10
12
14
16
18
0
2
4
6
8
10
12
14
16
18
6/29
NATURAL GAS FUTURES PRICE*(dollars per MMBTU)
Price (2.92)
* Nearby contract.200-day moving average
Source: Haver Analytics.
yardeni.com
Figure 8.
Energy
Page 4 / June 29, 2018 / Commodity Prices www.yardeni.com
Yardeni Research, Inc.

2002 2003 2004 2005 2006 2007 2008 2009 2010 2011 2012 2013 2014 2015 2016 2017 2018 2019100
300
500
700
900
1100
1300
100
300
500
700
900
1100
1300
6/28
CRB RAW INDUSTRIALS SPOT PRICE INDEX: METALS*(daily, 1967=100)
200-day moving average* Includes copper scrap, lead scrap, steel scrap, tin, and zinc.
Source: Haver Analytics.
yardeni.com
Figure 9.
2005 2006 2007 2008 2009 2010 2011 2012 2013 2014 2015 2016 2017 2018 2019 2020100
150
200
250
300
350
400
450
500
100
150
200
250
300
350
400
450
500
6/29
COPPER FUTURES PRICE*(cents per pound)
Price (295)
200-day moving average* Nearby futures contract.
Source: Haver Analytics.
yardeni.com
Figure 10.
Basic Metals
Page 5 / June 29, 2018 / Commodity Prices www.yardeni.com
Yardeni Research, Inc.
2002 2003 2004 2005 2006 2007 2008 2009 2010 2011 2012 2013 2014 2015 2016 2017 2018 2019125
175
225
275
325
375
425
475
525
575
625
675
725
125
175
225
275
325
375
425
475
525
575
625
675
725
6/29
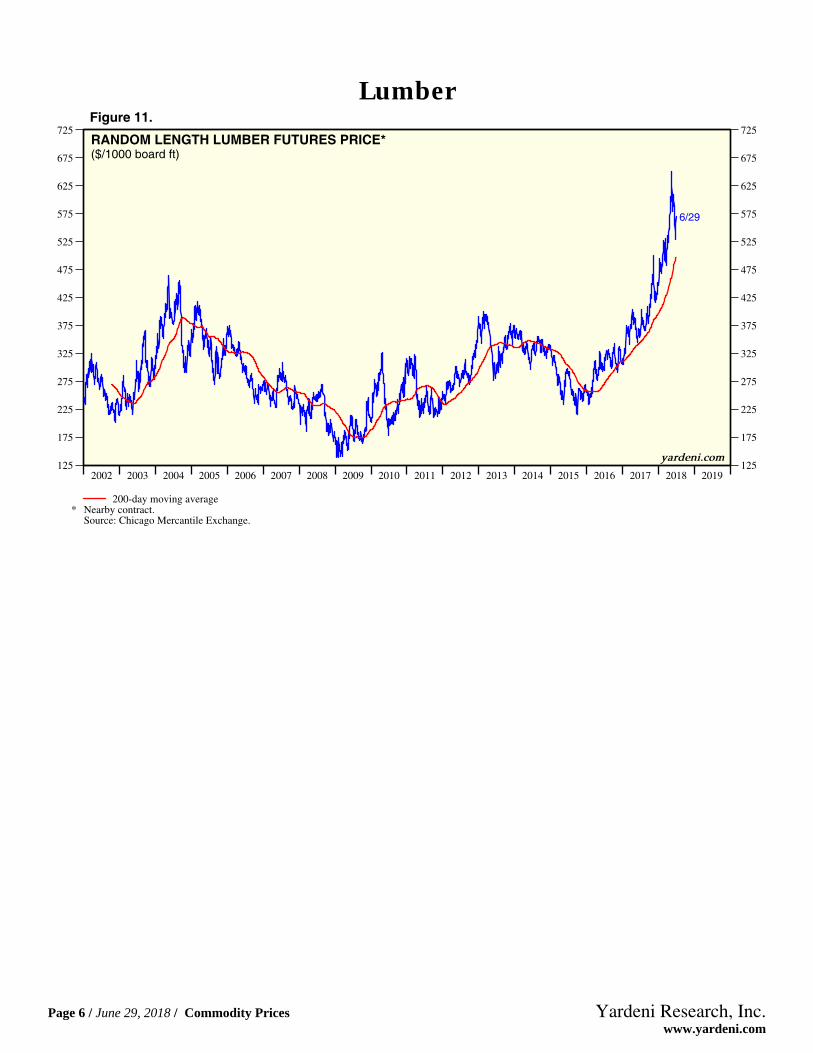
RANDOM LENGTH LUMBER FUTURES PRICE*($/1000 board ft)
200-day moving average* Nearby contract.
Source: Chicago Mercantile Exchange.
yardeni.com
Figure 11.
Lumber
Page 6 / June 29, 2018 / Commodity Prices www.yardeni.com
Yardeni Research, Inc.

2002 2003 2004 2005 2006 2007 2008 2009 2010 2011 2012 2013 2014 2015 2016 2017 2018 2019225
400
575
750
925
1100
1275
1450
1625
1800
1975
225
400
575
750
925
1100
1275
1450
1625
1800
1975
D A
6/28
GOLD CASH PRICE(dollars per troy ounce)
Price (1251.55)
200-day moving averageD = On July 26, 2012, ECB President Mario Draghi pledged to do "whatever it takes" to defend the euro.A = On April 4, 2013, Bank of Japan implemented "Abenomics" monetary policy.Source: Wall Street Journal and Haver Analytics.
yardeni.com
Figure 12.
2002 2003 2004 2005 2006 2007 2008 2009 2010 2011 2012 2013 2014 2015 2016 2017 2018 20194
8
12
16
20
24
28
32
36
40
44
48
52
4
8
12
16
20
24
28
32
36
40
44
48
52
6/29
SILVER CASH PRICE(dollars per troy ounce)
Price (16.15)
200-day moving averageSource: Haver Analytics.
yardeni.com
Figure 13.
Precious Metals
Page 7 / June 29, 2018 / Commodity Prices www.yardeni.com
Yardeni Research, Inc.

2005 2006 2007 2008 2009 2010 2011 2012 2013 2014 2015 2016 2017 2018 2019600
800
1000
1200
1400
1600
1800
2000
2200
2400
600
800
1000
1200
1400
1600
1800
2000
2200
2400
6/29
PLATINUM FUTURES PRICE*(dollars per troy ounce)
Price (852.40)
200-day moving average* Nearby contract.
Source: Haver Analytics.
yardeni.com
Figure 14.
2002 2003 2004 2005 2006 2007 2008 2009 2010 2011 2012 2013 2014 2015 2016 2017 2018 20190
200
400
600
800
1000
1200
0
200
400
600
800
1000
1200
6/26
PALLADIUM CASH PRICE($/troy oz)
Price (944.00)
200-day moving averageSource: Haver Analytics.
yardeni.com
Figure 15.
Precious Metals
Page 8 / June 29, 2018 / Commodity Prices www.yardeni.com
Yardeni Research, Inc.

82 84 86 88 90 92 94 96 98 00 02 04 06 08 10 12 14 16 18 20 22350
550
750
950
1150
1350
1550
1750
1950
350
550
750
950
1150
1350
1550
1750
1950
6/29
SOYBEANS FUTURES PRICE*(cents per bushel)
Price (858.50)
200-day moving average* Nearby contract.
Source: Haver Analytics.
yardeni.com
Figure 16.
2002 2003 2004 2005 2006 2007 2008 2009 2010 2011 2012 2013 2014 2015 2016 2017 2018 2019150
250
350
450
550
650
750
850
150
250
350
450
550
650
750
850
6/29
CORN FUTURES PRICE*(cents per bushel)
Price (350.25)
200-day moving average* Nearby contract.
Source: Haver Analytics.
yardeni.com
Figure 17.
Agriculture
Page 9 / June 29, 2018 / Commodity Prices www.yardeni.com
Yardeni Research, Inc.

2002 2003 2004 2005 2006 2007 2008 2009 2010 2011 2012 2013 2014 2015 2016 2017 2018 2019200
300
400
500
600
700
800
900
1000
1100
1200
1300
1400
200
300
400
500
600
700
800
900
1000
1100
1200
1300
1400
6/29
WHEAT FUTURES PRICE*(cents per bushel)
Price (497.50)
200-day moving average* Nearby contract.
Source: Haver Analytics.
yardeni.com
Figure 18.
2002 2003 2004 2005 2006 2007 2008 2009 2010 2011 2012 2013 2014 2015 2016 2017 2018 2019.0
.5
1.0
1.5
2.0
2.5
.0
.5
1.0
1.5
2.0
2.5
6/29
COTTON FUTURES PRICE*($/pound)
Price (0.85)
Source: Haver Analytics.* Nearby contract.
200-day moving average
yardeni.com
Figure 19.
Agriculture
Page 10 / June 29, 2018 / Commodity Prices www.yardeni.com
Yardeni Research, Inc.

62 64 66 68 70 72 74 76 78 80 82 84 86 88 90 92 94 96 98 00 02 04 06 08 10 12 14 16 18 20 2250
100
150
200
250
300
350
400
450
500
550
600
650
700
50
100
150
200
250
300
350
400
450
500
550
600
650
700
CRB RAW INDUSTRIALS SPOT PRICE INDEX*& RECESSIONS(1967=100, daily)
6/28
Note: Shaded areas denote recessions according to the National Bureau of Economic Research. Weekly from 1962 to 1982, daily thereafter.* Includes copper scrap, lead scrap, steel scrap, tin, zinc, burlap, cotton, print cloth, wool tops, hides, rosin, rubber, and tallow.
Source: Commodity Research Bureau.
yardeni.com
Figure 20.
95 96 97 98 99 00 01 02 03 04 05 06 07 08 09 10 11 12 13 14 15 16 17 18 19 20200
300
400
500
600
700
200
300
400
500
600
700
CRB RAW INDUSTRIALS SPOT PRICE INDEX*(1967=100 ratio scale)
CRB RAW INDUSTRIALS SPOT PRICE INDEX*(1967=100 ratio scale)
CRB RAW INDUSTRIALS SPOT PRICE INDEX*(1967=100 ratio scale)
CRB RAW INDUSTRIALS SPOT PRICE INDEX*(1967=100 ratio scale)
CRB RAW INDUSTRIALS SPOT PRICE INDEX*(1967=100 ratio scale)
CRB RAW INDUSTRIALS SPOT PRICE INDEX*(1967=100 ratio scale)
CRB RAW INDUSTRIALS SPOT PRICE INDEX*(1967=100 ratio scale)
CRB RAW INDUSTRIALS SPOT PRICE INDEX*(1967=100 ratio scale)
CRB RAW INDUSTRIALS SPOT PRICE INDEX*(1967=100 ratio scale)
CRB RAW INDUSTRIALS SPOT PRICE INDEX*(1967=100 ratio scale)
CRB RAW INDUSTRIALS SPOT PRICE INDEX*(1967=100 ratio scale)
CRB RAW INDUSTRIALS SPOT PRICE INDEX*(1967=100 ratio scale)
CRB RAW INDUSTRIALS SPOT PRICE INDEX*(1967=100 ratio scale)
6/28
* Includes copper scrap, lead scrap, steel scrap, tin, zinc, burlap, cotton, print cloth, wool tops, hides, rosin, rubber, and tallow.Source: Commodity Research Bureau.
yardeni.com
Figure 21.
Misc: CRB Index
Page 11 / June 29, 2018 / Commodity Prices www.yardeni.com
Yardeni Research, Inc.

81 83 85 87 89 91 93 95 97 99 01 03 05 07 09 11 13 15 17 19 21150
250
350
450
550
650
750
850
950
105011501250
150
250
350
450
550
650
750
850
950
105011501250
CRB SPOT PRICE INDEX: METALS*(1967=100, ratio scale)
6/28
Note: Shaded areas denote recessions according to the National Bureau of Economic Research.* Includes copper scrap, lead scrap, steel scrap, tin, and zinc.
Source: Haver Analytics.
yardeni.com
Figure 22.
52 54 56 58 60 62 64 66 68 70 72 74 76 78 80 82 84 86 88 90 92 94 96 98 00 02 04 06 08 10 12 14 16 18 20 2270
170
270
370
470
570
670
70
170
270
370
470
570
670
CRB RAW INDUSTRIALS SPOT PRICE INDEX*(1967=100, ratio scale)
6/28
* Weekly from 1951 to 1981, then daily. Includes copper scrap, lead scrap, steel scrap, tin, zinc, burlap, cotton, print cloth, wool tops, hides, rosin,rubber, and tallow.Note: Shaded areas denote recessions according to the National Bureau of Economic Research.Source: Commodity Research Bureau.
yardeni.com
Figure 23.
Misc: CRB Index
Page 12 / June 29, 2018 / Commodity Prices www.yardeni.com
Yardeni Research, Inc.

2004 2005 2006 2007 2008 2009 2010 2011 2012 2013 2014 2015 2016 2017 2018 201910
20
30
40
50
60
70
80
90
100
110
120
130
140
150
10
20
30
40
50
60
70
80
90
100
110
120
130
140
150
6/28
BRENT CRUDE OIL FUTURES PRICE*(dollars per barrel)
* Nearby futures price.Source: Energy Information Administration and Haver Analytics.
yardeni.com
Figure 24.
2004 2005 2006 2007 2008 2009 2010 2011 2012 2013 2014 2015 2016 2017 2018 2019 202020
40
60
80
100
120
140
160
20
40
60
80
100
120
140
160
6/28
6/28
COMMODITY PRICES: INDUSTRIAL vs CRUDE OIL
CRB Raw IndustrialsSpot Price Index*
Brent Crude Oil Futures Price**(dollars per barrel)
* Times 2 and divided by 10. Includes copper scrap, lead scrap, steel scrap, tin, zinc, burlap, cotton, print cloth, wool tops, hides, rosin, rubber, and tallow.** Nearby futures price.
Source: The Commodity Research Bureau and Haver Analytics.
yardeni.com
Figure 25.
Misc: Energy
Page 13 / June 29, 2018 / Commodity Prices www.yardeni.com
Yardeni Research, Inc.

2009 2010 2011 2012 2013 2014 2015 2016 2017 2018 2019.8
1.0
1.2
1.4
1.6
1.8
2.0
2.2
2.4
2.6
2.8
3.0
3.2
3.4
3.6
3.8
.8
1.0
1.2
1.4
1.6
1.8
2.0
2.2
2.4
2.6
2.8
3.0
3.2
3.4
3.6
3.8
6/29
PETROLEUM PRODUCTS FUTURES PRICES*(dollars per gallon)
Heating Oil (2.21)Gasoline (2.15)
* Nearby contract.Source: Haver Analytics.
yardeni.com
Figure 26.
46 48 50 52 54 56 58 60 62 64 66 68 70 72 74 76 78 80 82 84 86 88 90 92 94 96 98 00 02 04 06 08 10 12 14 16 18 20 220
50
100
150
0
50
100
150
6/28
WEST TEXAS INTERMEDIATE CRUDE OIL PRICE(dollars per barrel)
* Ratio scale. Shaded areas denote recessions according to the National Bureau of Economic Research. Monthly from 1946 to 1984, daily thereafter.Source: Haver Analytics.
yard
eni.
com
Figure 27.
Misc: Energy
Page 14 / June 29, 2018 / Commodity Prices www.yardeni.com
Yardeni Research, Inc.

Figure 28.
2006 2007 2008 2009 2010 2011 2012 2013 2014 2015 2016 2017 2018 2019 2020150
250
350
450
550
650
750
850
150
250
350
450
550
650
750
850
6/29
CORN FUTURES PRICE*(cents per bushel)
2006 2007 2008 2009 2010 2011 2012 2013 2014 2015 2016 2017 2018 2019 2020350
550
750
950
1150
1350
1550
1750
1950
350
550
750
950
1150
1350
1550
1750
1950
6/29
SOYBEANS FUTURES PRICE*(cents per bushel)
2006 2007 2008 2009 2010 2011 2012 2013 2014 2015 2016 2017 2018 2019 202020030040050060070080090010001100120013001400
200300400500600700800900
10001100120013001400
6/29
WHEAT FUTURES PRICE*(cents per bushel)
2006 2007 2008 2009 2010 2011 2012 2013 2014 2015 2016 2017 2018 2019 20200
50
100
150
200
250
0
50
100
150
200
250
6/29
COTTON FUTURES PRICE*($/pound)
200-day moving average
Source: Haver Analytics.* Nearby contract, closing price.
yardeni.com
Misc: Agriculture
Page 15 / June 29, 2018 / Commodity Prices www.yardeni.com
Yardeni Research, Inc.

Figure 29.
2006 2007 2008 2009 2010 2011 2012 2013 2014 2015 2016 2017 2018 2019 2020400
575
750
925
1100
1275
1450
1625
1800
1975
400
575
750
925
1100
1275
1450
1625
1800
1975
6/29
GOLD FUTURES PRICE*(dollars per troy ounce)
2006 2007 2008 2009 2010 2011 2012 2013 2014 2015 2016 2017 2018 2019 2020481216202428323640444852
48
1216202428323640444852
6/29
SILVER FUTURES PRICE*(dollars per troy ounce)
2006 2007 2008 2009 2010 2011 2012 2013 2014 2015 2016 2017 2018 2019 2020600
800
1000
1200
1400
1600
1800
2000
2200
2400
2600
600
800
1000
1200
1400
1600
1800
2000
2200
2400
2600
6/29
PLATINUM FUTURES PRICE*(dollars per troy ounce)
2006 2007 2008 2009 2010 2011 2012 2013 2014 2015 2016 2017 2018 2019 20200
200
400
600
800
1000
1200
0
200
400
600
800
1000
1200
6/26
PALLADIUM SPOT PRICE($/troy oz)
200-day moving average
Source: Haver Analytics.* Nearby contract.
yardeni.com
Misc: Precious Metals
Page 16 / June 29, 2018 / Commodity Prices www.yardeni.com
Yardeni Research, Inc.

77 79 81 83 85 87 89 91 93 95 97 99 01 03 05 07 09 11 13 15 17 19 21100
200
300
400
500
600
700
100
200
300
400
500
600
700
6/29
S&P GSCI GRAIN INDEX(January 5, 1970=100)
Source: Standard & Poor’s Corporation.
yardeni.com
Figure 30.
70 72 74 76 78 80 82 84 86 88 90 92 94 96 98 00 02 04 06 08 10 12 14 16 18 20 22100
150
200
250
300
350
400
450
500
550
600
650
700
750
800
100
150
200
250
300
350
400
450
500
550
600
650
700
750
800
6/29
S&P GSCI SOYBEANS INDEX(December 31, 1969=100)
Source: Standard & Poor’s.
yardeni.com
Figure 31.
Misc: Grains
Page 17 / June 29, 2018 / Commodity Prices www.yardeni.com
Yardeni Research, Inc.

70 72 74 76 78 80 82 84 86 88 90 92 94 96 98 00 02 04 06 08 10 12 14 16 18 20 2250
100
150
200
250
300
350
400
450
500
550
600
650
700
750
800
850
900
950
1000
50
100
150
200
250
300
350
400
450
500
550
600
650
700
750
800
850
900
950
1000
6/29
S&P GSCI WHEAT INDEX(December 31, 1969=100)
Source: Standard & Poor’s Corporation.
yardeni.com
Figure 32.
70 72 74 76 78 80 82 84 86 88 90 92 94 96 98 00 02 04 06 08 10 12 14 16 18 20 2250
100
150
200
250
300
350
400
450
500
550
600
650
700
750
50
100
150
200
250
300
350
400
450
500
550
600
650
700
750
6/29
S&P GSCI CORN INDEX(December 31 1969=100)
Source: Standard & Poor’s Corporation.
yardeni.com
Figure 33.
Misc: Grains
Page 18 / June 29, 2018 / Commodity Prices www.yardeni.com
Yardeni Research, Inc.

http://blog.yardeni.com
http://blog.yardeni.com
Copyright (c) Yardeni Research, Inc. 2018. All rights reserved. The informationcontained herein has been obtained from sources believed to be reliable, but is notnecessarily complete and its accuracy cannot be guaranteed. No representation orwarranty, express or implied, is made as to the fairness, accuracy, completeness, orcorrectness of the information and opinions contained herein. The views and the otherinformation provided are subject to change without notice. All reports posted onwww.yardeni.com, blog.yardeni.com, and YRI’s Apps for iPads and iPhones are issuedwithout regard to the specific investment objectives, financial situation, or particular needsof any specific recipient and are not to be construed as a solicitation or an offer to buy or sellany securities or related financial instruments. Past performance is not necessarily a guideto future results. Company fundamentals and earnings may be mentioned occasionally, butshould not be construed as a recommendation to buy, sell, or hold the company’s stock.Predictions, forecasts, and estimates for any and all markets should not be construed asrecommendations to buy, sell, or hold any security--including mutual funds, futurescontracts, and exchange traded funds, or any similar instruments.
The text, images, and other materials contained or displayed on any Yardeni Research, Inc.product, service, report, email or website are proprietary to Yardeni Research, Inc. andconstitute valuable intellectual property. No material from any part of www.yardeni.com, blog.yardeni.com, and YRI’s Apps for iPads and iPhones may be downloaded, transmitted,broadcast, transferred, assigned, reproduced or in any other way used or otherwisedisseminated in any form to any person or entity, without the explicit written consent ofYardeni Research, Inc. All unauthorized reproduction or other use of material from YardeniResearch, Inc. shall be deemed willful infringement(s) of this copyright and other proprietaryand intellectual property rights, including but not limited to, rights of privacy. YardeniResearch, Inc. expressly reserves all rights in connection with its intellectual property,including without limitation the right to block the transfer of its products and services and/orto track usage thereof, through electronic tracking technology, and all other lawful means,now known or hereafter devised. Yardeni Research, Inc. reserves the right, without furthernotice, to pursue to the fullest extent allowed by the law any and all criminal and civilremedies for the violation of its rights.
The recipient should check any email and any attachments for the presence of viruses.Yardeni Research, Inc. accepts no liability for any damage caused by any virus transmittedby this company’s emails, website, blog and Apps. Additional information available onrequest.