Embed Size (px)
Citation preview

Corrosion properties of AA5083 andAA6082 in seawater - effect oftemperature, pH and potential
Ove Nese
Subsea Technology
Supervisor: Roy Johnsen, IPM
Department of Engineering Design and Materials
Submission date: June 2016
Norwegian University of Science and Technology


i
Preface
This master’s thesis is submitted to the Norwegian University of Science and Technology
(NTNU) as a part of the master’s degree program Subsea Technology at the Department of
Engineering Design and Materials. The project has been a collaboration between NTNU and
Hydro, with Professor Roy Johnsen as the main supervisor.
Acknowledgement
First of all, I would like to thank my supervisor Professor Roy Johnsen for all help and guidance
during the project period. His engagement, helpfulness and availability have been highly
appreciated. I would also like to thank my co-supervisor Dr. Trond Furu.
I would also like to give a special thanks to Cristian Torres.
Trondheim, June 10, 2016
Ove Nese

iii
Abstract
Aluminium is an interesting material for use in subsea structures due to its low weight. So called
corrosion resistant aluminium alloys from the Al-Mg (5xxx)- and Al-Mg-Si (6xxx) series have
been used for many years in ship hulls, and the experiences are good. However, corrosion
failures have been observed. Used for subsea structures, aluminium will in most cases be in
metallic contact with carbon steel or more noble metals, hence galvanic corrosion becomes a
threat. Carbon steel is always connected to a cathodic protection (CP) system in seawater, this
means that the aluminium alloy also will be connected to the CP.
In this study the aluminium alloys accepted in NORSOK for use subsea, AA5083 and AA6082,
have been investigated. AA5083 and AA6082 were tested in natural seawater with temperature
of 10 ± 2 ᵒC and 32 ± 2 ᵒC, and in synthetic seawater (SSW) with adjusted pH at room
temperature. The adjusted pH was 3 and 10. Samples were freely exposed, anodic polarized to
−700 mV vs Ag/AgCl, cathodic polarized to −1500 mV vs Ag/AgCl and coupled to a sacrificial
anode. Recording of potentiodynamic polarization curves, open circuit potentials (OCP) and
current demand was performed during exposure. Surface examination in a scanning electron
microscope (SEM) was also performed.
The results from this study indicate that the temperature affects the corrosion behavior for both
AA5083 and AA6082. Increased temperature increases the severity and rate of corrosion, the
overall effect of temperature tended to be the same for both alloys. The electrochemical
potential had a significant effect on the corrosion behavior. Freely exposed samples and samples
coupled to sacrificial anodes exhibits good resistance to corrosion in seawater, both at 10 ᵒC
and 32 ᵒC. Anodic polarization to −700 mV vs Ag/AgCl and cathodic polarization to −1500
mV vs Ag/AgCl will cause severe corrosion on AA5083 and AA6082. Different pH also affects
the corrosion behavior of AA5083 and AA6082. Both alloys are sensitive to changes in pH, but
the results in this study indicate that AA6082 tended to be less sensitive to low pH than
AA5083. The experimental potential – pH diagram for AA5086, Figure 3, is a good guideline
for AA5083 and AA6082 at seawater conditions (pH 8,2). The diagram can also be used as a
rough guideline for AA5083 and AA6082 at pH 3, but the results showed that it is not valid for
AA5083 and AA6082 at pH 10. After 800 hours of exposure the required cathodic current
density for CP in nearly stagnant natural seawater at 10 ᵒC for AA5083 and AA6082 were −1,8
and −2,3 µA/cm2, respectively. Required cathodic current density for CP in nearly stagnant
natural seawater at 32 ᵒC for AA5083 and AA6082 were −0,75 and −1,7 µA/cm2, respectively.

v
Sammendrag
På grunn av dets lave vekt er aluminium et interessant materiale for bruk i subseastrukturer.
Såkalte korrosjonsbestandige aluminiumslegeringer fra 5xxx (Al-Mg)- og 6xxx (Al-Mg-Si)
seriene har blitt brukt i skipsskrog i mange år, og erfaringene med det er gode. Likevel, svikt
og feil som følge av korrosjon har blitt observert. Brukt i subseastrukturer vil aluminium i de
fleste tilfeller være metallisk koblet til karbonstål eller enda edlere metaller, og da blir galvanisk
korrosjon en trussel for aluminium. I sjøvann vil karbonstål alltid være koblet til et katodisk
beskyttelsessystem, det betyr at også aluminium vil være tilkoblet det katodiske
beskyttelsessystemet.
I denne studien har aluminiumslegeringene, AA5083 og AA6082, som er akseptert i NORSOK
for subseabruk blitt undersøkt. AA5083 og AA6082 ble testet i naturlig sjøvann ved
temperaturene 10 ± 2 o C og 32 ± 2 o C, og i syntetisk sjøvann med justert pH ved romtemperatur.
Den justerte pH var 3 og 10. Prøvene ble fritt eksponert, anodisk polarisert til −700 mV vs
Ag/AgCl, katodisk polarisert til −1500 mV vs Ag/AgCl og koblet mot offeranode. Gjennom
eksponeringstiden ble det tatt opp potensiodynamiske polarisasjonskurver, samt strømbehovet
og åpen krets potensial (OCP) ble logget. De eksponerte overflatene ble også undersøkt i et
skanning elektronmikroskop (SEM).
Resultatene fra denne studien indikerer at temperaturen påvirker korrosjonsoppførselen til både
AA5083 og AA6082. Økt temperatur øker alvorligheten og raten av korrosjonen. Den generelle
effekten av temperatur er den samme for begge legeringene. Det elektrokjemiske potensialet
hadde en markant effekt på korrosjonsoppførselen. Fritt eksponerte prøver og prøver koblet mot
offeranode utøver god korrosjonsbestandighet i sjøvann, både ved 10 og 32 ᵒC. Anodisk
polarisasjon til −700 mV vs Ag/AgCl og katodisk polarisasjon til −1500 mV vs Ag/AgCl fører
til alvorlig korrosjon på AA5083 og AA6082. Forskjellig pH har også en påvirkning på
korrosjonsoppførselen til AA5083 og AA6082. Begge legeringene er sensitive til endringer i
pH, men resultatene indikerer at AA6082 er mindre sensitiv for lav pH enn AA5083. Det
eksperimentelle potensial – pH diagrammet for AA5086, Figure 3, gir en god retningslinje for
AA5083 og AA6082 ved sjøvannsbetingelser (pH 8,2). Diagrammet kan også brukes som en
grov retningslinje for AA5083 og AA6082 ved pH 3, men resultatene viser at det ikke er gyldig
for AA5083 og AA6082 ved pH 10. Etter 800 timers eksponering er den katodiske
strømtettheten som kreves for katodisk beskyttelse i nær stillestående sjøvann ved 10 ᵒC for
AA5083 og AA6082 henholdsvis −1,8 og −2,3 µA/cm2. Katodisk strømtetthet som kreves for
katodisk beskyttelse i nær stillestående sjøvann ved 32 ᵒC for AA5083 og AA6082 er
henholdsvis −0,75 og −1,7 µA/cm2.

vii
Content
Preface ......................................................................................................................................... i
Acknowledgement ................................................................................................................... i
Abstract ..................................................................................................................................... iii
Sammendrag ............................................................................................................................... v
Content ..................................................................................................................................... vii
List of Abbreviations ................................................................................................................. xi
List of Figures ......................................................................................................................... xiii
List of Tables .......................................................................................................................... xvii
1 Introduction ............................................................................................................................. 1
1.1 Background ....................................................................................................................... 1
1.2 Aim of this work ............................................................................................................... 1
2 Theory ..................................................................................................................................... 3
2.1 Aluminium and aluminium alloys .................................................................................... 3
2.1.1 Al-Mg (5xxx) alloys .................................................................................................. 5
2.1.2 Al-Mg-Si (6xxx) alloys .............................................................................................. 5
2.2 Corrosion of aluminium .................................................................................................... 6
2.2.1 Concepts for corrosion of aluminium in seawater ..................................................... 6
2.2.2 Uniform corrosion and pitting corrosion on aluminium ............................................ 9
2.2.3 Crevice corrosion on aluminium .............................................................................. 10
2.2.4 Galvanic corrosion on aluminium ............................................................................ 11
2.2.5 Effect of temperature ............................................................................................... 12
2.2.6 Effect of microstructure and alloying elements ....................................................... 14
2.3 Cathodic protection of aluminium .................................................................................. 16
2.4 Calcareous deposit .......................................................................................................... 18
2.4.1 Formation of calcareous deposit .............................................................................. 18
2.4.2 Microstructure of calcareous deposit ....................................................................... 19
3 Literature Review .................................................................................................................. 21
4 Experimental procedure ........................................................................................................ 23
viii
4.1 Materials ......................................................................................................................... 23
4.2 Test samples ................................................................................................................... 23
4.3 The different conditions and setups ................................................................................ 25
4.3.1 SEALAB .................................................................................................................. 25
4.3.2 Corrosion Laboratory Perleporten ........................................................................... 27
4.4 Measurements ................................................................................................................. 29
4.4.1 SEALAB .................................................................................................................. 29
4.4.2 Corrosion Laboratory Perleporten ........................................................................... 29
4.5 Surface examination ....................................................................................................... 30
5 Results ................................................................................................................................... 31
5.1 SEALAB ......................................................................................................................... 31
5.1.1 Open Circuit Potential .............................................................................................. 31
5.1.2 Current density curves ............................................................................................. 32
5.1.3 Potentiodynamic polarization curves ....................................................................... 35
5.1.4 SEM images and EDS analyses ............................................................................... 40
5.2 Corrosion Laboratory Perleporten .................................................................................. 54
5.2.1 Open Circuit Potential .............................................................................................. 54
5.2.2 Current density curves ............................................................................................. 56
5.2.3 Potentiodynamic polarization curves ....................................................................... 59
5.2.4 SEM images ............................................................................................................. 63
6 Discussion ............................................................................................................................. 65
6.1 Effect of temperature ...................................................................................................... 65
6.1.1 OCP and pitting potential ......................................................................................... 65
6.1.2 Current density ......................................................................................................... 66
6.1.3 Surface examinations ............................................................................................... 68
6.2 Effect of electrochemical potential ................................................................................. 69
6.3 Effect of pH .................................................................................................................... 71
6.3.1 OCP and pitting potential ......................................................................................... 71
6.3.2 Current density ......................................................................................................... 72
6.3.3 Surface examination ................................................................................................. 73

ix
6.4 Effect of exposure time ................................................................................................... 74
6.5 Current density required for protection .......................................................................... 75
6.6 AA5083 vs AA6082 ....................................................................................................... 77
7 Conclusion ............................................................................................................................. 79
8 Suggestions for further work ................................................................................................. 81
References ................................................................................................................................ 83
Appendix A .............................................................................................................................. 87
Hydrogen in aluminium alloys ............................................................................................. 87
Appendix B .............................................................................................................................. 89
Photos of samples after exposure in SEALAB ..................................................................... 89
Appendix C .............................................................................................................................. 93
Potential from sacrificial anode and current density for carbon steel coupled to sacrificial
anode ..................................................................................................................................... 93
Appendix D .............................................................................................................................. 95
Complete polarization curves for AA6082 exposed at 10 ᵒC and 32 ᵒC .............................. 95
Appendix E ............................................................................................................................... 97
SEM images of samples prior to exposure ........................................................................... 97
Appendix F ............................................................................................................................... 99
EDS analysis of corrosion products on samples polarized to −1500 mV vs Ag/AgCl ........ 99
Appendix G ............................................................................................................................ 101
OCP and current density for samples exposed in SSW with pH 8,2 .................................. 101
Appendix H ............................................................................................................................ 103
Potentiodynamic polarization curves for pH 3 and 10 ....................................................... 103
Appendix I .............................................................................................................................. 107
Risk assessment .................................................................................................................. 107


xi
List of Abbreviations
AA Aluminium Association standard
β Equilibrium phase in Al-Mg (5xxx) alloys
CP Cathodic protection
CS Carbon steel (used in figures and tables)
DNV Det Norske Veritas
E Potential
Ecorr Corrosion potential
EOCP Open Circuit Potential
Epit Pitting potential
EDS Energy-Dispersive Spectroscopy
EN AW European standard
FCC Face-Centered Cubic
FSW Friction Stir Welding
HAZ Heat Affected Zone
HISC Hydrogen Induced Stress Cracking
i Current density
ipass Passive current density
IGC Intergranular corrosion
MIG Metal Inert Gas
NTNU Norwegian University of Science and Technology
OCP Open Circuit Potential
Rm Tensile strength
Rp0,2 Yield strength
SCC Stress Corrosion Cracking
SCE Saturated Calomel Reference Electrode
SEM Scanning Electron Microscope
SiC Silicon Carbide
SSW Synthetic Seawater
SWAAT Cyclic Acidified Synthetic Seawater (Fog) Testing
T Temperature
wt% Weight percent
ΔE Potential drop
ΔEpit-OCP Difference between pitting potential and OCP

xiii
List of Figures
Figure 1: Wrought aluminium alloys correlated to their main alloying elements and strengthening
categories [10]. ........................................................................................................................................ 3
Figure 2: Pourbaix diagram for aluminium. Modified from [12]. ........................................................... 7
Figure 3: Experimental potential - pH diagram for alloy 5086 in chloride solution [12]. ...................... 8
Figure 4: Typical pits on aluminium alloys. a) AA6061, b) AA5456 [18]. ............................................ 8
Figure 5: Schematic illustration of localized corrosion on aluminium alloys [12]. .............................. 10
Figure 6: Simple sketch of crevice corrosion [23]. ............................................................................... 11
Figure 7: The effect of temperature on the passivity of aluminium [24]............................................... 12
Figure 8: Temperature effect on the critical pitting potential [26]. ....................................................... 13
Figure 9: Temperature effect on pitting potential in chloride containing solutions [27]. ...................... 13
Figure 10: Cathodic polarization curves of freshly exposed aluminium and steel samples at a flow rate
of 8 cm/s [34]. ....................................................................................................................................... 17
Figure 11: Schematic representation of typical current – time behavior of an aluminium alloy during
cathodic polarization at a constant potential [34]. ................................................................................. 17
Figure 12: Detachment and isolation of an intermetallic particle during CP [12]. ................................ 18
Figure 13: CaCO3 microstructures, aragonite (left) and calcite (right) [41]. ......................................... 19
Figure 14: SEM photograph of Mg(OH)2 deposit [42]. ........................................................................ 19
Figure 15: Painted and grinded sample. ................................................................................................ 24
Figure 16: Sample ready for exposure. .................................................................................................. 25
Figure 17: Easy-to-understand illustration of the experimental setup. .................................................. 26
Figure 18: Overview photo SEALAB. .................................................................................................. 27
Figure 19: Experimental setup in the corrosion laboratory. .................................................................. 28
Figure 20: Cross-section polished to mirror quality. ............................................................................. 30
Figure 21: Development in OCP for freely exposed AA5083 and AA6082 in natural seawater. ......... 31
Figure 22: Current density for samples anodic polarized to −700 mV vs Ag/AgCl. ............................ 33
Figure 23: Current density for the samples coupled to sacrificial anode (potential of approximately
−1050 mV vs Ag/AgCl) ........................................................................................................................ 34
Figure 24: Current density for samples cathodic polarized to −1500 mV vs Ag/AgCl. ....................... 35
Figure 25: Recorded anodic- and cathodic polarization curves for the freely exposed AA5083 sample
at 10 ᵒC, the complete polarization curve recorded at the end of the exposure time is also included. AD
and CD means anodic direction and cathodic direction, respectively. CC means the complete
polarization curve. All the curves were recorded on the same sample. ................................................. 36
Figure 26: Recorded anodic- and cathodic polarization curves for the freely exposed AA5083 sample
at 32 ᵒC, the complete polarization curve recorded at the end of the exposure time is also included. AD
and CD means anodic direction and cathodic direction, respectively. CC means the complete
polarization curve. All the curves were recorded on the same sample. ................................................. 37
Figure 27: Recorded anodic- and cathodic polarization curves for the freely exposed AA6082 sample
at 10 ᵒC, the complete polarization curve recorded at the end of the exposure time is also included. AD
and CD means anodic direction and cathodic direction, respectively. CC means the complete
polarization curve. A new sample, that only had been freely exposed for 1000 hours, was used for
recording the complete polarization curves. .......................................................................................... 38

xiv
Figure 28: Recorded anodic- and cathodic polarization curves for the freely exposed AA6082 sample
at 32 ᵒC, the complete polarization curve recorded at the end of the exposure time is also included. AD
and CD means anodic direction and cathodic direction, respectively. CC means the complete
polarization curve. A new sample, that only had been freely exposed for 1000 hours, was used for
recording the complete polarization curves. .......................................................................................... 39
Figure 29: SEM image of an AA5083 sample freely exposed in natural seawater at 10 ᵒC. An EDS
analysis is performed for the pit inside the marked area. ...................................................................... 41
Figure 30: EDS spectra for the marked area in Figure 29. .................................................................... 41
Figure 31: SEM images and EDS spectra of freely exposed AA5083 in natural seawater at 32 ᵒC. .... 42
Figure 32: SEM images and EDS spectra for freely exposed AA6082 in natural seawater at 10 ᵒC. ... 43
Figure 33: SEM image and EDS spectra for AA6082 freely exposed in natural seawater at 32 ᵒC. .... 44
Figure 34: SEM images of cross-sections of the freely exposed samples in SEALAB, a) AA5083 at 10
ᵒC, b) AA5083 at 32 ᵒC, c) AA6082 at 10 ᵒC and d) AA6082 at 32 ᵒC. Note that the magnification is
not the same for all the images. Image a) is from another SEM. .......................................................... 45
Figure 35: SEM images of AA5083 anodic polarized to −700 mV vs Ag/AgCl in natural seawater in
SEALAB. a) and b) at 10 ᵒC, and c) and d) at 32 ᵒC. ............................................................................ 46
Figure 36: SEM images and EDS of AA6082 anodic polarized to −700 mV vs Ag/AgCl in natural
seawater in SEALAB. Image a) and b) for 10 ᵒC and c), d) and e) for 32 ᵒC. ...................................... 47
Figure 37: Crevice formed beneath the coating. ................................................................................... 48
Figure 38: SEM image of crystallographic pitting on the cross-section of AA6082 anodic polarized to
−700 mV vs Ag/AgCl at 32 ᵒC. ............................................................................................................. 48
Figure 39: SEM images of AA5083 coupled to sacrificial anode in natural seawater, a) at 10 ᵒC and b)
at 32 ᵒC. ................................................................................................................................................. 49
Figure 40: SEM images and EDS spectra for AA6082 coupled to a sacrificial anode in natural
seawater, a) and c) at 10 ᵒC, and b) and d) at 32 ᵒC. .............................................................................. 50
Figure 41: SEM images of the cross-sections for the samples coupled to a sacrificial anode; a)
AA5083 at 32 ᵒC, b) AA6082 at 10 ᵒC and c) AA6082 at 32 ᵒC. .......................................................... 51
Figure 42: SEM images of the samples cathodic polarized to −1500 mV vs Ag/AgCl in natural
seawater, a) AA5083 at 10 ᵒC, b) AA5083 at 32 ᵒC and c) AA6082 at 32 ᵒC....................................... 52
Figure 43: SEM images of the cross-sections of the samples cathodic polarized to −1500 mV vs
Ag/AgCl; a) AA5083 at 10 ᵒC, b) AA5083 at 32 ᵒC and c) AA6082 at 32 ᵒC. ..................................... 53
Figure 44: OCP for freely exposed AA5083 and AA6082 in SSW with pH 3 at room temperature. ... 54
Figure 45: OCP for freely exposed AA5083 and AA6082 in SSW with pH 10 at room temperature. . 55
Figure 46: Current density for samples anodic polarized to −700 mV vs Ag/AgCl in SSW with pH 3.
............................................................................................................................................................... 56
Figure 47: Current density for samples anodic polarized to −700 mV vs Ag/AgCl in SSW with pH 10.
............................................................................................................................................................... 56
Figure 48: Current density for the samples cathodic polarized to −1050 mV vs Ag/AgCl in SSW with
pH 3. ...................................................................................................................................................... 57
Figure 49: Current density for the samples cathodic polarized to −1050 mV vs Ag/AgCl in SSW with
pH 10. .................................................................................................................................................... 57
xv
Figure 50: Current density for the samples cathodic polarized to −1500 mV vs Ag/AgCl in SSW with
pH 3. ...................................................................................................................................................... 58
Figure 51: Current density for the samples cathodic polarized to −1500 mV vs Ag/AgCl in SSW with
pH 10. .................................................................................................................................................... 58
Figure 52: Complete polarization curves recorded for AA5083 after 24 hours exposure in SSW at
room temperature. ................................................................................................................................. 59
Figure 53: Complete polarization curves recorded for AA5083 after 168 hours exposure in SSW at
room temperature. ................................................................................................................................. 60
Figure 54: Complete polarization curves recorded for AA6082 after 24 hours exposure in SSW at
room temperature. ................................................................................................................................. 61
Figure 55: Complete polarization curves recorded for AA6082 after 168 hours exposure in SSW at
room temperature. ................................................................................................................................. 62
Figure 56: SEM images of AA5083 freely exposed in SSW with different pH-values, a) pH 3, b) pH
8,2 and c) pH 10. ................................................................................................................................... 63
Figure 57: SEM images of AA6082 freely exposed in SSW with different pH-values, a) pH 3, b) pH
8,2 and c) pH 10. ................................................................................................................................... 64
Figure 58: The three important factors for hydrogen embrittlement/HISC [53]. .................................. 87
Figure 59: Freely exposed samples in natural seawater at 10 ᵒC in SEALAB; a) AA5083 and b)
AA6082. ................................................................................................................................................ 89
Figure 60: Samples anodic polarized to −700 mV vs Ag/AgCl in natural seawater at 10 ᵒC in
SEALAB; a) AA5083 and b) AA6082. ................................................................................................. 89
Figure 61: Samples polarized coupled to a sacrificial anode (approximately −1050 mV vs Ag/AgCl) in
natural seawater at 10 ᵒC in SEALAB; a) AA5083 and b) AA6082. .................................................... 89
Figure 62: Samples cathodic polarized to −1500 mV vs Ag/AgCl in natural seawater at 10 ᵒC in
SEALAB; a) AA5083 and b) AA6082. ................................................................................................. 90
Figure 63: Freely exposed samples in natural seawater at 32 ᵒC in SEALAB; a) AA5083 and b)
AA6082. ................................................................................................................................................ 90
Figure 64: Samples anodic polarized to −700 mV vs Ag/AgCl in natural seawater at 32 ᵒC in
SEALAB; a) AA5083 and b) AA6082. ................................................................................................. 90
Figure 65: Samples polarized coupled to a sacrificial anode (approximately −1050 mV vs Ag/AgCl) in
natural seawater at 10 ᵒC in SEALAB; a) AA5083 and b) AA6082. .................................................... 91
Figure 66: Samples cathodic polarized to −1580 mV vs Ag/AgCl in natural seawater at 32 ᵒC in
SEALAB; a) AA5083 and b) AA6082. ................................................................................................. 91
Figure 67: Potential from the sacrificial anode used in the experiments performed in SEALAB. ....... 93
Figure 68: Current density for carbon steel coupled to sacrificial anode in SEALAB. ........................ 93
Figure 69: Complete polarization curves for AA6082 exposed at 10 ᵒC and 32 ᵒC in natural seawater.
............................................................................................................................................................... 95
Figure 70: AA5083 sample prior to exposure. ...................................................................................... 97
Figure 71: AA6082 sample prior to exposure. ...................................................................................... 97
Figure 72: EDS analysis of corrosion products on AA5083 polarized to −1500 mV vs Ag/AgCl at 10
ᵒC. Image a) is a SEM image of an area on the surface, b) indicates the composition of the same area.
............................................................................................................................................................... 99
xvi
Figure 73: EDS analysis of corrosion products on AA5083 polarized to −1500 mV vs Ag/AgCl at 32
ᵒC. Image a) is a SEM image of an area on the surface, b) indicates the composition of the same area.
............................................................................................................................................................. 100
Figure 74: EDS analysis of corrosion products on AA6082 polarized to −1500 mV vs Ag/AgCl at 32
ᵒC. Image a) is a SEM image of an area on the surface, b) indicates the composition of the same area.
............................................................................................................................................................. 100
Figure 75: OCP for freely exposed AA5083 and AA6082 in SSW with pH 8,2 at room temperature.
............................................................................................................................................................. 101
Figure 76: Current density for AA5083 and AA6082 polarized to −700 mV vs Ag/AgCl in SSW with
pH 8,2. ................................................................................................................................................. 101
Figure 77: Current density for AA5083 and AA6082 coupled to a sacrificial anode (ca −1050 mV vs
Ag/AgCl) in SSW with pH 8,2. ........................................................................................................... 102
Figure 78: Current density for AA5083 and AA6082 polarized to −1500 mV vs Ag/AgCl in SSW with
pH 8,2. ................................................................................................................................................. 102
Figure 79: Potentiodynamic polarization curves for AA5083 in SSW with pH 3 after 24 hours and 168
hours of exposure. ............................................................................................................................... 103
Figure 80: Potentiodynamic polarization curves for AA6082 in SSW with pH 3 after 24 hours and 168
hours of exposure. ............................................................................................................................... 104
Figure 81: Potentiodynamic polarization curves for AA5083 in SSW with pH 10 after 24 hours and
168 hours of exposure. ........................................................................................................................ 104
Figure 82: Potentiodynamic polarization curves for AA6082 in SSW with pH 10 after 24 hours and
168 hours of exposure. ........................................................................................................................ 105

xvii
List of Tables
Table 1: The basic temper groupings [11]. .............................................................................................. 4
Table 2: Important T-tempers for heat-treatable alloys [7]. .................................................................... 4
Table 3: Overview of strain-hardened tempers [11]. ............................................................................... 4
Table 4: Selected mechanical properties for the Al-Mg (5xxx) alloys [7]. ............................................. 5
Table 5: Selected mechanical properties for Al-Mg-Si (6xxx) alloys [7]. .............................................. 5
Table 6: Overview of corrosion potential (OCP), Ecorr, for intermetallic particles common to
aluminium alloys in chloride containing solutions [28]. ....................................................................... 14
Table 7: Chemical composition (wt%) of the alloys in this study. ........................................................ 23
Table 8: Characteristic values for AA5083 during anodic- and cathodic polarization after 168 hours
(one week) and 1000 hours (six weeks) of exposure............................................................................. 40
Table 9: Characteristic values for AA6082 during anodic- and cathodic polarization after 168 hours
(one week) and 1000 hours (six weeks) of exposure............................................................................. 40
Table 10: EDS analysis of the marked area in Figure 29. ..................................................................... 41
Table 11: EDS analysis of the freely exposed AA5083 in Figure 31. ................................................... 42
Table 12: EDS analysis for the indicated pit in image b) in Figure 32. ................................................ 43
Table 13: Results of EDS of the indicated pits in image a) in Figure 33. ............................................. 44
Table 14: Results from EDS of marked areas in Figure 39. .................................................................. 49
Table 15: Characteristic values for AA5083 during anodic- and cathodic polarization after 1 day (24
hours) and 1 week (168 hours) of exposure. ......................................................................................... 62
Table 16: Characteristic values for AA6082 during anodic- and cathodic polarization after 1 day (24
hours) and 1 week (168 hours) of exposure. ......................................................................................... 62
Table 17: Current density values, i [µA/cm2], for the samples coupled to a sacrificial anode in natural
seawater. ................................................................................................................................................ 76


Chapter 1 Introduction
1
1 Introduction
1.1 Background
Due to today’s low oil price there is a demand for cost effective solutions in the offshore oil
and gas industry. This makes aluminium an interesting material, and due to its low weight the
interest for using aluminium in subsea structures has increased during the last years. The density
of aluminium is approximately 1/3 compared to steel; this allows for considerable weight
savings.
So called corrosion resistant aluminium alloys from the Al-Mg (5xxx)- and Al-Mg-Si (6xxx)
series have been used for many years in ship hulls, and the experiences are good. However,
corrosion failures have been observed [1, 2]. The main problem is connection to more noble
metals e.g. carbon steel, stainless steel and copper alloys, that will cause galvanic corrosion on
aluminium [3]. Used for subsea structures, aluminium will in most cases be in metallic contact
with carbon steel (and even with more noble metals). Carbon steel is always connected to a
cathodic protection (CP) system in seawater [4], which means that the aluminium alloy also
will be connected to the CP system.
AA5083 and AA6082 are the most frequently used aluminium alloys for seawater applications,
and also the recommended ones according to NORSOK [5]. In the literature, limited detailed
information is published about the behavior of AA5083 and AA6082 under CP in seawater. It
is known that both temperature, electrochemical potential and pH affects the corrosion behavior
of these alloys.
1.2 Aim of this work
The aim of this study is to examine the behavior of the aluminium alloys AA5083 and AA6082
under different conditions in natural seawater. Samples will be exposed to natural seawater at
two different temperatures (10 ± 2 ᵒC and 32 ± 2 ᵒC) under different conditions (freely exposed
and at different fixed electrochemical potentials). In addition, to study the effect of pH will
samples under the same conditions be exposed to synthetic seawater (SSW) with pH-values: 3,
8,2 and 10. Recording of potentiodynamic polarization curves, current requirements and open
circuit potentials (OCP), in addition to surface examinations will be included in an effort to
examine the corrosion behavior.

Chapter 2 Theory
3
2 Theory
2.1 Aluminium and aluminium alloys
Aluminium is a silvery-white, soft, non-magnetic and ductile metal. Aluminium has a face-
centered cubic (FCC) crystal structure [6]. Aluminium and its alloys have an excellent
combination of properties such as low weight, good corrosion resistance, high ductility,
formability, electrical and thermal conductivity [7]. The strength and hardness of pure
aluminium are relatively low. Thus, aluminium is seldom used in its pure form. Aluminium is
usually alloyed with elements to increase physical properties such as strength and hardness. The
modulus of elasticity for aluminium is 69 GPa [8].
Age hardening and strain hardening (work hardening) can increase the strength and hardness of
the aluminium alloys. The age hardenable alloys achieve strength through controlled
precipitation during heat treatment and/or through solution heat treatment. Non-heat treatable
alloys normally obtain strength from work hardening, the strength is increased because of
movement of dislocations and generation of new dislocations within the crystal structure of the
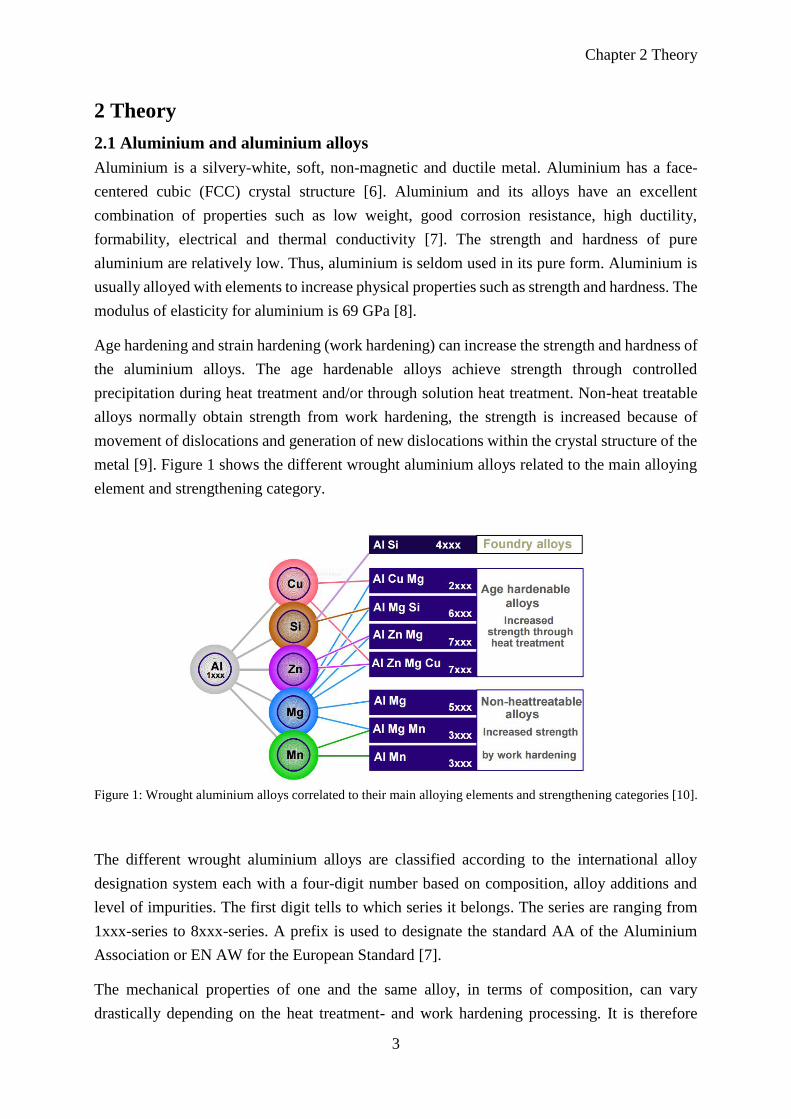
metal [9]. Figure 1 shows the different wrought aluminium alloys related to the main alloying
element and strengthening category.
Figure 1: Wrought aluminium alloys correlated to their main alloying elements and strengthening categories [10].
The different wrought aluminium alloys are classified according to the international alloy
designation system each with a four-digit number based on composition, alloy additions and
level of impurities. The first digit tells to which series it belongs. The series are ranging from
1xxx-series to 8xxx-series. A prefix is used to designate the standard AA of the Aluminium
Association or EN AW for the European Standard [7].
The mechanical properties of one and the same alloy, in terms of composition, can vary
drastically depending on the heat treatment- and work hardening processing. It is therefore
2.1 Aluminium and aluminium alloys
4
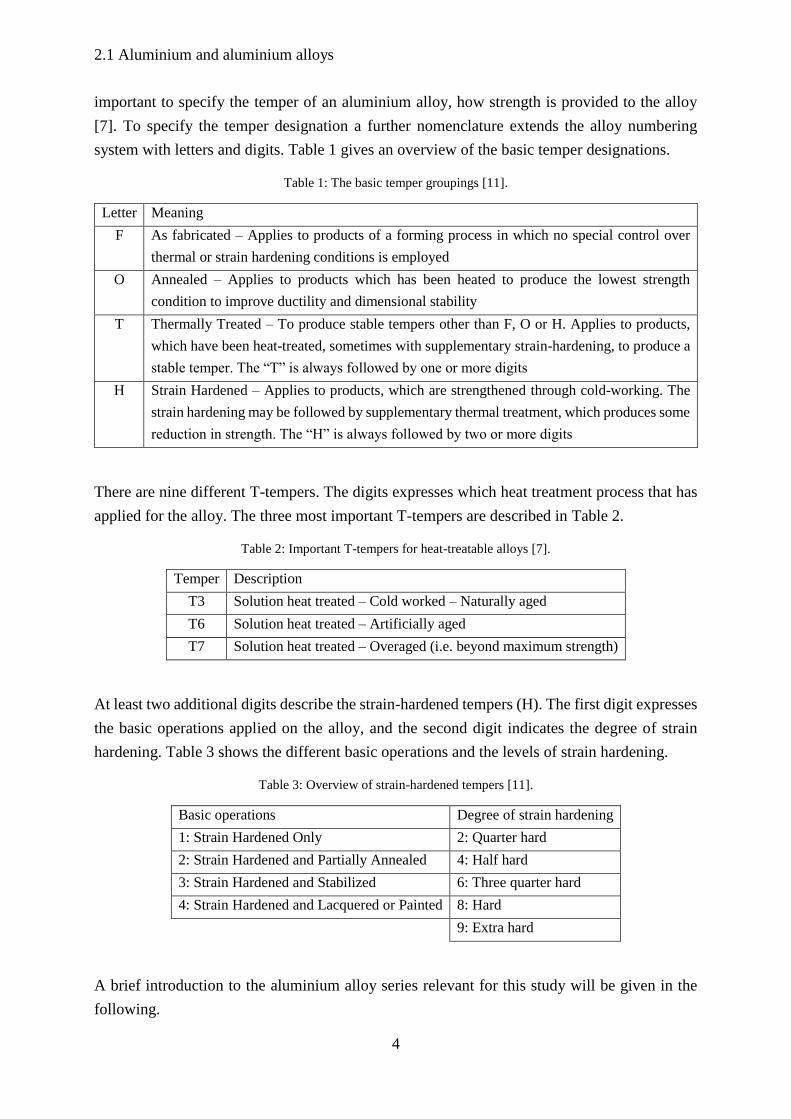
important to specify the temper of an aluminium alloy, how strength is provided to the alloy
[7]. To specify the temper designation a further nomenclature extends the alloy numbering
system with letters and digits. Table 1 gives an overview of the basic temper designations.
Table 1: The basic temper groupings [11].
Letter Meaning
F As fabricated – Applies to products of a forming process in which no special control over
thermal or strain hardening conditions is employed
O Annealed – Applies to products which has been heated to produce the lowest strength
condition to improve ductility and dimensional stability
T Thermally Treated – To produce stable tempers other than F, O or H. Applies to products,
which have been heat-treated, sometimes with supplementary strain-hardening, to produce a
stable temper. The “T” is always followed by one or more digits
H Strain Hardened – Applies to products, which are strengthened through cold-working. The
strain hardening may be followed by supplementary thermal treatment, which produces some
reduction in strength. The “H” is always followed by two or more digits
There are nine different T-tempers. The digits expresses which heat treatment process that has
applied for the alloy. The three most important T-tempers are described in Table 2.
Table 2: Important T-tempers for heat-treatable alloys [7].
Temper Description
T3 Solution heat treated – Cold worked – Naturally aged
T6 Solution heat treated – Artificially aged
T7 Solution heat treated – Overaged (i.e. beyond maximum strength)
At least two additional digits describe the strain-hardened tempers (H). The first digit expresses
the basic operations applied on the alloy, and the second digit indicates the degree of strain
hardening. Table 3 shows the different basic operations and the levels of strain hardening.
Table 3: Overview of strain-hardened tempers [11].
Basic operations Degree of strain hardening
1: Strain Hardened Only 2: Quarter hard
2: Strain Hardened and Partially Annealed 4: Half hard
3: Strain Hardened and Stabilized 6: Three quarter hard
4: Strain Hardened and Lacquered or Painted 8: Hard
9: Extra hard
A brief introduction to the aluminium alloy series relevant for this study will be given in the
following.
Chapter 2 Theory
5
2.1.1 Al-Mg (5xxx) alloys
The alloys in this series are the so-called seawater-resistant alloys [12]. Alloys of this series are
moderate in strength. These alloys are non-heat treatable, thus the strength is normally obtained
through work hardening. Alloys of this series have good resistance to corrosion in aggressive
environments and seawater. However, they become susceptible to intergranular corrosion
(IGC) if the Mg content exceeds 4,5% [12], some literature say 3,5% [3], this is further
discussed in Section 2.2.7. Mg is the main alloying element and the Mg additions are ranging
from 0,2 – 6,2% [11], elements like Si, Fe, Mn, Cr, Cu and Zn are also included [13].
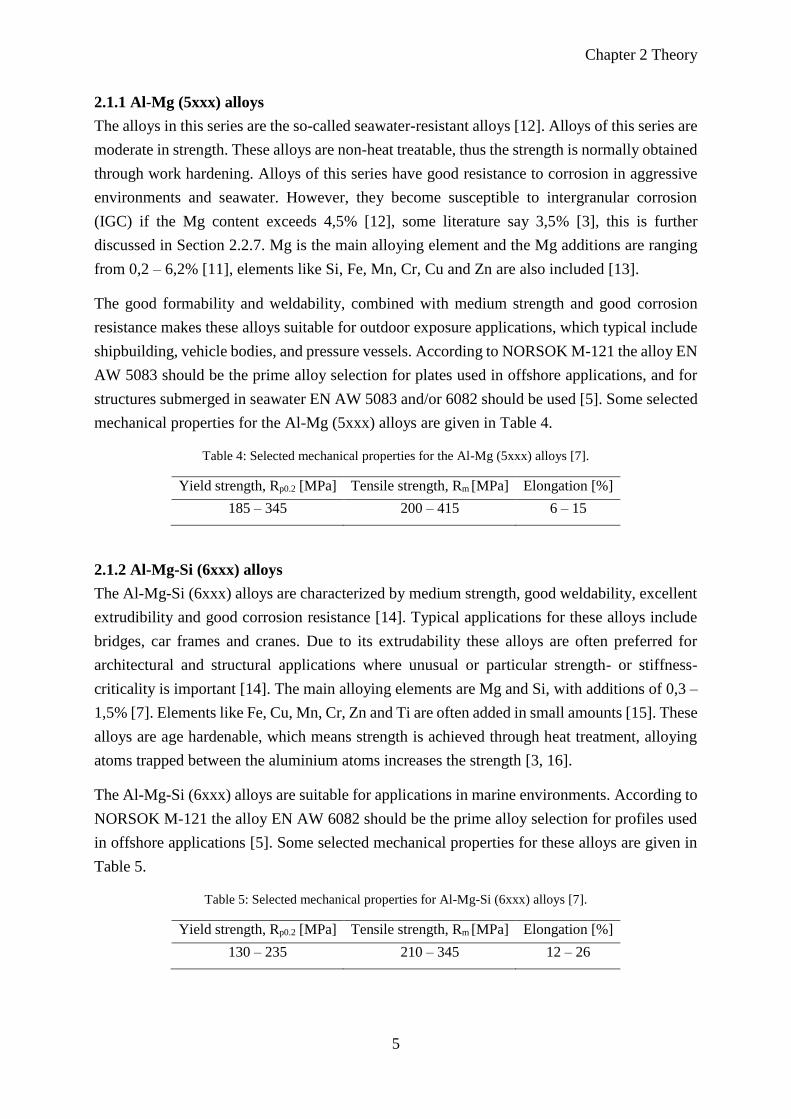
The good formability and weldability, combined with medium strength and good corrosion
resistance makes these alloys suitable for outdoor exposure applications, which typical include
shipbuilding, vehicle bodies, and pressure vessels. According to NORSOK M-121 the alloy EN
AW 5083 should be the prime alloy selection for plates used in offshore applications, and for
structures submerged in seawater EN AW 5083 and/or 6082 should be used [5]. Some selected
mechanical properties for the Al-Mg (5xxx) alloys are given in Table 4.
Table 4: Selected mechanical properties for the Al-Mg (5xxx) alloys [7].
Yield strength, Rp0.2 [MPa] Tensile strength, Rm [MPa] Elongation [%]
185 – 345 200 – 415 6 – 15
2.1.2 Al-Mg-Si (6xxx) alloys
The Al-Mg-Si (6xxx) alloys are characterized by medium strength, good weldability, excellent
extrudibility and good corrosion resistance [14]. Typical applications for these alloys include
bridges, car frames and cranes. Due to its extrudability these alloys are often preferred for
architectural and structural applications where unusual or particular strength- or stiffness-
criticality is important [14]. The main alloying elements are Mg and Si, with additions of 0,3 –
1,5% [7]. Elements like Fe, Cu, Mn, Cr, Zn and Ti are often added in small amounts [15]. These
alloys are age hardenable, which means strength is achieved through heat treatment, alloying
atoms trapped between the aluminium atoms increases the strength [3, 16].
The Al-Mg-Si (6xxx) alloys are suitable for applications in marine environments. According to
NORSOK M-121 the alloy EN AW 6082 should be the prime alloy selection for profiles used
in offshore applications [5]. Some selected mechanical properties for these alloys are given in
Table 5.
Table 5: Selected mechanical properties for Al-Mg-Si (6xxx) alloys [7].
Yield strength, Rp0.2 [MPa] Tensile strength, Rm [MPa] Elongation [%]
130 – 235 210 – 345 12 – 26
2.2 Corrosion of aluminium
6
As mentioned, both the Al-Mg (5xxx) - and the Al-Mg-Si (6xxx) alloys have good weldability.
The welding process will affect the properties of the base material in an area near the deposited
metal (filler alloy) due to the heating that occurs during welding. This area is called the heat-
affected zone (HAZ), and heat-treated and work hardened aluminium alloys, e.g. 5xxx- and
6xxx series, will develop a weakness in the HAZ. This subject will not be further discussed in
this report.
2.2 Corrosion of aluminium
Corrosion may be a problem for materials, especially in marine environments and seawater. In
general, aluminium is known to be resistant to corrosion in most environments due to its
protective oxide, but the corrosion properties will vary according to alloy, environmental
parameters, protective actions, etc.
2.2.1 Concepts for corrosion of aluminium in seawater
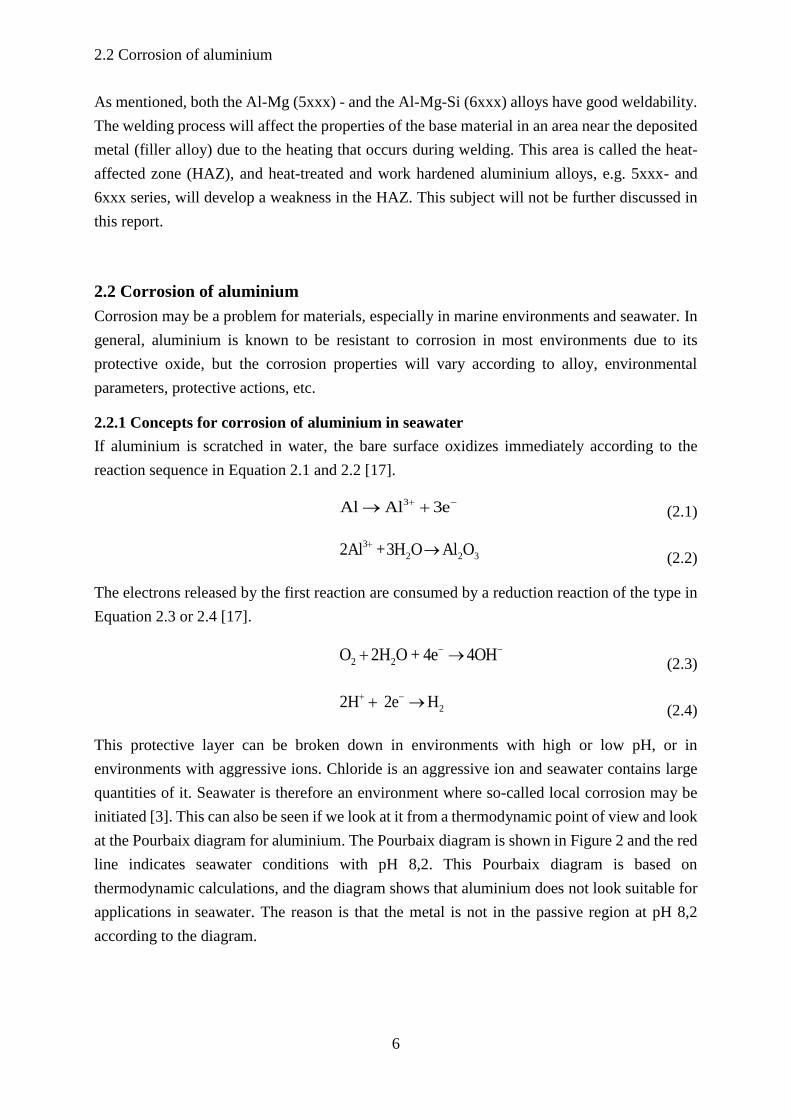
If aluminium is scratched in water, the bare surface oxidizes immediately according to the
reaction sequence in Equation 2.1 and 2.2 [17].
3Al Al 3e (2.1)
3
2 2 32Al +3H O Al O (2.2)
The electrons released by the first reaction are consumed by a reduction reaction of the type in
Equation 2.3 or 2.4 [17].
2 2O 2H O + 4e 4OH (2.3)
22H 2e H (2.4)
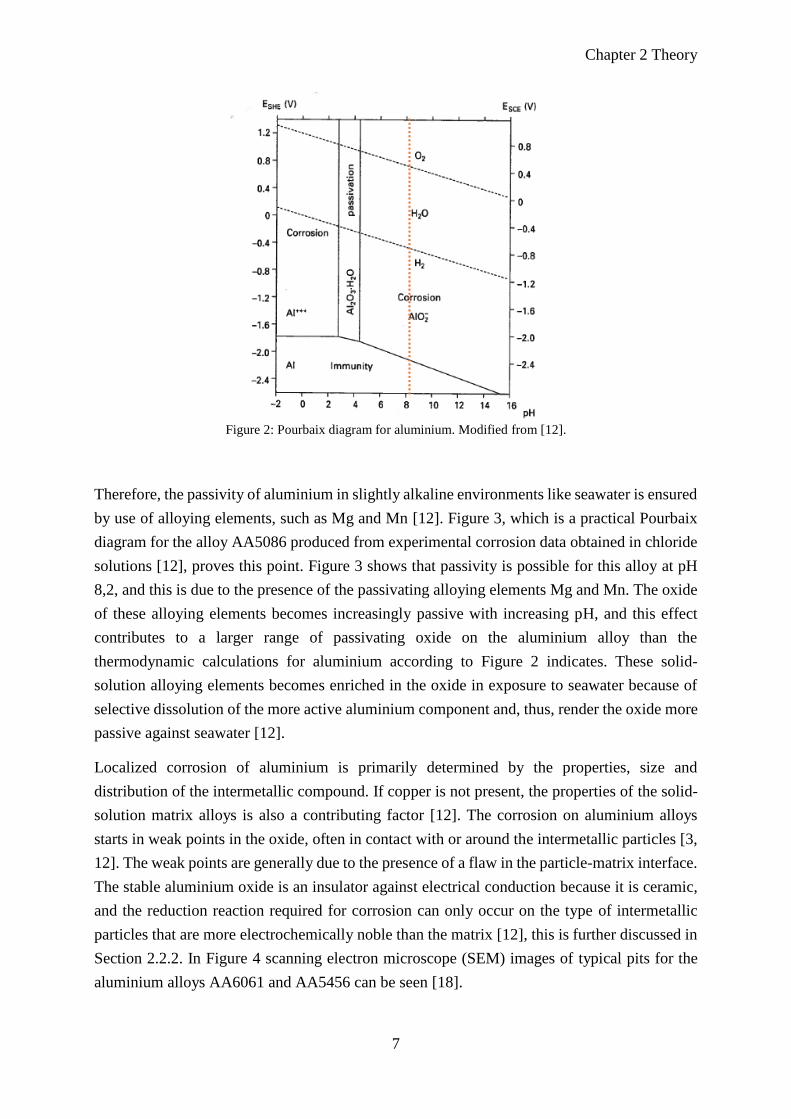
This protective layer can be broken down in environments with high or low pH, or in
environments with aggressive ions. Chloride is an aggressive ion and seawater contains large
quantities of it. Seawater is therefore an environment where so-called local corrosion may be
initiated [3]. This can also be seen if we look at it from a thermodynamic point of view and look
at the Pourbaix diagram for aluminium. The Pourbaix diagram is shown in Figure 2 and the red
line indicates seawater conditions with pH 8,2. This Pourbaix diagram is based on
thermodynamic calculations, and the diagram shows that aluminium does not look suitable for
applications in seawater. The reason is that the metal is not in the passive region at pH 8,2
according to the diagram.
Chapter 2 Theory
7
Figure 2: Pourbaix diagram for aluminium. Modified from [12].
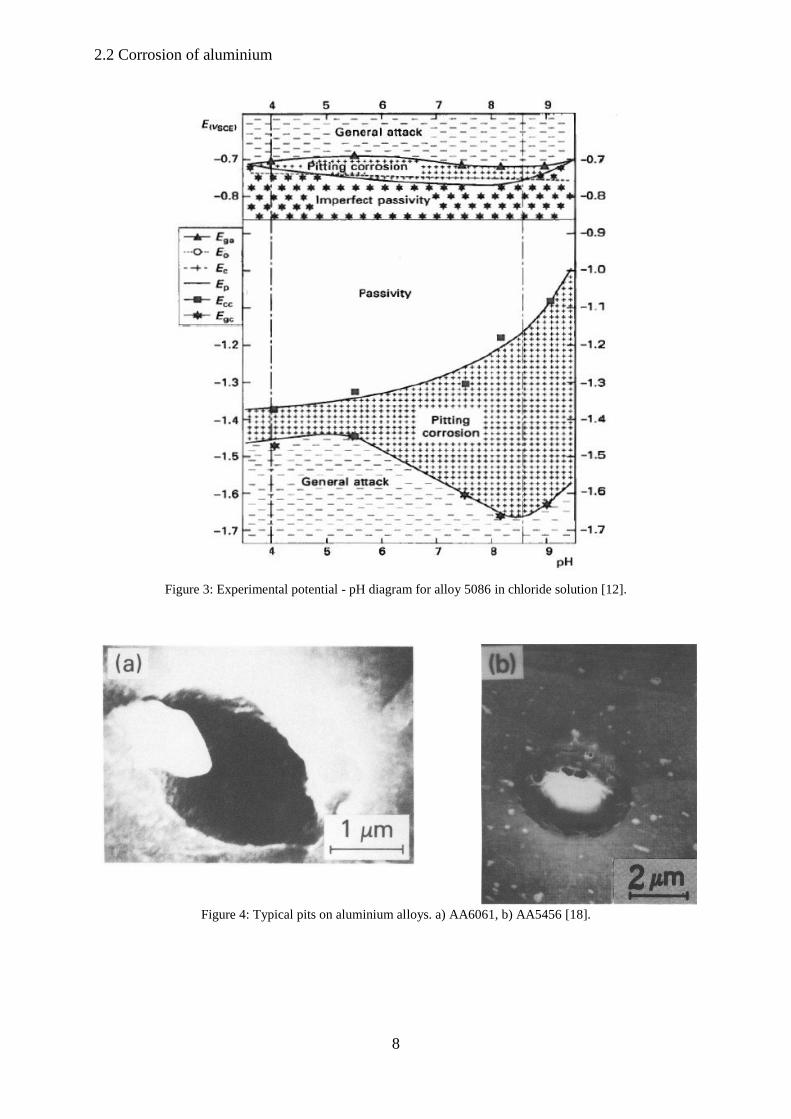
Therefore, the passivity of aluminium in slightly alkaline environments like seawater is ensured
by use of alloying elements, such as Mg and Mn [12]. Figure 3, which is a practical Pourbaix
diagram for the alloy AA5086 produced from experimental corrosion data obtained in chloride
solutions [12], proves this point. Figure 3 shows that passivity is possible for this alloy at pH
8,2, and this is due to the presence of the passivating alloying elements Mg and Mn. The oxide
of these alloying elements becomes increasingly passive with increasing pH, and this effect
contributes to a larger range of passivating oxide on the aluminium alloy than the
thermodynamic calculations for aluminium according to Figure 2 indicates. These solid-
solution alloying elements becomes enriched in the oxide in exposure to seawater because of
selective dissolution of the more active aluminium component and, thus, render the oxide more
passive against seawater [12].
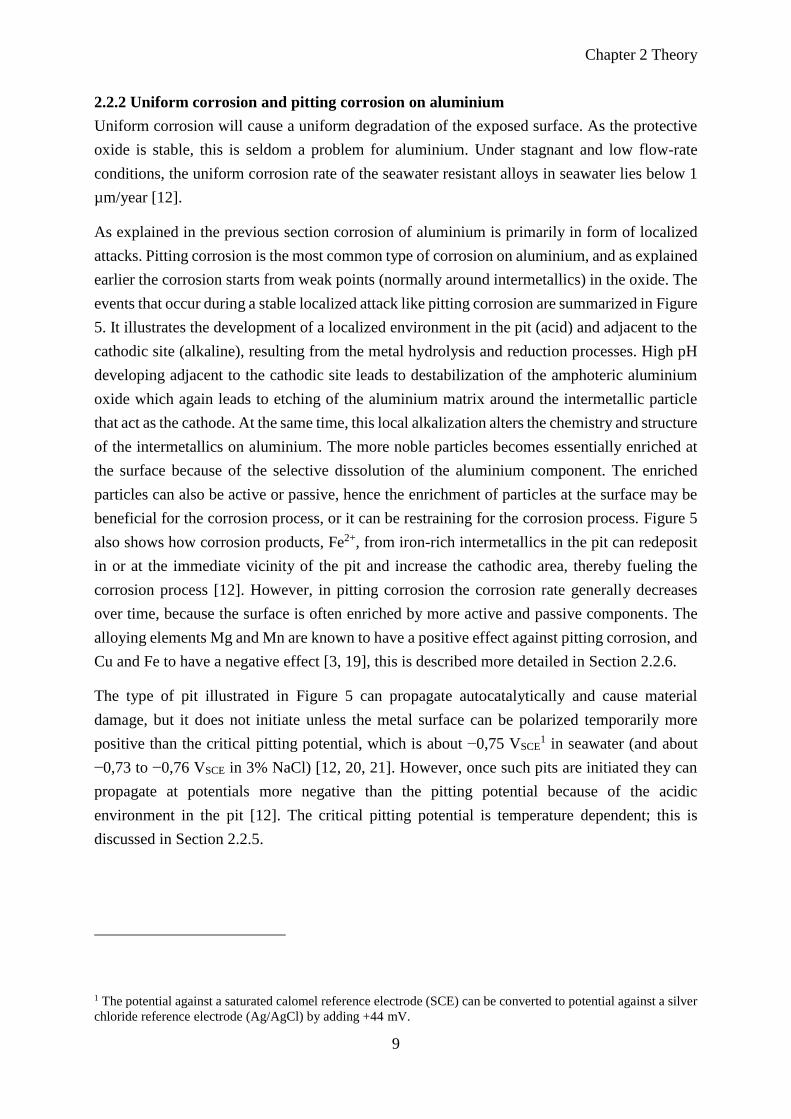
Localized corrosion of aluminium is primarily determined by the properties, size and
distribution of the intermetallic compound. If copper is not present, the properties of the solid-
solution matrix alloys is also a contributing factor [12]. The corrosion on aluminium alloys
starts in weak points in the oxide, often in contact with or around the intermetallic particles [3,
12]. The weak points are generally due to the presence of a flaw in the particle-matrix interface.
The stable aluminium oxide is an insulator against electrical conduction because it is ceramic,
and the reduction reaction required for corrosion can only occur on the type of intermetallic
particles that are more electrochemically noble than the matrix [12], this is further discussed in
Section 2.2.2. In Figure 4 scanning electron microscope (SEM) images of typical pits for the
aluminium alloys AA6061 and AA5456 can be seen [18].
2.2 Corrosion of aluminium
8
Figure 3: Experimental potential - pH diagram for alloy 5086 in chloride solution [12].
Figure 4: Typical pits on aluminium alloys. a) AA6061, b) AA5456 [18].
Chapter 2 Theory
9
2.2.2 Uniform corrosion and pitting corrosion on aluminium
Uniform corrosion will cause a uniform degradation of the exposed surface. As the protective
oxide is stable, this is seldom a problem for aluminium. Under stagnant and low flow-rate
conditions, the uniform corrosion rate of the seawater resistant alloys in seawater lies below 1
µm/year [12].
As explained in the previous section corrosion of aluminium is primarily in form of localized
attacks. Pitting corrosion is the most common type of corrosion on aluminium, and as explained
earlier the corrosion starts from weak points (normally around intermetallics) in the oxide. The
events that occur during a stable localized attack like pitting corrosion are summarized in Figure
5. It illustrates the development of a localized environment in the pit (acid) and adjacent to the
cathodic site (alkaline), resulting from the metal hydrolysis and reduction processes. High pH
developing adjacent to the cathodic site leads to destabilization of the amphoteric aluminium
oxide which again leads to etching of the aluminium matrix around the intermetallic particle
that act as the cathode. At the same time, this local alkalization alters the chemistry and structure
of the intermetallics on aluminium. The more noble particles becomes essentially enriched at
the surface because of the selective dissolution of the aluminium component. The enriched
particles can also be active or passive, hence the enrichment of particles at the surface may be
beneficial for the corrosion process, or it can be restraining for the corrosion process. Figure 5
also shows how corrosion products, Fe2+, from iron-rich intermetallics in the pit can redeposit
in or at the immediate vicinity of the pit and increase the cathodic area, thereby fueling the
corrosion process [12]. However, in pitting corrosion the corrosion rate generally decreases
over time, because the surface is often enriched by more active and passive components. The
alloying elements Mg and Mn are known to have a positive effect against pitting corrosion, and
Cu and Fe to have a negative effect [3, 19], this is described more detailed in Section 2.2.6.
The type of pit illustrated in Figure 5 can propagate autocatalytically and cause material
damage, but it does not initiate unless the metal surface can be polarized temporarily more
positive than the critical pitting potential, which is about −0,75 VSCE1 in seawater (and about
−0,73 to −0,76 VSCE in 3% NaCl) [12, 20, 21]. However, once such pits are initiated they can
propagate at potentials more negative than the pitting potential because of the acidic
environment in the pit [12]. The critical pitting potential is temperature dependent; this is
discussed in Section 2.2.5.
1 The potential against a saturated calomel reference electrode (SCE) can be converted to potential against a silver
chloride reference electrode (Ag/AgCl) by adding +44 mV.

2.2 Corrosion of aluminium
10
Figure 5: Schematic illustration of localized corrosion on aluminium alloys [12].
2.2.3 Crevice corrosion on aluminium
Crevice corrosion is local corrosion concentrated in crevices. The crevice need to be sufficient
open such that the liquid can enter, and at the same time sufficient narrow such that the liquid
stays in the crevice. Crevice corrosion can occur in narrow crevices between metal-to-metal
connections and between metal-to-non-metal connections. Crevices can also form beneath
coating or under fouling. The most pronounced crevice corrosion occurs on metals that are
passive or easily can be passivated, such as aluminium and stainless steel. The passivity will be
broken down locally [22].
Aggressive ions needs to be present in the liquid for crevice corrosion to occur, for example
chlorides in seawater. As the liquid is trapped in the crevice an environment different from the
surroundings is developed. The oxygen will be consumed in the crevice due to the corrosion
reactions. When the oxygen is consumed, the anodic metal dissolution reaction will continue in
the crevice and be maintained by the cathodic reduction reaction outside the crevice. Due to
migration of Cl−-ions into the crevice, the pH will drop, such that the conditions inside the
crevice will become more aggressive over time. The protective oxide will be dissolved due to
the low pH and active corrosion will start in the crevice [3].
The severity of the corrosion will to a certain extent depend on whether the crevice is above the
seawater or submerged in the seawater. For a crevice submerged in seawater the process is
explained above. If the crevice is above the waterline, both the anode and cathode reactions will
Chapter 2 Theory
11
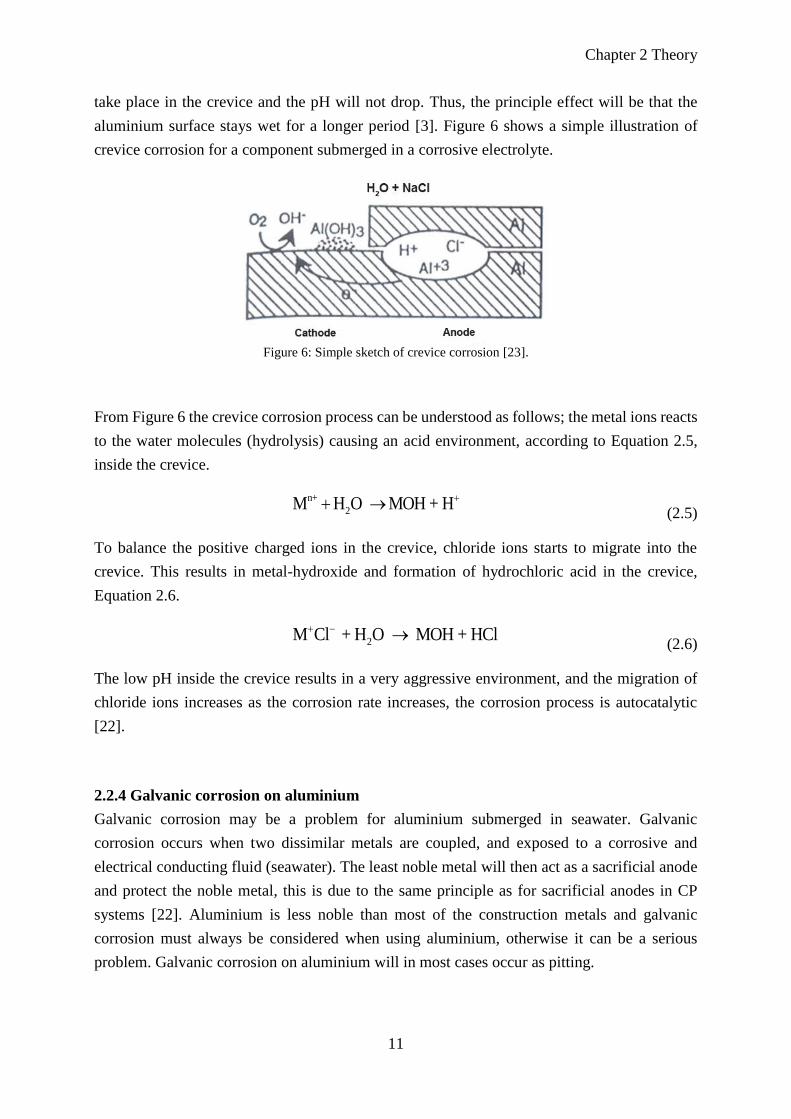
take place in the crevice and the pH will not drop. Thus, the principle effect will be that the
aluminium surface stays wet for a longer period [3]. Figure 6 shows a simple illustration of
crevice corrosion for a component submerged in a corrosive electrolyte.
Figure 6: Simple sketch of crevice corrosion [23].
From Figure 6 the crevice corrosion process can be understood as follows; the metal ions reacts
to the water molecules (hydrolysis) causing an acid environment, according to Equation 2.5,
inside the crevice.
n+
2M H O MOH + H (2.5)
To balance the positive charged ions in the crevice, chloride ions starts to migrate into the
crevice. This results in metal-hydroxide and formation of hydrochloric acid in the crevice,
Equation 2.6.
2M Cl + H O MOH + HCl (2.6)
The low pH inside the crevice results in a very aggressive environment, and the migration of
chloride ions increases as the corrosion rate increases, the corrosion process is autocatalytic
[22].
2.2.4 Galvanic corrosion on aluminium
Galvanic corrosion may be a problem for aluminium submerged in seawater. Galvanic
corrosion occurs when two dissimilar metals are coupled, and exposed to a corrosive and
electrical conducting fluid (seawater). The least noble metal will then act as a sacrificial anode
and protect the noble metal, this is due to the same principle as for sacrificial anodes in CP
systems [22]. Aluminium is less noble than most of the construction metals and galvanic
corrosion must always be considered when using aluminium, otherwise it can be a serious
problem. Galvanic corrosion on aluminium will in most cases occur as pitting.
2.2 Corrosion of aluminium
12
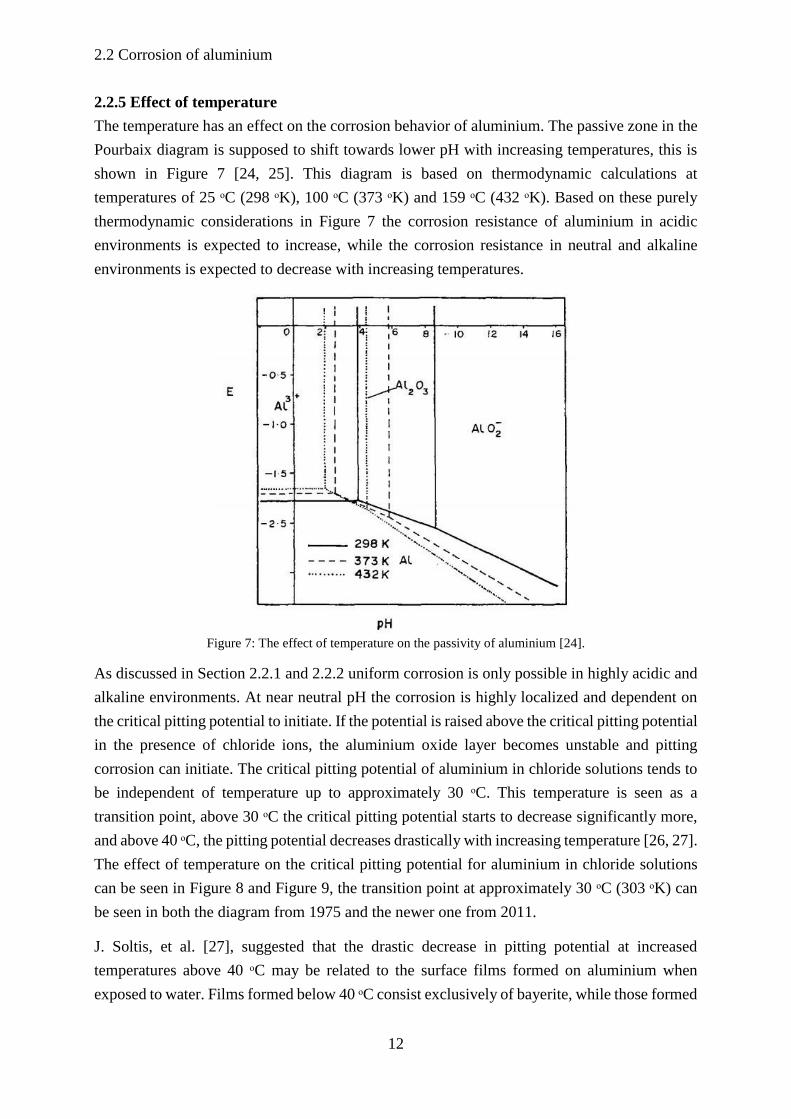
2.2.5 Effect of temperature
The temperature has an effect on the corrosion behavior of aluminium. The passive zone in the
Pourbaix diagram is supposed to shift towards lower pH with increasing temperatures, this is
shown in Figure 7 [24, 25]. This diagram is based on thermodynamic calculations at
temperatures of 25 ᵒC (298 ᵒK), 100 ᵒC (373 ᵒK) and 159 ᵒC (432 ᵒK). Based on these purely
thermodynamic considerations in Figure 7 the corrosion resistance of aluminium in acidic
environments is expected to increase, while the corrosion resistance in neutral and alkaline
environments is expected to decrease with increasing temperatures.
Figure 7: The effect of temperature on the passivity of aluminium [24].
As discussed in Section 2.2.1 and 2.2.2 uniform corrosion is only possible in highly acidic and
alkaline environments. At near neutral pH the corrosion is highly localized and dependent on
the critical pitting potential to initiate. If the potential is raised above the critical pitting potential
in the presence of chloride ions, the aluminium oxide layer becomes unstable and pitting
corrosion can initiate. The critical pitting potential of aluminium in chloride solutions tends to
be independent of temperature up to approximately 30 ᵒC. This temperature is seen as a
transition point, above 30 ᵒC the critical pitting potential starts to decrease significantly more,
and above 40 o C, the pitting potential decreases drastically with increasing temperature [26, 27].
The effect of temperature on the critical pitting potential for aluminium in chloride solutions
can be seen in Figure 8 and Figure 9, the transition point at approximately 30 ᵒC (303 ᵒK) can
be seen in both the diagram from 1975 and the newer one from 2011.
J. Soltis, et al. [27], suggested that the drastic decrease in pitting potential at increased
temperatures above 40 ᵒC may be related to the surface films formed on aluminium when
exposed to water. Films formed below 40 o C consist exclusively of bayerite, while those formed

Chapter 2 Theory
13
at higher temperatures (up to 100 ᵒC) have an inner layer of pseudo-boehmite and an outer layer
of bayerite crystals [27].
Figure 8: Temperature effect on the critical pitting potential [26].
Figure 9: Temperature effect on pitting potential in chloride containing solutions [27].

2.2 Corrosion of aluminium
14
2.2.6 Effect of microstructure and alloying elements
The different aluminium alloy microstructures are developed as a result of alloy composition
and thermomechanical treatment, as discussed in Section 2.1. From a corrosion point of view,
the important features of alloy microstructure are grain structure and distribution of secondary
phase (intermetallic) particles as constituent particles, dispersoids or precipitates. The
electrochemical characteristics of such particles differ from the behavior of the surrounding
alloy matrix, making alloys susceptible to localized forms of corrosion attack (microgalvanic
corrosion) [28], this has also been discussed in Section 2.2.1 and 2.2.2.
The critical pitting potential of aluminium depends on the alloying elements as long as these
are in solid solution with the aluminium. Noble alloying elements raise the pitting potential in
the positive direction, and active elements decrease the pitting potential in the negative direction
[25]. Table 6 shows an overview of corrosion potential (OCP), Ecorr, for intermetallic particles
common to aluminium alloys in chloride containing solutions.
Table 6: Overview of corrosion potential (OCP), Ecorr, for intermetallic particles common to aluminium alloys in
chloride containing solutions [28].
Phase Ecorr [mVSCE] in 0,1 M NaCl
Al3Fe −539
Al2Cu −665
Al6Mn −779
Al3Ti −603
Al32Zn49 −1004
Mg2Al3 −1013
MgZn2 −1029
Mg2Si −1538
Al7Cu2Fe −551
Al2CuMg −883
Al20Cu2Mn3 −565
Al12Mn3Si −810
Al – 2%Cu −672
Al – 4%Cu −602
Fe containing intermetallic particles, like Al3Fe and Al6Fe, are electrochemically more noble
than the surrounding aluminium matrix, and will act as sites for the reduction reactions in
Equations 2.3 and 2.4. The rate of the reduction reaction is dependent on the ratio of the area
of exposed intermetallic particles relative to area of the matrix alloy. If the reduction reaction
rate is high enough these cathodes are capable of increasing the potential of the surrounding
aluminium matrix in the positive direction. Depending on the corrosivity of the environment,
Chapter 2 Theory
15
the oxide layer may break down in weak spots and a microgalvanic cell (pitting) may be
established, similar to the illustration in Figure 5 [17]. The addition of Mn and Si increases the
resistance of pitting [29]. Mn prevents the formation of Al3Fe-particles. In addition, enrichment
of Mn on the aluminium surface contribute to passivity, both the oxidation and reduction
reaction rates will be decreased [17, 30].
The alloying elements with a certain solubility in aluminium also contribute to the corrosion
behavior, depending on whether these elements are more noble or more active than aluminium
[31]. Cu, which is more noble than aluminium, will increase the corrosion rate of the active
aluminium matrix, this is called selective dissolution. The surface will be enriched with the
more noble component, Cu, and will then behave more according to the electrochemical
properties of Cu [31]. Enrichment of the surface with Cu is known to have a negative effect on
initiation of pitting, while the active alloying element Mg is known to have the opposite effect
[12].
For alloying elements which are more active (less noble) than aluminium, Mg is the only
element that is commercially used today. The Al-Mg (5xxx) alloys usually contain between 1
– 5% Mg [31]. If the concentration of Mg is above 4,5% [12] the unwanted β-phase Mg5Al8
may precipitate on the grain boundaries. This will lead to brittleness and stress corrosion
cracking (SCC) [32]. During precipitation the Mg-rich β-phase Al3Mg2 may also form, Al3Mg2
grows heterogeneous along the grain boundaries. This β-phase will lead to SCC, because it is
anodic relative to the matrix. Al3Mg2 can grow as a continuous film along the grain boundaries
[32, 33], so-called IGC.
In the right amounts, Mg is beneficial, as mentioned in Section 2.2.1 since it makes the oxide
less soluble in alkaline environments. In addition, it corrodes faster than aluminium, causing
the surface to be purer in aluminium, which is more resistant to corrosion than an Al – Mg alloy.
The dissolved Mg will act as sacrificial anodes for the aluminium surface [17].
Silicon increases the corrosion resistance of aluminium in alkaline environment, this is because
the silicon particles are resistant to both most acids and salts. The Si containing particles will
be cathodic to the aluminium matrix [30, 31].
What kind of compounds the alloying elements form depends on the amount of the different
alloying elements and working procedure. According to Mondolfo [30] the following
intermetallic compounds are possible for the alloys in this study with the composition described
in Table 7.
AA5083: Mg5Al8, (FeMn)Al6, FeAl3 and (CrFe)Al7.
AA6082: Mg2Si, FeSiAl5, (FeMn)3Si2Al15 or (CrFe)4Si4Al13 and FeSiAl8.
2.3 Cathodic protection of aluminium
16
2.3 Cathodic protection of aluminium
CP is a method to protect aluminium and other metals from corrosion when submerged in
seawater, or other conducting corrosive electrolytes. In CP, an external current is applied to the
structure to be protected to lower the potential into the immune region of the Pourbaix diagram.
This can be done either by sacrificial anodes or by an impressed current system.
In terms of CP, two important issues distinguish aluminium alloys from steel. Firstly, for
aluminium protection is achieved by moving the potential into the passive region of the
Pourbaix diagram. This is because the protective oxide is amphoteric, and becomes unstable in
acid environments and alkaline environments. Seawater is a slightly alkaline environment, and
if the rate of the cathodic reaction is too high, the metal surface becomes more alkaline and
hence the protective oxide becomes destabilized. This can happen if the potential of aluminium
is lowered in an attempt to move it into the immune region of Figure 2, and can lead to higher
corrosion rate rather than reduced corrosion rate. The transition between passivity and cathodic
pitting in Figure 3 can be used as a rough guideline for the negative limit of the potential applied
during CP to avoid too high rate of the cathodic reaction, although the limit actually depends
on the flow rate. The protection is therefore achieved by maintaining the passivity of the surface
rather than by bringing the potential close to or into the range of immunity, as is the case for
steel. Thus, in principle, for aluminium we are talking about anodic protection rather than
cathodic protection [12, 34].
The other thing is that the current required for protection is low compared to CP of steel. This
is because the cathodic process is mainly restricted to the cathodic intermetallic sites and this
is just a small fraction of the area that is exposed. For steel, all of the exposed area needs CP,
not only weak spots. The cathodic current density on steel is given by the limiting current for
the oxygen reduction on a uniformly accessible surface, and it does not vary significantly with
changes in applied potential in the potential range −800 to −1000 mVSCE, see Figure 10. The
current density on aluminium is about a magnitude smaller than steel, and it does vary with
change in applied potential. The current level is also dependent on the type of alloy [12, 34].
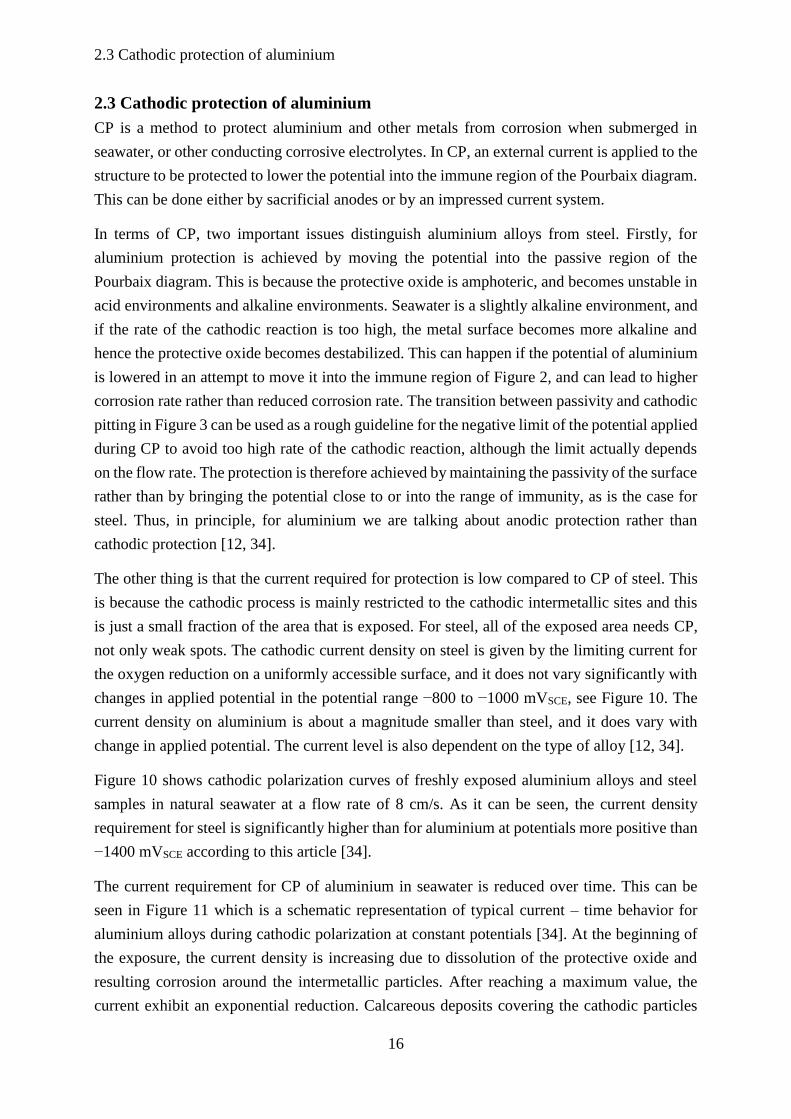
Figure 10 shows cathodic polarization curves of freshly exposed aluminium alloys and steel
samples in natural seawater at a flow rate of 8 cm/s. As it can be seen, the current density
requirement for steel is significantly higher than for aluminium at potentials more positive than
−1400 mVSCE according to this article [34].
The current requirement for CP of aluminium in seawater is reduced over time. This can be
seen in Figure 11 which is a schematic representation of typical current – time behavior for
aluminium alloys during cathodic polarization at constant potentials [34]. At the beginning of
the exposure, the current density is increasing due to dissolution of the protective oxide and
resulting corrosion around the intermetallic particles. After reaching a maximum value, the
current exhibit an exponential reduction. Calcareous deposits covering the cathodic particles
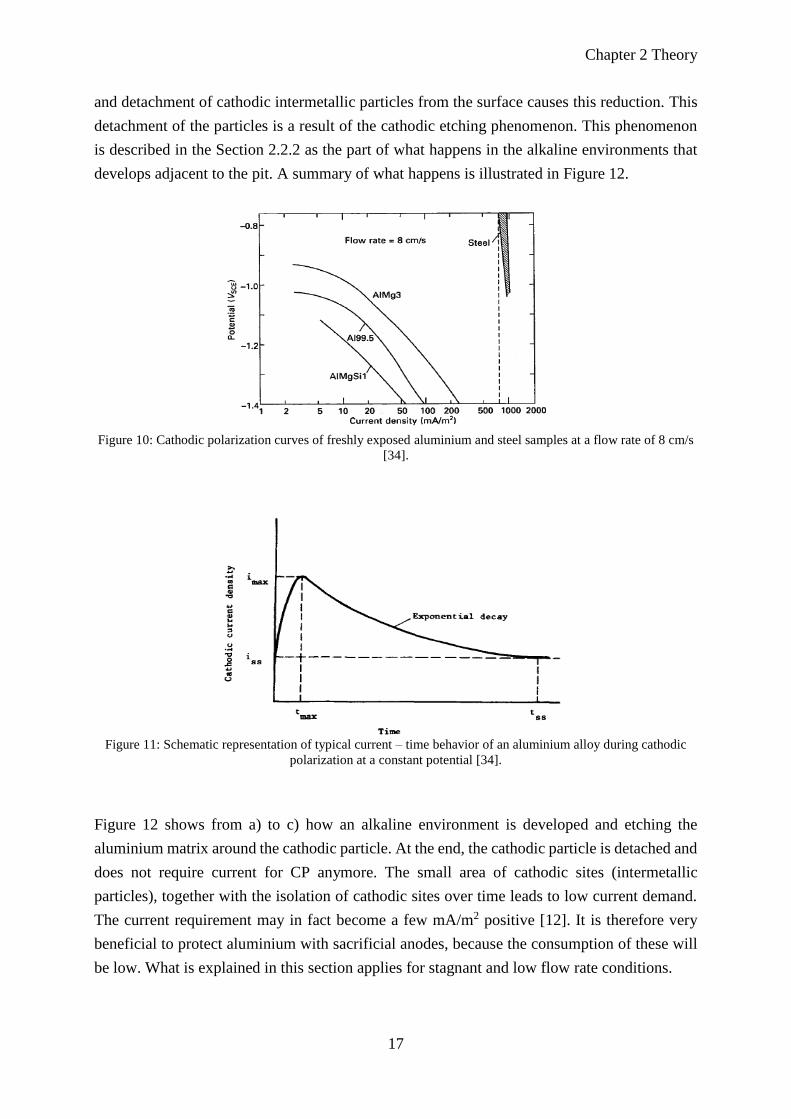
Chapter 2 Theory
17
and detachment of cathodic intermetallic particles from the surface causes this reduction. This
detachment of the particles is a result of the cathodic etching phenomenon. This phenomenon
is described in the Section 2.2.2 as the part of what happens in the alkaline environments that
develops adjacent to the pit. A summary of what happens is illustrated in Figure 12.
Figure 10: Cathodic polarization curves of freshly exposed aluminium and steel samples at a flow rate of 8 cm/s
[34].
Figure 11: Schematic representation of typical current – time behavior of an aluminium alloy during cathodic
polarization at a constant potential [34].
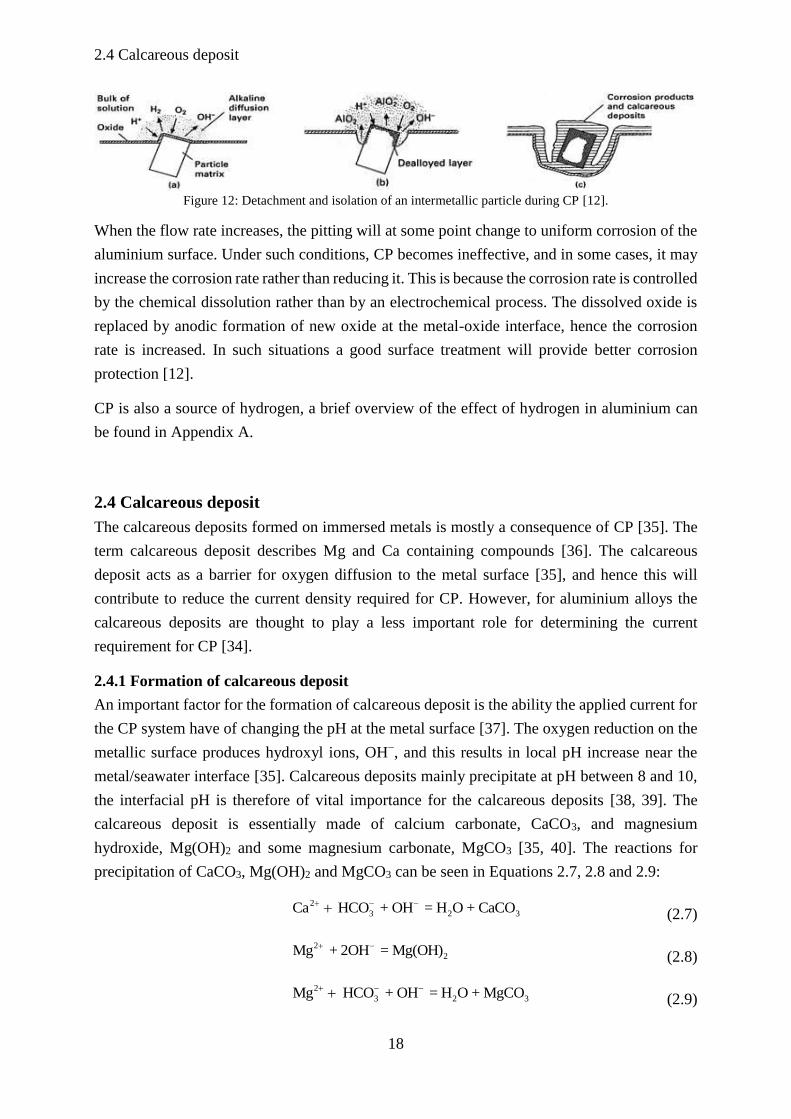
Figure 12 shows from a) to c) how an alkaline environment is developed and etching the
aluminium matrix around the cathodic particle. At the end, the cathodic particle is detached and
does not require current for CP anymore. The small area of cathodic sites (intermetallic
particles), together with the isolation of cathodic sites over time leads to low current demand.
The current requirement may in fact become a few mA/m2 positive [12]. It is therefore very
beneficial to protect aluminium with sacrificial anodes, because the consumption of these will
be low. What is explained in this section applies for stagnant and low flow rate conditions.
2.4 Calcareous deposit
18
Figure 12: Detachment and isolation of an intermetallic particle during CP [12].
When the flow rate increases, the pitting will at some point change to uniform corrosion of the
aluminium surface. Under such conditions, CP becomes ineffective, and in some cases, it may
increase the corrosion rate rather than reducing it. This is because the corrosion rate is controlled
by the chemical dissolution rather than by an electrochemical process. The dissolved oxide is
replaced by anodic formation of new oxide at the metal-oxide interface, hence the corrosion
rate is increased. In such situations a good surface treatment will provide better corrosion
protection [12].
CP is also a source of hydrogen, a brief overview of the effect of hydrogen in aluminium can
be found in Appendix A.
2.4 Calcareous deposit
The calcareous deposits formed on immersed metals is mostly a consequence of CP [35]. The
term calcareous deposit describes Mg and Ca containing compounds [36]. The calcareous
deposit acts as a barrier for oxygen diffusion to the metal surface [35], and hence this will
contribute to reduce the current density required for CP. However, for aluminium alloys the
calcareous deposits are thought to play a less important role for determining the current
requirement for CP [34].
2.4.1 Formation of calcareous deposit
An important factor for the formation of calcareous deposit is the ability the applied current for
the CP system have of changing the pH at the metal surface [37]. The oxygen reduction on the
metallic surface produces hydroxyl ions, OH−, and this results in local pH increase near the
metal/seawater interface [35]. Calcareous deposits mainly precipitate at pH between 8 and 10,
the interfacial pH is therefore of vital importance for the calcareous deposits [38, 39]. The
calcareous deposit is essentially made of calcium carbonate, CaCO3, and magnesium
hydroxide, Mg(OH)2 and some magnesium carbonate, MgCO3 [35, 40]. The reactions for
precipitation of CaCO3, Mg(OH)2 and MgCO3 can be seen in Equations 2.7, 2.8 and 2.9:
2
3 2 3Ca HCO + OH = H O + CaCO (2.7)
2
2Mg + 2OH = Mg(OH)
(2.8)
2
3 2 3Mg HCO + OH = H O + MgCO (2.9)
Chapter 2 Theory
19
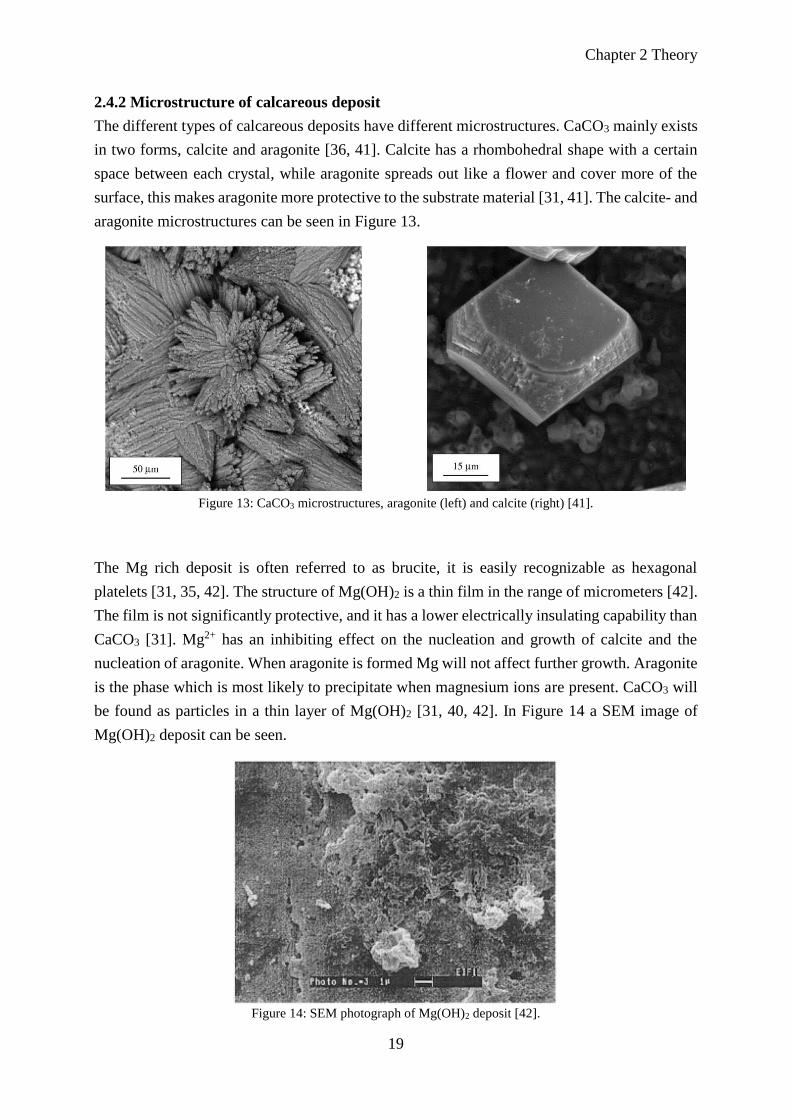
2.4.2 Microstructure of calcareous deposit
The different types of calcareous deposits have different microstructures. CaCO3 mainly exists
in two forms, calcite and aragonite [36, 41]. Calcite has a rhombohedral shape with a certain
space between each crystal, while aragonite spreads out like a flower and cover more of the
surface, this makes aragonite more protective to the substrate material [31, 41]. The calcite- and
aragonite microstructures can be seen in Figure 13.
Figure 13: CaCO3 microstructures, aragonite (left) and calcite (right) [41].
The Mg rich deposit is often referred to as brucite, it is easily recognizable as hexagonal
platelets [31, 35, 42]. The structure of Mg(OH)2 is a thin film in the range of micrometers [42].
The film is not significantly protective, and it has a lower electrically insulating capability than
CaCO3 [31]. Mg2+ has an inhibiting effect on the nucleation and growth of calcite and the
nucleation of aragonite. When aragonite is formed Mg will not affect further growth. Aragonite
is the phase which is most likely to precipitate when magnesium ions are present. CaCO3 will
be found as particles in a thin layer of Mg(OH)2 [31, 40, 42]. In Figure 14 a SEM image of
Mg(OH)2 deposit can be seen.
Figure 14: SEM photograph of Mg(OH)2 deposit [42].


Chapter 3 Literature Review
21
3 Literature Review
In the literature, several articles about the corrosion process for aluminium can be found.
However, these articles are mainly related to freely exposed aluminium. Limited detailed
information is published about the behavior of AA5083 and AA6082 under CP, and under
different temperatures and pH-values in seawater. In the following, a brief summary of relevant
available published literature is given.
In 2001 A. Aballe, et al. [43] published an article about localized corrosion of AA5083 in
neutral 3,5% NaCl solution. AA5083 samples were exposed in aerated 3,5% NaCl with pH 5,5.
The exposure time varied from 1 to 30 days. It was concluded that when AA5083 corrodes
freely in a solution of NaCl at 3,5%, the samples undergo a process of corrosion localized to
the area surrounding the precipitates of Al(Mn,Fe,Cr), which results in hemispherical pits. For
the formation of crystallographic pitting to be produced, it is necessary to polarize the alloy at
the nucleation potential of pitting or to apply a constant anodic current at a density above a
critical level.
K. A. Yasakau, et al. [44] published an article about the role of intermetallic phases in localized
corrosion of AA5083 in 2007. Experimental work where polished AA5083 samples were
immersed in 0,5 M and 0,005 M NaCl solutions was performed. The localized corrosion activity
of different intermetallics was investigated by use of advanced microscopic and local
electrochemical techniques 2. The results indicated that the different types of intermetallics
plays an important role in the localized corrosion attack. The following was concluded; the
Mg2Si intermetallics have an anodic behavior and demonstrate partial dissolution with distinct
dealloying due to selective leaching of magnesium. The formation of hydroxide deposits and
the enrichment of the intermetallics in silicon stop further propagation of defects preventing
formation of deep pits. The Fe-rich intermetallics work as local cathodes promoting fast anodic
dissolution of aluminium and formation of pits.
A study on the corrosion behavior of aluminium alloys in seawater was performed by H.
Ezuber, et al. in 2008 [45]. In this study, AA5083 and AA1100 were tested in seawater at 23
and 60 ᵒC. The study concluded that both AA1100 and AA5083 suffered from pitting corrosion
attack in seawater at room temperature as well as 60 ᵒC, with better corrosion resistance for
AA1100. The intensity of the pitting attack increases with increasing test temperature from 23
to 60 ᵒC. Hemispherical pits were found on AA5083, while for AA1100 a higher number of
shallow pits was found. The results also showed that the type of intermetallic particles in
2 Scanning Kelvin probe force microscopy in addition to SEM and EDS.
22
aluminium alloys plays a major role in passivity breakdown and pit morphology of aluminium
alloys in seawater.
Less literature is available for AA6082. A study from 2011 performed by M. Händel, et al. [46]
investigated the effect of different grain sizes and textures on the corrosion behavior of
AA6082. Commercially extruded AA6082 was potentiodynamic polarized in 0,1 M NaCl to
investigate the susceptibility to selective corrosion. The results indicated that there is a
possibility that pitting starts earlier in the finer-grained part of the sample, but proceeds more
slowly than in the coarser-grained part.
In 2013 a study of the corrosion development in welded AA6082 alloys was carried out by K.
Blommedal [47]. Four variants of AA6082 with Cu additions ranging from 0,001 to 0,60 wt%
were subjected to an IGC test, in addition to Cyclic Acidified Synthetic Sea Water (Fog) Testing
(SWAAT). The results from the study revealed significant pitting corrosion on most variants,
and the severity was found to increase with increasing Cu content and ageing time. Also, attacks
from pitting corrosion was occasionally observed to be accompanied with IGC attacks along
sub grains. Weld seams formed during friction stir welding (FSW) proved to be more
susceptible to pitting corrosion attacks than weld seams formed during MIG welding.
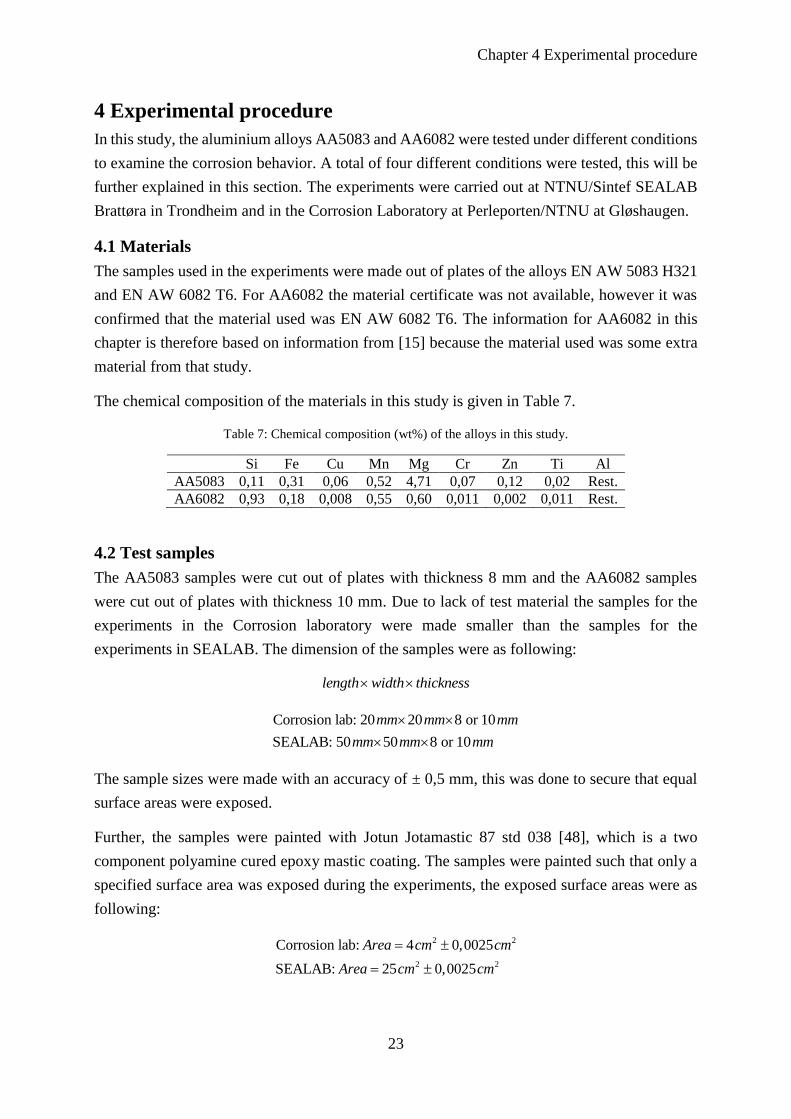
Chapter 4 Experimental procedure
23
4 Experimental procedure
In this study, the aluminium alloys AA5083 and AA6082 were tested under different conditions
to examine the corrosion behavior. A total of four different conditions were tested, this will be
further explained in this section. The experiments were carried out at NTNU/Sintef SEALAB
Brattøra in Trondheim and in the Corrosion Laboratory at Perleporten/NTNU at Gløshaugen.
4.1 Materials
The samples used in the experiments were made out of plates of the alloys EN AW 5083 H321
and EN AW 6082 T6. For AA6082 the material certificate was not available, however it was
confirmed that the material used was EN AW 6082 T6. The information for AA6082 in this
chapter is therefore based on information from [15] because the material used was some extra
material from that study.
The chemical composition of the materials in this study is given in Table 7.
Table 7: Chemical composition (wt%) of the alloys in this study.
Si Fe Cu Mn Mg Cr Zn Ti Al
AA5083 0,11 0,31 0,06 0,52 4,71 0,07 0,12 0,02 Rest.
AA6082 0,93 0,18 0,008 0,55 0,60 0,011 0,002 0,011 Rest.
4.2 Test samples
The AA5083 samples were cut out of plates with thickness 8 mm and the AA6082 samples
were cut out of plates with thickness 10 mm. Due to lack of test material the samples for the
experiments in the Corrosion laboratory were made smaller than the samples for the
experiments in SEALAB. The dimension of the samples were as following:
length width thickness
Corrosion lab: 20 20 8 or 10
SEALAB: 50 50 8 or 10
mm mm mm
mm mm mm
The sample sizes were made with an accuracy of ± 0,5 mm, this was done to secure that equal
surface areas were exposed.
Further, the samples were painted with Jotun Jotamastic 87 std 038 [48], which is a two
component polyamine cured epoxy mastic coating. The samples were painted such that only a
specified surface area was exposed during the experiments, the exposed surface areas were as
following:
2 2
2 2
Corrosion lab: 4 0,0025
SEALAB: 25 0,0025
Area cm cm
Area cm cm
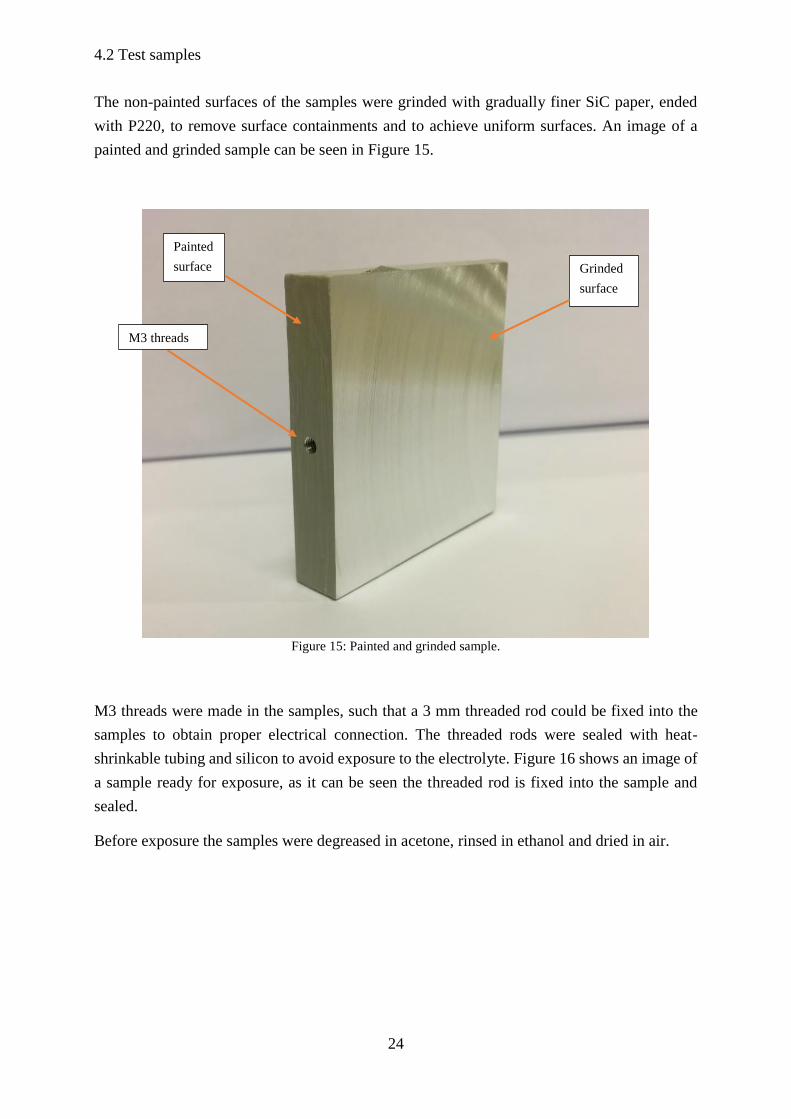
4.2 Test samples
24
The non-painted surfaces of the samples were grinded with gradually finer SiC paper, ended
with P220, to remove surface containments and to achieve uniform surfaces. An image of a
painted and grinded sample can be seen in Figure 15.
Figure 15: Painted and grinded sample.
M3 threads were made in the samples, such that a 3 mm threaded rod could be fixed into the
samples to obtain proper electrical connection. The threaded rods were sealed with heat-
shrinkable tubing and silicon to avoid exposure to the electrolyte. Figure 16 shows an image of
a sample ready for exposure, as it can be seen the threaded rod is fixed into the sample and
sealed.
Before exposure the samples were degreased in acetone, rinsed in ethanol and dried in air.
M3 threads
Painted
surface Grinded
surface
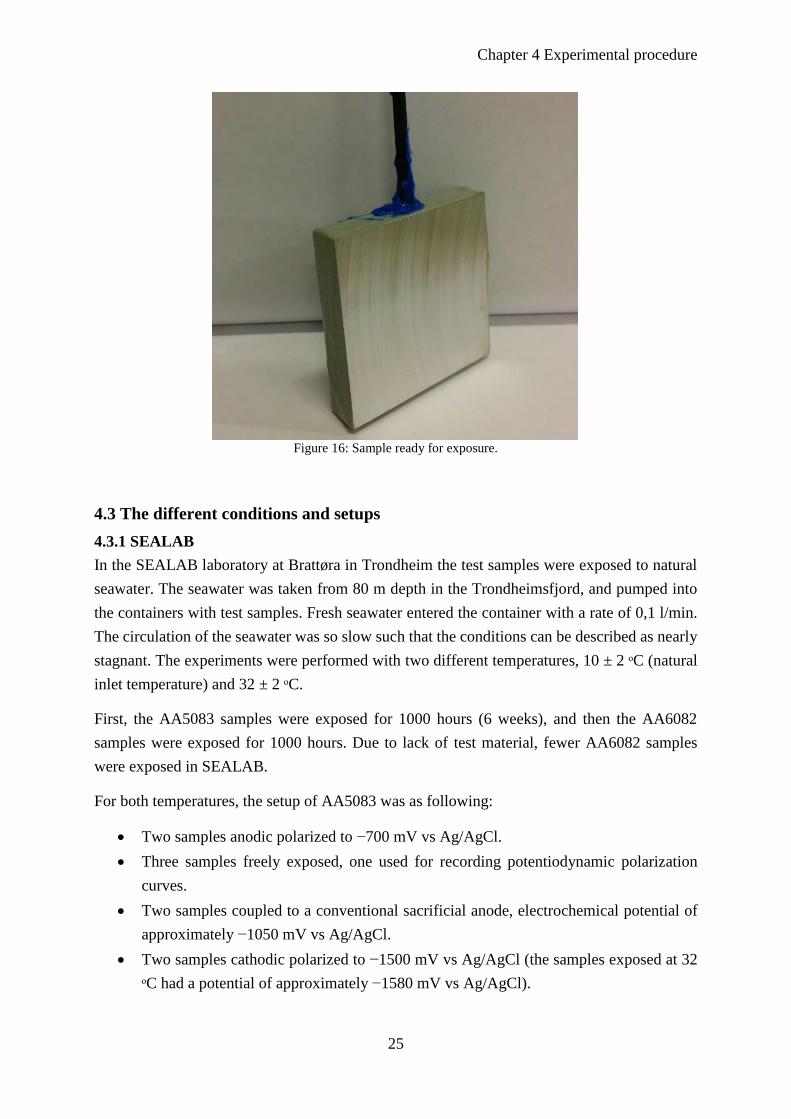
Chapter 4 Experimental procedure
25
Figure 16: Sample ready for exposure.
4.3 The different conditions and setups
4.3.1 SEALAB
In the SEALAB laboratory at Brattøra in Trondheim the test samples were exposed to natural
seawater. The seawater was taken from 80 m depth in the Trondheimsfjord, and pumped into
the containers with test samples. Fresh seawater entered the container with a rate of 0,1 l/min.
The circulation of the seawater was so slow such that the conditions can be described as nearly
stagnant. The experiments were performed with two different temperatures, 10 ± 2 ᵒC (natural
inlet temperature) and 32 ± 2 ᵒC.
First, the AA5083 samples were exposed for 1000 hours (6 weeks), and then the AA6082
samples were exposed for 1000 hours. Due to lack of test material, fewer AA6082 samples
were exposed in SEALAB.
For both temperatures, the setup of AA5083 was as following:
Two samples anodic polarized to −700 mV vs Ag/AgCl.
Three samples freely exposed, one used for recording potentiodynamic polarization
curves.
Two samples coupled to a conventional sacrificial anode, electrochemical potential of
approximately −1050 mV vs Ag/AgCl.
Two samples cathodic polarized to −1500 mV vs Ag/AgCl (the samples exposed at 32
ᵒC had a potential of approximately −1580 mV vs Ag/AgCl).

4.3 The different conditions and setups
26
For both temperatures, the setup of AA6082 was as following:
One sample anodic polarized to −700 mV vs Ag/AgCl.
Two samples freely exposed, one used for recording potentiodynamic polarization
curves.
One sample coupled to a conventional sacrificial anode, electrochemical potential of
approximately −1050 mV vs Ag/AgCl.
One sample cathodic polarized to −1500 mV vs Ag/AgCl (the sample exposed at 32 ᵒC
had a potential of approximately −1580 mV vs Ag/AgCl).
In Figure 17 the experimental setup is illustrated in an easy-to-understand way. Note that for
AA6082 it was one sample less at the different conditions. The reference electrodes used were
Ag/AgCl Saturated KCl, and the counter electrodes were platinum.
Two carbon steel St 52 samples were also coupled to the sacrificial anode, one at each
temperature. The purpose of this was to compare the results for the aluminium samples coupled
to the sacrificial anode to the results for the carbon steel samples.
Figure 17: Easy-to-understand illustration of the experimental setup.
Figure 18 shows an overview photo of the two containers used for the experiments. The
container to the left had a temperature of 10 ᵒC and the one to the right 32 ᵒC.

Chapter 4 Experimental procedure
27
Figure 18: Overview photo SEALAB.
4.3.2 Corrosion Laboratory Perleporten
In the Corrosion Laboratory at Perleporten/NTNU at Gløshaugen the test samples were exposed
to synthetic seawater (SSW), made in accordance to ASTM D 1141 [49], with three different
pH-values: 3, 8,2 and 10. The samples were exposed for 168 hours (1 week) in room
temperature (21 ± 2 ᵒC) for each of the three different pH values.
For both AA5083 and AA6082 the setup was as following:
Two samples anodic polarized to −700 mV vs Ag/AgCl.
Three samples freely exposed, one used for recording potentiodynamic polarization
curves after 24 hours and one used for recording potentiodynamic polarization curves
after 168 hours.
Two samples coupled to a conventional sacrificial anode, electrochemical potential of
approximately −1050 mV vs Ag/AgCl.
Two samples cathodic polarized to −1500 mV vs Ag/AgCl.
This means that at each pH a total number of 18 test samples were exposed at the same time,
nine of each alloy. For each of the alloys the experimental setup is the same as illustrated in
Figure 17. Figure 19 shows an overview photo of the experimental setup in the corrosion
laboratory.
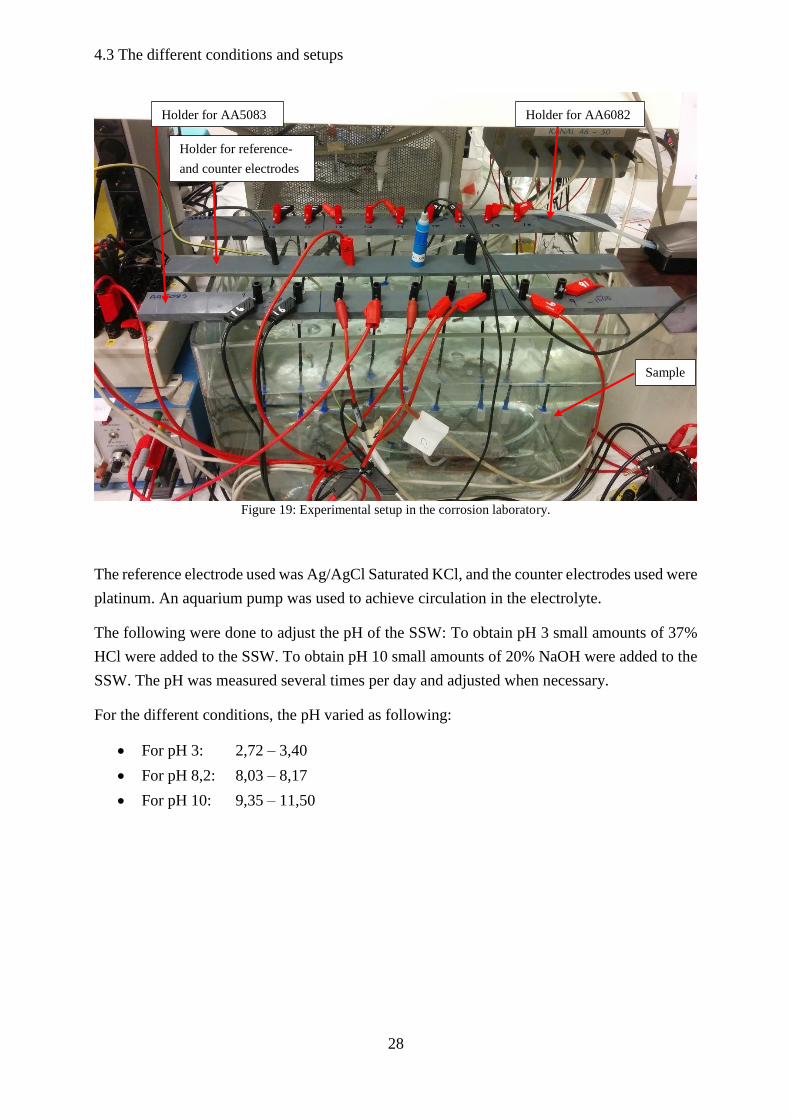
4.3 The different conditions and setups
28
Figure 19: Experimental setup in the corrosion laboratory.
The reference electrode used was Ag/AgCl Saturated KCl, and the counter electrodes used were
platinum. An aquarium pump was used to achieve circulation in the electrolyte.
The following were done to adjust the pH of the SSW: To obtain pH 3 small amounts of 37%
HCl were added to the SSW. To obtain pH 10 small amounts of 20% NaOH were added to the
SSW. The pH was measured several times per day and adjusted when necessary.
For the different conditions, the pH varied as following:
For pH 3: 2,72 – 3,40
For pH 8,2: 8,03 – 8,17
For pH 10: 9,35 – 11,50
Holder for AA6082
samples
Holder for AA5083
samples Holder for reference-
and counter electrodes
Sample

Chapter 4 Experimental procedure
29
4.4 Measurements
4.4.1 SEALAB
During exposure the following were recorded:
Potential drop, ΔE, across a fixed resistor (see Figure 17), for all the polarized samples.
It was emphasized to obtain ΔE = 1 mV. The potential drop was used to calculate the
anodic- and cathodic current requirement for the samples by the use of Ohm’s law.
The OCP for the freely exposed samples.
The recordings were done every fifth minute by the computer program Corrosion Lab
Datalogger. It was possible to follow the current- and potential development in situ during the
whole exposure period.
For one of the freely exposed samples (at both temperatures) cathodic- and anodic polarization
curves (potentiodynamic polarization curves) were recorded. The polarization curves were
recorded after one day of exposure, and then once a week. First, the cathodic polarization curves
were recorded from OCP and down to −1600 mV vs Ag/AgCl with a sweep rate of 600 mV/h.
Applied potential was then turned off and OCP was stabilizing for minimum one hour. The
anodic polarization curves were recorded from OCP and 400 mV in anodic direction, by use of
the same sweep rate; 600 mV/h.
At the end of the exposure time, complete polarization curves were recorded. The complete
polarization curves were recorded with the same limits and the same sweep rate as for the
cathodic- and anodic polarization curves. Both the complete polarization curves, and the
cathodic- and anodic polarization curves were recorded manually.
For AA5083 all polarization curves including the complete polarization curve were recorded
on the same sample. For AA6082 the complete polarization curves were recorded on samples
that had only been freely exposed for six weeks, and not experienced the previous anodic- and
cathodic polarizations. The other polarization curves for AA6082 were recorded on the same
sample.
4.4.2 Corrosion Laboratory Perleporten
During exposure, several recordings were done, and the following were recorded:
Potential drop, ΔE, across a fixed resistor, for all the polarized samples. It was
emphasized to obtain ΔE = 1 mV. The potential drop was used to calculate the anodic-
and cathodic current requirement for the samples by the use of Ohm’s law.
The OCP for the freely exposed samples.
The same recordings were performed for each of the tests with different pH values. The
recordings were done every fifth minute by the computer program Corrosion Lab Datalogger.
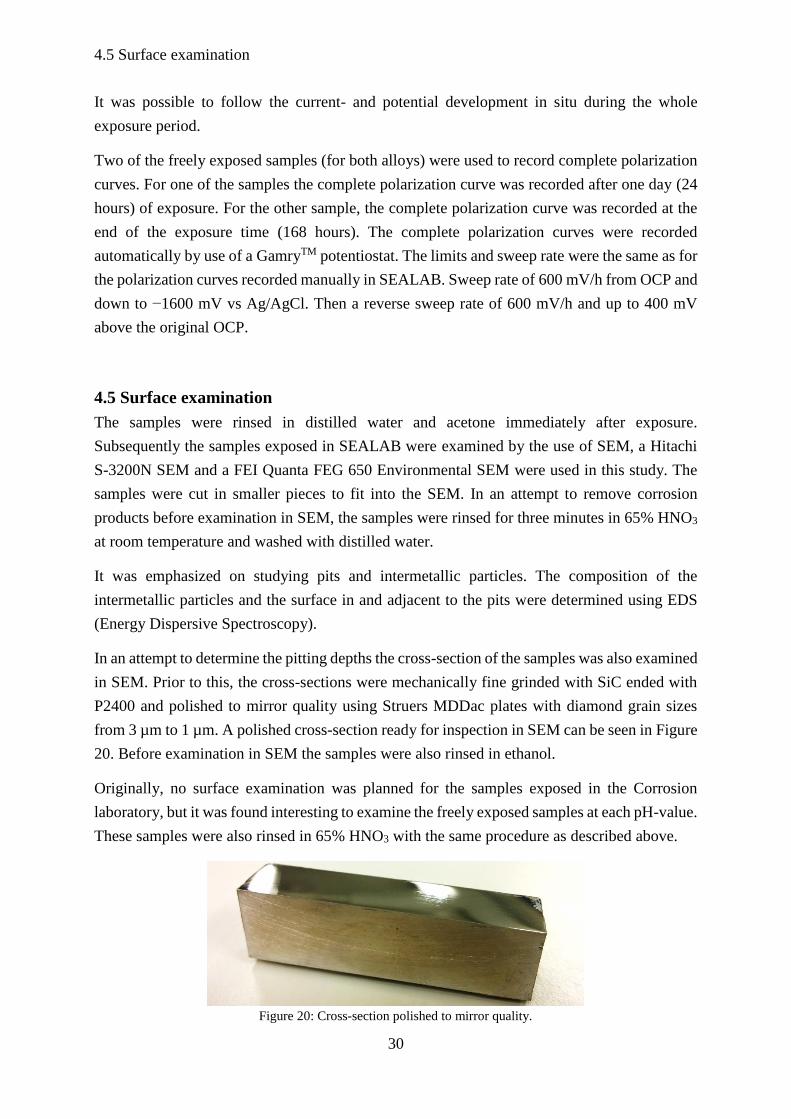
4.5 Surface examination
30
It was possible to follow the current- and potential development in situ during the whole
exposure period.
Two of the freely exposed samples (for both alloys) were used to record complete polarization
curves. For one of the samples the complete polarization curve was recorded after one day (24
hours) of exposure. For the other sample, the complete polarization curve was recorded at the
end of the exposure time (168 hours). The complete polarization curves were recorded
automatically by use of a GamryTM potentiostat. The limits and sweep rate were the same as for
the polarization curves recorded manually in SEALAB. Sweep rate of 600 mV/h from OCP and
down to −1600 mV vs Ag/AgCl. Then a reverse sweep rate of 600 mV/h and up to 400 mV
above the original OCP.
4.5 Surface examination
The samples were rinsed in distilled water and acetone immediately after exposure.
Subsequently the samples exposed in SEALAB were examined by the use of SEM, a Hitachi
S-3200N SEM and a FEI Quanta FEG 650 Environmental SEM were used in this study. The
samples were cut in smaller pieces to fit into the SEM. In an attempt to remove corrosion
products before examination in SEM, the samples were rinsed for three minutes in 65% HNO3
at room temperature and washed with distilled water.
It was emphasized on studying pits and intermetallic particles. The composition of the
intermetallic particles and the surface in and adjacent to the pits were determined using EDS
(Energy Dispersive Spectroscopy).
In an attempt to determine the pitting depths the cross-section of the samples was also examined
in SEM. Prior to this, the cross-sections were mechanically fine grinded with SiC ended with
P2400 and polished to mirror quality using Struers MDDac plates with diamond grain sizes
from 3 µm to 1 µm. A polished cross-section ready for inspection in SEM can be seen in Figure
20. Before examination in SEM the samples were also rinsed in ethanol.
Originally, no surface examination was planned for the samples exposed in the Corrosion
laboratory, but it was found interesting to examine the freely exposed samples at each pH-value.
These samples were also rinsed in 65% HNO3 with the same procedure as described above.
Figure 20: Cross-section polished to mirror quality.

Chapter 5 Results
31
5 Results
5.1 SEALAB
The results from the experimental work in SEALAB are presented in this section. Photos of the
samples after exposure in SEALAB can be seen in Appendix B.
5.1.1 Open Circuit Potential
Figure 21 shows the development in OCP for freely exposed AA5083 and AA6082 in natural
seawater at 10 ᵒC and 32 ᵒC in SEALAB.
Figure 21: Development in OCP for freely exposed AA5083 and AA6082 in natural seawater.
The OCP for AA5083 exposed at 10 ᵒC started at −830 mV vs Ag/AgCl, but showed a
fluctuating behavior the first 80 hours of exposure. After this the OCP stabilized, but with a
little variating behavior. The OCP was in the range −750 to −800 mV vs Ag/AgCl for the rest
of the exposure period. After 1000 hours, the OCP was −785 mV vs Ag/AgCl.
The OCP-curves for AA5083 exposed at 32 ᵒC were in two different potential ranges, −745 to
−800 mV vs Ag/AgCl and −900 to −915 mV vs Ag/AgCl. The grey curve showed a fluctuating
behavior the first 200 hours, while the yellow curve had a stable behavior the whole exposure
period. After 200 hours of exposure, the grey curve decreased and the yellow curve increased.
The two curves were relatively stable, but the grey curve decreased faster than the yellow curve
increased. The curves tended to unify in the range −840 to −850 mV vs Ag/AgCl.
The OCP for AA6082 exposed at 10 ᵒC started at −950 mV vs Ag/AgCl, and experienced a
fluctuating behavior the first 80 hours of exposure. First, it decreased to −1020 mV vs Ag/AgCl
and then increased to −870 mV vs Ag/AgCl. After this, the OCP exhibited a more stable
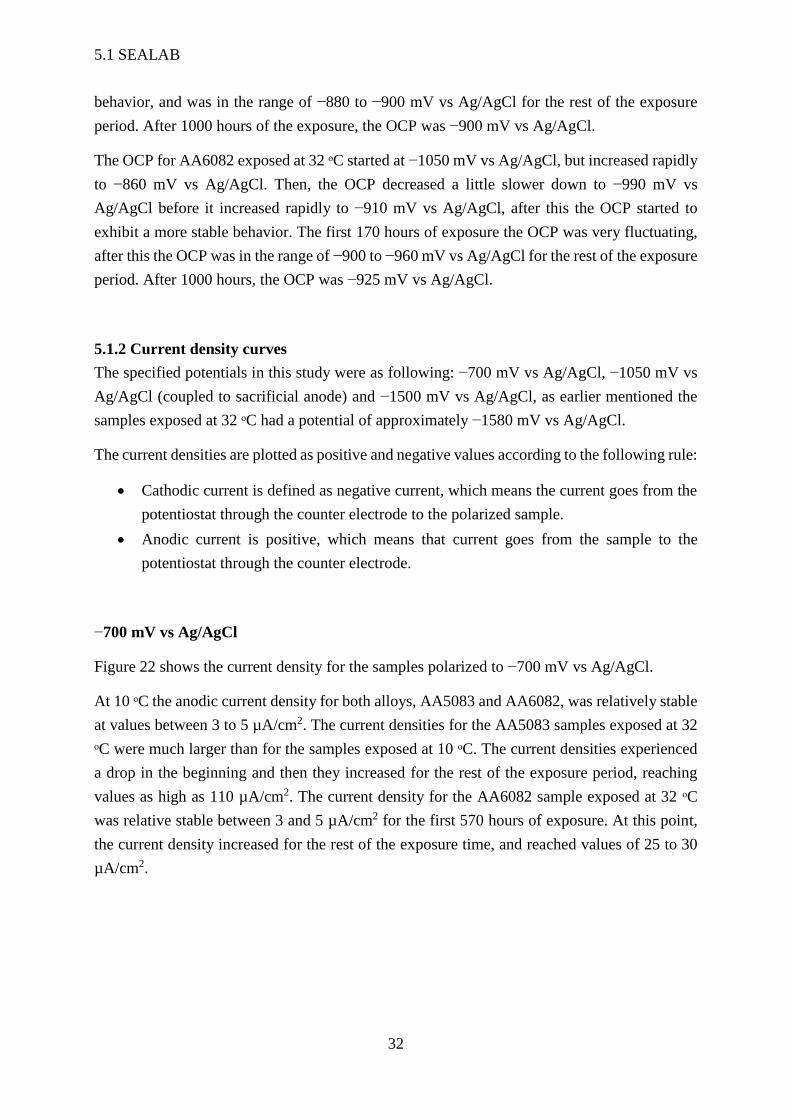
5.1 SEALAB
32
behavior, and was in the range of −880 to −900 mV vs Ag/AgCl for the rest of the exposure
period. After 1000 hours of the exposure, the OCP was −900 mV vs Ag/AgCl.
The OCP for AA6082 exposed at 32 ᵒC started at −1050 mV vs Ag/AgCl, but increased rapidly
to −860 mV vs Ag/AgCl. Then, the OCP decreased a little slower down to −990 mV vs
Ag/AgCl before it increased rapidly to −910 mV vs Ag/AgCl, after this the OCP started to
exhibit a more stable behavior. The first 170 hours of exposure the OCP was very fluctuating,
after this the OCP was in the range of −900 to −960 mV vs Ag/AgCl for the rest of the exposure
period. After 1000 hours, the OCP was −925 mV vs Ag/AgCl.
5.1.2 Current density curves
The specified potentials in this study were as following: −700 mV vs Ag/AgCl, −1050 mV vs
Ag/AgCl (coupled to sacrificial anode) and −1500 mV vs Ag/AgCl, as earlier mentioned the
samples exposed at 32 ᵒC had a potential of approximately −1580 mV vs Ag/AgCl.
The current densities are plotted as positive and negative values according to the following rule:
Cathodic current is defined as negative current, which means the current goes from the
potentiostat through the counter electrode to the polarized sample.
Anodic current is positive, which means that current goes from the sample to the
potentiostat through the counter electrode.
−700 mV vs Ag/AgCl
Figure 22 shows the current density for the samples polarized to −700 mV vs Ag/AgCl.
At 10 ᵒC the anodic current density for both alloys, AA5083 and AA6082, was relatively stable
at values between 3 to 5 µA/cm2. The current densities for the AA5083 samples exposed at 32
ᵒC were much larger than for the samples exposed at 10 ᵒC. The current densities experienced
a drop in the beginning and then they increased for the rest of the exposure period, reaching
values as high as 110 µA/cm2. The current density for the AA6082 sample exposed at 32 ᵒC
was relative stable between 3 and 5 µA/cm2 for the first 570 hours of exposure. At this point,
the current density increased for the rest of the exposure time, and reached values of 25 to 30
µA/cm2.
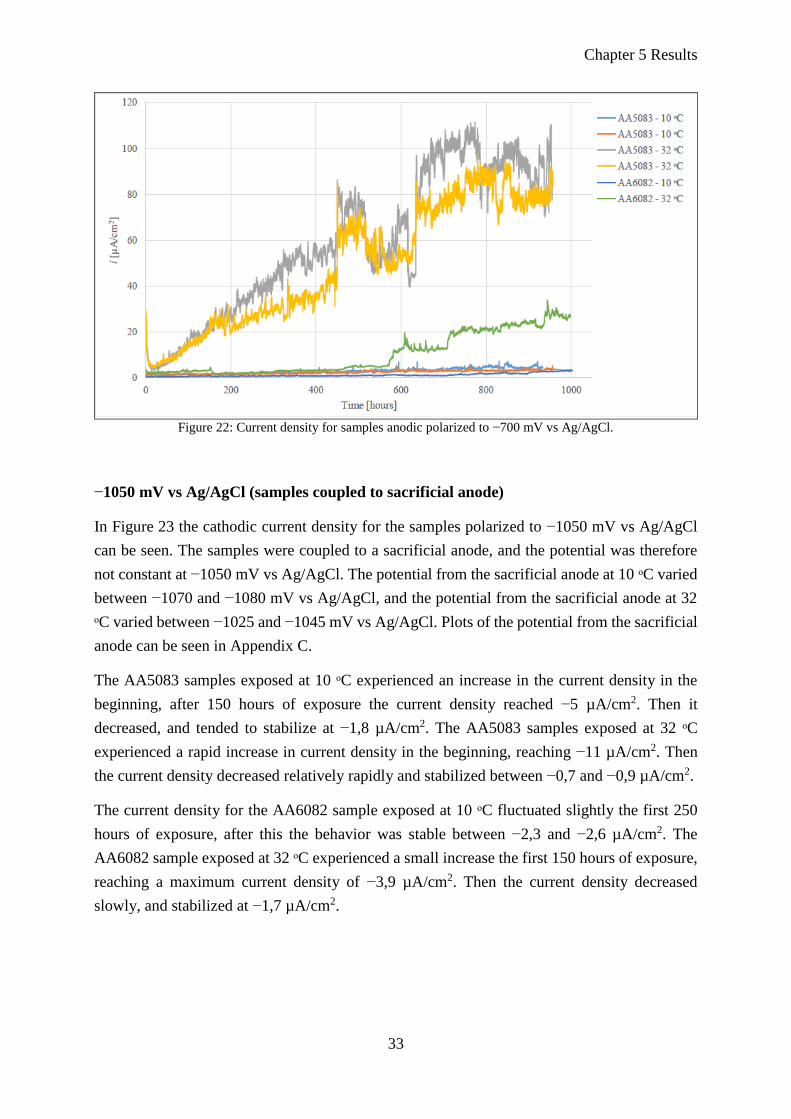
Chapter 5 Results
33
Figure 22: Current density for samples anodic polarized to −700 mV vs Ag/AgCl.
−1050 mV vs Ag/AgCl (samples coupled to sacrificial anode)
In Figure 23 the cathodic current density for the samples polarized to −1050 mV vs Ag/AgCl
can be seen. The samples were coupled to a sacrificial anode, and the potential was therefore
not constant at −1050 mV vs Ag/AgCl. The potential from the sacrificial anode at 10 ᵒC varied
between −1070 and −1080 mV vs Ag/AgCl, and the potential from the sacrificial anode at 32
ᵒC varied between −1025 and −1045 mV vs Ag/AgCl. Plots of the potential from the sacrificial
anode can be seen in Appendix C.
The AA5083 samples exposed at 10 ᵒC experienced an increase in the current density in the
beginning, after 150 hours of exposure the current density reached −5 µA/cm2. Then it
decreased, and tended to stabilize at −1,8 µA/cm2. The AA5083 samples exposed at 32 ᵒC
experienced a rapid increase in current density in the beginning, reaching −11 µA/cm2. Then
the current density decreased relatively rapidly and stabilized between −0,7 and −0,9 µA/cm2.
The current density for the AA6082 sample exposed at 10 ᵒC fluctuated slightly the first 250
hours of exposure, after this the behavior was stable between −2,3 and −2,6 µA/cm2. The
AA6082 sample exposed at 32 ᵒC experienced a small increase the first 150 hours of exposure,
reaching a maximum current density of −3,9 µA/cm2. Then the current density decreased
slowly, and stabilized at −1,7 µA/cm2.
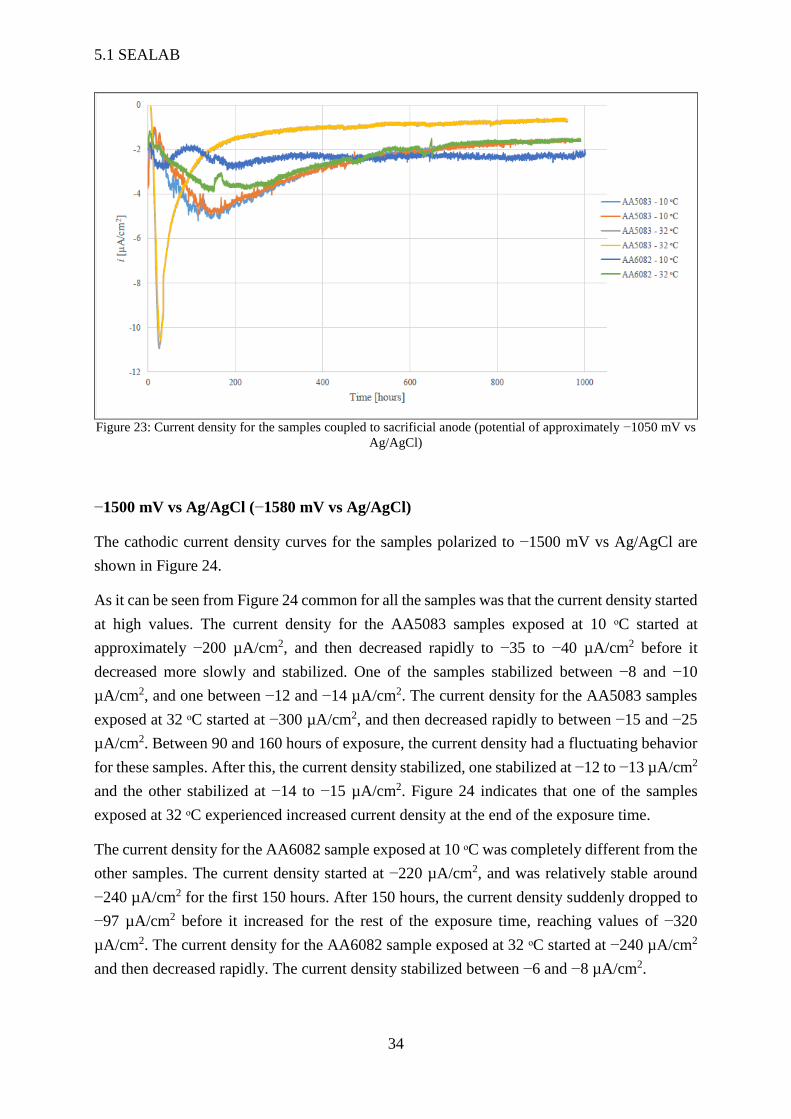
5.1 SEALAB
34
Figure 23: Current density for the samples coupled to sacrificial anode (potential of approximately −1050 mV vs
Ag/AgCl)
−1500 mV vs Ag/AgCl (−1580 mV vs Ag/AgCl)
The cathodic current density curves for the samples polarized to −1500 mV vs Ag/AgCl are
shown in Figure 24.
As it can be seen from Figure 24 common for all the samples was that the current density started
at high values. The current density for the AA5083 samples exposed at 10 ᵒC started at
approximately −200 µA/cm2, and then decreased rapidly to −35 to −40 µA/cm2 before it
decreased more slowly and stabilized. One of the samples stabilized between −8 and −10
µA/cm2, and one between −12 and −14 µA/cm2. The current density for the AA5083 samples
exposed at 32 ᵒC started at −300 µA/cm2, and then decreased rapidly to between −15 and −25
µA/cm2. Between 90 and 160 hours of exposure, the current density had a fluctuating behavior
for these samples. After this, the current density stabilized, one stabilized at −12 to −13 µA/cm2
and the other stabilized at −14 to −15 µA/cm2. Figure 24 indicates that one of the samples
exposed at 32 ᵒC experienced increased current density at the end of the exposure time.
The current density for the AA6082 sample exposed at 10 ᵒC was completely different from the
other samples. The current density started at −220 µA/cm2, and was relatively stable around
−240 µA/cm2 for the first 150 hours. After 150 hours, the current density suddenly dropped to
−97 µA/cm2 before it increased for the rest of the exposure time, reaching values of −320
µA/cm2. The current density for the AA6082 sample exposed at 32 ᵒC started at −240 µA/cm2
and then decreased rapidly. The current density stabilized between −6 and −8 µA/cm2.

Chapter 5 Results
35
Figure 24: Current density for samples cathodic polarized to −1500 mV vs Ag/AgCl.
5.1.3 Potentiodynamic polarization curves
Potentiodynamic polarization curves were recorded for the freely exposed AA5083- and
AA6082 samples at 10 ᵒC and 32 ᵒC. The procedure for recording the potentiodynamic
polarization curves is explained in Section 4.4.
It should be mentioned that the complete polarization curves for AA6082 (at both temperatures)
are recorded on freely exposed samples that have not been polarized previous during the
exposure, which is the case for AA5083.
AA5083 – 10 ᵒC
The recorded anodic- and cathodic polarization curves for the freely exposed AA5083 sample
at 10 ᵒC are shown in Figure 25. The complete polarization curve recorded at the end of the
exposure time is also included in Figure 25.
As it can be seen from Figure 25 the cathodic polarization curve for day 1 had the lowest current
density for potentials more negative than −1100 mV vs Ag/AgCl. For the cathodic curves, more
positive than −1100 mV vs Ag/AgCl, it tends that day 1, week 4 and week 5 had fairly the same
current densities, and that week 1, week 2 and week 3 had fairly the same.
The anodic polarization curve for day 1 had clearly the largest current density, and the pitting
potential was also easy to see at approximately −720 mV vs Ag/AgCl. The other anodic curves
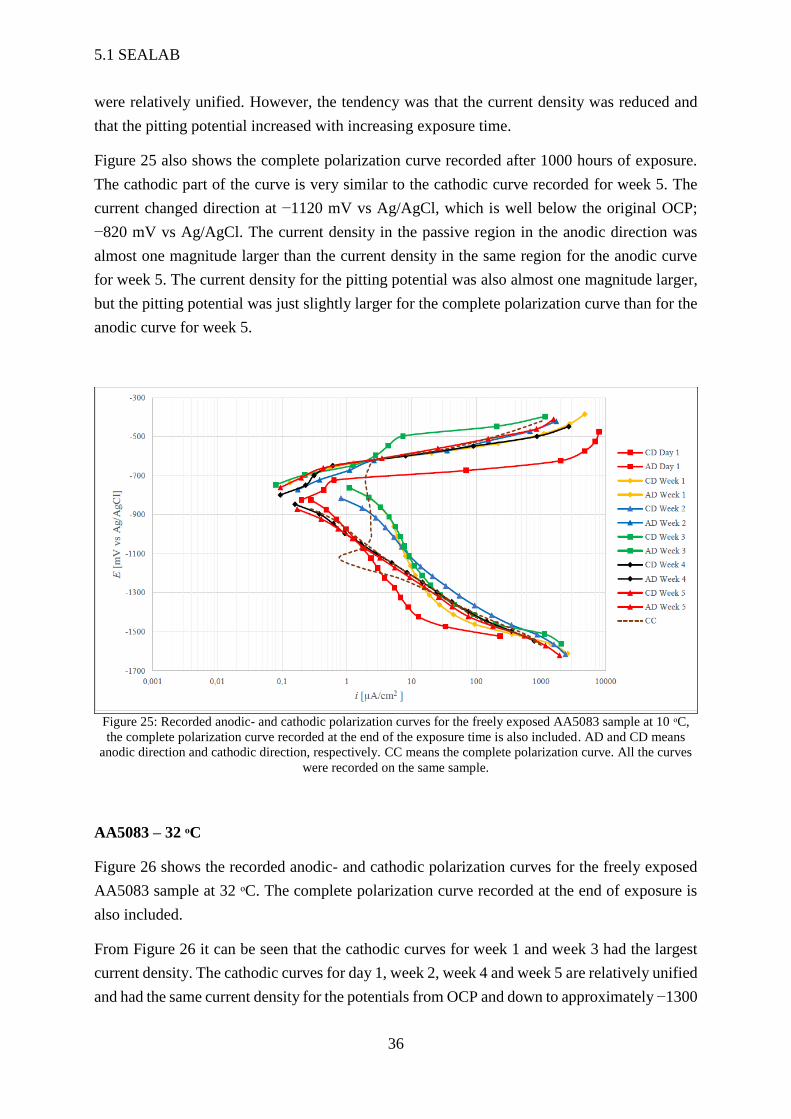
5.1 SEALAB
36
were relatively unified. However, the tendency was that the current density was reduced and
that the pitting potential increased with increasing exposure time.
Figure 25 also shows the complete polarization curve recorded after 1000 hours of exposure.
The cathodic part of the curve is very similar to the cathodic curve recorded for week 5. The
current changed direction at −1120 mV vs Ag/AgCl, which is well below the original OCP;
−820 mV vs Ag/AgCl. The current density in the passive region in the anodic direction was
almost one magnitude larger than the current density in the same region for the anodic curve
for week 5. The current density for the pitting potential was also almost one magnitude larger,
but the pitting potential was just slightly larger for the complete polarization curve than for the
anodic curve for week 5.
Figure 25: Recorded anodic- and cathodic polarization curves for the freely exposed AA5083 sample at 10 ᵒC,
the complete polarization curve recorded at the end of the exposure time is also included. AD and CD means
anodic direction and cathodic direction, respectively. CC means the complete polarization curve. All the curves
were recorded on the same sample.
AA5083 – 32 ᵒC
Figure 26 shows the recorded anodic- and cathodic polarization curves for the freely exposed
AA5083 sample at 32 ᵒC. The complete polarization curve recorded at the end of exposure is
also included.
From Figure 26 it can be seen that the cathodic curves for week 1 and week 3 had the largest
current density. The cathodic curves for day 1, week 2, week 4 and week 5 are relatively unified
and had the same current density for the potentials from OCP and down to approximately −1300

Chapter 5 Results
37
mV vs Ag/AgCl. At this potential, the current density for the day 1 curve increased and the
curve became more unified with week 1 and week 3.
Figure 26 indicates that the anodic curve at day 1 had the largest current density and the lowest
pitting potential. The current density for the anodic polarization curves decreased with time,
and the pitting potential increased with time.
Figure 26 also shows the complete polarization curve recorded for AA5083 at 32 ᵒC after 1000
hours of exposure. The cathodic part of the curve is slightly to the left of the recorded cathodic
curves, this implies lower current density for the cathodic part. The current changed direction
at −1120 mV vs Ag/AgCl. The current density for the transition to pitting was approximately
the same for the complete polarization curve as for the anodic curve for week 5. The pitting
potential was about 50 mV larger for the complete polarization curve compared to the anodic
curve for week 5.
Figure 26: Recorded anodic- and cathodic polarization curves for the freely exposed AA5083 sample at 32 ᵒC,
the complete polarization curve recorded at the end of the exposure time is also included. AD and CD means
anodic direction and cathodic direction, respectively. CC means the complete polarization curve. All the curves
were recorded on the same sample.
AA6082 – 10 ᵒC
The recorded anodic- and cathodic polarization curves, and the complete polarization curve for
the freely exposed AA6082 sample at 10 ᵒC are shown in Figure 27. Note that there are no
recorded curves for week 2 for this alloy.
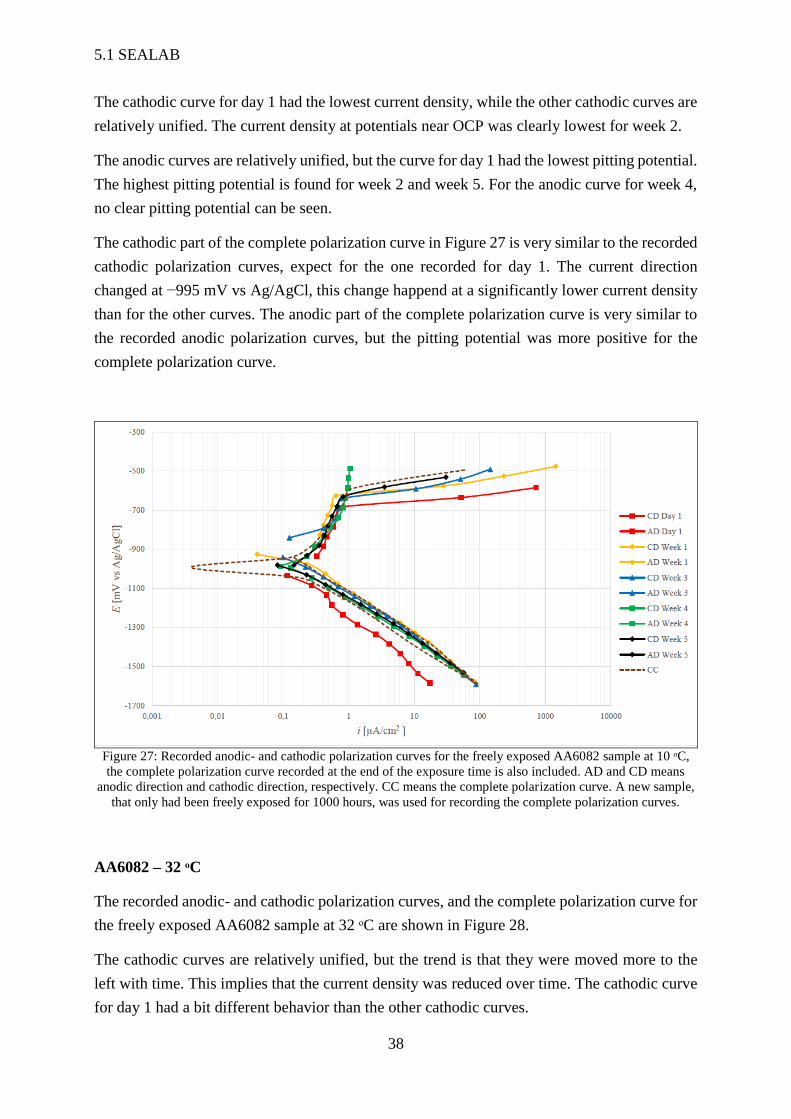
5.1 SEALAB
38
The cathodic curve for day 1 had the lowest current density, while the other cathodic curves are
relatively unified. The current density at potentials near OCP was clearly lowest for week 2.
The anodic curves are relatively unified, but the curve for day 1 had the lowest pitting potential.
The highest pitting potential is found for week 2 and week 5. For the anodic curve for week 4,
no clear pitting potential can be seen.
The cathodic part of the complete polarization curve in Figure 27 is very similar to the recorded
cathodic polarization curves, expect for the one recorded for day 1. The current direction
changed at −995 mV vs Ag/AgCl, this change happend at a significantly lower current density
than for the other curves. The anodic part of the complete polarization curve is very similar to
the recorded anodic polarization curves, but the pitting potential was more positive for the
complete polarization curve.
Figure 27: Recorded anodic- and cathodic polarization curves for the freely exposed AA6082 sample at 10 ᵒC,
the complete polarization curve recorded at the end of the exposure time is also included. AD and CD means
anodic direction and cathodic direction, respectively. CC means the complete polarization curve. A new sample,
that only had been freely exposed for 1000 hours, was used for recording the complete polarization curves.
AA6082 – 32 ᵒC
The recorded anodic- and cathodic polarization curves, and the complete polarization curve for
the freely exposed AA6082 sample at 32 ᵒC are shown in Figure 28.
The cathodic curves are relatively unified, but the trend is that they were moved more to the
left with time. This implies that the current density was reduced over time. The cathodic curve
for day 1 had a bit different behavior than the other cathodic curves.

Chapter 5 Results
39
The anodic curves showed a rather different behavior. The anodic curves for day 1 and week 1
showed similar behavior, but the current density was slightly decreased and the pitting potential
was slightly increased with time. The anodic curves for week 3 and 4 are moved significantly
to the left and no clear transition to pitting can be seen. The current density is somewhat
increased (moved to the right) for the anodic curve for week 5, but no clear transition to pitting
can be seen for this curve either.
The cathodic part of the complete polarization curve in Figure 28 is similar to the recorded
cathodic curves, and shows no significant difference in current density compared to the cathodic
curves. The current direction changed at −1125 mV vs Ag/AgCl. The anodic part of the
complete polarization curve is most similar to the anodic curves for day 1 and week 1. The
current density in the passive region is slightly lower for the complete polarization curve. The
transition to pitting happend in the same potential area as for the curves for day 1 and week 1.
Figure 28: Recorded anodic- and cathodic polarization curves for the freely exposed AA6082 sample at 32 ᵒC,
the complete polarization curve recorded at the end of the exposure time is also included. AD and CD means
anodic direction and cathodic direction, respectively. CC means the complete polarization curve. A new sample,
that only had been freely exposed for 1000 hours, was used for recording the complete polarization curves.
Characteristic values from the polarization curves for AA5083 and AA6082 after 168 hours
(one week) of exposure and after 1000 hours (six weeks) of exposure are shown in Table 8 and
Table 9.

5.1 SEALAB
40
Table 8: Characteristic values for AA5083 during anodic- and cathodic polarization after 168 hours (one week)
and 1000 hours (six weeks) of exposure.
AA5083
10 ᵒC 32 ᵒC
1 week 6 weeks 1 week 6 weeks
EOCP [mV vs Ag/AgCl] −712 −820 −922 −919
Epit [mV vs Ag/AgCl] −585 −620 −700 −519
ΔEpit-OCP = Epit – EOCP [mV] 127 200 222 400
ipass [µA/cm2] 0,3 – 1,3 1,95 – 2,45 0,4 – 0,9 0,4 – 0,55
Table 9: Characteristic values for AA6082 during anodic- and cathodic polarization after 168 hours (one week)
and 1000 hours (six weeks) of exposure.
AA6082
10 ᵒC 32 ᵒC
1 week 6 weeks 1 week 6 weeks
EOCP [mV vs Ag/AgCl] −877 −894 −915 −926
Epit [mV vs Ag/AgCl] −627 −594 −675 −726
ΔEpit-OCP = Epit – EOCP [mV] 250 300 240 200
ipass [µA/cm2] 0,35 – 0,65 0,15 – 1,05 1,0 – 1,45 0,95 – 1,35
The complete polarization curves recorded for AA6082, on samples that had not experienced
the previous polarizations, at 10 and 32 ᵒC are plotted in the same diagram in Appendix D. This
plot is included to see the effect of the temperature.
5.1.4 SEM images and EDS analyses
In this section, the results from SEM and EDS for the examination of the exposed surface of
the samples are presented. SEM images of AA5083 and AA6082 samples prior to exposure can
be seen in Appendix E. The results of the surface examination of the cross-sections in SEM are
also presented in this section. By investigating the cross-sections of the samples in SEM one
can only access a very small fraction of the exposed surface area; the edge of the cross-section
face. However, the pits observed along this edge is a good indication of the severity and depth
of the pits.

Chapter 5 Results
41
Freely exposed AA5083 at 10 ᵒC
Figure 29 shows a SEM image of an AA5083 sample freely exposed in natural seawater at 10
ᵒC and Figure 30 shows the EDS spectra of the marked area in Figure 29. The result from the
EDS analysis can be seen in Table 10.
As it can be seen from Figure 29 both pits and particles were observed on the surface of the
freely exposed AA5083 sample in natural seawater at 10 ᵒC. The EDS analysis of the marked
pit in Figure 29 revealed that inside the pit there was an intermetallic Al(Mn,Fe,Cr) particle
(precipitate).
Figure 29: SEM image of an AA5083 sample freely exposed in natural seawater at 10 ᵒC. An EDS analysis is
performed for the pit inside the marked area.
Figure 30: EDS spectra for the marked area in Figure 29.
Table 10: EDS analysis of the marked area in Figure 29.
Element C O Mg Al Si Cr Mn Fe
[wt%] 8,31 2,27 1,72 67,73 2,41 1,03 7,58 8,95

5.1 SEALAB
42
Freely exposed AA5083 at 32 ᵒC
Figure 31 shows SEM images and EDS spectra for an AA5083 sample freely exposed in natural
seawater at 32 ᵒC. The image a) is magnified 500 times and shows several pits. The marked
area in a) is further magnified in image b). An EDS analysis was performed on the marked area
in image b) and the EDS spectra can be seen in image c) in Figure 31. The result from the EDS
analysis can be seen in Table 11. According to the EDS analysis, the particle in the pit is a Fe-
rich intermetallic.
a) b)
c)
Figure 31: SEM images and EDS spectra of freely exposed AA5083 in natural seawater at 32 ᵒC.
Table 11: EDS analysis of the freely exposed AA5083 in Figure 31.
Element C O Mg Al Si Cr Mn Fe
[wt%] 7,62 3,95 1,03 60,84 2,9 0,64 7,23 15,8
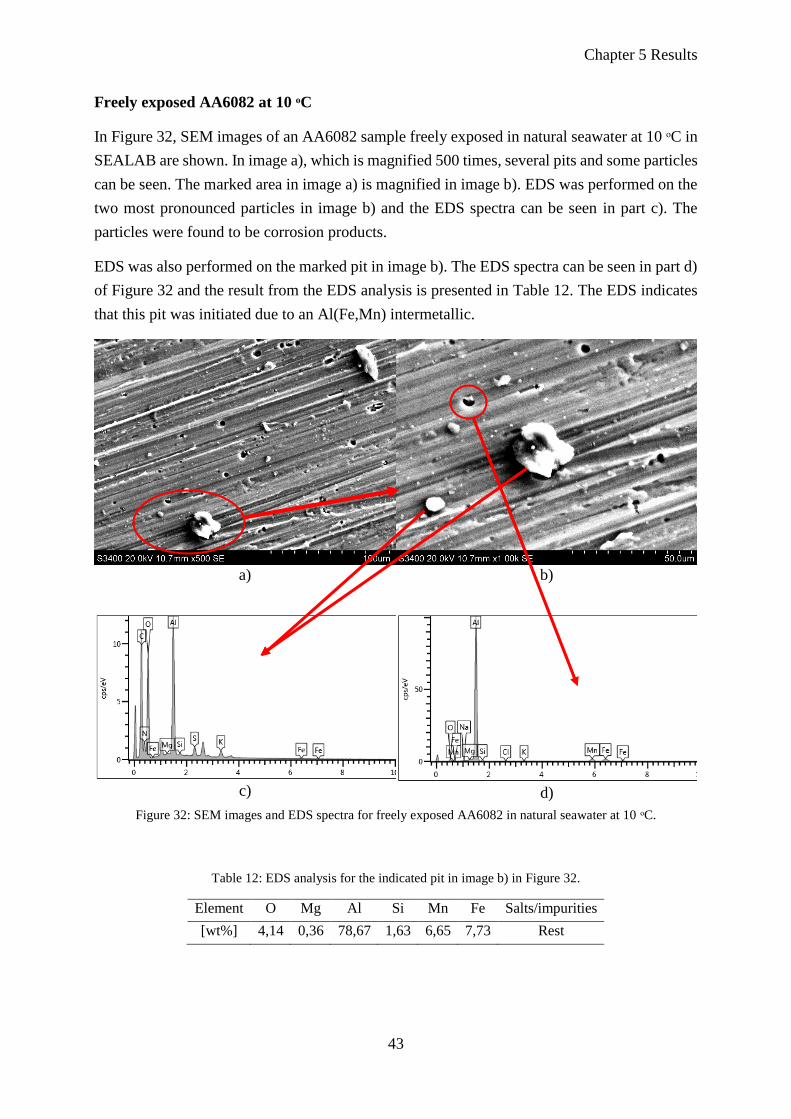
Chapter 5 Results
43
Freely exposed AA6082 at 10 ᵒC
In Figure 32, SEM images of an AA6082 sample freely exposed in natural seawater at 10 ᵒC in
SEALAB are shown. In image a), which is magnified 500 times, several pits and some particles
can be seen. The marked area in image a) is magnified in image b). EDS was performed on the
two most pronounced particles in image b) and the EDS spectra can be seen in part c). The
particles were found to be corrosion products.
EDS was also performed on the marked pit in image b). The EDS spectra can be seen in part d)
of Figure 32 and the result from the EDS analysis is presented in Table 12. The EDS indicates
that this pit was initiated due to an Al(Fe,Mn) intermetallic.
a) b)
c) d)
Figure 32: SEM images and EDS spectra for freely exposed AA6082 in natural seawater at 10 ᵒC.
Table 12: EDS analysis for the indicated pit in image b) in Figure 32.
Element O Mg Al Si Mn Fe Salts/impurities
[wt%] 4,14 0,36 78,67 1,63 6,65 7,73 Rest
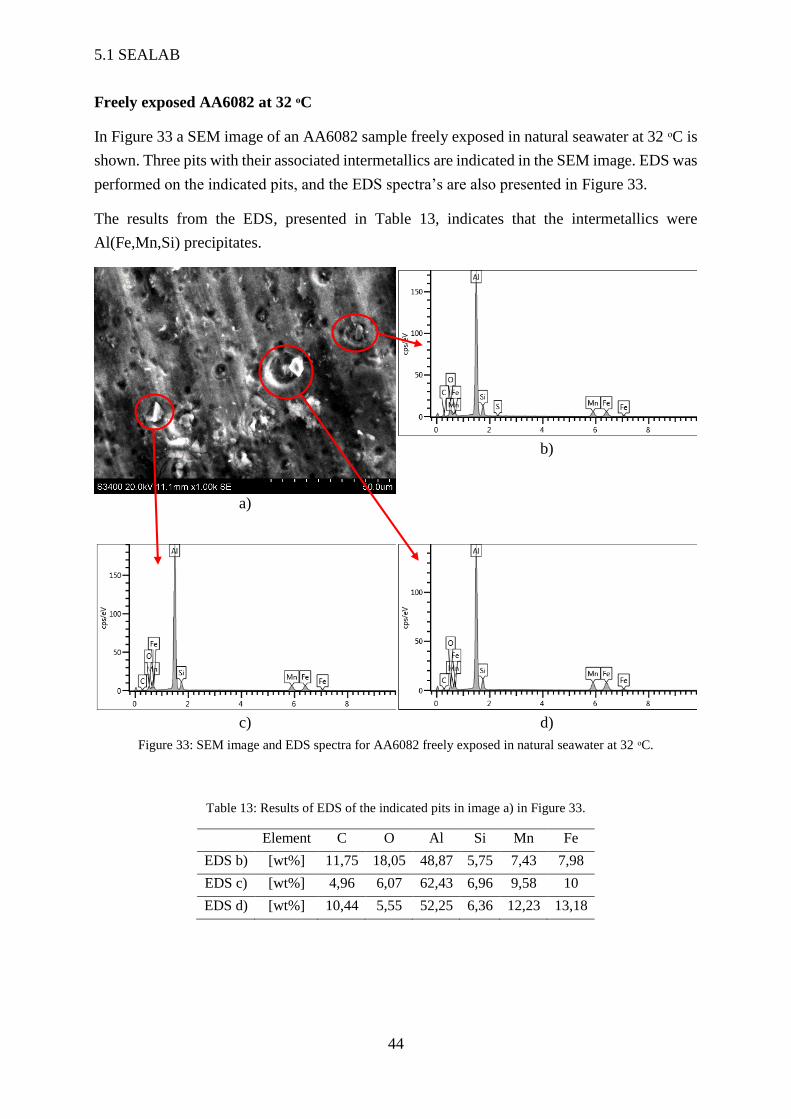
5.1 SEALAB
44
Freely exposed AA6082 at 32 ᵒC
In Figure 33 a SEM image of an AA6082 sample freely exposed in natural seawater at 32 ᵒC is
shown. Three pits with their associated intermetallics are indicated in the SEM image. EDS was
performed on the indicated pits, and the EDS spectra’s are also presented in Figure 33.
The results from the EDS, presented in Table 13, indicates that the intermetallics were
Al(Fe,Mn,Si) precipitates.
a)
b)
c) d)
Figure 33: SEM image and EDS spectra for AA6082 freely exposed in natural seawater at 32 ᵒC.
Table 13: Results of EDS of the indicated pits in image a) in Figure 33.
Element C O Al Si Mn Fe
EDS b) [wt%] 11,75 18,05 48,87 5,75 7,43 7,98
EDS c) [wt%] 4,96 6,07 62,43 6,96 9,58 10
EDS d) [wt%] 10,44 5,55 52,25 6,36 12,23 13,18
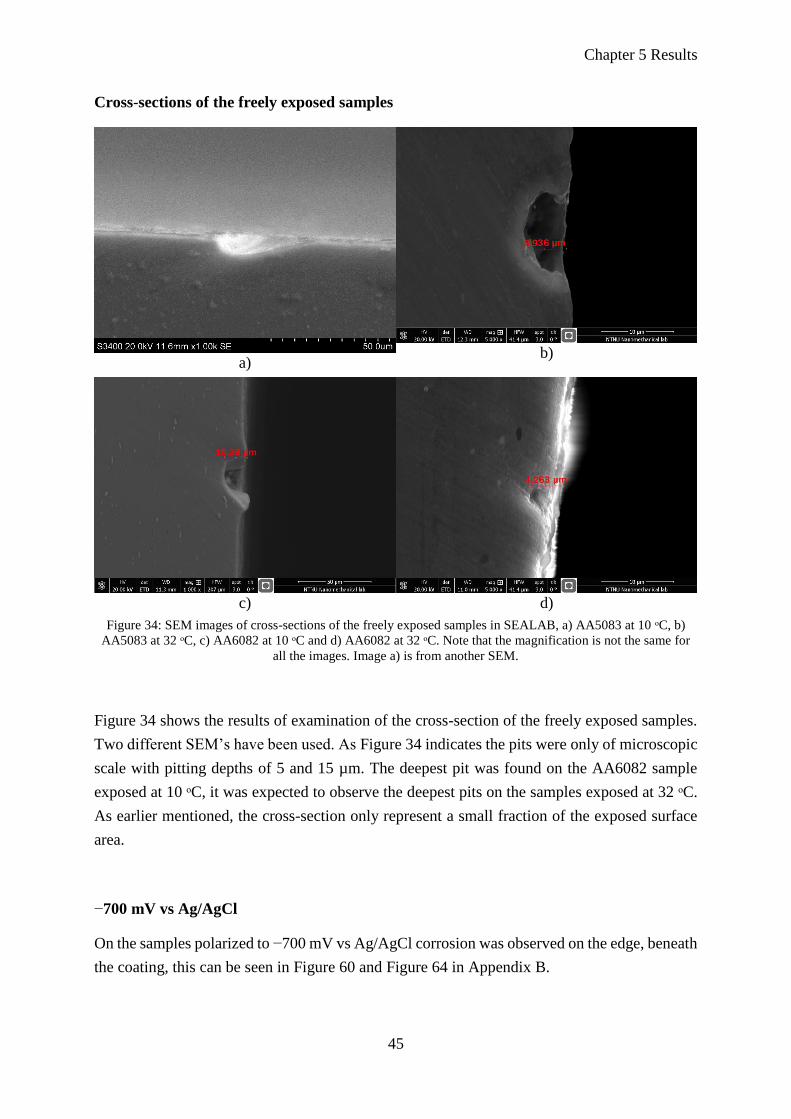
Chapter 5 Results
45
Cross-sections of the freely exposed samples
a) b)
c) d)
Figure 34: SEM images of cross-sections of the freely exposed samples in SEALAB, a) AA5083 at 10 ᵒC, b)
AA5083 at 32 ᵒC, c) AA6082 at 10 ᵒC and d) AA6082 at 32 ᵒC. Note that the magnification is not the same for
all the images. Image a) is from another SEM.
Figure 34 shows the results of examination of the cross-section of the freely exposed samples.
Two different SEM’s have been used. As Figure 34 indicates the pits were only of microscopic
scale with pitting depths of 5 and 15 µm. The deepest pit was found on the AA6082 sample
exposed at 10 ᵒC, it was expected to observe the deepest pits on the samples exposed at 32 ᵒC.
As earlier mentioned, the cross-section only represent a small fraction of the exposed surface
area.
−700 mV vs Ag/AgCl
On the samples polarized to −700 mV vs Ag/AgCl corrosion was observed on the edge, beneath
the coating, this can be seen in Figure 60 and Figure 64 in Appendix B.
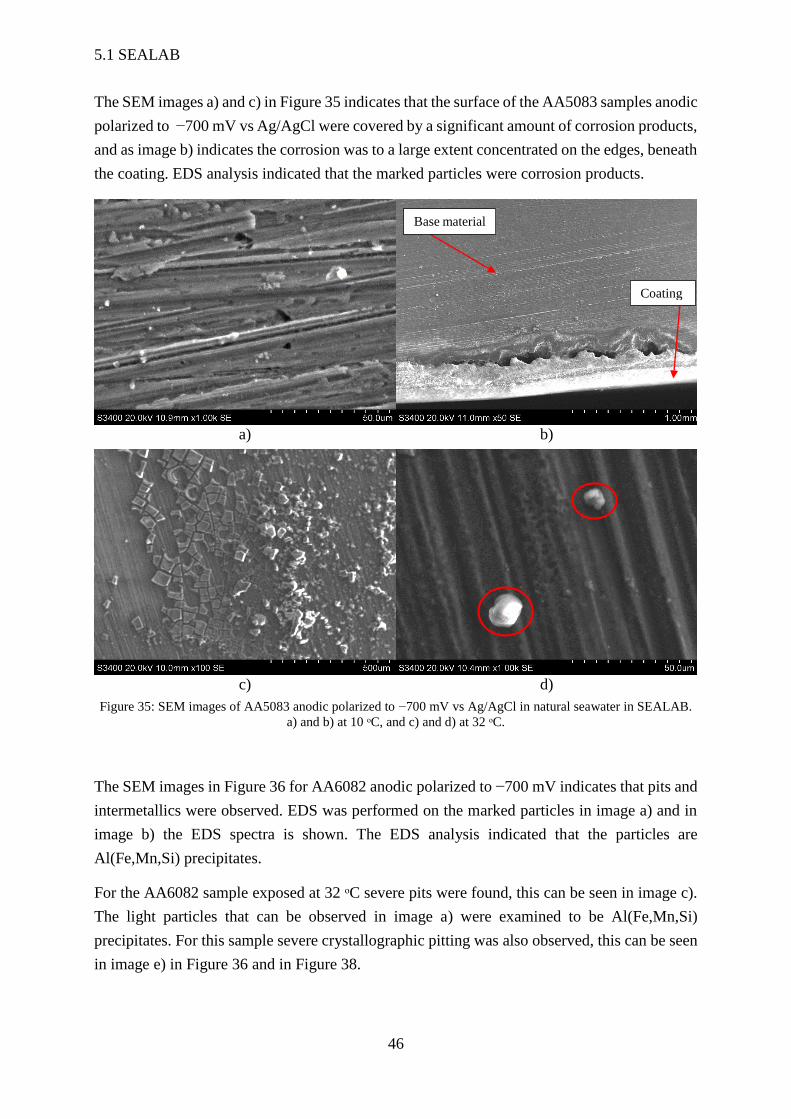
5.1 SEALAB
46
The SEM images a) and c) in Figure 35 indicates that the surface of the AA5083 samples anodic
polarized to −700 mV vs Ag/AgCl were covered by a significant amount of corrosion products,
and as image b) indicates the corrosion was to a large extent concentrated on the edges, beneath
the coating. EDS analysis indicated that the marked particles were corrosion products.
a) b)
c) d)
Figure 35: SEM images of AA5083 anodic polarized to −700 mV vs Ag/AgCl in natural seawater in SEALAB.
a) and b) at 10 ᵒC, and c) and d) at 32 ᵒC.
The SEM images in Figure 36 for AA6082 anodic polarized to −700 mV indicates that pits and
intermetallics were observed. EDS was performed on the marked particles in image a) and in
image b) the EDS spectra is shown. The EDS analysis indicated that the particles are
Al(Fe,Mn,Si) precipitates.
For the AA6082 sample exposed at 32 ᵒC severe pits were found, this can be seen in image c).
The light particles that can be observed in image a) were examined to be Al(Fe,Mn,Si)
precipitates. For this sample severe crystallographic pitting was also observed, this can be seen
in image e) in Figure 36 and in Figure 38.
Coating
Base material

Chapter 5 Results
47
Image d) shows that a significant degree of the corrosion was concentrated to edge beneath the
coating for AA6082 also. This corrosion was in form of crevice corrosion, Figure 37 shows
how the coating formed a crevice.
a)
b)
c) d)
e)
Figure 36: SEM images and EDS of AA6082 anodic polarized to −700 mV vs Ag/AgCl in natural seawater in
SEALAB. Image a) and b) for 10 ᵒC and c), d) and e) for 32 ᵒC.
Coating
Base material
Crevice

5.1 SEALAB
48
Figure 37: Crevice formed beneath the coating.
Cross-section of samples anodic polarized to −700 mV vs Ag/AgCl
Figure 38: SEM image of crystallographic pitting on the cross-section of AA6082 anodic polarized to −700 mV
vs Ag/AgCl at 32 ᵒC.
Figure 38 shows a severe pit observed on the cross-section of the AA6082 sample anodic
polarized to −700 mV vs Ag/AgCl at 32 ᵒC.
Coating
Base
material
Crevice
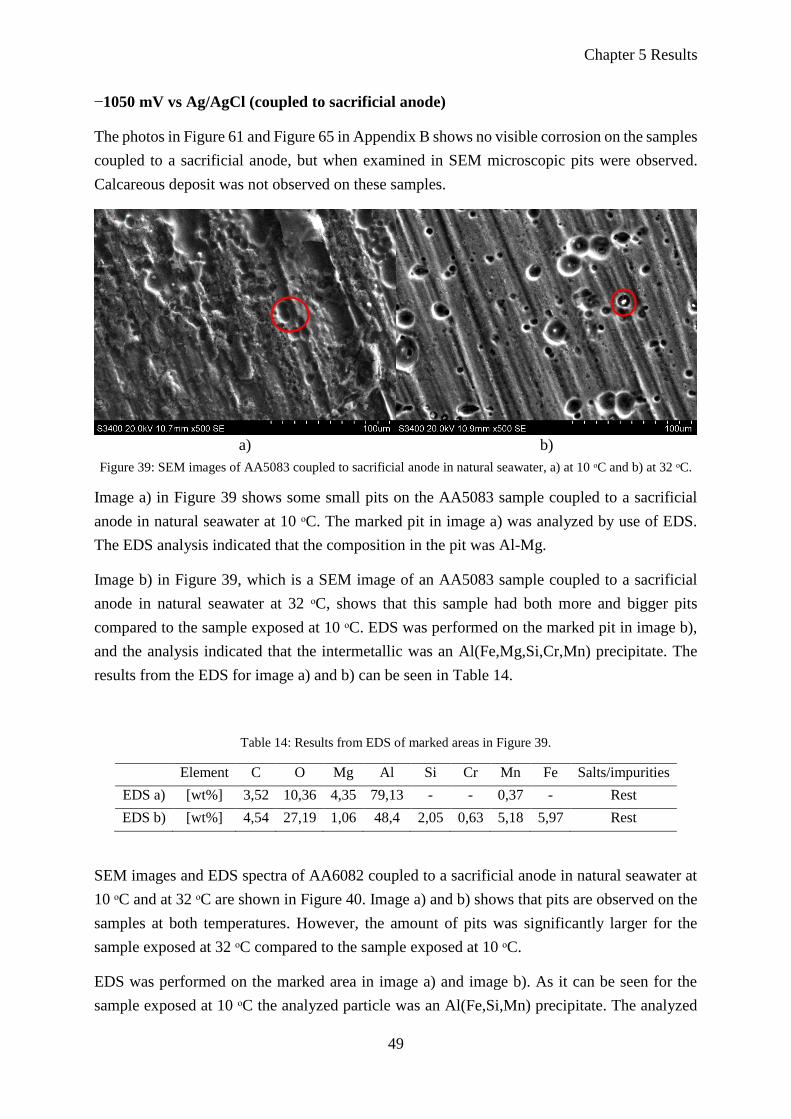
Chapter 5 Results
49
−1050 mV vs Ag/AgCl (coupled to sacrificial anode)
The photos in Figure 61 and Figure 65 in Appendix B shows no visible corrosion on the samples
coupled to a sacrificial anode, but when examined in SEM microscopic pits were observed.
Calcareous deposit was not observed on these samples.
a) b)
Figure 39: SEM images of AA5083 coupled to sacrificial anode in natural seawater, a) at 10 ᵒC and b) at 32 ᵒC.
Image a) in Figure 39 shows some small pits on the AA5083 sample coupled to a sacrificial
anode in natural seawater at 10 ᵒC. The marked pit in image a) was analyzed by use of EDS.
The EDS analysis indicated that the composition in the pit was Al-Mg.
Image b) in Figure 39, which is a SEM image of an AA5083 sample coupled to a sacrificial
anode in natural seawater at 32 ᵒC, shows that this sample had both more and bigger pits
compared to the sample exposed at 10 ᵒC. EDS was performed on the marked pit in image b),
and the analysis indicated that the intermetallic was an Al(Fe,Mg,Si,Cr,Mn) precipitate. The
results from the EDS for image a) and b) can be seen in Table 14.
Table 14: Results from EDS of marked areas in Figure 39.
Element C O Mg Al Si Cr Mn Fe Salts/impurities
EDS a) [wt%] 3,52 10,36 4,35 79,13 - - 0,37 - Rest
EDS b) [wt%] 4,54 27,19 1,06 48,4 2,05 0,63 5,18 5,97 Rest
SEM images and EDS spectra of AA6082 coupled to a sacrificial anode in natural seawater at
10 ᵒC and at 32 ᵒC are shown in Figure 40. Image a) and b) shows that pits are observed on the
samples at both temperatures. However, the amount of pits was significantly larger for the
sample exposed at 32 ᵒC compared to the sample exposed at 10 ᵒC.
EDS was performed on the marked area in image a) and image b). As it can be seen for the
sample exposed at 10 ᵒC the analyzed particle was an Al(Fe,Si,Mn) precipitate. The analyzed
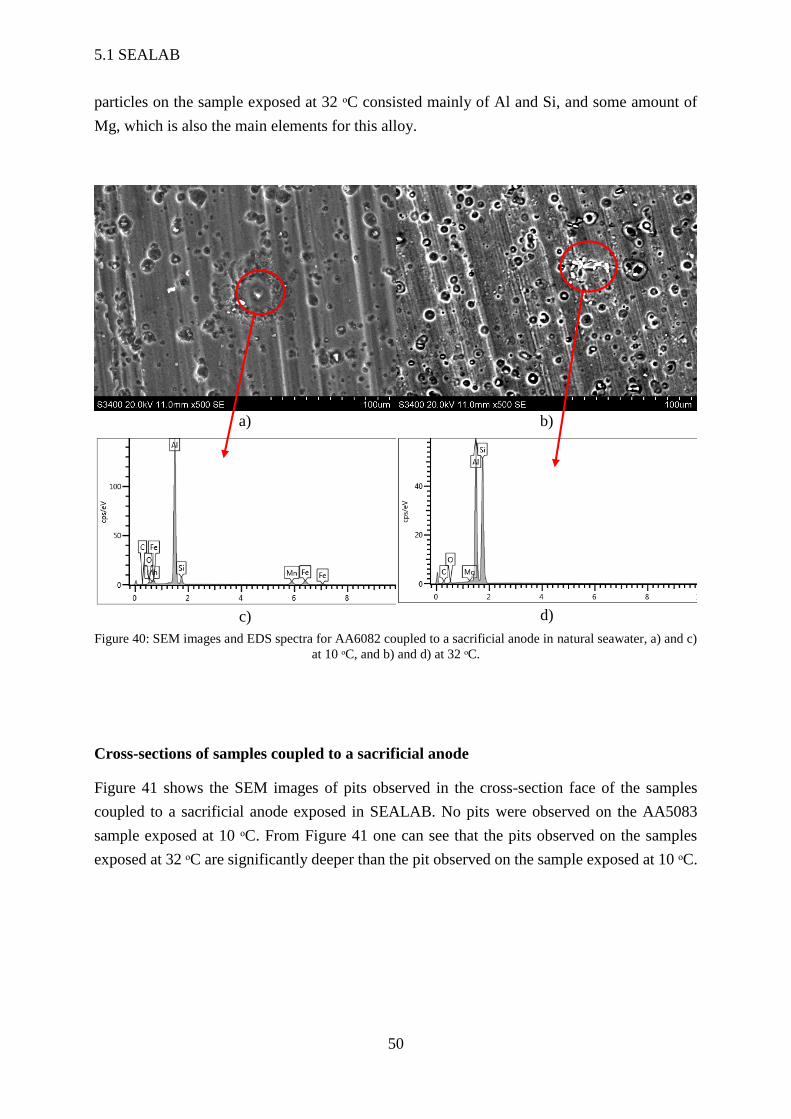
5.1 SEALAB
50
particles on the sample exposed at 32 ᵒC consisted mainly of Al and Si, and some amount of
Mg, which is also the main elements for this alloy.
a) b)
c) d)
Figure 40: SEM images and EDS spectra for AA6082 coupled to a sacrificial anode in natural seawater, a) and c)
at 10 ᵒC, and b) and d) at 32 ᵒC.
Cross-sections of samples coupled to a sacrificial anode
Figure 41 shows the SEM images of pits observed in the cross-section face of the samples
coupled to a sacrificial anode exposed in SEALAB. No pits were observed on the AA5083
sample exposed at 10 ᵒC. From Figure 41 one can see that the pits observed on the samples
exposed at 32 ᵒC are significantly deeper than the pit observed on the sample exposed at 10 ᵒC.
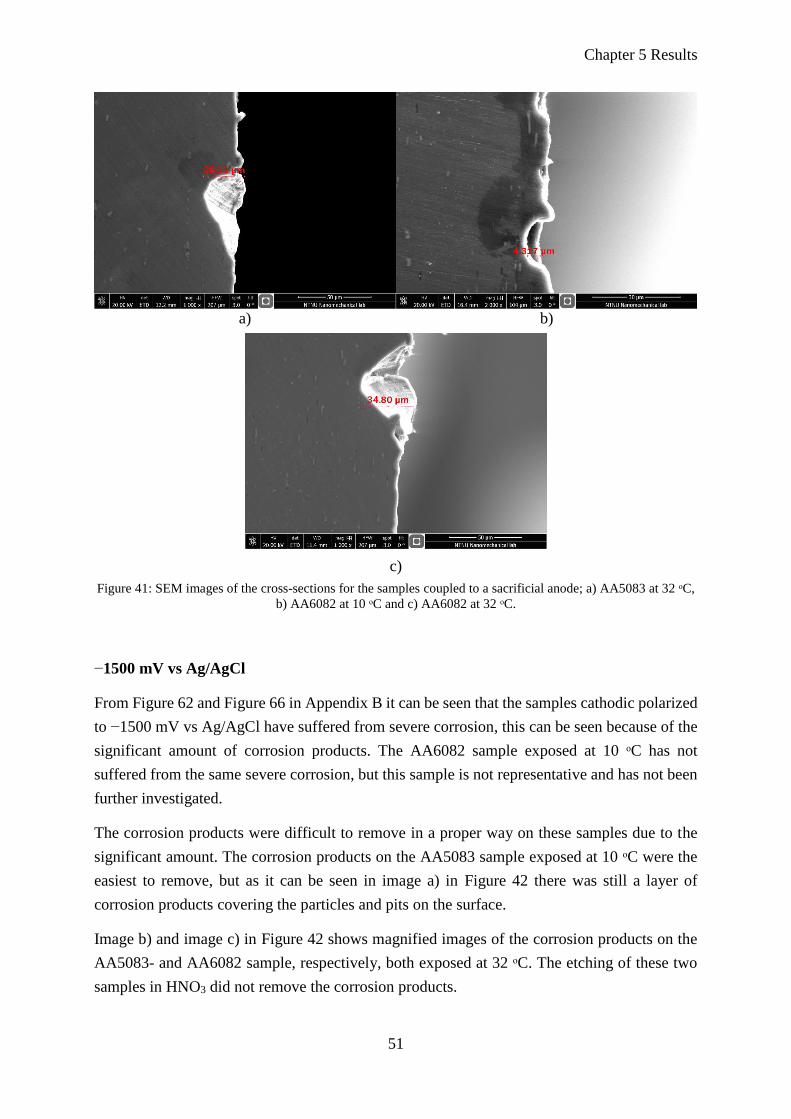
Chapter 5 Results
51
a) b)
c)
Figure 41: SEM images of the cross-sections for the samples coupled to a sacrificial anode; a) AA5083 at 32 ᵒC,
b) AA6082 at 10 ᵒC and c) AA6082 at 32 ᵒC.
−1500 mV vs Ag/AgCl
From Figure 62 and Figure 66 in Appendix B it can be seen that the samples cathodic polarized
to −1500 mV vs Ag/AgCl have suffered from severe corrosion, this can be seen because of the
significant amount of corrosion products. The AA6082 sample exposed at 10 ᵒC has not
suffered from the same severe corrosion, but this sample is not representative and has not been
further investigated.
The corrosion products were difficult to remove in a proper way on these samples due to the
significant amount. The corrosion products on the AA5083 sample exposed at 10 ᵒC were the
easiest to remove, but as it can be seen in image a) in Figure 42 there was still a layer of
corrosion products covering the particles and pits on the surface.
Image b) and image c) in Figure 42 shows magnified images of the corrosion products on the
AA5083- and AA6082 sample, respectively, both exposed at 32 ᵒC. The etching of these two
samples in HNO3 did not remove the corrosion products.

5.1 SEALAB
52
EDS analysis (mapping) of the corrosion products on these samples can be found in Appendix
F. The corrosion products for AA5083 mainly consisted of Al, O and Mg, and Na, Cl and S
from the seawater. The corrosion products for AA6082 consisted of Al, O, Si and C, in addition
to Na from the seawater.
a) b)
c)
Figure 42: SEM images of the samples cathodic polarized to −1500 mV vs Ag/AgCl in natural seawater, a)
AA5083 at 10 ᵒC, b) AA5083 at 32 ᵒC and c) AA6082 at 32 ᵒC.
Cross-section of the samples cathodic polarized to −1500 mV vs Ag/AgCl
Figure 43 shows SEM images of the cross-sections of the samples cathodic polarized to −1500
mV vs Ag/AgCl. The AA5083 sample exposed at 10 ᵒC was the only sample of the ones
cathodic polarized to −1500 mV vs Ag/AgCl where the corrosion products were fairly removed
during rinsing in HNO3. Thus, this was the only sample where pits may be observed.
Image a) in Figure 43 shows two pits observed on the cross-section of the AA5083 sample
exposed at 10 ᵒC. In image b) a cross-section view of the corrosion products on AA5083
exposed at 32 ᵒC can be seen, the thickness of the corrosion products layer was measured to be
above 1 mm. Image c) shows the corrosion products on AA6082 exposed at 32 ᵒC, the thickness

Chapter 5 Results
53
of this was measured to be about 410 µm. As earlier mentioned, the AA6082 sample exposed
at 10 ᵒC is not representative, thus it has not been examined in SEM.
a) b)
c)
Figure 43: SEM images of the cross-sections of the samples cathodic polarized to −1500 mV vs Ag/AgCl; a)
AA5083 at 10 ᵒC, b) AA5083 at 32 ᵒC and c) AA6082 at 32 ᵒC.
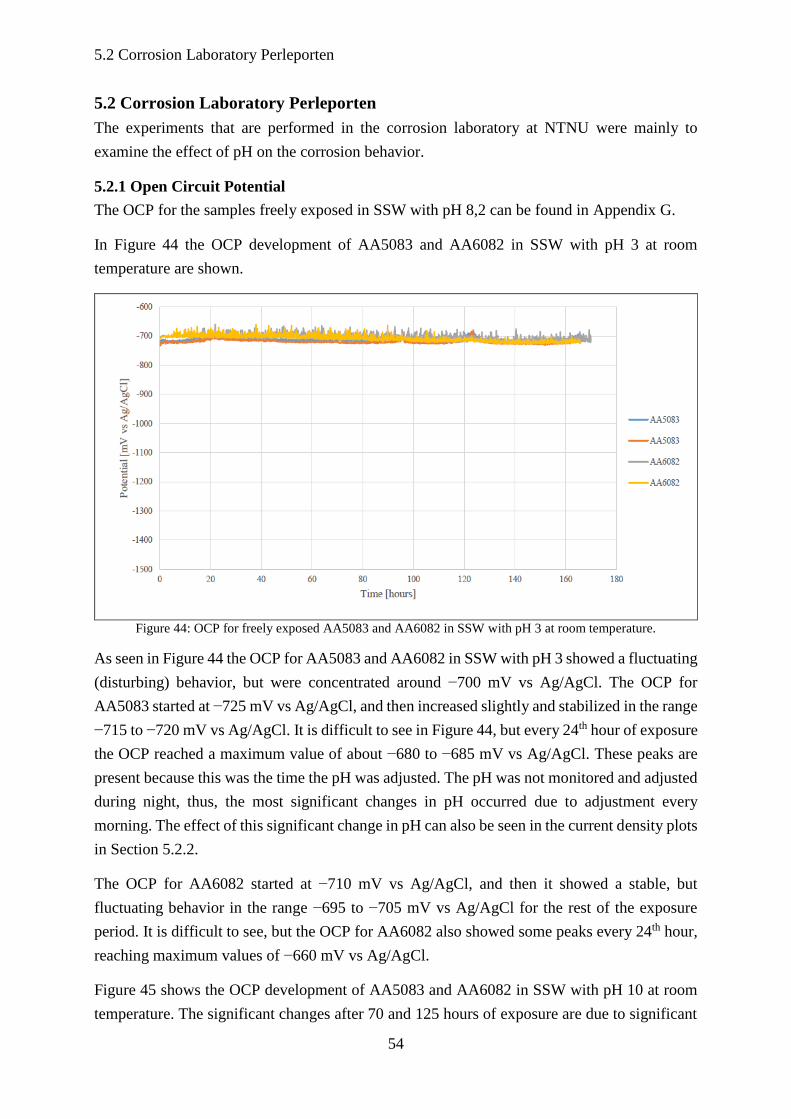
5.2 Corrosion Laboratory Perleporten
54
5.2 Corrosion Laboratory Perleporten
The experiments that are performed in the corrosion laboratory at NTNU were mainly to
examine the effect of pH on the corrosion behavior.
5.2.1 Open Circuit Potential
The OCP for the samples freely exposed in SSW with pH 8,2 can be found in Appendix G.
In Figure 44 the OCP development of AA5083 and AA6082 in SSW with pH 3 at room
temperature are shown.
Figure 44: OCP for freely exposed AA5083 and AA6082 in SSW with pH 3 at room temperature.
As seen in Figure 44 the OCP for AA5083 and AA6082 in SSW with pH 3 showed a fluctuating
(disturbing) behavior, but were concentrated around −700 mV vs Ag/AgCl. The OCP for
AA5083 started at −725 mV vs Ag/AgCl, and then increased slightly and stabilized in the range
−715 to −720 mV vs Ag/AgCl. It is difficult to see in Figure 44, but every 24th hour of exposure
the OCP reached a maximum value of about −680 to −685 mV vs Ag/AgCl. These peaks are
present because this was the time the pH was adjusted. The pH was not monitored and adjusted
during night, thus, the most significant changes in pH occurred due to adjustment every
morning. The effect of this significant change in pH can also be seen in the current density plots
in Section 5.2.2.
The OCP for AA6082 started at −710 mV vs Ag/AgCl, and then it showed a stable, but
fluctuating behavior in the range −695 to −705 mV vs Ag/AgCl for the rest of the exposure
period. It is difficult to see, but the OCP for AA6082 also showed some peaks every 24th hour,
reaching maximum values of −660 mV vs Ag/AgCl.
Figure 45 shows the OCP development of AA5083 and AA6082 in SSW with pH 10 at room
temperature. The significant changes after 70 and 125 hours of exposure are due to significant

Chapter 5 Results
55
adjustment of the pH. After 70 hours the pH was adjusted from 9,55 to 10,84, and after 125
hours it was adjusted from 9,78 to 11,5.
Figure 45: OCP for freely exposed AA5083 and AA6082 in SSW with pH 10 at room temperature.
The OCP-curves for AA5083 and AA6082 in SSW with pH 10 in Figure 45 were more spread
out than the OCP-curves for SSW with pH 8,2 and pH 3. The OCP for AA5083 started at −1250
mV vs Ag/AgCl, and then increased relatively fast at the same time as the two curves separated.
The curves increased to values of −1000 mV vs Ag/AgCl and −1040 mV vs Ag/AgCl. After 23
hours of exposure, the curves were unified and had the same behavior for the rest of the
exposure period. The OCP experienced a little fluctuation, but after 50 hours, the tendency was
that the OCP slightly increased and then suddenly had a significant drop after 70 hours. After
this, between 80 and 125 hours of exposure, the OCP had a stable increase from −1100 mV vs
Ag/AgCl to −1000 mV vs Ag/AgCl. Then, a sudden and significant drop down to −1150 mV
vs Ag/AgCl occurred. After this, the OCP had a stable increase until the end of the exposure
time.
The OCP curves for AA6082 started completely different, one started at −1300 mV vs Ag/AgCl
and the other one started at −700 mV vs Ag/AgCl. The yellow curve followed the same
tendency as the OCP for AA5083, but lied in the range −1500 to −2000 mV below the AA5083
curves. The grey curve was relative stable around −700 mV vs Ag/AgCl the first 20 hours of
exposure, and then it started to decrease towards the AA6082-curve. After 30 hours, the grey
curve decreased relative rapidly and after 50 hours, it reached −1310 mV vs Ag/AgCl, which
is about 700 mV below the other AA6082-curve. After 70 hours, the two AA6082-curves were
unified and followed the same trend for the rest of the exposure period. However, differences
up to 70 mV between the two curves could be observed for the last 100 hours of exposure.
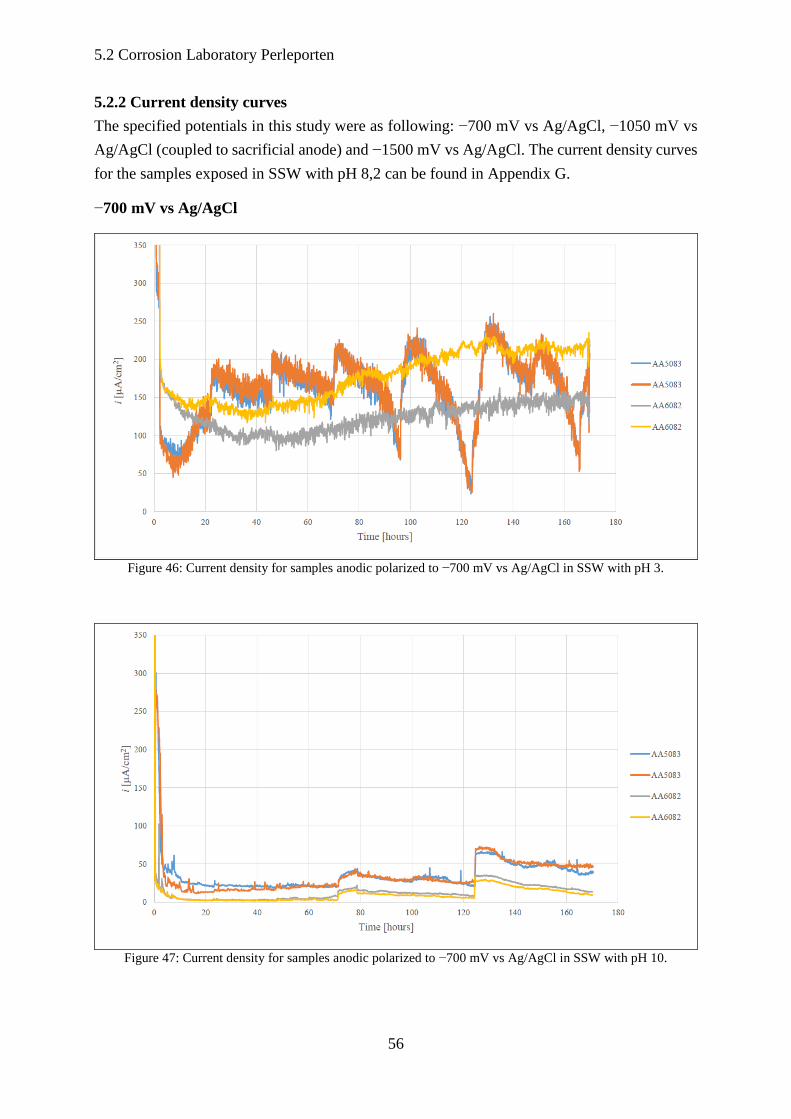
5.2 Corrosion Laboratory Perleporten
56
5.2.2 Current density curves
The specified potentials in this study were as following: −700 mV vs Ag/AgCl, −1050 mV vs
Ag/AgCl (coupled to sacrificial anode) and −1500 mV vs Ag/AgCl. The current density curves
for the samples exposed in SSW with pH 8,2 can be found in Appendix G.
−700 mV vs Ag/AgCl
Figure 46: Current density for samples anodic polarized to −700 mV vs Ag/AgCl in SSW with pH 3.
Figure 47: Current density for samples anodic polarized to −700 mV vs Ag/AgCl in SSW with pH 10.
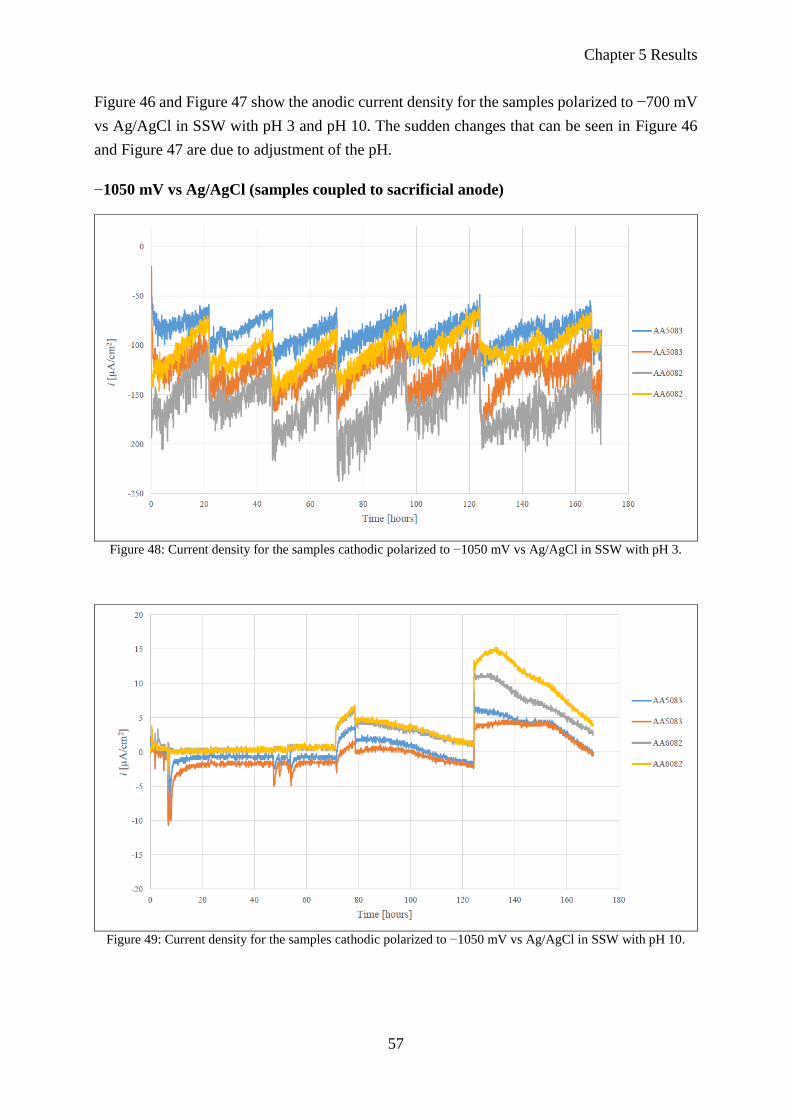
Chapter 5 Results
57
Figure 46 and Figure 47 show the anodic current density for the samples polarized to −700 mV
vs Ag/AgCl in SSW with pH 3 and pH 10. The sudden changes that can be seen in Figure 46
and Figure 47 are due to adjustment of the pH.
−1050 mV vs Ag/AgCl (samples coupled to sacrificial anode)
Figure 48: Current density for the samples cathodic polarized to −1050 mV vs Ag/AgCl in SSW with pH 3.
Figure 49: Current density for the samples cathodic polarized to −1050 mV vs Ag/AgCl in SSW with pH 10.

5.2 Corrosion Laboratory Perleporten
58
Figure 48 and Figure 49 show the current density for the samples coupled to a sacrificial anode
in SSW with pH 3 and pH 10. The sudden changes that can be seen in Figure 48 and Figure 49
are due to adjustment of the pH.
−1500 mV vs Ag/AgCl
Figure 50 and Figure 51 show the current density for the samples polarized to −1500 mV vs
Ag/AgCl in SSW with pH 3 and pH 10. The sudden changes that can be seen in Figure 50 is
due to adjustment of the pH.
Figure 50: Current density for the samples cathodic polarized to −1500 mV vs Ag/AgCl in SSW with pH 3.
Figure 51: Current density for the samples cathodic polarized to −1500 mV vs Ag/AgCl in SSW with pH 10.
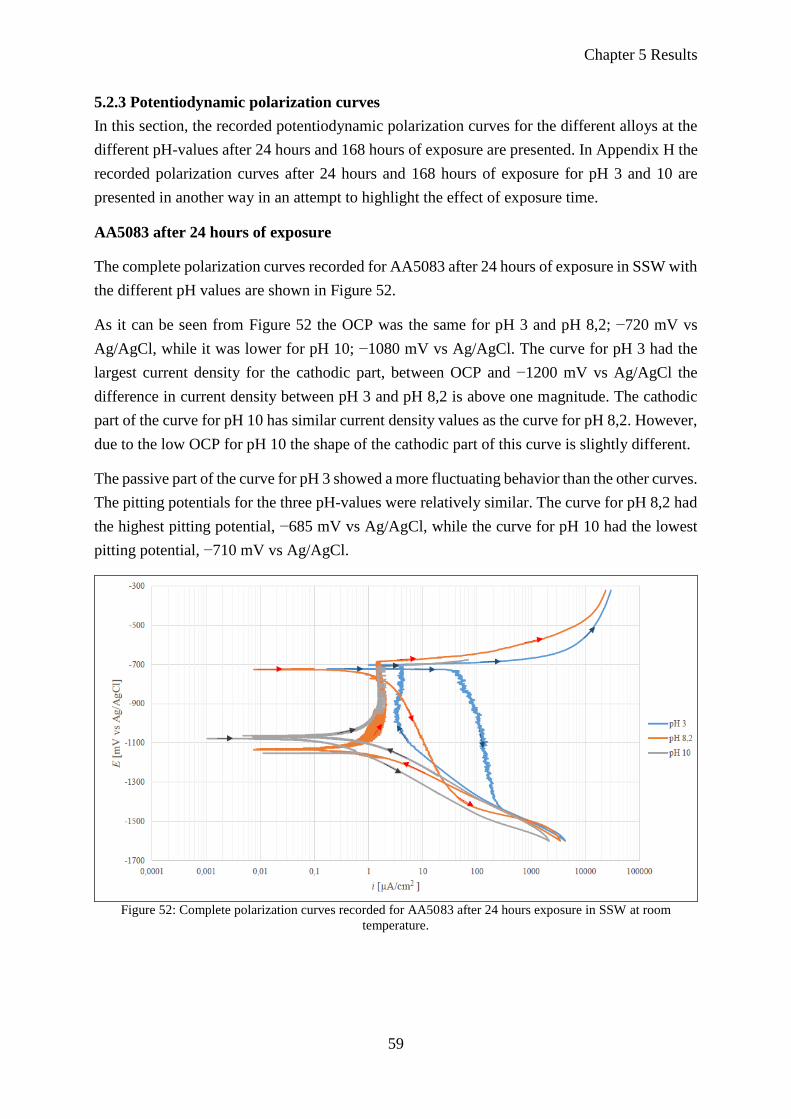
Chapter 5 Results
59
5.2.3 Potentiodynamic polarization curves
In this section, the recorded potentiodynamic polarization curves for the different alloys at the
different pH-values after 24 hours and 168 hours of exposure are presented. In Appendix H the
recorded polarization curves after 24 hours and 168 hours of exposure for pH 3 and 10 are
presented in another way in an attempt to highlight the effect of exposure time.
AA5083 after 24 hours of exposure
The complete polarization curves recorded for AA5083 after 24 hours of exposure in SSW with
the different pH values are shown in Figure 52.
As it can be seen from Figure 52 the OCP was the same for pH 3 and pH 8,2; −720 mV vs
Ag/AgCl, while it was lower for pH 10; −1080 mV vs Ag/AgCl. The curve for pH 3 had the
largest current density for the cathodic part, between OCP and −1200 mV vs Ag/AgCl the
difference in current density between pH 3 and pH 8,2 is above one magnitude. The cathodic
part of the curve for pH 10 has similar current density values as the curve for pH 8,2. However,
due to the low OCP for pH 10 the shape of the cathodic part of this curve is slightly different.
The passive part of the curve for pH 3 showed a more fluctuating behavior than the other curves.
The pitting potentials for the three pH-values were relatively similar. The curve for pH 8,2 had
the highest pitting potential, −685 mV vs Ag/AgCl, while the curve for pH 10 had the lowest
pitting potential, −710 mV vs Ag/AgCl.
Figure 52: Complete polarization curves recorded for AA5083 after 24 hours exposure in SSW at room
temperature.
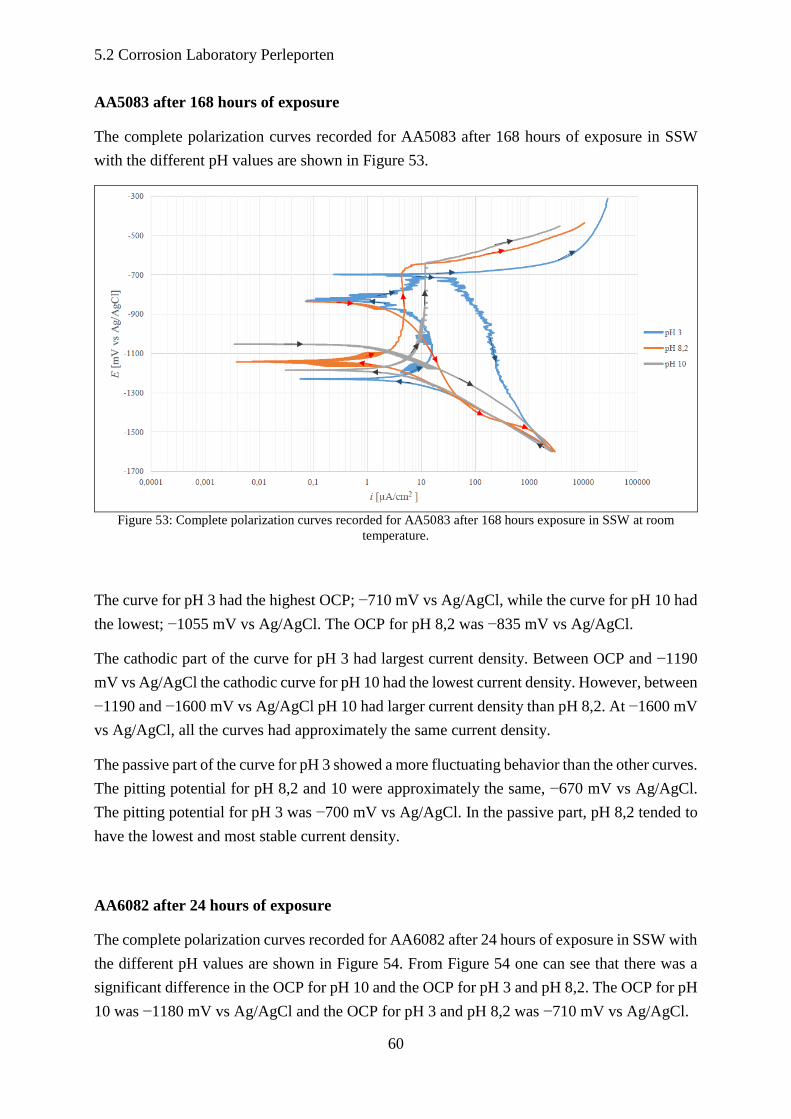
5.2 Corrosion Laboratory Perleporten
60
AA5083 after 168 hours of exposure
The complete polarization curves recorded for AA5083 after 168 hours of exposure in SSW
with the different pH values are shown in Figure 53.
Figure 53: Complete polarization curves recorded for AA5083 after 168 hours exposure in SSW at room
temperature.
The curve for pH 3 had the highest OCP; −710 mV vs Ag/AgCl, while the curve for pH 10 had
the lowest; −1055 mV vs Ag/AgCl. The OCP for pH 8,2 was −835 mV vs Ag/AgCl.
The cathodic part of the curve for pH 3 had largest current density. Between OCP and −1190
mV vs Ag/AgCl the cathodic curve for pH 10 had the lowest current density. However, between
−1190 and −1600 mV vs Ag/AgCl pH 10 had larger current density than pH 8,2. At −1600 mV
vs Ag/AgCl, all the curves had approximately the same current density.
The passive part of the curve for pH 3 showed a more fluctuating behavior than the other curves.
The pitting potential for pH 8,2 and 10 were approximately the same, −670 mV vs Ag/AgCl.
The pitting potential for pH 3 was −700 mV vs Ag/AgCl. In the passive part, pH 8,2 tended to
have the lowest and most stable current density.
AA6082 after 24 hours of exposure
The complete polarization curves recorded for AA6082 after 24 hours of exposure in SSW with
the different pH values are shown in Figure 54. From Figure 54 one can see that there was a
significant difference in the OCP for pH 10 and the OCP for pH 3 and pH 8,2. The OCP for pH
10 was −1180 mV vs Ag/AgCl and the OCP for pH 3 and pH 8,2 was −710 mV vs Ag/AgCl.

Chapter 5 Results
61
The curve for pH 3 had clearly the largest current density and the curve for pH 10 has clearly
the lowest current density. At −1600 mV vs Ag/AgCl the difference is above one magnitude.
In the passive part of the curves, the difference between pH 3 and pH 10 is approximately two
magnitudes.
The pitting potential for pH 8,2 was the highest, −660 mV vs Ag/AgCl. The pitting potential
for pH 3 was −700 mV vs Ag/AgCl. The curve for pH 10 did not reach the pitting potential;
this is due to the low OCP.
Figure 54: Complete polarization curves recorded for AA6082 after 24 hours exposure in SSW at room
temperature.
AA6082 after 168 hours of exposure
The complete polarization curves recorded for AA6082 after 24 hours of exposure in SSW with
the different pH values are shown in Figure 55. It can be seen from Figure 55 that the OCP for
pH 3, 8,2 and 10 were as following; −725, −855 and −1290 mV vs Ag/AgCl. The curve for pH
3 had clearly the largest current density. The curve for pH 8,2 had the lowest current density in
the passive part of the curve, but the current density for pH 10 in the passive part tended to be
more stable.
The pitting potential for pH 8,2 was −665 mV vs Ag/AgCl. The pitting potential for pH 3 was
−690 mV vs Ag/AgCl. The curve for pH 10 does not reach the pitting potential.
Characteristic values from the polarization curves for AA5083 and AA6082 after one day (24
hours) of exposure and after one week (168 hours) of exposure are shown in Table 15 and Table
16.
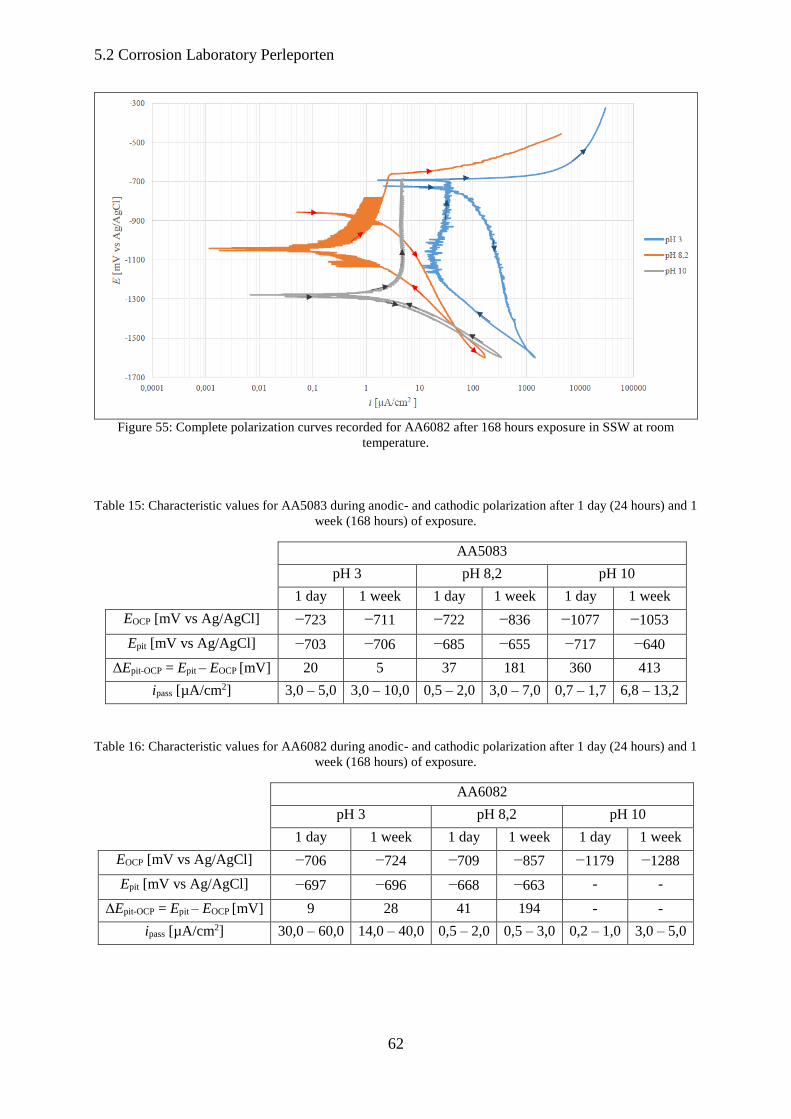
5.2 Corrosion Laboratory Perleporten
62
Figure 55: Complete polarization curves recorded for AA6082 after 168 hours exposure in SSW at room
temperature.
Table 15: Characteristic values for AA5083 during anodic- and cathodic polarization after 1 day (24 hours) and 1
week (168 hours) of exposure.
AA5083
pH 3 pH 8,2 pH 10
1 day 1 week 1 day 1 week 1 day 1 week
EOCP [mV vs Ag/AgCl] −723 −711 −722 −836 −1077 −1053
Epit [mV vs Ag/AgCl] −703 −706 −685 −655 −717 −640
ΔEpit-OCP = Epit – EOCP [mV] 20 5 37 181 360 413
ipass [µA/cm2] 3,0 – 5,0 3,0 – 10,0 0,5 – 2,0 3,0 – 7,0 0,7 – 1,7 6,8 – 13,2
Table 16: Characteristic values for AA6082 during anodic- and cathodic polarization after 1 day (24 hours) and 1
week (168 hours) of exposure.
AA6082
pH 3 pH 8,2 pH 10
1 day 1 week 1 day 1 week 1 day 1 week
EOCP [mV vs Ag/AgCl] −706 −724 −709 −857 −1179 −1288
Epit [mV vs Ag/AgCl] −697 −696 −668 −663 - -
ΔEpit-OCP = Epit – EOCP [mV] 9 28 41 194 - -
ipass [µA/cm2] 30,0 – 60,0 14,0 – 40,0 0,5 – 2,0 0,5 – 3,0 0,2 – 1,0 3,0 – 5,0

Chapter 5 Results
63
5.2.4 SEM images
The freely exposed samples were examined in SEM to determine the degree of pits with the
different pH-values.
AA5083
a) b)
c)
Figure 56: SEM images of AA5083 freely exposed in SSW with different pH-values, a) pH 3, b) pH 8,2 and c)
pH 10.
Figure 56 shows SEM images of AA5083 freely exposed in SSW with different pH-values. As
it can be seen in image a) the surface of the sample exposed at pH 3 had a layer of a deposit or
corrosion products, and the pits could not be observed due to this. The etching in 65% HNO3
did not remove this layer. In image b) some minor pits on the sample exposed at pH 8,2 can be
seen. Image c) show the surface of the sample exposed at pH 10, and as it can be seen some pits
were observed and the pits tended to be less severe than for the sample exposed at pH 8,2.
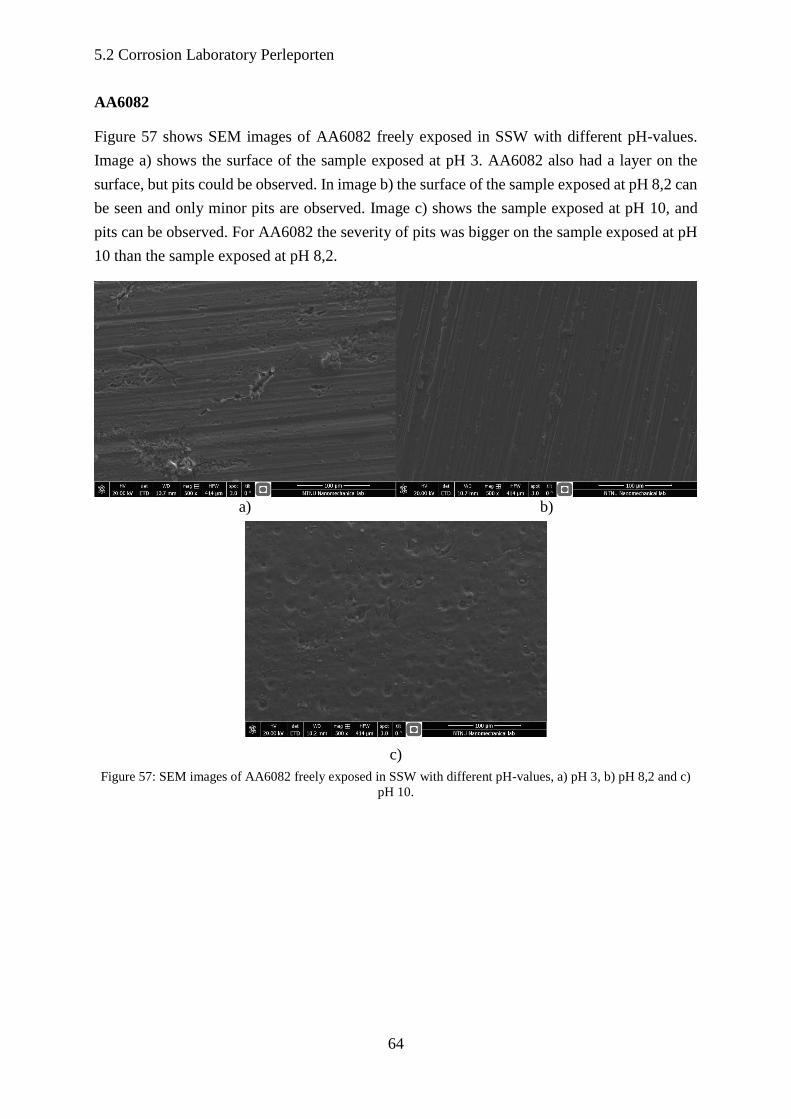
5.2 Corrosion Laboratory Perleporten
64
AA6082
Figure 57 shows SEM images of AA6082 freely exposed in SSW with different pH-values.
Image a) shows the surface of the sample exposed at pH 3. AA6082 also had a layer on the
surface, but pits could be observed. In image b) the surface of the sample exposed at pH 8,2 can
be seen and only minor pits are observed. Image c) shows the sample exposed at pH 10, and
pits can be observed. For AA6082 the severity of pits was bigger on the sample exposed at pH
10 than the sample exposed at pH 8,2.
a) b)
c)
Figure 57: SEM images of AA6082 freely exposed in SSW with different pH-values, a) pH 3, b) pH 8,2 and c)
pH 10.
Chapter 6 Discussion
65
6 Discussion
6.1 Effect of temperature
6.1.1 OCP and pitting potential
The temperature has an effect on the OCP for the freely exposed samples, this can be seen in
Figure 21 for both alloys. The tendency was that OCP for the samples exposed at 32 ᵒC was
more negative than OCP for the samples exposed at 10 ᵒC. The literature provides little
information about the temperature dependency of OCP for aluminium alloys, but it is
reasonable to think that the behavior of the OCP is related to the behavior of the critical pitting
potential with varying temperature. The OCP for the samples in this study behaved in
accordance to how Z. A. Foroulis and M. J. Thubrikar [26], and J. Soltis, et al. [27] explains
that the critical pitting potential behave with varying temperature3.
The results from the recorded polarization curves presented in Section 5.1.3, Table 8 and Table
9, indicate the same effect of temperature on OCP as discussed above. The pitting potentials
after one week for AA5083 are reasonable and in accordance with theory [25, 26]. The pitting
potential for the sample exposed at 10 ᵒC was −585 mV vs Ag/AgCl, and for the sample at 32
ᵒC it was −700 mV vs Ag/AgCl. After six weeks of exposure, the pitting potential for AA5083
exposed at 10 ᵒC and 32 ᵒC were −620 and −519 mV vs Ag/AgCl, respectively. This is not in
accordance with theory, because the sample exposed at the highest temperature is supposed to
have the most negative pitting potential [26, 27]. The results show that the pitting potential for
AA6082 behaved in accordance with theory, see Table 9.
pit-OCP pit OCPE E E (6.1)
The difference between OCP and pitting potential, Equation 6.1, is an interesting and important
value considering resistance against pitting corrosion. The bigger this difference is the better.
The characteristic values in Table 8 and Table 9 show this difference after one week and six
weeks of exposure. For AA5083 after one week of exposure this difference was 127 mV for the
sample at 10 o C and 222 mV for the sample at 32 o C. After six weeks of exposure, this difference
was 200 mV at 10 ᵒC and 400 mV at 32 ᵒC. These results implies that the corrosion resistance
was better for the sample exposed at 32 ᵒC. This is somewhat conflicting with the surface
examinations, discussed in Section 6.1.3, of these samples. Because more pits were observed
on the sample exposed at 32 ᵒC than on the sample exposed at 10 ᵒC.
3 When comparing the results of this study to other studies and theory, all electrochemical potential values are
converted to the actual reference used, such that the basis for comparison is correct.
6.1 Effect of temperature
66
For AA6082 after one week the difference was 250 mV at 10 ᵒC and 240 mV at 32 ᵒC, and after
six weeks, the difference was 300 mV at 10 ᵒC and 200 mV at 32 ᵒC. These results implies that
the sample exposed at 10 ᵒC exhibited the best resistance to corrosion, and this is more in
accordance with the observations from the surface examinations, which shows more pits for the
sample at 32 ᵒC. As mentioned in Section 4.4.1 the complete polarization curves for AA6082
were recorded on samples that had only been freely exposed for six weeks, and not experienced
the previous anodic- and cathodic polarizations. This was not the case for AA5083, the samples
used for recording these complete polarization curves had experienced all the previous anodic-
and cathodic polarizations. The previous polarizations may have made the AA5083 samples
defect, and not representative, this may have affected the results. The ideal way to record
potentiodynamic polarization curves is to have a new sample for every polarization. This could
not be done in this study due to lack of test material. For further studies it is recommended to
record the polarization curves on new samples for every polarization, this will provide more
reliable and correct results.
6.1.2 Current density
The current density for the polarized samples can be seen in Figure 22, Figure 23 and Figure
24. As explained in Section 2.3 the cathodic current demand for aluminium is mainly restricted
to the cathodic intermetallic sites, but when calculating/plotting the current density it was
assumed that the current is supplied to the complete exposed aluminium surface area.
The temperature clearly had the biggest effect on the current density for the samples anodic
polarized to −700 mV vs Ag/AgCl, and especially for the AA5083 samples. This can be seen
in Figure 22. For the AA5083 samples there was a slightly difference in anodic current for 10
ᵒC and 32 ᵒC from the very beginning of the exposure, and the difference increased with
increased exposure time. For the AA6082 samples, there was no significant difference in anodic
current for 10 ᵒC and 32 ᵒC for the first 550 hours of exposure. After 550 hours of exposure, the
anodic current for the sample exposed at 32 o C started to increase, and the anodic current tended
to increase with increasing exposure time.
The significant effect of temperature on the anodic current for the samples polarized to −700
mV vs Ag/AgCl may be due to the following explanation. These samples were polarized to
approximately the same potential as the critical pitting potential for aluminium in seawater
which is about −0,75 VSCE (−706 mV vs Ag/AgCl) [12]. The pitting potentials presented in
Section 5.1.3 were generally in a range slightly more positive than −700 mV vs Ag/AgCl, but
as these pitting potentials varied somewhat the samples may have been polarized more positive
than the pitting potential for periods. As earlier discussed, the critical pitting potential of
samples exposed at 32 ᵒC should be more negative than for 10 ᵒC. Thus, corrosion was more
easily initiated on the samples exposed at 32 ᵒC, and as the rate of corrosion increased, the

Chapter 6 Discussion
67
anodic current increased. It should be mentioned that the corrosion on these samples to a large
extent was crevice corrosion in crevices formed beneath the coating, this is discussed more in
detail in Section 6.2. Due to the acidic environment, crevice corrosion is usually initiated at
potentials more negative than the pitting potential. Thus, it can be concluded that the samples
were polarized above the potential for crevice corrosion to initiate, and crevice corrosion was
the main contributing factor for the increased anodic current.
In Figure 23 the current densities for the samples coupled to a sacrificial anode are shown. It
can be seen that the current densities for the samples exposed at 32 ᵒC decreased faster and were
lower than for the samples exposed at 10 ᵒC. As explained in Section 2.3, the cathodic current
is mainly restricted to the cathodic intermetallic sites. As it can be seen from the results
presented in Section 5.1.4 more pits and intermetallic particles were observed for the samples
exposed at 32 ᵒC. According to theory [34] is detachment and isolation of such cathodic
intermetallic particles, Figure 12, the main factor for reducing the current demand, and thus the
current density decreased fastest and was lowest for the samples exposed at 32 ᵒC. The samples
exposed at 10 ᵒC had more positive OCP than the samples exposed at 32 ᵒC. This implies that
the change in potential, between OCP and the potential from the anode, is larger for the samples
exposed at 10 ᵒC than for the samples at 32 ᵒC. This may also be a contributing factor for why
the samples exposed at 32 ᵒC had the lowest current density. The potentials from the sacrificial
anodes in this study can be found in Appendix C.
In Figure 24 the current densities for the samples cathodic polarized to −1500 mV vs Ag/AgCl
are shown. Remember that the samples exposed at 32 ᵒC were polarized to −1580 mV vs
Ag/AgCl. The AA6082 sample exposed at 10 o C is not representative, and will not be discussed.
Due to lack of test-material, there was no redundancy for this sample at this condition. For the
other samples it can be observed that for the cathodic current densities (after 800 hours) the
AA6082 sample exposed at 32 ᵒC had the lowest, −6 µA/cm2. While for the AA5083 samples
one can see that the samples exposed at 10 ᵒC had lower current densities, −9,9 and −10,7
µA/cm2, than the samples exposed at 32 ᵒC, −13,3 and −16,3 µA/cm2. The course of events for
these samples were as following. The rate of the cathodic reaction was high due to the negative
potential, this caused the high cathodic current density in the beginning. The cathodic
intermetallic particles were detached and isolated from the aluminium matrix at a high rate, and
hence the cathodic current density decreased rapidly. The exposed surface was covered with a
layer of corrosion products, and the cathodic current density was kept at a low level. The
samples exposed at 32 ᵒC were polarized to a more negative potential than the samples at 10
ᵒC, and this is probably why the current density was slightly larger for these samples.
6.1 Effect of temperature
68
6.1.3 Surface examinations
The results from the surface examinations presented in Section 5.1.4 clearly indicate that the
temperature had an effect on the corrosion behavior. For the exposed samples, both AA5083
and AA6082, it was common that more severe corrosion was found on the samples exposed at
32 ᵒC.
For the freely exposed samples, one can see from the SEM images that the number of pits were
significantly higher and the pits were bigger for the samples exposed at 32 ᵒC compared to the
samples exposed at 10 ᵒC. The same can be observed on the samples coupled to the sacrificial
anode. It should be mentioned that the observed corrosion on these samples is of microscopic
scale, and is not referred to as corrosion attacks.
For the samples anodic polarized to −700 mV vs Ag/AgCl it can be seen from Figure 60 and
Figure 64 in Appendix B that more white deposit as a result of the corrosion process is escaping
from under the coating on the samples exposed at 32 ᵒC compared to the samples exposed at 10
ᵒC. The crevice corrosion beneath the coating is discussed more in detail in Section 6.2.
For the samples cathodic polarized to −1500 mV vs Ag/AgCl, −1580 mV vs Ag/AgCl for the
samples exposed at 32 ᵒC, a thick layer of corrosion products was observed on the samples
exposed at 32 o C. This can be seen both in Figure 43, and in Figure 66 in Appendix B. Corrosion
was also observed on the AA5083 sample exposed at 10 ᵒC, this can be seen in Figure 62 in
Appendix B, but the severity was not of the same degree as for the samples exposed at 32 ᵒC.
The explanation is the same as discussed earlier, at least for the samples polarized to −700 mV
vs Ag/AgCl, increased temperature lower the critical pitting potential and the potential for
crevice corrosion to initiate, and thus corrosion is more easily initiated on the samples exposed
at the highest temperature. By use of the potentiodynamic polarization curves a reasonable
explanation for the samples coupled to a sacrificial anode can be given. Considering the
complete polarization curves for AA6082 in Figure 27 and Figure 28, a plot can be seen in
Figure 69 in Appendix D, it can be seen that at a potential of −1050 mV vs Ag/AgCl the cathodic
current density was larger for 32 ᵒC than for 10 ᵒC. This implies that there were more cathodic
activity (corrosion activity), Figure 12, on the samples exposed at 32 ᵒC and, thus more pits
were observed on these samples. This confirms the discussion in Section 6.1.2 regarding why
the cathodic current density for the samples exposed at 32 ᵒC decreases faster and are lower
than for the samples at 10 ᵒC. The rate of the sequence in Figure 12 increases with increased
temperature.
The samples polarized to −1500 mV vs Ag/AgCl were clearly in the pitting corrosion region of
the diagram in Figure 3. By increasing the temperature, in addition to the fact that the samples
exposed at 32 ᵒC experienced at potential of −1580 mV vs Ag/AgCl, make it reasonable to
suggest that these samples may alternated between the pitting corrosion region and the general
attack region. Thus, such severe corrosion as observed on these samples will occur.
Chapter 6 Discussion
69
6.2 Effect of electrochemical potential
Based on the experimental potential – pH diagram, Figure 3, it was expected that the freely
exposed samples would exhibit good corrosion resistance when exposed in SEALAB. Even
though this diagram is originally based on data for AA5086, it was thought that it might be a
good guideline for AA5083 and AA6082 also. From the results presented in Section 5.1.4 it
can be seen that freely exposed samples did not suffer from corrosion. The observed corrosion
is only of microscopic scale, the pits found on the cross-section faces, Figure 34, had depths of
5 and 15 µm. As it can be seen from the results the corrosion for AA5083 was mainly
concentrated to areas around Al(Mg,Mn,Fe,Cr) precipitates, according to theory this is also as
expected [12, 43, 44]. For AA6082 the intermetallics found in the pits also contained Si. The
observed pits was of a hemispherical art, this is in accordance with what A. Aballe, et al. [43]
and H. Ezuber, et al. [45] observed through similar experimental work.
The samples coupled to a sacrificial anode, with a potential of approximately −1050 mV vs
Ag/AgCl, did not suffer from corrosion. The observed corrosion is only of microscopic scale;
no pits were observed on the cross-section for the AA5083 sample exposed at 10 ᵒC, for
AA6082 at 10 ᵒC a pit with depth 4,3 µm was observed. The samples exposed at 32 ᵒC had pits
with depths 28,3 and 34,8 µm. On the AA5083 samples, only minor pits were observed around
the intermetallics, in the same way as discussed above. For the AA6082 samples, the severity
of the corrosion tended to be of a larger degree than for the freely exposed samples. This can
be seen by comparing Figure 40 to Figure 32 and Figure 33. This may be because the lowered
potential from the anode increased the rate of the cathodic reaction such that the protective
oxide was slightly destabilized, and hence more pits were observed on the AA6082 sample
coupled to the sacrificial anode. Based on the results it is clearly that when AA5083 and
AA6082 are exposed to seawater, without metallic contact to more noble metals, the corrosion
resistance is good both when freely exposed and with CP.
The corrosion on the samples anodic polarized to −700 mV vs Ag/AgCl was in a large extent
concentrated to the edges beneath the coating, in the form of crevice corrosion. Figure 37 shows
how the coating formed crevices. According to the theory [22] an acid environment develops
in the crevice. The low pH inside the crevice results in an aggressive environment. When
polarizing the samples to −700 mV vs Ag/AgCl by the use of a potentiostat, one is simulating
the samples being coupled to a big cathode, e.g. galvanic coupling with steel, thus the samples
acts as anodes. The corrosion is initiated by the more positive potential caused by the coupling
to the “big cathode” and will then start in weak spots on the samples, often in weak spots in the
oxide layer. For this case, the weakest spots were the crevices, with its acidic environment,
beneath the coating, thus the corrosion was favored to occur there. Corrosion on the exposed
surface was also observed, in weak spots in the oxide and around the intermetallics, but in a
less degree than expected. For the AA6082 samples more corrosion was observed on the
exposed surface, and the degree of crevice corrosion was not as severe as for the AA5083
6.2 Effect of electrochemical potential
70
samples. This may be related to the higher content of Si, according to theory [30], Si particles
are resistant to both most acids and salts, hence the presence of Si may reduce the AA6082
samples susceptibility to corrosion in the acid environment in the crevices beneath the coating.
Si containing particles will be cathodic to the aluminium matrix, and thus contribute to initiate
corrosion around the intermetallics. This may be some of the reason for observing more pits on
the AA6082 samples than on the AA5083 samples.
The study performed by A. Aballe, et al. [43] showed that for the formation of crystallographic
pitting to be produced, it is necessary to polarize the alloy above the critical pitting potential.
The results from this study agrees with that, severe crystallographic pitting was observed on the
AA6082 sample exposed at 32 ᵒC, Figure 38. Crystallographic pitting was not observed on the
other samples anodic polarized to −700 mV vs Ag/AgCl, but this is in accordance with the
results obtained from the potentiodynamic polarization curves. According to these result, the
pitting potential of the other samples was more positive and has not been reached, thus
crystallographic pitting was not observed. The results has clearly been affected by the fact that
the samples were coated. In that manner the results can be of practical use by indicating what
will happen to coated aluminium coupled to steel submerged in seawater. New experiments
with uncoated samples should be performed to avoid crevice corrosion on the test samples.
The samples cathodic polarized to −1500 mV vs Ag/AgCl experienced severe corrosion attacks.
As discussed in Section 6.1 the samples exposed at 32 ᵒC experienced the most severe attack.
Based on the experimental potential – pH diagram in Figure 3 a lot of corrosion was expected
on these samples. As it can be seen from the diagram these samples have been in the pitting
corrosion region, and as discussed earlier, the samples exposed at 32 ᵒC may have altered
between pitting attacks and general attack because the potential for these samples was −1580
mV vs Ag/AgCl. Based on the images in Figure 66 in Appendix B the samples at 32 ᵒC seems
to have suffered from a general corrosion attack. The thickness of the corrosion products layer
was measured for the samples exposed at 32 ᵒC, Figure 43, and for AA5083 it was found to be
above 1 mm, while for AA6082 it was measured to be about 410 µm. For AA5083 the corrosion
products consisted of the main elements Al and Mg, in addition to O. Elements from the
seawater, like Cl and Na, were also present. For AA6082 the corrosion products consisted of
the main elements Al, Mg and Si, in addition to O. Elements from the seawater were also
present. No indication of calcareous deposits, CaCO3 or Mg(OH)2, was found.
Based on theory about corrosion of aluminium [12, 17, 22, 50] the explanation for the samples
cathodic polarized to −1500 mV vs Ag/AgCl is as following. The low potential increases the
rate of the cathodic reaction and the high rate of the cathodic reaction leaves the metal surface
alkaline due to the production of OH−. Hence, the protective oxide, which is amphoteric, is
destabilized. The destabilized oxide leads to higher corrosion rate, often called cathodic pitting.
For this study, the potential of −1580 mV vs Ag/AgCl for the samples exposed at 32 ᵒC tended
Chapter 6 Discussion
71
to increase the rate of the cathodic reaction so much that the bulk of the oxide was destabilized,
causing a general corrosion attack. It should be mentioned that the general attack also included
corrosion beneath the coating. The potential of −1500 mV vs Ag/AgCl for the AA5083 sample
exposed at 10 ᵒC tended to cause a severe pitting corrosion attack, but as this corrosion was in
form of pitting, a pronounced layer of corrosion products was not found of this sample.
6.3 Effect of pH
The results presented in Section 5.2 indicates that the pH clearly affects the corrosion behavior
of AA5083 and AA6082. The results obtained for the experiment in SSW with pH 8,2 as
electrolyte should be used as basis for comparison, because this can be seen as standardized
conditions [49].
6.3.1 OCP and pitting potential
The experiments performed in SSW indicated that the pH clearly has an effect on the OCP.
When the pH was lowered from 8,2 to 3, the OCP for AA5083 and AA6082 was increased by
approximately 140 to 180 mV. Figure 44 shows the development in OCP at pH 3, and one can
see that the OCP had a fluctuating behavior, but it was concentrated around −700 mV vs
Ag/AgCl. The explanation for this behavior is given by use of the experimental potential – pH
diagram in Figure 34. When the AA5083 and AA6082 samples (freely exposed) are submerged
in SSW with pH 3 the protective oxide becomes destabilized [12], thus the OCP will be in the
imperfect passivity region and may alternate to the pitting region of the diagram. Due to the
low pH, the samples cannot manage to build a sufficient oxide, such that passivity is secured.
The samples will try to build a sufficient protective oxide that will break down by the low pH,
therefore, the OCP for these samples will show a fluctuating behavior in the imperfect passivity
region. It is worth mentioning that from Figure 75 in Appendix G one can see that the OCP for
the samples exposed in SSW with pH 8,2 also started in the imperfect passivity region of the
diagram in Figure 3. However, due to the different pH, these samples managed to build a
sufficient protective oxide and the OCP was lowered into the passive region.
When the pH was increased to 10 the OCP was lowered, this can be seen in Figure 45. The
OCP for AA6082 was more negative than for AA5083. The samples were in the pitting
corrosion region of the diagram in Figure 3. It can be seen, Figure 45, that the development of
OCP followed the development of pH. Because, after 50 hours of exposure the pH was
significantly adjusted (increased from about 9,55 to 10,84) and at the same time the OCP
4 The lowest pH-value in the diagram in Figure 3 is used in the discussion of AA5083 and AA6082 at pH 3, and
the highest pH-value in the diagram is used in the discussion of AA5083 and AA6082 at pH 10.
6.3 Effect of pH
72
dropped significantly. From 80 to 125 hours exposure the pH decreased gradually, while the
OCP increased gradually until the pH was adjusted again. According to theory [12, 17] the
alloying elements Mg and Mn have oxides which becomes increasingly passive with increased
pH, and this is some of the reason for that aluminium can be passive in the slightly alkaline
seawater environment with pH 8,2. In this study the passivating effect of these alloying
elements tended to fade with increasing pH, even if the alloying elements itself becomes more
passive. From Table 7 it can be seen that AA5083 and AA6082 contains approximately the
same amount of Mn, but AA5083 contains much more Mg than AA6082. This may be the
reason for why the OCP for AA6082 became more negative than the OCP for AA5083 in SSW
with pH 10.
The results from the recorded polarization curves presented in Section 5.2.3 indicate the same
effect of pH on OCP as discussed above. The pitting potential, Table 15 and Table 16, was
slightly lowered when the pH decreased from 8,2 to 3. At pH 10 the behavior of the pitting
potential was more unpredictable. The difference between OCP and pitting potential (ΔEpit-OCP),
Equation 6.1, is interesting. The samples exposed at pH 3 had the lowest ΔEpit-OCP, this was as
expected and in accordance to theory [12, 17, 50]. Because low ΔEpit-OCP implies a larger extent
of corrosion, which is also expected when the pH is decreased to 3. The SEM images, Figure
56 and Figure 57, confirms the low ΔEpit-OCP.
For the samples exposed at pH 10 the ΔEpit-OCP was large. For AA5083 it was 360 mV after 24
hours and 413 mV after 168 hours. For AA6082 no pitting potentials were observed during
recording of potentiodynamic polarization curves, Figure 54 and Figure 55. Considering the
procedure for recording of these curves, explained in Section 4.4.2, this implies that ΔEpit-OCP
was larger than 400 mV for AA6082. The big difference in OCP and pitting potential means
that these samples experienced good corrosion resistance during exposure. The SEM images
presented in Section 5.2.4 also indicates a low degree of pitting corrosion on the samples
exposed at pH 10. The results are conflicting the theory; according to Figure 3 should a severe
pitting attack occur on the samples, and relevant theory [12] explains that the protective oxide
will be broken down in alkaline environments (pH 10).
6.3.2 Current density
As earlier mentioned, the pH was not monitored and adjusted during nighttime, thus for pH 3
some significant changes (often from 3,35 to 2,80) in pH occurred due to adjustment every
morning. From the current density plots presented in Section 5.2.2 it can be seen that the current
densities were very sensitive for changes in pH when the pH was in the low range of 2,7 to 3,4.
The current densities for the samples anodic polarized to −700 mV vs Ag/AgCl in Figure 46
indicate that AA6082 did not experience the same sensitivity for sudden changes in pH. As
discussed in Section 6.2 when polarizing to −700 mV vs Ag/AgCl one is simulating a galvanic
coupling to steel (cathode), and the corrosion is initiated by this cathode connection and will
Chapter 6 Discussion
73
start in the weakest spots on the samples. The corrosion for these samples was mainly in forms
of crevice corrosion, this goes also for the samples exposed in the Corrosion Laboratory. The
proposed explanation is therefore that the larger content of Si in AA6082 makes this alloy less
sensitive to low pH. This is in accordance to Mondolfo [30] that documented that Si is resistant
to most acids and salts.
For the samples polarized in cathodic direction, coupled to sacrificial anode and −1500 mV vs
Ag/AgCl, both AA5083 and AA6082 were sensitive to sudden changes in pH. For these
samples, the corrosion process is mainly restricted to the intermetallic sites, and one thought is
that Si may become inferior in these precipitates. Such that the positive effect against low pH
for AA6082 fades, and AA6082 becomes sensitive to these changes such as AA5083. It should
also be mentioned that Si is cathodic to aluminium, and will then act as a site for the cathodic
reaction.
The current density for the samples exposed in SSW with pH 10 did not show the same
sensitivity as for pH 3. An interesting thing regarding the current density for the samples
exposed at pH 10 can be seen in Figure 49. The current density for the samples coupled to the
sacrificial anode alternated between anodic- and cathodic current. The simple explanation for
this is that the OCP varies, and will sometimes be more positive and sometimes more negative
than the potential of the sacrificial anode. From the low current, one can also see that the OCP
and the anode had potential values close to each other for this pH.
6.3.3 Surface examination
The results presented in Section 5.2.4 indicate that the different pH-values affected the
corrosion behavior of AA5083 and AA6082. For AA5083 exposed in SSW with pH 3, Figure
56, a layer was observed on the surface. This layer is most likely corrosion products because of
high corrosion rate. For AA6082 exposed at pH 3, Figure 57, big pits were observed. These
results are as expected, and in accordance with theory [12, 17].
From Figure 56 it can be seen that more pits were observed for AA5083 exposed at pH 8,2 than
for AA5083 at pH 10. According to theory [12, 17] more corrosion should be expected on the
sample exposed at pH 10 because of the amphoteric behavior of the protective aluminium oxide.
One thought is therefore that the sample exposed at pH 10 may suffered from a general
corrosion attack, thus fewer pits were observed for this sample. This is an imperfect
explanation, and similar experimental work where weight loss is included should be performed
to confirm this.
From Figure 57 it can be seen that the observed pits on AA6082 were as expected and in
accordance with theory. More severe pits were observed on the sample exposed at pH 10, than
on the sample exposed at pH 8,2.

6.4 Effect of exposure time
74
6.4 Effect of exposure time
The exposure time did not have a significant effect on the OCP development for the exposed
samples rather than the fact that the OCP behavior stabilized with increased exposure time.
According to theory [12, 17, 34], will cathodic intermetallic particles detach from the
aluminium matrix during exposure, which implies that the current density will be reduced. This
was observed for the samples coupled to a sacrificial anode and the samples cathodic polarized
to −1500 mV vs Ag/AgCl, Figure 23 and Figure 24. From Table 8 and Table 9 it can be seen
from the passive current values that the AA6082 samples behaved in accordance with theory.
The AA5083 sample exposed at 32 o C tended to behave as expected, but for the AA5083 sample
exposed at 10 ᵒC the passive current was increased rather than decreased. This was probably
due to the harsh treatment. Based on the potentiodynamic polarization curves it can be
concluded that AA5083 was more resistant to the harsh treatment than AA6082. The current
density, Figure 22, for the samples anodic polarized to −700 mV vs Ag/AgCl increased with
exposure time. This is, as discussed earlier, because of the localized crevice- and pitting
corrosion.
The intuitive thought was that pitting potentials would increase with exposure time for freely
exposed AA5083 and AA6082, because of the protective oxide and the reduced amount of
cathodic intermetallics. This was not the case for neither AA5083 nor AA6082. For the
characteristic values for AA6082 in Table 9, which is the most reliable because a new sample
was used for recording the complete polarization curves, see Section 4.4.1, it can be seen that
at 10 ᵒC the pitting potential increased and at 32 ᵒC it decreased. One thought is that the pitting
potential is determined by the types of intermetallic particles enriched on the surface, and
remaining in the surface of the aluminium matrix. The type of detached and remaining
intermetallic particles may vary from sample to sample, thus the pitting potential may vary from
sample to sample. However, this proposed explanation is imperfect and more experimental
work should be performed regarding this topic. For further work on this topic it is recommended
to increase the number of samples, such that one sample does not have to undergo several
potentiodynamic polarizations.
It is also interesting to see how the exposure time affects the samples freely exposed in SSW
with pH 3 and pH 10. Aluminium may experience pH 3 when exposed in soil, and pH 10 is
likely to occur on the surface of cathodic polarized samples in seawater due to the cathodic
reaction. In Appendix H the potentiodynamic polarization curves for pH 3 and pH 10 are plotted
such that the effect of exposure time is emphasized. For pH 3, Figure 79 and Figure 80, it can
be seen that there were no significant changes after 168 hours of exposure. The OCP and pitting
potential were more or less the same. Some differences can be seen in the passive current, after
168 hours of exposure the samples showed a more fluctuating and unpredictable behavior

Chapter 6 Discussion
75
regarding the passive current. AA5083 showed a more fluctuating behavior than AA6082, this
may be due to the different content of Si, the effect of Si has been discussed earlier.
For pH 10, Figure 81 and Figure 82, the differences between 24 and 168 hours of exposure
were more obvious. For AA5083, it can be seen that the pitting potential increased from −717
to −640 mV vs Ag/AgCl, and the passive current increased by almost one decade, from
approximately 1,7 to 13,2 µA/cm2. But, the alloy was passive in a wider potential range after
168 hours. There was no pronounced difference in OCP for AA5083. For AA6082 the OCP
decreased from −1179 to −1288 mV vs Ag/AgCl, and the passive current increased
significantly, but not as much as for AA5083. One can see that AA6082 also was passive in a
wider potential range after 168 hours. Due to the negative OCP for AA6082 in SSW with pH
10 these samples did not reach the pitting potential during recording of complete
potentiodynamic polarization curves. The development in the polarization curves over time for
pH 3 and pH 10 implies that the rate of corrosion increased with increased exposure time.
6.5 Current density required for protection
As mentioned, the use of sacrificial anodes is a common way to achieve corrosion protection
for structures in seawater. In Figure 23 the current density for the samples coupled to a
sacrificial anode (approximately −1050 mV vs Ag/AgCl) in this study is shown. The current
density for these samples, except for AA6082 at 10 ᵒC, behaved in accordance to what R.
Gundersen and K. Nisancioglu explains [34]. They had initial current density peaks, and then
the current density decreased. The increase in current density in the beginning is due to
corrosion around the Fe-rich intermetallic particles in the surface of the matrix. Once these
intermetallic particles are detached and isolated from the matrix they are not cathodic to the
matrix anymore and corrosion will not occur around them, i.e. the demand for current is
reduced. The current density for carbon steel St 52 coupled to a sacrificial anode exposed in
natural seawater in SEALAB is shown in Figure 68 in Appendix C.
According to DNV RP B-401 [51], the recommended initial5 current densities relevant for this
study are as following:
5 The initial design current densities from DNV are used, because the exposure period is relative short and the
initial values provides the best basis for comparison. For aluminium the initial, final and mean design current
density values are the same. The initial design current density refers to the cathodic current density that is required
to effect polarization of an initially bare metal surface, typically for structural steel surfaces with some rusting
and/or mill scale. The design current densities are used to determine the number and size of anodes [51].
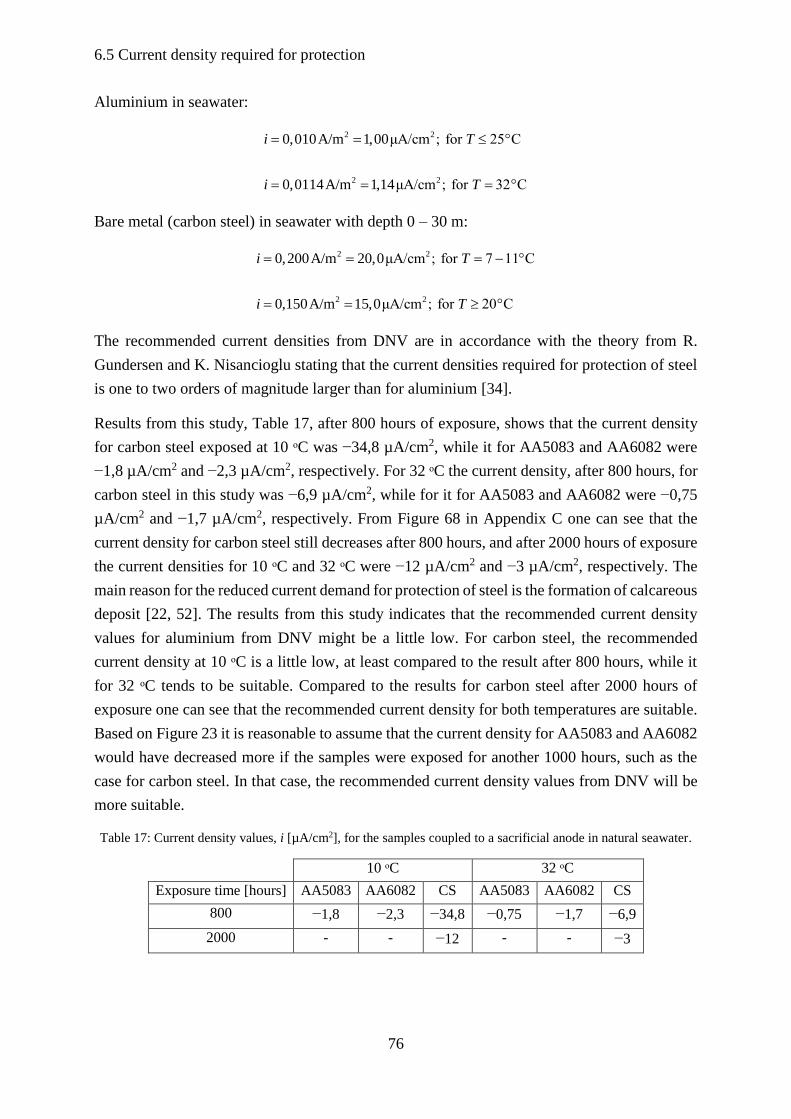
6.5 Current density required for protection
76
Aluminium in seawater:
2 2
2 2
0,010A/m 1,00μA/cm ; for 25 C
0,0114A/m 1,14μA/cm ; for 32 C
i T
i T
Bare metal (carbon steel) in seawater with depth 0 – 30 m:
2 2
2 2
0,200A/m 20,0μA/cm ; for 7 11 C
0,150A/m 15,0μA/cm ; for 20 C
i T
i T
The recommended current densities from DNV are in accordance with the theory from R.
Gundersen and K. Nisancioglu stating that the current densities required for protection of steel
is one to two orders of magnitude larger than for aluminium [34].
Results from this study, Table 17, after 800 hours of exposure, shows that the current density
for carbon steel exposed at 10 ᵒC was −34,8 µA/cm2, while it for AA5083 and AA6082 were
−1,8 µA/cm2 and −2,3 µA/cm2, respectively. For 32 ᵒC the current density, after 800 hours, for
carbon steel in this study was −6,9 µA/cm2, while for it for AA5083 and AA6082 were −0,75
µA/cm2 and −1,7 µA/cm2, respectively. From Figure 68 in Appendix C one can see that the
current density for carbon steel still decreases after 800 hours, and after 2000 hours of exposure
the current densities for 10 ᵒC and 32 ᵒC were −12 µA/cm2 and −3 µA/cm2, respectively. The
main reason for the reduced current demand for protection of steel is the formation of calcareous
deposit [22, 52]. The results from this study indicates that the recommended current density
values for aluminium from DNV might be a little low. For carbon steel, the recommended
current density at 10 ᵒC is a little low, at least compared to the result after 800 hours, while it
for 32 ᵒC tends to be suitable. Compared to the results for carbon steel after 2000 hours of
exposure one can see that the recommended current density for both temperatures are suitable.
Based on Figure 23 it is reasonable to assume that the current density for AA5083 and AA6082
would have decreased more if the samples were exposed for another 1000 hours, such as the
case for carbon steel. In that case, the recommended current density values from DNV will be
more suitable.
Table 17: Current density values, i [µA/cm2], for the samples coupled to a sacrificial anode in natural seawater.
10 ᵒC 32 ᵒC
Exposure time [hours] AA5083 AA6082 CS AA5083 AA6082 CS
800 −1,8 −2,3 −34,8 −0,75 −1,7 −6,9
2000 - - −12 - - −3

Chapter 6 Discussion
77
6.6 AA5083 vs AA6082
In general, AA5083 and AA6082 tended to show rather similar corrosion behavior with the
different conditions, but some differences were also observed. The recording of OCP during
exposure in SEALAB showed that AA6082 had a more negative OCP than AA5083. This was
not as expected, because AA5083 contains a significantly larger amount of Mg and as it can be
seen in Table 6 intermetallics containing Mg have rather negative OCP. The overall effect of
the temperature tended to be the same for both alloys.
For the samples anodic polarized to −700 mV vs Ag/AgCl it can be seen in the results that the
AA6082 samples exhibited better resistance to the crevice corrosion that occurred on the
samples at this condition. As earlier discussed, this may be because AA6082 contains more Si
than AA5083. The two alloys experienced fairly the same current density behavior when
coupled to a sacrificial anode in natural seawater at 32 ᵒC. When coupled to a sacrificial anode
at 10 ᵒC the current density behavior was a little more different for the two alloys, the current
demand for AA6082 was 1 µA/cm2 larger than for AA5083. This is a reasonable difference,
because of the larger amount of Mg in AA5083. Selective dissolution of Mg protects the Al
remaining at surface sacrificially against pitting [17], thus the lower current demand. For the
samples cathodic polarized to −1500 mV vs Ag/AgCl both AA5083 and AA6082 suffered from
severe corrosion. This was as expected according to theory [12], because the rate of the cathodic
reaction was so high that the pH increased and destabilized the protective oxide.
From the potentiodynamic polarization curves recorded for the samples exposed in SEALAB,
it can be seen that AA5083 had a more pronounced tendency than AA6082. The curves,
especially the anodic curves, were moved to the left with increased exposure time and the pitting
potential tended to increase with increased exposure time. This implies that the current density
is reduced and that the cathodic intermetallics are detached and isolated from the aluminium
matrix. For AA6082 this tendency was not so pronounced. However, by considering the curve
for week 1 and the complete polarization curve at the end it can be seen that this tendency was
almost the case for AA6082 also. It may be concluded that for the freely exposed samples,
AA5083 became more passivated during exposure than AA6082.
From the surface examinations it could be seen that the pitting corrosion for AA5083 was
mainly concentrated to areas around Al(Mg,Mn,Fe,Cr) precipitates. For AA6082 the
intermetallics found in the pits also contained Si. Based on the theory explained in Section 2.2.1
and 2.2.6 this was as expected. For the freely exposed samples, the severity of the microscopic
pitting tended to be the same for both alloys. For the cathodic polarized samples, the pits were
more severe on the AA6082 samples than on the AA5083 samples. This was as expected,
because according to basic theory about aluminium [3] the Al-Mg (5xxx) series is known to be
the alloys most suitable for applications in seawater. However, for the samples cathodic

6.6 AA5083 vs AA6082
78
polarized to −1500 mV vs Ag/AgCl at 32 ᵒC the corrosion products layer was thicker for
AA5083 than for AA6082.
As discussed earlier, AA6082 tended to be less affected by the variations in pH due to the
presence of Si. By considering the recorded potentiodynamic polarization curves for the
samples exposed in SSW with different pH-values the tendency was the opposite. Significantly
larger differences in the potentiodynamic polarization curves with varying pH were observed
for AA6082 than for AA5083. This implies that AA6082 is more sensitive to the varying pH
than AA5083.
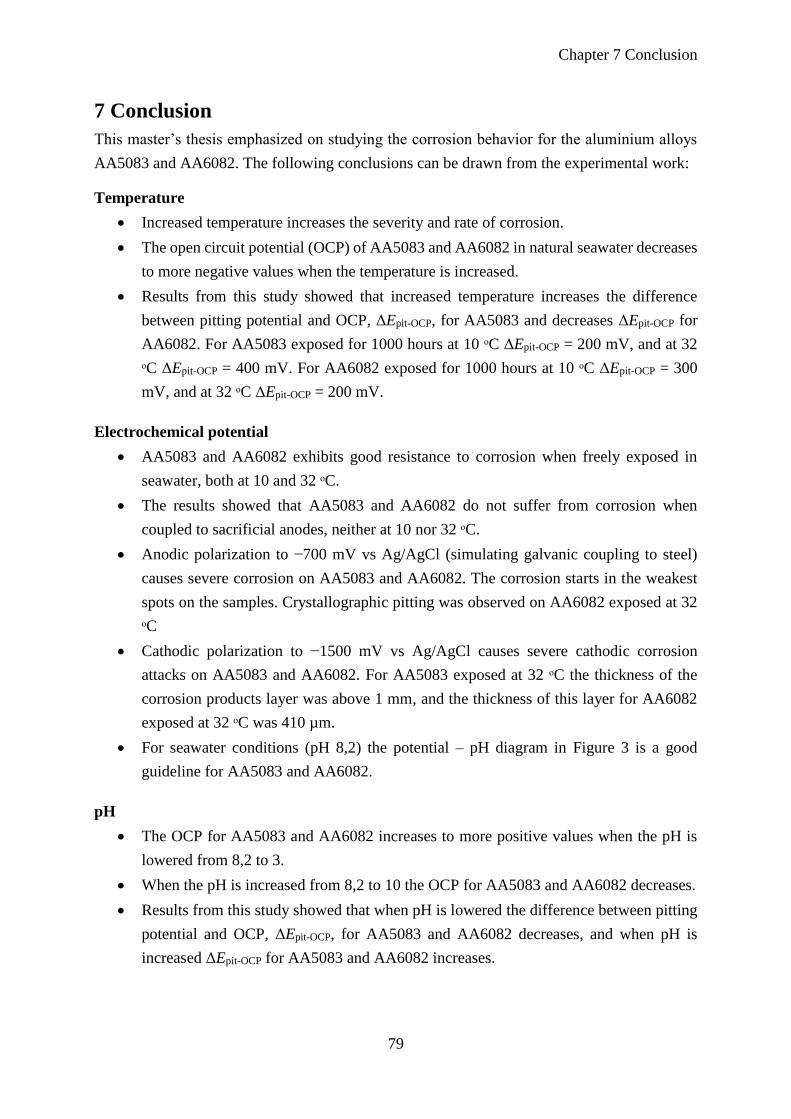
Chapter 7 Conclusion
79
7 Conclusion
This master’s thesis emphasized on studying the corrosion behavior for the aluminium alloys
AA5083 and AA6082. The following conclusions can be drawn from the experimental work:
Temperature
Increased temperature increases the severity and rate of corrosion.
The open circuit potential (OCP) of AA5083 and AA6082 in natural seawater decreases
to more negative values when the temperature is increased.
Results from this study showed that increased temperature increases the difference
between pitting potential and OCP, ΔEpit-OCP, for AA5083 and decreases ΔEpit-OCP for
AA6082. For AA5083 exposed for 1000 hours at 10 ᵒC ΔEpit-OCP = 200 mV, and at 32
ᵒC ΔEpit-OCP = 400 mV. For AA6082 exposed for 1000 hours at 10 ᵒC ΔEpit-OCP = 300
mV, and at 32 ᵒC ΔEpit-OCP = 200 mV.
Electrochemical potential
AA5083 and AA6082 exhibits good resistance to corrosion when freely exposed in
seawater, both at 10 and 32 ᵒC.
The results showed that AA5083 and AA6082 do not suffer from corrosion when
coupled to sacrificial anodes, neither at 10 nor 32 ᵒC.
Anodic polarization to −700 mV vs Ag/AgCl (simulating galvanic coupling to steel)
causes severe corrosion on AA5083 and AA6082. The corrosion starts in the weakest
spots on the samples. Crystallographic pitting was observed on AA6082 exposed at 32
ᵒC
Cathodic polarization to −1500 mV vs Ag/AgCl causes severe cathodic corrosion
attacks on AA5083 and AA6082. For AA5083 exposed at 32 ᵒC the thickness of the
corrosion products layer was above 1 mm, and the thickness of this layer for AA6082
exposed at 32 ᵒC was 410 µm.
For seawater conditions (pH 8,2) the potential – pH diagram in Figure 3 is a good
guideline for AA5083 and AA6082.
pH
The OCP for AA5083 and AA6082 increases to more positive values when the pH is
lowered from 8,2 to 3.
When the pH is increased from 8,2 to 10 the OCP for AA5083 and AA6082 decreases.
Results from this study showed that when pH is lowered the difference between pitting
potential and OCP, ΔEpit-OCP, for AA5083 and AA6082 decreases, and when pH is
increased ΔEpit-OCP for AA5083 and AA6082 increases.
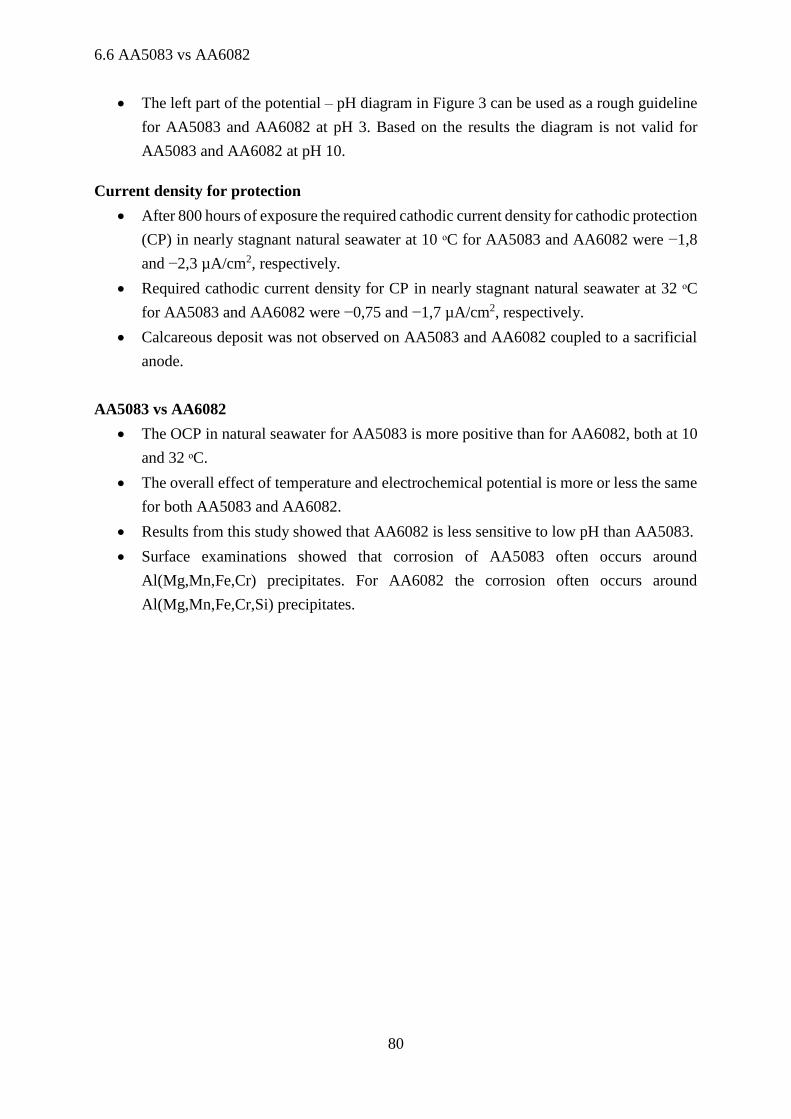
6.6 AA5083 vs AA6082
80
The left part of the potential – pH diagram in Figure 3 can be used as a rough guideline
for AA5083 and AA6082 at pH 3. Based on the results the diagram is not valid for
AA5083 and AA6082 at pH 10.
Current density for protection
After 800 hours of exposure the required cathodic current density for cathodic protection
(CP) in nearly stagnant natural seawater at 10 ᵒC for AA5083 and AA6082 were −1,8
and −2,3 µA/cm2, respectively.
Required cathodic current density for CP in nearly stagnant natural seawater at 32 ᵒC
for AA5083 and AA6082 were −0,75 and −1,7 µA/cm2, respectively.
Calcareous deposit was not observed on AA5083 and AA6082 coupled to a sacrificial
anode.
AA5083 vs AA6082
The OCP in natural seawater for AA5083 is more positive than for AA6082, both at 10
and 32 ᵒC.
The overall effect of temperature and electrochemical potential is more or less the same
for both AA5083 and AA6082.
Results from this study showed that AA6082 is less sensitive to low pH than AA5083.
Surface examinations showed that corrosion of AA5083 often occurs around
Al(Mg,Mn,Fe,Cr) precipitates. For AA6082 the corrosion often occurs around
Al(Mg,Mn,Fe,Cr,Si) precipitates.

Chapter 8 Suggestions for further work
81
8 Suggestions for further work
For further experimental work on this topic it is recommended to use uncoated samples. The
formation of such crevices that were formed on some of the samples in this study, Figure 37,
will not be possible on uncoated samples. Furthermore, it is strongly suggested to include more
samples for recording potentiodynamic polarization curves, and each sample should only
experience one recording. This will provide more correct and reliable results.
Suggestions for further work include:
The same study should be performed on welded samples to examine the effect of
welding.
Study the corrosion behavior of AA5083 and AA6082 with temperatures above 40 ᵒC.
Perform experiments with increased exposure period.
It would also be interesting to perform experimental work emphasized on studying
crevice corrosion when AA5083 and AA6082 are galvanic coupled to a more noble
metal in seawater.

References
83
References
[1] M. Collette and R. Sielski, "Aluminum Ship Structures," 2013.
[2] D. Lerman and T. Capaccio, "Navy Finds "Aggressive" Corrosion on Austal's Combat Ship,"
in Bloomberg Business, ed, 2011.
[3] Hydro. (2002, Aluminium in the marine environment.
[4] "Petroleum, petrochemical and natural gas industries -- Materials selection and corrosion
control for oil and gas production systems," in ISO21457, ed: International Organization of
Standardization, 2010.
[5] "Aluminium structural material," in NORSOK M-121, ed: Standard Norway, 2015.
[6] S. Alexey, "Properties of Pure Aluminum," in Handbook of Aluminum, ed: CRC Press, 2003.
[7] (11.02.2016). European Aluminium Association and MATTER. Available:
http://aluminium.matter.org.uk/content/html/eng/default.asp?catid=&pageid=1
[8] TheEngineeringToolBox. (26.05.16). Modulus of Elasticity or Young's Modulus - and Tensile
Modulus for common Materials. Available: http://www.engineeringtoolbox.com/young-
modulus-d_417.html
[9] W. D. J. Callister and D. G. Rethwisch., "Materials science and engineering; an introduction,
8th ed.," 2010.
[10] T. Furu, "Aluminium in marine environments," presented at the Lecture in Offshore materials,
NTNU, 2015.
[11] ESAB-Knowledge-Center. (2014). Understanding the Aluminum Alloy Designation System.
Available: http://www.esabna.com/us/en/education/blog/understanding-the-aluminum-alloy-
designation-system.cfm
[12] K. Nisancioglu, "Corrosion and protection of aluminum alloys in seawater," European
Federation of Corrosion Publications, vol. 50, pp. 145-155, 2007.
[13] TotalMateria. (2003). Aluminum-Magnesium (5000) Alloys. Available:
http://www.totalmateria.com/Article75.htm
[14] I. The Aluminum Association. (1998, 20.10.2015). Aluminum Alloy Selection and
Applications. Available: http://www.calm-aluminium.com.au/documents/aluminium-
alloys.pdf
[15] K. F. Veium, "Effect of Cathodic Polarization on the Susceptibility to Hydrogen Embrittlement
in 5xxx, 6xxx and 7xxx Series Aluminium Alloys," Master, Department of Materials and
Engineering Science, NTNU, 2015.
[16] E. k. center. (2014). The Difference Between Heat-Treatable and Non-Heat-Treatable
Aluminum Alloys. Available: http://www.esabna.com/us/en/education/blog/the-differences-
between-heat-treatable-and-non-heat-treatable-aluminum-alloys.cfm
[17] K. Nisacioglu, "Corrosion of Aluminum and Aluminum Alloys - Lecture notes in TMM4170,"
2014.
[18] P. P. Trzaskoma, "Pit Morphology of Aluminum Alloy and Silicon Carbide/Aluminum Alloy
Metal Matrix Composites," Corrosion, vol. 46, pp. 402-409, 1990.
[19] J. G. Kaufman, "Aluminum Alloys," in Mechanical Engineers' Handbook, ed: John Wiley &
Sons, Inc., 2006, pp. 59-116.
[20] K. Nisancioglu and H. Holtan, "Measurement of the critical pitting potential of aluminium,"
Corrosion Science, vol. 18, pp. 835-849, 1978/01/01 1978.
[21] A. Broli and H. Holtan, "Use of potentiokinetic methods for the determination of characteristic
potentials for pitting corrosion of aluminium in a deaerated solution of 3%NaCl," Corrosion
Science, vol. 13, pp. 237-246, 1973/01/01 1973.
[22] E. Bardal, Korrosjon og korrosjonsvern. Trondheim, 1994.
[23] TotalMateria. (2008). Corrosion of Aluminum and Its Alloys: Forms of Corrosion. Available:
http://www.totalmateria.com/page.aspx?ID=CheckArticle&site=ktn&NM=187
[24] P. A. Brook, "Potential-pH diagrams at elevated temperatures," Corrosion Science, vol. 12, pp.
297-306, 1972/01/01 1972.
[25] A. Bjørgum, "Corrosion of Aluminum in Chloride Solutions Containing Carbon Dioxide,
Bicarbonate, Copper and Hydrogen Sulfide," PhD, Laboratories of Industrial Electrochemistry,
Norwegian Institute of Technology, Trondheim, 1993.

84
[26] Z. A. Foroulis and M. J. Thubrikar, "A Contribution to the Study of the Critical Pitting Potential
of Oxide Covered Aluminum in aqueous chloride solutions," Materials and Corrosion, vol. 26,
pp. 350-355, 1975.
[27] J. Soltis, N. J. Laycock, and D. Krouse, "Temperature dependence of the pitting potential of
high purity aluminium in chloride containing solutions," Corrosion Science, vol. 53, pp. 7-10,
1// 2011.
[28] B. Nick, T. H. Muster, and G. B. Rudolph, "Corrosion of Aluminum Alloys," in Corrosion
Mechanisms in Theory and Practice, Third Edition, ed: CRC Press, 2011, pp. 705-736.
[29] K. Nisancioglu, "Electrochemical Behavior of Aluminum‐Base Intermetallics Containing Iron,"
The Electrochemical Society, vol. 137, pp. 69-77, 1990.
[30] L. F. Mondolfo, "3 - Aluminum–Magnesium, Aluminum–Manganese Alloys," in Aluminum
Alloys, ed: Butterworth-Heinemann, 1976, pp. 806-841.
[31] S. Egtvedt, "Thermally Sprayed Aluminum (TSA) with Cathodic Protection as Corrosion
Protection for Steel in Natural Seawater: Characterization of Properties on TSA and Calcareous
Deposit," Materials Science and Engineering, Norwegian University of Science and
Technology, Trondheim, 2011.
[32] R. Goswami, G. Spanos, P. S. Pao, and R. L. Holtz, "Precipitation behavior of the ß phase in
Al-5083," Materials Science and Engineering: A, vol. 527, pp. 1089-1095, 2/15/ 2010.
[33] B. Sakshaug, "Korrosjonsoppførsel av AA5083- og AA6082-legeringer ved ulike
temperaturer," NTNU, Trondheim, 2015.
[34] R. Gundersen and K. Nisancioglu, "Cathodic Protection of Aluminum in Seawater,"
CORROSION, vol. 46, pp. 279-285, 1990.
[35] C. Deslouis, A. Doncescu, D. Festy, O. Gil, V. Maillot, S. Touzain, et al., "Kinetics and
Characterisation of Calcareous Deposits under Cathodic Protection in Natural Sea Water,"
Materials Science Forum, vol. 289-292, pp. 1163-1180, 1998.
[36] A. Neville and A. P. Morizot, "Calcareous scales formed by cathodic protection—an assessment
of characteristics and kinetics," Journal of Crystal Growth, vol. 243, pp. 490-502, 9// 2002.
[37] S. C. Dexter and S. H. Lin, "Calculation of seawater ph at polarized metal surfaces in the
presence of surface films," CORROSION, vol. 48, 1992.
[38] D. A. Shifler, "Understanding material interactions in marine environments to promote extended
structural life," Corrosion Science, vol. 47, pp. 2335-2352, 10// 2005.
[39] H. P. Hack and R. J. Guanti, "Effect of high flow on calcareous deposits and cathodic protection
current denisty," David Taylor Research Center, 1988.
[40] W. H. Hartt, C. H. Culberson, and S. W. Smith, "Calcareous Deposits on Metal Surfaces in
Seawater—A Critical Review," Corrosion, vol. 40, pp. 609-618, 1984.
[41] H. Möller, "The influence of Mg2+on the formation of calcareous deposits on a freely corroding
low carbon steel in seawater," Corrosion Science, vol. 49, pp. 1992-2001, 4// 2007.
[42] C. Deslouis, D. Festy, O. Gil, V. Maillot, S. Touzain, and B. Tribollet, "Characterization of
calcareous deposits in artificial sea water by impedances techniques: 2-deposit of Mg(OH)2
without CaCO3," Electrochimica Acta, vol. 45, pp. 1837-1845, 2/1/ 2000.
[43] A. Aballe, M. Bethencourt, F. J. Botana, M. J. Cano, and M. Marcos, "Localized alkaline
corrosion of alloy AA5083 in neutral 3.5% NaCl solution," Corrosion Science, vol. 43, pp.
1657-1674, 9// 2001.
[44] K. A. Yasakau, M. L. Zheludkevich, S. V. Lamaka, and M. G. S. Ferreira, "Role of intermetallic
phases in localized corrosion of AA5083," Electrochimica Acta, vol. 52, pp. 7651-7659, 10/10/
2007.
[45] H. Ezuber, A. El-Houd, and F. El-Shawesh, "A study on the corrosion behavior of aluminum
alloys in seawater," Materials & Design, vol. 29, pp. 801-805, // 2008.
[46] M. Händel, D. Nickel, and T. Lampke, "Effect of different grain sizes and textures on the
corrosion behaviour of aluminum alloy AA6082
Einfluss unterschiedlicher Korngrößen und Texturen auf das Korrosionsverhalten der
Aluminiumlegierung EN AW-6082," Materialwissenschaft und Werkstofftechnik, vol. 42, pp.
606-611, 2011.
References
85
[47] K. Blommedal, "Corrosion Development in Welded AA6082 Alloys," Materials Science and
Engineering, NTNU, Trondheim, 2013.
[48] Jotun, "Jotamastic 87," ed, 2016.
[49] "Standard Practice for the Preparation of Substitute Ocean Water," ed: ASTM International,
2013.
[50] C. Vargel, Corrosion of aluminium, 1st ed., English ed ed. Amsterdam ; Boston: Amsterdam ;
Boston : Elsevier, 2004.
[51] "Cathodic Protection Design," in DNV-RP-B401, ed: Det Norske Veritas, 2010.
[52] J. F. Yan, R. E. White, and R. B. Griffin, "Parametric Studies of the Formation of Calcareous
Deposits on Cathodically Protected Steel in Seawater," Journal of the Electrochemical Society,
vol. 140, pp. 1275-1280, 1993.
[53] K. Andersen, "HISC in Super Duplex Stainless Steels: A study of the relation between
microstructure and susceptibility to hydrogen induced stress cracking," Department of Materials
Science and Engineering, Norwegian University of Science and Technology, Trondheim, 2013.
[54] R. H. Jones, "The influence of hydrogen on the stress-corrosion cracking of low-strength Al-
Mg alloys," JOM, vol. 55, pp. 42-46, 2003.

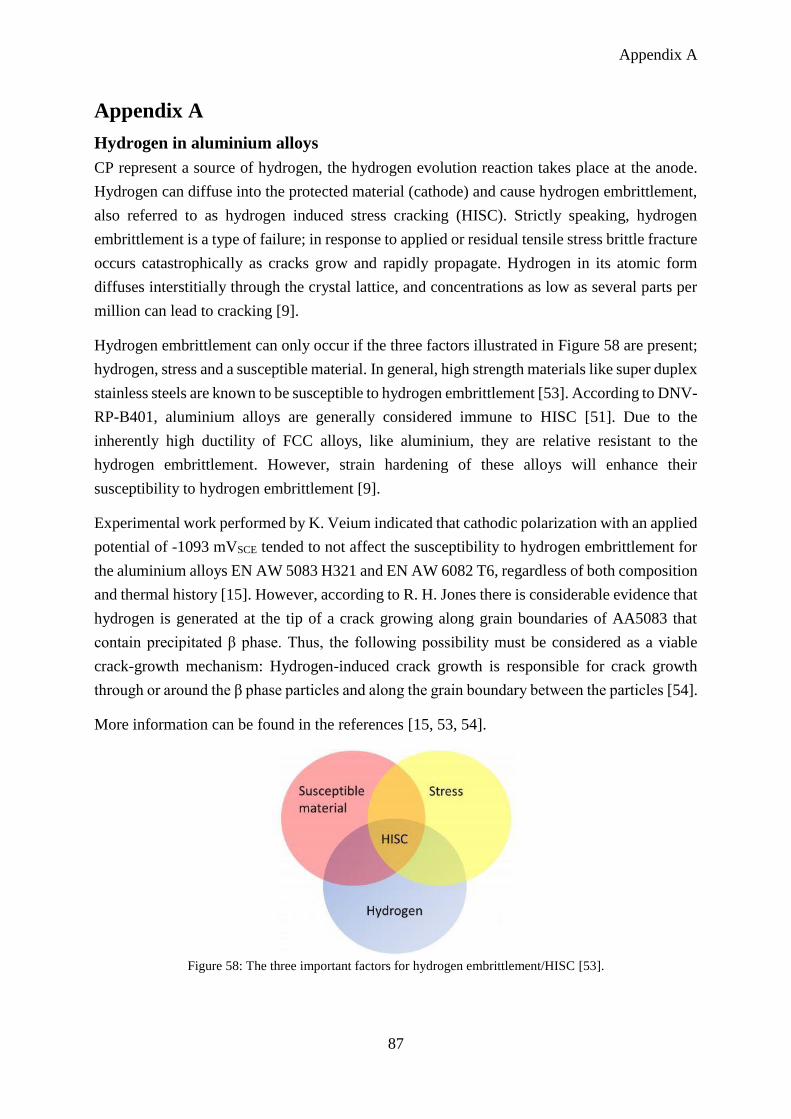
Appendix A
87
Appendix A
Hydrogen in aluminium alloys
CP represent a source of hydrogen, the hydrogen evolution reaction takes place at the anode.
Hydrogen can diffuse into the protected material (cathode) and cause hydrogen embrittlement,
also referred to as hydrogen induced stress cracking (HISC). Strictly speaking, hydrogen
embrittlement is a type of failure; in response to applied or residual tensile stress brittle fracture
occurs catastrophically as cracks grow and rapidly propagate. Hydrogen in its atomic form
diffuses interstitially through the crystal lattice, and concentrations as low as several parts per
million can lead to cracking [9].
Hydrogen embrittlement can only occur if the three factors illustrated in Figure 58 are present;
hydrogen, stress and a susceptible material. In general, high strength materials like super duplex
stainless steels are known to be susceptible to hydrogen embrittlement [53]. According to DNV-
RP-B401, aluminium alloys are generally considered immune to HISC [51]. Due to the
inherently high ductility of FCC alloys, like aluminium, they are relative resistant to the
hydrogen embrittlement. However, strain hardening of these alloys will enhance their
susceptibility to hydrogen embrittlement [9].
Experimental work performed by K. Veium indicated that cathodic polarization with an applied
potential of -1093 mVSCE tended to not affect the susceptibility to hydrogen embrittlement for
the aluminium alloys EN AW 5083 H321 and EN AW 6082 T6, regardless of both composition
and thermal history [15]. However, according to R. H. Jones there is considerable evidence that
hydrogen is generated at the tip of a crack growing along grain boundaries of AA5083 that
contain precipitated β phase. Thus, the following possibility must be considered as a viable
crack-growth mechanism: Hydrogen-induced crack growth is responsible for crack growth
through or around the β phase particles and along the grain boundary between the particles [54].
More information can be found in the references [15, 53, 54].
Figure 58: The three important factors for hydrogen embrittlement/HISC [53].

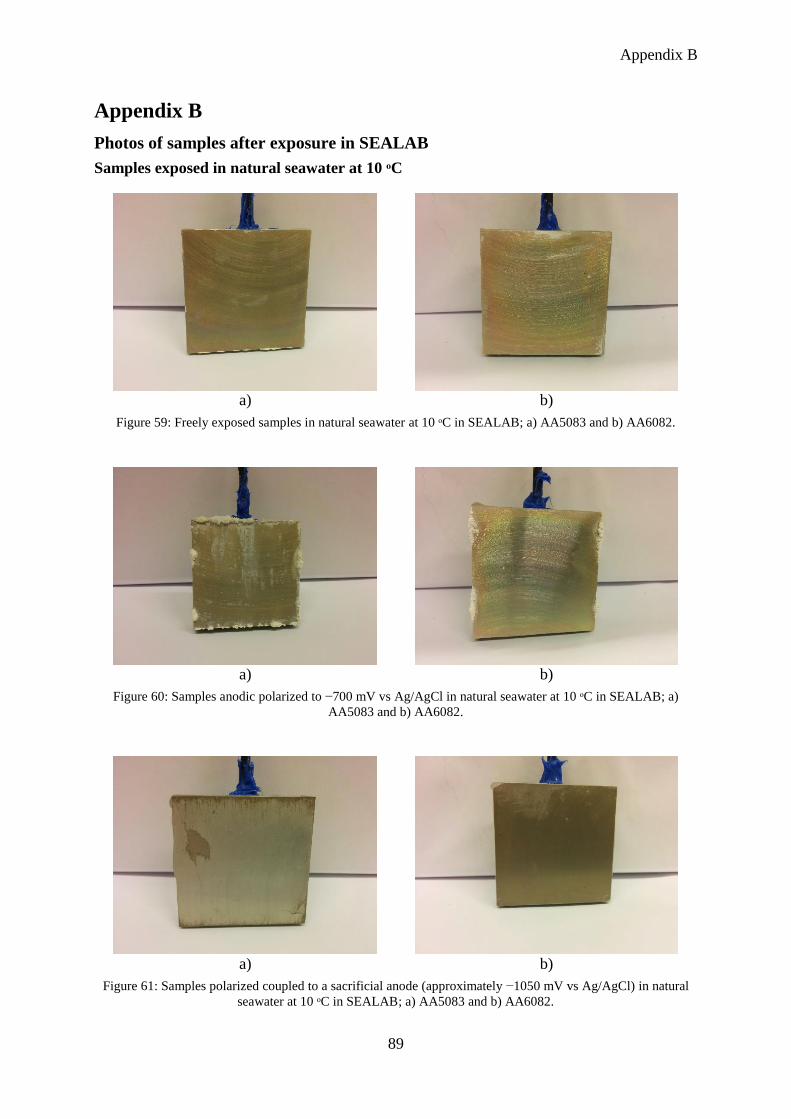
Appendix B
89
Appendix B
Photos of samples after exposure in SEALAB
Samples exposed in natural seawater at 10 ᵒC
a) b)
Figure 59: Freely exposed samples in natural seawater at 10 ᵒC in SEALAB; a) AA5083 and b) AA6082.
a) b)
Figure 60: Samples anodic polarized to −700 mV vs Ag/AgCl in natural seawater at 10 ᵒC in SEALAB; a)
AA5083 and b) AA6082.
a) b)
Figure 61: Samples polarized coupled to a sacrificial anode (approximately −1050 mV vs Ag/AgCl) in natural
seawater at 10 ᵒC in SEALAB; a) AA5083 and b) AA6082.

Photos of samples after exposure in SEALAB
90
a) b)
Figure 62: Samples cathodic polarized to −1500 mV vs Ag/AgCl in natural seawater at 10 ᵒC in SEALAB; a)
AA5083 and b) AA6082.
Samples exposed in natural seawater at 32 ᵒC
a) b)
Figure 63: Freely exposed samples in natural seawater at 32 ᵒC in SEALAB; a) AA5083 and b) AA6082.
a) b)
Figure 64: Samples anodic polarized to −700 mV vs Ag/AgCl in natural seawater at 32 ᵒC in SEALAB; a)
AA5083 and b) AA6082.
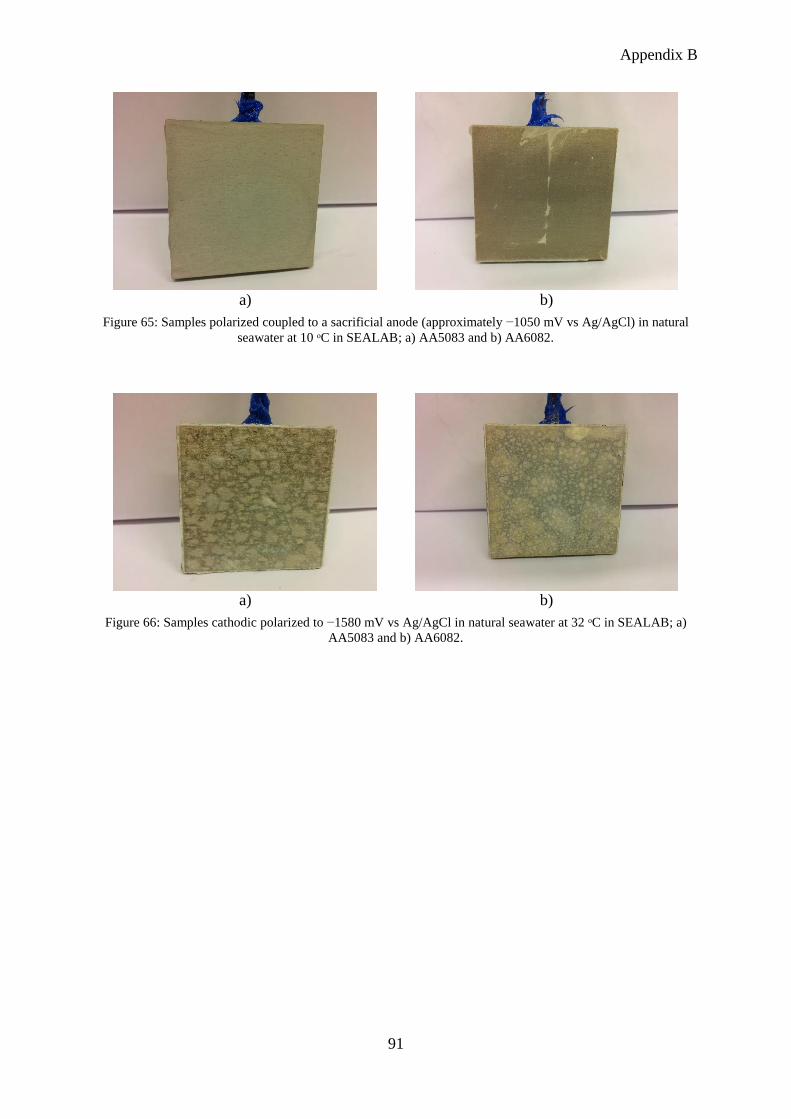
Appendix B
91
a) b)
Figure 65: Samples polarized coupled to a sacrificial anode (approximately −1050 mV vs Ag/AgCl) in natural
seawater at 10 ᵒC in SEALAB; a) AA5083 and b) AA6082.
a) b)
Figure 66: Samples cathodic polarized to −1580 mV vs Ag/AgCl in natural seawater at 32 ᵒC in SEALAB; a)
AA5083 and b) AA6082.


Appendix C
93
Appendix C
Potential from sacrificial anode and current density for carbon steel coupled to
sacrificial anode
Figure 67: Potential from the sacrificial anode used in the experiments performed in SEALAB.
Figure 67 shows the potential from the sacrificial anode used in the experiments performed in
SEALAB, the drop in the curve for AA6082 at 32 ᵒC was due to poor contact between two
cables. It did not affect the results. Figure 68 shows the current density for carbon steel coupled
to a sacrificial anode in SEALAB, at 10 ᵒC and 32 ᵒC. The carbon steel samples were exposed
for 2000 hours.
Figure 68: Current density for carbon steel coupled to sacrificial anode in SEALAB.

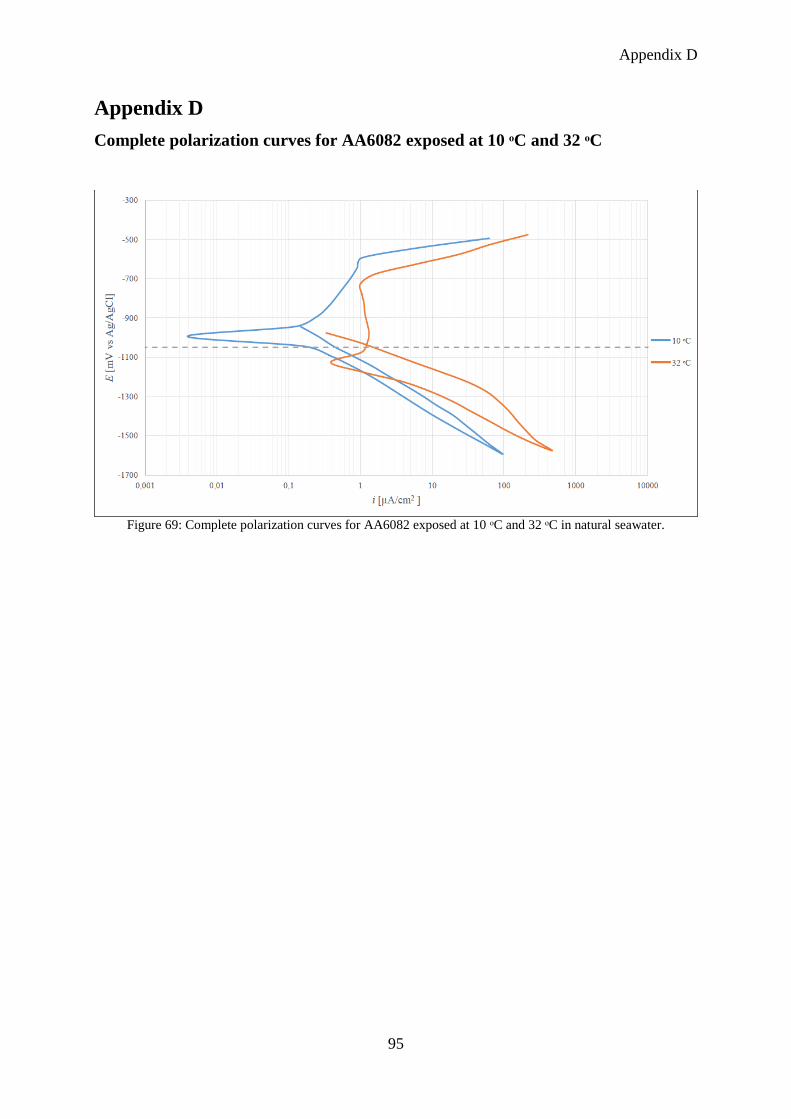
Appendix D
95
Appendix D
Complete polarization curves for AA6082 exposed at 10 ᵒC and 32 ᵒC
Figure 69: Complete polarization curves for AA6082 exposed at 10 ᵒC and 32 ᵒC in natural seawater.

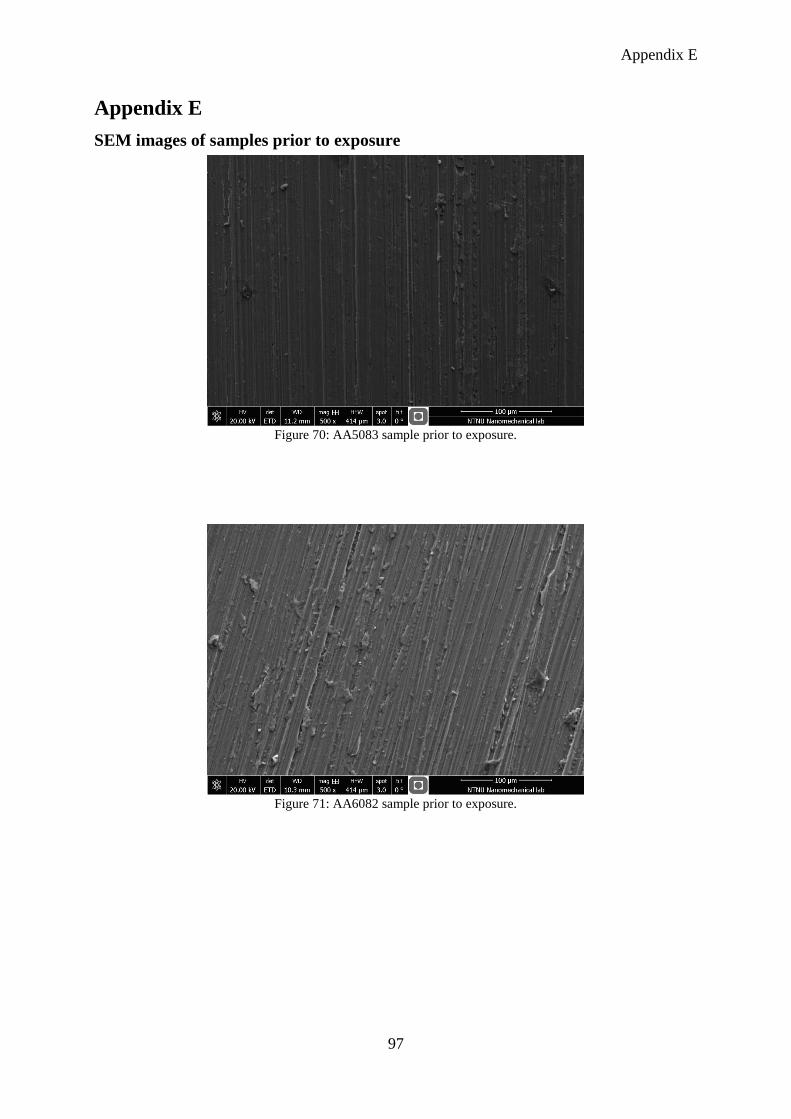
Appendix E
97
Appendix E
SEM images of samples prior to exposure
Figure 70: AA5083 sample prior to exposure.
Figure 71: AA6082 sample prior to exposure.

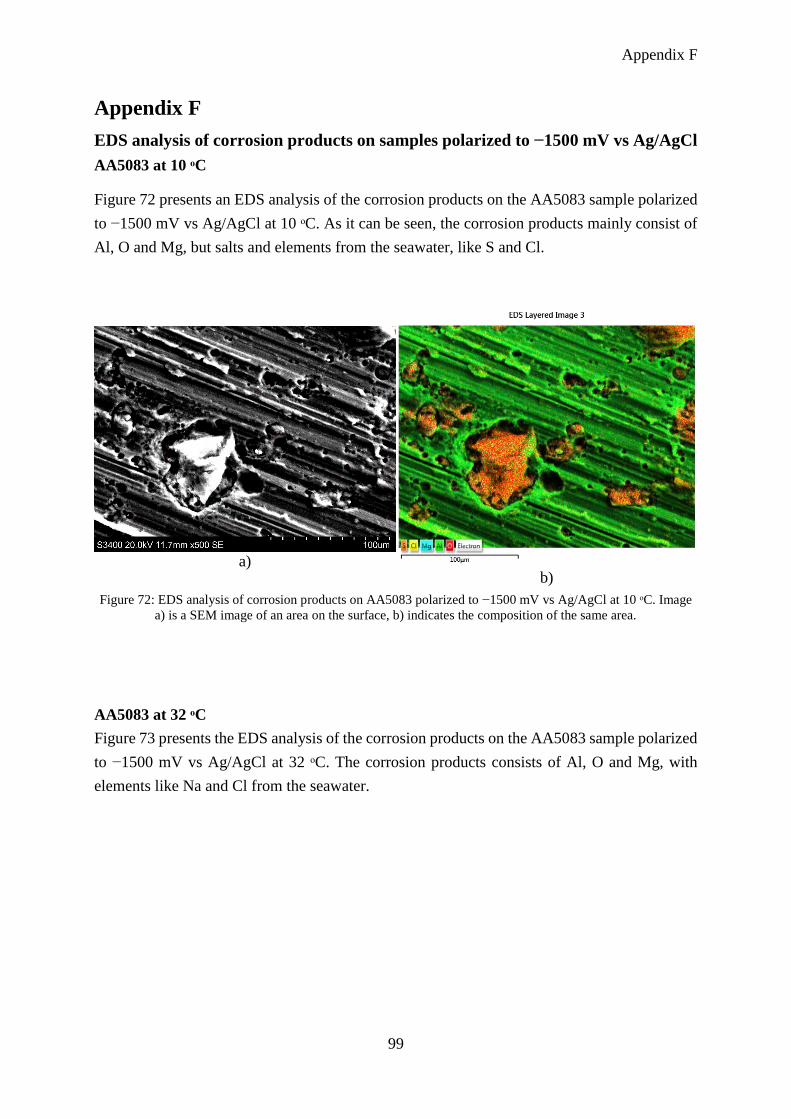
Appendix F
99
Appendix F
EDS analysis of corrosion products on samples polarized to −1500 mV vs Ag/AgCl
AA5083 at 10 ᵒC
Figure 72 presents an EDS analysis of the corrosion products on the AA5083 sample polarized
to −1500 mV vs Ag/AgCl at 10 ᵒC. As it can be seen, the corrosion products mainly consist of
Al, O and Mg, but salts and elements from the seawater, like S and Cl.
a) b)
Figure 72: EDS analysis of corrosion products on AA5083 polarized to −1500 mV vs Ag/AgCl at 10 ᵒC. Image
a) is a SEM image of an area on the surface, b) indicates the composition of the same area.
AA5083 at 32 ᵒC
Figure 73 presents the EDS analysis of the corrosion products on the AA5083 sample polarized
to −1500 mV vs Ag/AgCl at 32 ᵒC. The corrosion products consists of Al, O and Mg, with
elements like Na and Cl from the seawater.

EDS analysis of corrosion products on samples polarized to −1500 mV vs Ag/AgCl
100
a) b)
Figure 73: EDS analysis of corrosion products on AA5083 polarized to −1500 mV vs Ag/AgCl at 32 ᵒC. Image
a) is a SEM image of an area on the surface, b) indicates the composition of the same area.
AA6082 at 32 ᵒC
The EDS analysis for the corrosion products on AA6082 polarized to −1500 mV vs Ag/AgCl
at 32 ᵒC is presented in Figure 74. The corrosion products consists of Al, O, Si and C, but also
Na from the seawater.
a) b)
Figure 74: EDS analysis of corrosion products on AA6082 polarized to −1500 mV vs Ag/AgCl at 32 ᵒC. Image
a) is a SEM image of an area on the surface, b) indicates the composition of the same area.
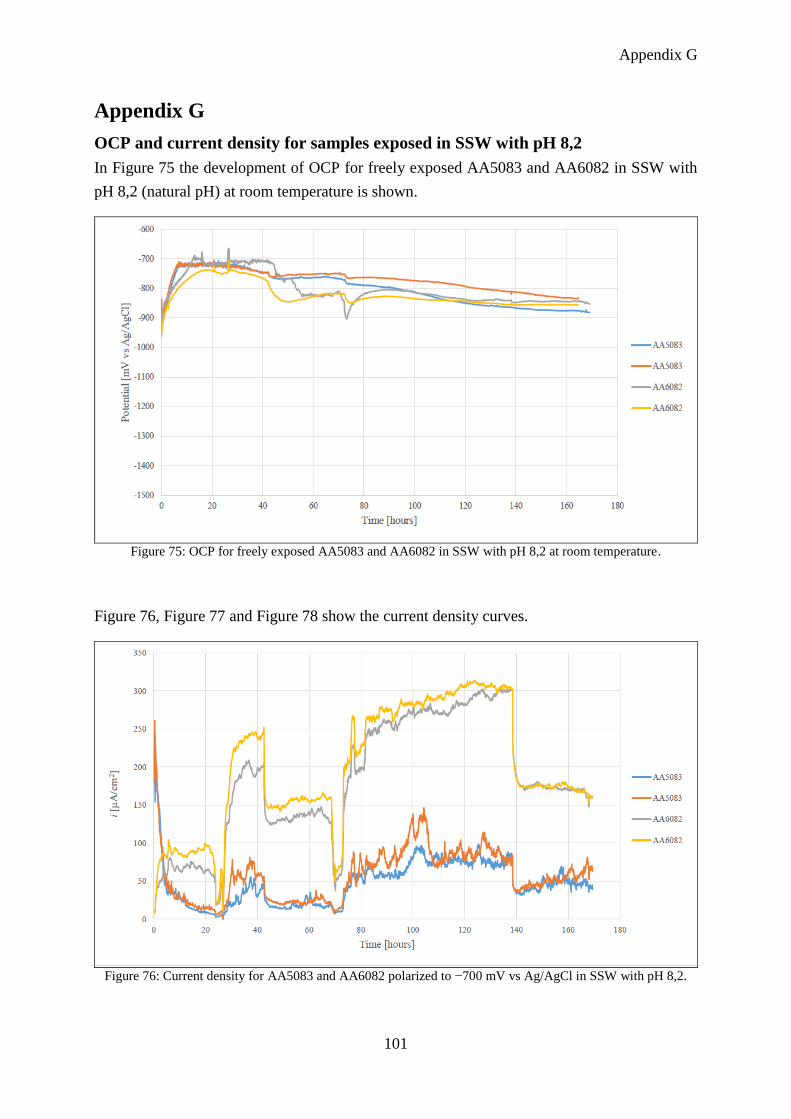
Appendix G
101
Appendix G
OCP and current density for samples exposed in SSW with pH 8,2
In Figure 75 the development of OCP for freely exposed AA5083 and AA6082 in SSW with
pH 8,2 (natural pH) at room temperature is shown.
Figure 75: OCP for freely exposed AA5083 and AA6082 in SSW with pH 8,2 at room temperature.
Figure 76, Figure 77 and Figure 78 show the current density curves.
Figure 76: Current density for AA5083 and AA6082 polarized to −700 mV vs Ag/AgCl in SSW with pH 8,2.
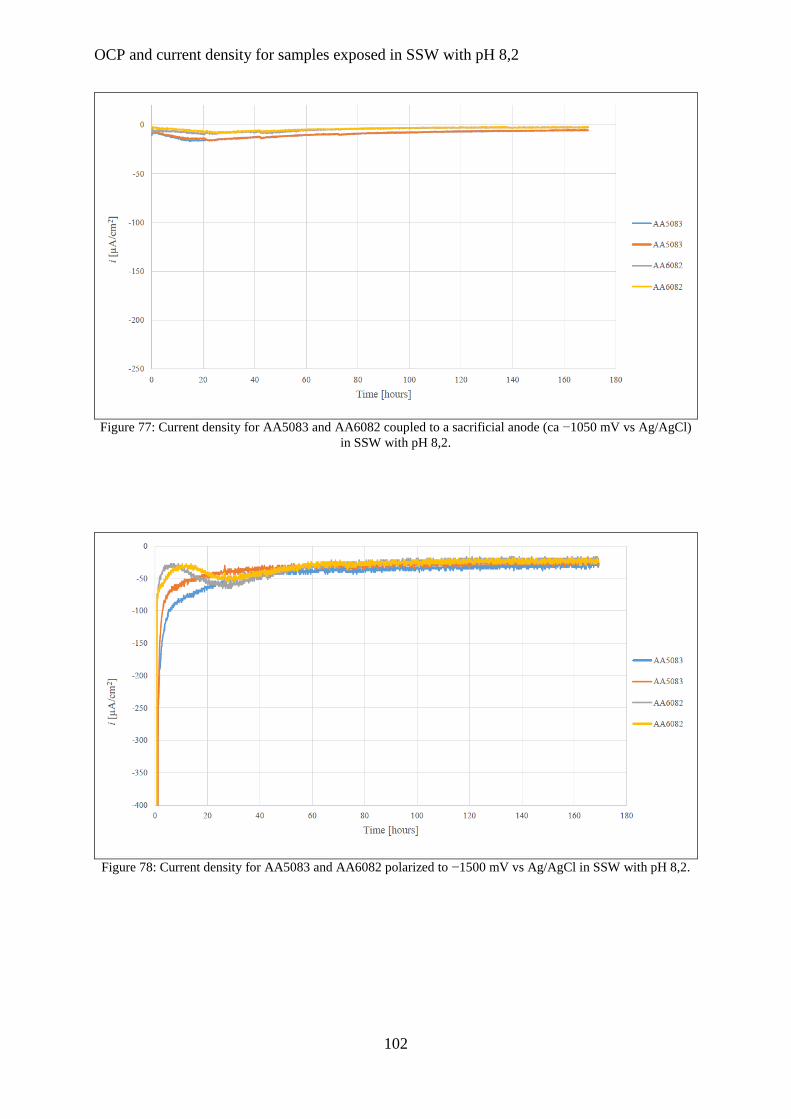
OCP and current density for samples exposed in SSW with pH 8,2
102
Figure 77: Current density for AA5083 and AA6082 coupled to a sacrificial anode (ca −1050 mV vs Ag/AgCl)
in SSW with pH 8,2.
Figure 78: Current density for AA5083 and AA6082 polarized to −1500 mV vs Ag/AgCl in SSW with pH 8,2.
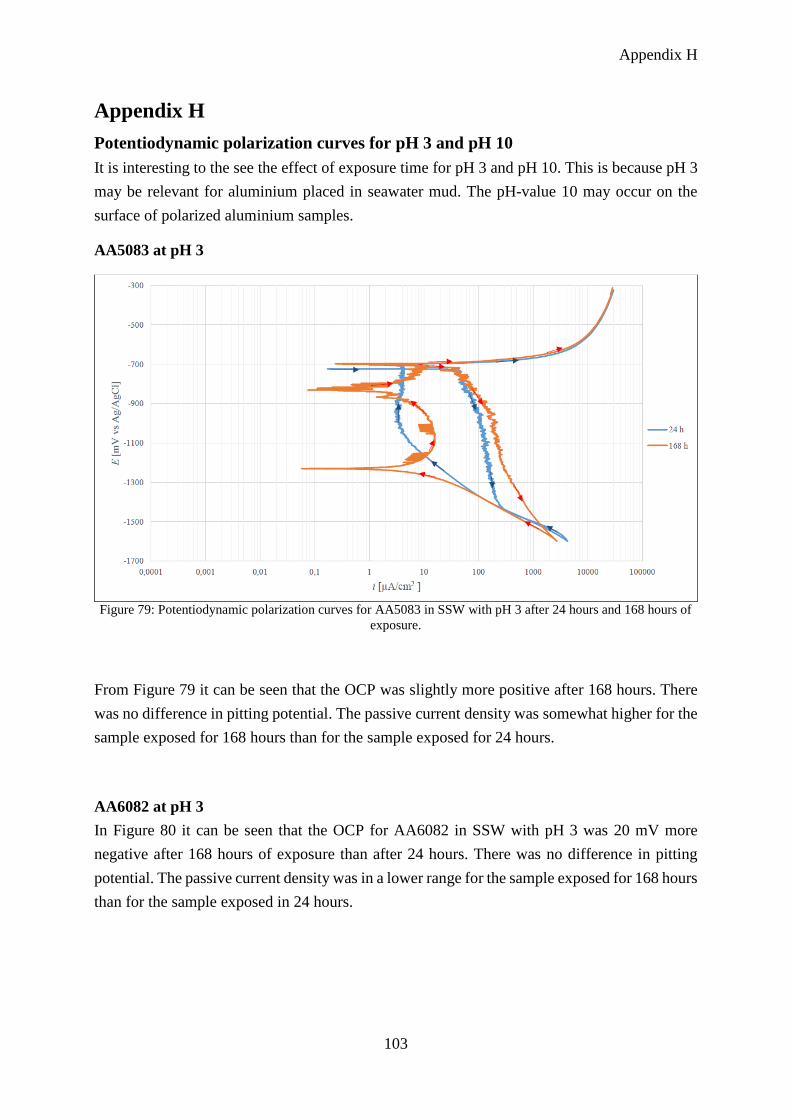
Appendix H
103
Appendix H
Potentiodynamic polarization curves for pH 3 and pH 10
It is interesting to the see the effect of exposure time for pH 3 and pH 10. This is because pH 3
may be relevant for aluminium placed in seawater mud. The pH-value 10 may occur on the
surface of polarized aluminium samples.
AA5083 at pH 3
Figure 79: Potentiodynamic polarization curves for AA5083 in SSW with pH 3 after 24 hours and 168 hours of
exposure.
From Figure 79 it can be seen that the OCP was slightly more positive after 168 hours. There
was no difference in pitting potential. The passive current density was somewhat higher for the
sample exposed for 168 hours than for the sample exposed for 24 hours.
AA6082 at pH 3
In Figure 80 it can be seen that the OCP for AA6082 in SSW with pH 3 was 20 mV more
negative after 168 hours of exposure than after 24 hours. There was no difference in pitting
potential. The passive current density was in a lower range for the sample exposed for 168 hours
than for the sample exposed in 24 hours.
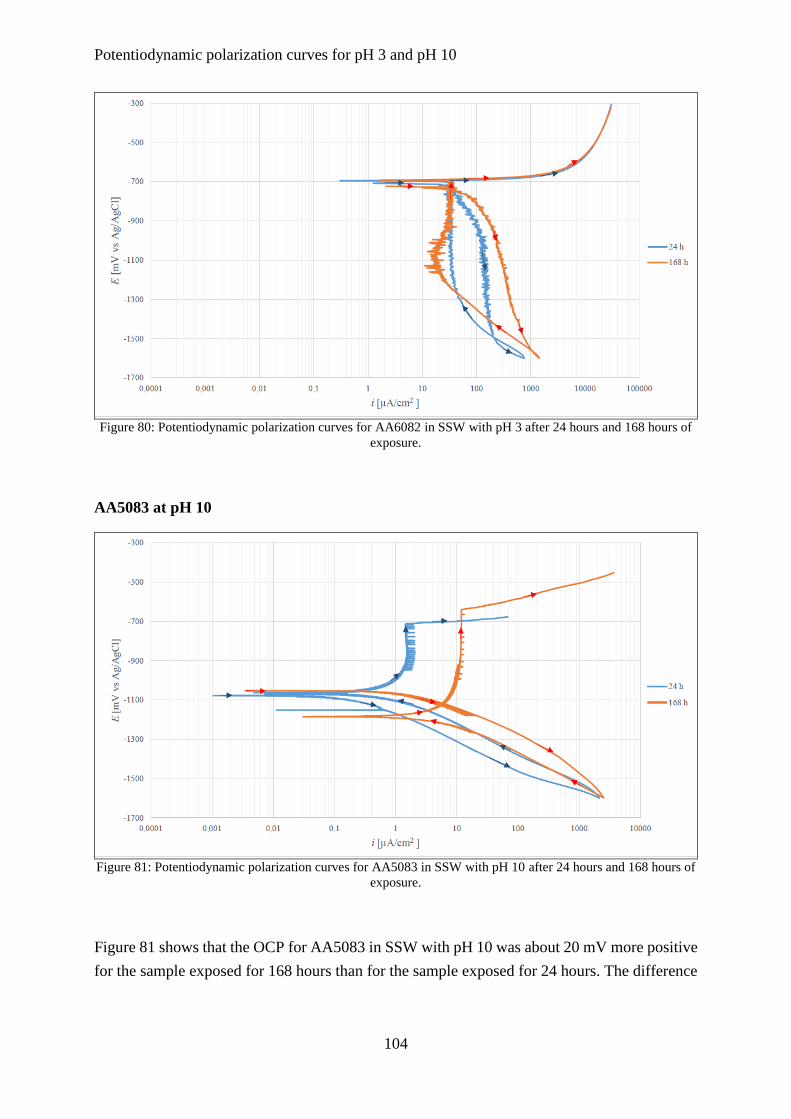
Potentiodynamic polarization curves for pH 3 and pH 10
104
Figure 80: Potentiodynamic polarization curves for AA6082 in SSW with pH 3 after 24 hours and 168 hours of
exposure.
AA5083 at pH 10
Figure 81: Potentiodynamic polarization curves for AA5083 in SSW with pH 10 after 24 hours and 168 hours of
exposure.
Figure 81 shows that the OCP for AA5083 in SSW with pH 10 was about 20 mV more positive
for the sample exposed for 168 hours than for the sample exposed for 24 hours. The difference

Appendix H
105
in pitting potential was about 80 mV. The passive current density was significantly larger for
the sample exposed in 168 hours.
AA6082 at pH 10
Figure 82: Potentiodynamic polarization curves for AA6082 in SSW with pH 10 after 24 hours and 168 hours of
exposure.
Figure 82 shows that there was a significant difference in OCP, the OCP for the sample exposed
for 168 hours was 110 mV more negative. No pitting potential can be seen, because the limits
for the recording of the potentiodynamic polarization curves were not sufficient wide for these
samples. The passive current density was significantly larger for the sample exposed for 168
hours.


Appendix I
107
Appendix I
Risk assessment
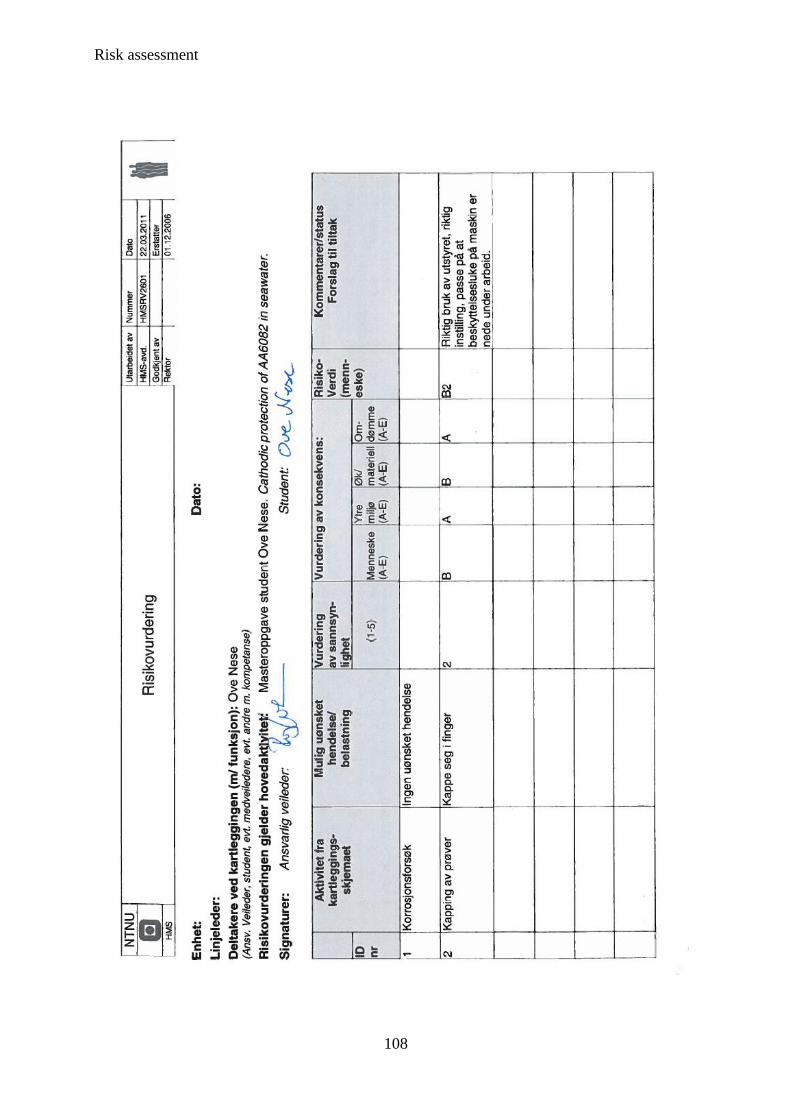
Risk assessment
108

Appendix I
109
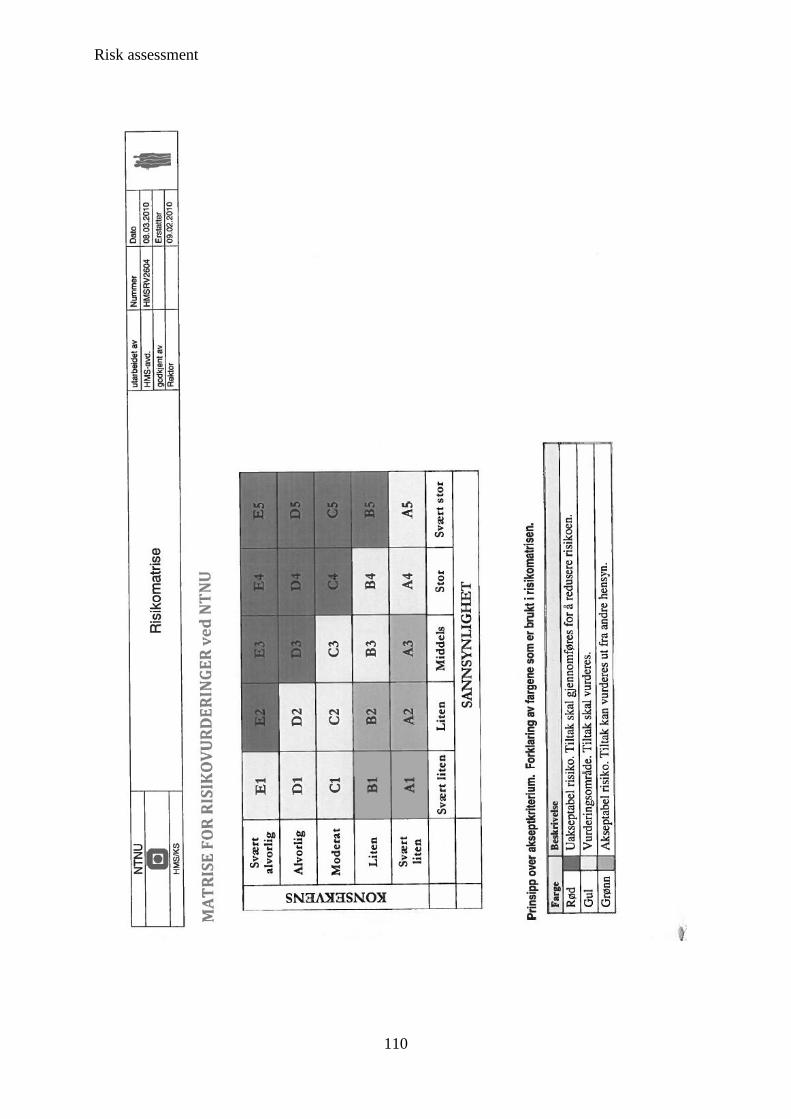
Risk assessment
110


![kmstechnologies.com¼… · 10−1 100 101 102 10−2 10−1 t [s] step response [mV/km] seawater air, seawater air, seawater, sediments air, seawater, sediments, reservoir 100 102](https://img.dokumen.tips/doc/110x75/5ed9d12ffc45a253ed575c3b/-10a1-100-101-102-10a2-10a1-t-s-step-response-mvkm-seawater-air-seawater.jpg)