Embed Size (px)
Citation preview

1
NAME 591 COMPUTER AIDED DESIGN PROJECT
2015-2016
CONCEPT DESIGN OF LNG BUNKERING SUPPLY VESSEL
UNIVERSITY OF BIRITISH COLUMBIA
DEPARMENT OF NAVAL ARCITECTURE AND MARINE ENGINEERING
AUTHORS
MEHRAN ZARGHAM
ARJUN PAHWA
PRAVEEN DWARKANATH
DEBANJAN SAHA

2
NAME 591 COMPUTER AIDED DESIGN PROJECT
2015-2016
April 28 2016
Dr. Christopher B. McKesson
Instructor
The University of British Columbia
Subject: Submission of the Conceptual Design Report of the LNG Bunker Supply Vessel
Dear Dr. McKesson,
We are pleased to present to you the conceptual design of the LNG Bunker Supply Vessel. The project has
been completed and the report prepared in accordance to the course requirement for NAME 591 for
degree of Master of Engineering in Naval Architecture and Marine Engineering. Furthermore, the project
was carried out following standard industrial practices as well as, recommended best practices.
Yours Truly,
UBC- LNG Bunker Vessel Team.
3
NAME 591 COMPUTER AIDED DESIGN PROJECT
2015-2016
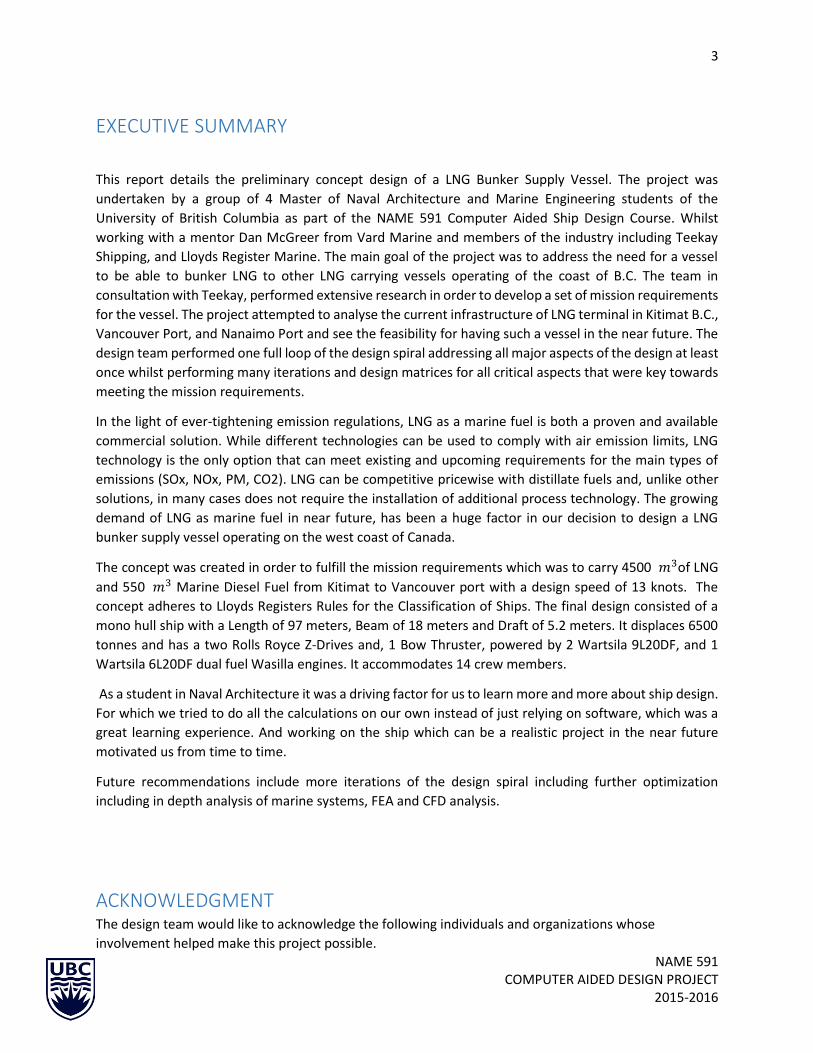
EXECUTIVE SUMMARY
This report details the preliminary concept design of a LNG Bunker Supply Vessel. The project was
undertaken by a group of 4 Master of Naval Architecture and Marine Engineering students of the
University of British Columbia as part of the NAME 591 Computer Aided Ship Design Course. Whilst
working with a mentor Dan McGreer from Vard Marine and members of the industry including Teekay
Shipping, and Lloyds Register Marine. The main goal of the project was to address the need for a vessel
to be able to bunker LNG to other LNG carrying vessels operating of the coast of B.C. The team in
consultation with Teekay, performed extensive research in order to develop a set of mission requirements
for the vessel. The project attempted to analyse the current infrastructure of LNG terminal in Kitimat B.C.,
Vancouver Port, and Nanaimo Port and see the feasibility for having such a vessel in the near future. The
design team performed one full loop of the design spiral addressing all major aspects of the design at least
once whilst performing many iterations and design matrices for all critical aspects that were key towards
meeting the mission requirements.
In the light of ever-tightening emission regulations, LNG as a marine fuel is both a proven and available
commercial solution. While different technologies can be used to comply with air emission limits, LNG
technology is the only option that can meet existing and upcoming requirements for the main types of
emissions (SOx, NOx, PM, CO2). LNG can be competitive pricewise with distillate fuels and, unlike other
solutions, in many cases does not require the installation of additional process technology. The growing
demand of LNG as marine fuel in near future, has been a huge factor in our decision to design a LNG
bunker supply vessel operating on the west coast of Canada.
The concept was created in order to fulfill the mission requirements which was to carry 4500 𝑚3of LNG
and 550 𝑚3 Marine Diesel Fuel from Kitimat to Vancouver port with a design speed of 13 knots. The
concept adheres to Lloyds Registers Rules for the Classification of Ships. The final design consisted of a
mono hull ship with a Length of 97 meters, Beam of 18 meters and Draft of 5.2 meters. It displaces 6500
tonnes and has a two Rolls Royce Z-Drives and, 1 Bow Thruster, powered by 2 Wartsila 9L20DF, and 1
Wartsila 6L20DF dual fuel Wasilla engines. It accommodates 14 crew members.
As a student in Naval Architecture it was a driving factor for us to learn more and more about ship design.
For which we tried to do all the calculations on our own instead of just relying on software, which was a
great learning experience. And working on the ship which can be a realistic project in the near future
motivated us from time to time.
Future recommendations include more iterations of the design spiral including further optimization
including in depth analysis of marine systems, FEA and CFD analysis.
ACKNOWLEDGMENT The design team would like to acknowledge the following individuals and organizations whose
involvement helped make this project possible.

4
NAME 591 COMPUTER AIDED DESIGN PROJECT
2015-2016
Vard Marine Dan McGreer Lloyd’s Register Ben Thompson Teekay Shipping Sergiy Yakovenko University of British Columbia
Jon Mikkelsen
Dr. Chris McKesson
Table of Contents EXECUTIVE SUMMARY .................................................................................................................................. 3
ACKNOWLEDGMENT ..................................................................................................................................... 3
List of Figures ................................................................................................................................................ 7

5
NAME 591 COMPUTER AIDED DESIGN PROJECT
2015-2016
List of Tables ................................................................................................................................................. 9
1. PROJECT OVERVIEW............................................................................................................................ 10
2. SUMMARY OF PRINCIPLE PARTICULARS ............................................................................................. 11
3. VESSEL OVERVIEW .............................................................................................................................. 11
3.1 ANALYSIS OF NEED ...................................................................................................................... 11
3.1.1 Targeted Customer ............................................................................................................. 12
3.1.2 Area of Operation ............................................................................................................... 12
3.1.3 Current and projected shipping in BC coast ....................................................................... 15
3.2 Concept of Operations ................................................................................................................ 15
3.3 SMART Requirements ................................................................................................................. 15
3.4 Critical Assumptions .................................................................................................................... 17
4.0 Bunker Operations General ............................................................................................................ 18
4.1 Bunkering Timeline ..................................................................................................................... 19
4.2 Key Characteristics Affecting Tank Capacity for Bunkering LNG ................................................ 19
4.3 Operational Issues aboard the receiving Ship ............................................................................ 21
4.3.1 During the Bunkering Process .................................................................................................... 21
4.3.2 Other Operational Phases Related to LNG Storage ................................................................... 25
4.4 Bunker Operations .......................................................................................................................... 27
4.4.1 Emergency Procedures ................................................................................................................ 29
4.4.2 Responsibilities .......................................................................................................................... 30
4.4.3 Manning ..................................................................................................................................... 30
Safety/ Major Hazards............................................................................................................................... 30
Major Hazards ......................................................................................................................................... 31
5.0 Special Equipment’s ........................................................................................................................ 33
5.1 Nitrogen Plants ........................................................................................................................... 33
5.2 Re liquefaction plant ................................................................................................................... 33
5.2.1 Pre-Cooler ........................................................................................................................... 33
5.2.2 BOG Compressors ............................................................................................................... 34
5.2.3 Cold Box .............................................................................................................................. 34
5.2.4 Cryogenic Heat Exchanger ...................................................................................................... 35
5.2.5 LNG Pump ............................................................................................................................... 35
5.2.6 Vent Gas Heater ...................................................................................................................... 36

6
NAME 591 COMPUTER AIDED DESIGN PROJECT
2015-2016
5.2.7 Nitrogen Re-liquefaction Loop ................................................................................................ 36
5.2.8 Operations stages ................................................................................................................... 36
5.2.8.1 Re-liquefaction Plant Off ..................................................................................................... 37
5.2.8.2 Re-liquefaction Plant Standstill ........................................................................................... 37
5.2.8.3 Standby mode ..................................................................................................................... 37
5.3.8.4 Re-liquefaction mode .............................................................................................................. 37
5.3.8.5 Vent Gas Mode ....................................................................................................................... 37
5.3.8.6 Excessive BOG Mode ............................................................................................................... 37
6.0 HULL FORM DEVELOPMENT ........................................................................................................... 38
7.0 Structural design of type C independent tank ................................................................................ 42
7.1 METALS FOR APPLICATION AT CRYOGENIC TEMPERATURE ........................................................... 43
We considered three metals practically established in various applications for handling LNG. There
applications, physical and chemical properties are discussed in the tables below. ................................... 43
7.2 Physical Properties of Metal used for LNG ..................................................................................... 44
7.3 Mechanical Properties of the material ........................................................................................... 44
7.4 Design of Type C independent tank as per Lloyd’s rule: ................................................................. 45
7.5 Shell Thickness ................................................................................................................................ 46
7.6 LNG tank Insulation ......................................................................................................................... 47
8.0 RESISTANCE ESTIMATES .................................................................................................................. 49
8.1 Overview ..................................................................................................................................... 49
8.2 Holtrop Method .......................................................................................................................... 49
8.3 Bulbous Bow considerations: ...................................................................................................... 51
8.4 Propeller Calculation and Prediction of Propulsive Power. ........................................................ 54
9.0 PROPULSION SELECTION ................................................................................................................. 57
10.0 Main Engine Selection .................................................................................................................... 58
10.1 Engine Configuration................................................................................................................... 60
10.2 Engine Selection .......................................................................................................................... 60
11.0 INTACT STABILITY ANALYSIS ........................................................................................................... 61
12.0 DAMAGE STABILITY ANALYSIS ........................................................................................................ 63
12.1 Analysis ....................................................................................................................................... 63
12.2 Conclusion ................................................................................................................................... 64
13.0 General Arrangement..................................................................................................................... 63

7
NAME 591 COMPUTER AIDED DESIGN PROJECT
2015-2016
14.0 STRUCTURAL DESIGN ...................................................................................................................... 67
14.1 Rule Set ....................................................................................................................................... 67
14.2 Design Methodology ................................................................................................................... 68
14.3 Vessel Loading ............................................................................................................................. 70
14.4 Mid-ship Section ......................................................................................................................... 73
15.0 WEIGHT ESSTIMATE ........................................................................................................................ 73
15.1 Parametric Estimate .................................................................................................................... 73
15.1.1 Structural Weight .................................................................................................................... 74
15.1.2 Machinery Weight Estimation ................................................................................................ 74
15.1.3 Outfitting Weight Estimation .................................................................................................. 75
15.1.4 Weight Margins ....................................................................................................................... 75
15.2 Light Ship Weight Estimation ...................................................................................................... 76
16.0 COST ANALYSIS ............................................................................................................................... 78
16.1 Construction Cost Analysis .......................................................................................................... 78
16.1.1 Construction Cost Summary ............................................................................................... 80
17. CONCLUSION ......................................................................................................................................... 80
18. REFERENCES .......................................................................................................................................... 81
APPENDIX A: PARAMETRIC STUDY .............................................................................................................. 81
APPENDIX B: TANK CALCULATIONS ............................................................................................................ 86
APPENDIX C: STRUCTURAL CALCULATION .................................................................................................. 88
APPENDIX D: WEIGHT ESTIMATION .......................................................................................................... 108
APPENDIX E: STABILITY ANALYSIS ............................................................................................................. 111
APPENDIX F: RESISTANCE PREDICTION ..................................................................................................... 118
APPENDIX G: PROPELLER AND POWERING CALCULATION ....................................................................... 123
APPENDIX H: COST ESTIMATION ............................................................................................................... 123
APPENDIX I: CAD DRAWINGS .................................................................................................................... 124
List of Figures Figure 1 Ship Travel Path 13 Figure 2 Radial Distance from Kitimat to Vancouver 14 Figure 3 Electrical Isolation 25 Figure 4 Cold Box with Separator 35

8
NAME 591 COMPUTER AIDED DESIGN PROJECT
2015-2016
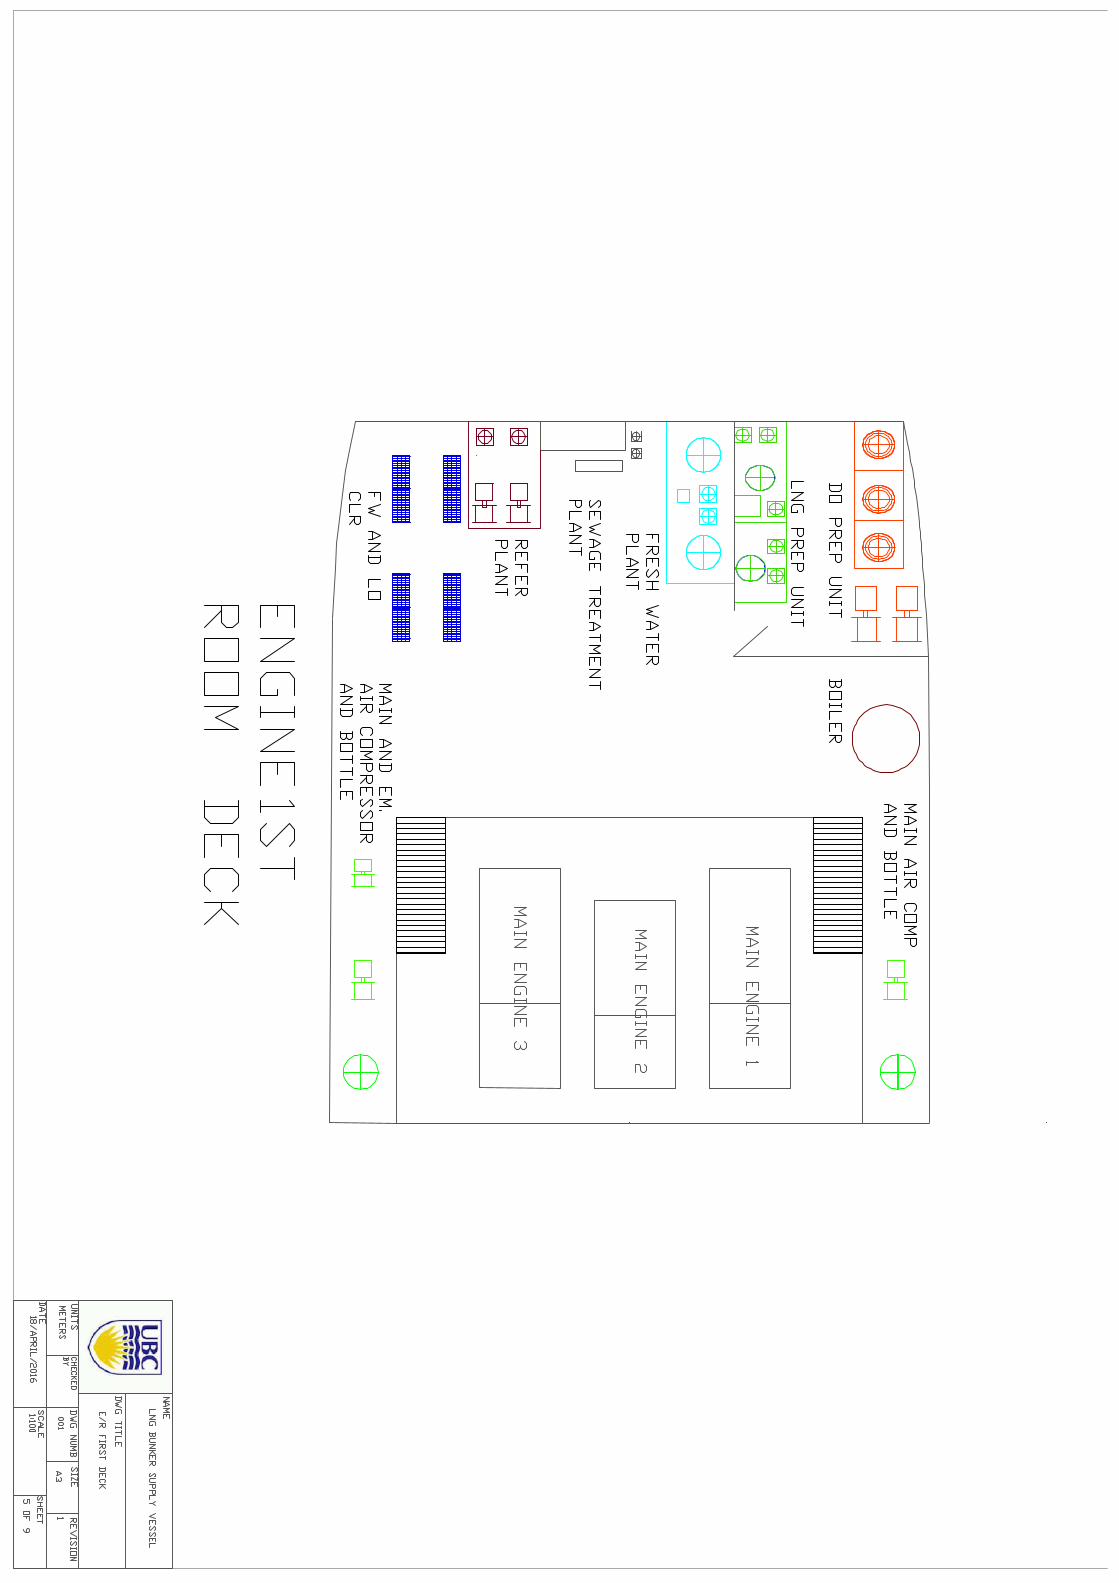
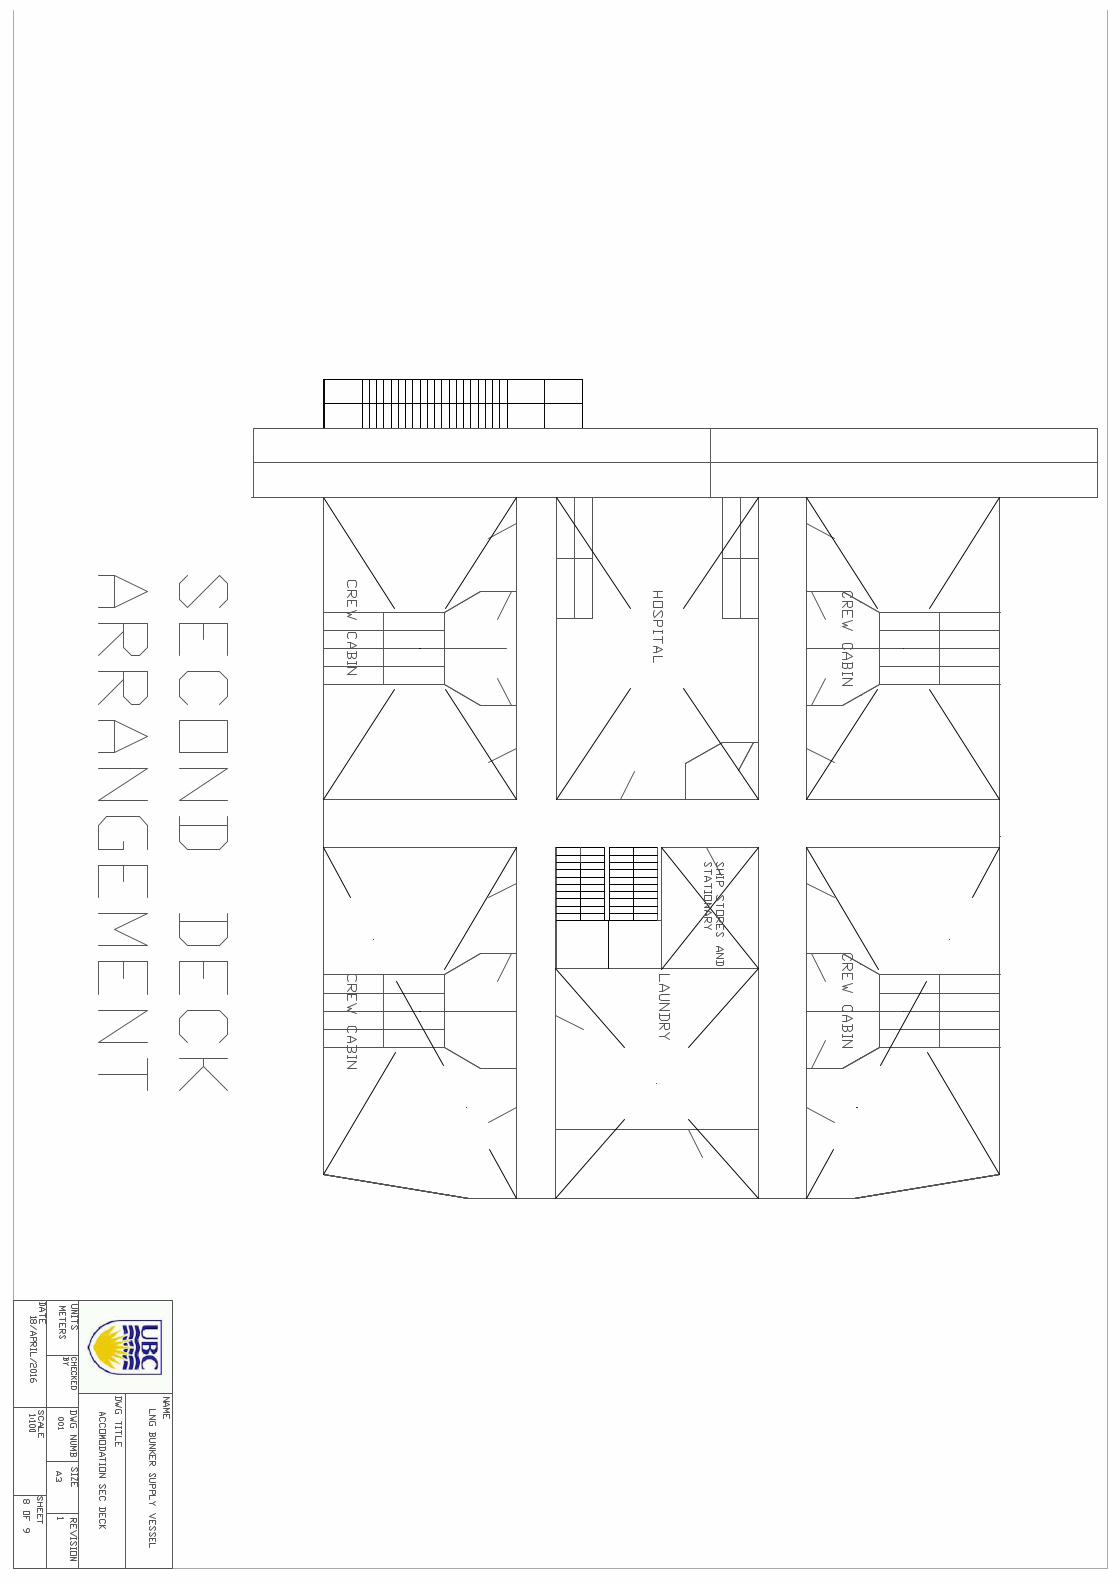
Figure 5 Line Plan 42 Figure 6 Parameter Ranges for Different Ship Types 50 Figure 7 Speed vs Power graph 51 Figure 8 Bulb Geometry 2 52 Figure 9 Bulb Geometry 3 52 Figure 10 Determination of Main Bulb Dimensions 53 Figure 11 GZ plot at Fully Loaded Draft 62 Figure 12 Location of Watertight Bulkheads 63 Figure 13 Bottom Platform 64 Figure 14 Engine Room 1st Platform 65 Figure 15 ECR Platform 65 Figure 16 Main Deck 66 Figure 17 1st Deck Accommodation 67 Figure 18 2nd Deck Accommodation 67 Figure 19 3rd Deck accommodation 68 Figure 20 Longitudinal Framing 70 Figure 21 Bending Moment Diagram 72 Figure 22 Shear Force Diagram 72 Figure 23 Midship Section 73 Figure 24 Outfit Weight Coefficient 76
List of Tables Table 1 Principle Particulars ........................................................................................................................ 11
Table 2 Current and projected shipping along the BC coast..................................................................... 155
Table 3 Summary of Parent Ships ............................................................................................................... 38
Table 4 Tank Comparison ............................................................................................................................ 39
Table 5 Parent Ship Data………………………………………………………………………………………………………………………. 40
Table 6 Summary of Tank Design ………………………………………………………………………………………………………….46

9
NAME 591 COMPUTER AIDED DESIGN PROJECT
2015-2016
Table 7 Tank Cost Comparison……………………………………………………………………………………………………………….47
Table 8 Insulation Comparison…………………………………………………………………………………………………………….. 48
Table 9 Propeller Design ……………………………………………………………………………………………………………………….56
Table 10 Propeller Selection Matrix……………………………………………………………………………………………………….59
Table 11 Mode of Operation …………………………………………………………………………………………………………………60
Table 12 Intact Stability Criteria IMO A 749 …………………………………………………………………………………………..61
Table 13 Intact Stability Results …………………………………………………………………………………………………………….62
Table 14 Thickness Calculation for Members ………………………………………………………………………………………..70
Table 15 Midship Weight Calculation ……………………………………………………………………………………………………77
Table 16 Cost Analysis …………………………………………………………………………………………………………………………..79
1. PROJECT OVERVIEW The purpose of the project was to come up with a solution to part of Vancouver’s lack of infrastructure to
supply LNG to LNG carrying vessels and the growing need to address the prospect of using LNG as an
alternative fuel solution for ships in the near future. In recent years, there has been a growing concern on
air pollution and air quality, the extent and complexity of regulations have increased while regulations
have become tougher. Annex VI of the MARPOL Convention applies to all ships trading internationally and

10
NAME 591 COMPUTER AIDED DESIGN PROJECT
2015-2016
has been used as the basis for many regulations. With MARPOL Annex VI, the International Maritime
Organization (IMO) has prioritised reduction of NOx and SOx emissions to air. In order to comply with
SOx compliance, a low sulphur fuel needs to be used. There are many low sulphur fuels such as Liquefied
Natural gas (LNG), Liquefied Petroleum Gas (LPG), and biofuels. Unlike SOx emissions which are a product
of fuel sulphur content, NOx emissions are created during the combustion process. How much NOx
created depends on the fuel being used. Some fuels such as LNG and methanol, have lower NOx emissions
than the marine fuels.
MARPOL Tier III emission limit for NOx will take effect for marine diesel engines installed on ships whose
keels are laid on or after January 1st 2016 if they are operating within the North American and US
Caribbean Sea. This emission limit is equivalent to 80 % reduction of NOx emissions from marine diesel
engines. In order to be compliant to this requirement, there are several possible solutions, a selective
catalytic reduction (SCR), exhaust gas recirculation (EGR). These Tier III engine installations can be very
different to existing Tier II engines, these differences may take the form of alternative fuels such as natural
gas or liquefied natural gas (LNG) change of fuel type to LNG.
LNG is low in sulphur and easily combusted in engines and boilers. Furthermore, Gas engines are widely
used in land based industries, and also in LNG carriers for many years. With the new regulations coming
into effect within the next few years, the potential for a new fuel that is more environmental friendly can
be seen. The LNG would also be compliant to ECA regions, which would make it a viable choice for the
ship owners who would be transitioning from the conventional distillates.
A study conducted by Colombia Institute (Institute, 2015) has shown potential promise in B.C. for the
shipbuilding sector in the future. This along with a recent federal bid to make B.C. the lead regulator of
LNG terminals, would be a great opportunity for the design and construction of LNG vessels.
Hence the core reason for taking up this project was to show that this can be done. By transporting LNG
from Kitimat terminals and supplying it to the local vessel running on LNG fuel, we could utilize this and
provide a feasible solution by our concept design for a LNG bunkering Vessel which could be taken to
other stages by industry professionals.
2. SUMMARY OF PRINCIPLE PARTICULARS The primary driving factor for the design of this vessel, was the selection and arrangement of the LNG
cargo tanks. The group came up with a dozen conceptual designs for a variety of arrangements and tank
types. And from our customer’s requirement (Teekay shipping), the vessel has to carry 4500 meters cube
of LNG, we choose the optimum design and receive approvals from project mentors after consulting with
them. This design calls for two Type C IMO approved LNG tanks placed longitudinally. The vessel also

11
NAME 591 COMPUTER AIDED DESIGN PROJECT
2015-2016
carries 550 meters cube of Diesel Oil in order to supply to ships. Table 1 below, overviews the principle
particulars of the vessel.
Table 1 Principle Particulars
Particular Value
LWL 95.87
LOA 97
BWL 17.5
BOA 18
DRAFT 5.2
DEPTH 11.5
BLOCK COEFFICIENT 0.74
PRISMATIC
COEFFICIENT 0.75
CLASS Lloyd's
3. VESSEL OVERVIEW The project became successful due to several reasons, the first was having a well-defined needs
statement. Since LNG bunkering vessels are relatively new types of designs, there are very few parent
vessels out there and the group lacked adequate information. The only help the group received was a few
brochures’ with pictures of proposed designs for such vessels. The owner’s requirement was well defined
and helped us initially have the parameters to which we needed to design. Furthermore, mentor Dan
McGreer provided much guidance and feedback on our design, progress, and the further needed
iterations for us to be able to complete this project. When necessary, the design team performed
calculations based off of available information in order to determine additional requirements.
3.1 ANALYSIS OF NEED British Columbia is known for its expansive picturesque coastlines, and for its enormous supply of natural
gas specifically in the Northeast. An estimated 2933 trillion cubic feet primarily in four areas: the Horn
River Basin, the Montney, the Liard Basin and the Cordova Embayment. This is enough natural gas to
support energy needs not only in Canada but also around the world for more than 150 years (Columbia,
2015).
Since natural gas is the cleanest, most efficient fossil fuel available, it has world-wide demand. When it is
chilled -160 °C, natural gas becomes liquid, shrinking to 1/600th of its original volume. This would make it
very efficient and economical to send to the overseas markets.
As of October 2014, it has been proposed that there would be up to 18 industry projects that produce and
export LNG from plants along B.C’s coast (Columbia, 2015). A key strategy of B.C. government’s LNG
Particular Value
LOADED
DISPLACEMENT 6500 Tonnes
DEADWEIGHT 3200 Tonnes
LIGHTSHIP WEIGHT 2975 Tonnes
CARGO LNG 4500 m3
CARGO DEISEL 550 m3
POWER 4440 KW
DESIGN SPEED 13 Knots
OPERATIONAL AREA BC Waters
GAS CONSUMPTION 7.2 Tonnes/day

12
NAME 591 COMPUTER AIDED DESIGN PROJECT
2015-2016
strategy is to promote the advantages ports in Kitimat and Prince Rupert. Transportation of LNG within
British Columbia waters would provide the ideal scenario for a bunkering vessel to be present in order to
provide bunkering to LNG carrying vessels.
This gives rise to the purpose of our project. In an initial study, it was determined that there is a lack of
such a vessel in the coast of B.C. Furthermore, the infrastructure presented at Kitimat is ideal for a
bunkering vessel to bunker LNG and travel down the coast of B.C., once reaching near ports of Vancouver,
or Nanaimo, it could bunker LNG to LNG carrying vessels. This is ideal since the provincial government has
heavily invested in shipbuilding and LNG. The group saw a golden opportunity to take the initiative and
come up with a vessel that will address the needs of LNG vessels that do not have the opportunity to
bunker LNG at Vancouver ports as the necessary infrastructures are not present yet.
The team conferred with mentor Dan McGreer, senior Naval Architect at Vard marine, and also with Sergiy
Yakovenko from Teekay shipping, to get a better understanding of the customer needs, as well as the
project scope and deliverables.
3.1.1 Targeted Customer In the article LNG Bunkering Infrastructure Study (Aagesen, 2010), published by Lloyd’s Register, Jesper
Aagesen, Senior Surveyor, Ship Design Specialist, said that the year 2015 is an important year for the
shipping industry. During that time, Jasper mentioned there will be stricter requirements on fuel oil
sulphur content. This will enter into force in emission control areas (ECAs) which are the Baltic Sea, and
the North American Coast together with the U.S. Caribbean. Then from 2015, the maximum allowable
sulphur content in fuel oils is 0.1 percent in the ECAs. From 2020 onwards, a global requirement of
maximum 0.5 percent sulphur (outside of ECAs) will also apply. It is important to understand since Jasper
argued that vast majority of the world merchant fleet will enter ECAs during their lifetime and since more
ECAs are expected to be introduced in the future, action needs to be taken. Using LNG as an alternative
fuel Jasper mentioned would be one of the best alternatives, not only to meet these needs but also
eventually leave burning of fossil fuels behind.
The Teekay shipping who are our customer, has shown a lot of interest in our vessel. Teekay Shipping has
a lot of stake in the gas sector, especially in LNG carrying vessels. They are experts in the transfer of LNG
to other vessels. They could use vessel such as ours for their operation in the Pacific North West region.
3.1.2 Area of Operation The ship would operate in Pacific North West of the Canadian waters, it would get LNG fuel from Kitimat
port and travel down the waters of coastal B.C. and meet LNG fuel ships near Nanaimo or Vancouver and
bunker LNG to them. Figure 1 below outlines the locations where the ship would bunker LNG.
Furthermore, Figure 2 below shows the nautical mile distance from Kitimat to Vancouver. As can be seen
from the figure, it takes about 444 nautical miles from Kitimat to Vancouver. The vessel also needs to go
to Nanaimo which is around 33 nautical miles. The ship is carrying two LNG tanks which holds up to 5006
m3 of LNG fuel. The ship needs to transport 4500 m3 of LNG. The remaining LNG in the tanks which is 506
m3 of LNG would be used for consumption by the ship in its journey and some safety margins.
Furthermore, the ship is also carrying 550 m3 of diesel oil which would be bunkered to other vessels.

13
NAME 591 COMPUTER AIDED DESIGN PROJECT
2015-2016
This area of operation was used as it was part of our customer requirements as they wanted a bunkering
vessel which would operate in these waters and be able to bunker LNG fuel to other LNG carrying ships.
It also addresses the lack of infrastructure in Vancouver port for providing LNG fuels to ships.
Figure 1 Ship travel path

14
NAME 591 COMPUTER AIDED DESIGN PROJECT
2015-2016
Figure 2 Radial distance from Kitimat to Vancouver

15
NAME 591 COMPUTER AIDED DESIGN PROJECT
2015-2016
3.1.3 Current and projected shipping in BC coast The team got in contact with Ben Thompson from Lloyds Register, Ben was very supportive and provided
the team with hard data on both the current and projected shipping traffic along the BC coast for LNG
vessels as compared to Bulk Carriers. These vessels are only traveling to BC ports and not going to US
waters. Table 2 shows this data.
Table 2 Current and projected shipping along the BC coast
TYPE Size/ Class
DWT( thousand)
Ships per year current
Ships per year projected
LNG 160-170k-
CBM 85-90 0 600-1000
Bulk Carriers Panamax
65 70-80 70-80
As can be seen from the table 2, the current Bulk Carrier ships currently and the projected ones will
remain the same value between 70-80 ships, LNG ships however are projected to be a staggering 600-
1000 in the near future. This is why addressing the issue and having an LNG bunkering vessel would be
very ideal to address it the near future.
3.2 Concept of Operations The Vessel shall be operated as LNG bunker supply vessel that will serve a varied clientele. The primary mission of the vessel is to provide safe, efficient, reliable, and economic bunkering options to LNG fueled vessels operating in and around Vancouver region. The vessel has home port Kitimat, and it will load at the Kitimat LNG terminal. The ship will then sail to
Vancouver/Nanaimo region following coastal routes, where it meets the client vessel in order to perform
the bunkering operations. Once the vessel has bunkered to the client vessel, it will travel back to its home
port. All of the ship board operations shall be executed at the home port.
3.3 SMART Requirements Speed: 13 knots
Range: The vessel will operate over a distance of 1200 nm at service speed.
Required Manning: 14 persons
Maneuverability: The offeror shall carry out maneuverability test during the sea trials along with the owner technical representative.
Number of Cabins: 8 cabins with single occupancy, which includes 6 cabins for all of the officers, 1 for the pilot/owner, and 1 should be kept as spare. 5 double occupancy cabins which will be shared amongst the crew.
Medical: First aid, and emergency response for LNG hazards should be provided on board. There shall one medical room for general treatment of the crew.
Sanitary System: Every cabin shall have its own WC, and there shall be WC in each deck/engine room/bridge.

16
NAME 591 COMPUTER AIDED DESIGN PROJECT
2015-2016
Level of Safety: The ship shall be built as per Lloyds register Class rules and Transport Canada regulations. The ship should have dedicated muster stations. The vessel shall be equipped with emergency towing arrangements at both ends.
Sea Keeping: The vessel shall be fully operable in sea state 3 as per Beaufort Number.
Transfer Rate: 300 m^3/hr.
The vessel shall be operated as LNG bunker supply vessel that will serve a varied clientele. The primary mission of the Vessel is to provide safe, efficient, reliable, and economic bunkering options to LNG fueled vessels operating in and around Vancouver region.
The ship is expected to have an operational life of 20 years. During this period, it shall be taken to a dry dock every 2.5 years for intermediate service, and every 5 years for major service.
The vessel should operate in 13 knots but be able to operate in different speeds and should be easily maneuvered with maximum reliability.
The vessel shall be equipped with a dual fuel engine, propelled by diesel and Liquefied Natural Gas (LNG) as per tier 3 restrictions, Annex 6 of MARPOL. The designer shall select the appropriate engine and propulsion option to meet the vessel’s speed, propulsion and fuel requirement.
The vessel shall be equipped with the latest telecom facilities, communications, and navigation systems.
The vessel will have the following emergency safety feature: o Electrical emergency fire pump o Emergency air compressor o Emergency lighting o Emergency generator o Emergency battery back up o All the doors shall be water tight wherever required, and A60 class standard. Also it shall
be fitted with self-closing mechanism. o Adequate life boats, and life rafts shall be provided as per Lloyd’s Register Rules.
The vessel shall be equipped with emergency towing arrangements.
Bunkering of the vessel shall happen on Vancouver/Nanaimo coastal areas.
100 tons of domestic fresh water tank shall be provided to serve ships domestic requirements. The water shall be bunkered at Kitimat.
Underway conditions- At all throttle settings, the accommodation and engine control room will be provided with HVAC. Optimum level of noise vibration as per Lloyd’s Register shall be designed.
The funnel location shall be located at the aft end of the ship in order to prevent the smoke falling onto the open decks. The height of this shall be in accordance as per Lloyd’s Register rules
It shall a hull corrosion prevention system
The vessel shall carry the necessary drugs and medication for all of the minor health problems
The operation crew of the vessel shall be certified and competent and will need to have the following ranks:
o Navigation department 1 Captain 1 Chief officer 1 second officer 3 deck crew

17
NAME 591 COMPUTER AIDED DESIGN PROJECT
2015-2016
o Engine department 1 chief engineer 1 second engineer 1 third engineer 3 engine crew
o Galley department 1 cooks 1 steward
The vessel shall have Planned Maintenance System (PMS), Garbage Management and Segregation Plan, Emergency Evacuation Plan, Fire Plan, Bunkering Plan, Risk Management Plan, Safety Management System (SMS) as per International Safety Management (ISM), Ship Security Plan (SSP) should comply as per International Ship and Port Security (ISPS)
All equipment and machinery shall be mounted so that it is accessible for ease of maintenance and inspection so that components are easily replaced with a minimum amount of interference. This includes keeping the overhead in way of main engines free of pipes or cable runs and installation of lifting pad eyes and rails for machinery removal
The vessel maneuverability characteristics shall allow for rapid, safe and controlled docking in all weather conditions.
The ships machinery shall be provided with spares as per the necessary planned maintenance system.
The ship shall receive its provisional stores and spares for engine/deck department at Kitimat port.
The ship shall be provided with adequate capacity of lubricants.
The ship shall be provided with adequate capacity of sewage holding tanks as per Lloyds Register rules.
The vessel shall be provided with a waste oil tank as per MARPOL requirement, the capacity of this tank shall be sufficient for 7 days of operation of vessel which will be discharged at Kitimat Port
3.4 Critical Assumptions Assuming the sea draft is sufficient for the ship to operate without grounding
Assuming the air draft is sufficient for the ship to operate without a major land obstacle i.e. bridges
Kitimat port has arrangement for reception of following o Fuel bunkering facility o LNG bunkering facility o Sludge and garbage disposal facility o Sewage disposal facility o Lube oil bunkering facility o Catering services o Service technicians from the manufactures shall be provided
There is adequate budget for the construction and design of this vessel
The vessel and crew are insured by P&I
2 Years of Extended Warranty on Main engines, Propulsion System by the Manufacturer.

18
NAME 591 COMPUTER AIDED DESIGN PROJECT
2015-2016
4.0 Bunker Operations General
Loading LNG into fuel tanks is a different process from loading HFO due to some unique differences
in the fuel’s characteristics. One difference is that LNG is carried as a boiling liquid, which means
temperature and pressure influence the behavior of the liquid. A second difference is that LNG is a
cryogenic liquid at temperatures of about -162°C (-259°F), and consequently, it is hazardous to
personnel and any conventional steel structures or piping with which it comes into contact. A third
difference is that the vapor from typical petroleum bunkering is not considered to create a
hazardous zone because the flash point is above 60°C (140°F), and is simply vented through flame
screens to the atmosphere. In contrast, LNG vapor can form explosive clouds in confined spaces and
is considered hazardous. This requires special handling of the vapor when bunkering.
Methods of filling LNG storage tanks have been developed wherein there is no vapor emitted from the
tanks, or the vapor is returned to the bunkering vessel or terminal. Lines used for bunkering must at the
completion of bunkering be drained of LNG and the remaining gas vapors removed using nitrogen. Any
liquid remaining in the pipes that is trapped between closed valves will boil and expand to fill the space
available. If that space is small, the pressure developed by the expanding vapor can increase to
dangerous levels and cause the pipes to burst or valves to be damaged. Where there is a risk of natural
gas pressure buildup, such as LNG storage tanks and piping systems, relief valves are required to safely
allow the excess pressure to be released as a final safety measure. Relief valves should be properly
located so the hazardous zone created by the release of vapor is not near any operational areas aboard
the vessel. In general, relief valves should tie into a vent mast which directs the gas away from all critical
areas.
LNG is bunkered at cryogenic temperatures so special equipment and procedures are required. Any
contact of personnel with the fuel will cause severe frostbite. Spillage of even small amounts of LNG
can cause structural problems as unprotected normal structural steel can become embrittled by
the cold liquid, leading to fracture. Stainless steel drip trays, break-away couplings, and special hose
connections that seal before uncoupling are often used to protect from spillage.
Communication between the receiving ship and the bunkering facility is always important, but it is even
more critical when handling LNG. Because of the greater potential for hazardous situations with LNG
bunkering, proper procedures should be followed and understood between the person- in-charge on
the bunkering facility and receiving ship. Security and safety zones around the bunkering operation
need to be set up to reduce the risk of damage to property and personnel from the LNG hazards, reduce
the risk of outside interference with the LNG bunkering operation, and to limit the potential for
expansion of a hazard situation should LNG or natural gas release take place.
19
NAME 591 COMPUTER AIDED DESIGN PROJECT
2015-2016
4.1 Bunkering Timeline Assuming all the bunker is taken by a single vessel and cargo pumps are running at full speed of 300 m3/hr,
the time limit for the bunker scenario is for 17 hours for the complete procedure. It would take about 1
hour before bunkering, 15 hours during bunkering, and 1 hour after bunkering.
However it is very unlikely that all the cargo will be taken by a single vessel. Normally 1 ship bunkers around 2000-2500 m3 of LNG at a time.
4.2 Key Characteristics Affecting Tank Capacity for Bunkering LNG
Typical LNG characteristics, including chemical components and composition, heating value, methane
number, liquid density, and methane vapor pressure (boiling pressure) are provided in the Appendix.
The following characteristics represent key considerations for handling LNG and highlight its important
differences from typical liquid fuel storage and bunkering.
Bunkering (Loading) Temperature: At atmospheric pressure, natural gas will liquefy at a temperature
of about -162°C (-260°F). As LNG increases in temperature, its vapor pressure increases and its liquid
density, decreases. These physical changes need to be considered because they may increase the
required storage tank volume and pressure rating.
Filling Limit: The filling limit of an LNG tank is the maximum allowable liquid volume in the tank, expressed
as a percentage of the total tank volume. The filling limit is not the same as the loading limit. The maximum
filling limit for LNG cargo tanks is 98 percent at the reference temperature.
This same limit is expected to apply to LNG fuel tanks. A higher filling limit may be allowed on a case-
by-case basis based on requirements from classification societies and regulatory bodies.
Reference Temperature: The reference temperature is the temperature corresponding to the saturated
vapor pressure of the LNG at the set pressure of the pressure relief valves. For example, if the LNG tank
has a pressure relief valve set pressure of 0.7 barg (10.15 psig), then the reference temperature is -
154.7°C (-246.4°F), which is the temperature that natural gas will remain a liquid at
0.7 barg (10.15 psig).
Loading Limit: The loading limit is the maximum allowable liquid volume to which the tank may be
loaded, expressed as a percentage of the total tank volume. This limit depends on the
LNG densities at the loading temperature and reference temperature and is determined by the following
formula:

20
NAME 591 COMPUTER AIDED DESIGN PROJECT
2015-2016
R
Where: LL = loading limit
FL = filling limit
= LNG density @ reference temperature
ρL = LNG density @ loading temperature
Typical loading limits for gas fueled vessels are expected to range from 85 to 95 percent depending on tank type, pressure relief valve settings, and other vessel specific considerations.
Effect of Temperature and Pressure on Loading Limit: To understand the effect of temperature and
pressure on the loading limit, it is helpful to consider an example where LNG and vapor are not being
consumed from the tank. In this case, the LNG tank is a closed system and remains at a saturated
condition, meaning the liquid and vapor are in equilibrium. Even though the tank is insulated, some heat
will leak into the tank and cause an increase in the liquid and vapor temperatures while they remain in
a saturated condition.
Liquid density decreases as temperature increases. If the tank is nearly full, the space available for vapor
is relatively small, so the increase in liquid volume due to a lower density can significantly reduce the
available vapor space volume. This decrease in available vapor volume as a result of the temperature
changes will result in higher vapor pressure.
If the tank temperature is allowed to increase unchecked, the pressure in the tank will increase to the
point where the pressure relief valves open. The temperature of the LNG at this point is the reference
temperature. Because the density of the LNG at the reference temperature is lower than the density
at the loading temperature, and given the formula for the loading limit, it is clear that the loading limit
will always be lower than the filling limit.
As the pressure relief valve setting is increased, the reference temperature of the LNG also
increases, which has the advantage of increasing the amount of time it takes for the tank to reach the
pressure relief opening pressure. However, because the reference temperature is higher, the LNG
density at the reference temperature will be lower, resulting in a greater difference between the LNG
density at the loading and reference temperatures than in tanks with a low relief valve setting. This
presents a tradeoff between initial loading capacity and the time it takes to reach the set pressure of
the relief valve.
Heel: The volume of LNG that is normally left in the tank before bunkering is called the tank heel. This
small volume of LNG keeps the LNG tank cold before it is refilled during bunkering. The required tank
heel should be calculated with the assistance of the tank designer and fuel gas designer based on
several variables such as tank size and shape, ship motions, heat inflow from external sources, gas
consumption of the engines, and bunkering and voyage schedule. As a general rule of thumb, for initial
design considerations a tank heel of 5 percent can be assumed.
21
NAME 591 COMPUTER AIDED DESIGN PROJECT
2015-2016
Usable Capacity: In general, the usable capacity of the LNG tank is equal to the loading limit minus the
heel, expressed as a percentage of the total tank volume. The usable capacity is the consumable
volume of bunkered LNG in the tank.
4.3 Operational Issues aboard the receiving Ship
4.3.1 During the Bunkering Process
When receiving LNG bunkers, the receiving ship needs to implement several operational procedures
that are unique to LNG. These procedures include special communications and monitoring,
emergency shutdown, cryogenic material precautions, inerting and purging, firefighting and
electrical isolation or bonding.
1. Communications and Monitoring: Communications between the receiving ship and bunker
supplier is critical for carrying out the bunkering operation safely. Communications should be
established before the bunker hoses are connected and can end after the hoses are disconnected.
It is important for the supplier and receiver to both speak a common language and fully
understand each other.
Although currently there are no established standards, compatibility of all communication links between the receiving ship and bunker supplier must be confirmed and tested.
Radio and communication equipment for involved persons should include the following
considerations:
• Radio equipment to be used in the safety zone during the operation should be designed for
use in hazardous areas and should be intrinsically safe.
• Any radio equipment, cell phones, or portable electronic equipment in the safety zone that are
not intrinsically safe should be removed from the area.
In addition to the communication system, a monitoring system with data link may be
provided. The monitoring system allows both parties to monitor their own systems as well as
critical aspects of the other’s system. This data link may be an integral part of the emergency
shutdown system or independent. Integrated systems allow for automatic shutdown of the
bunkering operation upon receiving an alarm, such as from the gas, fire, or smoke detection
systems, or from manual activation. The typical technologies used for data and
communication links in the LNG industry include electrical and fiber optic cables, radio
frequency and pneumatics. All of the listed technologies, except pneumatics, have the
capacity to transfer additional information, such as communications or monitoring of other
important, but non-LNG related systems. Pneumatic systems are simple and dependable, but

22
NAME 591 COMPUTER AIDED DESIGN PROJECT
2015-2016
generally only capable of sending one signal. They are typically used as the emergency
shutdown.
2. Emergency Shutdown (ESD): Having a means to quickly and safely shut down the bunkering
operation by closing the manifold valves, stopping pumps, and closing tank filling valves is
essential to ensure safety. The ESD should be capable of activation from both the bunker receiving
ship and the bunker supplier, and the signal should simultaneously activate the ESD on both sides
of the transfer operation. No release of gas or liquid shall take place as a result of ESD activation.
Typical reasons for activation of the ESD include the following:
• Gas detection
• Fire detection
• Manual activation from either the supplier or receiver
• Excessive ship movement
• Power failure
• High level in receiving tank
• Abnormal pressure in transfer system
• High tank pressure
• Other causes as determined by system designers and regulatory organizations 3. Special Precautions for LNG: The issues associated with cryogenic substances like LNG are
extremely important to understand and respect. LNG cannot simply be handled as ‘cold
diesel’. It is in fact extremely cold and can cause serious burns to human flesh. Even
uninsulated LNG pipes and equipment can become cold enough to cause serious injury to
personnel. In addition, the cryogenic temperatures are cold enough to cause steel to become
brittle and crack. Because of these issues, the piping system, material requirements, and
safety issues are much different than for an oil fuel system. The hull or deck structures in
areas where LNG spills, leaks or drips may occur must be either suitable for the cold
temperatures or protected from the cold temperatures.
Drip trays are commonly used to contain LNG leakage and prevent damage to the ship’s
structure. This includes the location below any flanged connection, which are typically fitted
with spray shields, in the LNG piping system or where leakage may occur. Drip trays should be
sized to contain the maximum amount of leakage expected and made from suitable material,
such as stainless steel. Cryogenic pipes and equipment are typically thermally insulated from
the ship’s structure to prevent the extreme cold from being transferred via conduction. These
requirements are especially important at the bunker station because this is where LNG leaks or
spills are most likely to occur.

23
NAME 591 COMPUTER AIDED DESIGN PROJECT
2015-2016
4. Inerting and Purging: Before bunkering, it is necessary to inert and purge the bunker hoses and
other warm bunker lines. In order to prevent a flammable gas mixture, the inerting process
includes displacing air from the bunker lines with inert gas, typically nitrogen, to ensure the
oxygen content is less than or equal to 1 percent. Purging, also known as gassing up and gas filling,
is the process of displacing the inert gas with warm natural gas. Purging can either be done with
vapor purge lines, which force vapor from the tank through the bunker lines; or by slowly
pumping small volumes of LNG through the bunker lines, which will quickly vaporize and purges
the lines. After the bunker lines have been inerted and purged, the lines are slowly cooled to the
temperature of LNG with the use of cold LNG vapor and/or LNG. This process prevents the risk of
cold shock and damage that would occur if LNG was allowed to flow through the warm hoses and
pipes at the normal flow rate. Once the bunker lines have been cooled, the transfer of LNG can
begin.
After bunkering, it is very important to drain the bunker lines so that LNG does not remain
trapped in pipes or hoses. If LNG remains trapped in a sealed section of a pipe or hose, it will
warm, vaporize and pressurize the pipe and may cause the pipe or hose to burst. One way to
drain the bunker line is to allow the LNG to vaporize in the pipes while the valves leading to the
ship’s fuel tank are left open. This allows the LNG and natural gas vapor to flow to the tank. Purge
connections also can be used after bunkering to force the remaining LNG into the ship’s fuel
tanks.
When bunkering is complete and the lines have been drained of LNG, it is necessary to inert the
LNG bunker lines to prevent a flammable gas mixture from accumulating in the pipes or hose.
Inerting is to be completed prior to disconnecting the bunker lines. Typically, nitrogen is used to
displace the warm natural gas from the bunker lines. The bunker facility and receiving ship should
agree on the means to properly manage and dispose of the remaining natural gas and nitrogen
so that the natural gas is not released into the atmosphere. This may be accomplished by pushing
the natural gas and nitrogen mixture back into the bunkering facility tanks or by using gas
combustion units or boilers. Furthermore, it should be confirmed with all agencies having
jurisdiction over the bunkering operation that the proposed procedure is acceptable. Figure 3
shows a typical sequence for a simplified bunkering process including the inerting and purging of
the bunker hose and associated piping.
5. Safety and Firefighting: SOLAS Chapter II-2 can be referenced for fire protection requirements for
an LNG fueled vessel. A permanently installed fire extinguishing system will typically be fitted at
the bunker station and drip trays. Manual release of the system should be easily possible from

24
NAME 591 COMPUTER AIDED DESIGN PROJECT
2015-2016
outside, but near, the bunker station.
In addition, portable dry chemical fire extinguishers are typically located near the bunker
station and in nearby areas with easy access by the crew. For enclosed or semi-enclosed
bunker stations, a fixed fire and gas detecting system should be fitted.
A water curtain is frequently fitted wherever large quantities of cold LNG can leak and damage
critical structural components, such as the ship’s side shell directly below the LNG bunker
station and bunker hoses and above the waterline.
Fighting LNG fires is not a simple task. Completely extinguishing an LNG fire could leave a pool
of LNG which will continue to release gas that could reignite in a much more intensive fire. The
most important first step is to cool any surrounding tanks or pipes that contain LNG, natural
gas or other flammable substances, and to cool spaces that contain critical machinery and
accommodations. This will help prevent the spread of the fire and reduce its consequential
damage. Intensive heating of LNG tanks by an outside fire impinging on the tank can lead to
excessive venting of the tanks. Spraying large quantities of water by a deluge system or from
hoses or monitors is generally the recommended method of cooling. Medium or high-expansion
foam sprayed on a liquid pool LNG fire also can reduce the intensity of the flames, reducing the
potential for damage to surrounding areas, but will not stop the release of gas.
6. Electrical Isolation: Vessels transferring or receiving low flashpoint flammable liquids, such as
LNG, need to take additional precautions against ignition resulting from electrical arcing. Two
causes of arcing are static electricity buildup in the LNG bunker hose and differences in
potential between the ship and bunker supplier’s facility, including the quay or pier, trucks,
bunker vessels, etc. It used to be common practice to connect a bonding cable between a ship
carrying low flashpoint flammable liquids and the loading or offloading facility to physically
ground the two objects together to equalize the difference in potential. However, it was noted
that the bonding cable was not fully effective at equalizing the potential. Furthermore, if the
cable accidentally broke or became detached, the chances of arcing would be greatly increased.
An effective way of preventing arcing is to isolate the ship and the bunker supplier using an
isolating (insulating) flange fitted at one end of the bunker hose only, in addition to an
electrically continuous bunker hose. The isolating flange, an example of which is shown in
Figure 3, prevents arcs from passing between the ship and facility even if there is a difference
in potential. Furthermore, because the hose is electrically continuous and one end is
grounded to either the ship or the bunker supplier, static electricity will effectively be
dissipated. An alternative method is to use one short section of insulating hose without any
isolating flanges, but with the rest of the bunker hose string electrically continuous. To ensure

25
NAME 591 COMPUTER AIDED DESIGN PROJECT
2015-2016
that the ship is completely isolated from the supplier, it may be necessary to isolate mooring
lines, gangways, cranes, and any other physical connections. This is typically done by using
rope tails on mooring lines, insulating rubber feet on the end of gangways, and prohibiting
the use of certain equipment that would otherwise pose an unacceptable risk of arcing.
Figure 3: Electrical Isolation
4.3.2 Other Operational Phases Related to LNG Storage
In addition to the actual bunkering process, there are several LNG handling and storage
operations on board the receiving ship that are unique to cryogenic fuels. These involve
managing the storage tank temperature and the mixing of LNG of different densities.
1. Initial Gassing Up: Before the initial filling of an LNG fuel tank or after it has been completely
emptied and gas-freed, it will be full of air. Before LNG can be introduced to the tank, the air
needs to be removed by inerting the tank (typically with nitrogen) to ensure an explosive mixture
of gas and air is never present in the tank. Some ships might not be fitted with a nitrogen
generator or nitrogen storage tank with sufficient capacity to inert the entire fuel tank or tanks.
This task might be accomplished by the LNG bunker supplier or another source, such as a nitrogen
tank truck or a fixed tank onshore. Even if the ship has a large enough nitrogen capacity, it should
have proper connections to accept an outside source of nitrogen in case of system failure or
emergencies.
LNG bunkering can begin only after the LNG fuel tank has been properly inerted, purged and
cooled down. The tank is inerted with nitrogen gas. After inerting the tank, the inert gas is
Bolt-stud
washer
Nut

26
NAME 591 COMPUTER AIDED DESIGN PROJECT
2015-2016
typically displaced with warm natural gas. Displacing the inert gas with warm natural gas is
known as purging, gassing up or gas filling. The inert gas is either returned to the shore facility
or vented. Venting of the inert gas is stopped when the natural gas vapors are detected. It
should be confirmed with all agencies having jurisdiction over the bunkering operation whether
the inert gas can be released into the atmosphere; some agencies may require that the inert
gas be captured and stored or processed since it could contain natural gas. The tank is then
gradually cooled in stages to the temperature of the incoming LNG. The cooldown process can
be accomplished using cold natural gas and/or LNG.
This initial cooldown is typically done by spraying LNG into the fuel tank to slowly cool the
piping, the tank and the gas in the tank. This is a slow process that uses a much lower flow
rate than normal bunkering to ensure uniform cooling and minimize induced thermal stresses
in the tank. The cooldown process may take several hours, typically 12 to 18 hours,
depending on the size of the tank. The cooldown procedure is typically developed by the
tank’s manufacturer and includes directions for the use of the tanks spray nozzles and
bottom filling. Once the tank is cooled to the specified temperature, continuous filling of the
tank can continue to the desired level. Although the procedures and sequence of events will
differ, the use of cold nitrogen gas and/or liquid nitrogen also is common for the cooldown
process.
2. Transit and Storage: During transit, the ship’s fuel tanks will normally contain some quantity of
LNG. The volume of cold LNG in the tank, as a minimum, should be sufficient to maintain the cold
temperature in the tank. Tank pressure during transit can be maintained within acceptable
limits by consuming LNG or by using vapor control methods. Draining and Stripping: The
requirement to strip the LNG fuel tank prior to entry into a shipyard may vary worldwide
depending on shipyard or port authority policies. Tank stripping can be accomplished by building
up the tank pressure to force the LNG out of the ship’s tank to another tank, or by using stripping
pumps. Any liquid left in the tank after stripping can be removed by circulating warm methane
vapor from the ship’s vaporizer. After stripping, the tank will need to be inerted with nitrogen. If
human entry and inspection is required, the tank has to be purged with fresh air to gas-free.
As specified in the ABS Gas Fueled Ships Guide, all LNG fueled ships also should have some means
of emptying the fuel tanks without relying on the ship’s own gas machinery system. This
capability would allow another vessel or shore side facility to empty and strip the LNG fuel tank
for scheduled events or in case of an emergency where the tank could release gas.
3. Rollover: When LNG from different sources with different densities are mixed (such as during a
bunkering operation when new LNG is introduced into a tank), the LNG with the higher density

27
NAME 591 COMPUTER AIDED DESIGN PROJECT
2015-2016
(typically lower temperature) settles at the bottom with the lighter density on top. If the tank
remains relatively stationary (no sloshing or mixing takes place) heating of the lower part of the
tank will decrease its density and increase its vapor pressure, but the hydrostatic pressure of the
LNG on top will keep gas from boiling off. If the density difference becomes too large or the tank
is disturbed so rapid mixing occurs, the LNG with higher vapor pressure at the bottom will rise up
and encounter the lower pressure at the top of the tank. This is called rollover and can lead to
rapid boil-off and generation of large amounts of vapor in extreme cases. This could lead to a large
gas release through the pressure relief valves.
LNG density can vary significantly with change in temperature, but it also can vary depending on
the physical composition of the LNG. As LNG warms, the lighter components boil off first and the
remaining LNG has a different composition, with an increased density. According to the Society of
International Gas and Tanker Operators (SIGTTO) publication, Guidance for the Prevention of
Rollover in LNG Ships, studies have shown that density differences as low as 1 kg/m3 can lead to
stratification if the LNG fill rate is very slow. This hazard has occurred in shore terminals where
there is no motion of the tank, and potentially is a hazard for ships which remain stationary in
port. A vessel rolling at sea will have less of a tendency for this to occur because the sloshing of
the LNG in the tank will cause mixing. It is unlikely for bunkered LNG to have the same
temperature and density as the LNG remaining in the fuel tank, so it is important for the LNG to
be thoroughly mixed during bunkering.
A typical way to minimize the risk of stratification is to use the top or bottom fill lines to mix the
incoming LNG with the retained heel in the tank. If the bunkered LNG is lighter (lower density)
than the heel, the bottom filling connection should be used. This will cause the bunkered LNG
to rise to the top of the denser heel, mixing in the process. Conversely, if the bunkered LNG is
heavier (higher density) then the top filling connection should be used. Mixing jet nozzles fitted
to the fill line in the bottom of the tank can be used to increase movement within the tank and
help to mix the bunkered LNG with the existing contents of the tank. Once the vessel goes to sea
and rolling commences, mixing will tend to happen naturally, reducing the risk of rollover.
4.4 Bunker Operations
The use of standardized procedures and checklists from existing projects may be helpful as guidance.
However, vessel-specific procedures for the bunkering operation should be developed to include any
characteristics or features that are unique to the particular bunkering facility and receiving vessel or
location.
28
NAME 591 COMPUTER AIDED DESIGN PROJECT
2015-2016
The following is a simplified bunker operation sequence. Actual sequences will vary depending on the
suppliers and receiver’s equipment and capabilities. More detailed sequences are currently available
online from some ports, such as the Port of Rotterdam.
Before Transfer:
1. Notify port authorities of intent to bunker, when required to do so.
2. Compatibility confirmed between the supplier and receiver regarding e q u i p m e n t , procedures and protocols.
3. Receiving ship moors alongside the quay or pier, or bunker vessel moors alongside receiving ship.
4. Security and safety zones are established.
5. Any pre-bunkering checklist, procedures, and communication protocols are completed and
agreed between the supplier and receiver. Persons-in-charge are designated.
6. Communications, monitoring and ESD links have been established. ESD is to be tested.
7. Supplier evaluates tank pressure and temperature (depends on tank types and bunker
procedure).
8. Firefighting equipment is readied for immediate use.
9. All safety systems, such as gas detection and alarms, are operational and have been tested.
10. Sufficient lighting is established.
11. All involved personnel put on required PPE.
12. Weather and sea conditions are deemed to be within established limits.
13. Electrical isolation or bonding connections, as applicable, are c o n f i r m e d .
14. Water spray curtains and drip trays, as applicable, are in place.
15. Supplier’s bunker hoses or transfer arms are connected between the supplier’s and
receiving ship’s manifolds.
16. Supplier and/or receiver should inert and then gas up and cool down all required bunker lines and
equipment that will be utilized.
17. LNG transfer starts.
During Transfer:
1. Monitor tank levels.
2. Monitor tank pressures and temperatures.
3. Monitor pump transfer rates.
4. Adjust pump flow rates as necessary.
29
NAME 591 COMPUTER AIDED DESIGN PROJECT
2015-2016
5. Adjust top spray and bottom fill rates as necessary to control tank pressure.
6. Adjust mooring lines and bunker hoses and arms as necessary.
7. Monitor that the integrity of security and safety zones is maintained. Monitor that weather
and sea conditions remain within limits.
After Transfer:
1. LNG transfer stops.
2. LNG in lines is allowed to vaporize and displace the remaining liquid back to the tanks.
3. Supplier and receiver inert all bunker lines and bunker hoses utilized during the
bunker operations.
4. Supplier’s bunker hoses, communications, monitoring, ESD and electrical isolation or
bonding connections are disconnected from the receiving ship’s manifold.
5. Receiving ship unmoors from the quay or pier, or bunker vessel unmoors from the receiving ship and notifies port authority.
4.4.1 Emergency Procedures
Emergency response planning and preparedness are critical to protect personnel, the environment,
the public and assets during an incident. In addition to the typically required emergency response
plans aboard the ship, specific plans relevant to an emergency involving the LNG system and bunkering
operations also should be developed and implemented.
Emergency procedures can be classed as ‘higher level’ and ‘lower level’. Higher level procedures are
intended to provide general instruction to all relevant personnel, while lower level procedures are
more specific to certain incidents, areas aboard the vessel, or equipment. The emergency
procedures are intended to provide guidance and direction on how to carry out an organized and
effective response to an incident, which may include LNG spill and/or gas release, fire or other
hazardous situation. Some possible incidents that directly affect bunkering are loss of power by the
supplier or receiver, non-LNG related fire near the bunkering, unexpected breakaway of one of the
vessels, etc. Emergency procedures also should exist for other external incidents not directly related
to the bunkering, such as a fire or gas release on a quay, pier or bunker vessel. Other emergency
procedures should handle incidents relating to injury sustained by personnel involved in bunkering,
such as frostbite induced by contact with extremely cold LNG or equipment.
It is important that personnel from both the supplier and the receiving ship are familiar with and trained
in the emergency procedures and have access to them at all times. The training, drills, and exercises
should ensure that all involved personnel understand the procedures, their role and responsibilities, and

30
NAME 591 COMPUTER AIDED DESIGN PROJECT
2015-2016
the use of the emergency response equipment available at the supplier and aboard the receiving ship.
The emergency procedures can be updated to reflect lessons learned from previous incidents or
exercises or to reflect any modifications made by the supplier or receiving ship. SIGTTO and other
agencies have developed numerous publications specifically related to the hazards of LNG which can be
referenced when developing emergency response procedures.
4.4.2 Responsibilities
A designated person-in-charge should be present for every LNG bunkering operation from both the
receiving ship and the supplier’s side. Aboard the receiving ship, this person-in-charge is normally
an officer permanently assigned to the ship who has the proper training and experience with all
relevant characteristics of the ship for the purposes of LNG bunkering. This includes the LNG
bunkering systems and procedures, monitoring and control systems, shipboard emergency
equipment and procedures, and pollution reporting procedures. The supplier also should have a
person-in-charge who is familiar and experienced with all aspects of the supplier’s bunkering
equipment and procedures. Both persons-in-charge should coordinate the bunkering operation and
have an adequate understanding of the other party’s bunkering capabilities and responsibilities
before starting the operation. Both persons should have complete responsibility for their side of the
bunkering operation and should be present for the entire duration.
4.4.3 Manning
Well-designed bunker facilities and LNG fueled ships may only require one or two people each
during a typical bunkering operation, but additional crew will be necessary for normal vessel
operations and should be available in case of emergency or other circumstances. The number of
bunker supplier personnel depends on the method of supply (e.g., truck, barge, ship or fixed
facility). Actual manning requirements will be dependent on the bunker procedure, facilities, and
regulatory requirements. All personnel involved in the bunkering operation should have the
necessary training and certification.
Safety/ Major Hazards
LNG presents hazards that are different than conventional marine fuels, like heavy fuel oil (HFO) and
marine gas oil (MGO). If released at normal ambient temperatures and pressures it will form a
flammable vapor, so the release of LNG or natural gas should be prevented at all stages of the
bunkering process. Furthermore, in its liquid phase, LNG is cold enough that it can cause ordinary
steel to become brittle and crack, so any contact with steel structures and decks should be
avoided. Because of these hazards and others that can occur, safety and the prevention of leakage
need to be among the primary objectives in the development of LNG bunkering system designs

31
NAME 591 COMPUTER AIDED DESIGN PROJECT
2015-2016
and procedures.
The three primary safety objectives for bunkering operations are as follows:
• Prevent the occurrence of any hazardous release of gas or liquid.
• In the event of a release, prevent or contain any hazardous situations.
• If a hazardous incident does occur, limit the consequences and harmful effects.
Major Hazards
The primary hazards of LNG are:
• Serious injuries to personnel in the immediate area if they come in contact with cryogenic
liquids. Skin contact with LNG results in effects similar to thermal burns and with exposure to
sensitive areas, including eyes, tissue can be damaged on contact. Prolonged contact with skin
can result in frostbite and prolonged breathing of very cold air can damage lung tissue.
• Brittle fracture damage to steel structures exposed to cryogenic temperatures. If LNG comes
into contact with normal shipbuilding steels, the extremely cold temperature makes the steel
brittle, potentially resulting in the cracking of deck surfaces or affecting other metal
equipment.
• Formation of a flammable vapor cloud. As a liquid, LNG will neither burn nor explode; however, if
released from bunkering equipment, it will form a vapor cloud as the LNG boils at ambient
temperatures. To result in a fire or explosion, the vapor cloud must be in the flammable range, which
for methane is between 5 and 15 percent by volume in air, and there must be an ignition source
present.
• Asphyxiation. If the concentration of methane is high enough in the air, there is a potential for
asphyxiation hazard for personnel in the immediate area, particularly if the release occurs in
confined spaces.
Some of the key hazards are discussed in more detail as follow:
Gas or LNG Release: The release of natural gas or LNG is to be prevented because of its flammable and cryogenic nature leading to many of the hazards which can be done by:
1. There are a number of factors affecting the consequence potential of an LNG release, including:
the surface it is released on, the amount released, air temperature, surface temperature, wind
speed, wind direction, atmospheric stability, proximity to offsite populations and location of
ignition sources. Although LNG vapors can explode (i.e., create large overpressures) if ignited
within a confined space, such as a building or ship, there is no evidence suggesting that LNG is

32
NAME 591 COMPUTER AIDED DESIGN PROJECT
2015-2016
explosive when ignited in unconfined open areas.
2. The primary way to avoid gas release is to make sure at no time a route exists for the gas or
liquid to escape over the full length of the bunkering system from the supply tank to the
receiving tank, including all pipes and hoses which may contain gas or liquid at any time in the
process. No release should occur during the hook-up or disconnect of any components during
the bunkering process. To ensure no release occurs at system connect or disconnect, purging of
the bunker piping systems with inert gas prior to connect or disconnect is necessary.
3. The bunkering system should be designed so that no breakage or overloading of the bunkering
system components will occur during the bunkering process, including consideration of
relative motions between the LNG supply tank and the receiving vessel under the full range of
wind and weather conditions that could occur during the bunkering process, and considering
the range of relative drafts and trims that could occur, plus any motions that may occur from
ships passing nearby.
4. In the case of overload or breakage of the connecting hoses, the use of special breakaway fittings and dry-disconnect couplings should prevent the release of any gas or liquid.
5. In the event of bunkering shutdown, measures need to be in place to remove any retained gas or
liquid in the system, particularly liquid. Retained LNG can boil off and create hazardous high
pressure in the bunkering system.
Fire: One of the greatest safety hazards to the bunkering process is fire at or in the vicinity of the
bunkering operations and piping systems. The reason fire is so dangerous is that natural gas is highly
flammable and will readily fuel and expand a fire if it is released in the vicinity of the fire. In addition,
the heat from fire can cause rapid boil-off of LNG in the vicinity of the fire, which can lead to system
component rupture and feed gaseous fuel directly into the fire, greatly expanding the hazard from
the fire. The best way to avoid fire is to avoid release of gas and exclude any sources of fire or ignition
from the vicinity of the bunkering operation and to have in place measures to fight and prevent
the spread of fires that could affect the bunkering operation area.
Rollover and Density Variation: As described in the section on operational issues on the receiving ship,
rollover and density variation can be a hazard when bunkering LNG fuel because LNG density changes
significantly with change in temperature and as a result of gas boil-off. A hazardous rollover incident
can occur when LNG with different density from that in the tank is bunkered without properly mixing
the LNG in the tank during the bunkering operation. If a rollover incident occurs, rapid gas boil-off and
the subsequent generation of large amounts of vapor could lead to gas release through the pressure
relief valves or impair the tank containment. This is more of a risk while a vessel is stationary than for
a rolling vessel at sea because the vessel motion will cause mixing. Measures as described in the bunker
operation sections of this Advisory should be used to properly mix new and old LNG.

33
NAME 591 COMPUTER AIDED DESIGN PROJECT
2015-2016
Cryogenic Temperatures: The cold temperature (about -162°C) of LNG is a hazard to normal steel,
other materials, and personnel. It will cause embrittlement of normal steel leading to fracture and
can similarly cause failure of other materials, such as rubber. It is an obvious hazard to any personnel
handling LNG system components. Special materials, such as cryogenic stainless steels, should be
used for structures like drip trays that could be exposed to LNG. Countermeasures, such as water
curtains, can be used to prevent excessive cooling of any regular steel structures that could be
exposed to LNG. Insulation is also necessary on any exposed components, particularly in areas where
personnel will be working.
5.0 Special Equipment’s
5.1 Nitrogen Plants One nitrogen generator is installed in the engine room, they are used to produce nitrogen in a gaseous
manner which is used for the following functions:
Purging for pipelines and boil off gas system.
Purging various parts of the cargo pipping and fuel gas lines.
5.2 Re liquefaction plant The liquefaction system is designed to provide cargo tank pressure control by liquefying all of the boil-off
gas from the cargo tanks during normal ship operations so protecting the tanks from over-pressurisation.
The boil-off gas from each of the cargo tanks is collected in a common vapour main then pre-cooled in a heat exchanger, compressed in a two-stage centrifugal (BOG) compressor, cooled and then condensed in a large multi-pass heat exchanger which is part of the cold box.
The BOG loop consists of the following main equipment: • Two BOG compressors, one duty and one standby • Two LNG transfer pumps, one duty and one standby • One BOG pre-cooler • One plate-fin cryogenic heat exchanger (part of the cold box) • One liquid BOG phase separator (part of the cold box) • Auxiliary systems
The plate fin cryogenic heat exchanger and the separator are assembled in one enclosed module located
in the compressor room and is called the ‘cold box’.
5.2.1 Pre-Cooler The pre cooler is there to make sure that the boil of gas (BOG) compressor discharge temperature remains
constant, therefore protecting the cold box from a large temperature variations and damages caused by
the thermal stress. This consists of a heat exchanger that is in a vertical separator and is designed to cool
the incoming BOG from -100 degrees Celsius to -120 degrees Celsius.

34
NAME 591 COMPUTER AIDED DESIGN PROJECT
2015-2016
Another function of the pre-cooler is to separate the liquid droplets from the vapour in order to protect
the compressor from any liquid carry-over. A safety feature in pre-cooler shuts down the BOG compressor
and closes the LNG supply value when activated.
5.2.2 BOG Compressors The BOG compressor is a two stage centrifugal compressor that controls the compressor capacity. This is
done by DGV (diffuser guide vanes) which is used on each stage. When one BOG compressor is running,
the suction pressure controller will modulate the recycle valve and the DGV’s to control the pressure in
the cargo tanks. In case the pressure for the cargo tank increases above the set point, the recycle valve
closes and the DGV’s will open, but this doesn’t happen until the valve is fully closed. The BOG compressor
is running at 100% capacity when the DGV’s are fully open. When however, the suction pressure drops
below the set point, the DGV will close and then recycle valve will open.
5.2.3 Cold Box The compressed boil-off gas transferred from the BOG compressor is cooled and condensed in a large
multi-pass heat exchanger called a cold box. The temperature in the heat exchanger is lowest at the
bottom (-164°C) and highest at the top where it is slightly above the cooling water temperature. The low
pressure nitrogen flows through from the bottom of the cryogenic heat exchanger to the top before it is
returned to the suction side of the first stage compressor on the nitrogen compander.
The heat exchanger temperature is allowed to change at a maximum rate of 0.7°C per minute and the
expander bypass valve protects the cold box temperature from changing quicker than this.
The cold box is shown in Figure 4. It consists of a plate-fin heat exchanger and a liquid separator assembled
inside a pearlite insulated steel casing. A nitrogen purging system ensures that there is an over-pressure
in the cold box at all times and a cold box gas detector has been placed in the purging stream outlet to
detect if there is a leak inside the cold box.
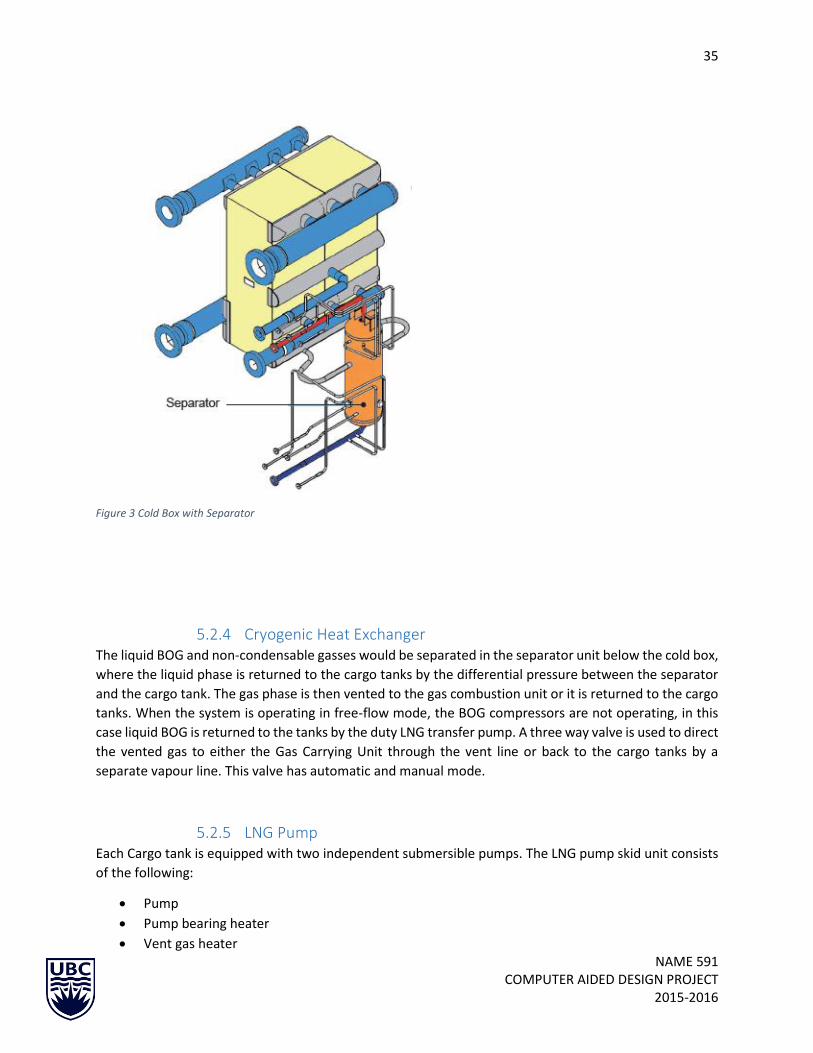
35
NAME 591 COMPUTER AIDED DESIGN PROJECT
2015-2016
Figure 3 Cold Box with Separator
5.2.4 Cryogenic Heat Exchanger The liquid BOG and non-condensable gasses would be separated in the separator unit below the cold box,
where the liquid phase is returned to the cargo tanks by the differential pressure between the separator
and the cargo tank. The gas phase is then vented to the gas combustion unit or it is returned to the cargo
tanks. When the system is operating in free-flow mode, the BOG compressors are not operating, in this
case liquid BOG is returned to the tanks by the duty LNG transfer pump. A three way valve is used to direct
the vented gas to either the Gas Carrying Unit through the vent line or back to the cargo tanks by a
separate vapour line. This valve has automatic and manual mode.
5.2.5 LNG Pump Each Cargo tank is equipped with two independent submersible pumps. The LNG pump skid unit consists
of the following:
Pump
Pump bearing heater
Vent gas heater

36
NAME 591 COMPUTER AIDED DESIGN PROJECT
2015-2016
Control panel
Flow element with transmitter
The LNG transfer pumps operate automatically based on the liquid level in the separator. They have a
variable frequency drives that would regulate the pump capacity depending on the level controller in the
separator, allowing the pump to run on minimum speed until the valve has opened completely. And if the
flow is too small, the pump will be turned off. The pumps are also fitted with vent valve to allow purging
of the motor cage with nitrogen before first start up, but it is closed under all other operations mode.
There is also a vent line with isolated valves for each pump to prevent the pump casing from gassing up.
5.2.6 Vent Gas Heater The vent gas is heated to the ambient temperature in the unit called the vent gas heater which is upstream
of the GCU. The outlet temperature is controlled so that the temperature of the gas stays within the GCU
operating limitations.
5.2.7 Nitrogen Re-liquefaction Loop The main task of the re-liquefaction loop (also known as R loop) is to provide the necessary refrigerant to
liquefy the boil-off gas from the cargo tanks. The main components of the R-loop are the following:
2 sets of nitrogen commanders (3-stage compressor, an expander, and two stage intercoolers
and one aftercooler)
1 cold box
2 sets of nitrogen booster compressors with 1 on duty and 1 on standby
2 sets of nitrogen dryers
1 nitrogen reservoir
Auxiliary systems
There is also a nitrogen booster compressor and associated items to replenish the re-liquefaction loop
with nitrogen due to leakages from nitrogen compressor seals. The nitrogen booster compressors will try
to maintain a pressure in the nitrogen reservoir based on a set point.
5.2.8 Operations stages There are the following modes for the Re-liquefaction mode:
Plant off
Re-liquefaction plant standstill
Standby mode
Re-liquefaction
Vent gas mode
Excess boil-off gas mode
Each will be discussed in greater detail in the subsequent sections

37
NAME 591 COMPUTER AIDED DESIGN PROJECT
2015-2016
5.2.8.1 Re-liquefaction Plant Off This is the situation where all of the sub-systems associated with the plant are inactive. This case occurs
when the plant has started to operate or after gas is freed from the ship in case of an emergency.
5.2.8.2 Re-liquefaction Plant Standstill This happens when the button for re-liquefaction is pushed, the plant will have access to power, and
nitrogen supply. This will make the plant in standstill mode.
5.2.8.3 Standby mode This mode will be conducted once there is ample liquid present in the cold box separator. The start-up
will require that the BOG section of the cold box to have access to BOG from the cargo tank, to be able to
build up a liquid level in to separator and avoid sub-atmospheric pressures due to density changes during
cooling. Once the liquid in the separator has reached normal liquid level low, and the temperatures in the
cold box have stabilized, the standby operation has been reached.
5.3.8.4 Re-liquefaction mode This occurs when the tank pressure control is performed by one BOG compressor and the BOG compressor
capacity is less than or equal to 100% of the max flow. This BOG compressor will provide sufficient head
for bringing the Liquid BOG back to the cargo tangs. This operation will commence if anything out of
normal operating conditions occur such as a high nitrogen content. Then the vent gas or boil off gas mode
will occur.
5.3.8.5 Vent Gas Mode In case when BOG has a high level of nitrogen content, only a partial re-liquefaction will be applied. In the
normal mode, the vent gas which is the non-condensed gas is directed back to the cargo tanks. But in the
vent mode, this vent gas will instead be redirected to the GCU.
5.3.8.6 Excessive BOG Mode In case the BOG compressor is not capable of controlling the cargo tank pressure by itself, a second
compressor is started, when this happens the excessive BOG mode has happened. Also when both the
compressors are operating, any excess gas which cannot be handled by the re-liquefaction system will be
sent to GCU for disposal. This mode can occur when there is a non-equilibrium condition is the tanks i.e.
insufficient cooldown of tanks before loading or by rough weather.
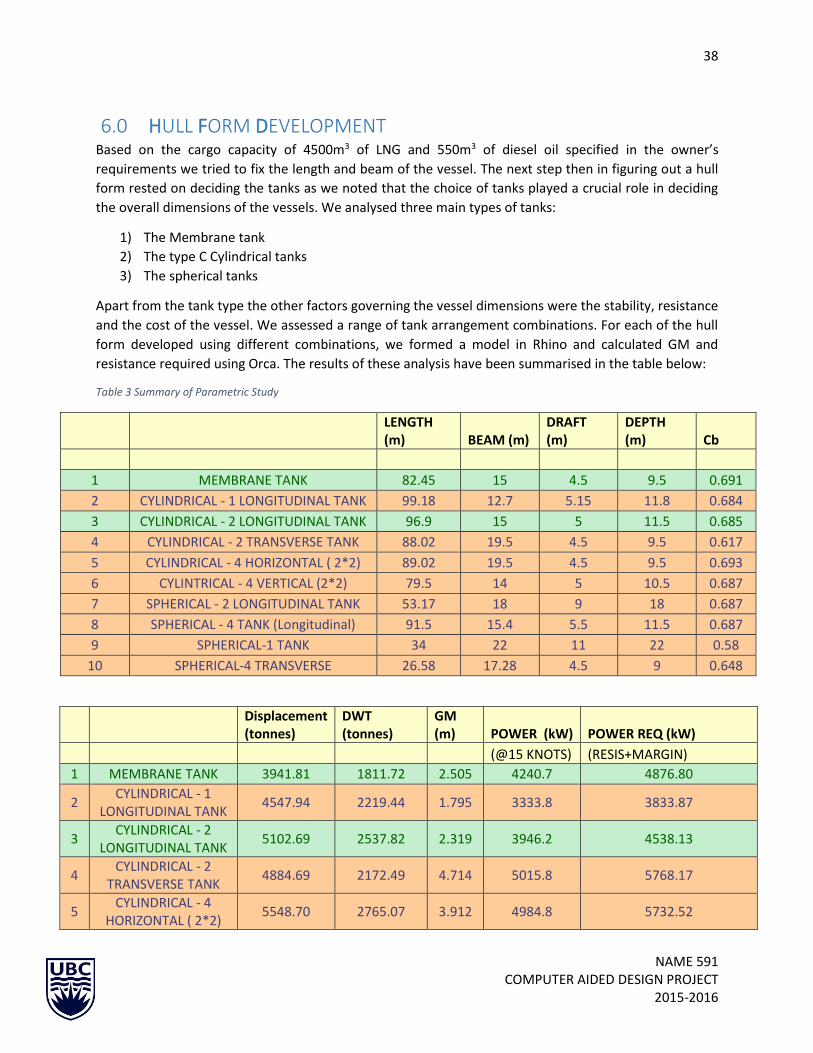
38
NAME 591 COMPUTER AIDED DESIGN PROJECT
2015-2016
6.0 HULL FORM DEVELOPMENT Based on the cargo capacity of 4500m3 of LNG and 550m3 of diesel oil specified in the owner’s
requirements we tried to fix the length and beam of the vessel. The next step then in figuring out a hull
form rested on deciding the tanks as we noted that the choice of tanks played a crucial role in deciding
the overall dimensions of the vessels. We analysed three main types of tanks:
1) The Membrane tank
2) The type C Cylindrical tanks
3) The spherical tanks
Apart from the tank type the other factors governing the vessel dimensions were the stability, resistance
and the cost of the vessel. We assessed a range of tank arrangement combinations. For each of the hull
form developed using different combinations, we formed a model in Rhino and calculated GM and
resistance required using Orca. The results of these analysis have been summarised in the table below:
Table 3 Summary of Parametric Study
LENGTH (m) BEAM (m)
DRAFT (m)
DEPTH (m) Cb
1 MEMBRANE TANK 82.45 15 4.5 9.5 0.691
2 CYLINDRICAL - 1 LONGITUDINAL TANK 99.18 12.7 5.15 11.8 0.684
3 CYLINDRICAL - 2 LONGITUDINAL TANK 96.9 15 5 11.5 0.685
4 CYLINDRICAL - 2 TRANSVERSE TANK 88.02 19.5 4.5 9.5 0.617
5 CYLINDRICAL - 4 HORIZONTAL ( 2*2) 89.02 19.5 4.5 9.5 0.693
6 CYLINTRICAL - 4 VERTICAL (2*2) 79.5 14 5 10.5 0.687
7 SPHERICAL - 2 LONGITUDINAL TANK 53.17 18 9 18 0.687
8 SPHERICAL - 4 TANK (Longitudinal) 91.5 15.4 5.5 11.5 0.687
9 SPHERICAL-1 TANK 34 22 11 22 0.58
10 SPHERICAL-4 TRANSVERSE 26.58 17.28 4.5 9 0.648
Displacement (tonnes)
DWT (tonnes)
GM (m) POWER (kW) POWER REQ (kW)
(@15 KNOTS) (RESIS+MARGIN)
1 MEMBRANE TANK 3941.81 1811.72 2.505 4240.7 4876.80
2 CYLINDRICAL - 1
LONGITUDINAL TANK 4547.94 2219.44 1.795 3333.8 3833.87
3 CYLINDRICAL - 2
LONGITUDINAL TANK 5102.69 2537.82 2.319 3946.2 4538.13
4 CYLINDRICAL - 2
TRANSVERSE TANK 4884.69 2172.49 4.714 5015.8 5768.17
5 CYLINDRICAL - 4
HORIZONTAL ( 2*2) 5548.70 2765.07 3.912 4984.8 5732.52
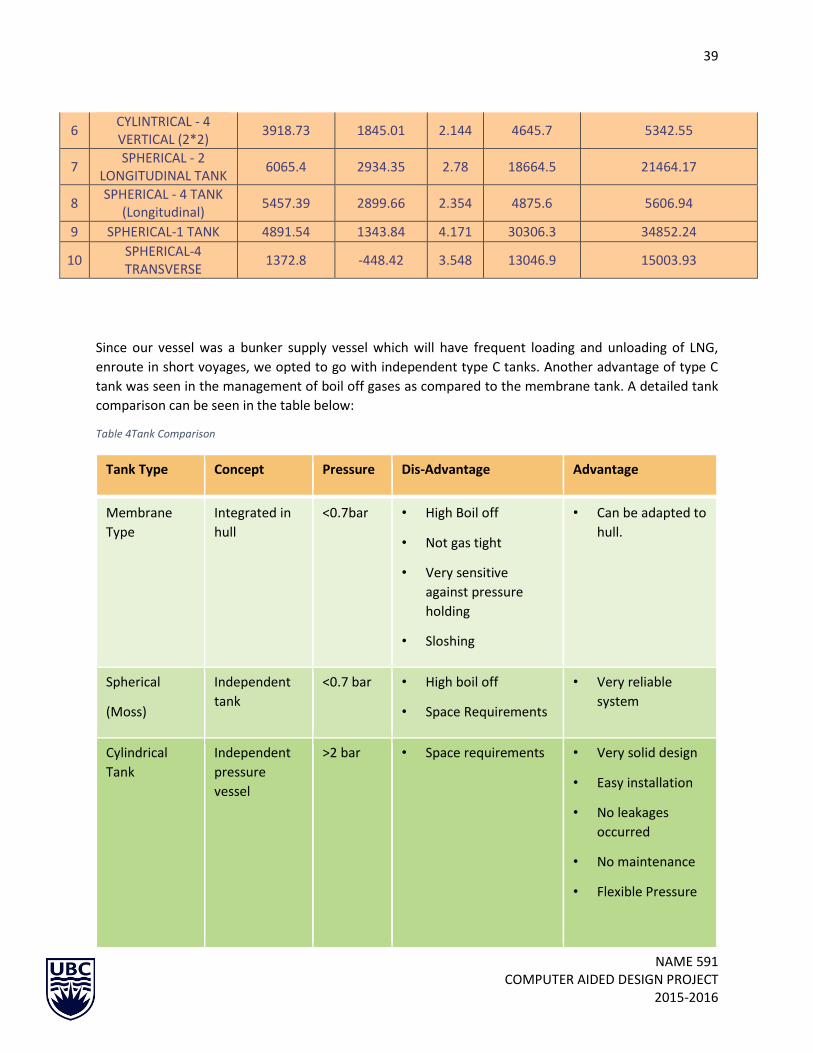
39
NAME 591 COMPUTER AIDED DESIGN PROJECT
2015-2016
6 CYLINTRICAL - 4 VERTICAL (2*2)
3918.73 1845.01 2.144 4645.7 5342.55
7 SPHERICAL - 2
LONGITUDINAL TANK 6065.4 2934.35 2.78 18664.5 21464.17
8 SPHERICAL - 4 TANK
(Longitudinal) 5457.39 2899.66 2.354 4875.6 5606.94
9 SPHERICAL-1 TANK 4891.54 1343.84 4.171 30306.3 34852.24
10 SPHERICAL-4 TRANSVERSE
1372.8 -448.42 3.548 13046.9 15003.93
Since our vessel was a bunker supply vessel which will have frequent loading and unloading of LNG,
enroute in short voyages, we opted to go with independent type C tanks. Another advantage of type C
tank was seen in the management of boil off gases as compared to the membrane tank. A detailed tank
comparison can be seen in the table below:
Table 4Tank Comparison
Tank Type Concept Pressure Dis-Advantage Advantage
Membrane
Type
Integrated in
hull
<0.7bar • High Boil off
• Not gas tight
• Very sensitive
against pressure
holding
• Sloshing
• Can be adapted to
hull.
Spherical
(Moss)
Independent
tank
<0.7 bar • High boil off
• Space Requirements
• Very reliable
system
Cylindrical
Tank
Independent
pressure
vessel
>2 bar • Space requirements • Very solid design
• Easy installation
• No leakages
occurred
• No maintenance
• Flexible Pressure

40
NAME 591 COMPUTER AIDED DESIGN PROJECT
2015-2016
Based on estimation of these volumes and taking margins on the cargo volume for equipment, piping, etc.
and following safety norms and industry best practices an initial vessel length of approximately 97 meters
was estimated. Based on the standard hull form ratios of similar vessel the corresponding beam was found
to be 15 meters at a depth of 11.5 meters and a draft of 5 meters.
The hull form was developed after gathering data on existing vessels of a similar nature and after a
thorough review of the existing rules and regulations for Gas Carriers. The table below shows the details
of these parent vessels. After forming the hull form, it was realised that the ship was a little skinny as
compared to the parent vessel. Also there was not enough space for inspection of inner hull LNG tank
surface. Thus, it was decided to increase the beam to 18 meters. A comparison of the different parent
vessels is shown below.
Table 5 Parent Ship Data
Name of the ship Length Breadth Depth Draft
LOA LBP
1 Wartsila LNG Bunker WSD59 6.5K 98.8 96.5 19.2 12.7 5.8
2 Concept Naval ENR2 120 18 7 3.5
3 Rolls Royce type NVC 604 GT 89.3 87.1 18.4 8.9 4.9
4 Kawasaki Concept 120 114 18.8 9.5 5.6
5 TG LNG Bunker Vessel 98.6 93 14.2 7.6 4
Name of the ship Cargo Tank
Capacity Discharge capacity Design Speed
Gas Consumption Tank Type
LNG MDO (-/day)
Wartsila LNG Bunker WSD59
6.5K 6500 550 250 13 9.8 C-type
Concept Naval ENR2 4600 1000 300 C-type
Rolls Royce type NVC 604 GT 4500 250 13 C-type
Kawasaki Concept 6000 C-type
TG LNG Bunker Vessel 3000 12 C-type

41
NAME 591 COMPUTER AIDED DESIGN PROJECT
2015-2016
These Ships exhibited the following hull form characteristics:
HULL FORM RATIO
Name of the ship L/B B/T B/D T/D
1 Wartsila LNG Bunker WSD59 6.5K 5.02604 3.31 1.51181 0.457
2 Concept Naval ENR2 6.66667 5.143 2.57143 0.5
3 Rolls Royce type NVC 604 GT 4.7337 3.755 2.06742 0.551
4 Kawasaki Concept 6.06383 3.357 1.97895 0.589
5 TG LNG Bunker Vessel 6.5493 3.55 1.86842 0.526
The detailed analysis can be found in APPENDIX A
The principal particulars of the finalized hull form are as follows:
PRINCIPAL PARTICULARS
LENGTH OVERALL (m) 96.99
LENGTH BETWEEN PERPENDICULARS (m) 93
BEAM (m) 18
DEPTH (m) 11.2
DRAFT (m) 5.2
DISPLACEMENT (TONNES) 6500
Following this we developed the lines plan for our vessel using ORCA 3D. The complete lines plan
drawing can be found in APPENDIX I. The finalized hull form is shown in the figure below.
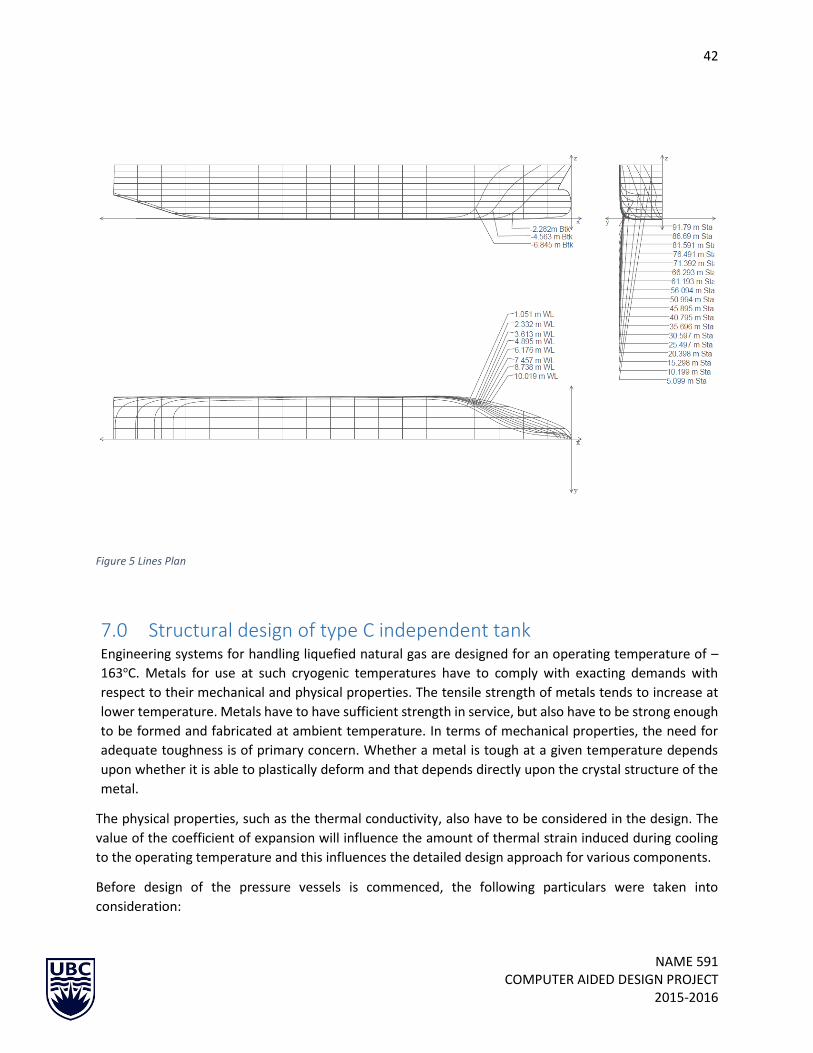
42
NAME 591 COMPUTER AIDED DESIGN PROJECT
2015-2016
Figure 5 Lines Plan
7.0 Structural design of type C independent tank Engineering systems for handling liquefied natural gas are designed for an operating temperature of –
163oC. Metals for use at such cryogenic temperatures have to comply with exacting demands with
respect to their mechanical and physical properties. The tensile strength of metals tends to increase at
lower temperature. Metals have to have sufficient strength in service, but also have to be strong enough
to be formed and fabricated at ambient temperature. In terms of mechanical properties, the need for
adequate toughness is of primary concern. Whether a metal is tough at a given temperature depends
upon whether it is able to plastically deform and that depends directly upon the crystal structure of the
metal.
The physical properties, such as the thermal conductivity, also have to be considered in the design. The
value of the coefficient of expansion will influence the amount of thermal strain induced during cooling
to the operating temperature and this influences the detailed design approach for various components.
Before design of the pressure vessels is commenced, the following particulars were taken into
consideration:

43
NAME 591 COMPUTER AIDED DESIGN PROJECT
2015-2016
• Nature of cargoes, together with maximum vapour pressures and minimum liquid temperature
for which the pressure vessels.
• Particulars of materials for the construction of the vessels.
• General arrangement plan showing location of pressure vessels in the ship unit.
• Plans of pressure vessels showing attachments, openings, dimensions, details of welded joints.
7.1 METALS FOR APPLICATION AT CRYOGENIC TEMPERATURE
We considered three metals practically established in various applications for handling LNG. There
applications, physical and chemical properties are discussed in the tables below.
Different Applications of the chosen materials:
Table 6Materials and Application
Alloy TYPE APPLICATION
9Ni 9% Ni steel Storage tanks
36NiFe Low expansion, 36%Ni-Fe
alloy
Some large storage tank designs. Piping in critical
applications.
Al Aluminum alloy type 5083
(Al-4.5%Mg) Alloy 5154
(Al-3.5%Mg)
Alloy 6000 (Al –Si)
Spherical or prismatic storage tanks for ship
transportation of LNG. Tubing for the main
cryogenic heat exchanger.
Forgings such as flanges.

44
NAME 591 COMPUTER AIDED DESIGN PROJECT
2015-2016
7.2 Physical Properties of Metal used for LNG
7.3 Mechanical Properties of the material
Property T °C 9%Ni Steel 36% Ni Fe Alloy Al alloy 5083
Yield stress, MPa
0
-196
441-587
680
270
650
145
165
Ultimate tensile stress, MPa
0
-196
637-834
1100
490
900
290
405
Elongation to break, % 0
-196
17-20
30
40
40
16
36
Impact energy, J 0
-196
125
42
150
100
237
20
Property T
°C
9% Ni
Steel
36% Ni Fe
Alloy
Al alloy 5083
Density, kg/m3
7860 8120 2660
Elastic Modulus E, GPa +20
-196
186
207
148
138
70
81
Thermal Conductivity, W/m°C +20
-196
28.5
13.0
10.5
5.7 117
Mean Coefficient of thermal expansion, , 10-6/°C
0 to
-196 9.5 1.5 17.5
Theoretical thermal stress in contracting a rigid length from 0 to -163°C, MPa
304 34 228
Theoretical thermal stress in contracting a rigid length from 0 to -163°C, MPa as a percentage of yield strength
51-69% 12.6% 157%

45
NAME 591 COMPUTER AIDED DESIGN PROJECT
2015-2016
7.4 Design of Type C independent tank as per Lloyd’s rule: For this design consideration we fixed the inside radius to 6000mm, and the design pressure to 5 bar.
However the values can be changed later if required.
Definition of symbols
Following symbols are used in the given section for design of the C-type LNG tank.
p = design pressure in bar
t = minimum thickness, in mm
Di = inside diameter, in mm
Do = outside diameter, in mm
J = joint factor applicable to welded seams
Ri = inside radius, in mm
Ro = outside radius, in mm
T = design temperature, in °C
σ = allowable stress as per the material properties defined above in material properties.
The design basis for Type C independent tanks is based on pressure vessel criteria modified to include
fracture mechanics and crack propagation criteria. The design vapour pressure shall not be less than:
Po = 0.2 + AC(ρr)1.5 (MPa)
𝐴 = .00185( 𝜎𝑚
∆𝜎𝐴)
With
σm = design primary membrane stress
= 75 N/mm2 for Aluminum
= 233 N/mm2 for 9 Ni- Fe
= 233 N/mm2 for 36 Ni- Fe
∆σA = allowable dynamic membrane stress
= 55 N/mm2 for ferritic-perlite, martensitic and austenitic steel
= 25 N/mm2 for aluminium alloy (5083-O)
C = a characteristic tank dimension to be taken as the greatest of the following:
h, 0.75b or 0.45l
With
h = height of tank (dimension in ship unit’s vertical direction) (m)
b = width of tank (dimension in ship unit’s transverse direction) (m)
l = length of tank (dimension in ship unit’s longitudinal direction) (m)
ρr = the relative density of the cargo (ρr = 1 for fresh water) at the design temperature
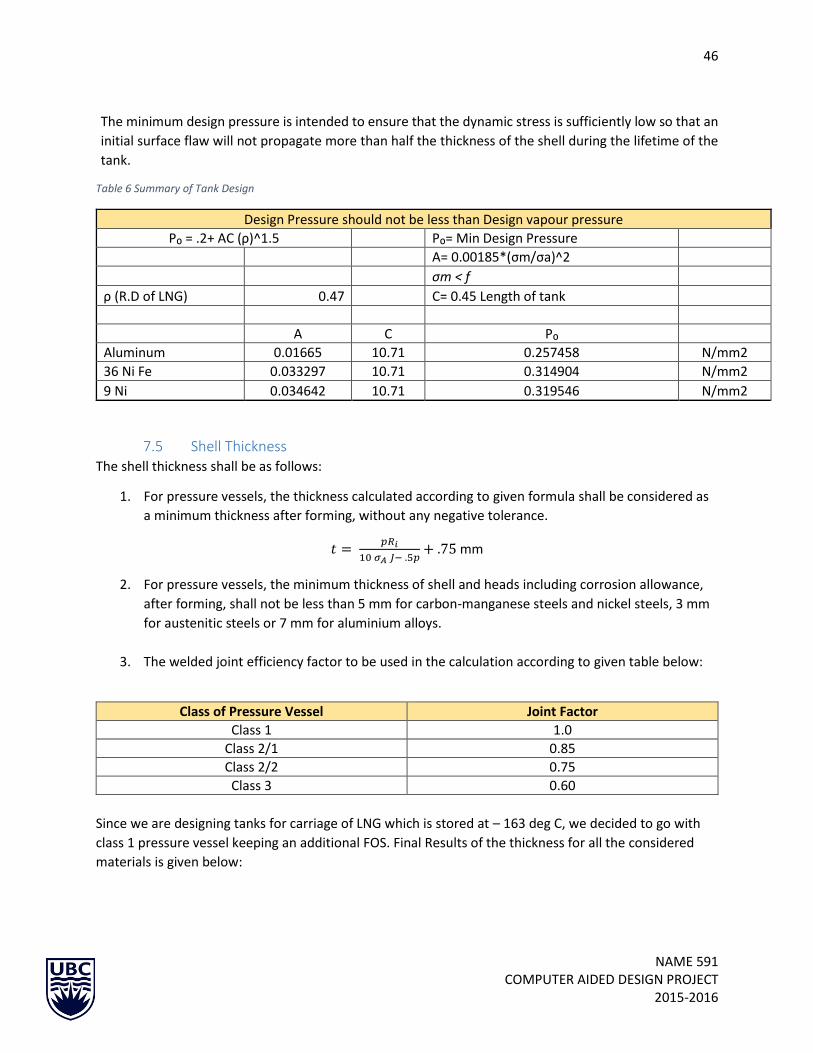
46
NAME 591 COMPUTER AIDED DESIGN PROJECT
2015-2016
The minimum design pressure is intended to ensure that the dynamic stress is sufficiently low so that an
initial surface flaw will not propagate more than half the thickness of the shell during the lifetime of the
tank.
Table 6 Summary of Tank Design
Design Pressure should not be less than Design vapour pressure
P₀ = .2+ AC (ρ)^1.5 P₀= Min Design Pressure
A= 0.00185*(σm/σa)^2
σm < f
ρ (R.D of LNG) 0.47 C= 0.45 Length of tank
A C P₀
Aluminum 0.01665 10.71 0.257458 N/mm2
36 Ni Fe 0.033297 10.71 0.314904 N/mm2
9 Ni 0.034642 10.71 0.319546 N/mm2
7.5 Shell Thickness The shell thickness shall be as follows:
1. For pressure vessels, the thickness calculated according to given formula shall be considered as
a minimum thickness after forming, without any negative tolerance.
𝑡 = 𝑝𝑅𝑖
10 𝜎𝐴 𝐽− .5𝑝+ .75 mm
2. For pressure vessels, the minimum thickness of shell and heads including corrosion allowance,
after forming, shall not be less than 5 mm for carbon-manganese steels and nickel steels, 3 mm
for austenitic steels or 7 mm for aluminium alloys.
3. The welded joint efficiency factor to be used in the calculation according to given table below:
Class of Pressure Vessel Joint Factor
Class 1 1.0
Class 2/1 0.85
Class 2/2 0.75
Class 3 0.60
Since we are designing tanks for carriage of LNG which is stored at – 163 deg C, we decided to go with
class 1 pressure vessel keeping an additional FOS. Final Results of the thickness for all the considered
materials is given below:

47
NAME 591 COMPUTER AIDED DESIGN PROJECT
2015-2016
Thickness of Tank
Al 40.88 mm
9 Ni 13.62 mm
36 Ni- Fe 13.37 mm
Thickness of the spherical ends was determined by the given formula:
𝑡 = 𝑝𝑅𝑖
20 𝜎𝐴 𝐽− .5𝑝+ .75 mm
Calculated results:
Thickness of Spherical ends
Al 20.78 mm
9 Ni 7.18 mm
36 Ni- Fe 7.06 mm
Table 7Tank Cost Comparison
Based on the thickness of the material we calculated the volume of the material required and found the
material cost considered for the construction.
Assuming that the main driving factor in selection of the tank material is the cost of the material and the
labour charges in construction all together with other costs is approximately going to be same.
Thus, based up on the cost we finalised the material of the tank to be 9Ni-Fe.
7.6 LNG tank Insulation In order to guarantee the LNG cold temperature of -160°C, high-quality insulation applied in accordance
with strict specifications is essential. Insulation systems consisting of Polyisocyanurate (PIR) rigid foam or
cellular glass insulation, applied in multiple layers, in combination with high performance vapour barriers
are used in order to produce the necessary degree of insulation.
The insulation system is designed to maintain the boil-off losses from the cargo at an acceptable level,
and to protect the inner hull steel from the effect of excessively low temperature.
Al 9 Ni- Fe 36 Ni Fe
Outer Radius 6.04 6.01 6.01
Inner Radius 6.00 6.00 6.00
Volume 36.82 12.24 12.01
Weight (tonnes) 97.95 96.20 97.54
Material cost $/ton 1000 600 5000
Approximate total cost $98,000 $58,000 $485,000

48
NAME 591 COMPUTER AIDED DESIGN PROJECT
2015-2016
If the insulation efficiency should deteriorate for any reason, the effect may be a lowering of the inner
hull steel temperature, i.e. a cold spot and an increase in boil-off from the affected tank. If necessary,
increased boil-off gas may be vented to the atmosphere via the vent riser and gas heater, which will result
in the loss of LNG. Also the inner hull steel temperature must, however, be maintained within acceptable
limits to prevent possible brittle fracture.
We carried out our research further to decide the type of insulation and came across 3 different materials
used for the insulation of LNG tanks as approved by Classification societies.
1. PU- Foam Insulation
2. Vacuum Perlite Insulation
3. Aerogel mat Insulation
Their advantages and disadvantages are shown in the table below.
Table 8Insulation Comparison
Type of Insulation
Advantages Disadvantages Space Requirement (mm)
PU- Foam Insulation
Cost Efficient Risk of Icing
Expensive Waste Disposal
Needs a secondary barrier
260
Vacuum Perlite Insulation
Non-Inflammable
Low thermal Conductivity
Has a secondary barrier
Simple Processing
Remaining Insulation after vacuum loss
Risk of Vacuum loss due to leakages.
High insulation cost with industrial vacuum
35
Aerogel Mats
Non- Inflammable
Low thermal Conductivity
Each layer has vapour barrier
High material Costs
Risk of Icing
Needs a secondary barrier
165
We chose to go for Vacuum Perlite Insulation because of its various advantages specified above and
choosing any other insulation would have increased the overall height of the cargo hold which was
undesired.

49
NAME 591 COMPUTER AIDED DESIGN PROJECT
2015-2016
8.0 RESISTANCE ESTIMATES A ship is designed to move through water with minimal force being exerted by it. The force due to the
mass of water opposing the movement of the vessel is known as resistance. There are various methods
used to predict the resistance faced by the vessel as if moves through the water. Some of these methods
include:
1) Empirical methods: Based on data from systematic series, regression analysis and parametric data
2) Numeric Methods: Computational Fluid Dynamics Analysis.
3) Model Testing.
We used the Empirical methods to determine the resistance of the vessel. This being a student project
and due to the lack of time a detailed analysis of the resistance and powering was not possible. It would
however be worthwhile to undertake a CFD analysis in the future to verify the results obtained from this
analysis.
8.1 Overview The Holtrop method was used to determine the resistance of our vessel. This method of resistance
prediction is valid for models of different sizes and thus a very widely used tool for resistance analysis.
The resistance components in this analysis are expressed as dimensionless quantities depending on their
respective scaling parameter. This dependency varies from model to model owing to differences in hull
form.
8.2 Holtrop Method The Holtrop method is a regression analysis based on historical data of many different ships with varying
geometric dimensions. This method is widely used to determine the propulsive power requirement of a
vessel in the initial design stages. A number of different resistance prediction are available in the marine
industry such as NPL series, Oomertsen method and Holtrop method. Holtrop method of evaluating
resistance is typically used for larger vessels .Below is table which clearly shows different categories of
ships and based on our vessel prismatic coefficient and L/B ratio falling under tankers and bulk carriers,
we chose to predict the bare hull resistance using Holtrop method.
The application is limited to hull forms resembling the average ship described by the main dimensions and
form coefficients used in the method.

50
NAME 591 COMPUTER AIDED DESIGN PROJECT
2015-2016
Figure 7 Parameter Ranges for Different Ship Types
Resistance Prediction:
The total resistance of a ship has been subdivide into:
RTotal = RF (1+k1) + RAPP+ Rw + RB + RTR + RA
where:
RF friction Resistance according to ITTC- 1957 friction formula
1+k1 form factor describing the viscous resistance of the hull form in relation to RF
RAPP resistance of appendages
Rw wave-making and wave-breaking resistance
RB additional pressure resistance of bulbous bow
RTR additional pressure resistance of immersed transom stern
RA model-ship correlation resistance

51
NAME 591 COMPUTER AIDED DESIGN PROJECT
2015-2016
Based on the total resistance calculated, we found the power estimation of the vessel. The speed
Vs Power estimation is shown in the graph below.
Figure 8 Speed vs Power Graph
8.3 Bulbous Bow considerations: For reducing wave making resistance, adding a Bulbous Bow to the vessel was considered. In order to
calculate the area of the bulb required, we came across typical values of Non-Linear coefficients published
by Kracht in 1970 .For calculating the bulb area we considered the nonlinear coefficients and they are
mentioned as below:
-500
0
500
1000
1500
2000
2500
0 5 10 15 20
Speed Vs Power
Speed Vs Power

52
NAME 591 COMPUTER AIDED DESIGN PROJECT
2015-2016
Figure 8 Bulb Geometry 2
Figure 9 Bulb Geometry 3

53
NAME 591 COMPUTER AIDED DESIGN PROJECT
2015-2016
Figure 10 Determination of Main Bulb Geometry
From the table above we found the range of areas for different bulbous bow that can be used for our
Vessel. The bulb area was calculated to be in a range from 11.2 m2 - 22 m2.. In order to choose the right
bulb area Holtrop method had a direct empirical relation for the bulb resistance which is mentioned
below:
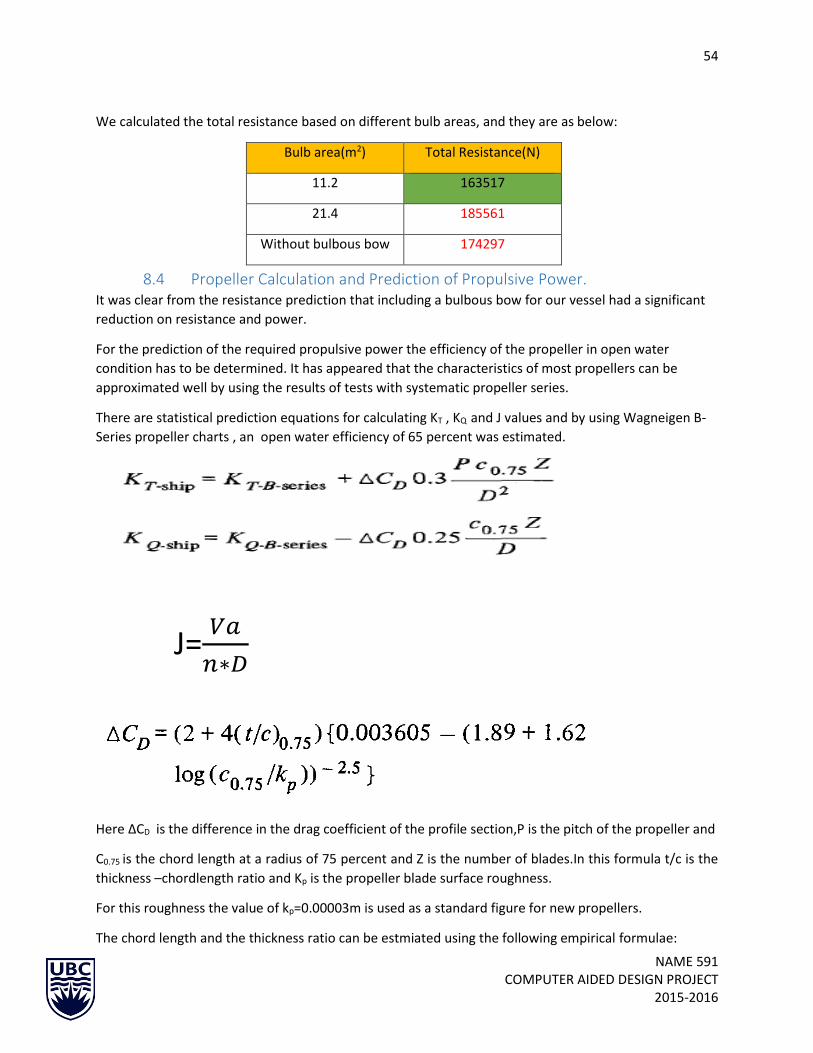
54
NAME 591 COMPUTER AIDED DESIGN PROJECT
2015-2016
We calculated the total resistance based on different bulb areas, and they are as below:
Bulb area(m2) Total Resistance(N)
11.2 163517
21.4 185561
Without bulbous bow 174297
8.4 Propeller Calculation and Prediction of Propulsive Power. It was clear from the resistance prediction that including a bulbous bow for our vessel had a significant
reduction on resistance and power.
For the prediction of the required propulsive power the efficiency of the propeller in open water
condition has to be determined. It has appeared that the characteristics of most propellers can be
approximated well by using the results of tests with systematic propeller series.
There are statistical prediction equations for calculating KT , KQ and J values and by using Wagneigen B-
Series propeller charts , an open water efficiency of 65 percent was estimated.
J=𝑉𝑎
𝑛∗𝐷
Here ΔCD is the difference in the drag coefficient of the profile section,P is the pitch of the propeller and
C0.75 is the chord length at a radius of 75 percent and Z is the number of blades.In this formula t/c is the
thickness –chordlength ratio and Kp is the propeller blade surface roughness.
For this roughness the value of kp=0.00003m is used as a standard figure for new propellers.
The chord length and the thickness ratio can be estmiated using the following empirical formulae:
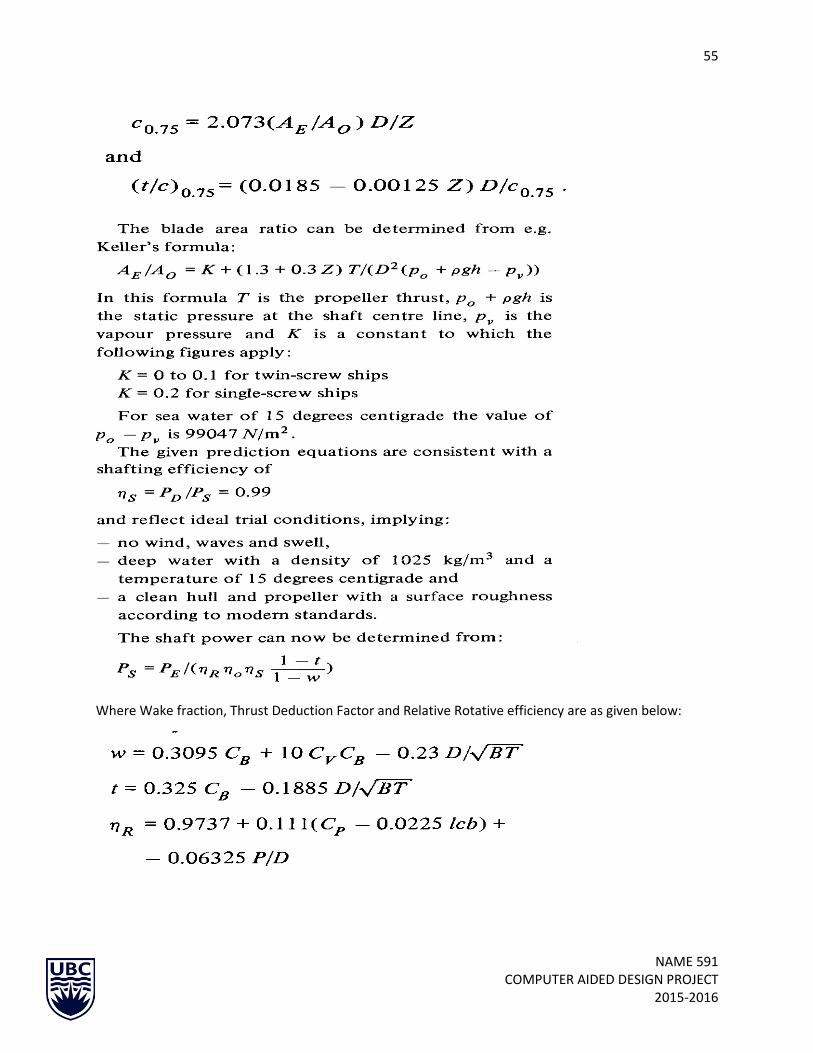
55
NAME 591 COMPUTER AIDED DESIGN PROJECT
2015-2016
Where Wake fraction, Thrust Deduction Factor and Relative Rotative efficiency are as given below:

56
NAME 591 COMPUTER AIDED DESIGN PROJECT
2015-2016
Table 9 Propeller Design
The Propulsive power with various bulb area are listed below:
Bulb area(m2) Power(KW)
11.2 1733
21.4 1967
Without bulbous bow 1847
It was decided to go with a bulb area of 11.2m2
Finally considering efficiencies listed below, the total shaft power, Ps including a service margin of 20
percent was calculated to be around 3500 KW.
ἠopenwater=0.65
ἠgen=0.95

57
NAME 591 COMPUTER AIDED DESIGN PROJECT
2015-2016
ἠtransformer=0.95
ἠshaft=0.98
ἠrectifier=0.94
9.0 PROPULSION SELECTION In order to choose the best propulsion selection for our vessel, we had an option of two propulsion
systems:
Conventional Single Screw Propulsion
Z-Drive Rolls Royce Propulsion
Conventional Single screw propulsion systems are generally fixed or controllable pitch type. Propellers of
the FP-type are cast in one block and normally made of a copper alloy. The position of the blades, and
thereby the propeller pitch, is once and for all fixed, with a given pitch that cannot be changed in
operation. This means that when operating in, for example, heavy weather conditions, the propeller
performance curves, i.e. the combination of power and speed (r/min) points, will change according to the
physical laws, and the actual propeller curve cannot be changed by the crew. Most ships which do not
need a particularly good manoeuvrability are equipped with an FP-propeller.
Propellers of the CP-type have a relatively larger hub compared with the FP-propellers because the hub
has to have space for a hydraulically activated mechanism for control of the pitch (an gle) of the blades.
The CP-propeller is relatively expensive, maybe up to 2-3 times as expensive as a corresponding FP-
propeller. Furthermore, because of the relatively larger hub, the propeller efficiency is slightly lower and
also CP propellers do not have the steering capability.
Z-Drives or the Azimuth propulsion are popular for vessels where there is a requirement of high degree
of maneuverability. Our vessel being a LNG bunker vessel will require a propulsion system which has good
maneuvering capacity and the captain can have full command over the vessel.
An Azimuth thruster is an arrangement of marine propellers placed in pods which can be rotated to any
horizontal angle (azimuth). The ships fitted with this system give better maneuverability than a fixed
propeller and rudder system. This assembly consists of the podded propeller connected to a motor and
an azimuth well to support the propeller. As thrust acts on the assembly, the well is supported by
structures like brackets, struts etc.
Azimuth thrusters are mounted on a 360˚ rotating shaft under the ship. The most important advantage of
azimuth thruster is an optimal thrust in every direction. There is no rudder required in an azimuth system
and hence, the underwater dynamics are improved which not only increase maneuverability, but also
azimuth thrusters include the advantages of combined engine systems.

58
NAME 591 COMPUTER AIDED DESIGN PROJECT
2015-2016
With the invention of azipod propulsion system, steering behavior has been increased. It can be built for
pushing or pulling operation, at low or high speeds. Additional maneuverability may be attained by
changing the azimuth elevation. Using azimuth thrusters, the crash stop distance can be halved compared
to conventional propeller systems.
More advantages are electrical efficiency, better use of ship space, and lower maintenance costs. Ships
with azimuth thrusters do not need tugboats to dock, though they still require tugs to maneuver in difficult
places.
Finally a matrix was created in order to have better decision, the matrix is shown as below:
Table 10 Propeller Selection Matrix
Selection of Propeller
Importance %
Single Screw Azimuth Twin Screw
Manoeuverability 40 0.4 1 5 Space 25 0.25 1 3 Efficiency 25 0.25 3 2 Cost 10 0.1 3 1
Total 8 11 Weighted Total 1.7 3.35
Azimuth twin screw was chosen to be the optimal propulsion system for our LNG vessel.
10.0 Main Engine Selection Choosing a propulsion engine or engines and the most suitable plant configuration for a given newbuilding
or retrofit project is not a simple decision. It dictates careful study of the machinery options available and
the operating profile of the ship.
There is a wide variety of engines which can be selected and based on the MARPOL Tier III regulations, we
decided to go with Dual Fuel engines which complies MARPOL Tier III regulations. Also our vessel was
carrying LNG so it was easy for us to manage boil off gases by supplying it to the engines.
Other Advantages of using Dual Fuel Engines/Diesel Electric propulsion:
Simple shafting arrangements
Fuel processing machinery and system not required
Reduced maintenance costs
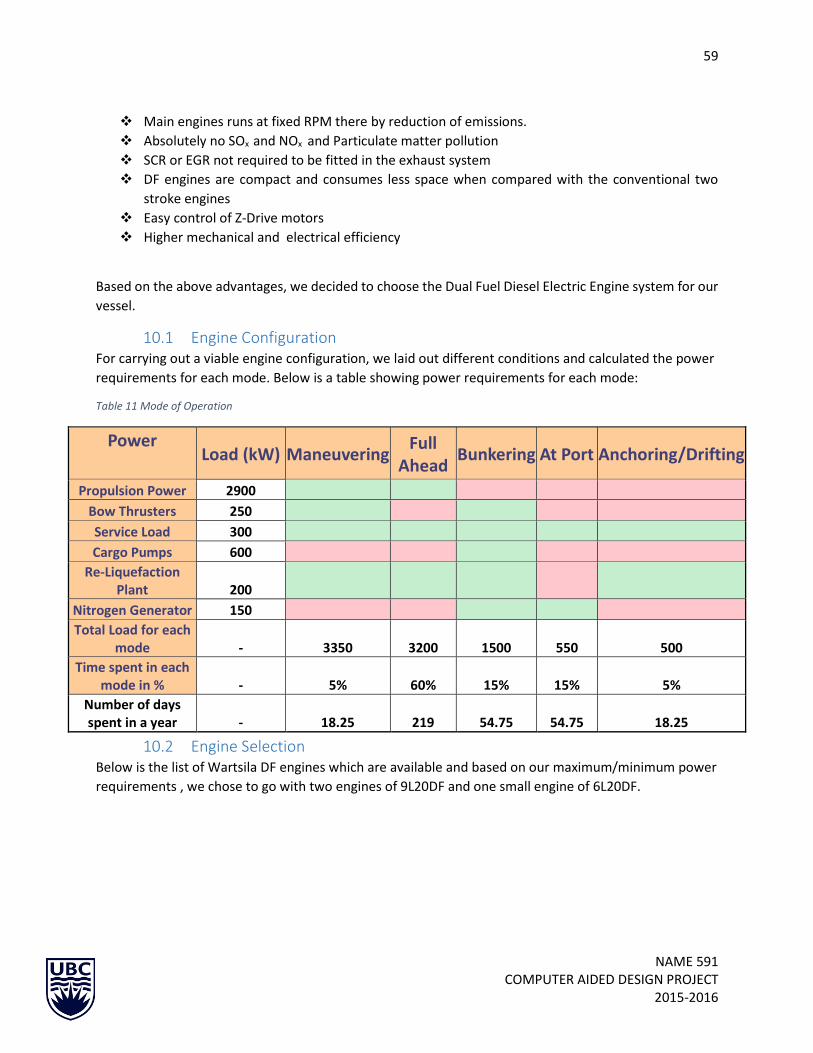
59
NAME 591 COMPUTER AIDED DESIGN PROJECT
2015-2016
Main engines runs at fixed RPM there by reduction of emissions.
Absolutely no SOx and NOx and Particulate matter pollution
SCR or EGR not required to be fitted in the exhaust system
DF engines are compact and consumes less space when compared with the conventional two
stroke engines
Easy control of Z-Drive motors
Higher mechanical and electrical efficiency
Based on the above advantages, we decided to choose the Dual Fuel Diesel Electric Engine system for our
vessel.
10.1 Engine Configuration For carrying out a viable engine configuration, we laid out different conditions and calculated the power
requirements for each mode. Below is a table showing power requirements for each mode:
Table 11 Mode of Operation
Power
Load (kW) Maneuvering
Full Ahead Bunkering At Port Anchoring/Drifting
Propulsion Power 2900 Bow Thrusters 250 Service Load 300 Cargo Pumps 600
Re-Liquefaction Plant 200
Nitrogen Generator 150 Total Load for each
mode - 3350 3200 1500 550 500 Time spent in each
mode in % - 5% 60% 15% 15% 5% Number of days spent in a year - 18.25 219 54.75 54.75 18.25
10.2 Engine Selection Below is the list of Wartsila DF engines which are available and based on our maximum/minimum power
requirements , we chose to go with two engines of 9L20DF and one small engine of 6L20DF.

60
NAME 591 COMPUTER AIDED DESIGN PROJECT
2015-2016
Different Available Combinations Wartsila 9L20DF Wartsila 8L20DF
Wartsila 6L20DF
Wartsila 6L34DF
Wartsila 4L20
Power produced (kw) 1665 1480 1110 3000 800 Fuel Used Dual Fuel Dual Fuel Dual Fuel Dual Fuel Diesel
Weight (Tonnes) 11.7 11.1 9.4 13.2 7.2
Combination 2 of 9L20DF + 1
6L20DF
Produces => kw of power 4440
11.0 INTACT STABILITY ANALYSIS The stability of the vessel is discussed in this section of the report. We have followed IMO A 749 (18)
standards to determine the intact stability of the vessel. The intact stability of the vessel was carried out
under the following loading conditions:
1. Light ship
2. Fully loaded
3. Partial load condition (50 % cargo)
The intact stability of UBC LNG BUNKERING VESSEL was assessed using Maxsurf. For clarity purposes, the
criteria are restated in the table 12 below. For an excerpt of criteria please refer to APPENDIX E.
Additionally, the results of the intact stability analysis, are also shown below.
Table 12 Stability Criteria IMO A.749
Criteria Description(IMO A.749)
1 Area Under GZ curve up to 30 degrees >3.151 mdeg
2 Area Under GZ curve up to 40 degrees >5.157 mdeg
3 Area Under GZ curve from 30-40 degrees >1.719 mdeg
4 Max GZ at an angle of 30 degrees or greater shall not be less than 0.2m
5 Angle of maximum GZ shall not be less than 25 degrees
6 Initial GM transverse should not be less than 0.15 m
The team used Orca3D, Maxsurf to perform stability analysis for the vessel. The results of these analysis
are presented in Figure 3-5 below.

61
NAME 591 COMPUTER AIDED DESIGN PROJECT
2015-2016
Table 13 Intact Stability Results
Stability Results
Criteria
Case 1 2 3 4 5 6
Light Ship PASS PASS PASS PASS PASS PASS
Fully Loaded
PASS PASS PASS PASS PASS PASS
Partially Loaded
PASS PASS PASS PASS PASS PASS
The vessel was expected to be least stable in the fully loaded condition and hence we wanted to make
sure we passed this criteria. This was verified using Maxsurf to analyse the stability and plot the GZ
Curve. The GZ Curve plot obtained from Maxsurf is shown below.
Figure 11: GZ plot at fully loaded draft.
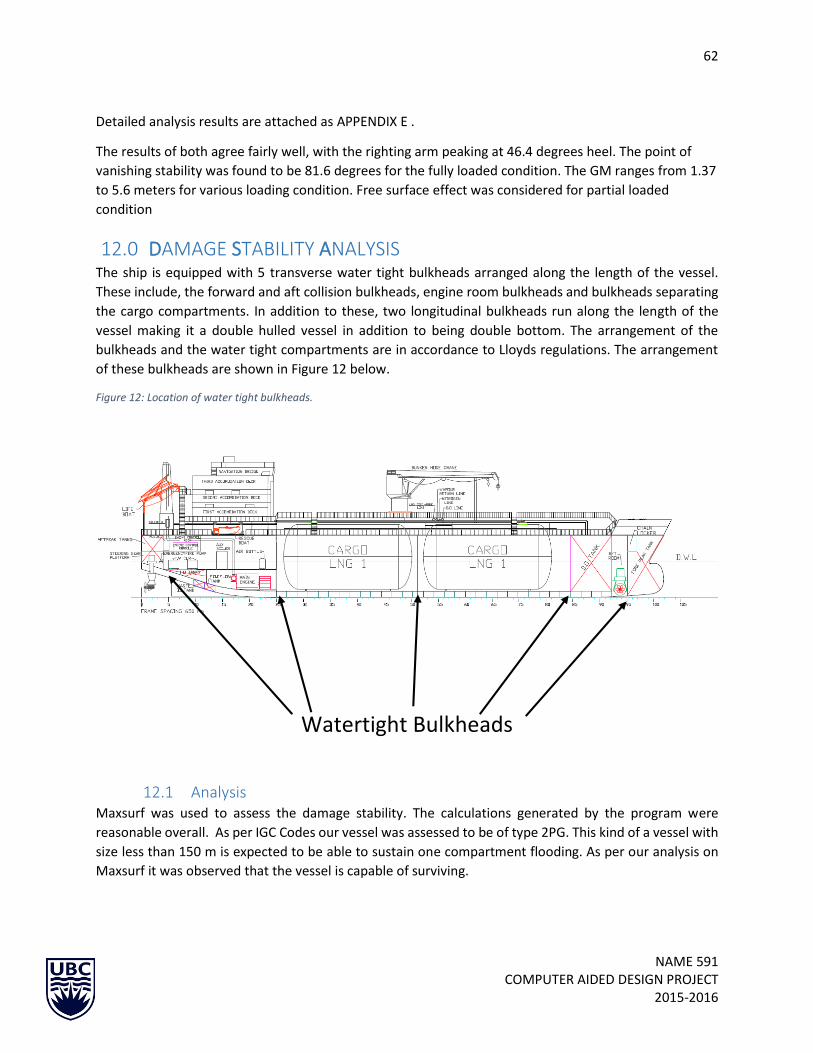
62
NAME 591 COMPUTER AIDED DESIGN PROJECT
2015-2016
Detailed analysis results are attached as APPENDIX E .
The results of both agree fairly well, with the righting arm peaking at 46.4 degrees heel. The point of
vanishing stability was found to be 81.6 degrees for the fully loaded condition. The GM ranges from 1.37
to 5.6 meters for various loading condition. Free surface effect was considered for partial loaded
condition
12.0 DAMAGE STABILITY ANALYSIS The ship is equipped with 5 transverse water tight bulkheads arranged along the length of the vessel.
These include, the forward and aft collision bulkheads, engine room bulkheads and bulkheads separating
the cargo compartments. In addition to these, two longitudinal bulkheads run along the length of the
vessel making it a double hulled vessel in addition to being double bottom. The arrangement of the
bulkheads and the water tight compartments are in accordance to Lloyds regulations. The arrangement
of these bulkheads are shown in Figure 12 below.
Figure 12: Location of water tight bulkheads.
Watertight Bulkheads
12.1 Analysis Maxsurf was used to assess the damage stability. The calculations generated by the program were
reasonable overall. As per IGC Codes our vessel was assessed to be of type 2PG. This kind of a vessel with
size less than 150 m is expected to be able to sustain one compartment flooding. As per our analysis on
Maxsurf it was observed that the vessel is capable of surviving.

63
NAME 591 COMPUTER AIDED DESIGN PROJECT
2015-2016
12.2 Conclusion As of today the vessel is equipped with 5 watertight bulkheads in accordance with Lloyd’s rules and can
with stand up to one compartment flooding in accordance with IGC Codes for Liquefied Gas Carriers of
type 2PG.
13.0 General Arrangement The arrangement of machinery and spaces have been discussed in the following section. This section
mainly focuses on the following decks:
1) Main deck
2) First Deck
3) Second Deck
4) Third deck
5) Bottom Platform
6) First Platform
7) ECR Platform
Figure 13: Bottom Platform
E/R Bottom Platform contains 3 main engines (2 Wartsila 9L20DF and 1 Wartsila 6L20DF), auxiliary pumps
for Fuel transfer, Ejector Pump, Ballast Pumps, Sea water cooling pumps, and bilge pumps. All the main
tanks required for normal operation are placed at this platform which includes 2 tanks for fresh water, 2
diesel oil fuel tanks, 1 lube oil tank, 1 bilge water tank. All tanks are of capacity 33.5 m3. Also a cofferdam
of .76 m is placed between each tank. Sludge tank and waste oil tank are placed in the double bottom.

64
NAME 591 COMPUTER AIDED DESIGN PROJECT
2015-2016
Figure 14: Engine Room 1st Platform
E/R First Platform contains all the major machineries required for normal operation. 2 main air
compressors, 1 emergency air compressor, 2 air bottles, fuel preparation room, boiler, fresh water and
lube oil coolers, sewage treatment plant, and fresh water preparation plant.
Figure 15: ECR platform

65
NAME 591 COMPUTER AIDED DESIGN PROJECT
2015-2016
ECR Platform contains a workshop, HT and LT expansion tanks, electric switchboard, and access to
steering gear compartment.
Figure 16: Main Deck
Main Deck: CO2 fixed fire system is placed on the main deck, along with a fixed foam system. Air
conditioning room with air handling unit and compressors is also placed at this deck with access from
the back. Emergency generator is placed on the main deck. Main deck also contains the following:
Galley stores: including general provision stores, meat and fish room, etc.
Deck/ Engine crew changing room
Access to ECR from Accommodation
Cargo handling system: 1 Nitrogen generator plant and 1 Re-liquefaction plant

66
NAME 591 COMPUTER AIDED DESIGN PROJECT
2015-2016
Figure 17: 1st Deck Accommodation
First Deck Accommodation includes galley, 1 officers mess room, 1 crew mess room, 1 cargo control
room, 1 ship’s office, one recreational room for the crew.
Figure 18: 2nd Deck Accommodation
Second Deck provides Accommodation to 8 crew members (3 for engine, 3 for deck, and 2 for galley staff).
Each room has his individual bathroom. Stationary stores, Laundry facilities and a medical inspection
room/hospital is placed at this deck.

67
NAME 591 COMPUTER AIDED DESIGN PROJECT
2015-2016
Figure 19: 3rd Deck Accommodation
Third Deck provides accommodation for Chief engineer/ Caption, 2 engineer officers and 2 deck officers.
This deck also contains a conference room, owner’s cabin and a spare cabin.
The Entire General Arrangement of the vessel can be found in Appendix I
14.0 STRUCTURAL DESIGN This section describes the structural calculation and the Mid-ship section drawings for our vessel.
14.1 Rule Set The structural calculations were carried out using Lloyd’s Register Rules and Regulations. The rules used
for the calculation was for an double bottom oil tanker, the reason for that is because of the close
resemblance of the oil tankers structure to our ship in terms of structural members. The rules stipulate
the general requirements, local and global loads, scantling requirements including shell envelope plating
and framing. An excel sheet was developed for the calculation. In this excel sheet, took the particulars of
the vessel and using the Lloyd’s formulas the calculation was carried forth. The calculated thickness values
for the structural members pass the minimum required thickness as specified in the rules. They were
rounded up for a higher value for safety purposes as recommended by general guidelines of Lloyds
register.
68
NAME 591 COMPUTER AIDED DESIGN PROJECT
2015-2016
14.2 Design Methodology The selection of a structural framing system is a very important design decision. It needs to be made from
a consideration of weight, the ability of the vessel to be able to resist global loads, and vibrations. Ships
are generally longitudinally or transversely framed.
Historically, early iron and steel vessels were built with transverse framing as this was the tired and used
method for wooden ships. (James Roy, 2010). It was not until 1906 when longitudinal framing started
being used for the Iron Clad vessels. In this novel design the longitudinal stiffeners and deep transverse
web frames were used in the same way that modern arrangements do. The benefit was primarily a lighter
structure, which for commercial vessels equated to increased deadweight for a given displacement, and
hence a more profitable ship.
Furthermore, from a structural design viewpoint, the most important aspect is the ability of the stiffened
plate to carry in-plane loads. Longitudinal bending of the hull girder, due to the buoyancy and weight
distribution of the vessel, as well as the action of the waves, will induce stresses in the fore and aft
direction. Thin shell plate is susceptible to buckling, and due to the orientation of the stiffeners, a
transversely framed panel will have approximately a quarter of the strength of a longitudinally framed
panel of the same size and thickness (James Roy, 2010). As a result, transversely framed vessels tend to
have to have thicker plating, particularly on the decks, in order to have adequate buckling capacity to
resist hull girder loads.
As the size of a vessel increases the significance of hull girder loads increases dramatically; Lloyd’s
generally require global strength calculations for all vessels over 50m. Currently small vessels are
generally transversely framed, and larger vessels, when global loads become significant, are generally
longitudinally framed. The transition occurs between 50m and 90m dependent on vessel type and usage.
Since our ship’s length is 96 meters, it is considered a long ship and the usage of a transverse framing is
not recommended. Therefore, we opted for the longitudinal framing configuration. Longitudinal system
has longitudinal frame at the bottom, sides and decks, supported by widely spaced transverse web. This
was particularly true for our vessel where we have LNG tanks and also diesel oil tank, where the increased
web frame depth did not affect cargo stowage volume. This configuration can be seen in the Figure 20
below.

69
NAME 591 COMPUTER AIDED DESIGN PROJECT
2015-2016
Figure 20: Longitudinal Framing
Following the rules from Lloyd’s Register the following thicknesses were calculated:
Table 14 Thickness calculation for members
14.3 Vessel Loading The still water wave bending moments were calculated using Lloyd’s Rules and the corresponding Shear
force was evaluated. The following figure shows these results:
Members Calculated Thickness (mm) Taken Values (mm)
Deck 7.3 10
Bottom Plating Thickness 8.1 10
Bilge Plating 8.1 10
Keel Plate 11.2 12
Side shell above mid depth 6.7 8
Side shell below mid depth 7.3 8
Sheer strake and gunwale 7.3 10
Inner Hull Plate 6.9 9

70
NAME 591 COMPUTER AIDED DESIGN PROJECT
2015-2016
Still Water Bending Moment
LBP L 93 m
LWL LWL 93 m
Breadth B 18 m
Block Coefficient Cb 0.74
Navigation coefficient n 0.8 coastal
Navigation coefficient n1 0.9 coastal
96%LWL 89.28 m
97%LWL 90.21 m
Rule length 90.21 m
Location x/L 0.5
Distribution factor FM 1
Wave parameter C 7.7113745
Vertical Wave Bending Moment
Hogging M WV,H 127054 kN.M
Sagging M WV,S -143139 kN.M
Still Water Bending Moment
Hogging M sWM,H 129133 kN.M
Sagging M sWM,S 113048 kN.M
Vertical Wave Shear Force
A 0.8876263
FQ (positive) FQ (Negative) X/L Positive-kn Negative-kn
0 0 0 0 0
0.8166 -0.92 0.2 3533.87 -3981.26
0.8166 -0.92 0.3 3533.87 -3981.26
0.7 -0.7 0.4 3029.21 -3029.21
0.7 -0.7 0.6 3029.21 -3029.21
1 -0.887 0.7 4327.45 -3841.16
1 -0.887 0.85 4327.45 -3841.16
0 0 1 0 0

71
NAME 591 COMPUTER AIDED DESIGN PROJECT
2015-2016
Figure 21: Bending Moment Diagram
Figure 22: Shear Force Diagram
-200000
0
200000
0.00 0.15 0.30 0.45 0.60 0.75 0.90
kN.M
x/L
STILL WATER BENDING MOMENT
Hogging Sagging
-5000
-4000
-3000
-2000
-1000
0
1000
2000
3000
4000
5000
1 2 3 4 5 6 7 8
Positive

72
NAME 591 COMPUTER AIDED DESIGN PROJECT
2015-2016
14.4 Mid-ship Section A typical mid-ship section of our vessel is shown below. The complete mid-ship section of the vessel can
be found in Appendix I.
Figure 23Midship Section
15.0 WEIGHT ESSTIMATE
15.1 Parametric Estimate
To carry out the iteration on the ship dimensions and parameters needed to achieve a balance between
weight and displacement and/or between required and available hull volume, deck area, and/or deck length, parametric models are needed for the various weight and volume requirements. Some of this information is available from vendor’s information as engines and other equipment are selected or from
characteristics of discrete cargo and specified payload equipment.
Parametric weight estimate was carried out based on ship design and construction by Thomas Lamb. The
total light ship weight was given by
WLS = WS + WM + Wo + Wmargin
Where:
WS = the structural weight
WM = propulsion machinery weight Wo = outfit and hull engineering weight

73
NAME 591 COMPUTER AIDED DESIGN PROJECT
2015-2016
Wmargin = Lightship design (or Acquisition) weight margin that is included as protection against
the under- prediction of the required displacement
The estimation of weight at the early parametric stage of design typically involves the use of parametric
models that are developed from weight information for similar vessels. A fundamental part of this modeling task is the selection of relevant independent variables that are correlated with the weight or center to be estimated.
15.1.1 Structural Weight The structural weight includes (1) the weight of the basic hull to its depth amidships; (2) the weight of the super- structures, those full width extensions of the hull above the basic depth amidships such as a
raised forecastle or poop; and (3) the weight of the deckhouses, those less than full width erections on the hull and superstructure. Because the superstructures and deckhouses have an important effect on the
overall structural VCG and LCG, it is important to capture the designer’s intent relative to the existence and location of superstructures and deckhouses as early as possible in the design process. E = Ehull + ESS + Edh
E = L(B + T) + 0.85L(D – T) + 0.85 ihi + 0.75 jhj
This independent variable is an area type independent variable. The first term represents the area of the
bottom, the equally heavy main deck, and the two sides below the waterline. (The required factor of two
is absorbed into the constant in the eventual equation.) The second term represents the two sides above the waterline, which are somewhat (0.85) lighter since they do not experience hydrostatic loading. These first two terms are the hull contribution Ehull. The third term is the sum of the profile areas (length x
height) of all of the superstructure elements and captures the superstructure contribution to the
structural weight. The fourth term is the sum of the profile area of all of the deckhouse elements, which
are relatively lighter (0.75/0.85) because they are further from wave loads and are less than full width.
We calculated the structural weight by using the given formula:
WS = WS(E) = K E1.36 [1 + 0.5(CB´ – 0.70)]
Where CB´ = CB + (1 – CB)[(0.8D – T)/3T]
The weight estimate for a single deckhouse can be estimated using the following approach:
Wdh = WS(Ehull + ESS + Edh) – WS(Ehull + ESS)

74
NAME 591 COMPUTER AIDED DESIGN PROJECT
2015-2016
And the structural weight coefficient K was given by the given table:
Ship type K mean K range Range of E
Tankers
0.032
±0.003
1500 < E < 40 000
Chemical tankers 0.036 ±0.001 1900 < E < 2500
Bulk carriers 0.031 ±0.002 3000 < E < 15 000
Container ships 0.036 ±0.003 6000 < E < 13 000
Cargo 0.033 ±0.004 2000 < E < 7000
Refrigerator ships 0.034 ±0.002 4000 < E < 6000
Coasters 0.030 ±0.002 1000 < E < 2000
Offshore supply 0.045 ±0.005 800 < E < 1300
Tugs 0.044 ±0.002 350 < E < 450
Fishing trawlers 0.041 ±0.001 250 < E < 1300
Research vessels 0.045 ±0.002 1350 < E < 1500
RO-RO ferries 0.031 ±0.006 2000 < E < 5000
Passenger ships 0.038 ±0.001 5000 < E < 15 000
Frigates/corvettes 0.023
15.1.2 Machinery Weight Estimation
The machinery weight in the commercial classification includes only the propulsion machinery primarily the prime mover, reduction gear, shafting, and propeller. We used Watson and Gilfillan method for a useful separation of this weight between the main engine(s) and the remainder of the machinery weight:
WM = WME + Wrem
This approach is useful because in commercial design, it is usually possible to select the main engine early
in the design process permitting the use of specific vendor’s weight and dimension information for the
prime mover from very early in the design. If an engine has not been selected, they provided the
conservative regression equation for an estimate about 5% above the mean of diesel electric engine data:
WM = 0.72 (MCR)0.78
Where now MCR is the total capacity of all generators in kW. The weight of the remainder of the machinery varies as the total plant MCR as follows:
Wrem = Cm (MCR)0.70
Cm= .72 for tankers
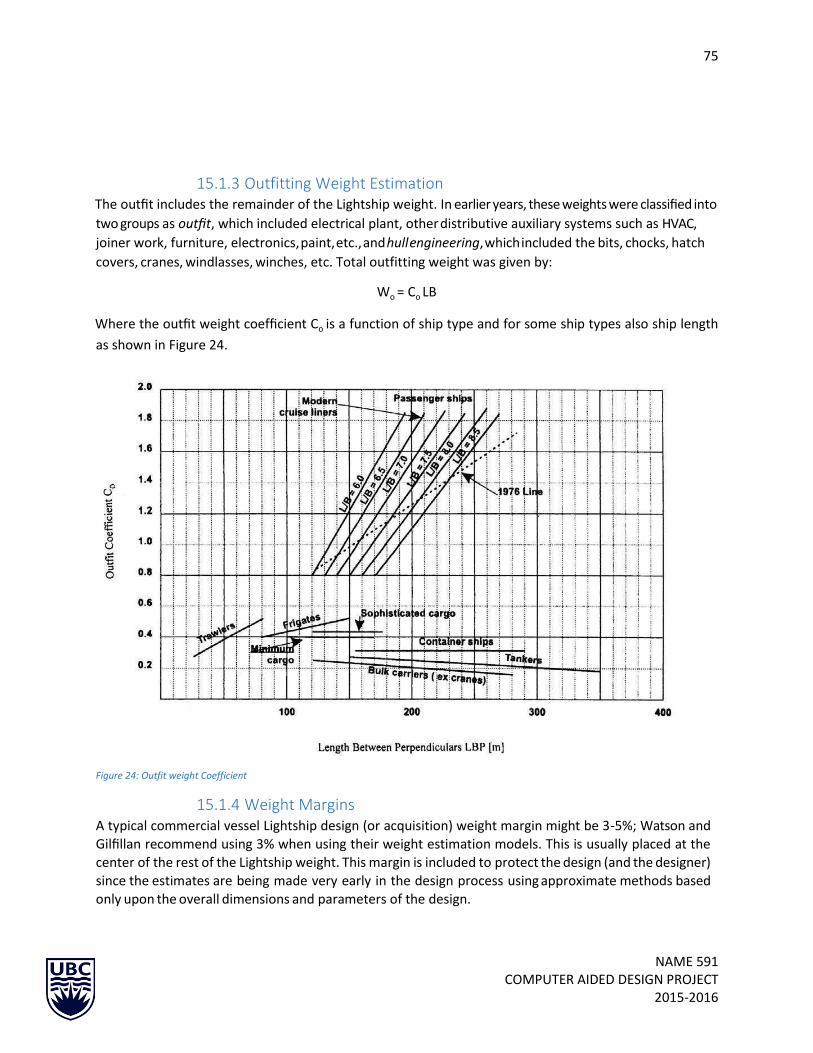
75
NAME 591 COMPUTER AIDED DESIGN PROJECT
2015-2016
15.1.3 Outfitting Weight Estimation The outfit includes the remainder of the Lightship weight. In earlier years, these weights were classified into
two groups as outfit, which included electrical plant, other distributive auxiliary systems such as HVAC,
joiner work, furniture, electronics, paint, etc., and hull engineering, which included the bits, chocks, hatch
covers, cranes, windlasses, winches, etc. Total outfitting weight was given by:
Wo = Co LB
Where the outfit weight coefficient Co is a function of ship type and for some ship types also ship length
as shown in Figure 24.
Figure 24: Outfit weight Coefficient
15.1.4 Weight Margins A typical commercial vessel Lightship design (or acquisition) weight margin might be 3-5%; Watson and Gilfillan recommend using 3% when using their weight estimation models. This is usually placed at the center of the rest of the Lightship weight. This margin is included to protect the design (and the designer) since the estimates are being made very early in the design process using approximate methods based
only upon the overall dimensions and parameters of the design.
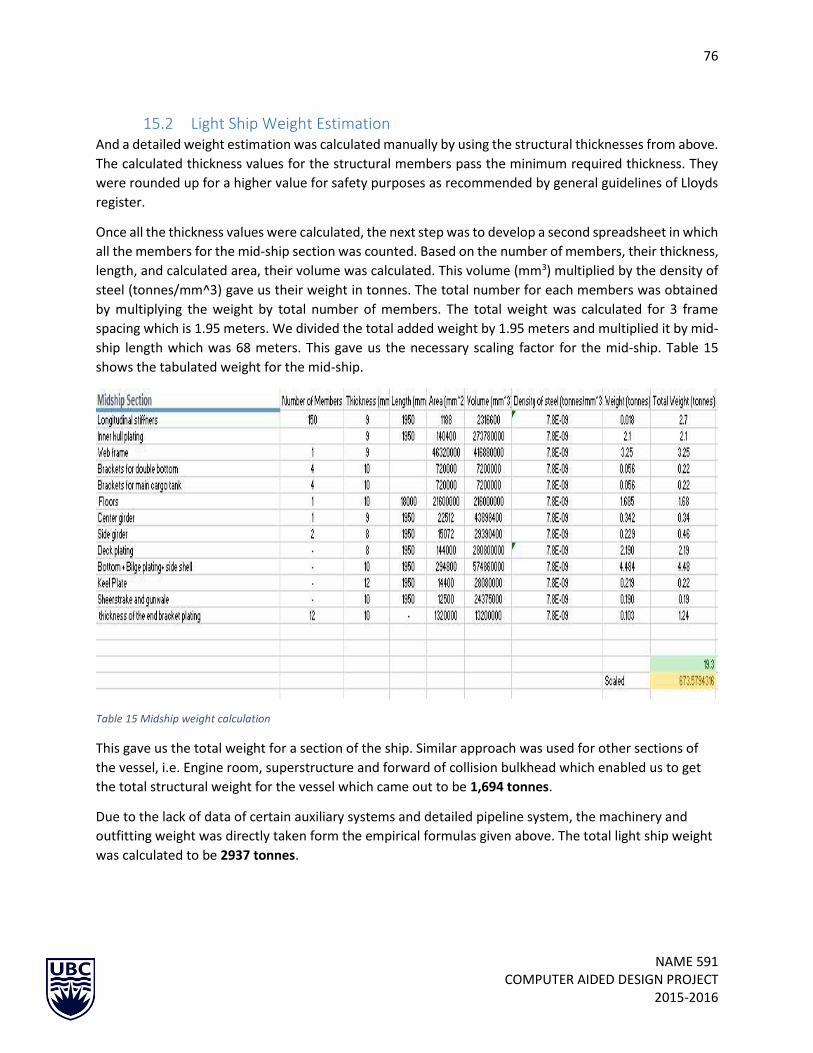
76
NAME 591 COMPUTER AIDED DESIGN PROJECT
2015-2016
15.2 Light Ship Weight Estimation And a detailed weight estimation was calculated manually by using the structural thicknesses from above.
The calculated thickness values for the structural members pass the minimum required thickness. They
were rounded up for a higher value for safety purposes as recommended by general guidelines of Lloyds
register.
Once all the thickness values were calculated, the next step was to develop a second spreadsheet in which
all the members for the mid-ship section was counted. Based on the number of members, their thickness,
length, and calculated area, their volume was calculated. This volume (mm3) multiplied by the density of
steel (tonnes/mm^3) gave us their weight in tonnes. The total number for each members was obtained
by multiplying the weight by total number of members. The total weight was calculated for 3 frame
spacing which is 1.95 meters. We divided the total added weight by 1.95 meters and multiplied it by mid-
ship length which was 68 meters. This gave us the necessary scaling factor for the mid-ship. Table 15
shows the tabulated weight for the mid-ship.
Table 15 Midship weight calculation
This gave us the total weight for a section of the ship. Similar approach was used for other sections of
the vessel, i.e. Engine room, superstructure and forward of collision bulkhead which enabled us to get
the total structural weight for the vessel which came out to be 1,694 tonnes.
Due to the lack of data of certain auxiliary systems and detailed pipeline system, the machinery and
outfitting weight was directly taken form the empirical formulas given above. The total light ship weight
was calculated to be 2937 tonnes.

77
NAME 591 COMPUTER AIDED DESIGN PROJECT
2015-2016

78
NAME 591 COMPUTER AIDED DESIGN PROJECT
2015-2016
16.0 COST ANALYSIS This section outlines the cost analysis that was performed for our vessel. The results of these analysis
are explained further in this section while the entire cost analysis can be found in Appendix H.
16.1 Construction Cost Analysis The cost of constructing the vessel was determined based on the weight of the vessel. The weight of the
vessel determined from the structural analysis as well as the tank selection were used to determine the
material and associated labour cost of the vessel.
The cost of the vessel was estimated to be around 24-25 million dollars as shown below:
Table 16 Cost Analysis
SYSTEM
NUMBER TITLE
WEIGHT
[TON]
RATE [MAN
HRS/TON]
MAN
HOURS MATERIAL Material[$/t]
100 HULL 1696 25 42,410 $1,187,501 700
200 PROPULSION M/C 64 30 1,920 $896,000 14000
300 ELECTRICAL 50 55 2,750 $900,000 18000
400 COMMAND & COMM 25 250 6,250 $875,000 35000
500 AUXILLIARY M/C 382 102 39,015 $3,442,500 9000
600 OUTFIT 552 55 30,381 $3,314,304 6000
600 LNG Tanks - 9 NI FE 177 12 2,126 $106,344 600
800 ENGINEERING 30,682 $10,615,305
900 SUPPORT SERVICES 61,363
SUB-TOTAL LABOR
HOURS 216,899
SUB-TOTAL LABOR DOLLARS $ 7,411,838
SUB-TOTAL LABOR & MATERIALS $ 16,133,487
OVERHEAD $ 3,517,694
TOTAL LABOR, MATERIALS AND OVERHEAD $ 19,651,181
MARGIN $ 1,965,118
PROFIT $ 982,559
Approximate Bid Price $ 24,598,859
79
NAME 591 COMPUTER AIDED DESIGN PROJECT
2015-2016
16.1.1 Construction Cost Summary The labour rate was taken to be $30/hr, while the rate for skilled engineering services was taken to be
$45/hr. A margin of 15% was taken in to account while a profit of 15% was considered. This falls well
within the range of $20 million to $25 million.
17. CONCLUSION The concept design of a LNG bunker supply vessel revolved around addressing the need to provide an
infrastructure to help ships tackle the problem of pollution and comply with the MARPOL tier 3
regulations. These challenges were enhanced and reflected in the owner’s requirements. In designing
such a vessel we proceeded by identifying the available solutions by taking a look at the existing vessels
and performing a parent vessel analysis. Based on the results of these analysis we decided to develop our
hull form. From here on we proceeded to analyses the resistance and powering required by our vessel.
Based on these results we selected our machinery. The vessel’s structure was analysed following Lloyd’s
Register rules and the weight was estimated thereafter. Apart from these the stability of the vessel was
assessed using ORCA 3D as well as MAXSURF. And finally, the drawings were generated using AutoCAD.
Given the limitation of time and resources some issues still need to be resolved. The following should be
addressed in subsequent design cycles:
1) Detailed design and analysis of all marine systems including but not restricted to the electrical
systems, piping system, HVAC system, etc.
2) Detailed analysis of the life cycle cost as well as the Return on investment for the vessel to be
assessed.
3) CFD analysis of the vessel to be carried out to support the resistance and powering estimations
made.
In conclusion, we’d like to present to you the conceptual study done for a LNG Bunker Supply Vessel. This
vessel will be constructed based on Lloyd’s Class rules sail under the Canadian flag. The project was done
in accordance to the requirement set up by the University of British Columbia’s Naval Architecture and
Marine Engineering program.
80
NAME 591 COMPUTER AIDED DESIGN PROJECT
2015-2016
18. REFERENCES
1. Wartsila Engine Manual
2. ABS Bunker Operation Manual
3. Holtrop Resistance Estimate
4. Design and Construction Weight estimation – Thomas Lamb
5. An Approximate Power prediction method- J. Holtrop & G.G.J. Mennen
6. Lloyd’s Rules
7. Lloyd’s Rules for offshore calculations
8. Ship Design and Construction – Thomas Lamb
9. https://maritant.com/
10. Marine Auxillary Machineries – H. D. McGeorge
11. Ship Construction –D. J. Eyres
12. Ship Construction Sketches and Notes- Kemp and Young
13. IMO 749 A
14. IGC Codes
15. Wartsila WSD59 6.5K
16. Rolls Royce Azimuth Thruster Manual
17. Rolls Royce type NVC 604 GT
18. Concept Naval ENR2
19. Kawasaki Concept
20. TG LNG Bunker Vessel
21. LNG world News
22. Principles of Naval Architecture Series
23. Basic ship theory- Rawson and Tupper
24. Diesel Engines- A.J Wharton
25. http://www.techcrane.com/
26. Wasrtsila reliquefaction plant
27. http://www.alibaba.com/
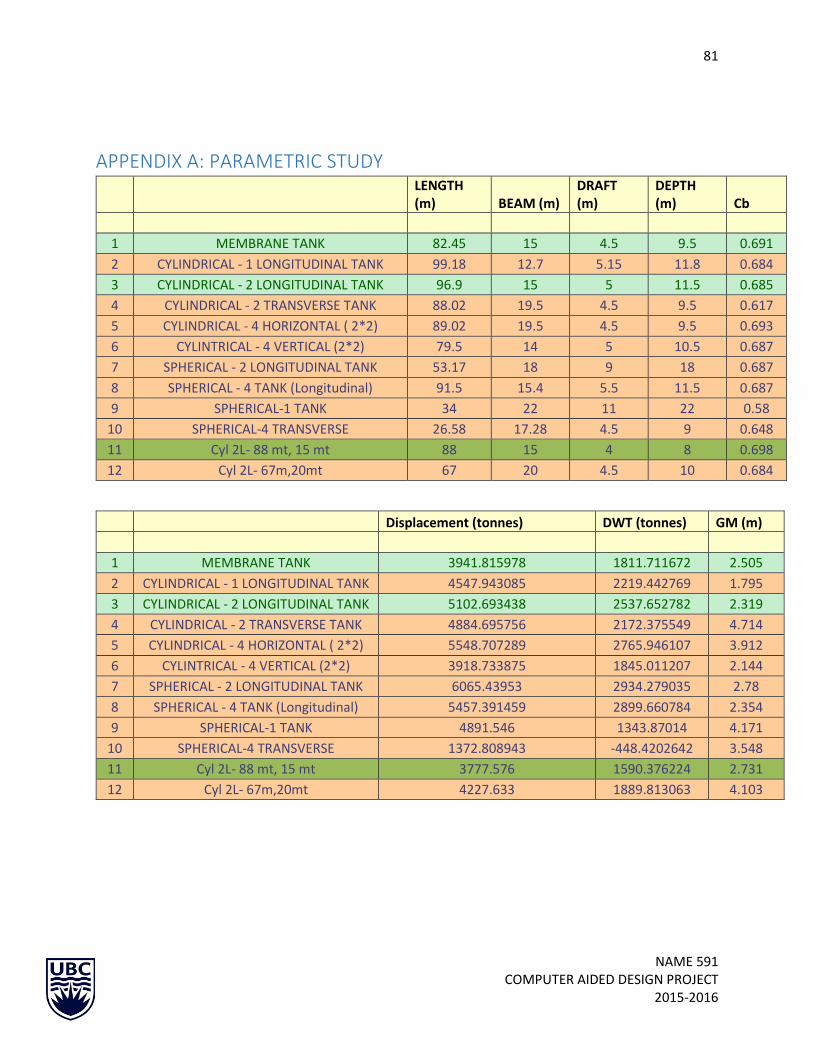
81
NAME 591 COMPUTER AIDED DESIGN PROJECT
2015-2016
APPENDIX A: PARAMETRIC STUDY
LENGTH (m) BEAM (m)
DRAFT (m)
DEPTH (m) Cb
1 MEMBRANE TANK 82.45 15 4.5 9.5 0.691
2 CYLINDRICAL - 1 LONGITUDINAL TANK 99.18 12.7 5.15 11.8 0.684
3 CYLINDRICAL - 2 LONGITUDINAL TANK 96.9 15 5 11.5 0.685
4 CYLINDRICAL - 2 TRANSVERSE TANK 88.02 19.5 4.5 9.5 0.617
5 CYLINDRICAL - 4 HORIZONTAL ( 2*2) 89.02 19.5 4.5 9.5 0.693
6 CYLINTRICAL - 4 VERTICAL (2*2) 79.5 14 5 10.5 0.687
7 SPHERICAL - 2 LONGITUDINAL TANK 53.17 18 9 18 0.687
8 SPHERICAL - 4 TANK (Longitudinal) 91.5 15.4 5.5 11.5 0.687
9 SPHERICAL-1 TANK 34 22 11 22 0.58
10 SPHERICAL-4 TRANSVERSE 26.58 17.28 4.5 9 0.648
11 Cyl 2L- 88 mt, 15 mt 88 15 4 8 0.698
12 Cyl 2L- 67m,20mt 67 20 4.5 10 0.684
Displacement (tonnes) DWT (tonnes) GM (m)
1 MEMBRANE TANK 3941.815978 1811.711672 2.505
2 CYLINDRICAL - 1 LONGITUDINAL TANK 4547.943085 2219.442769 1.795
3 CYLINDRICAL - 2 LONGITUDINAL TANK 5102.693438 2537.652782 2.319
4 CYLINDRICAL - 2 TRANSVERSE TANK 4884.695756 2172.375549 4.714
5 CYLINDRICAL - 4 HORIZONTAL ( 2*2) 5548.707289 2765.946107 3.912
6 CYLINTRICAL - 4 VERTICAL (2*2) 3918.733875 1845.011207 2.144
7 SPHERICAL - 2 LONGITUDINAL TANK 6065.43953 2934.279035 2.78
8 SPHERICAL - 4 TANK (Longitudinal) 5457.391459 2899.660784 2.354
9 SPHERICAL-1 TANK 4891.546 1343.87014 4.171
10 SPHERICAL-4 TRANSVERSE 1372.808943 -448.4202642 3.548
11 Cyl 2L- 88 mt, 15 mt 3777.576 1590.376224 2.731
12 Cyl 2L- 67m,20mt 4227.633 1889.813063 4.103

82
NAME 591 COMPUTER AIDED DESIGN PROJECT
2015-2016
POWER (kW) POWER REQ (kW)
(@15 KNOTS) (RESIS+MARGIN)
1 MEMBRANE TANK 4240.7 4876.805
2 CYLINDRICAL - 1 LONGITUDINAL TANK 3333.8 3833.87
3 CYLINDRICAL - 2 LONGITUDINAL TANK 3946.2 4538.13
4 CYLINDRICAL - 2 TRANSVERSE TANK 5015.8 5768.17
5 CYLINDRICAL - 4 HORIZONTAL ( 2*2) 4984.8 5732.52
6 CYLINTRICAL - 4 VERTICAL (2*2) 4645.7 5342.555
7 SPHERICAL - 2 LONGITUDINAL TANK 18664.5 21464.175
8 SPHERICAL - 4 TANK (Longitudinal) 4875.6 5606.94
9 SPHERICAL-1 TANK 30306.3 34852.245
10 SPHERICAL-4 TRANSVERSE 13046.9 15003.935
11 Cyl 2L- 88 mt, 15 mt 4474 5145.1
12 Cyl 2L- 67m,20mt 6069 6979.35
Lloyd's equipment numeral
HULL SUPER STRUCTURE DECKHOUSE Total
1 MEMBRANE TANK 1958.188 153 135 2246.1875
2 CYLINDRICAL - 1 LONGITUDINAL TANK 2330.978 153 135 2618.97795
3 CYLINDRICAL - 2 LONGITUDINAL TANK 2473.373 153 135 2761.3725
4 CYLINDRICAL - 2 TRANSVERSE TANK 2486.565 153 135 2774.565
5 CYLINDRICAL - 4 HORIZONTAL ( 2*2) 2514.815 153 135 2802.815
6 CYLINTRICAL - 4 VERTICAL (2*2) 1882.163 153 135 2170.1625
7 SPHERICAL - 2 LONGITUDINAL TANK 1842.341 153 135 2130.3405
8 SPHERICAL - 4 TANK (Longitudinal) 2379 153 135 2667
9 SPHERICAL-1 TANK 1439.9 153 135 1727.9
10 SPHERICAL-4 TRANSVERSE 680.5809 153 135 968.5809
11 Cyl 2L- 88 mt, 15 mt 1971.2 153 135 2259.2
12 Cyl 2L- 67m,20mt 1954.725 153 135 2242.725

83
NAME 591 COMPUTER AIDED DESIGN PROJECT
2015-2016
Weight coefficent
STRUCTURAL WEIGHT (tonnes)
K FACTOR Cb' Co
1 MEMBRANE TANK 0.032 0.76196 0.32 1192.245937
2 CYLINDRICAL - 1 LONGITUDINAL TANK 0.032 0.77174 0.32 1476.09841
3 CYLINDRICAL - 2 LONGITUDINAL TANK 0.032 0.7732 0.32 1587.417547
4 CYLINDRICAL - 2 TRANSVERSE TANK 0.032 0.70495 0.32 1545.141286
5 CYLINDRICAL - 4 HORIZONTAL ( 2*2) 0.032 0.7635 0.32 1612.323208
6 CYLINTRICAL - 4 VERTICAL (2*2) 0.032 0.75795 0.32 1135.490655
7 SPHERICAL - 2 LONGITUDINAL TANK 0.032 0.7496 0.32 1102.756858
8 SPHERICAL - 4 TANK (Longitudinal) 0.032 0.75719 0.32 1502.398844
9 SPHERICAL-1 TANK 0.032 0.664 0.32 794.8529097
10 SPHERICAL-4 TRANSVERSE 0.032 0.7184 0.32 371.7680343
11 Cyl 2L- 88 mt, 15 mt 0.032 0.7584 0.32 1199.576971
12 Cyl 2L- 67m,20mt 0.032 0.76593 0.32 1192.038058
MACHINERY WEIGHT (tonnes)
OUTFITTING WEIGHT (tonnes)
Light Ship Weight (tonnes)
1 MEMBRANE TANK 542.0983696 395.76 2130.104306
2 CYLINDRICAL - 1 LONGITUDINAL TANK 449.3343859 403.06752 2328.500316
3 CYLINDRICAL - 2 LONGITUDINAL TANK 512.5031085 465.12 2565.040656
4 CYLINDRICAL - 2 TRANSVERSE TANK 617.9341208 549.2448 2712.320206
5 CYLINDRICAL - 4 HORIZONTAL ( 2*2) 614.9531745 555.4848 2782.761183
6 CYLINTRICAL - 4 VERTICAL (2*2) 582.0720125 356.16 2073.722668
7 SPHERICAL - 2 LONGITUDINAL TANK 1722.144436 306.2592 3131.160494
8 SPHERICAL - 4 TANK (Longitudinal) 604.4198312 450.912 2557.730675
9 SPHERICAL-1 TANK 2513.46295 239.36 3547.67586
10 SPHERICAL-4 TRANSVERSE 1302.484405 146.976768 1821.229208
11 Cyl 2L- 88 mt, 15 mt 565.2228052 422.4 2187.199776
12 Cyl 2L- 67m,20mt 716.9818785 428.8 2337.819937

84
NAME 591 COMPUTER AIDED DESIGN PROJECT
2015-2016

85
NAME 591 COMPUTER AIDED DESIGN PROJECT
2015-2016

86
NAME 591 COMPUTER AIDED DESIGN PROJECT
2015-2016
APPENDIX B: TANK CALCULATIONS Design pressure 5 bar p
Inside Radius 6000 mm Ri
Design Temperature -170 deg C T
Weld Joint Efficency 1 J
Tank Dimensions
Length 23.8 mt
Radius 6 mt
Weld Joint Efficiency
Class 1 Class 2 A Class 2B Class 3
1 0.85 0.75 0.6
Constants for Allowable stree factor
9 Ni 36 Ni- Fe Al
A 3 3.5 4
B 1.5 1.5 1.5
Thickness of Tank t= [(P*Ri)/(10*σa*J-0.5*P)] + 0.75 mm
Al 40.88378 mm
9 Ni 13.62095 mm
36 Ni- Fe 13.3683 mm
Torispherical Ends t= [(P*Ri)/(20*σa*J-0.5*P)] + 0.75 mm
Al 20.78339 mm
9Ni 7.182026 mm
36 Ni- Fe 7.055833 mm
Density (Kg/m3)
Allowable stress (σa) (N/mm2)
Tensile strength (Rm) (N/mm2)
Yield Strength (Re) (N/mm2)
Alluminium 5083-0 2660 25 300 145
Nickel 9 Ni Steel 7860 55 700 490
Steel 36 Ni Fe 8120 55 833 612
Rm/A Re/B Lower Value (f)
Membrane Stress (σm)(N/mm2)
Min Design Pressure (bar)
Alluminium 5083-0 75 96.666667 75 Mpa 75 2.574579988

87
NAME 591 COMPUTER AIDED DESIGN PROJECT
2015-2016
Nickel 9 Ni Steel 233.33333 326.66667 233.333 Mpa 233.333 3.149039443
Steel 36 Ni Fe 238 408 238 Mpa 238 3.195464052
Design Pressure should not be less than Design vapour pressure
P₀ = .2+ AC (ρ)^1.5 P₀= Min Design Pressure
A= 0.00185*(σm/σa)^2
σm < f
ρ (R.D of LNG) 0.47 C= 0.45 Length of tank
A C P₀
Alluminium 0.01665 10.71 0.257458 N/mm2
36 Ni Fe 0.033297 10.71 0.314904 N/mm2
9 Ni 0.034642 10.71 0.319546 N/mm2
Insulation
PU- Foam 260 mm
Vacuum perlite 35 mm
Aerogel mats 165 mm
Al 9 Ni 36 Ni Fe
Outer Radius 6.040883779 6.013621 6.013368297
Inner Radius 6 6 6
Volume 36.82230723 12.24004 12.01275057
Weight 97947.33722 96206.74 97543.53466
Cost $/ton 97947.33722 57724.05 975435.3466

88
NAME 591 COMPUTER AIDED DESIGN PROJECT
2015-2016
APPENDIX C: STRUCTURAL CALCULATION
Bending Moment Calculations:
-150000
-100000
-50000
0
50000
100000
150000
0.00 0.15 0.30 0.45 0.60 0.75 0.90kN.M
x/L
STILL WATER BENDING MOMENT
Hogging Sagging

89
NAME 591 COMPUTER AIDED DESIGN PROJECT
2015-2016
-5000.00
-4000.00
-3000.00
-2000.00
-1000.00
0.00
1000.00
2000.00
3000.00
4000.00
5000.00
1 2 3 4 5 6 7 8
Positive
Negative

90
NAME 591 COMPUTER AIDED DESIGN PROJECT
2015-2016
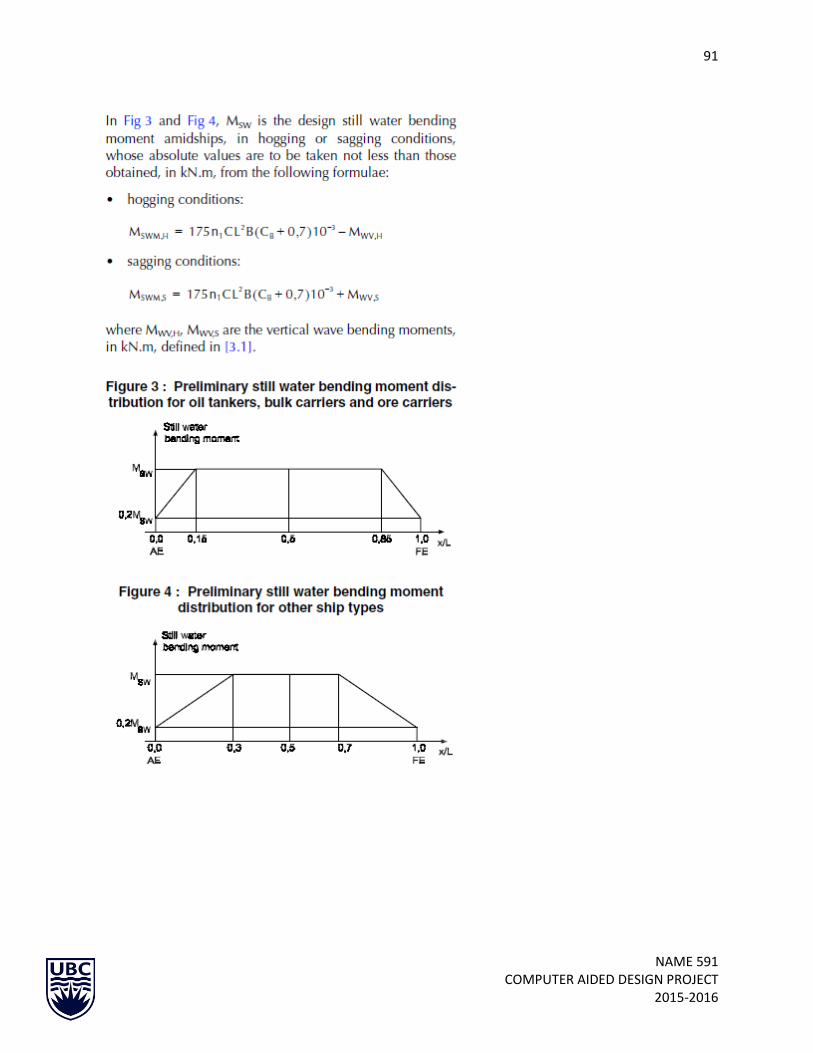
91
NAME 591 COMPUTER AIDED DESIGN PROJECT
2015-2016
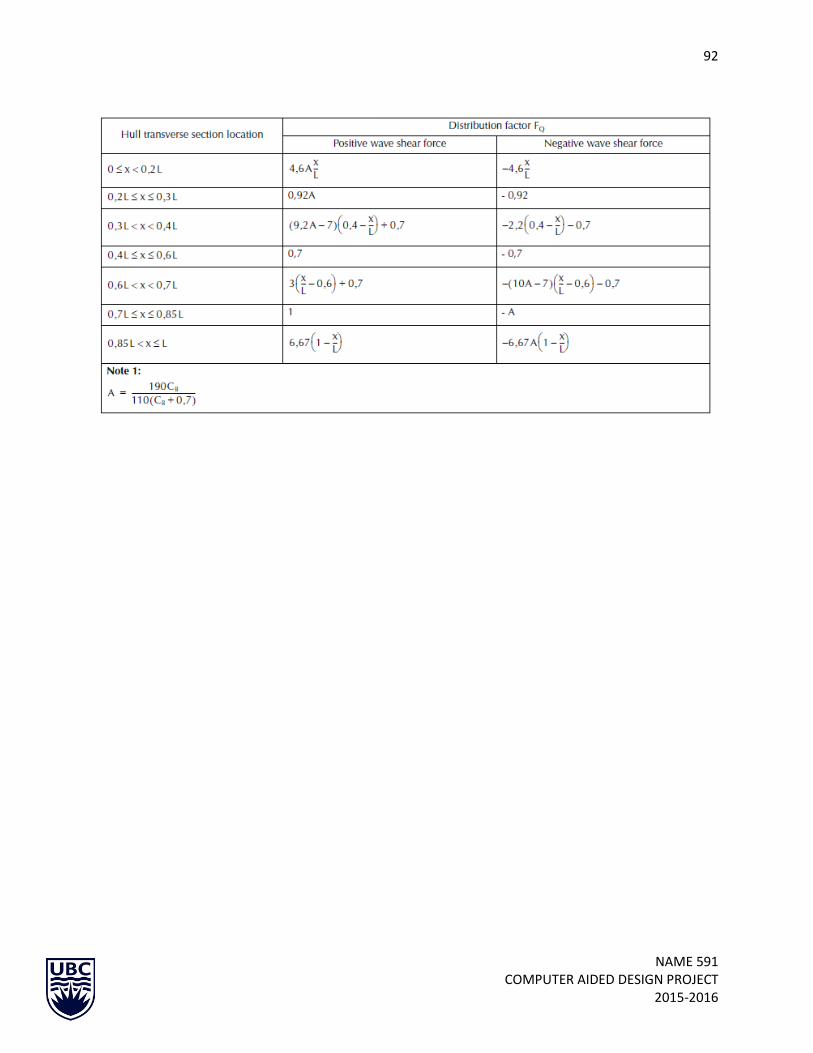
92
NAME 591 COMPUTER AIDED DESIGN PROJECT
2015-2016
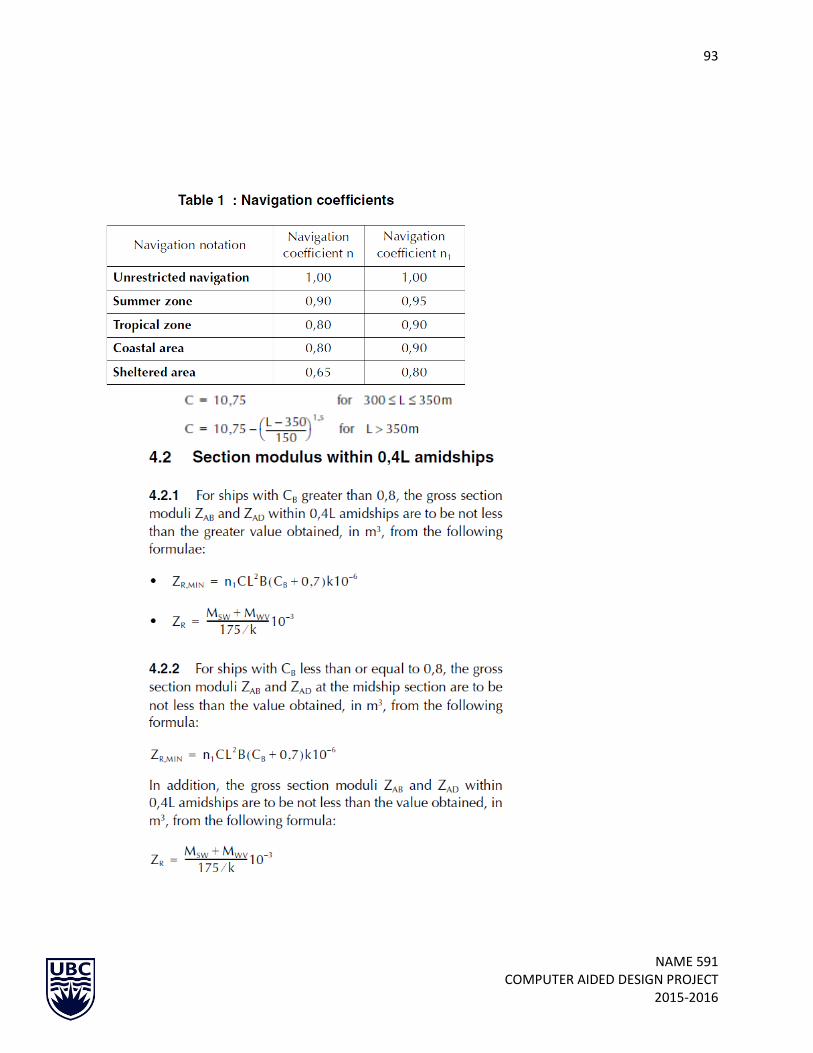
93
NAME 591 COMPUTER AIDED DESIGN PROJECT
2015-2016

94
NAME 591 COMPUTER AIDED DESIGN PROJECT
2015-2016

95
NAME 591 COMPUTER AIDED DESIGN PROJECT
2015-2016
STRENGTH CALCULAITONS
Project: LNG BUNKER SUPPLY VESSEL
LLOYD'S
LBP L 93.00 m
LWL LWL 93.00 m
Breadth B 18.00 m
Block Coefficient Cb 0.74 Navigation coefficient n 0.80 coastal Navigation coefficient n1 0.90 coastal
96%LWL 89.28 m
97%LWL 90.21 m
Rule length 90.21 m
Location x/L 0.50
Distributioin factor FM 1.00
Wave parameter C 7.71
Vertical Wave Bending Moment
Hogging M WV,H 127054 kN.M
Sagging M WV,S -143139 kN.M
Still Water Bending Moment
Hogging M sWM,H 129133 kN.M
Sagging M sWM,S 113048 kN.M
x/L Hogging Sagging
0 0 0
0.15 129132.60 -113047.50
0.5 129132.60 -113047.50
0.85 129132.60 -113047.50
1 0 0

96
NAME 591 COMPUTER AIDED DESIGN PROJECT
2015-2016
Vertical Wave Shear Force
A 0.89
FQ (positive) FQ (Negative) X/L Positive-kn Negative-kn
0 0 0 0.00 0
0.8166 -0.92 0.2 3533.87 -3981.26
0.8166 -0.92 0.3 3533.87 -3981.26
0.7 -0.7 0.4 3029.22 -3029.22
0.7 -0.7 0.6 3029.22 -3029.22
1 -0.887626263 0.7 4327.46 -3841.16
1 -0.887626263 0.85 4327.46 -3841.16
0 0 1 0.00 0
Thickness Calculations:
Ship Parameters
L 97
B 18
D 11.5
T 5.2
Cb 0.685
Min wing tank width 0.82 m
Min Double bottom hieght 0.76 m

97
NAME 591 COMPUTER AIDED DESIGN PROJECT
2015-2016
Hull Envelope Plating Thicknesses as per Table 9.4.1
Deck 7.30 mm Also 8.125 mm (min) 10
Bottom Plating Thicknes 8.08 Or 9.20 mm 10
Bilge Plating 8.08 9.20 mm 10
Keel Plate 11.20 12
Side shell above mid depth 6.66 mm 8
Side shell below mid depth 7.25 mm 8
Sheerstrake and gunwale 7.30 mm 10
should not be less then side shell plating
Inner Hull Plate 6.90 mm 9
Hull Framing
Bottom stiffners (Z) 221.523 cm3 222
Bulkead Thickness (to)
Deck, side and bottom longitudinals
Z Modulus of longitudinals within the cargo tank (cm^3) 196.218 196

98
NAME 591 COMPUTER AIDED DESIGN PROJECT
2015-2016
Stability of longitudinals
Ch 4, 7 Hull buckling strength.
t w= as built thickness of plating, stiffener flange and web used in Table 4.7.1 Standard deduction for corrosion, d t in calculating standard deduction d t, in mm 8.4
t p = as built thickness of plating less standard deduction d t, in mm, (i.e. t p =t — d t) 6.4
S = spacing of primary members, in metres 0.65
τE = elastic critical buckling stress in shear, in N/mm2 (kgf/mm2) 108.8146011
σ E = elastic critical buckling stress in compression, in N/mm2(kgf/mm2) 71.89570651
Section 6: Inner hull, inner bottom and longitudinal watertight bulkheads
Thickness of the inner bottom plating in the holds 8.443139668 mm
(to) scantling thickness for transverse bulkhead 9.672527894
Side longitudinal in way of double skin tanks, including double skin construction (Z) in cm3 170.352
Bottom and bilge longitudinal in cm3 155.142
Transverse Watertight bulkhead
Thickness 6.596664024 8

99
NAME 591 COMPUTER AIDED DESIGN PROJECT
2015-2016
Primary members supporting longitudenal framing
d-DB = Rule depth of centre girder mm 971.4719243
Thckness of the center girder in mm 8.771775394 12 choose 1100x12 mm
Thickness of Floors and the side girders in mm 7.80030347 8
For the primary member:
d w = depth of member web, in mm 1200
t w = thickness of member web, in mm 8.48144754 9
S w = spacing of web frame members, in metres 1950
For the primary member web stiffener:
67.88550611
For the primary member end bracket, see Figure 9.10.2 Primary member end brackets
d b = arm length, in metres 1.44
lb = effective length of the free edge, in metres 2.03646753
t b = thickness of the end bracket plating, in mm 10 10
Background
Kl (higher tensile steel factor) 1
FLOORS
Thickness 9.743247319 10
Water tight floor thickness 10.77177539 11
Weather Deck Structure
Thickness 6.667446847 8

100
NAME 591 COMPUTER AIDED DESIGN PROJECT
2015-2016
e (base of natural logarithms)
l (overall length of stiffening member, or pillar, in metres)
Ie (effective length of stiffening member, or pillar, in metres) 2.5
min should be 2.5
t (thickness of plating, in mm)
s (spacing of secondary stiffeners, in mm) 650 631.6666667 mm
A (cross-sectional area of stiffening member, in cm2)
C (stowage rate, in m3/tonne)
Cw (a wave head in metres) 7,71 x 10⁻² L e−0,0044 L where L is not to be taken greater than 227 4.874225
I (inertia of stiffening member, in cm4)
S (spacing or mean spacing of primary members, in metres)
Z (section modulus of stiffening member, in cm3)
Ro (relative density (specific gravity) of liquid carried in a tank but is not to be taken less than 1,025) 1.025
dc (the height between the ship's base line and the bottom of the cargo pump-room, in metres)
DWT (deadweight, in tonnes, at the summer load waterline)
b (the width of plating supported by the primary or secondary member, in metres or mm respectively)
be (the effective width, in metres, of end brackets as determined from Pt 3, Ch 3, 3 Structural idealisation)
bi = minimum distance from side shell to inner hull/outer longitudinal bulkhead of the tank in question measured inboard at right angles to the centreline at the summer load waterline, in metres
db = the distance, in metres, between the bottom of the cargo tanks and the moulded line of the bottom shell plating measured at right angles to the bottom shell plating as shown in Table 9.1.1 0.76
ds = the distance, in metres, between the cargo tank boundary and the moulded line of the side shell plating measured at any cross-section at right angles to the side she 0.82
h = the load height applied to the item under consideration, in metres
L1 = length of ship, in metres, = L 97
Tm = minimum operating moulded draught of the ship at amidships under any expected cargo loading condition, in metres

101
NAME 591 COMPUTER AIDED DESIGN PROJECT
2015-2016
Hull Envelope Plating
F B = local scantling reduction factor for hull members below the neutral axis 0.77
F D = local scantling reduction factor for hull members above the neutral axis 0.65
F M = the greater of F D or F B
α 46.792781
σo = specified minimum yield stress, in N/mm2 (kgf/mm2) 235
σC = maximum compressive hull vertical bending stress, in N/mm2 5.0221422
f1 0.5
C1 1
Z min = minimum hull midship section modulus about the transverse neutral axis, in m3 f 1 k L C 1 L 2 B (C b + 0,7) x 10-6 m3 0.1172832
z D, z B = vertical distances from the hull transverse neutral axis to the deck and keel respectively, in metres 4
Initial design stage
Zb 7.5
σ 150
sigma 150/k initial
At Deck σD 5.0221422 equal to σC
At Keel σB 2.6784758
J 122.62308
H4 = Load head required for general deep tanks 11.5
Ht2 = in meters for bottom longitudinals 6.24 6.24 or 7.637113
Ht1 = for bottom longitudinals above waterline 7.072 7.072 or 10.07423
Gamma 0.051
Effective length of longitudinal, l 2.5 1.5 - 3

102
NAME 591 COMPUTER AIDED DESIGN PROJECT
2015-2016
Hull Framing
b f = the width of the face plate, in mm, of the side longitudinal under consideration
b f1 = the minimum distance, in mm, from the edge of the face plate of the side longitudinal under consideration to the centre of the web plate
Alpha 25
should be less than 27.65
b1 = greater horizontal distance in metres from a point 1/3rd of the height of the strake above its lower edge 15.6
c1 at deck 0.509554
1
c1 at D/2 1
C1 at base 0.588235
3
C2 at deck 0.723684
2
C2 at D/2 1
C2 at base 0.799418
6
dw depth of web, in mm
h = distance of longitudinal below deck at side, in metres. For deck longitudinal, h = 0 0
h o = the distance, in metres, from the mid-point of span of the stiffener to the highest point of tank 5.75
h1 7.1875 Max of
7.1875
1.732143
1.67
h2 5.75
h3 12.90214
3
D1 11.5 To be between 10 and 16
R= sin theta 0.458470
7
s = spacing, in mm, of bulkhead stiffeners for plane bulkheads. 650
F1 Fatigue factor determined from Table 9.6.2 Values of F 1 0.12
min value

103
NAME 591 COMPUTER AIDED DESIGN PROJECT
2015-2016
table 9.5.2
F2 Fatigue factor 0.73
min value table 9.5.2
Fs (fatigue Factor) 1 min value
Deck, side and bottom longitudinal
Z Modulus of longitudinal within the cargo tank (cm^3) 196.21875 196.21875 or 195.1409
5.3.4 Referring Pt 3, Ch 3, 3.2 Geometric properties of section 3.2.3. The webs and flanges are to comply with the minimum thickness requirements of Pt 4, Ch 9, 10 Construction details and minimum thickness.
5.3.5 The side and bottom longitudinal scantlings derived from Pt 4, Ch 9, 5.3 Deck, side and bottom longitudinal 5.3.1 and Pt 4, Ch 9, 5.3 Deck, side and bottom longitudinal 5.3.2, using the midship thickness of plating, are to extend throughout the cargo tanks. Where the shell plating is inclined at an angle to the horizontal longitudinal axis of greater than 10°, the span of the longitudinal is to be measured along the member. Where the shell plating is inclined at an angle to the vertical axis of greater than 10°, the spacing of longitudinal is to be measured along the chord between members. Where the angle of attachment of side longitudinal clear of amidships varies by 20° or more from a line normal to the plane of the shell, the properties of the section are to be determined about an axis parallel to the attached plating. Angles of slope greater than 40° are to be avoided.
Stability of longitudinals
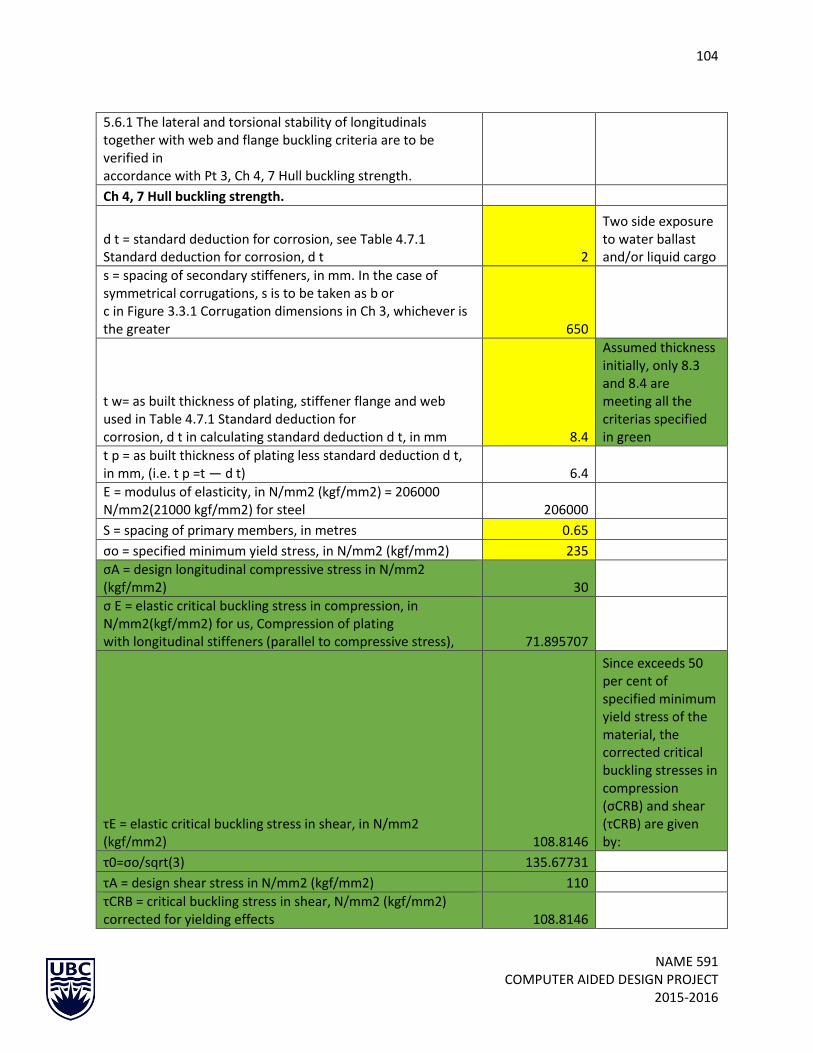
104
NAME 591 COMPUTER AIDED DESIGN PROJECT
2015-2016
5.6.1 The lateral and torsional stability of longitudinals together with web and flange buckling criteria are to be verified in accordance with Pt 3, Ch 4, 7 Hull buckling strength.
Ch 4, 7 Hull buckling strength.
d t = standard deduction for corrosion, see Table 4.7.1 Standard deduction for corrosion, d t 2
Two side exposure to water ballast and/or liquid cargo
s = spacing of secondary stiffeners, in mm. In the case of symmetrical corrugations, s is to be taken as b or c in Figure 3.3.1 Corrugation dimensions in Ch 3, whichever is the greater 650
t w= as built thickness of plating, stiffener flange and web used in Table 4.7.1 Standard deduction for corrosion, d t in calculating standard deduction d t, in mm 8.4
Assumed thickness initially, only 8.3 and 8.4 are meeting all the criterias specified in green
t p = as built thickness of plating less standard deduction d t, in mm, (i.e. t p =t — d t) 6.4
E = modulus of elasticity, in N/mm2 (kgf/mm2) = 206000 N/mm2(21000 kgf/mm2) for steel 206000
S = spacing of primary members, in metres 0.65
σo = specified minimum yield stress, in N/mm2 (kgf/mm2) 235
σA = design longitudinal compressive stress in N/mm2 (kgf/mm2) 30
σ E = elastic critical buckling stress in compression, in N/mm2(kgf/mm2) for us, Compression of plating with longitudinal stiffeners (parallel to compressive stress), 71.895707
τE = elastic critical buckling stress in shear, in N/mm2 (kgf/mm2) 108.8146
Since exceeds 50 per cent of specified minimum yield stress of the material, the corrected critical buckling stresses in compression (σCRB) and shear (τCRB) are given by:
τ0=σo/sqrt(3) 135.67731
τA = design shear stress in N/mm2 (kgf/mm2) 110
τCRB = critical buckling stress in shear, N/mm2 (kgf/mm2) corrected for yielding effects 108.8146

105
NAME 591 COMPUTER AIDED DESIGN PROJECT
2015-2016
σ CRB = critical buckling stress in compression, in N/mm2 (kgf/mm2) corrected for yielding effects 71.895707
7.5 Scantling criteria
σ CRB >= BσA where beta=1.1 for buckling 33 Satisfied
τCRB>=τA Satisfied
dw/tw=<15*sqrt Kl
dw= less than 126 mm
dw 100 mm
Section 6: Inner hull, inner bottom and longitudinal watertight bulkheads
Thickness of the inner bottom plating in the holds 8.44 mm
more than required for satisfying hull buckling strength
h = load height, in metres measured vertically as follows: (a) For bulkhead plating, the distance from a point one third of the height of the plate panel above its lower edge to the highest point of the tank, excluding hatchway (b) for bulkhead stiffeners or corrugations, the distance from the mid-point of span of the stiffener or corrugation to the highest point of the tank, excluding hatchway 5.15
midway D/2
h1 8.85 Max of 6.65
8.857543
h2 6.65 Max of 6.65
1.732143 1.67
h3 distance of longitudinal below deck at side, in metres, but is not to be less than 0 0.002
h4 12.30
h5 6.76 6.65 or 6.76
6179
D1 12
between 10 to 16
R= sin theta 0.458
F1 Fatigue factor determined from Table 9.6.2 Values of F 1 0.12 min(.12)
s = spacing, in mm, of bulkhead stiffeners for plane bulkheads. 650
(to) scantling thickness for transverse bulkhead 9.6725279

106
NAME 591 COMPUTER AIDED DESIGN PROJECT
2015-2016
tm minimum value of t 0 within 0,4D each side of mid-depth of bulkhead 6.5
Minimum value should not be less than 65. mm
F2 Fatique factor 0.73 0.72 or min 0.73
tf
Fs (fatique Factor) 1 min
Side longitudinal in way of double skin tanks, including double skin construction (Z) in cm3 170.352
Bottom and bilge longitudinal in cm3 155.142
Transverse Watertight bulkhead
s = spacing, in mm, of bulkhead stiffeners for plane bulkheads. 650
As defined above
Thickness 5.958
f (constant for thickness) 0.7 1 0.7
Stiffener modulus (z) in cm3 12.235917
Primary members supporting longitudinal framing
b-e1, b-e2 = effective end bracket leg length, in metres, at each end of the member,
d-DB = Rule depth of centre girder mm 971.47192 971.4719243
should not be less than 650
hc = vertical distance from the centre of the cross-ties to deck at side amidships
hs = distance between the lower span point of the vertical web and the moulded deck line at centreline
lb = the distance, in metres, between the transverse bulkheads
lc = one-half the vertical distance, in metres, between the centres of the adjacent cross-ties or between the centre of the adjacent cross-tie and the centre of the

107
NAME 591 COMPUTER AIDED DESIGN PROJECT
2015-2016
adjacent bottom or deck transverse, or double bottom.
s = spacing of transverses, in metres
Thickness of the center girder in mm 8.7717754
Thickness of Floors and the side girders in mm 7.8003035
Section 10 Construction details and minimum thickness
For the primary member:
d w = depth of member web, in mm 1200
t w = thickness of member web, in mm 8.4814475 8.48144754 or
S w = spacing of web frame members, in metres 1950 7.5
For the primary member web stiffener:
A s = cross-sectional area of the web stiffener and associated web plating, in cm2 67.885506
Is = moment of inertia of the web stiffener and associated web plating, in cm4
For the primary member end bracket, see Figure 9.10.2 Primary member end brackets
d b = arm length, in metres 1.44
lb = effective length of the free edge, in metres 2.0364675
t b = thickness of the end bracket plating, in mm 10 8.48144754 or 10
Floors
Floors are defined in section 8.5.1, page 4.1.8.26. Spacing between them is 2.25 m (3·0.75 m), and it shouldn’t be less than 3,8 m. Floors thickness is defined as: t = (0.009·dDB + 1)·k1/2 = 9.332 mm, and it should be between 6 mm and 15 mm
Thickness 9.7432473
Water tight floor thickness 10.771775
Water tight floor stiffeners
Weather Deck Structure
Thickness 6.6674468
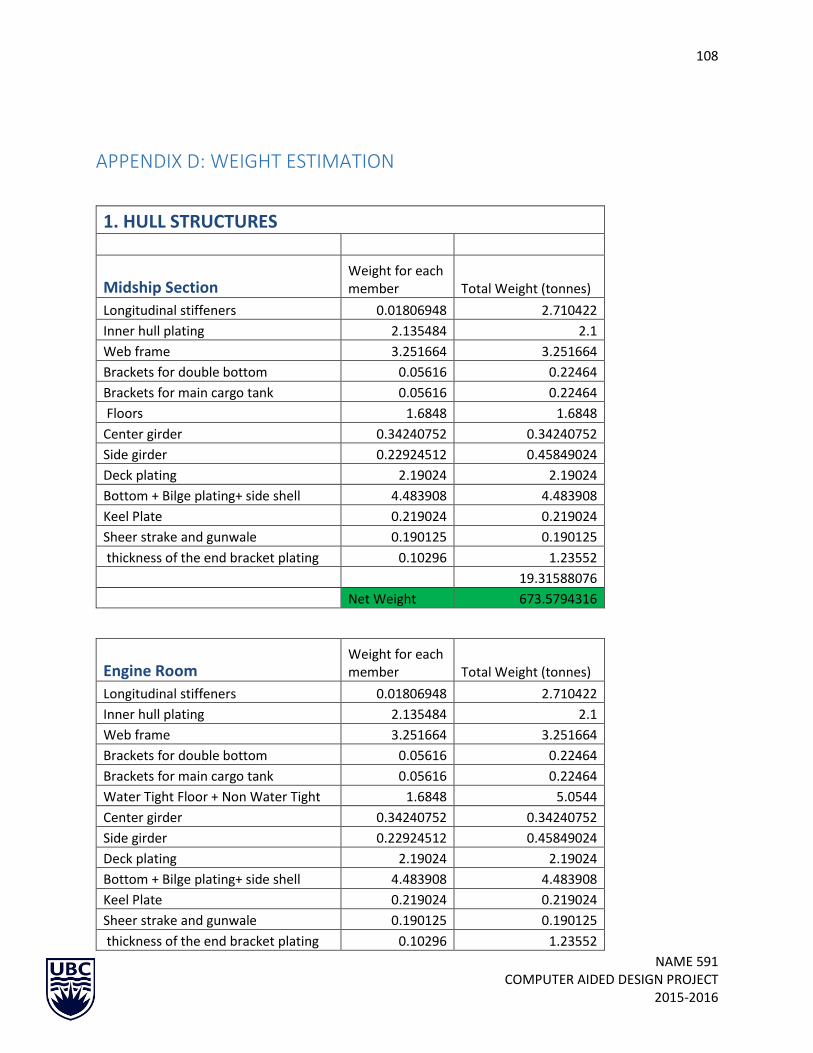
108
NAME 591 COMPUTER AIDED DESIGN PROJECT
2015-2016
APPENDIX D: WEIGHT ESTIMATION
1. HULL STRUCTURES
Midship Section Weight for each member Total Weight (tonnes)
Longitudinal stiffeners 0.01806948 2.710422
Inner hull plating 2.135484 2.1
Web frame 3.251664 3.251664
Brackets for double bottom 0.05616 0.22464
Brackets for main cargo tank 0.05616 0.22464
Floors 1.6848 1.6848
Center girder 0.34240752 0.34240752
Side girder 0.22924512 0.45849024
Deck plating 2.19024 2.19024
Bottom + Bilge plating+ side shell 4.483908 4.483908
Keel Plate 0.219024 0.219024
Sheer strake and gunwale 0.190125 0.190125
thickness of the end bracket plating 0.10296 1.23552
19.31588076
Net Weight 673.5794316
Engine Room Weight for each member Total Weight (tonnes)
Longitudinal stiffeners 0.01806948 2.710422
Inner hull plating 2.135484 2.1
Web frame 3.251664 3.251664
Brackets for double bottom 0.05616 0.22464
Brackets for main cargo tank 0.05616 0.22464
Water Tight Floor + Non Water Tight 1.6848 5.0544
Center girder 0.34240752 0.34240752
Side girder 0.22924512 0.45849024
Deck plating 2.19024 2.19024
Bottom + Bilge plating+ side shell 4.483908 4.483908
Keel Plate 0.219024 0.219024
Sheer strake and gunwale 0.190125 0.190125
thickness of the end bracket plating 0.10296 1.23552

109
NAME 591 COMPUTER AIDED DESIGN PROJECT
2015-2016
42.15428076
Net Weight 324.2636982
Forward of Collision Bulkhead Weight for each member Total Weight (tonnes)
Longitudinal stiffeners 0.01806948 0.903474
Inner hull plating 2.135484 2.1
Brackets for double bottom 0.05616 0.22464
Brackets for main cargo tank 0.05616 0.22464
Water Tight Floor + Non Water Tight 1.6848 5.0544
Deck plating 2.19024 2.19024
Bottom + Bilge plating+ side shell 4.483908 4.483908
Keel Plate 0.219024 0.219024
Sheer strake and gunwale 0.190125 0.190125
thickness of the end bracket plating 0.10296 1.23552
Watertight bulkhead 14.6016 14.6016
Panting beams 0.0383292 1.533168
Stringer 0.01533168 1.8398016
Breast hooks 0.702 0.702
35.5025406
Net Weight 271.0964662
Structural Bulkhead Weight for each member
Watertight bulkhead 19.4688 38.9376
Watertight bulkheads siffeners 0.0741312 2.07567
Net Weight 41.01327
Decks
1st Deck (Accomodation) 22.464 22.464
2nd Deck (Accomodation) 22.464 22.464
3rd Deck (Accomodation) 22.464 22.464
01 Level Deck (Engine Room) 22.464 22.464
02 Level Deck (Engine Room) 22.464 22.464

110
NAME 591 COMPUTER AIDED DESIGN PROJECT
2015-2016
Net Weight 112.32
Total Hull Structure Weight 1696.431343
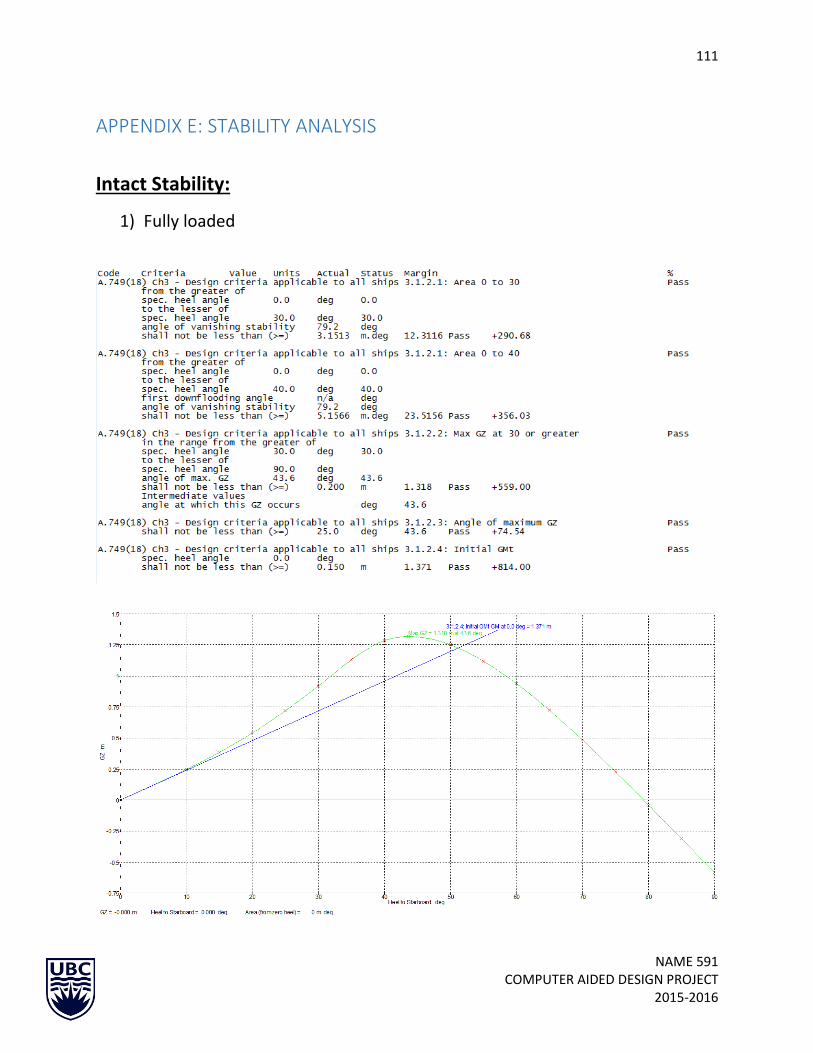
111
NAME 591 COMPUTER AIDED DESIGN PROJECT
2015-2016
APPENDIX E: STABILITY ANALYSIS
Intact Stability:
1) Fully loaded

112
NAME 591 COMPUTER AIDED DESIGN PROJECT
2015-2016
2) Partial Loaded

113
NAME 591 COMPUTER AIDED DESIGN PROJECT
2015-2016
3) Light Ship
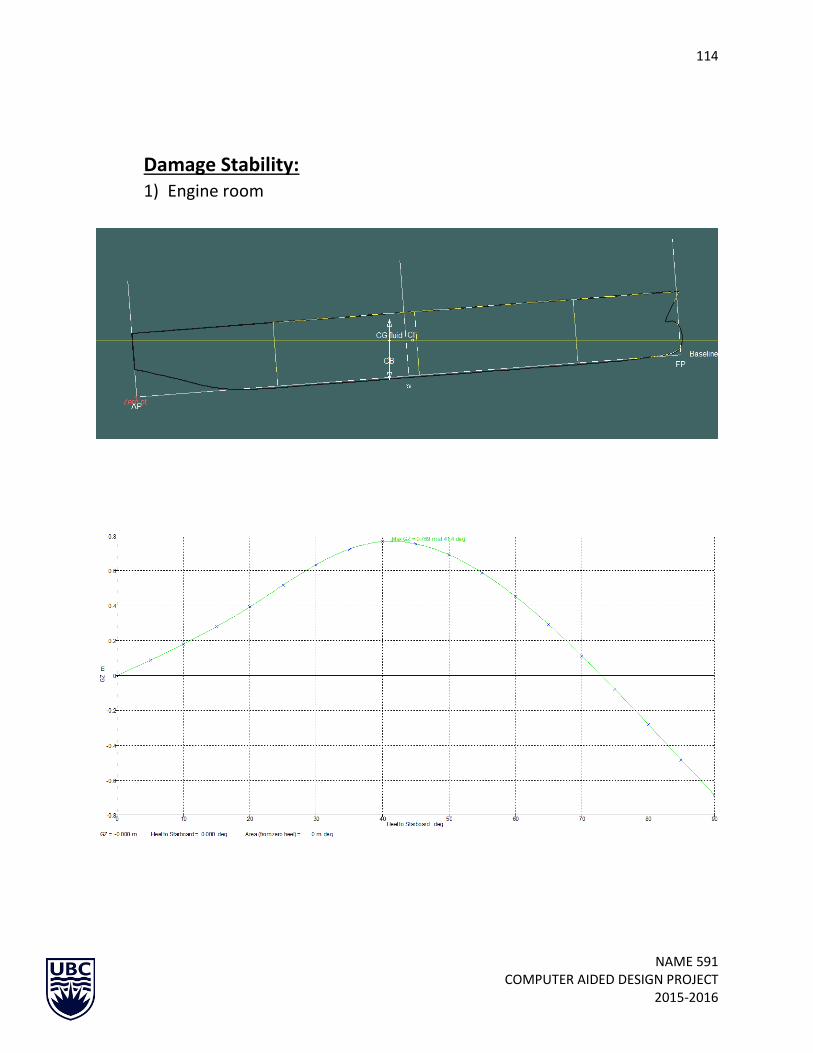
114
NAME 591 COMPUTER AIDED DESIGN PROJECT
2015-2016
Damage Stability: 1) Engine room

115
NAME 591 COMPUTER AIDED DESIGN PROJECT
2015-2016
2) Cargo Hold 1

116
NAME 591 COMPUTER AIDED DESIGN PROJECT
2015-2016
3) Cargo Hold 2

117
NAME 591 COMPUTER AIDED DESIGN PROJECT
2015-2016
4) Forward of Collision Bulkhead

118
NAME 591 COMPUTER AIDED DESIGN PROJECT
2015-2016
APPENDIX F: RESISTANCE PREDICTION SHIP PARTICULARS
LENGTH 96.99 m
BEAM 18 m
DRAFT 5.2 m
DEPTH 11.5 m T/L 0.053614
DISPLACEMENT 6717.91536 m3
Cb 0.74
Cp 0.75
Cwp 0.83
Cx 0.99
rho 1025.9 kg/m3
Wetted Surface 2206.330956 m2
Area midship 146.47 m2
Area Waterplane 1193.2 m2
Area Transom Immersed 0 m2
Viscosity 1.1883E-06 m2/sec
LCB 45.501 m from aft
lcb -0.030869162 relative to percentage of L
Sapp 50 m2
Form Factor
1+K1
C13=1+.003 stern 1 Cstern = 0
C12 (depends on T/L) 0.52098606
LR 24.180135
1+k1 1.281655298
Appendage Resistance
1+K2 bilge keels 1.4
Twin Screw Balance Rudder 2.8
1+K2 equivalent 4.2

119
NAME 591 COMPUTER AIDED DESIGN PROJECT
2015-2016
Wave Resistance (Constants)
C1 3.892268755
C2 0.420591482
C5 1
C7 0.185586143 B/L
C3 0.209993435
M1 -2.174657124 C16 1.20604
d -0.9 C15 -1.69385
LAMDA 0.92285
HALF ANGLE ENTRANCE
Ie 33.97372366
Vk V (m/s) Fn (l) Rn Wetted Surface
knots m/s [-] [-] m^2
5 2.572 0.083382 2.1E+08 2206.331
10 5.144 0.166764 4.2E+08 2206.331
11 5.6584 0.183441 4.62E+08 2206.331
12 6.1728 0.200117 5.04E+08 2206.331
12.5 6.43 0.208455 5.25E+08 2206.331
13 6.6872 0.216794 5.46E+08 2206.331
13.5 6.9444 0.225132 5.67E+08 2206.331
14 7.2016 0.23347 5.88E+08 2206.331
14.5 7.4588 0.241808 6.09E+08 2206.331
15 7.716 0.250146 6.3E+08 2206.331
16 8.2304 0.266823 6.72E+08 2206.331
17 8.7448 0.283499 7.14E+08 2206.331
18 9.2592 0.300176 7.56E+08 2206.331
19 9.7736 0.316852 7.98E+08 2206.331
20 10.288 0.333529 8.4E+08 2206.331
21 10.8024 0.350205 8.82E+08 2206.331

120
NAME 591 COMPUTER AIDED DESIGN PROJECT
2015-2016
RESISTANCE
Friction Wave Making
BULBOUS
BOW
ITTC Cf
Rf Friction Drag
k1 - Fricti
on form facto
r RF(1+
k)
R appendag
e RW_40 m2 CA R_A Fni Resistance R-TOT
[-] [N] [-] [N] [N]
0.001876
14048.5
1.281655
18005.34
1337.146
0.161813
-5.4E-
07 0.000527
3942.168
0.564721
515.8727
23800.69
0.00171 51201.
89 1.281655
65623.18
4873.429
2049.763
-0.02614
0.000527
15768.67
1.056194
2104.095
90419.14
0.001689
61187.09
1.281655
78420.76
5823.827
5160.237
-0.0488
0.000527
19080.09
1.141924
2441.671
110926.6
0.00167 71998.
9 1.281655
92277.77
6852.901 11036.8
-0.07844
0.000527
22706.89
1.223203
2769.927
135644.3
0.001661
77712.13
1.281655
99600.17
7396.691
15890.76
-0.0954
0.000527
24638.55
1.262178
2929.544
150455.7
0.001652
83628.95
1.281655
107183.5
7959.858
18639.04
-0.11349
0.000527
26649.05
1.300051
3085.773
163517.2

121
NAME 591 COMPUTER AIDED DESIGN PROJECT
2015-2016
0.001644
89748.44
1.281655
115026.6
8542.314
24212.28
-0.13248
0.000527
28738.4
1.336832
3238.408
179758
0.001637
96069.7
1.281655
123128.2
9143.976
37071.99
-0.15214
0.000527
30906.6
1.372535 3387.3
203638.1
0.001629
102591.9
1.281655
131487.4
9764.763
53683.73
-0.17229
0.000527
33153.63
1.407172
3532.341
231621.9
0.001622
109314.2
1.281655
140103.1
10404.6
63840.39
-0.19273
0.000527
35479.51
1.440762
3673.465
253501.1
0.001609
123356.2
1.281655
158100.1
11741.12
70606.26
-0.23388
0.000527
40367.8
1.504873
3943.848
284759.1
0.001597
138189.6
1.281655
177111.5
13152.98
112583.8
-0.27456
0.000527
45571.46
1.565029
4198.466
352618.2
0.001585
153809.2
1.281655
197130.4
14639.66
222762.1
-0.31406
0.000527
51090.49
1.62141
4437.635
490060.2
0.001574
170209.7
1.281655
218150.2
16200.67
343324.4
-0.35189
0.000527
56924.9
1.674206
4661.876
639262
0.001564
187386.5
1.281655
240164.9
17835.56 379226
-0.38778
0.000527
63074.68
1.723612
4871.837
705173
0.001555
205334.9
1.281655
263168.6
19543.91
360292.5
-0.42159
0.000527
69539.84
1.769824
5068.241
717613.1
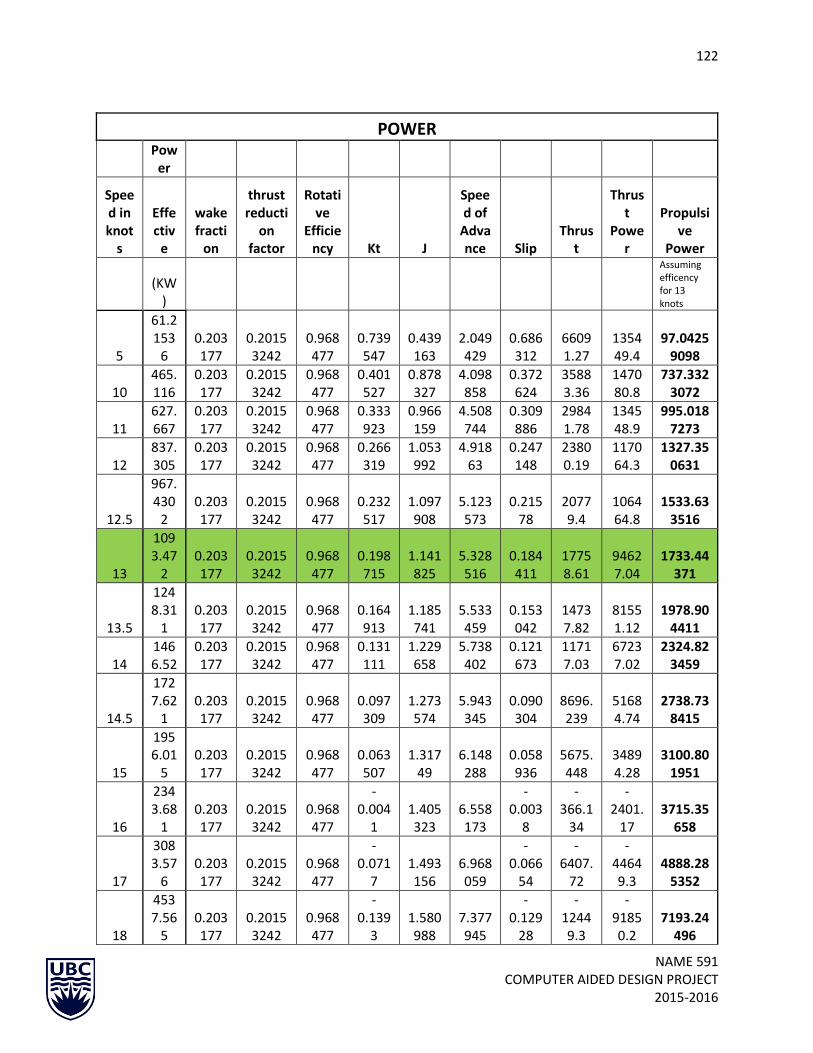
122
NAME 591 COMPUTER AIDED DESIGN PROJECT
2015-2016
POWER
Pow
er
Speed in knot
s
Effectiv
e
wake fracti
on
thrust reducti
on factor
Rotative
Efficiency Kt J
Speed of
Advance Slip
Thrust
Thrust
Power
Propulsive
Power
(KW
)
Assuming efficency for 13 knots
5
61.2153
6 0.203177
0.20153242
0.968477
0.739547
0.439163
2.049429
0.686312
66091.27
135449.4
97.04259098
10 465.116
0.203177
0.20153242
0.968477
0.401527
0.878327
4.098858
0.372624
35883.36
147080.8
737.3323072
11 627.667
0.203177
0.20153242
0.968477
0.333923
0.966159
4.508744
0.309886
29841.78
134548.9
995.0187273
12 837.305
0.203177
0.20153242
0.968477
0.266319
1.053992
4.91863
0.247148
23800.19
117064.3
1327.350631
12.5
967.430
2 0.203177
0.20153242
0.968477
0.232517
1.097908
5.123573
0.21578
20779.4
106464.8
1533.633516
13
1093.47
2 0.203177
0.20153242
0.968477
0.198715
1.141825
5.328516
0.184411
17758.61
94627.04
1733.44371
13.5
1248.31
1 0.203177
0.20153242
0.968477
0.164913
1.185741
5.533459
0.153042
14737.82
81551.12
1978.904411
14 1466.52
0.203177
0.20153242
0.968477
0.131111
1.229658
5.738402
0.121673
11717.03
67237.02
2324.823459
14.5
1727.62
1 0.203177
0.20153242
0.968477
0.097309
1.273574
5.943345
0.090304
8696.239
51684.74
2738.738415
15
1956.01
5 0.203177
0.20153242
0.968477
0.063507
1.31749
6.148288
0.058936
5675.448
34894.28
3100.801951
16
2343.68
1 0.203177
0.20153242
0.968477
-0.004
1 1.405323
6.558173
-0.003
8
-366.1
34
-2401.
17 3715.35
658
17
3083.57
6 0.203177
0.20153242
0.968477
-0.071
7 1.493156
6.968059
-0.066
54
-6407.
72
-44649.3
4888.285352
18
4537.56
5 0.203177
0.20153242
0.968477
-0.139
3 1.580988
7.377945
-0.129
28
-12449.3
-91850.2
7193.24496

123
NAME 591 COMPUTER AIDED DESIGN PROJECT
2015-2016
19
6247.89
1 0.203177
0.20153242
0.968477
-0.206
91 1.668821
7.787831
-0.192
01
-18490.9
-1440
04 9904.56
5285
20
7254.81
9 0.203177
0.20153242
0.968477
-0.274
51 1.756654
8.197717
-0.254
75
-24532.5
-2011
10 11500.8
1337
21
7751.94
4 0.203177
0.20153242
0.968477
-0.342
12 1.844486
8.607603
-0.317
49
-3057
4
-2631
69 12288.8
8714
Resistance @ 13 knots 163517.2131 N
Area of bulbous bow 11.2 m2
APPENDIX G: PROPELLER AND POWERING CALCULATION
Propeller .@13 knots
Pitch 2.8 mt Kt J desired
Diameter 2 mt 0.198715 1.141825
kt= 0.17
P/D 1.4 J= 1.2
Rpm 140
Area Prop 2.199114858 m2 Efficiency
0.65
APPENDIX H: COST ESTIMATION
SYSTEM
NUMBER TITLE
WEIGHT
[TON]
RATE
[MAN
HRS/TON]
MAN
HOURS MATERIAL Material[$/t]
100 HULL 1696 25 42,410 $1,187,501 700
200 PROPULSION M/C 64 30 1,920 $896,000 14000
300 ELECTRICAL 50 55 2,750 $900,000 18000
400 COMMAND & COMM 25 250 6,250 $875,000 35000
500 AUXILLIARY M/C 382 102 39,015 $3,442,500 9000
600 OUTFIT 552 55 30,381 $3,314,304 6000

124
NAME 591 COMPUTER AIDED DESIGN PROJECT
2015-2016
600 LNG Tanks - 9 NI FE 177 12 2,126 $106,344 600
800 ENGINEERING 30,682 $10,615,305
900 SUPPORT SERVICES 61,363
SUB-TOTAL LABOR
HOURS 216,899
SUB-TOTAL LABOR DOLLARS $ 7,411,838
SUB-TOTAL LABOR & MATERIALS $ 16,133,487
OVERHEAD $ 3,517,694
TOTAL LABOR, MATERIALS AND OVERHEAD $ 19,651,181
MARGIN $ 1,965,118
PROFIT $ 982,559
Approximate Bid Price $ 24,598,859
APPENDIX I: CAD DRAWINGS


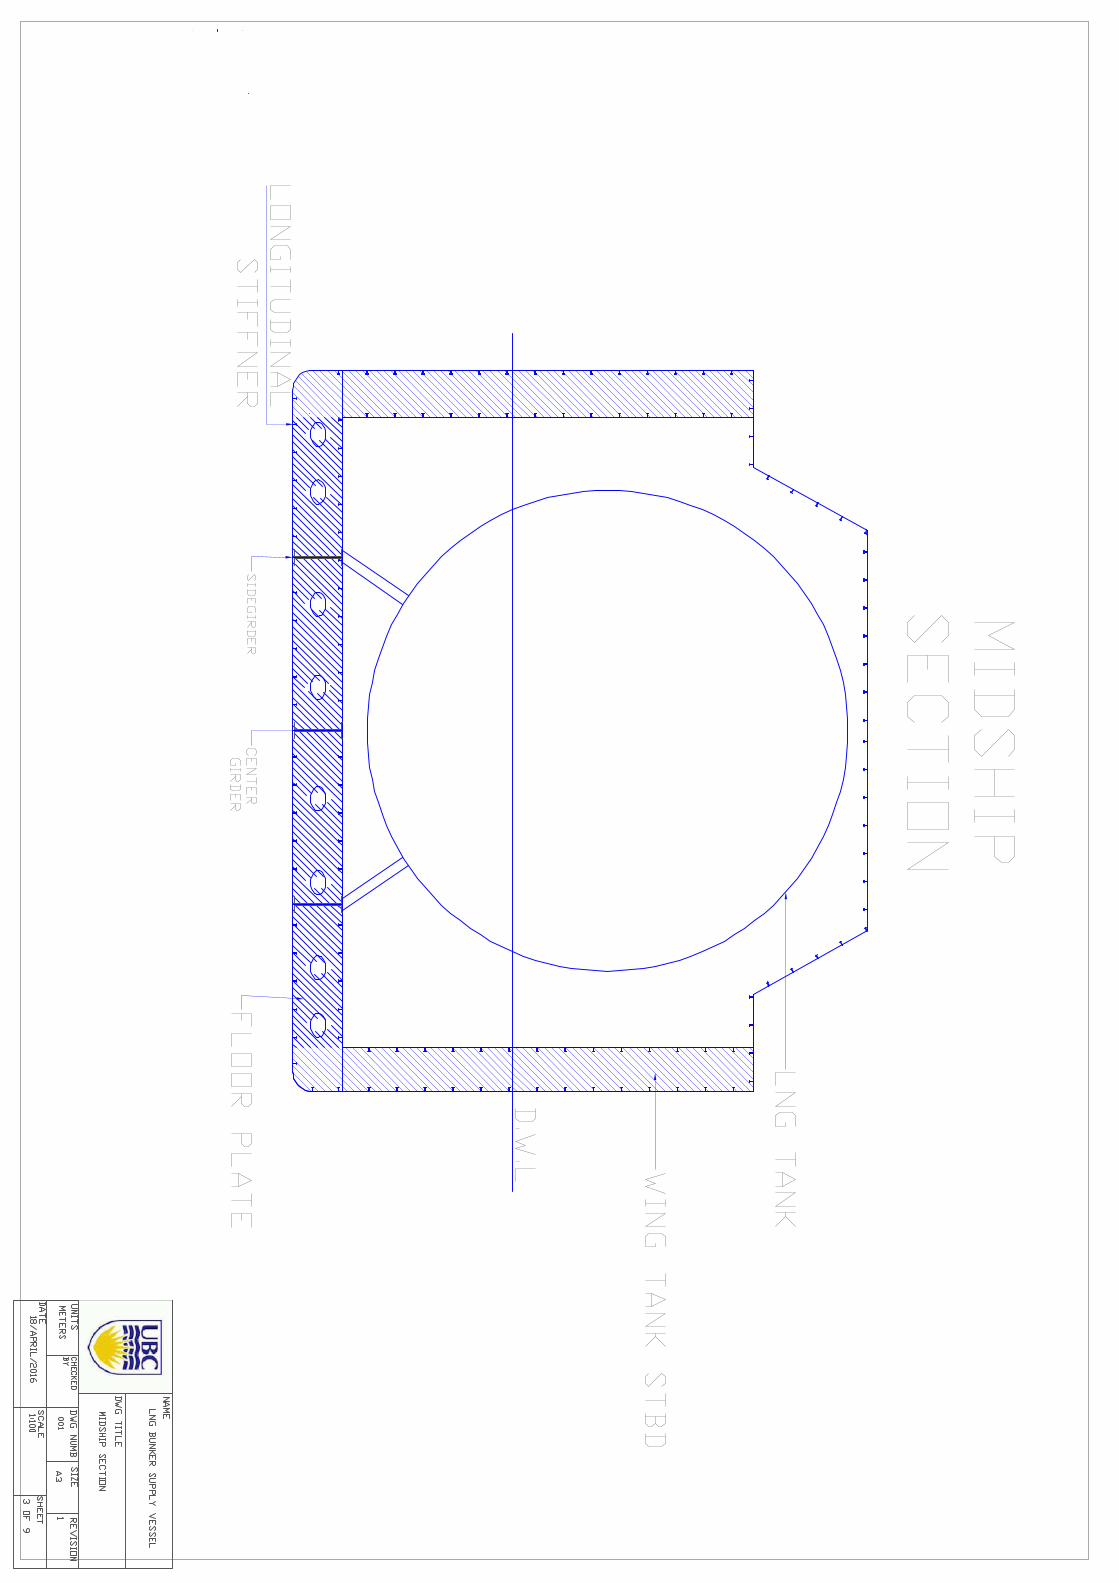
21

5.099 m Sta10.199 m Sta15.298 m Sta20.398 m Sta25.497 m Sta30.597 m Sta35.696 m Sta40.795 m Sta45.895 m Sta50.994 m Sta56.094 m Sta61.193 m Sta66.293 m Sta71.392 m Sta76.491 m Sta81.591 m Sta86.69 m Sta91.79 m Sta
-6.845 m Btk-4.563 m Btk-2.282m Btk
10.019 m WL8.738 m WL7.457 m WL6.176 m WL4.895 m WL3.613 m WL2.332 m WL1.051 m WL
z
y
zxy x