Embed Size (px)
Citation preview
1
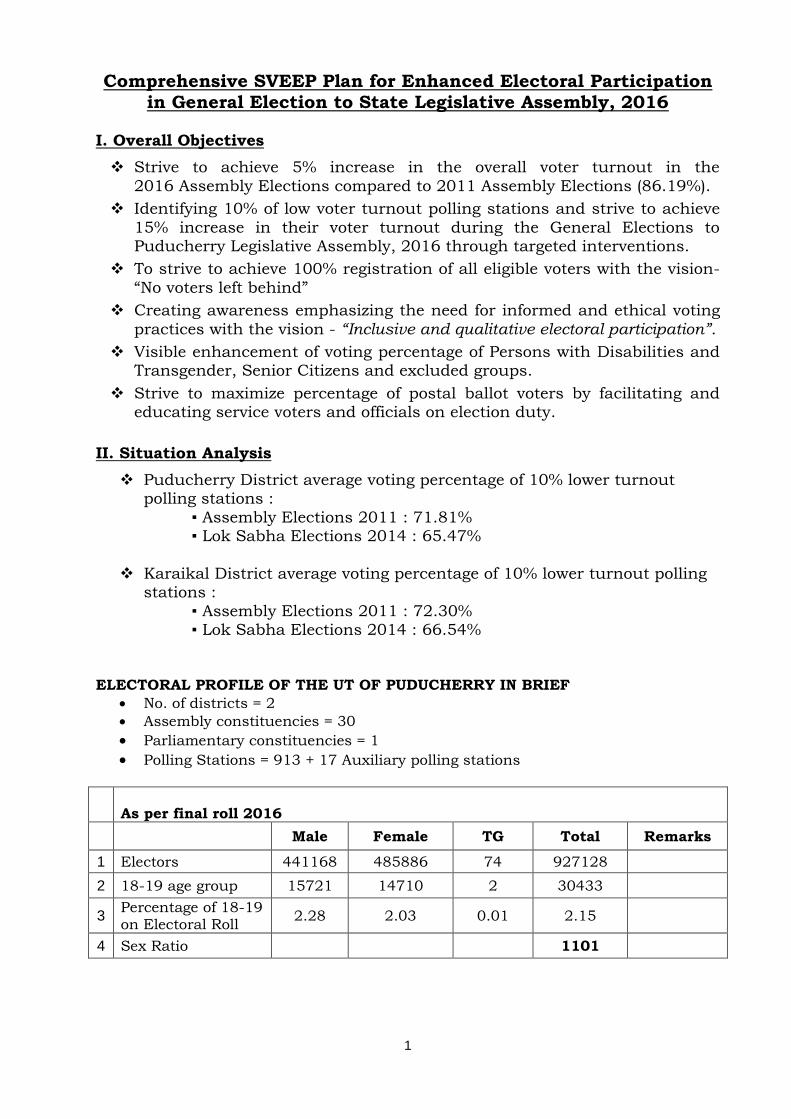
Comprehensive SVEEP Plan for Enhanced Electoral Participation in General Election to State Legislative Assembly, 2016
I. Overall Objectives
Strive to achieve 5% increase in the overall voter turnout in the
2016 Assembly Elections compared to 2011 Assembly Elections (86.19%).
Identifying 10% of low voter turnout polling stations and strive to achieve
15% increase in their voter turnout during the General Elections to Puducherry Legislative Assembly, 2016 through targeted interventions.
To strive to achieve 100% registration of all eligible voters with the vision-
“No voters left behind”
Creating awareness emphasizing the need for informed and ethical voting
practices with the vision - “Inclusive and qualitative electoral participation”.
Visible enhancement of voting percentage of Persons with Disabilities and Transgender, Senior Citizens and excluded groups.
Strive to maximize percentage of postal ballot voters by facilitating and educating service voters and officials on election duty.
II. Situation Analysis
Puducherry District average voting percentage of 10% lower turnout polling stations :
▪ Assembly Elections 2011 : 71.81% ▪ Lok Sabha Elections 2014 : 65.47%
Karaikal District average voting percentage of 10% lower turnout polling stations :
▪ Assembly Elections 2011 : 72.30% ▪ Lok Sabha Elections 2014 : 66.54%
ELECTORAL PROFILE OF THE UT OF PUDUCHERRY IN BRIEF
No. of districts = 2
Assembly constituencies = 30
Parliamentary constituencies = 1
Polling Stations = 913 + 17 Auxiliary polling stations
As per final roll 2016
Male Female TG Total Remarks
1 Electors 441168 485886 74 927128
2 18-19 age group 15721 14710 2 30433
3 Percentage of 18-19 on Electoral Roll
2.28 2.03 0.01 2.15
4 Sex Ratio 1101
2
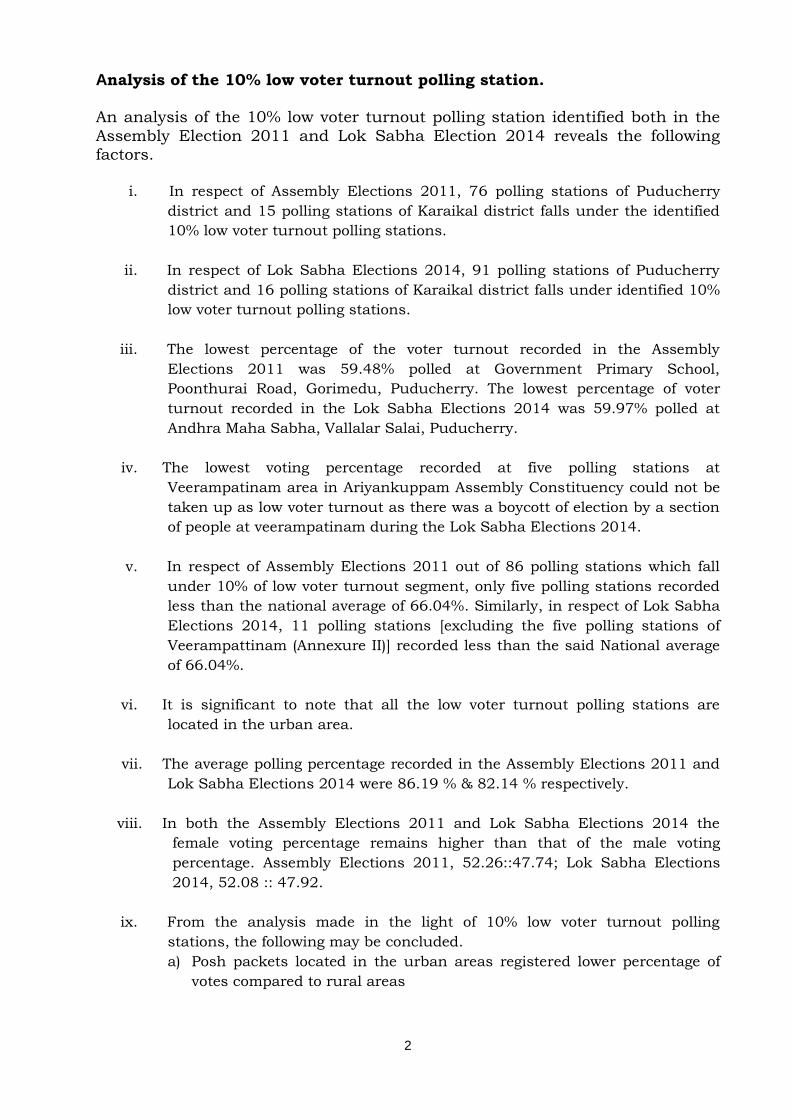
Analysis of the 10% low voter turnout polling station. An analysis of the 10% low voter turnout polling station identified both in the
Assembly Election 2011 and Lok Sabha Election 2014 reveals the following factors.
i. In respect of Assembly Elections 2011, 76 polling stations of Puducherry
district and 15 polling stations of Karaikal district falls under the identified
10% low voter turnout polling stations.
ii. In respect of Lok Sabha Elections 2014, 91 polling stations of Puducherry
district and 16 polling stations of Karaikal district falls under identified 10%
low voter turnout polling stations.
iii. The lowest percentage of the voter turnout recorded in the Assembly
Elections 2011 was 59.48% polled at Government Primary School,
Poonthurai Road, Gorimedu, Puducherry. The lowest percentage of voter
turnout recorded in the Lok Sabha Elections 2014 was 59.97% polled at
Andhra Maha Sabha, Vallalar Salai, Puducherry.
iv. The lowest voting percentage recorded at five polling stations at
Veerampatinam area in Ariyankuppam Assembly Constituency could not be
taken up as low voter turnout as there was a boycott of election by a section
of people at veerampatinam during the Lok Sabha Elections 2014.
v. In respect of Assembly Elections 2011 out of 86 polling stations which fall
under 10% of low voter turnout segment, only five polling stations recorded
less than the national average of 66.04%. Similarly, in respect of Lok Sabha
Elections 2014, 11 polling stations [excluding the five polling stations of
Veerampattinam (Annexure II)] recorded less than the said National average
of 66.04%.
vi. It is significant to note that all the low voter turnout polling stations are
located in the urban area.
vii. The average polling percentage recorded in the Assembly Elections 2011 and
Lok Sabha Elections 2014 were 86.19 % & 82.14 % respectively.
viii. In both the Assembly Elections 2011 and Lok Sabha Elections 2014 the
female voting percentage remains higher than that of the male voting
percentage. Assembly Elections 2011, 52.26::47.74; Lok Sabha Elections
2014, 52.08 :: 47.92.
ix. From the analysis made in the light of 10% low voter turnout polling
stations, the following may be concluded.
a) Posh packets located in the urban areas registered lower percentage of
votes compared to rural areas
3
b) There is no gender gap because the percentage of female voters was more
in rural and urban areas in both the Assembly Elections 2011 and Lok
Sabha Elections 2014.
c) The existence of gap in the urban and rural voters segment is identified.
c. Identification of lowest turnout Assembly Constituencies and reasons
thereof.
Lok Sabha Elections 2014
The average voting percentage of UT of Puducherry is 82.14%. The lowest
percentage of 71.12% polling was recorded at Mahe. The highest percentage of
90.54% was recorded at Yanam (Annexure III).
UT of Puducherry is coming under high voter turnout category. 16
Assembly Constituencies have recorded more than 80% of voting. Except two
constituencies all the other constituencies have recorded more than 75% of
voting. In view of the above, the lowest voter turnout constituencies are :
i) Karaikal South – 73.02%
ii) Mahe – 71.12%
d. Identification of reasons for drop in turnout (if any) between last
Assembly election and last LS election in the State.
Percentage Of Voter Turnout
Assembly Elections 2011 – 86.19%
Lok Sabha Elections 2014 – 82.14%
Drop in turnout percentage – 4.05%
Reasons For Drop In Turnout In The Lok Sabha Elections
Contesting candidates were not more persuasive as in the case of
Assembly Elections
Candidates affinity with the people was not as strong as in the case of
Assembly Elections
Contestants were very less compared to large number of contestants in
the Assembly Elections
Upper section of the society was not showing much interest
Reasons for low voter turnout.
a) Findings based on analysis of the 10% low voter segment polling stations:
Candidates are non-persuasive
Multiparty
Urban apathy
Urban Youth discontent
Urban migrant workers
Persons occupying high profile jobs
Upper stage of the society may not have interest
4
b) Findings Based On The KAP Baseline Survey
As per the findings of the KABP survey it is found that 97.8% of the
respondents have enrolled their names in the voters list and 98.6% of
them have EPIC. So the percentage of respondents who have not
registered their names in the electoral roll and failed to vote is very
narrow and marginal. The reason adduced for not voting by the select
group of new voters was captured in KAP survey and the same is
discussed in detail as under:
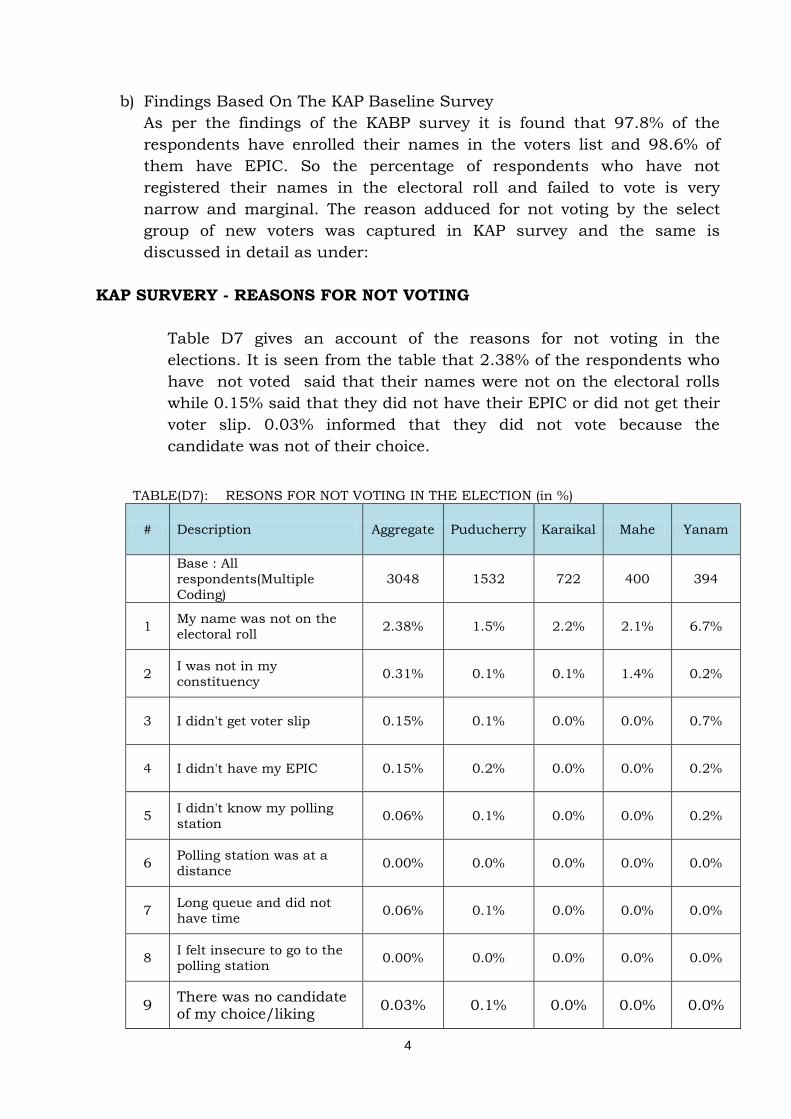
KAP SURVERY - REASONS FOR NOT VOTING
Table D7 gives an account of the reasons for not voting in the
elections. It is seen from the table that 2.38% of the respondents who
have not voted said that their names were not on the electoral rolls
while 0.15% said that they did not have their EPIC or did not get their
voter slip. 0.03% informed that they did not vote because the
candidate was not of their choice.
TABLE(D7): RESONS FOR NOT VOTING IN THE ELECTION (in %)
# Description Aggregate Puducherry Karaikal Mahe Yanam
Base : All
respondents(Multiple
Coding)
3048 1532 722 400 394
1 My name was not on the
electoral roll 2.38% 1.5% 2.2% 2.1% 6.7%
2 I was not in my
constituency 0.31% 0.1% 0.1% 1.4% 0.2%
3 I didn't get voter slip 0.15% 0.1% 0.0% 0.0% 0.7%
4 I didn't have my EPIC 0.15% 0.2% 0.0% 0.0% 0.2%
5 I didn't know my polling
station 0.06% 0.1% 0.0% 0.0% 0.2%
6 Polling station was at a
distance 0.00% 0.0% 0.0% 0.0% 0.0%
7 Long queue and did not
have time 0.06% 0.1% 0.0% 0.0% 0.0%
8 I felt insecure to go to the
polling station 0.00% 0.0% 0.0% 0.0% 0.0%
9 There was no candidate of my choice/liking
0.03% 0.1% 0.0% 0.0% 0.0%
5
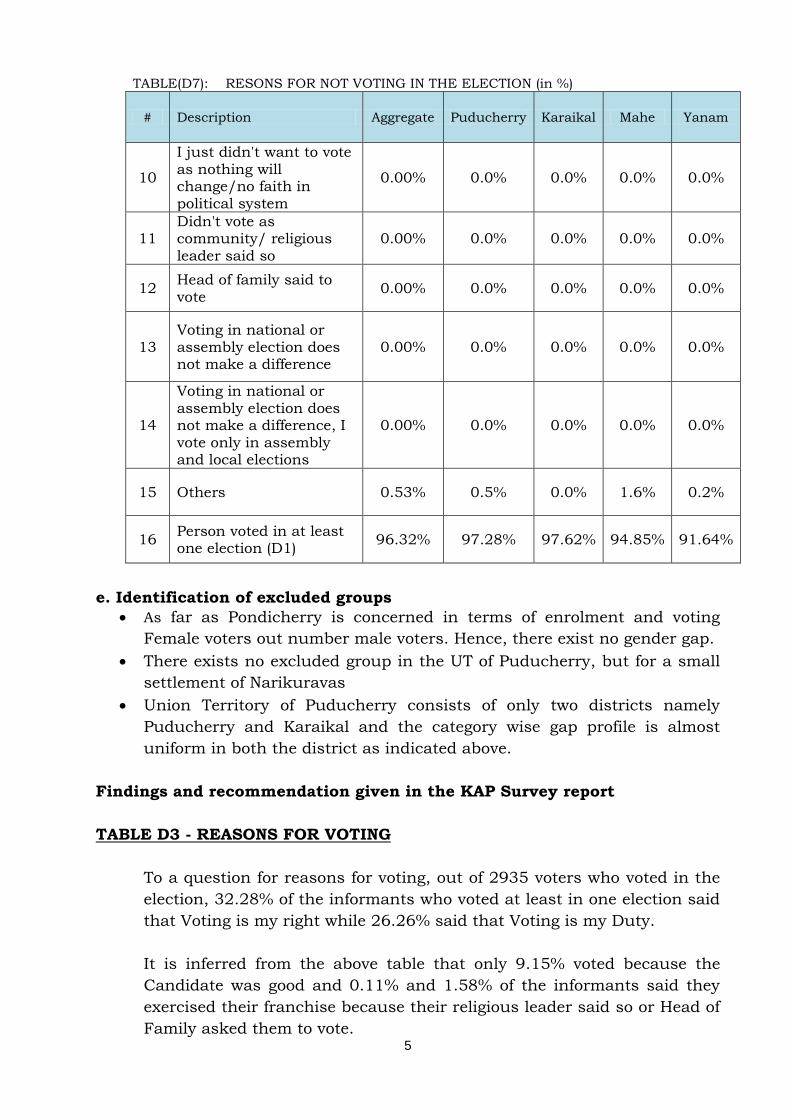
TABLE(D7): RESONS FOR NOT VOTING IN THE ELECTION (in %)
# Description Aggregate Puducherry Karaikal Mahe Yanam
10
I just didn't want to vote as nothing will change/no faith in political system
0.00% 0.0% 0.0% 0.0% 0.0%
11 Didn't vote as community/ religious leader said so
0.00% 0.0% 0.0% 0.0% 0.0%
12 Head of family said to vote
0.00% 0.0% 0.0% 0.0% 0.0%
13 Voting in national or assembly election does not make a difference
0.00% 0.0% 0.0% 0.0% 0.0%
14
Voting in national or assembly election does not make a difference, I vote only in assembly and local elections
0.00% 0.0% 0.0% 0.0% 0.0%
15 Others 0.53% 0.5% 0.0% 1.6% 0.2%
16 Person voted in at least one election (D1)
96.32% 97.28% 97.62% 94.85% 91.64%
e. Identification of excluded groups
As far as Pondicherry is concerned in terms of enrolment and voting
Female voters out number male voters. Hence, there exist no gender gap.
There exists no excluded group in the UT of Puducherry, but for a small
settlement of Narikuravas
Union Territory of Puducherry consists of only two districts namely
Puducherry and Karaikal and the category wise gap profile is almost
uniform in both the district as indicated above.
Findings and recommendation given in the KAP Survey report
TABLE D3 - REASONS FOR VOTING
To a question for reasons for voting, out of 2935 voters who voted in the
election, 32.28% of the informants who voted at least in one election said
that Voting is my right while 26.26% said that Voting is my Duty.
It is inferred from the above table that only 9.15% voted because the
Candidate was good and 0.11% and 1.58% of the informants said they
exercised their franchise because their religious leader said so or Head of
Family asked them to vote.
6
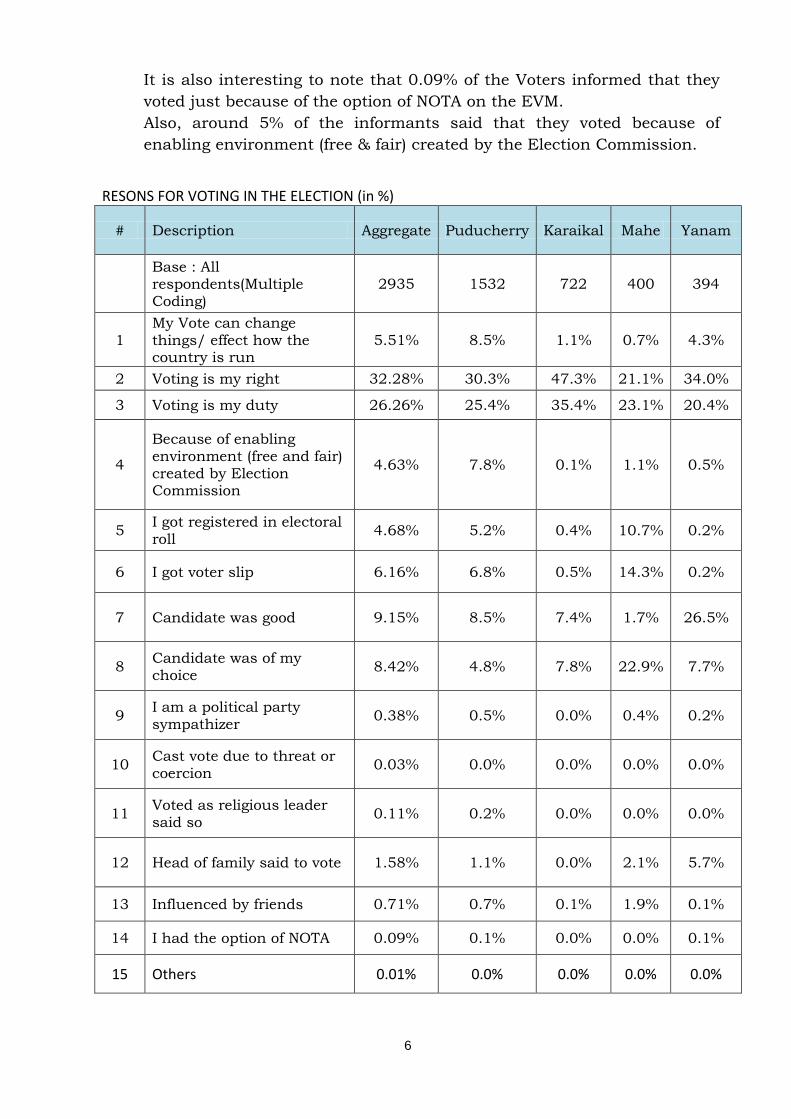
It is also interesting to note that 0.09% of the Voters informed that they
voted just because of the option of NOTA on the EVM.
Also, around 5% of the informants said that they voted because of
enabling environment (free & fair) created by the Election Commission.
RESONS FOR VOTING IN THE ELECTION (in %)
# Description Aggregate Puducherry Karaikal Mahe Yanam
Base : All respondents(Multiple Coding)
2935 1532 722 400 394
1
My Vote can change
things/ effect how the country is run
5.51% 8.5% 1.1% 0.7% 4.3%
2 Voting is my right 32.28% 30.3% 47.3% 21.1% 34.0%
3 Voting is my duty 26.26% 25.4% 35.4% 23.1% 20.4%
4
Because of enabling environment (free and fair) created by Election Commission
4.63% 7.8% 0.1% 1.1% 0.5%
5 I got registered in electoral roll
4.68% 5.2% 0.4% 10.7% 0.2%
6 I got voter slip 6.16% 6.8% 0.5% 14.3% 0.2%
7 Candidate was good 9.15% 8.5% 7.4% 1.7% 26.5%
8 Candidate was of my choice
8.42% 4.8% 7.8% 22.9% 7.7%
9 I am a political party sympathizer
0.38% 0.5% 0.0% 0.4% 0.2%
10 Cast vote due to threat or
coercion 0.03% 0.0% 0.0% 0.0% 0.0%
11 Voted as religious leader said so
0.11% 0.2% 0.0% 0.0% 0.0%
12 Head of family said to vote 1.58% 1.1% 0.0% 2.1% 5.7%
13 Influenced by friends 0.71% 0.7% 0.1% 1.9% 0.1%
14 I had the option of NOTA 0.09% 0.1% 0.0% 0.0% 0.1%
15 Others 0.01% 0.0% 0.0% 0.0% 0.0%
7
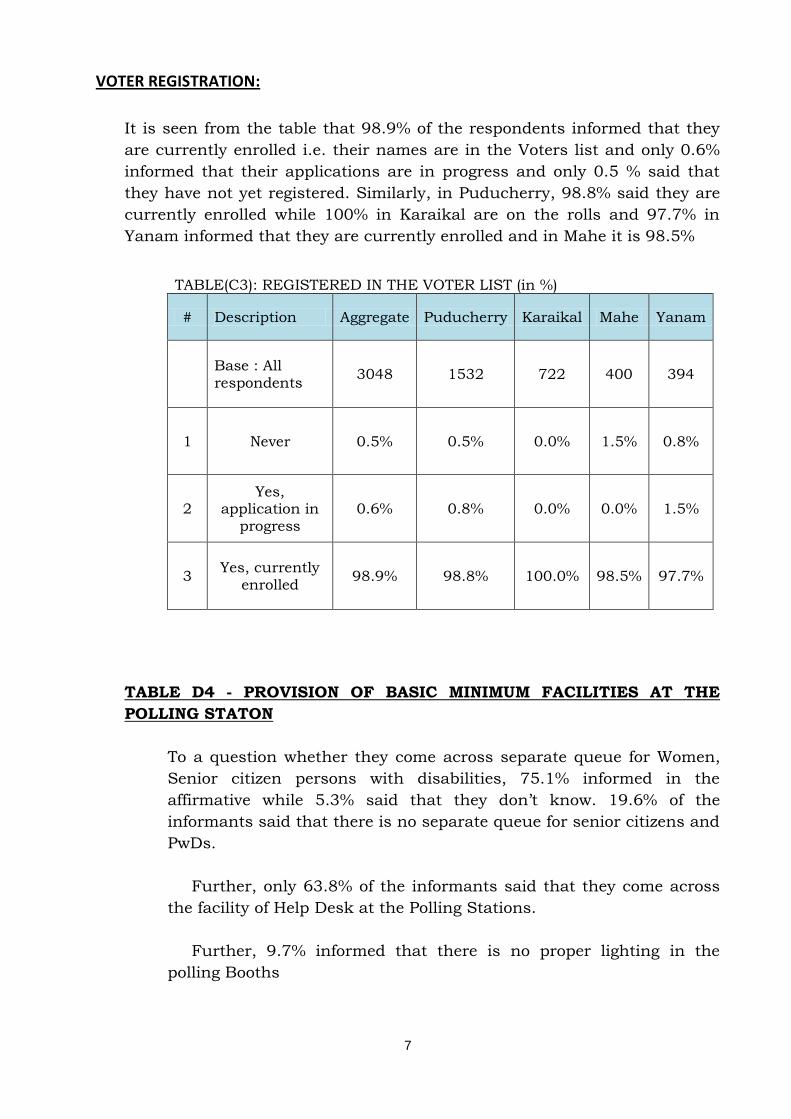
VOTER REGISTRATION:
It is seen from the table that 98.9% of the respondents informed that they
are currently enrolled i.e. their names are in the Voters list and only 0.6%
informed that their applications are in progress and only 0.5 % said that
they have not yet registered. Similarly, in Puducherry, 98.8% said they are
currently enrolled while 100% in Karaikal are on the rolls and 97.7% in
Yanam informed that they are currently enrolled and in Mahe it is 98.5%
TABLE(C3): REGISTERED IN THE VOTER LIST (in %)
# Description Aggregate Puducherry Karaikal Mahe Yanam
Base : All respondents
3048 1532 722 400 394
1 Never 0.5% 0.5% 0.0% 1.5% 0.8%
2 Yes,
application in progress
0.6% 0.8% 0.0% 0.0% 1.5%
3 Yes, currently
enrolled 98.9% 98.8% 100.0% 98.5% 97.7%
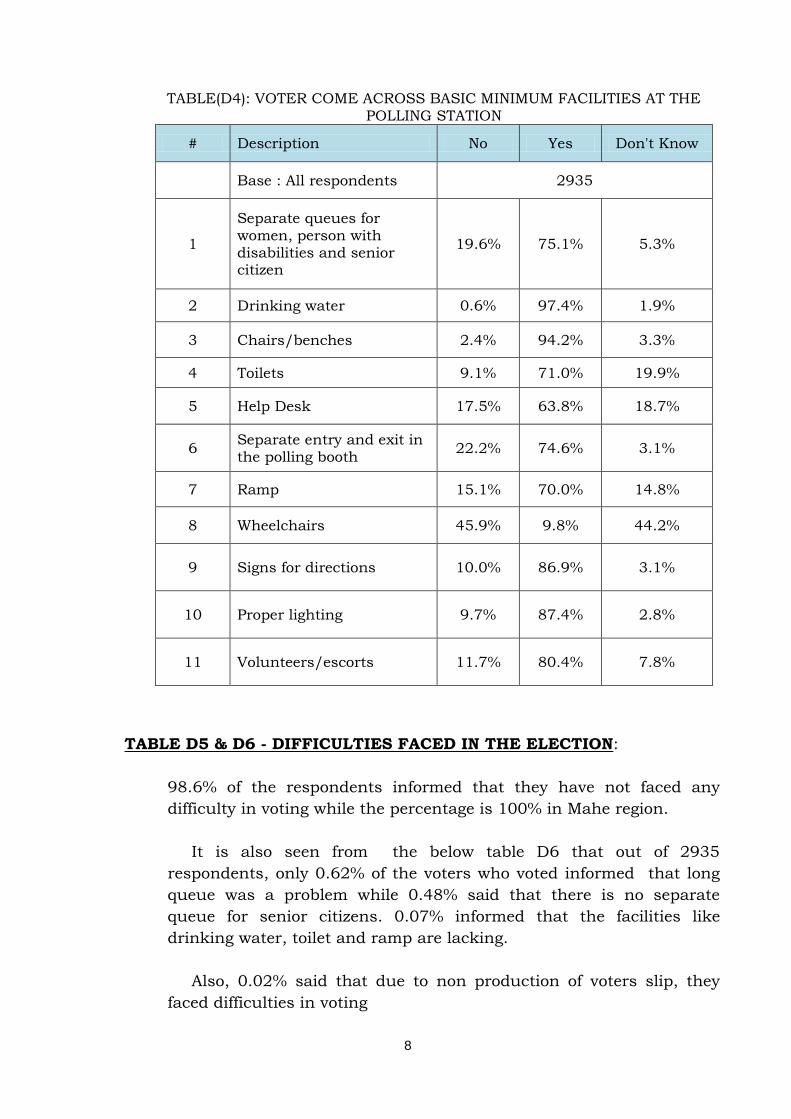
TABLE D4 - PROVISION OF BASIC MINIMUM FACILITIES AT THE
POLLING STATON
To a question whether they come across separate queue for Women,
Senior citizen persons with disabilities, 75.1% informed in the
affirmative while 5.3% said that they don’t know. 19.6% of the
informants said that there is no separate queue for senior citizens and
PwDs.
Further, only 63.8% of the informants said that they come across
the facility of Help Desk at the Polling Stations.
Further, 9.7% informed that there is no proper lighting in the
polling Booths
8
TABLE(D4): VOTER COME ACROSS BASIC MINIMUM FACILITIES AT THE POLLING STATION
# Description No Yes Don't Know
Base : All respondents 2935
1
Separate queues for women, person with disabilities and senior citizen
19.6% 75.1% 5.3%
2 Drinking water 0.6% 97.4% 1.9%
3 Chairs/benches 2.4% 94.2% 3.3%
4 Toilets 9.1% 71.0% 19.9%
5 Help Desk 17.5% 63.8% 18.7%
6 Separate entry and exit in the polling booth
22.2% 74.6% 3.1%
7 Ramp 15.1% 70.0% 14.8%
8 Wheelchairs 45.9% 9.8% 44.2%
9 Signs for directions 10.0% 86.9% 3.1%
10 Proper lighting 9.7% 87.4% 2.8%
11 Volunteers/escorts 11.7% 80.4% 7.8%
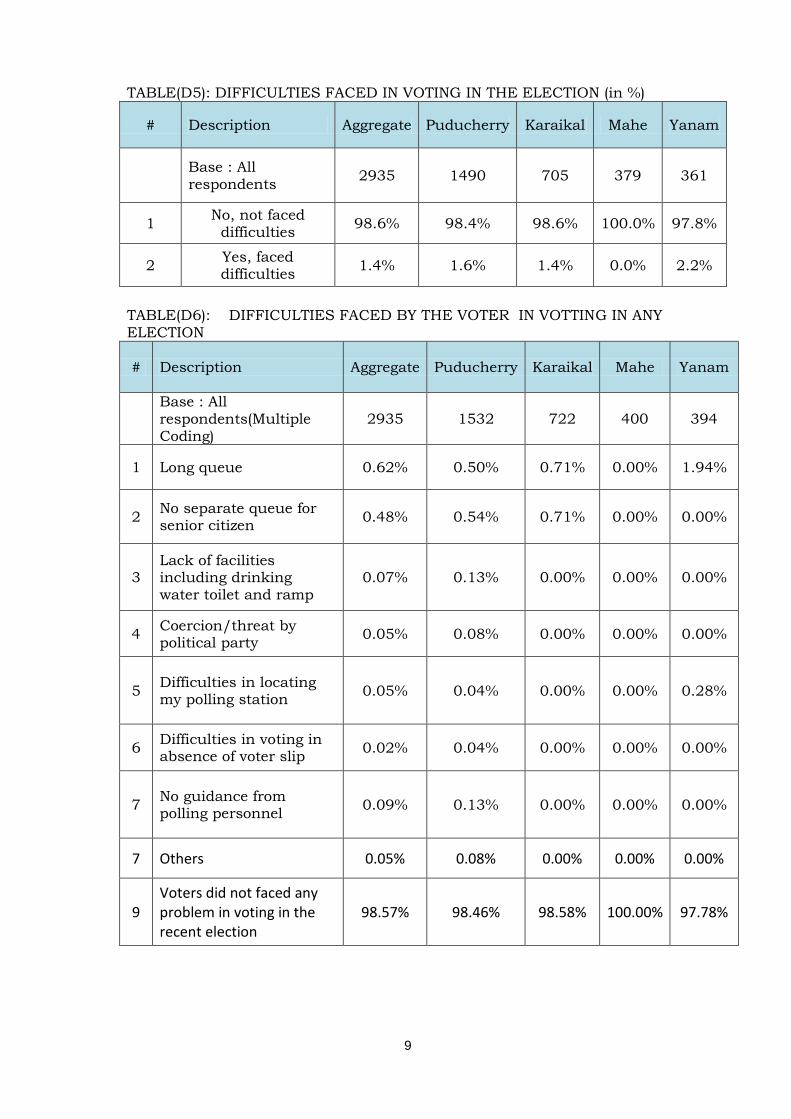
TABLE D5 & D6 - DIFFICULTIES FACED IN THE ELECTION:
98.6% of the respondents informed that they have not faced any
difficulty in voting while the percentage is 100% in Mahe region.
It is also seen from the below table D6 that out of 2935
respondents, only 0.62% of the voters who voted informed that long
queue was a problem while 0.48% said that there is no separate
queue for senior citizens. 0.07% informed that the facilities like
drinking water, toilet and ramp are lacking.
Also, 0.02% said that due to non production of voters slip, they
faced difficulties in voting
9
TABLE(D5): DIFFICULTIES FACED IN VOTING IN THE ELECTION (in %)
# Description Aggregate Puducherry Karaikal Mahe Yanam
Base : All respondents
2935 1490 705 379 361
1 No, not faced
difficulties 98.6% 98.4% 98.6% 100.0% 97.8%
2 Yes, faced difficulties
1.4% 1.6% 1.4% 0.0% 2.2%
TABLE(D6): DIFFICULTIES FACED BY THE VOTER IN VOTTING IN ANY
ELECTION
# Description Aggregate Puducherry Karaikal Mahe Yanam
Base : All respondents(Multiple Coding)
2935 1532 722 400 394
1 Long queue 0.62% 0.50% 0.71% 0.00% 1.94%
2 No separate queue for senior citizen
0.48% 0.54% 0.71% 0.00% 0.00%
3 Lack of facilities including drinking water toilet and ramp
0.07% 0.13% 0.00% 0.00% 0.00%
4 Coercion/threat by political party
0.05% 0.08% 0.00% 0.00% 0.00%
5 Difficulties in locating my polling station
0.05% 0.04% 0.00% 0.00% 0.28%
6 Difficulties in voting in absence of voter slip
0.02% 0.04% 0.00% 0.00% 0.00%
7 No guidance from polling personnel
0.09% 0.13% 0.00% 0.00% 0.00%
7 Others 0.05% 0.08% 0.00% 0.00% 0.00%
9 Voters did not faced any problem in voting in the recent election
98.57% 98.46% 98.58% 100.00% 97.78%
10
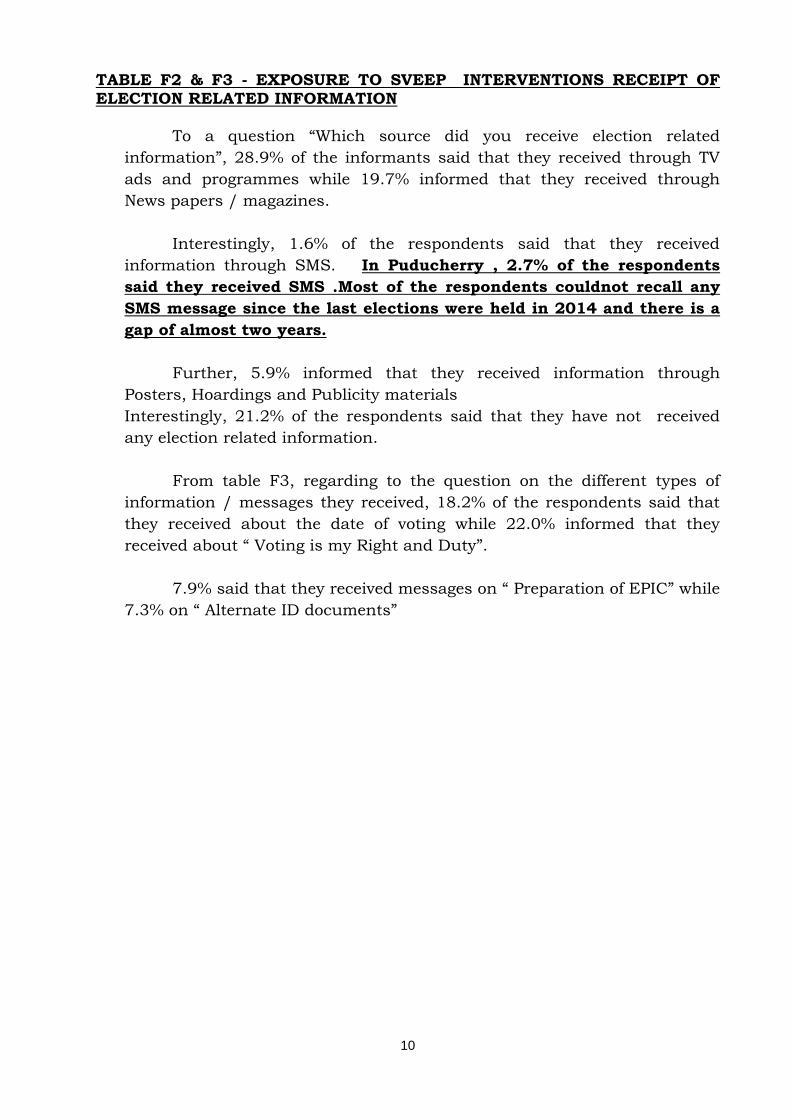
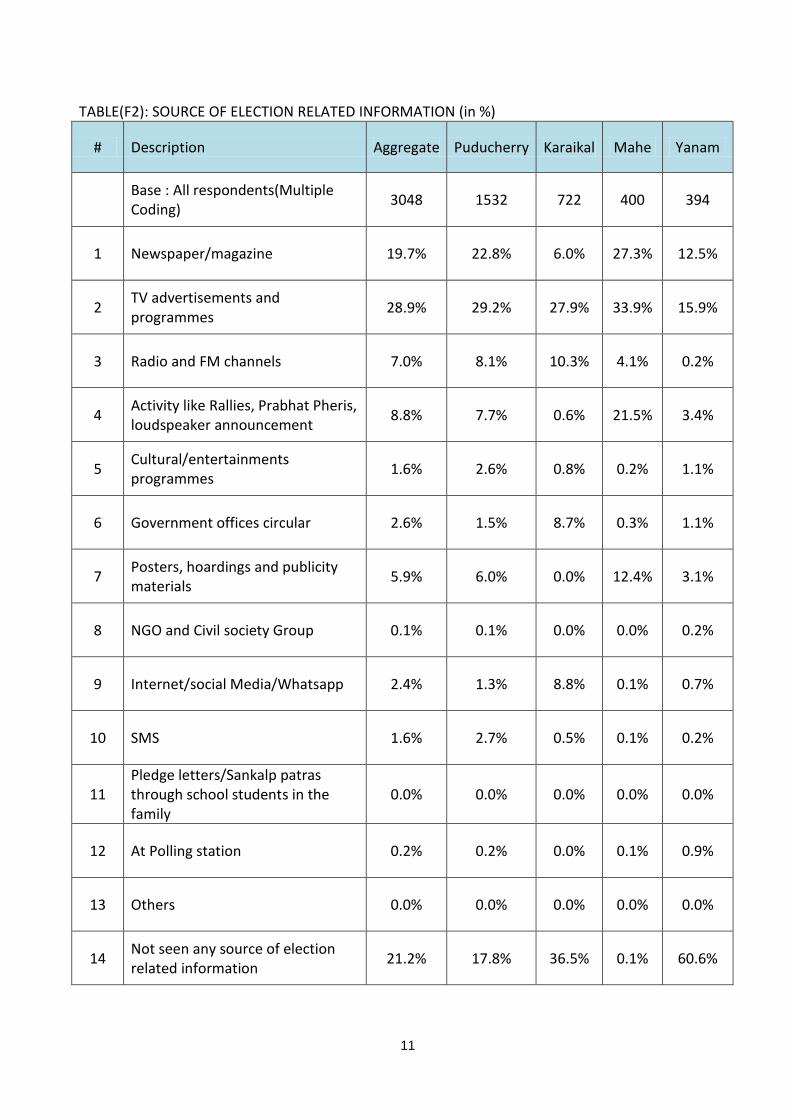
TABLE F2 & F3 - EXPOSURE TO SVEEP INTERVENTIONS RECEIPT OF ELECTION RELATED INFORMATION
To a question “Which source did you receive election related
information”, 28.9% of the informants said that they received through TV
ads and programmes while 19.7% informed that they received through
News papers / magazines.
Interestingly, 1.6% of the respondents said that they received
information through SMS. In Puducherry , 2.7% of the respondents
said they received SMS .Most of the respondents couldnot recall any
SMS message since the last elections were held in 2014 and there is a
gap of almost two years.
Further, 5.9% informed that they received information through
Posters, Hoardings and Publicity materials
Interestingly, 21.2% of the respondents said that they have not received
any election related information.
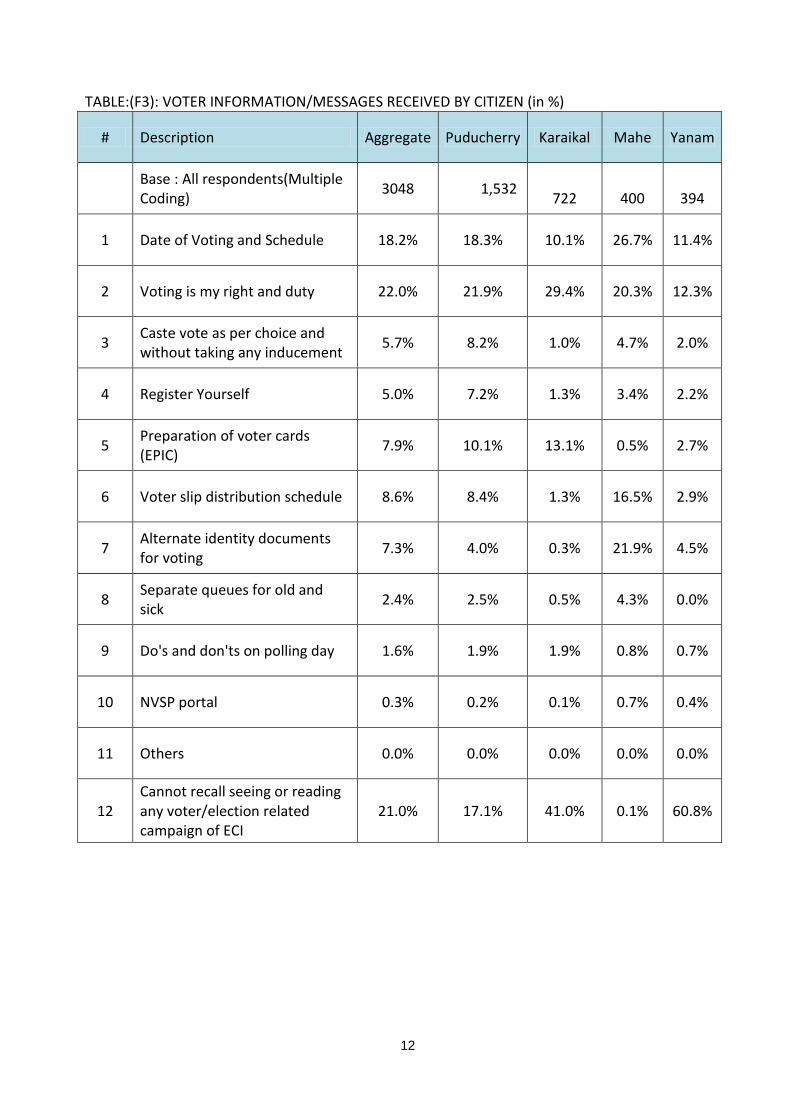
From table F3, regarding to the question on the different types of
information / messages they received, 18.2% of the respondents said that
they received about the date of voting while 22.0% informed that they
received about “ Voting is my Right and Duty”.
7.9% said that they received messages on “ Preparation of EPIC” while
7.3% on “ Alternate ID documents”
11
TABLE(F2): SOURCE OF ELECTION RELATED INFORMATION (in %)
# Description Aggregate Puducherry Karaikal Mahe Yanam
Base : All respondents(Multiple Coding)
3048 1532 722 400 394
1 Newspaper/magazine 19.7% 22.8% 6.0% 27.3% 12.5%
2 TV advertisements and programmes
28.9% 29.2% 27.9% 33.9% 15.9%
3 Radio and FM channels 7.0% 8.1% 10.3% 4.1% 0.2%
4 Activity like Rallies, Prabhat Pheris, loudspeaker announcement
8.8% 7.7% 0.6% 21.5% 3.4%
5 Cultural/entertainments programmes
1.6% 2.6% 0.8% 0.2% 1.1%
6 Government offices circular 2.6% 1.5% 8.7% 0.3% 1.1%
7 Posters, hoardings and publicity materials
5.9% 6.0% 0.0% 12.4% 3.1%
8 NGO and Civil society Group 0.1% 0.1% 0.0% 0.0% 0.2%
9 Internet/social Media/Whatsapp 2.4% 1.3% 8.8% 0.1% 0.7%
10 SMS 1.6% 2.7% 0.5% 0.1% 0.2%
11 Pledge letters/Sankalp patras through school students in the family
0.0% 0.0% 0.0% 0.0% 0.0%
12 At Polling station 0.2% 0.2% 0.0% 0.1% 0.9%
13 Others 0.0% 0.0% 0.0% 0.0% 0.0%
14 Not seen any source of election related information
21.2% 17.8% 36.5% 0.1% 60.6%
12
TABLE:(F3): VOTER INFORMATION/MESSAGES RECEIVED BY CITIZEN (in %)
# Description Aggregate Puducherry Karaikal Mahe Yanam
Base : All respondents(Multiple Coding)
3048 1,532
722
400
394
1 Date of Voting and Schedule 18.2% 18.3% 10.1% 26.7% 11.4%
2 Voting is my right and duty 22.0% 21.9% 29.4% 20.3% 12.3%
3 Caste vote as per choice and without taking any inducement
5.7% 8.2% 1.0% 4.7% 2.0%
4 Register Yourself 5.0% 7.2% 1.3% 3.4% 2.2%
5 Preparation of voter cards (EPIC)
7.9% 10.1% 13.1% 0.5% 2.7%
6 Voter slip distribution schedule 8.6% 8.4% 1.3% 16.5% 2.9%
7 Alternate identity documents for voting
7.3% 4.0% 0.3% 21.9% 4.5%
8 Separate queues for old and sick
2.4% 2.5% 0.5% 4.3% 0.0%
9 Do's and don'ts on polling day 1.6% 1.9% 1.9% 0.8% 0.7%
10 NVSP portal 0.3% 0.2% 0.1% 0.7% 0.4%
11 Others 0.0% 0.0% 0.0% 0.0% 0.0%
12 Cannot recall seeing or reading any voter/election related campaign of ECI
21.0% 17.1% 41.0% 0.1% 60.8%
13
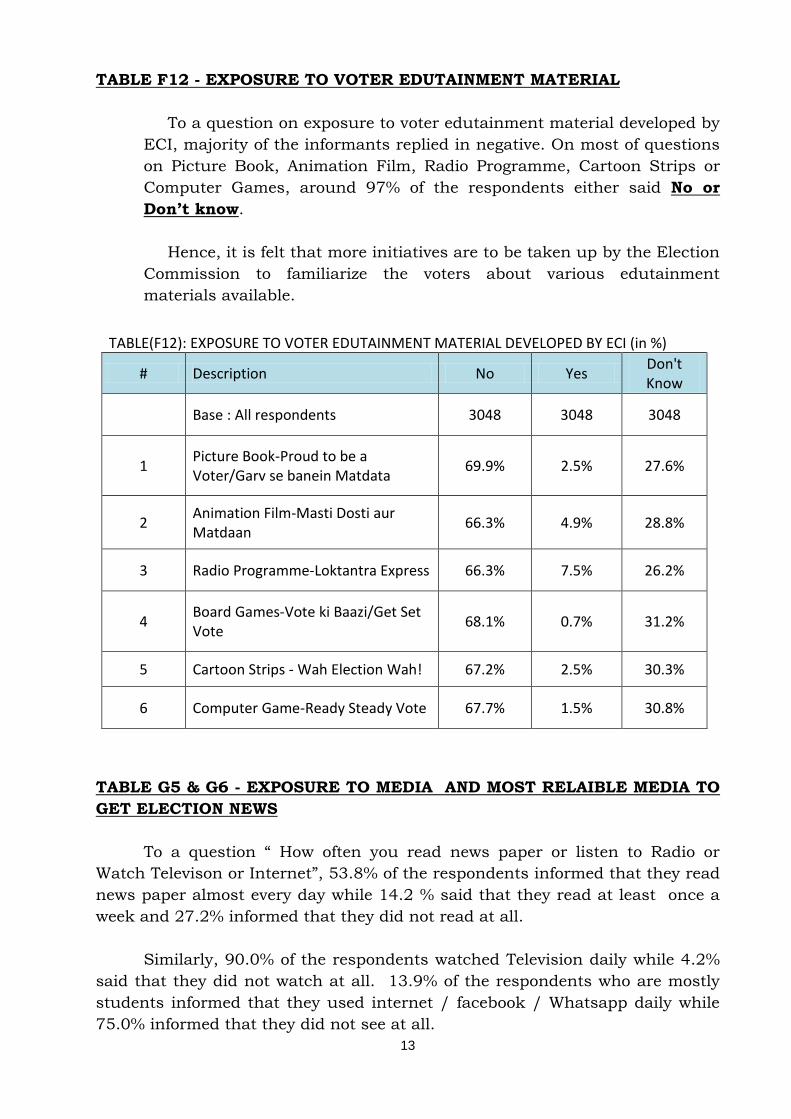
TABLE F12 - EXPOSURE TO VOTER EDUTAINMENT MATERIAL
To a question on exposure to voter edutainment material developed by
ECI, majority of the informants replied in negative. On most of questions
on Picture Book, Animation Film, Radio Programme, Cartoon Strips or
Computer Games, around 97% of the respondents either said No or
Don’t know.
Hence, it is felt that more initiatives are to be taken up by the Election
Commission to familiarize the voters about various edutainment
materials available.
TABLE(F12): EXPOSURE TO VOTER EDUTAINMENT MATERIAL DEVELOPED BY ECI (in %)
# Description No Yes Don't Know
Base : All respondents 3048 3048 3048
1 Picture Book-Proud to be a Voter/Garv se banein Matdata
69.9% 2.5% 27.6%
2 Animation Film-Masti Dosti aur Matdaan
66.3% 4.9% 28.8%
3 Radio Programme-Loktantra Express 66.3% 7.5% 26.2%
4 Board Games-Vote ki Baazi/Get Set Vote
68.1% 0.7% 31.2%
5 Cartoon Strips - Wah Election Wah! 67.2% 2.5% 30.3%
6 Computer Game-Ready Steady Vote 67.7% 1.5% 30.8%
TABLE G5 & G6 - EXPOSURE TO MEDIA AND MOST RELAIBLE MEDIA TO
GET ELECTION NEWS
To a question “ How often you read news paper or listen to Radio or
Watch Televison or Internet”, 53.8% of the respondents informed that they read
news paper almost every day while 14.2 % said that they read at least once a
week and 27.2% informed that they did not read at all.
Similarly, 90.0% of the respondents watched Television daily while 4.2%
said that they did not watch at all. 13.9% of the respondents who are mostly
students informed that they used internet / facebook / Whatsapp daily while
75.0% informed that they did not see at all.
14
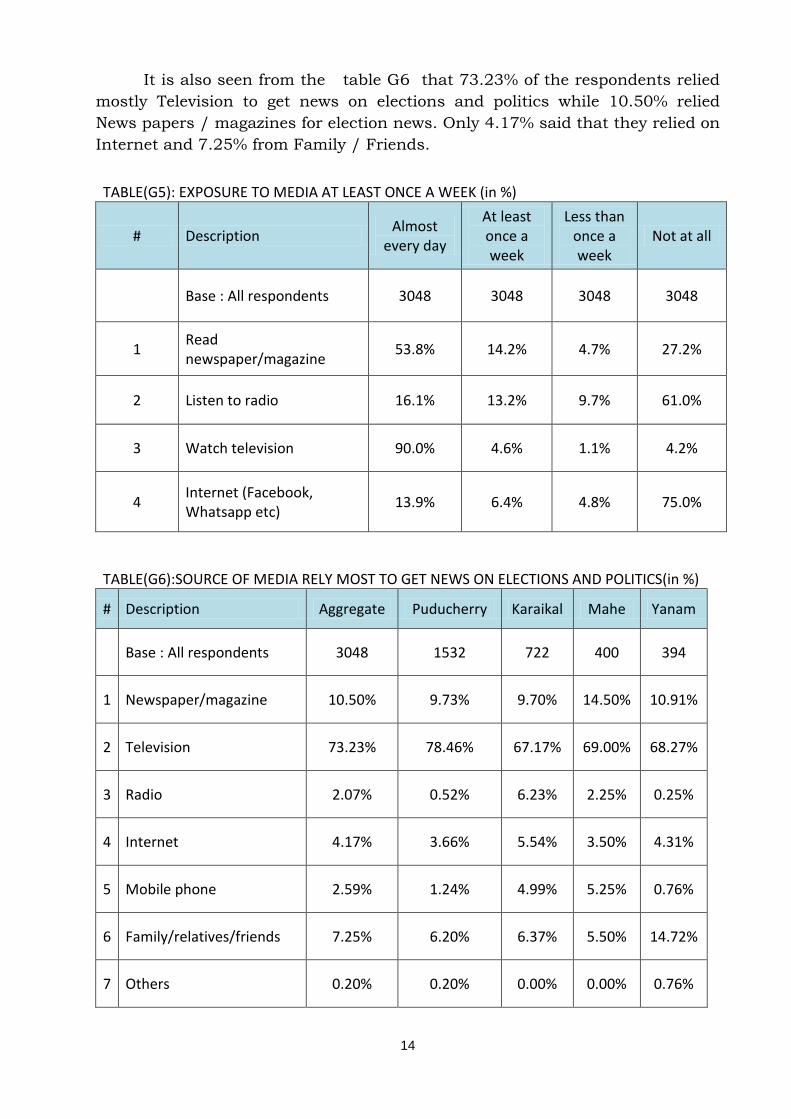
It is also seen from the table G6 that 73.23% of the respondents relied
mostly Television to get news on elections and politics while 10.50% relied
News papers / magazines for election news. Only 4.17% said that they relied on
Internet and 7.25% from Family / Friends.
TABLE(G5): EXPOSURE TO MEDIA AT LEAST ONCE A WEEK (in %)
# Description Almost
every day
At least once a week
Less than once a week
Not at all
Base : All respondents 3048 3048 3048 3048
1 Read newspaper/magazine
53.8% 14.2% 4.7% 27.2%
2 Listen to radio 16.1% 13.2% 9.7% 61.0%
3 Watch television 90.0% 4.6% 1.1% 4.2%
4 Internet (Facebook, Whatsapp etc)
13.9% 6.4% 4.8% 75.0%
TABLE(G6):SOURCE OF MEDIA RELY MOST TO GET NEWS ON ELECTIONS AND POLITICS(in %)
# Description Aggregate Puducherry Karaikal Mahe Yanam
Base : All respondents 3048 1532 722 400 394
1 Newspaper/magazine 10.50% 9.73% 9.70% 14.50% 10.91%
2 Television 73.23% 78.46% 67.17% 69.00% 68.27%
3 Radio 2.07% 0.52% 6.23% 2.25% 0.25%
4 Internet 4.17% 3.66% 5.54% 3.50% 4.31%
5 Mobile phone 2.59% 1.24% 4.99% 5.25% 0.76%
6 Family/relatives/friends 7.25% 6.20% 6.37% 5.50% 14.72%
7 Others 0.20% 0.20% 0.00% 0.00% 0.76%
15
III. Strategy
i. Based on the Base line survey and on the basis of the voter turnout analysis the voters segment which requires targeted intervention are
identified as follows: a) Urban youth
b) Student youth
c) Non-student youth
d) Urban migrant workers
e) Persons occupying high profile jobs
f) Person with Disabilities
g) Senior citizens
h) Corporate workers
i) Transgender
j) Women
k) Youth
ii. Plan, design and implement awareness programmes tailor made to each
of the identified apathetic segments. Efforts will be made to physically involve the targeted people in the awareness campaign in association
with the partner agencies.
Student youth –
Boards on voting percentage, ethical voting will be placed in the
campus of all the colleges.
Campaign materials will be sent to the colleges to be shown to the
students
Education Classes / materials to students
SMS to all First Time Voters
Letters to all First Time Voters
Interview of college students
Launch of Election Anthem
Institution of Awards to the Campus Ambassadors and the Best
Performing Colleges
Certificate of Appreciation for all student volunteers
Creating Whats App group of college students to disseminate
awareness materials, inviting young voters to the Facebook page of
CEO and initiating discussions in Social Media Networks.
Use of intra-college information dissemination systems like FM radio,
intranet, social media groups to spread awareness information
Programme
16
Programme for Non-student Youth Group – “FRIENDS”
Under Nehru Yuva Kendra Sangathan, numerous competitions will
be conducted. The volunteers of NYKS will work under the banner
“FRIENDS” to create awareness at grassroot level. The events planned
for student group will also be extended to non-student youth group.
Urban youth -
Organising Sports,
Competitions
Cultural programmes etc.
Partner agencies viz. NYK, NSS, NCC, NGOs and other Youth
organisations.
Persons occupying high profile jobs and upper strata of the Society –
Electronic media insertions
Posters
Banners
Handbills
Playing awareness audio jingles at Traffic Signals and awareness
programmes conducted through partner agencies.
Migrant voters – print & electronic media insertions, posters, banners,
handbills, cultural programmes and awareness programmes conducted through partner agencies corporate ....
Women –
Encouraging and motivating women through Self Help Groups
Educative classes on informed voting
Special television shows for women voters
Traditional mode of motivation through pamphlets, posters etc.
Image boosting through advertisement videos
17
Corporate workers –
Organising Corporate voters week,
Corporate specific special registration camps
Voters awareness campaign
Transgender –
Sensitisation through workshop
School Students –
Messages in School Assembly sessions
Short film and videos in School Assembly sessions
SankalpPatra- will be distributed to the school students starting from 6th std. to 11th std. to invite parents to cast their votes. The
students will return the resolution after confirming the casting of votes by their parents.
Co-curricular materials – will be distributed to school students, the future voters to improve their civic knowledge. It will be made a part of their curriculum.
Compulsory classes for NSS students on voting SCHOOL STUDENTS
Messages in School Assembly sessions
Short film and videos in School Assembly sessions
Senior Citizens –
To encourage the senior citizens to come out for voting, the following activities are planned.
Debate
Walkathon
Patti Mandram
Pattumandram
Traditional modes of information dissemination through pamphlets, videos
Poll day help for senior citizens, if required
Co-ordinating with the Homes/ Associations for the aged
Persons with Disabilities – Facilitati Enrolment
Preparation and collection of polling station wise differently-abled
people details. The details include the EPIC card number, the type of disability, the kind of assistancerequired during and before the
polling day and telephone number
18
Use of a dedicated phone number coupled with 1950to facilitate
on call enrolment.
Indication of differently-abled voters in the electoral roll
Braille enabled voter slips
Volunteers to be deployed to facilitate enrollment in orphanages
and homes
During the Awareness Phase
Preparation of volunteers tagging software called as “Enable
Pondy by Young Pondy” to offer a basket of services to the
differently-abled people by the volunteers including college
students, Red Cross Members and NGOs.
Conduct of cultural programmes (constituency-wise) in a phased
manner to increase the morale and awareness level of the
differently-abled voters.
Conduct of Differently abled Voters Day
Awareness messages in the form of posters and stickers to be
Braille enabled.
Video awareness messages shall be prepared with sign language
interpretation.
Motivational SMS to all the differently-abled voters every week.
Constitution of differently-abled activist groups to act as volunteers
to monitor the implementation of initiatives at the Polling Station
level.
Confidence Building Measures (CBM) by distributing awareness
material through volunteers and AWWs.
Polling Day Arrangements
Provision of permanent sturdy ramp with handrails ( 3” width,
gradient of 1:12 to 1:10)
Wheelchair
Wide non-slippery path.
Separate queue for senior citizens and differently abled people
Seating arrangements inside the Polling Station.
Ensuring 3 feet wide doorways at the entry and exit points
Providing adequate space inside the Poll Station.
19
Desk and counters at wheel chair accessible height
Ballot sheet and EVMs should be in Braille
Braille Enabled Voters Slips
The table where the EVMs placed shall be of adjustable height
To provide amplifiers for hearing impaired, sign language
interpreters and trained volunteers on the Poll Day
Drinking water facility at accessible height
Thank you cards
Easily accessible rest rooms.
Specific Initiatives
Sensitization of BLOs and all election facilities on the importance and sensitivity of addressing the needs of the differently-abled voters
Linking of the website of the Election Department with that of the Social Welfare Department to facilitate data sharing
Common programmes for all segments –
Print & electronic media insertions Posters, stickers, erection of banners at vantage points
Issue of handbills Auto rickshaw announcements
Cycle and motorcycle rally Signature campaign Cultural programmes
Playing awareness audio jingles at Traffic Signals Regional specific awareness programmes conducted in association
with partner agencies. iii. Educating each segment by implementing the planned interventions.
iv. Creating awareness with special emphasizes on informed and inducement free voting.
v. Creating awareness about NOTA
vi. Creating awareness on EVM and VVPAT vii. Monitoring the outcome by obtaining continuous feed back through the
implementing agencies and introduce corrective action. viii. Disabled friendly booths
20
IV. Planning and Implementation
a. Team formation at District and State Headquarters
State SVEEP core committee Chairman - Chief Electoral Officer
Member Secretary - Deputy Chief Electoral Officer Members - 1) Joint Chief Electoral Officer
2) District Election Officer, Puducherry
3) District Election Officer, Karaikal 4) Coordinator (SVEEP)
5) State Nodal Officer (SVEEP) 6) Superintendent, SVEEP Cell
7) District Nodal Officer, Puducherry
8) District Nodal Officer, Karaikal 9) Representatives of Partner Agencies
District SVEEP core committee, Puducherry
Chairman - District Election Officer Member Secretary - District Nodal Officer Members - 1) Co-ordinator SVEEP
2) Regional Administrator, Mahe 3) Regional Administrator, Yanam
4) Returning Officers - I to VIII 5) Assistant Returning Officers – I to VIII
District SVEEP core committee, Karaikal Chairman - District Election Officer
Member Secretary - District Nodal Officer Members - 1) Returning Officers - IX & X
2) Assistant Returning Officers – IX & X b. Building Partnerships
State/District Level
1. Colleges/Educational Institutions – Appointment of Nodal Officers and
Campus Ambassadors.
2. Government Departments –
Labour Department
Social Welfare Department
Health Department
Local Administration Department
Health and Family Welfare Services 3. National Service Scheme (NSS)
4. National Cadet Corps 5. Nehru Yuvak Kendra (NYK) 6. Media Houses
21
Doordarshan & AIR
Private FM channels
Private cable TV channels
7. CSO
Lions Club
Pudu United Charitable Trust
Rotary Club
Junior Chambers
8. Non-Governmental Organisations 9. Department of Field Publicity
10. Municipalities / Local bodies 11. Public Sector Banks 12. Post Office
Continuous efforts will be made to identify new partner agencies while at
the same time strengthening the relationship with the existing partner agencies to ensure effective delivery of voter awareness messages and programmes
aimed at the targeted segment.
CEO and DEO will mobilise and brief partner agencies and provide them
requisite resources and outreach material at state level and district level respectively.
A. OUTREACH ACTIVITIES
I) Facilitating Easy Voter Registration
a) Setting-up of Your Voice Centres at Colleges
b) Floating mobile registration vans c) Special registrations camps for Colleges
d) Special registrations camps for corporate houses e) Special registration camps for orphanages f) Special registration camps for PwD, Senior Citizens and Transgenders
g) Sensitising people of the importance of registration as voters through various electronic and print media apart from conduct of special events
h) Continuous training to BLOs to help people avail hassle free registration.
i) Exhibition of Electoral roll at registration counters to help search voter’s
names j) Creating awareness and encouraging online registration of voters k) Sensitizing eligible voters on the importance of becoming a registered
voter
II) Facilitating User Friendly Voting Experience a) Floating of Solar Powered Modal Mobile Polling Stations on wheels b) Familiarising people with the EVM operations and VVPAT functions
c) Popularize the concept of NOTA d) Ensuring availability of basic minimum facilities in all polling stations
e) Steps to minimise waiting time in queue at polling stations
22
f) Providing separate queue for women, senior citizens, PwD and transgenders.
g) Setting up of all women polling stations h) Distribution of voters slip
i) SMS reminders on poll day j) Setting up of Model polling stations k) Roping in Common Service Centres for dissemination of election related
information l) Identification of PwD voters in respect of each polling stations and
provide special arrangements for them to vote viz., Wheel chairs, ramps,
volunteer assistance to choose through mobile app etc. m) Maximising the percentage of postal vote by educating and assisting
service voters and officials on elections duty n) Setting up of information counters at each polling stations to help
locate polling stations, name search in electoral roll, distribution of undistributed voters slip
o) Continuous voter awareness programme to educate people of the importance of informed and ethical voting practices.
B. OUTREACH MATERIAL DEVELOPMENT The contents for the SVEEP awareness campaign shall be prepared under the
supervision of the State SVEEP Core Committee in association with District SVEEP Core Committee and other partner agencies.
Material and content development for various voter awareness
programmes shall initially be developed based on the approved material
available in the ECI website. Production of regional specific variants of content materials will also be carried out with the approval of the ECI.
The Human Resource for spearheading the message of the SVEEP awareness campaign will include the State SVEEP Core Committee and the
District SVEEP Core Committee associating with Partner Agencies.
Union Territory of Puducherry does not have any local icons on its own.
Yet, as the geopolitical identity of Puducherry synchronizes with the State of Tamil Nadu, the awareness material prepared by the Tamil Nadu State with
their State icons can be used in Puducherry and Karaikal district as well. However, in respect of Mahe and Yanam State icons of Kerala and Andhra Pradesh will be used for creating awareness.
As per the KBP survey it is found that local TV advt./
programmes/newspapers/magazines are the prime media on which people rely
on for election related information. Therefore, the media and communication are planned as follows:
1. Print medium: Newspaper ads, Posters, Handbills. 2. Electronic media: AIR/Doordarshan, Private FM Radio stations, local
Cable TV networks, Police Department (for playing jingles at Traffic Signals).
23
3. Outdoor: Placards, Banners, Ads on PRTC buses, Private Auto Rickshaws, Banners at Traffic signals, Railway stations, Bus Stand and other
strategic public gathering points. 4. SMS & Caller tunes: BSNL, Airtel, Vodafone. etc.
5. Cultural programmes, rallies & talk shows etc. 6. CEO/DEO will send pledge letters and invitation letters to the voters
through print and electronic media.
Electoral literacy programmes will be conducted through the BLOs, Nodal
Officers, Campus Ambassadors and Representatives of Partner Agencies by providing them proper training.
Physical Events and Activities: Voter awareness programmes viz., Bicycle
and Motor cycle rallies, talk shows, debates, human chains, signature campaigns, debates, quiz, rallies, meetings, street plays etc. etc. will be
arranged in association with the partner agencies. C. VOTERS’ FACILITATION
Exhibition of Electoral roll at polling booths to help search voter’s names
SMS reminder on pre poll day and on poll day
Online registration
Issue of e-Voter slips
Polling station search by Google map
Ensuring 100% Basic Minimum Facilities
Ensuring the polling stations are differently abled friendly
Provision of ramp at all polling stations
Provision of Toilet Facilities
Provision of Drinking water facilities
Sunshade
Proper lighting arrangements at the Polling Stations.
Separate queue for the aged and people with disabilities
Separate queue for male and female voters.
Security persons to maintain law and order.
Flags to mark 100 mts and 200 mts.
Ensuring identification of Women Nursing area in Polling Stations
Provision of seating arrangements for senior citizens in Polling Stations
Sending Thank You SMS after casting vote
Sending Thank You Cards for having cast the vote
TV monitors for Ethical Voting
Volunteers to be deployed
Status of voting percentage messages to voter
Setting up of Control Room/ Helpline
SMS reminder on pre poll day and on poll day
On poll day, mike announcements in the afternoon session in low voter
turnout polling station circle, reminding people to vote
Setting up of Voter Facilitation Centres at all polling stations
24
Queue strength intimation
Auto rickshaw speaker announcements in the area covering low voter
turnout polling stations
Voter Facilitation Centres
Display of Voter list
Voter Name Search facility
Issue of undistributed Voter slips
Assist voters to locate their polling stations
Familiarise voters of the voting formalities
Interactive voter education
Polling station specific facilitation initiatives planned
Provision of ramp at all polling stations
Toilet Facilities
Drinking water facilities
Sunshade
Proper lighting arrangements at the polling stations.
Separate queue for the aged and people with disabilities
Separate queue for male and female voters.
Security persons to maintain law and order.
Flags to mark 100 mts and 200 mts.
Voter Slip: Voters slip will be distributed to the voters a week before the poll day through the BLOs concerned.
Postal Ballot
In order to ensure 100% casting of postal ballot by the persons on election duty, it is proposed to capture the details of EPIC and mobile number of all Government servants on duty.
The database will be created by the Head of the Office/Department where the person is drafted for election duty. In case of Police personnel who are also
considered to be the persons on election duty, the database will be maintained by the SSP or the other officer who will be appointed by the SSP for the above purpose.
The EPIC number captured will be used to populate the Assembly constituency to which the person sent on duty as a voter.
During the first phase of training Form 12 will be issued to polling
officials. In the second stage, when the officials report for training after the postal ballots are printed each of them will be issued with postal ballots. A
separate software application will be developed which will capture the details of issue of postal ballot paper. This fact can be viewed by the Returning Officer concerned. The software package will also capture the data of the officials who
submit the postal ballot. The Returning Officer concerned will come to know of the number of officials from whom he will have to obtain the postal ballots from
25
each training centre. Accordingly, he will depute a representative to collect the postal ballots from the other Returning officers.
A similar exercise will be carried out by the police. The Police Department will be provided with the software application to track down the Police on poll
duty at the polling stations. A software application will be provided to the police to compile the data of police officials who were issued with postal ballots and those who have submitted the postal ballots. The Returning officer will be
provided with the window in the software application to access the details and depute an official to collect the Postal ballots of police officials from the respective Superintendent of Police.
As for Drivers and cleaners they will be on duty at the Office of the Chief Electoral Officer, District Election Officer and Returning Officers. Here to, the
software application will be employed to capture the data of issue of postal ballots and receipt of the same.
D. MONITORING & REVIEW
As per the directions of ECI, SVEEP programmes organised at the state
and district level will be constantly monitored by the Elections Department to evaluate its impact on the voters. The implementation of SVEEP programme will also be reviewed from time to time by the CEO and the DEOs for suitable
interventions.
E. EVALUATION & DOCUMENTATION
a) The DEOs shall submit a report to CEO within a month of closing of polls as regards the impact of the SVEEP programmes in relation to the set objectives.
The reports shall focus on the following points:
i) Analysis of registration ahead of polls ii) Analysis of comparative turnout among women, urban voters and
youth iii) Analysis of the turnout of the identified excluded groups/
communities at specific polling stations
iv) Analysis of comparative turnout in the identified 10% of the lowest turnout polling stations
b) The CEO shall submit a documented report to the Commission within two months of closure of polls focusing on the points enumerated above in respect
of the entire state.