Embed Size (px)
Citation preview
COMPREHENSIVE ANNUAL FINANCIAL REPORT FOR YEAR ENDED DECEMBER 31, 2011
Chairman’s Letter............ . . . . . . . . . . . . . . . . . . . . . . . . . . . . . . . . . . . . . . . . . . . . . . . . . . . . . . . . . . . . . . . . . . . . . . . . . . . .
Board of Commissioners . . . . . . . . . . . . . . . . . . . . . . . . . . . . . . . . . . . . . . . . . . . . . . . . . . . . . . . . . . . . . . . . . . . . . . . . . . . . .
Organizational Chart . . . . . . . . . . . . . . . . .. . . . . . . . . . . . . . . . . . . . . . . . . . . . . . . . . . . . . . . . . . . . . . . . . . . . . . . . . . . . . . . . .
Officers and Executive Staff. . . . . . . . . . . . . . . . . . . . . . . . . . . . . . . . . . . . . . . . . . . . . . . . . . . . . . . . . . . . . . . . . . . . . . . . . .
Facilities. . . . . . . . . . . . . . . . . . . . . . . . . . . . . . . . . . . . . . . . . . . . . . . . . . . . . . . . . . . . . . . . . . . . . . . . . . . . . . . . . . . . . . . . . . . . . . . . .
Report of the Chief Executive Officer. . . . . . . . . . . . . . . . . . . . . . . . . . . . . . . . . . . . . . . . . . . . . . . . . . . . . . . . . . . . . .Letter of Transmittal... . . . . . . . . . . . . . . . . . . . . . . . . . . . . . . . . . . . . . . . . . . . . . . . . . . . . . . . . . . . . . . . . . . . . . . . . . . . . . .
346679
15
FINANCIAL SECTION
INTRODUCTORY SECTION
STATISTICAL SECTION
Independent Auditor’s Report . . . . . . . . . . . . . . . . . . . . . . . . . . . . . . . . . . . . . . . . . . . . . . . . . . . . . . . . . . . . . . . . . . . . . .
Management’s Discussion and Analysis . . . . . . . . . . . . . . . . . . . . . . . . . . . . . . . . . . . . . . . . . . . . . . . . . . . . . . . . . . .
Combined Financial Statements: Combined Statements of Net Assets.. . . . . . . . . . . . . . . . . . . . . . . . . . . . . . . . . . . . . . . . . . . . . . . . . . . . . . . . . . . Combined Statements of Revenues, Expenses and Changes in Net Assets. . . . . . . . . . . . . . . Combined Statements of Cash Flows . . . . . . . . . . . . . . . . . . . . . . . . . . . . . . . . . . . . . . . . . . . . . . . . . . . . . . . . . .
Notes to Combined Financial Statements . . . . . . . . . . . . . . . . . . . . . . . . . . . . . . . . . . . . . . . . . . . . . . . . . . . .
Required Supplementary Information (Unaudited): Schedule of Funding Progress for Health Benefits Plan. . . . . . . . . . . . . . . . . . . . . . . . . . . . . . . . . . . . .
Notes to Required Supplementary Information. . . . . . . . . . . . . . . . . . . . . . . . . . . . . . . . . . . . . . . . . . . . . .
Supplementary Information: Combined Supplemental Schedule of Net Asset Information by Fund. . . . . . . . . . . . . . . . . . .
Combined Supplemental Schedule of Changes in Fund Net Assets Information by Fund. . . . . . . . . . . . . . . . . . . . . . . . . . . . . . . . . . . . . . . . . . . . . . . . . . .
Supplemental Schedule of Net Asset Information for Bond and Project Funds. . . . . . . . . Supplemental Schedule of Changes in Net Asset Information for Bond and Project Funds. . . . . . . . . . . . . . . . . . . . . . . . . . . . . . . . . . . . . . . . . . . . . . . . . . . . . . . . . . . . . . . . . . .
2123
32343536
7777
78
8081
82
Prepared by the Office of the Chief Financial Officer
Net Assets. . . . . . . . . . . . . . . . . . . . . . . . . . . . . . . . . . . . . . . . . .
Changes in Net Assets. . . . . . . . . . . . . . . . . . . . . . . . . .
Major Revenues By Source. . . . . . . . . . . . . . . . . . . . .
Toll Revenue By Bridge.. . . . . . . . . . . . . . . . . . . . . . . .
Bridge Cash Toll Rates. . . . . . . . . . . . . . . . . . . . . . . . ..
Bridge Traffic By Vehicle Classification .. . . . . .
Bridge Traffic By Bridge.. . . . . . . . . . . . . . . . . . . . . . . .
PATCO Transit System Operating Revenues....PATCO Passenger Fares . . . . . . . . . . . . . . . . . . . . . . . .
PATCO Transit System Ridership. . . . . . . . . . . . .
88888889909091919192
Debt Service Coverage. . . . . . . . . . . . . . . . . .
Funded Debt . . . . . . . . . . . . . . . . . . . . . . . . . . . .
Ratio Of Debt Per Customer...... . . . . .Demographic and Economic Data . . .
Bridge Operating Revenues. . . . . . . . . . . .
General Expenses By Function. . . . . . . .
Operating Statistics . . . . . . . . . . . . . . . . . . . . . .
Full Time Authority Employees. . . . . . .Capital Expenditures. . . . . . . . . . . . . . . . . . . .
Bridge and PATCO Operations. . . . . . .
85858686868787878787
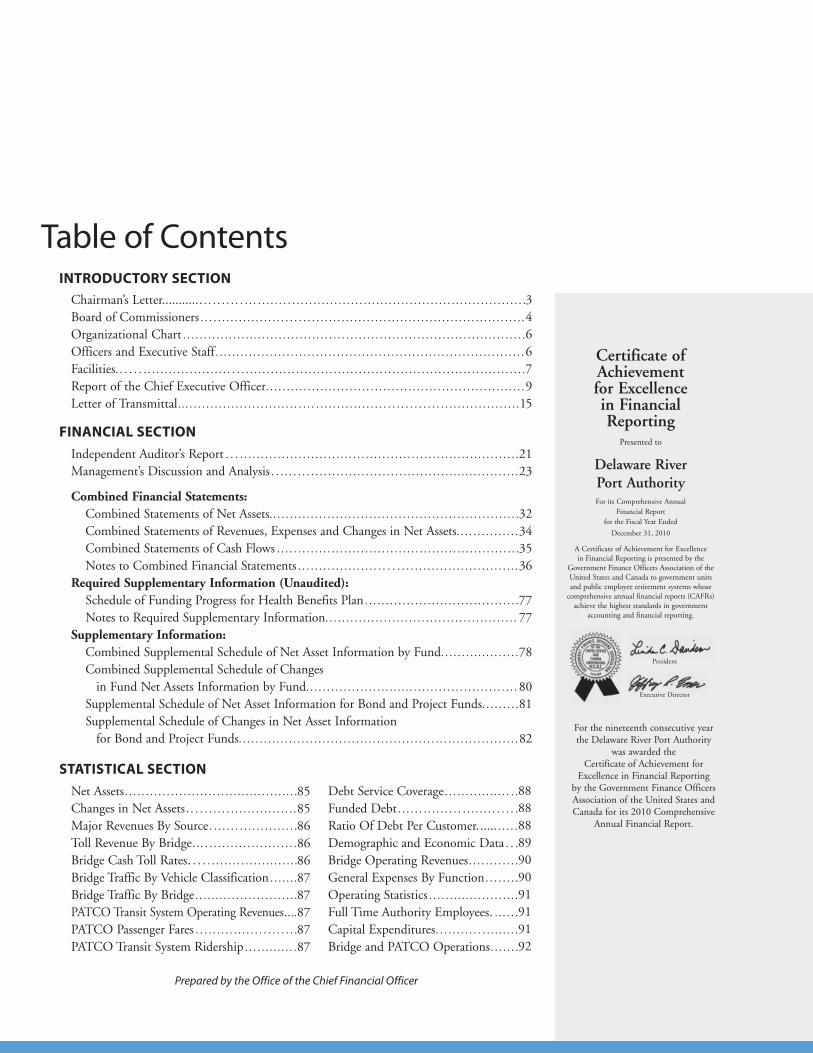
Table of Contents
Certificate ofAchievementfor Excellencein FinancialReporting
Presented to
Delaware River Port AuthorityFor its Comprehensive Annual
Financial Reportfor the Fiscal Year Ended
December 31, 2010
A Certificate of Achievement for Excellencein Financial Reporting is presented by the
Government Finance Officers Association of the United States and Canada to government units and public employee retirement systems whose
comprehensive annual financial reports (CAFRs) achieve the highest standards in government
accounting and financial reporting.
For the nineteenth consecutive year the Delaware River Port Authority
was awarded the Certificate of Achievement for
Excellence in Financial Reportingby the Government Finance Officers Association of the United States and Canada for its 2010 Comprehensive
Annual Financial Report.
President
Executive Director
3DRPA 2011 ANNUAL REPORT
INTRODUCTORY SECTION
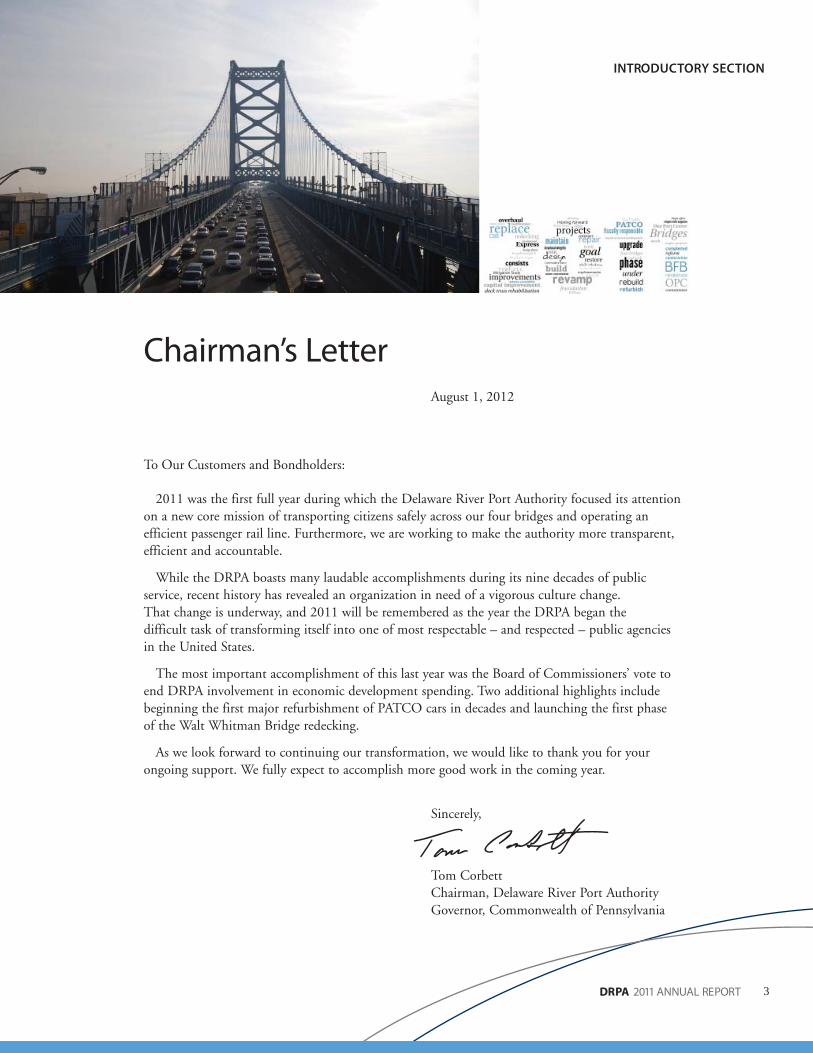
Chairman’s Letter August 1, 2012
To Our Customers and Bondholders:
2011 was the first full year during which the Delaware River Port Authority focused its attention on a new core mission of transporting citizens safely across our four bridges and operating an efficient passenger rail line. Furthermore, we are working to make the authority more transparent, efficient and accountable.
While the DRPA boasts many laudable accomplishments during its nine decades of public service, recent history has revealed an organization in need of a vigorous culture change. That change is underway, and 2011 will be remembered as the year the DRPA began the difficult task of transforming itself into one of most respectable – and respected – public agencies in the United States.
The most important accomplishment of this last year was the Board of Commissioners’ vote to end DRPA involvement in economic development spending. Two additional highlights include beginning the first major refurbishment of PATCO cars in decades and launching the first phase of the Walt Whitman Bridge redecking.
As we look forward to continuing our transformation, we would like to thank you for your ongoing support. We fully expect to accomplish more good work in the coming year.
Sincerely,
Tom Corbett
Chairman, Delaware River Port Authority Governor, Commonwealth of Pennsylvania

4
INTRODUCTORY SECTION
DRPA 2011 ANNUAL REPORT
HonorableChris ChristieGovernorState of New Jersey
HonorableTom CorbettGovernorCommonwealth of Pennsylvania
Governors
Board of Commissioners
Joann BELLGovernment Relations Executive Pugliese Associates
Hon. Tom CORBETT ChairmanGovernor, Commonwealthof Pennsylvania
Joanna CRUZAttorney Kerns, Pearlstine, Onorato & Hladik
WalterD’ALESSIOVice ChairmanNorthMarq Capital
Hon. Robert M. MCCORDState TreasurerCommonwealth of Pennsylvania
William R. SASSOBoard ChairmanStradley Ronon Stevens & Young
Hon. Jack WAGNER Auditor GeneralCommonwealth of Pennsylvania
David F. SIMONExecutive Vice President and Chief Legal Offi cerJefferson Health System
PENNSYLVANIA

5DRPA 2011 ANNUAL REPORT
INTRODUCTORY SECTION
Jeffrey L. NASHVice ChairmanFreeholder, Camden County Board of Chosen Freeholders
Denise Y. MASONVice PresidentHSBC Bank USA
E. Frank DIANTONIOPresident, Construction & General Laborers Union Local 172
Charles FENTRESSRetired Police SergeantDelaware River Port Authority
Albert F. FRATTALIBusiness ManagerReinforced Iron Workers Local 405
Tamarisk L. JONESDirector of Health and Senior ServicesGloucester County
Richard SWEENEYFinancial Secretary, Business RepresentativeIronworkers #399
Ricardo V. TAYLOR, JR.School AdministratorPennsauken Township
NEW JERSEY

6
INTRODUCTORY SECTION
DRPA 2011 ANNUAL REPORT
Organizational Chart
– Betsy Ross Bridge– Walt Whitman Bridge– Comm. Barry Bridge– Ben Franklin Bridge – Revenue Operations
John J. MatheussenChief Executive Officer, DRPAPresident, PATCO
Robert P. GrossDeputy Chief Executive Officer
Archer & GreinerNew Jersey Counsel
Duane Morris, LLPPennsylvania Counsel
John D. RinkPATCO General Manager
Cheryl Y. SpicerPATCO Assistant General Manager
Richard L. Brown, Esq.General Counsel Corporate Secretary
Toni P. Brown, Esq.Chief Administrative Officer
John T. Hanson, CPAChief Financial OfficerTreasurer
Timothy M. PulteChief Operating Officer
Officers & Executive Staff
Planning/Design– Construction –
& Maintenance... Engineering –
Administration... Traffic Management–
Port Projects–
– Accounting– Payroll– Budget– Analysis
– Accounting– Budget– Revenue
– Revenue Audit– Purchasing (DRPA/PATCO)– Contract Administration
Way & Power – Equipment –
Safety –
– All Legal
Chief ExecutiveOfficer
PATCOGeneral Manager
Chief OperatingOfficer
General Counsel
Chief FinancialOfficer
Directors,Bridges
Chief AdministrativeOfficer
Director, Finance
Director,Revenue
Director, Government Relations Director, Corporate Communications Director, Internal Audit Director, Labor Contract Compliance
– Systems Development– Production Systems
– Budget Planning/Compliance– Capital Planning– Special Projects– Regional Development/Real Estate
Deputy ChiefExecutive Officer
Director, Information Services
Director, Human Resource Services
Director, Risk Management
& Safety
Personnel – Employee Training –
– Safety– Transit Services– Fare Collection
Assistant General Manager
Director, PATCO Finance
Board AppointedCorporate Secretary
Board ofCommissioners
Business Development – EEO –
Customer Service – Community Relations –
Mail Room – Printing Services –
Benefits Administration –
Director, Port of Philadelphia
& Camden
Director, Engineering
– Contract Administration– Corporate Secretary Function
Board AppointedTreasurer
Police Chief
Director, Emergency Management
& Homeland Security
7DRPA 2011 ANNUAL REPORT
INTRODUCTORY SECTION
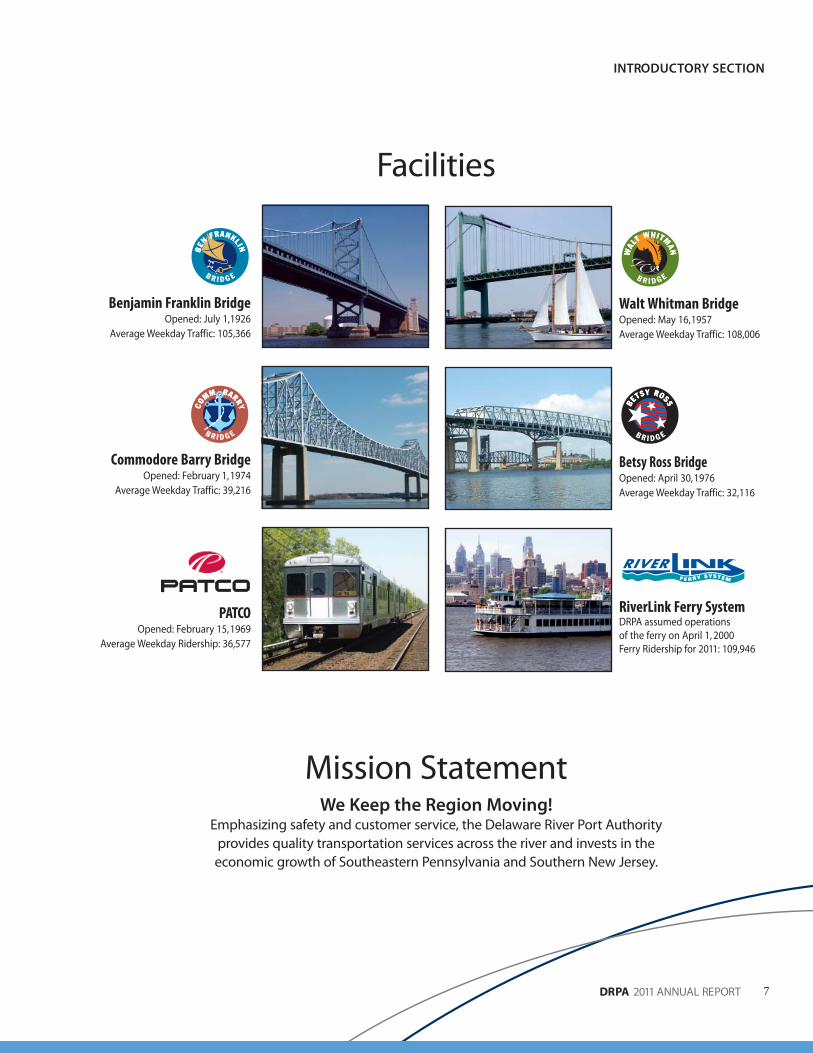
We Keep the Region Moving! Emphasizing safety and customer service, the Delaware River Port Authority
provides quality transportation services across the river and invests in the economic growth of Southeastern Pennsylvania and Southern New Jersey.
Mission Statement
Facilities
Benjamin Franklin BridgeOpened: July 1,1926
Average Weekday Traffic: 105,366
Walt Whitman BridgeOpened: May 16, 1957Average Weekday Traffic: 108,006
Commodore Barry BridgeOpened: February 1, 1974
Average Weekday Traffic: 39,216
Betsy Ross BridgeOpened: April 30, 1976Average Weekday Traffic: 32,116
PATCOOpened: February 15, 1969
Average Weekday Ridership: 36,577
RiverLink Ferry SystemDRPA assumed operations of the ferry on April 1, 2000Ferry Ridership for 2011: 109,946

8
INTRODUCTORY SECTION
DRPA 2011 ANNUAL REPORT
9DRPA 2011 ANNUAL REPORT
INTRODUCTORY SECTION
In 2011, the Delaware River Port Authority completed its ninth consecutive year of containing costs without compromising customer service. In order to fund a capital improvement program which keeps all of its facilities secure and well-maintained, the DRPA authorized a 25 percent toll hike on its four bridges and a 10 percent fare hike for the PATCO commuter rail line, both of which took effect on July 1.
With the arrival of a new administration in Pennsylvania, the DRPA and PATCO Board of Commissioners reorganized in March. Six new commissioners, including a new chairman, Gov. Tom Corbett of Pennsylvania, joined the board. The governor also appointed Commissioners Joann Bell, Joanna M. Cruz, Walter D’Alessio, William R. Sasso and David F. Simon.
In addition, the Delaware River Port Authority:
Report of theChief Executive Officer
Carried an estimated 98 million vehicles across • our four bridges.Transported more than 10.5 million passengers • aboard PATCO. Carried 110,000 riders aboard the • RiverLink Ferry. Completed the first phase of the three-year, • $140 million Walt Whitman Bridge deck removal and replacement project. Finished constructing a permit vehicle • staging area on the westbound side of the Walt Whitman Bridge. Supported the completion of the PennDOT • Chester ramp project at the Commodore Barry Bridge.Continued the implementation of a Six Sigma-• based lean government initiative to improve organizational and operational processes. Completed concourse improvements at • PATCO’s 9/10th, 12/13th and 15/16th Locust street stations in Philadelphia. Launched a pilot project involving the use of • pre-loaded debit cards to pay PATCO fares directly at the gate. Replaced almost all of the 835 poles that carry • communications and power lines along PATCO commuter rail rights-of-way in New Jersey.
Shipped the first 26 of PATCO’s 120 passenger • rail cars to an Alstom facility in Hornell, N.Y. where they will be completely renovated as part of a multi-year, $194 million project. Hosted a series of events that benefitted the • March of Dimes, regional multiple sclerosis organizations, a southern New Jersey school for children with disabilities and various police and firefighter charities. Observed Earth Day by participating • in a Camden clean-up project.Participated in state and national campaigns • including “Click It or Ticket,” “Over the Limit Under Arrest” and “Drive Sober or Get Pulled Over.”Participated in Visible Intermodal Prevention • and Response (VIPR), a collaborative, federal initiative to increase safety in and near PATCO rail stations. Participated in the Commercial Vehicle Safe • Drivers, Operation Road Check and Operation Air Brakes programs with the Federal Motor Carrier Safety Administration, Commercial Vehicle Safety Alliance and the Pennsylvania State Police.
JOHN J. MATHEUSSENChief Executive Officer, DRPAPresident of PATCO
10
INTRODUCTORY SECTION
DRPA 2011 ANNUAL REPORT
BRIDGES
During the first quarter of 2011, the Board of Commissioners appointed members to the first DRPA/PATCO Citizen Advisory Committee. The committee convened to provide the board with direct input from citizens who live within the DRPA Port District and use DRPA or PATCO facilities.
The DRPA also finished installing three new variable message signs on the Walt Whitman Bridge. Truss rehabilitation at the Ben Franklin Bridge and miscellaneous structural repairs on the Betsy Ross Bridge also continued.
In the spring, the Government Finance Officers Association awarded the DRPA annual financial report a certificate of achievement for excellence in financial reporting for the 19th consecutive year.
The Federal Transit Administration in early summer approved the Delaware River Port Authority’s Disadvantaged Business Enterprise methodology and goal for fiscal years 2011-13.
The DRPA hosted several summer charity events, and endured two memorable natural disruptions: An earthquake and a hurricane, both of which struck during the last week of August. Neither damaged the bridges or PATCO infrastructure.
In September, the DRPA engaged EthicsPoint to provide a user-friendly system that allows employees to report waste, fraud, abuse and other potential issues of concern. The new resource augmented an in-place process for reporting possible Equal Employment Opportunity violations.
Finally, the authority completed construction of the Walt Whitman Bridge permit vehicle staging area in November.
PATCO
In 2011, PATCO rehabilitated and painted all of its New Jersey railroad bridges.
PATCO also shipped the first 26 passenger rail cars to the Alstom plant in Hornell, N.Y., for renovation. Over approximately five years, all 120 PATCO cars will be rebuilt to modernize braking, propulsion control, heating and air conditioning, communications and messaging, doors openers and vehicle diagnostics. The cars will also be modified to meet the latest Americans with Disabilities Act (ADA) standards.
During the first quarter of 2011, PATCO formed a partnership with global, internet-search giant Google to make PATCO schedule information accessible through Google Transit.
Parking lot repaving work at the Haddonfield and Ashland Stations was completed during the second quarter of the year.
In June, PATCO enhanced its FREEDOM smart card by allowing customers to manage their accounts online.
During the third quarter, a fare increase scheduled for September 2010 took effect. Although fare increases often result in decreased ridership, PATCO’s ridership in 2011 exceeded that of the past several years with a total of 10.5 million riders recorded in 2011.
On September 26, PATCO launched a 12-month pilot program featuring a branded, contactless Visa® pre-paid debit card, the PATCO Wave & Pay ANYWHERE card. The program marks the first time PATCO customers were able to use the same payment card for both transit and retail purchases.
As it has for the past 22 years, PATCO hosted the start and finish of the 31st Annual Bike MS event at the end of September.
2011 Activities
11DRPA 2011 ANNUAL REPORT
INTRODUCTORY SECTION
On November 6, PATCO and the DRPA Public Safety Department staged an emergency drill at the Ashland Station in Voorhees, N.J. The drill simulated an emergency aboard a PATCO train and involved more than 200 emergency responders from the DPRA and local communities. PATCO conducted the drill to train local responders and comply with FTA requirements.
In December, PATCO completed concourse improvements at 9/10th streets, 12/13th streets, 15/16th streets and Locust Street stations in Philadelphia. The completion marked the end of a $9.6 million program to improve two PATCO stations in Camden and four in Philadelphia.
RIVERLINK FERRY
We welcomed HMS Global Maritime, formerly known as Hornblower Marine Services, back for its eighth consecutive season to operate the RiverLink Ferry. The RiverLink Ferry operated daily between Memorial Day and Labor Day, offering its express concert service from May through September. This year’s ridership totaled 109,946.
PUBLIC SAFETY
In January, Corporal Christopher Milito was honored with a plaque at the Walt Whitman Bridge. Corporal Milito died in the line of duty in January 2010.
In May and June, the DRPA Public Safety Department joined other law enforcement agencies in the region to participate in the National Highway Traffic Safety Administration’s “Click It or Ticket” campaign. The goal was to increase awareness of state seat belt laws.
DRPA police also participated in two New Jersey crackdowns on drunken driving: “Over the Limit Under Arrest” in August and “Drive Sober or Get Pulled Over” in December.
AWARDS AND ACKNOWLEDGEMENTS
DRPA Police Officer Daniel Caruso was honored by the Camden County Hero Scholarship Fund for pulling a woman from a blazing house in Camden. The award citation credited Officer Caruso with exceptional valor, professionalism and commitment to duty. Officer Caruso also
12
INTRODUCTORY SECTION
DRPA 2011 ANNUAL REPORT
received a Valor Award from the South Jersey Chapter 170 of ASIS (American Society for Industrial Security) International.
Corporal John Santry Jr. received the DRPA Police Department Corporal Christopher Milito Police Officer of the Year Award for his commitment to law enforcement excellence.
DRPA Corporal Christopher Milito was posthumously awarded the Presidential Award from the Citizens Crime Commission of the Delaware Valley for making the ultimate sacrifice in the line of duty last year.
Each year the DRPA sponsors a “Make it Better” program, which honors employees who find creative ways to improve workplace safety and business processes. Nicholas Day, a construction and maintenance technical assistant at the Walt Whitman Bridge, won the Safety Process Award for creating a durable DRPA/PATCO parking sticker. PATCO Machinist Richard Player won the Work Process Award for devising an in-house system for refurbishing armatures. Diane Hartery, an administrative secretary at the Walt Whitman Bridge, won the Safety Slogan contest with her entry, “Safety is as Simple as ABC … Always Be Safe.”
Commissioner Albert Frattali was named Man of the Year at the 65th Annual Boys’ Town of Italy Awards Gala in December.
FINANCES
• DRPA and PATCO will continue to manage costs in a manner that keeps operating expenses below budget limits.
• DRPA will continue to manage its swap portfolio to maximize debt flexibility and minimize debt service costs.
• DRPA/PATCO Finance will continue to lead a “Lean Government” pilot. This program applies “Lean” and “Six Sigma” process improvement methodologies across all functions and at all levels of the organization. More than 100 employees are now actively involved.
BRIDGES
Looking ahead to 2012, the DRPA is positioned to lead regional economic stimulus efforts. Its five-to-seven-year capital improvement plan will create jobs, maintain iconic assets and continue to provide outstanding transportation services in a fiscally responsible manner.
Benjamin Franklin – Rehabilitation of the bridge deck truss and the miscellaneous structural repairs will be completed in 2012. A building will be raised to store our de-icing materials.
Walt Whitman – The Walt Whitman Bridge deck replacement project will continue throughout the coming year. This major capital project involves removing the entire suspended portion of the bridge roadway, lane by lane, down to the steel. The DRPA also will begin to dehumidify the anchorages to maintain the long term structural integrity of the suspension cables.
Commodore Barry – Work will be completed on a major effort to replace bearings, repair concrete on piers and decks, repair drainage systems and repair structural steel. The DRPA is also designing a process to remove lead-based paint and then re-paint sections of the bridge.
2012 Work Agenda
13DRPA 2011 ANNUAL REPORT
INTRODUCTORY SECTION
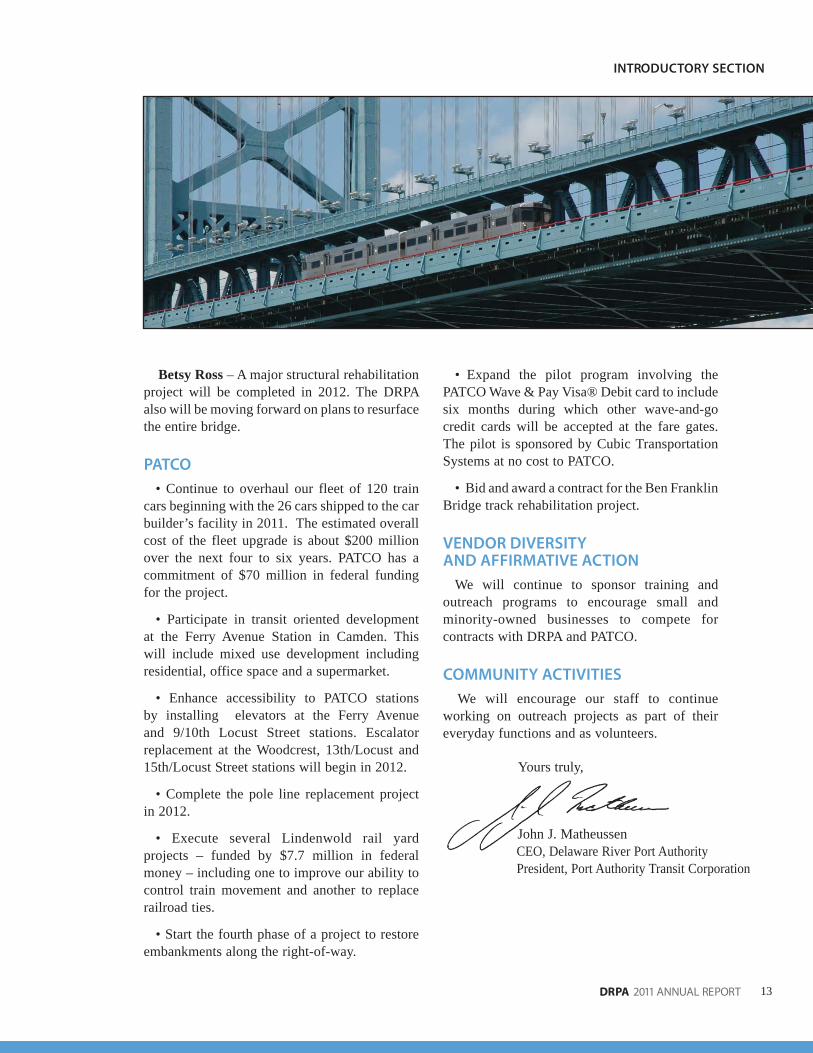
Betsy Ross – A major structural rehabilitation project will be completed in 2012. The DRPA also will be moving forward on plans to resurface the entire bridge.
PATCO
• Continue to overhaul our fleet of 120 train cars beginning with the 26 cars shipped to the car builder’s facility in 2011. The estimated overall cost of the fleet upgrade is about $200 million over the next four to six years. PATCO has a commitment of $70 million in federal funding for the project.
• Participate in transit oriented development at the Ferry Avenue Station in Camden. This will include mixed use development including residential, office space and a supermarket.
• Enhance accessibility to PATCO stations by installing elevators at the Ferry Avenue and 9/10th Locust Street stations. Escalator replacement at the Woodcrest, 13th/Locust and 15th/Locust Street stations will begin in 2012.
• Complete the pole line replacement project in 2012.
• Execute several Lindenwold rail yard projects – funded by $7.7 million in federal money – including one to improve our ability to control train movement and another to replace railroad ties.
• Start the fourth phase of a project to restore embankments along the right-of-way.
• Expand the pilot program involving the PATCO Wave & Pay Visa® Debit card to include six months during which other wave-and-go credit cards will be accepted at the fare gates. The pilot is sponsored by Cubic Transportation Systems at no cost to PATCO.
• Bid and award a contract for the Ben Franklin Bridge track rehabilitation project.
VENDOR DIVERSITY AND AFFIRMATIVE ACTION
We will continue to sponsor training and outreach programs to encourage small and minority-owned businesses to compete for contracts with DRPA and PATCO.
COMMUNITY ACTIVITIES
We will encourage our staff to continue working on outreach projects as part of their everyday functions and as volunteers.
Yours truly,
John J. Matheussen CEO, Delaware River Port Authority President, Port Authority Transit Corporation
14
INTRODUCTORY SECTION
DRPA 2011 ANNUAL REPORT
15DRPA is an equal opportunity employer
Mailing Address: PO Box 1949 Camden New Jersey 08101-1949 Telephone: (856) 968-2000
DELAWARE RIVER PORT AUTHORITY of Pennsylvania & New Jersey
TO THE BOARD OF COMMISSIONERSOF THE DELAWARE RIVER PORT AUTHORITY
The comprehensive annual financial report of the Delaware River Port Authority (“the Authority”) for the year ended December 31, 2011, is hereby submitted. Responsibility for both the accuracy of the data and the completeness and fairness of the presentation, including all disclosures, rests with the Authority. To the best of our knowledge and belief, the enclosed data is accurate in all material respects and is reported in a manner designed to present fairly the combined financial position and results of operations of the Authority. All disclosures necessary to enable the reader to gain an understanding of the Authority’s financial activities have been included.
The Authority’s Indentures of Trust require an annual audit of the Authority’s financial statements by a firm of independent auditors. Additionally, as a recipient of funds from the Federal Transit Administration for projects involving the PATCO transit system, the Authority is required to have a single audit performed annually by an independent auditor in accordance with the Single Audit Act of 1984, as amended in 1996, and OMB Circular A-133. The purpose of the single audit is to determine the adequacy of the Authority’s internal controls and compliance with applicable laws and regulations relating to the receipt of federal assistance. The Authority retains an independent auditor to satisfy these audit requirements. The report of the independent auditor on the combined financial statements of the Authority is included in the financial section of this report. The Authority’s management is responsible for the content and presentation of the audited financial report.
Management of the Authority is responsible for establishing and maintaining a system of internal control designed to ensure that the assets of the Authority are protected from loss, theft or misuse and to ensure that adequate accounting data is compiled to allow for the preparation of financial statements in conformity with Generally Accepted Accounting Principles (GAAP) in the United States. The internal controls are designed to provide reasonable, but not absolute, assurance that these objectives are met. The concept of reasonable assurance recognizes that: (1) the cost of a control should not exceed the resulting benefits; and (2) the analysis of costs and benefits requires estimates and judgments by management.
In addition, as a recipient of federal financial assistance, the Authority is required to ensure that adequate internal controls are in place to ensure compliance with applicable laws and regulations relating to that federal assistance. These internal controls are subject to periodic evaluation by the Office of the Inspector General and by the management of the Authority.
The combined financial statements of the Authority are prepared using the accrual method of accounting in accordance with GAAP. Management has provided a narrative introduction, overview, and analysis to accompany the basic financial statements in the Management’s Discussion and Analysis (MD&A). This letter of transmittal is designed to complement the MD&A and should be read in conjunction with it. The Delaware River Port Authority’s MD&A can be found immediately following the report of the independent auditors.
August 1, 2012
16
INTRODUCTORY SECTION
DRPA 2011 ANNUAL REPORT
PROFILE OF GOVERNMENT
The Delaware River Port Authority is a public corporate instrumentality of the Commonwealth of Pennsylvania and the State of New Jersey created with the consent of Congress by compact legislation between the Commonwealth of Pennsylvania and the State of New Jersey. The Authority, which has no stockholders or equity holders, was created in 1952 as a successor to the Delaware River Joint Commission, which was created in 1931. The Authority is governed by a 16-member Board of Commissioners. The Governor of New Jersey appoints eight commissioners with the advice and consent of the Senate of New Jersey. The Governor of Pennsylvania appoints six commissioners, with the Auditor General and the State Treasurer of Pennsylvania serving as ex-officio commissioners for Pennsylvania. Both Pennsylvania and New Jersey Commissioners serve without compensation. The Board of Commissioners establishes policy and plans for the operations of the Authority. A Chief Executive Officer is appointed by the Board of Commissioners to implement policy and to manage the daily operations of the Authority.
The Board of Commissioners of the Delaware River Port Authority has five committees established under the authority of its Bylaws. They are: the Operations and Maintenance Committee, Projects Committee, Executive Committee, Finance Committee, and Export Development and International Trade Committee. These committees adhere to the rules and leadership structure outlined in Article IX of the DRPA Bylaws. These Committees act pursuant to the power vested under the bylaws.
The Board of Commissioners of the Delaware River Port Authority has also established, under the authority of resolution DRPA-10-040, an Audit Committee that is chaired by the Auditor General of Pennsylvania. The Audit Committee is charged with overseeing an independent financial, forensic and performance audit. The Board of The Delaware River Port Authority also adopted an Audit Committee charter through resolution DRPA-10-141. This resolution specifies that the purpose of the Audit Committee is to assist the board in fulfilling its oversight responsibility relating to: (1) the Authority’s internal and external audit process, the financial reporting process, and the risk assessment and
internal controls over financial reporting; (2) compliance with applicable laws, policies, and accounting and auditing standards, and (3) communication between the Authority’s management, internal and external auditors, experts, other advisors, and the Board.
The Audit Committee adheres to the rules and leadership structure outlined in resolutions DRPA-10-040 and DRPA-10-141. The Audit Committee acts pursuant to the power vested under these two resolutions. It is not vested with any power under the bylaws.
The Authority is vested with the ownership, control, operation, and collection of tolls and revenues of certain bridges spanning the Delaware River; namely, the Benjamin Franklin, Walt Whitman, Commodore Barry and Betsy Ross bridges. The Authority has also constructed and owns a high-speed transit system which is operated by its wholly owned subsidiary, the Port Authority Transit Corporation (PATCO). The transit system operates between Philadelphia, Pennsylvania and Lindenwold, New Jersey. The Authority’s Port of Philadelphia and Camden Department (PPC) is responsible for the marketing and operation of the RiverLink Ferry System and the Cruise Terminal operation. (The Cruise Terminal operation closed in mid-2011).
BUDGET PROCESS
The Authority prepares both operating and capital budgets annually. The annual operating budget is a financial planning tool for the associated fiscal year; it also sets the maximum spending limit for the Authority. Each of the Authority’s Chief Officers and staff contribute to the development of a preliminary operating budget based on the expected staffing and funding levels necessary to operate the Authority’s facilities in an efficient and safe manner. After individual departmental budgets are reviewed at budget hearings conducted by the Operating Budget Review Committee, (which consists of the Chief Executive Officer, Deputy Chief Executive Officer, Chief Financial Officer, Chief Operating Officer, General Counsel, the General Manager of PATCO and other senior staff), a proposed operating budget is presented by the Chief Executive Officer to the Finance Committee and ultimately to the Board of Commissioners for its review and approval. Any
17DRPA 2011 ANNUAL REPORT
INTRODUCTORY SECTION
subsequent addition of funds to the total operating budget requires the approval of the Board of Commissioners.
A five year capital budget is also prepared through a similar process and submitted to the Finance Committee, and subsequently to the Board of Commissioners for approval. The capital budget is a planning document identifying the Authority’s potential commitments. The approval of the capital budget does not in itself authorize any specific project. Specific approval by the Board of Commissioners is required before any capital project may commence. The foundation for the major capital budget projects (those projects greater than $200K) is the biennial inspection which inspects all four bridges and PATCO. This inspection is required by the 1998 Revenue Bond Indenture. Smaller capital projects are identified by various operating and administrative departments.
Expenditures are monitored continuously throughout the year by the Finance Division to ensure that each department is in compliance with the approved operating budget and the established Policies and By-Laws of the Authority.
A Master Plan, detailing Port District and economic development projects, is distributed to the States, county and municipal governments, commissions, public corporations and authorities, and the private sector, when prepared by the Authority. When updated, the Authority approves amendments to each Master Plan as necessary to facilitate the implementation of new projects within the Port District. Updates and amendments to the Master Plan are approved through the Board of Commissioners.
In accordance with the Authority’s governing Revenue and Port District Project Bond Indentures, the next year’s annual budget must be submitted to the respective Bond Trustees by December 31 of each year.
FACTORS AFFECTING FINANCIAL CONDITION
During the past several years, the Authority has taken significant strategic steps to strengthen its financial position through: cost-containment of personnel and non-personnel expenditures, increasing its liquidity through growth in its General Fund, and restructuring its debt and swap portfolios. The latter
policy is primarily in response to: changing financial markets, the exercise of various swaptions, which were issued in 2001, passage of a board resolution mandating the liquidation of the Authority’s swap portfolio in an orderly and strategic fashion, and the necessity of funding its roughly $1.0 billion Five Year Capital Program.
DEBT MANAGEMENT
During fiscal year 2011, the Authority did not issue any additional debt, or take any actions related to its outstanding swaps. However, the Authority did repay $42.7 million in revenue bond and port district project bond debt during the year.
During 2012, the Authority’s Board approved a comprehensive finance plan to pay down at least $96 million in fixed-rate debt, restructure its variable rate debt and reduce the costs of its underlying letters of credit, and to refund a large portion of its port district project bond debt. This action plan is disclosed in the “Subsequent Events” section of the notes accompanying the financial statements.
LOCAL ECONOMY
From the latest data available, it appears that population growth decreased slightly in the Pennsylvania counties within the Port District while increasing slightly in New Jersey counties within the Port District. The unemployment rate in the both areas has increased slightly since 2009. Additional information can be found in the Statistical Section of this report.
LONG TERM FINANCIAL PLANNING
An important component of the Authority’s long-term financial plan is ensuring that it has sufficient revenue to meet its operating and capital requirements. With assistance from its Financial Advisors, the Authority uses a long-term forecasting model, which creates a multi-year forecast of its revenues and expenses. The model incorporates numerous independent variables (including operating revenue and expense estimates, debt service coverages and capacity, etc.) in order to determine the annual cash flow required to create sufficient bonding capacity to finance its five-year capital plan. Results from this model assisted the Authority in the development of
18
INTRODUCTORY SECTION
DRPA 2011 ANNUAL REPORT
its multi-year strategy to increase bridge tolls and PATCO system passenger fares in mid-2008 and in July 2011 and is updated regularly to determine new revenue bond capacity and sizing. The most recent traffic engineering study, with projections for a 10-year period, was completed in the first half of 2010. The traffic engineer’s report was included in the Official Statement for the aforementioned revenue bond issue.
As mentioned in the “Budget Process” section of this document, each year, the Authority develops a five-year capital plan which details the anticipated capital expenditures during this five-year period. The 2011 Capital Plan, developed and approved in December 2010, outlined numerous bridge, transit system, security and technology project expenditures approaching $1.0 billion (net of federal funding), for the five-year period commencing in 2011. The 2011 Capital Plan was funded primarily through the use of project funds received from the July 2010 issuance of $308 million in new revenue bonds. Short-lived capital assets (vehicles, etc.) are purchased with cash from the General Fund.
BRIDGE TOLL AND PASSENGER FARE SCHEDULES
In 2008, the Authority’s Board of Commissioners enacted a comprehensive toll increase plan; tolls were increased by 33.3% (or $1.00 for passenger vehicles) in September 2008, and were scheduled to be increased by another 25% (another $1.00 per passenger vehicle) in September, 2010. Cost-of-living toll increases were scheduled to occur every two years thereafter.
At its December 2009 meetings, the Board postponed the implementation of the September 2010 passenger fare and toll increases until January 1, 2011 and July 1, 2011, respectively. Later, at its December 2010 meeting, the Board postponed the PATCO 10% fare increase until July 1, 2011 to coincide with the effective date on the second part of the toll increase program. On July 1, 2011, both the 25% across-the-board bridge toll increase and the 10% PATCO fare increase became effective.
Additional information on the toll and fare schedules can be found in the financial footnotes and in the statistical section of this report.
AWARDS AND ACCOMPLISHMENTS
The Government Finance Officers Association of the United States and Canada (GFOA) awarded a Certificate of Achievement for Excellence in Financial Reporting to the Delaware River Port Authority for its comprehensive annual financial report for the fiscal year ended December 31, 2010. This was the nineteenth consecutive year that the Authority has achieved this prestigious award. In order to be awarded a Certificate of Achievement, a government must publish an easily readable and efficiently organized comprehensive annual financial report. This report must satisfy both GAAP and applicable legal requirements and employ best practices identified by the GFOA.
A Certificate of Achievement is valid for a period of one year only. We believe our current comprehensive annual financial report continues to meet the Certificate of Achievement Program’s requirements and we are submitting it to GFOA to determine its eligibility for another certificate.
The preparation of this report would not have been possible without the dedication and efficiency of the entire staff of the Finance, Administrative Services and Government & Corporate Communications Departments. I would especially like to express my appreciation to the members of these Departments who contributed to the preparation of this report. Special thanks must also be given to the Chairman, Vice-Chairman, Chief Executive Officer, Deputy Chief Executive Officer and the Finance and Audit Committees of the Board for maintaining the highest standards in the management of the Delaware River Port Authority’s finances. Special thanks also to the DRPA Inspector General Thomas W. Raftery III for his leadership in facilitating this financial audit.
Respectfully submitted,
John T. Hanson Chief Financial Officer

FinancialSection

FinancialSection
21
Independent Auditor’s Report
To the CommissionersDelaware River Port AuthorityCamden County, New Jersey
We have audited the accompanying combined statement of net assets of Delaware River Port Authorityand subsidiary as of December 31, 2011, and the related combined statements of revenues, expensesand changes in net assets and cash fl ows for the year then ended. These combined fi nancial statementsare the responsibility of the Authority’s management. Our responsibility is to express an opinion on thesecombined fi nancial statements based on our audit. The combined fi nancial statements of Delaware RiverPort Authority and subsidiary as of and for the year ended December 31, 2010, before they were restatedfor the matter discussed in Note 18 to the fi nancial statements, were audited by other auditors whosereport dated June 28, 2011 expressed an unqualifi ed opinion on those statements.
We conducted our audit in accordance with auditing standards generally accepted in the United States ofAmerica. Those standards require that we plan and perform the audit to obtain reasonable assuranceabout whether the fi nancial statements are free of material misstatement. An audit includes examining,on a test basis, evidence supporting the amounts and disclosures in the fi nancial statements. An auditalso includes assessing the accounting principles used and signifi cant estimates made by management,as well as evaluating the overall fi nancial statement presentation. We believe that our audit provides areasonable basis for our opinion.
In our opinion, the 2011 combined fi nancial statements referred to above present fairly, in all materialrespects, the fi nancial position of Delaware River Port Authority and subsidiary as of December 31, 2011,and the changes in fi nancial position and cash fl ows for the year then ended in conformity with accountingprinciples generally accepted in the United States of America.
We also audited the adjustments described in Note 18 that were applied to restate the 2010 fi nancialstatements. In our opinion, such adjustments are appropriate and have been properly applied.
Accounting principles generally accepted in the United States of America require that management’sdiscussion and analysis and the schedule of funding progress for health benefi ts be presented tosupplement the combined fi nancial statements. Such information, although not a part of the combinedfi nancial statements, is required by the Governmental Accounting Standards Board, who considers it tobe an essential part of fi nancial reporting for placing the combined fi nancial statements in an appropriateoperational, economic, or historical context. We and the other auditors have applied certain limitedprocedures to the required supplementary information in accordance with auditing standards generallyaccepted in the United States of America, which consisted of inquiries of management about the methodsof preparing the information and comparing the information for consistency with management’s responsesto our inquiries, the combined fi nancial statements, and other knowledge we obtained during our audit ofthe combined fi nancial statements. We do not express an opinion or provide any assurance on theinformation because the limited procedures do not provide us with evidence suffi cient to express anopinion or provide any assurance.
McGladrey LLP
Member of the RSM International network of independent accounting, tax and consulting firms.

22
Our audit was conducted for the purpose of forming an opinion on the fi nancial statements thatcollectively comprise Delaware River Port Authority and subsidiary’s combined fi nancial statements. Thesupplemental schedules are presented for purposes of additional analysis and are not a required part ofthe combined fi nancial statements. Such information is the responsibility of management and was derivedfrom and relates directly to the underlying accounting and other records used to prepare the fi nancialstatements. The supplemental schedules have been subjected to the auditing procedures applied in theaudit of the fi nancial statements and certain additional procedures, including comparing and reconcilingsuch information directly to the underlying accounting and other records used to prepare the fi nancialstatements or to the fi nancial statements themselves, and other additional procedures in accordance withauditing standards generally accepted in the United States of America. In our opinion, the information isfairly stated in all material respects in relation to the fi nancial statements as a whole.
Our audit was conducted for the purpose of forming an opinion on the fi nancial statements thatcollectively comprise Delaware River Port Authority and subsidiary’s combined fi nancial statements. Theintroductory and statistical section is presented for purposes of additional analysis and is not a requiredpart of the combined fi nancial statements. Such information has not been subjected to the auditingprocedures applied in the audit of the combined fi nancial statements and, accordingly, we do not expressan opinion or provide any assurance on it.
Blue Bell, PennsylvaniaAugust 1, 2012
23DRPA 2011 ANNUAL REPORT
INTRODUCTORY SECTION
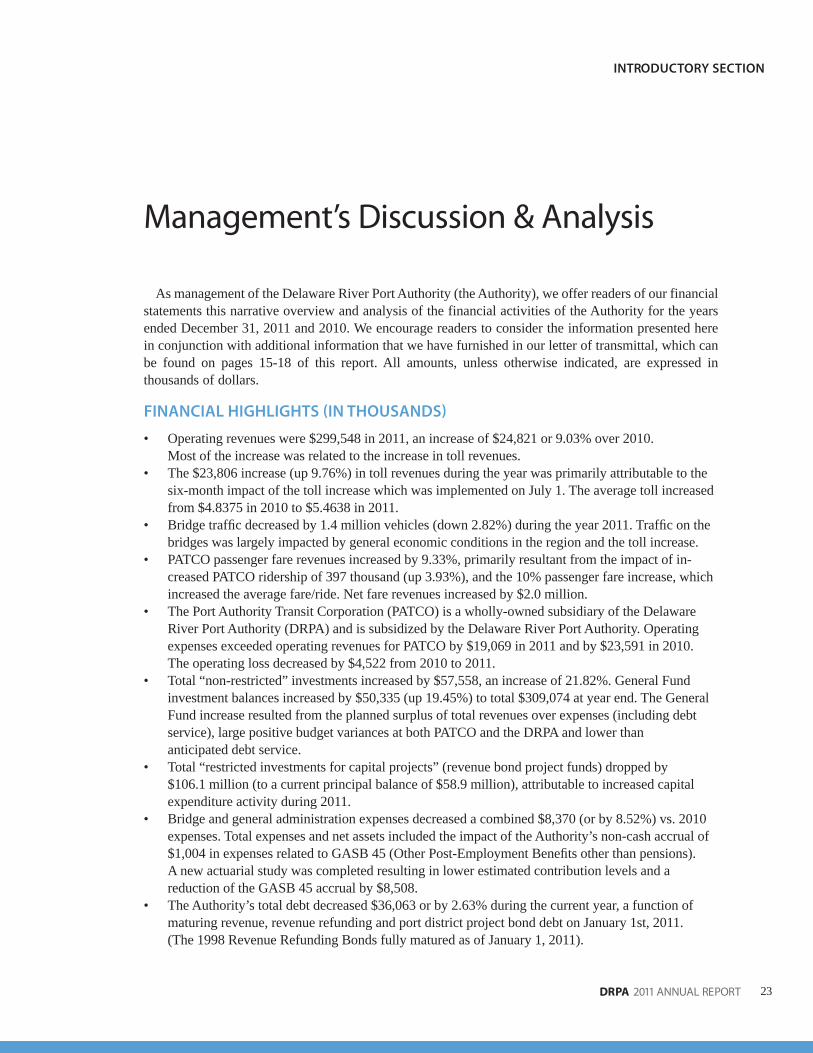
As management of the Delaware River Port Authority (the Authority), we offer readers of our financial statements this narrative overview and analysis of the financial activities of the Authority for the years ended December 31, 2011 and 2010. We encourage readers to consider the information presented here in conjunction with additional information that we have furnished in our letter of transmittal, which can be found on pages 15-18 of this report. All amounts, unless otherwise indicated, are expressed in thousands of dollars.
FINANCIAL HIGHLIGHTS IN THOUSANDS
Operating revenues were $299,548 in 2011, an increase of $24,821 or 9.03% over 2010. • Most of the increase was related to the increase in toll revenues.The $23,806 increase (up 9.76%) in toll revenues during the year was primarily attributable to the • six-month impact of the toll increase which was implemented on July 1. The average toll increased from $4.8375 in 2010 to $5.4638 in 2011. Bridge traffi c decreased by 1.4 million vehicles (down 2.82%) during the year 2011. Traffi c on the • bridges was largely impacted by general economic conditions in the region and the toll increase.PATCO passenger fare revenues increased by 9.33%, primarily resultant from the impact of in-• creased PATCO ridership of 397 thousand (up 3.93%), and the 10% passenger fare increase, which increased the average fare/ride. Net fare revenues increased by $2.0 million.The Port Authority Transit Corporation (PATCO) is a wholly-owned subsidiary of the Delaware • River Port Authority (DRPA) and is subsidized by the Delaware River Port Authority. Operating expenses exceeded operating revenues for PATCO by $19,069 in 2011 and by $23,591 in 2010. The operating loss decreased by $4,522 from 2010 to 2011.Total “non-restricted” investments increased by $57,558, an increase of 21.82%. General Fund • investment balances increased by $50,335 (up 19.45%) to total $309,074 at year end. The General Fund increase resulted from the planned surplus of total revenues over expenses (including debt service), large positive budget variances at both PATCO and the DRPA and lower than anticipated debt service.Total “restricted investments for capital projects” (revenue bond project funds) dropped by • $106.1 million (to a current principal balance of $58.9 million), attributable to increased capital expenditure activity during 2011.Bridge and general administration expenses decreased a combined $8,370 (or by 8.52%) vs. 2010 • expenses. Total expenses and net assets included the impact of the Authority’s non-cash accrual of $1,004 in expenses related to GASB 45 (Other Post-Employment Benefi ts other than pensions). A new actuarial study was completed resulting in lower estimated contribution levels and a reduction of the GASB 45 accrual by $8,508.The Authority’s total debt decreased $36,063 or by 2.63% during the current year, a function of • maturing revenue, revenue refunding and port district project bond debt on January 1st, 2011. (The 1998 Revenue Refunding Bonds fully matured as of January 1, 2011).
Management’s Discussion & Analysis
24
FINANCIAL SECTION
DRPA 2011 ANNUAL REPORT
Economic development expenditures totaled $2,025 in 2011, a decrease in such expenditures of • $37,632 over 2010. The Authority’s economic development spending now refl ects only previously committed projects, as the Authority’s Board approved a discontinuation of any new economic development projects in 2010.The assets of the Authority exceeded its liabilities at the close of 2011 resulting in net assets • of $341,281. Net assets increased by $54,352 during the year.For the year ended December 31, 2010, the Authority was required to implement Governmental • Accounting Standards Board Statement No. 53, Accounting and Financial Reporting for Derivative Instruments, with retroactive implementation for the year ended December 31, 2009. As a result of the retroactive implementation, the previously issued fi nancial statements for the year ended December 31, 2009 have been restated. The implementation signifi cantly impacted total “non-operating revenues (expenses)”, “income before capital contributions,” and “total non-current liabilities.” During 2011, the Authority changed its accounting method to remove the projected costs of bridge • repainting. As a result, net assets as of January 1, 2010 and the change in net assets for the year ended December 31, 2010 were restated. Please see Note 18 of the Financial Statements for details.
25DRPA 2011 ANNUAL REPORT
FINANCIAL SECTION
Delaware River Port Authority’s Net Assets
Current and other assets Capital assets Total assets Deferred outfl ows Long-term liabilities outstanding Other liabilities Total liabilities Net assets: Invested in capital assets, net of related debt Restricted Unrestricted (defi ciency) Total net assets
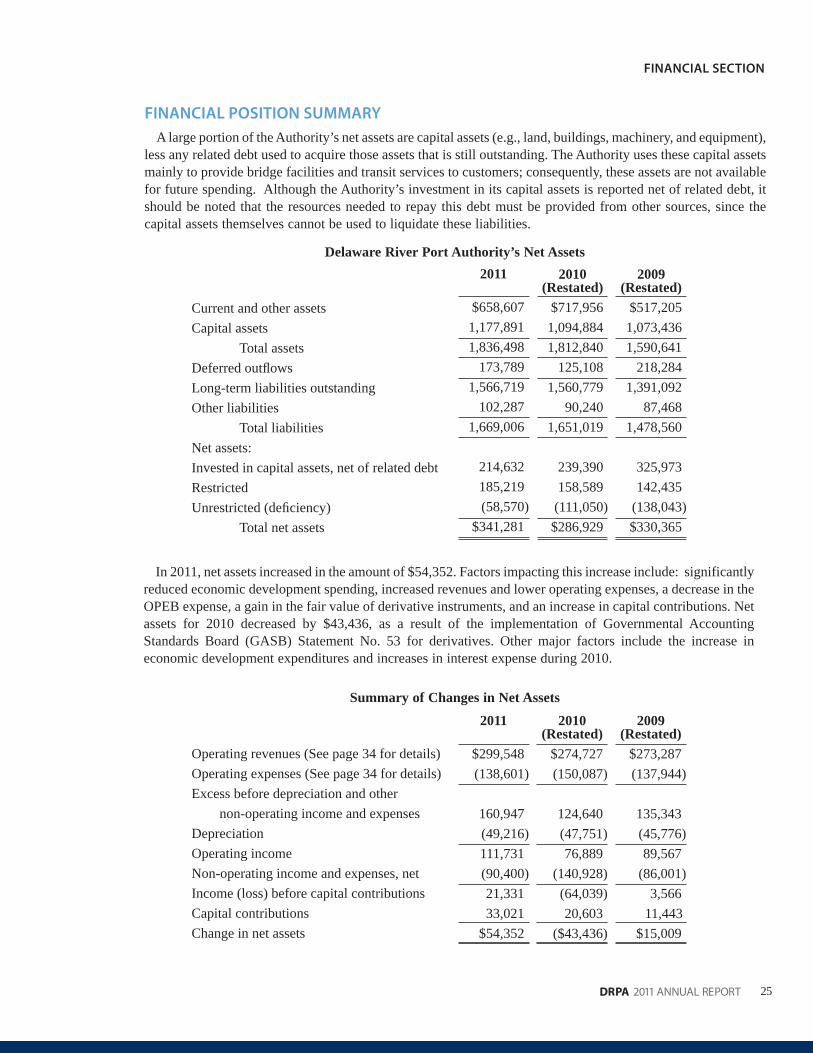
In 2011, net assets increased in the amount of $54,352. Factors impacting this increase include: significantly reduced economic development spending, increased revenues and lower operating expenses, a decrease in the OPEB expense, a gain in the fair value of derivative instruments, and an increase in capital contributions. Net assets for 2010 decreased by $43,436, as a result of the implementation of Governmental Accounting Standards Board (GASB) Statement No. 53 for derivatives. Other major factors include the increase in economic development expenditures and increases in interest expense during 2010.
Summary of Changes in Net Assets
Operating revenues (See page 34 for details) Operating expenses (See page 34 for details) Excess before depreciation and other non-operating income and expenses Depreciation Operating income Non-operating income and expenses, net Income (loss) before capital contributions Capital contributions Change in net assets
2011
$658,6071,177,8911,836,498
173,7891,566,719
102,2871,669,006
214,632185,219(58,570)
$341,281
2011
$299,548(138,601)
160,947(49,216)111,731(90,400)21,33133,021
$54,352
2010(Restated)
$717,9561,094,8841,812,840
125,1081,560,779
90,2401,651,019
239,390158,589
(111,050)$286,929
2010(Restated)
$274,727(150,087)
124,640(47,751)76,889
(140,928)(64,039)20,603
($43,436)
2009(Restated)
$517,2051,073,4361,590,641
218,2841,391,092
87,4681,478,560
325,973142,435
(138,043)$330,365
2009(Restated)
$273,287(137,944)
135,343(45,776)89,567
(86,001)3,566
11,443$15,009
FINANCIAL POSITION SUMMARY
A large portion of the Authority’s net assets are capital assets (e.g., land, buildings, machinery, and equipment), less any related debt used to acquire those assets that is still outstanding. The Authority uses these capital assets mainly to provide bridge facilities and transit services to customers; consequently, these assets are not available for future spending. Although the Authority’s investment in its capital assets is reported net of related debt, it should be noted that the resources needed to repay this debt must be provided from other sources, since the capital assets themselves cannot be used to liquidate these liabilities.
26
FINANCIAL SECTION
DRPA 2011 ANNUAL REPORT
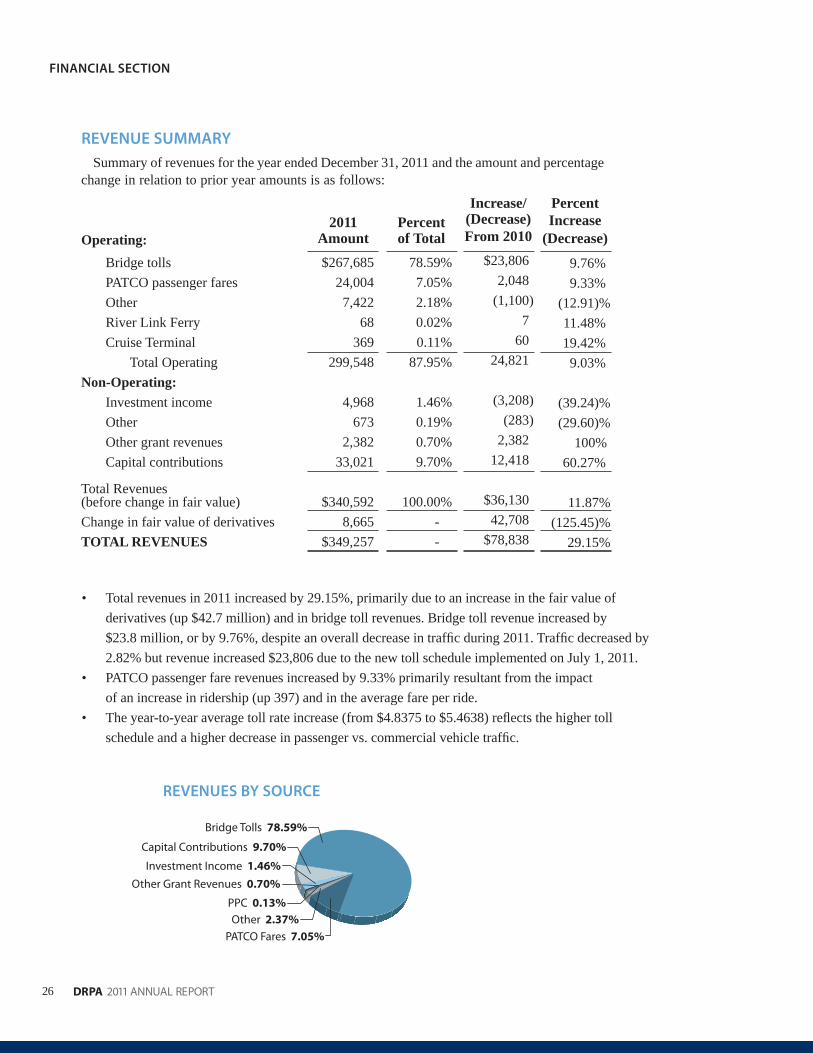
REVENUE SUMMARY
Summary of revenues for the year ended December 31, 2011 and the amount and percentage change in relation to prior year amounts is as follows:
Operating: Bridge tolls PATCO passenger fares Other River Link Ferry Cruise Terminal Total Operating Non-Operating: Investment income Other Other grant revenues Capital contributions
Total Revenues (before change in fair value)Change in fair value of derivativesTOTAL REVENUES
2011Amount$267,685
24,0047,422
68369
299,548
4,968673
2,38233,021
$340,5928,665
$349,257
Percentof Total
78.59%7.05%2.18%0.02%0.11%
87.95%
1.46%0.19%0.70%9.70%
100.00%- -
Increase/(Decrease)From 2010
$23,8062,048
(1,100)7
6024,821
(3,208)(283)
2,38212,418
$36,13042,708
$78,838
PercentIncrease
(Decrease)
9.76%9.33%
(12.91)%11.48%19.42%9.03%
(39.24)%(29.60)%
100%60.27%
11.87%(125.45)%
29.15%
Total revenues in 2011 increased by 29.15%, primarily due to an increase in the fair value of • derivatives (up $42.7 million) and in bridge toll revenues. Bridge toll revenue increased by $23.8 million, or by 9.76%, despite an overall decrease in traffi c during 2011. Traffi c decreased by 2.82% but revenue increased $23,806 due to the new toll schedule implemented on July 1, 2011.PATCO passenger fare revenues increased by 9.33% primarily resultant from the impact • of an increase in ridership (up 397) and in the average fare per ride.The year-to-year average toll rate increase (from $4.8375 to $5.4638) refl ects the higher toll • schedule and a higher decrease in passenger vs. commercial vehicle traffi c.
REVENUES BY SOURCE
Bridge Tolls 78.59%
PATCO Fares 7.05%Other 2.37%
Investment Income 1.46%
PPC 0.13%
Other Grant Revenues 0.70%
Capital Contributions 9.70%
27DRPA 2011 ANNUAL REPORT
FINANCIAL SECTION
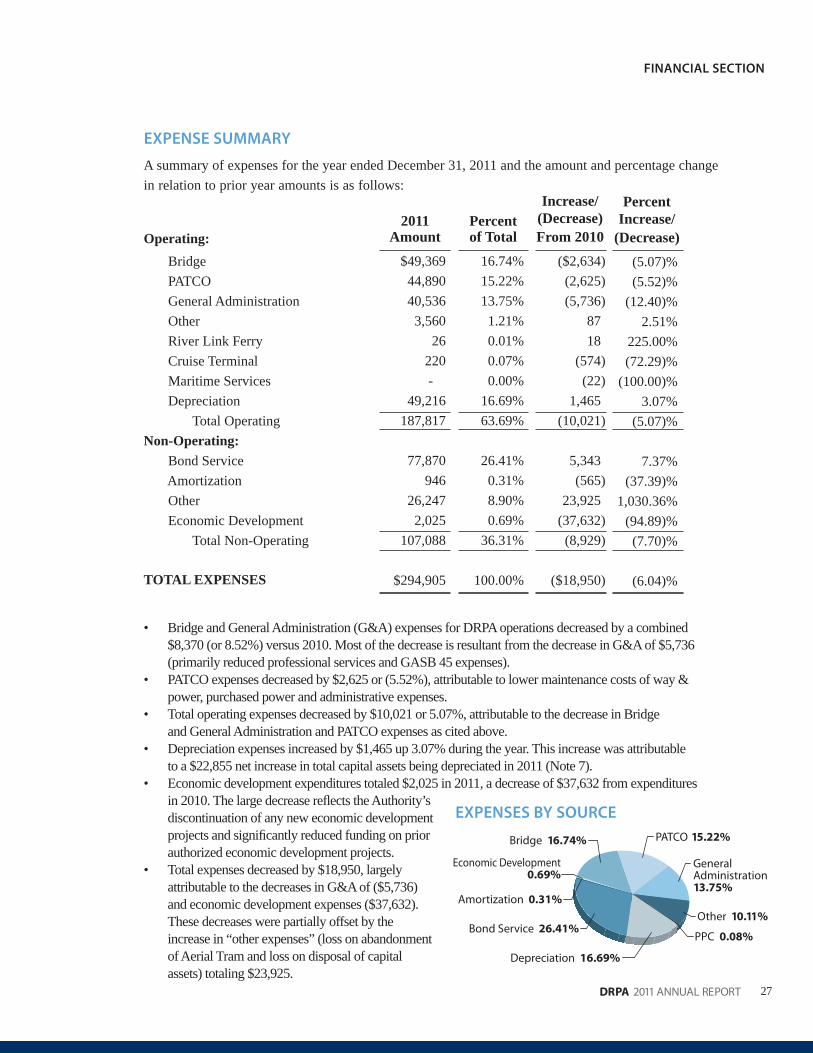
EXPENSE SUMMARY
A summary of expenses for the year ended December 31, 2011 and the amount and percentage change in relation to prior year amounts is as follows:
Operating: Bridge PATCO General Administration Other River Link Ferry Cruise Terminal Maritime Services Depreciation Total Operating Non-Operating: Bond Service Amortization Other Economic Development Total Non-Operating
TOTAL EXPENSES
2011Amount
$49,36944,89040,5363,560
26220-
49,216187,817
77,870946
26,2472,025
107,088
$294,905
Percentof Total
16.74%15.22%13.75%1.21%0.01%0.07%0.00%
16.69%63.69%
26.41%0.31%8.90%0.69%
36.31%
100.00%
Increase/(Decrease)From 2010
($2,634)(2,625)(5,736)
8718
(574)(22)
1,465(10,021)
5,343(565)
23,925(37,632)(8,929)
($18,950)
PercentIncrease/
(Decrease)(5.07)%(5.52)%
(12.40)%2.51%
225.00%(72.29)%
(100.00)%3.07%
(5.07)%
7.37%(37.39)%
1,030.36% (94.89)%(7.70)%
(6.04)%
Bridge and General Administration (G&A) expenses for DRPA operations decreased by a combined • $8,370 (or 8.52%) versus 2010. Most of the decrease is resultant from the decrease in G&A of $5,736 (primarily reduced professional services and GASB 45 expenses). PATCO expenses decreased by $2,625 or (5.52%), attributable to lower maintenance costs of way & • power, purchased power and administrative expenses. Total operating expenses decreased by $10,021 or 5.07%, attributable to the decrease in Bridge • and General Administration and PATCO expenses as cited above. Depreciation expenses increased by $1,465 up 3.07% during the year. This increase was attributable • to a $22,855 net increase in total capital assets being depreciated in 2011 (Note 7). Economic development expenditures totaled $2,025 in 2011, a decrease of $37,632 from expenditures• in 2010. The large decrease refl ects the Authority’sdiscontinuation of any new economic developmentprojects and signifi cantly reduced funding on priorauthorized economic development projects. Total expenses decreased by $18,950, largely • attributable to the decreases in G&A of ($5,736)and economic development expenses ($37,632). These decreases were partially offset by the increase in “other expenses” (loss on abandonment of Aerial Tram and loss on disposal of capital assets) totaling $23,925.
EXPENSES BY SOURCE
Bond Service 26.41%
Depreciation 16.69%
Economic Development 0.69%
Amortization 0.31%
PPC 0.08%
Other 10.11%
PATCO 15.22%
General Administration13.75%
Bridge 16.74%
28
FINANCIAL SECTION
DRPA 2011 ANNUAL REPORT
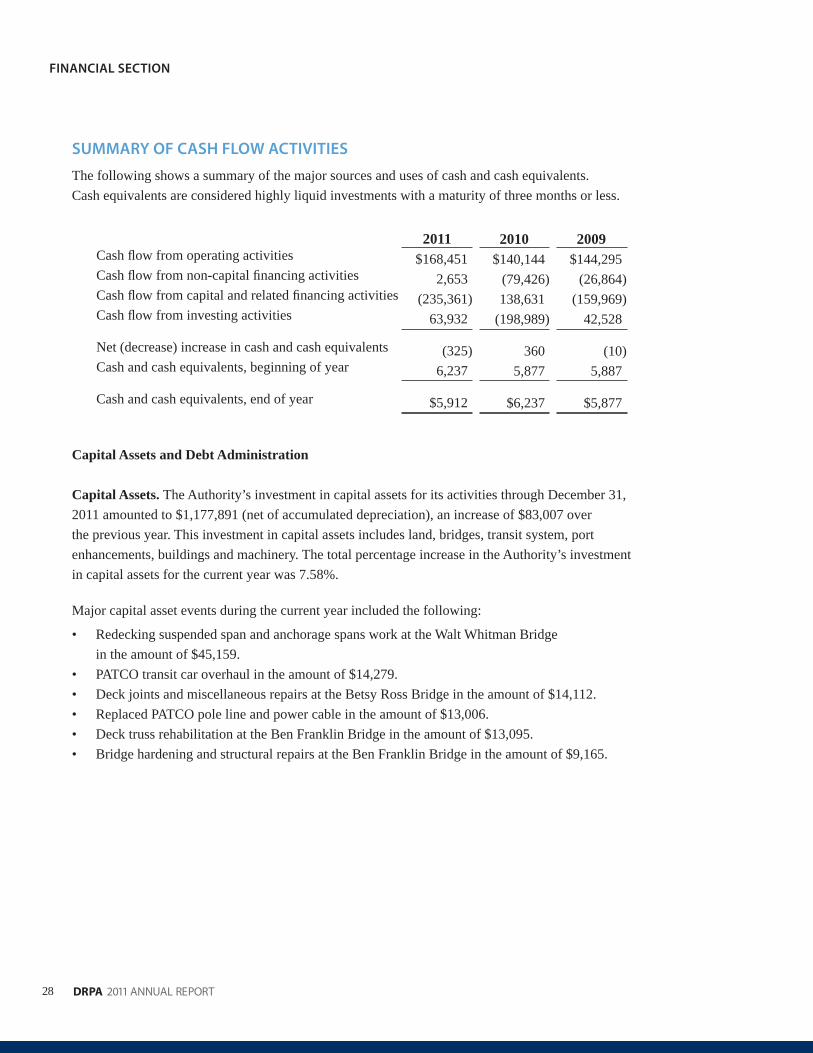
SUMMARY OF CASH FLOW ACTIVITIES
The following shows a summary of the major sources and uses of cash and cash equivalents.Cash equivalents are considered highly liquid investments with a maturity of three months or less.
Cash fl ow from operating activities Cash fl ow from non-capital fi nancing activities Cash fl ow from capital and related fi nancing activities Cash fl ow from investing activities Net (decrease) increase in cash and cash equivalents Cash and cash equivalents, beginning of year
Cash and cash equivalents, end of year
Capital Assets and Debt Administration
Capital Assets. The Authority’s investment in capital assets for its activities through December 31, 2011 amounted to $1,177,891 (net of accumulated depreciation), an increase of $83,007 over the previous year. This investment in capital assets includes land, bridges, transit system, port enhancements, buildings and machinery. The total percentage increase in the Authority’s investment in capital assets for the current year was 7.58%.
Major capital asset events during the current year included the following:
Redecking suspended span and anchorage spans work at the Walt Whitman Bridge • in the amount of $45,159.PATCO transit car overhaul in the amount of $14,279.• Deck joints and miscellaneous repairs at the Betsy Ross Bridge in the amount of $14,112.• Replaced PATCO pole line and power cable in the amount of $13,006.• Deck truss rehabilitation at the Ben Franklin Bridge in the amount of $13,095.• Bridge hardening and structural repairs at the Ben Franklin Bridge in the amount of $9,165.•
2011$168,451
2,653(235,361)
63,932
(325)6,237
$5,912
2010$140,144
(79,426)138,631
(198,989)
3605,877
$6,237
2009$144,295
(26,864)(159,969)
42,528
(10)5,887
$5,877
29DRPA 2011 ANNUAL REPORT
FINANCIAL SECTION
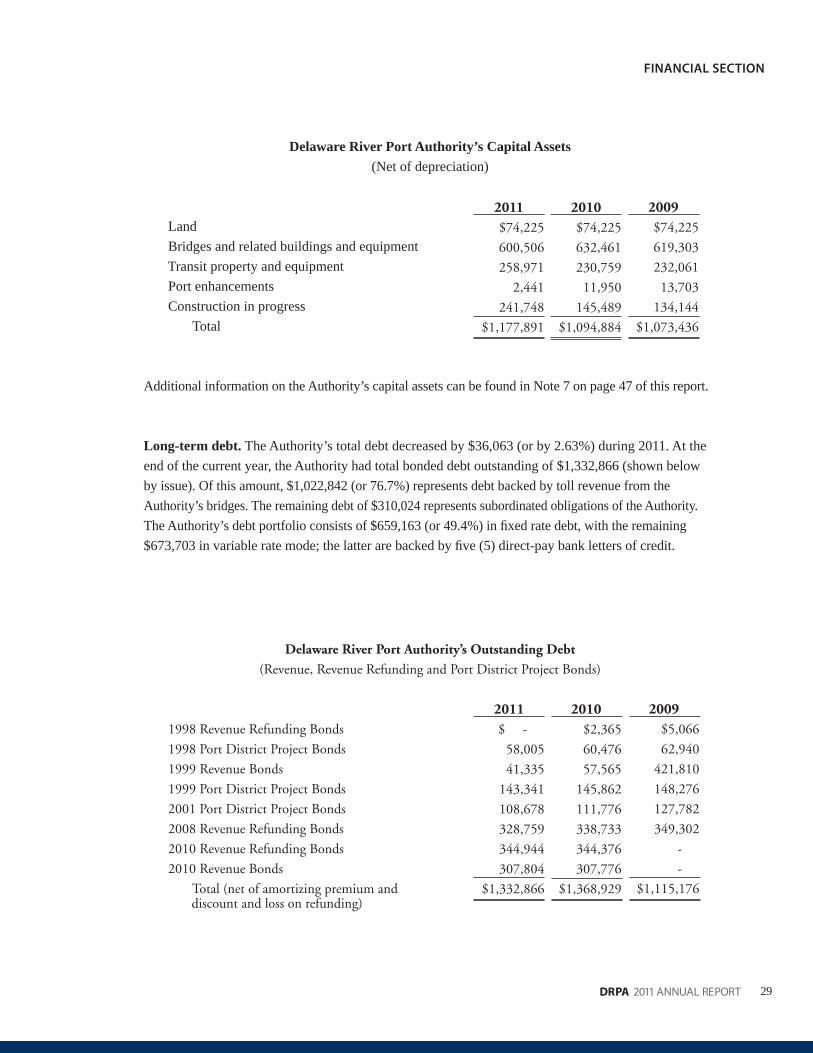
Delaware River Port Authority’s Capital Assets(Net of depreciation)
Land Bridges and related buildings and equipment Transit property and equipment Port enhancements Construction in progress Total
Additional information on the Authority’s capital assets can be found in Note 7 on page 47 of this report.
Long-term debt. The Authority’s total debt decreased by $36,063 (or by 2.63%) during 2011. At the end of the current year, the Authority had total bonded debt outstanding of $1,332,866 (shown below by issue). Of this amount, $1,022,842 (or 76.7%) represents debt backed by toll revenue from the Authority’s bridges. The remaining debt of $310,024 represents subordinated obligations of the Authority. The Authority’s debt portfolio consists of $659,163 (or 49.4%) in fi xed rate debt, with the remaining $673,703 in variable rate mode; the latter are backed by fi ve (5) direct-pay bank letters of credit.
2009$74,225
619,303
232,061
13,703
134,144
$1,073,436
2011$74,225
600,506
258,971
2,441
241,748
$1,177,891
2010$74,225
632,461
230,759
11,950
145,489
$1,094,884
Delaware River Port Authority’s Outstanding Debt
(Revenue, Revenue Refunding and Port District Project Bonds)
1998 Revenue Refunding Bonds
1998 Port District Project Bonds
1999 Revenue Bonds
1999 Port District Project Bonds
2001 Port District Project Bonds
2008 Revenue Refunding Bonds
2010 Revenue Refunding Bonds
2010 Revenue Bonds
Total (net of amortizing premium and discount and loss on refunding)
2009$5,066
62,940
421,810
148,276
127,782
349,302
-
-
$1,115,176
2011$ -
58,005
41,335
143,341
108,678
328,759
344,944
307,804
$1,332,866
2010$2,365
60,476
57,565
145,862
111,776
338,733
344,376
307,776
$1,368,929
30
FINANCIAL SECTION
DRPA 2011 ANNUAL REPORT
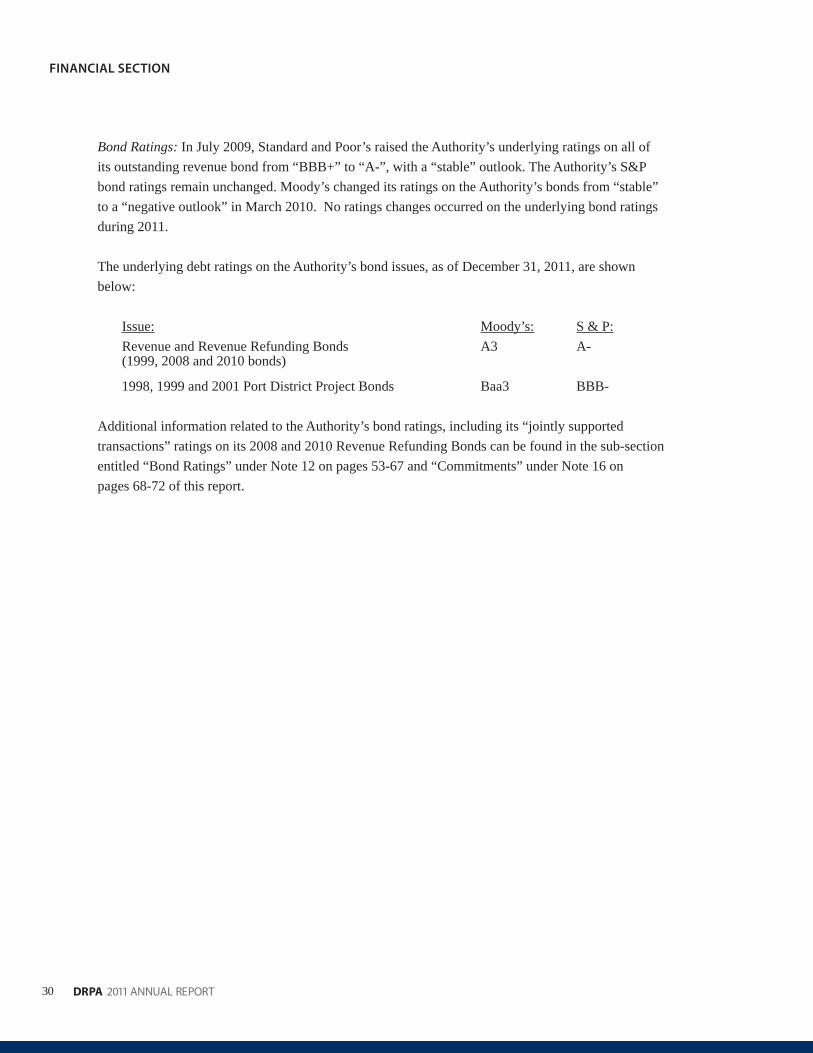
Bond Ratings: In July 2009, Standard and Poor’s raised the Authority’s underlying ratings on all of its outstanding revenue bond from “BBB+” to “A-”, with a “stable” outlook. The Authority’s S&P bond ratings remain unchanged. Moody’s changed its ratings on the Authority’s bonds from “stable” to a “negative outlook” in March 2010. No ratings changes occurred on the underlying bond ratings during 2011.
The underlying debt ratings on the Authority’s bond issues, as of December 31, 2011, are shown below:
Issue: Moody’s: S & P: Revenue and Revenue Refunding Bonds A3 A- (1999, 2008 and 2010 bonds)
1998, 1999 and 2001 Port District Project Bonds Baa3 BBB-
Additional information related to the Authority’s bond ratings, including its “jointly supported transactions” ratings on its 2008 and 2010 Revenue Refunding Bonds can be found in the sub-section entitled “Bond Ratings” under Note 12 on pages 53-67 and “Commitments” under Note 16 on pages 68-72 of this report.
31DRPA 2011 ANNUAL REPORT
FINANCIAL SECTION
Economic Factors and Next Year’s Budgets The following factors were considered in preparing the Authority’s budget for the 2012 year:
Little or no growth in the overall regional economy.• No bridge toll or PATCO fare increases during 2012.• Bridge toll revenues projected to approach $287.4 million, attributable to increase of $17.9 million in • budgeted toll revenues vs. 2011. (This increase results from the full year impact of the 25% across-the-board toll increase on all vehicles, which became effective July 1, 2011.) Bridge traffi c is expected to dip slightly attributable to economic factors and elasticity of demand • (net toll revenues include a three-day adjustment for the projected impact of snowstorms).Increase of 3.3% in projected PATCO fares and revenues over 2011, increasing to $25.6 million, • attributable to the full year’s impact of passenger fare increase effective July 1, 2011. Passenger ridership is budgeted to remain fl at vs. the 2011 budget, at 10.0 million riders annually. Biennial inspection costs estimated to be $3.0 million in 2012.• Flat operating expense growth for DRPA and PATCO.• Projected increase of approximately $8.75 million in budgeted total debt service, primarily related • to the anticipated issuance of new revenue bonds in late 2012 to fi nance the second portion of the Authority’s fi ve-year capital plan. Total debt service projected to be $130.2 million for 2012. Debt service costs on the Authority’s variable rate bonds are expected to remain stable, although bank direct letters of credit costs (related to the 2008 and 2010 Revenue Refunding variable rate bonds) are expected to decrease by approximately $176 annually, a 1.6% decrease.
The Authority’s actual financial results could vary materially from management’s expectations because of changes in such factors, and other risks and uncertainties that adversely impact the Authority’s operations.
Requests for Information
This financial report is designed to provide a general overview of the Authority’s activities for all of those with an interest in the Authority’s activities through December 31, 2011. Questions from interested parties concerning any of the information provided in this report or requests for additional financial information should be addressed to the Office of the Chief Financial Officer, Delaware River Port Authority, One Port Center, 2 Riverside Drive, P.O. Box 1949, Camden, NJ 08101-1949.
32
FINANCIAL SECTION
DRPA 2011 ANNUAL REPORT
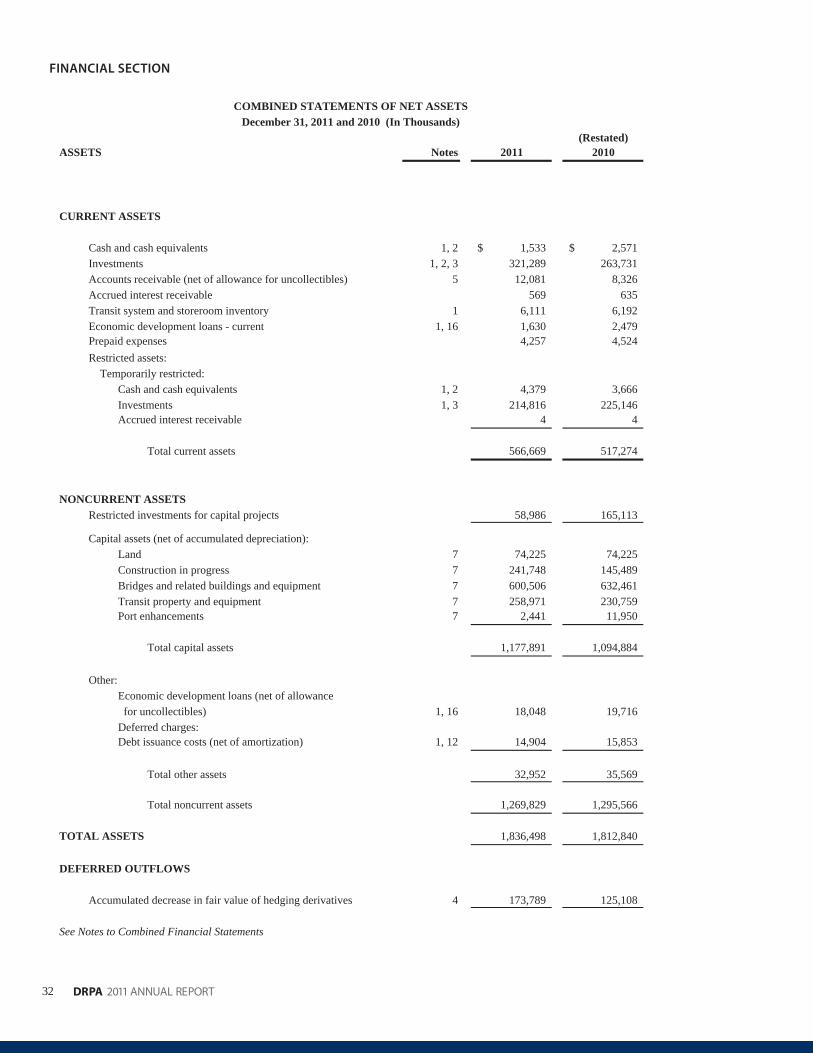
COMBINED STATEMENTS OF NET ASSETSDecember 31, 2011 and 2010 (In Thousands)
(Restated)ASSETS Notes 2011 2010
CURRENT ASSETS
Cash and cash equivalents 1, 2 1,533$ 2,571$Investments 1, 2, 3 321,289 263,731Accounts receivable (net of allowance for uncollectibles) 5 12,081 8,326Accrued interest receivable 569 635Transit system and storeroom inventory 1 6,111 6,192Economic development loans - current 1, 16 1,630 2,479Prepaid expenses 4,257 4,524Restricted assets: Temporarily restricted:
Cash and cash equivalents 1, 2 4,379 3,666Investments 1, 3 214,816 225,146Accrued interest receivable 4 4
Total current assets 566,669 517,274
NONCURRENT ASSETSRestricted investments for capital projects 58,986 165,113
Capital assets (net of accumulated depreciation):Land 7 74,225 74,225Construction in progress 7 241,748 145,489Bridges and related buildings and equipment 7 600,506 632,461Transit property and equipment 7 258,971 230,759Port enhancements 7 2,441 11,950
Total capital assets 1,177,891 1,094,884
Other:Economic development loans (net of allowance for uncollectibles) 1, 16 18,048 19,716Deferred charges:Debt issuance costs (net of amortization) 1, 12 14,904 15,853
Total other assets 32,952 35,569
Total noncurrent assets 1,269,829 1,295,566
TOTAL ASSETS 1,836,498 1,812,840
DEFERRED OUTFLOWS
Accumulated decrease in fair value of hedging derivatives 4 173,789 125,108
See Notes to Combined Financial Statements
33DRPA 2011 ANNUAL REPORT
FINANCIAL SECTION
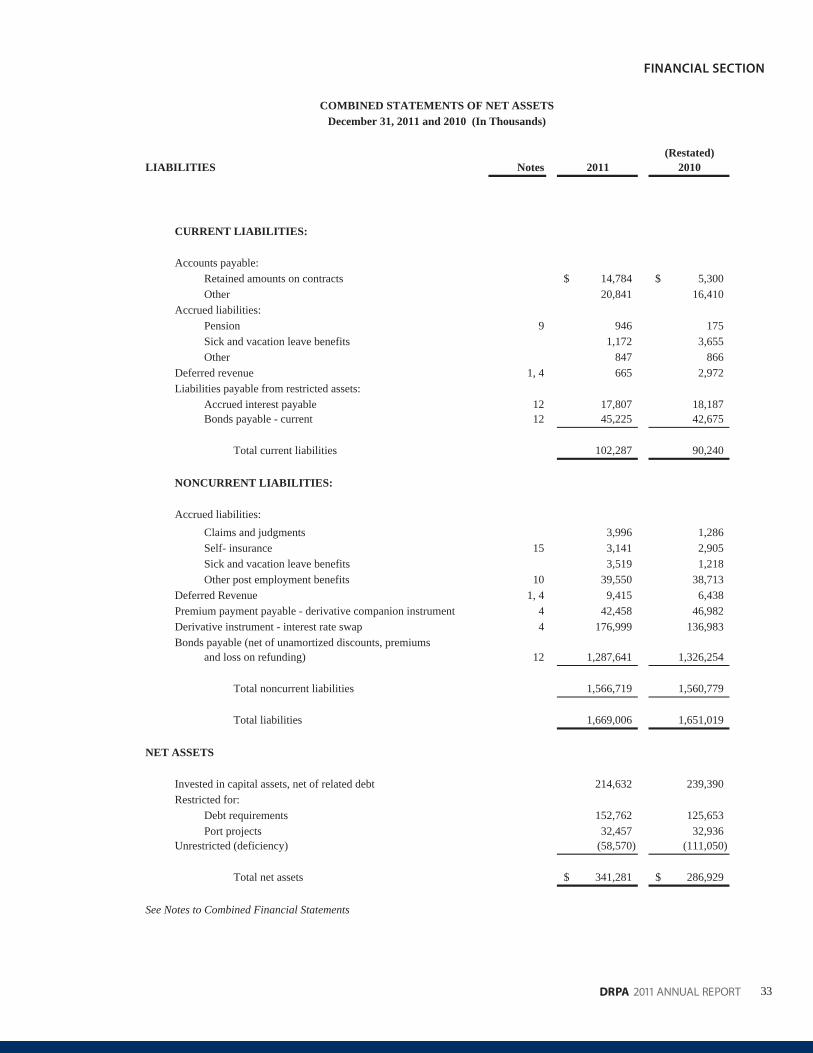
COMBINED STATEMENTS OF NET ASSETSDecember 31, 2011 and 2010 (In Thousands)
(Restated)LIABILITIES Notes 2011 2010
CURRENT LIABILITIES:
Accounts payable:Retained amounts on contracts 14,784$ 5,300$Other 20,841 16,410
Accrued liabilities:Pension 9 946 175Sick and vacation leave benefits 1,172 3,655Other 847 866
Deferred revenue 1, 4 665 2,972Liabilities payable from restricted assets:
Accrued interest payable 12 17,807 18,187Bonds payable - current 12 45,225 42,675
Total current liabilities 102,287 90,240
NONCURRENT LIABILITIES:
Accrued liabilities:3,996 1,286
Self- insurance 15 3,141 2,905Sick and vacation leave benefits 3,519 1,218Other post employment benefits 10 39,550 38,713
Deferred Revenue 1, 4 9,415 6,438Premium payment payable - derivative companion instrument 4 42,458 46,982Derivative instrument - interest rate swap 4 176,999 136,983Bonds payable (net of unamortized discounts, premiums
and loss on refunding) 12 1,287,641 1,326,254
Total noncurrent liabilities 1,566,719 1,560,779
Total liabilities 1,669,006 1,651,019
NET ASSETS
Invested in capital assets, net of related debt 214,632 239,390Restricted for:
Debt requirements 152,762 125,653Port projects 32,457 32,936
Unrestricted (deficiency) (58,570) (111,050)
Total net assets 341,281$ 286,929$
See Notes to Combined Financial Statements
Claims and judgments
34
FINANCIAL SECTION
DRPA 2011 ANNUAL REPORT
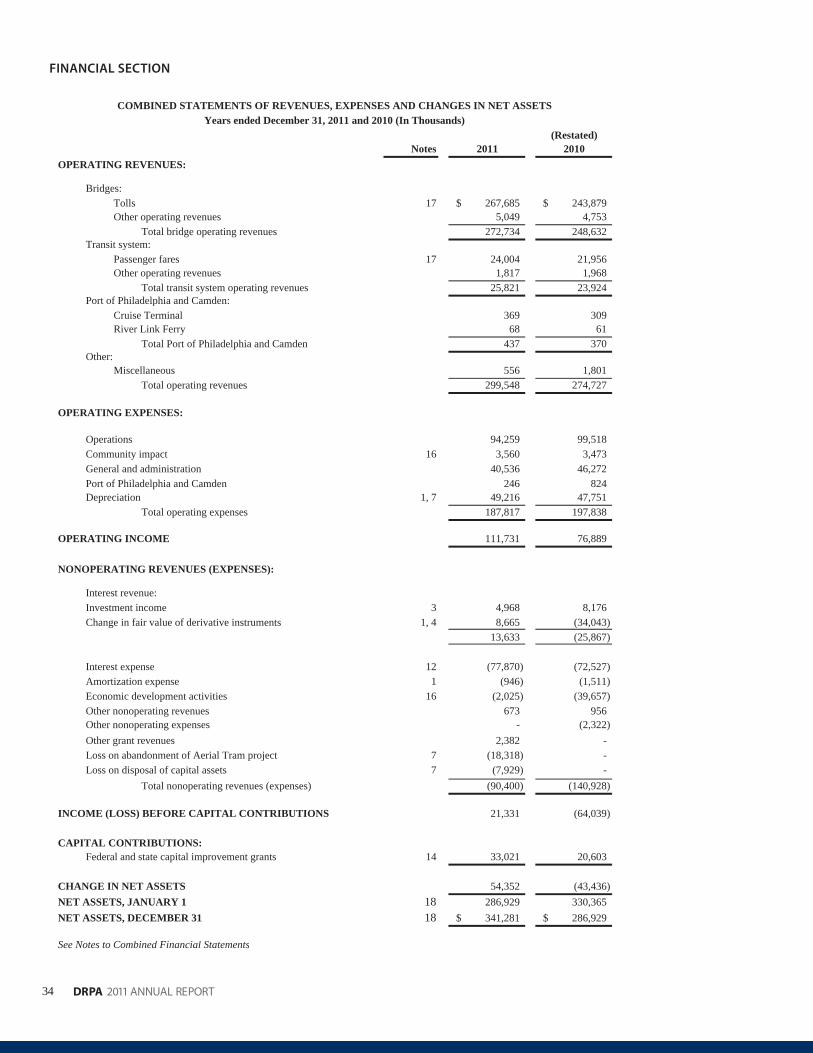
COMBINED STATEMENTS OF REVENUES, EXPENSES AND CHANGES IN NET ASSETSYears ended December 31, 2011 and 2010 (In Thousands)
(Restated)Notes 2011 2010
OPERATING REVENUES:
Bridges:Tolls 17 267,685$ 243,879$Other operating revenues 5,049 4,753
Total bridge operating revenues 272,734 248,632Transit system:
Passenger fares 17 24,004 21,956Other operating revenues 1,817 1,968
Total transit system operating revenues 25,821 23,924Port of Philadelphia and Camden:
Cruise Terminal 369 309River Link Ferry 68 61
Total Port of Philadelphia and Camden 437 370Other:
Miscellaneous 556 1,801Total operating revenues 299,548 274,727
OPERATING EXPENSES:
Operations 94,259 99,518Community impact 16 3,560 3,473General and administration 40,536 46,272Port of Philadelphia and Camden 246 824Depreciation 1, 7 49,216 47,751
Total operating expenses 187,817 197,838
OPERATING INCOME 111,731 76,889
NONOPERATING REVENUES (EXPENSES):
Interest revenue:Investment income 3 4,968 8,176Change in fair value of derivative instruments 1, 4 8,665 (34,043)
13,633 (25,867)
Interest expense 12 (77,870) (72,527)Amortization expense 1 (946) (1,511)Economic development activities 16 (2,025) (39,657)Other nonoperating revenues 673 956Other nonoperating expenses - (2,322)
2,382 -Loss on abandonment of Aerial Tram project 7 (18,318) -Loss on disposal of capital assets 7 (7,929) -
Total nonoperating revenues (expenses) (90,400) (140,928)
INCOME (LOSS) BEFORE CAPITAL CONTRIBUTIONS 21,331 (64,039)
CAPITAL CONTRIBUTIONS:Federal and state capital improvement grants 14 33,021 20,603
CHANGE IN NET ASSETS 54,352 (43,436)NET ASSETS, JANUARY 1 18 286,929 330,365NET ASSETS, DECEMBER 31 18 341,281$ 286,929$
See Notes to Combined Financial Statements
Other grant revenues
35DRPA 2011 ANNUAL REPORT
FINANCIAL SECTION
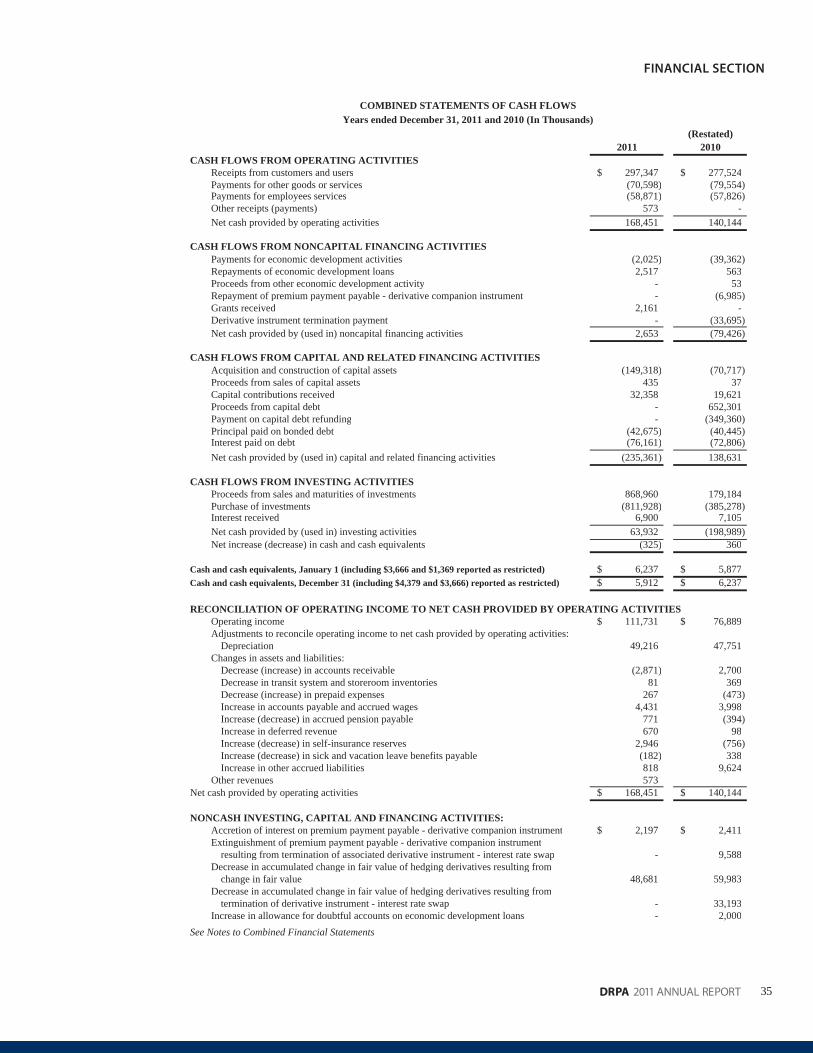
COMBINED STATEMENTS OF CASH FLOWSYears ended December 31, 2011 and 2010 (In Thousands)
(Restated)2011 2010
CASH FLOWS FROM OPERATING ACTIVITIESReceipts from customers and users 297,347$ 277,524$Payments for other goods or services (70,598) (79,554)Payments for employees services (58,871) (57,826)Other receipts (payments) 573 -Net cash provided by operating activities 168,451 140,144
CASH FLOWS FROM NONCAPITAL FINANCING ACTIVITIESPayments for economic development activities (2,025) (39,362)Repayments of economic development loans 2,517 563Proceeds from other economic development activity - 53Repayment of premium payment payable - derivative companion instrument - (6,985)Grants received 2,161 -Derivative instrument termination payment - (33,695)Net cash provided by (used in) noncapital financing activities 2,653 (79,426)
CASH FLOWS FROM CAPITAL AND RELATED FINANCING ACTIVITIESAcquisition and construction of capital assets (149,318) (70,717)Proceeds from sales of capital assets 435 37Capital contributions received 32,358 19,621Proceeds from capital debt - 652,301Payment on capital debt refunding - (349,360)Principal paid on bonded debt (42,675) (40,445)Interest paid on debt (76,161) (72,806)Net cash provided by (used in) capital and related financing activities (235,361) 138,631
CASH FLOWS FROM INVESTING ACTIVITIESProceeds from sales and maturities of investments 868,960 179,184Purchase of investments (811,928) (385,278)Interest received 6,900 7,105Net cash provided by (used in) investing activities 63,932 (198,989)Net increase (decrease) in cash and cash equivalents (325) 360
Cash and cash equivalents, January 1 (including $3,666 and $1,369 reported as restricted) 6,237$ 5,877$Cash and cash equivalents, December 31 (including $4,379 and $3,666) reported as restricted) 5,912$ 6,237$
RECONCILIATION OF OPERATING INCOME TO NET CASH PROVIDED BY OPERATING ACTIVITIESOperating income 111,731$ 76,889$Adjustments to reconcile operating income to net cash provided by operating activities:
Depreciation 49,216 47,751Changes in assets and liabilities:
Decrease (increase) in accounts receivable (2,871) 2,700Decrease in transit system and storeroom inventories 81 369Decrease (increase) in prepaid expenses 267 (473)Increase in accounts payable and accrued wages 4,431 3,998Increase (decrease) in accrued pension payable 771 (394)Increase in deferred revenue 670 98Increase (decrease) in self-insurance reserves 2,946 (756)Increase (decrease) in sick and vacation leave benefits payable (182) 338Increase in other accrued liabilities 818 9,624
573Net cash provided by operating activities 168,451$ 140,144$
NONCASH INVESTING, CAPITAL AND FINANCING ACTIVITIES:Accretion of interest on premium payment payable - derivative companion instrument 2,197$ 2,411$Extinguishment of premium payment payable - derivative companion instrument
resulting from termination of associated derivative instrument - interest rate swap - 9,588Decrease in accumulated change in fair value of hedging derivatives resulting from
change in fair value 48,681 59,983Decrease in accumulated change in fair value of hedging derivatives resulting from
termination of derivative instrument - interest rate swap - 33,193Increase in allowance for doubtful accounts on economic development loans - 2,000
See Notes to Combined Financial Statements
Other revenues
36
FINANCIAL SECTION
DRPA 2011 ANNUAL REPORT
NOTES TO COMBINED FINANCIAL STATEMENTSFor the Year Ended December 31, 2011 (Dollars in Thousands)
NOTE 1. SUMMARY OF SIGNIFICANT ACCOUNTING POLICIES
A. Description of Operations: The Delaware River Port Authority (the Authority ) is a public corporateinstrumentality of the Commonwealth of Pennsylvania (the Commonwealth ) and the State of New Jersey (the State ),created with the consent of Congress by compact legislation between the Commonwealth and the State. The Authority has no stockholders or equity holders. The Authority is vested with the ownership, control, operation, and collection of tollsand revenues of certain bridges spanning the Delaware River; namely, the Benjamin Franklin, Walt Whitman,Commodore Barry, and Betsy Ross bridges. The Authority has also constructed and owns a high-speed transit system that is operated by the Port Authority Transit Corporation ( PATCO ). The transit system operates between Philadelphia,Pennsylvania and Lindenwold, New Jersey. The Authority s Port of Philadelphia and Camden Department ( PPC ) isresponsible for the operation of the Philadelphia Cruise Terminal at Pier 1 at the former Navy Yard, and the RiverlinkFerry System. (The Authority discontinued operations related to the Philadelphia Cruise Terminal effective July 1, 2011).The costs of providing facilities and services to the general public on a continuing basis are recovered primarily in theform of tolls and fares. The Authority is a member of the E-ZPass Interagency Group, the largest interoperable ElectronicToll Collection System in the world, comprised of twenty-two (22) agencies in eleven (11) states. Through December2011, customer participation in the E-ZPass electronic toll collection process grew to approximately sixty-seven (67%) ofits toll collection activity during rush hour periods. E-ZPass revenues now exceed sixty-three percent (63%) of total tollrevenues.
B. Basis of Presentation: The Authority is a single enterprise fund and maintains its records on the accrual basisof accounting. Enterprise Funds account for activities (i) that are financed with debt that is secured solely by a pledge ofthe net revenues from fees and charges of the activity; or (ii) that are required by law or regulations that the activity s costof providing services, including capital cost (such as depreciation or debt service), be recovered with fees and charges,rather than with taxes or similar revenues; or (iii) that the pricing policies of the activity establish fees and chargesdesigned to recover its costs, including capital costs (such as depreciation or debt service). Under the accrual basis ofaccounting, revenues are recorded when earned and expenses are recorded when the related liability is incurred. TheAuthority has elected not to follow any FASB pronouncements issued after November 30, 1989.
C. Cash and Cash Equivalents: The Authority considers all highly liquid investments with a maturity of threemonths or less when purchased to be cash equivalents (Note 2). In addition, according to the various Indentures of Trustwhich govern the flow and accounting of the Authority s financial resources, certain accounts are required to bemaintained in order to comply with the provisions of the Indentures of Trust. For the accounts that are restricted, theAuthority has recorded the applicable cash and cash equivalents as restricted on the combined financial statements (Note11).
D. Investment in Securities: Investments are stated at fair value, generally based on quoted market prices.Certain investments are maintained in connection with the Authority s funded debt (Notes 3 and 12). Likewise, as withcash and cash equivalents, the accounts that are restricted as per the various Indentures of Trust have been recorded asrestricted investments on the combined financial statements (Note 11).
E. Accounts Receivable: The Authority establishes a provision for the estimated amount of uncollectibleaccounts based on an individual account basis.
F. Transit System Inventory: Transit system inventory, consisting principally of spare parts for maintenance oftransit system facilities, is stated at the lower of cost (first-in, first-out method) or market.
G. Debt Issuance Costs, Bond Premiums, Bond Discounts and Loss on Refunding: Debt issuance costs areamortized by the straight-line method from the issue date to maturity. Premiums, discounts and loss on refunding arisingfrom the issuance of the revenue bonds and port district project bonds are amortized by the effective interest method fromthe issue date to maturity.
H. Investment in Facilities: Investment in facilities is stated at cost, which generally includes expenses foradministrative and legal expenses incurred during the construction period. Investment in facilities also includes the costincurred for port-related projects, and improvements, enlargements and betterments to the original facilities.Replacements of existing facilities (except for primarily police and certain other vehicles whose estimated useful life istwo years or less) are also recorded at cost. The related costs and accumulated depreciation of the property replaced areremoved from the respective accounts, and any gain or loss on disposition is credited or charged to non-operating revenues or expenses. Assets capitalizable generally have an original cost of five thousand dollars ($5) or more and a useful life inexcess of three years. Depreciation and amortization are provided using the straight-line method over the estimated usefullives of the related assets, including those financed by federal and state contributions (Notes 7 and 14).
37DRPA 2011 ANNUAL REPORT
FINANCIAL SECTION
Asset lives used in the calculation of depreciation are generally as follows:
Bridges, freeways and tunnels 100 years Buildings, stations and certain bridge components 35 - 50 years Electrification, signals and communication system 30 - 40 years Transit cars, machinery and equipment 10 - 25 years Computer equipment, automobiles and other equipment 3 - 10 years
I. Maintenance and Repairs: Maintenance and repair costs considered necessary to maintain bridge facilities in good operating condition are charged to operations as incurred.
J. Self-insurance: The Authority provides for the uninsured portion of potential public liability claims andworkers compensation claims through self-insurance programs and charges current operations for estimated claims to bepaid (Note 15).
K. Economic Development Activities: The Authority establishes loan loss provisions for economic development loans receivable, based upon collection history and analysis of creditor s ability to pay. The Authority has established a loss reserve in the amount of $1,345 for its economic development loans outstanding.
L. Net Assets: Net assets are classified in the following three components:Invested in Capital Assets, Net of Related Debt: This component of net assets consists of capital assets, net of
accumulated depreciation, reduced, by the outstanding balances of any bonds, notes or other borrowings that areattributable to the acquisition, construction, or improvement of those assets. If there are significant unspent related debtproceeds at year-end, the portion of the debt attributable to the unspent proceeds is not included in the calculation ofinvested in capital assets, net of related debt. Rather, that portion of the debt is included in the same net assets componentas the unspent proceeds.
Restricted: This component of net assets consists of external constraints imposed by creditors (such as debtcovenants), grantors, contributors, laws or regulations of other governments, or constraints imposed by law throughconstitutional provisions or enabling legislation, that restricts the use of net assets.
Unrestricted Net Assets: This component of net assets consists of net assets that do not meet the definition ofrestricted or invested in capital assets, net of related debt. This component includes net assets that may be allocated
for specific purposes by the Board. A deficiency will require future funding.M. Operating and Non-operating Revenues and Expenses: Operating revenues include all revenues derived
from facility charges (i.e., toll revenues, which include E-ZPass revenues), PATCO operations (passenger fare, advertising and parking), and other revenue sources. Non-operating revenues principally consist of interest income earned on variousinterest-bearing accounts and on investments in debt securities.
Operating expenses include expenses associated with the operation, maintenance and repair of the bridges,PATCO, PPC operations, and general administrative expenses. Non-operating expenses principally include expensesattributable to the Authority s interest on funded debt and economic development activities.
When both restricted and unrestricted resources are available for use, it is the Authority s policy to use restrictedresources first, then unrestricted resources as they are needed.
N. Debt Management: Total outstanding bond debt reflected on the balance sheet is net of unamortized bonddiscounts, premiums, and loss on refunding (Note 12). The Authority presently has two active interest rate hedge (swap)agreements (derivative instruments) with UBS AG (Paine Webber) to hedge interest rates on a portion of its outstandinglong-term debt (Note 4).
O. Derivative Instruments and the Related Companion Instruments: The Authority has entered into twointerest rate swap agreements with Bank of America, N.A. for the primary purposes of investing and for theaforementioned purpose of hedging interest rates on its outstanding long-term debt. In accordance with GovernmentalAccounting Standards Board Statement No. 53, Accounting and Financial Reporting for Derivative Instruments, allactivity related to the interest rate swap agreements has been recorded on the combined financial statements and is furtherdetailed in Note 4.
P. Budget: In accordance with Section 5.15 of the 1998 Revenue Refunding Bonds Indenture of Trust and itsSupplemental Indentures and Section 5.07 of the 1998, 1999 and 2001 Port District Project Bond Indentures of Trust, theAuthority must annually adopt an Annual Budget on or before December 31 for the ensuing year. Section 5.15 of the1998 Revenue Bond Indenture of Trust requires that the Authority, on or before December 31, in each fiscal year, adopt afinal budget for the ensuing fiscal year of (i) operational expenses, (ii) the PATCO Subsidy, (iii) the amount to bedeposited to the credit of the Maintenance Reserve Fund, and (iv) the estimated amounts to be deposited into the DebtService Fund, the Debt Service Reserve Fund, and the Rebate Fund. Each Annual Budget must also contain theAuthority s projections of revenues for the ensuing fiscal year demonstrating compliance with the covenant as to facilitycharges as set forth in Section 5.09 of the Indentures of Trust. On or before December 31 in each fiscal year, the Authority must file a copy of the Annual Budget for the ensuing fiscal year with the Trustees.
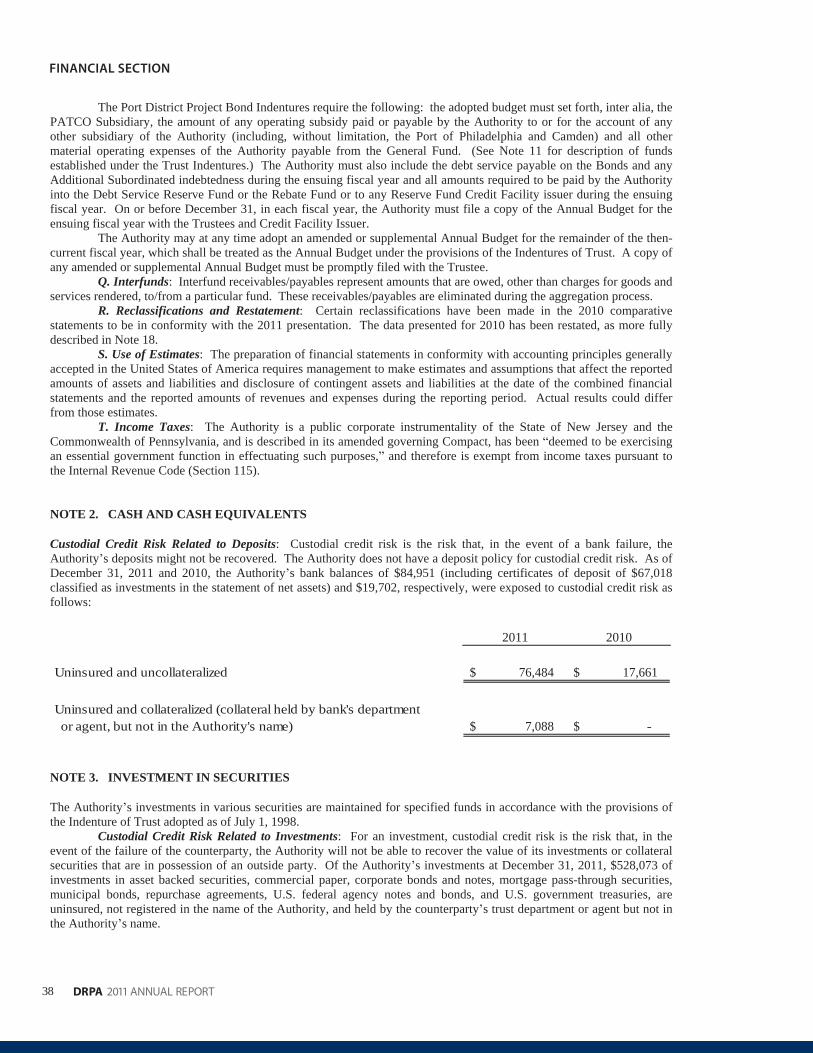
38
FINANCIAL SECTION
DRPA 2011 ANNUAL REPORT
The Port District Project Bond Indentures require the following: the adopted budget must set forth, inter alia, the PATCO Subsidiary, the amount of any operating subsidy paid or payable by the Authority to or for the account of anyother subsidiary of the Authority (including, without limitation, the Port of Philadelphia and Camden) and all othermaterial operating expenses of the Authority payable from the General Fund. (See Note 11 for description of fundsestablished under the Trust Indentures.) The Authority must also include the debt service payable on the Bonds and anyAdditional Subordinated indebtedness during the ensuing fiscal year and all amounts required to be paid by the Authorityinto the Debt Service Reserve Fund or the Rebate Fund or to any Reserve Fund Credit Facility issuer during the ensuingfiscal year. On or before December 31, in each fiscal year, the Authority must file a copy of the Annual Budget for theensuing fiscal year with the Trustees and Credit Facility Issuer.
The Authority may at any time adopt an amended or supplemental Annual Budget for the remainder of the then-current fiscal year, which shall be treated as the Annual Budget under the provisions of the Indentures of Trust. A copy of any amended or supplemental Annual Budget must be promptly filed with the Trustee.
Q. Interfunds: Interfund receivables/payables represent amounts that are owed, other than charges for goods and services rendered, to/from a particular fund. These receivables/payables are eliminated during the aggregation process.
R. Reclassifications and Restatement: Certain reclassifications have been made in the 2010 comparativestatements to be in conformity with the 2011 presentation. The data presented for 2010 has been restated, as more fullydescribed in Note 18.
S. Use of Estimates: The preparation of financial statements in conformity with accounting principles generallyaccepted in the United States of America requires management to make estimates and assumptions that affect the reportedamounts of assets and liabilities and disclosure of contingent assets and liabilities at the date of the combined financialstatements and the reported amounts of revenues and expenses during the reporting period. Actual results could differfrom those estimates.
T. Income Taxes: The Authority is a public corporate instrumentality of the State of New Jersey and theCommonwealth of Pennsylvania, and is described in its amended governing Compact, has been deemed to be exercisingan essential government function in effectuating such purposes, and therefore is exempt from income taxes pursuant tothe Internal Revenue Code (Section 115).
NOTE 2. CASH AND CASH EQUIVALENTS
Custodial Credit Risk Related to Deposits: Custodial credit risk is the risk that, in the event of a bank failure, theAuthority s deposits might not be recovered. The Authority does not have a deposit policy for custodial credit risk. As ofDecember 31, 2011 and 2010, the Authority s bank balances of $84,951 (including certificates of deposit of $67,018classified as investments in the statement of net assets) and $19,702, respectively, were exposed to custodial credit risk asfollows:
2011 2010
Uninsured and uncollateralized 76,484$ 17,661$
Uninsured and collateralized (collateral held by bank's departmentor agent, but not in the Authority's name) 7,088$ -$
NOTE 3. INVESTMENT IN SECURITIES
The Authority s investments in various securities are maintained for specified funds in accordance with the provisions ofthe Indenture of Trust adopted as of July 1, 1998.
Custodial Credit Risk Related to Investments: For an investment, custodial credit risk is the risk that, in theevent of the failure of the counterparty, the Authority will not be able to recover the value of its investments or collateralsecurities that are in possession of an outside party. Of the Authority s investments at December 31, 2011, $528,073 ofinvestments in asset backed securities, commercial paper, corporate bonds and notes, mortgage pass-through securities,municipal bonds, repurchase agreements, U.S. federal agency notes and bonds, and U.S. government treasuries, areuninsured, not registered in the name of the Authority, and held by the counterparty s trust department or agent but not inthe Authority s name.
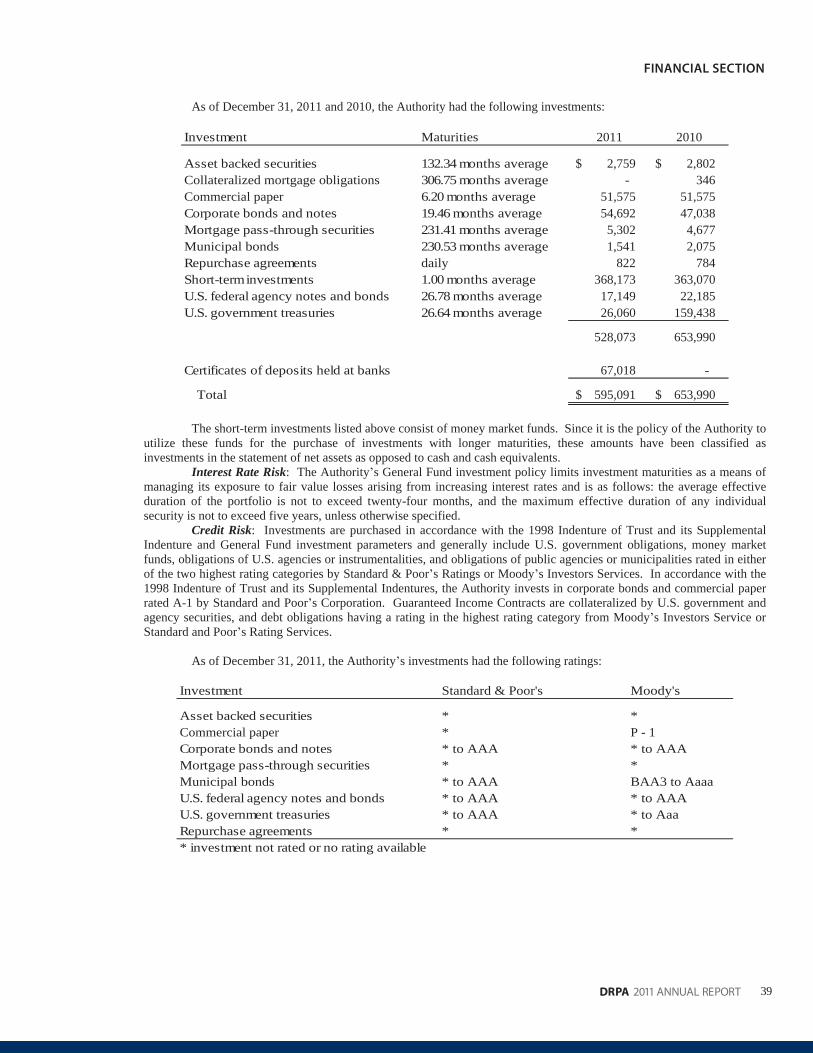
39DRPA 2011 ANNUAL REPORT
FINANCIAL SECTION
As of December 31, 2011 and 2010, the Authority had the following investments:
Investment Maturities 2011 2010
Asset backed securities 132.34 months average 2,759$ 2,802$Collateralized mortgage obligations 306.75 months average - 346Commercial paper 6.20 months average 51,575 51,575Corporate bonds and notes 19.46 months average 54,692 47,038Mortgage pass-through securities 231.41 months average 5,302 4,677Municipal bonds 230.53 months average 1,541 2,075Repurchase agreements daily 822 784Short-terminvestments 1.00 months average 368,173 363,070U.S. federal agency notes and bonds 26.78 months average 17,149 22,185U.S. government treasuries 26.64 months average 26,060 159,438
528,073 653,990
Certificates of deposits held at banks 67,018 -
Total 595,091$ 653,990$
The short-term investments listed above consist of money market funds. Since it is the policy of the Authority toutilize these funds for the purchase of investments with longer maturities, these amounts have been classified asinvestments in the statement of net assets as opposed to cash and cash equivalents.
Interest Rate Risk: The Authority s General Fund investment policy limits investment maturities as a means ofmanaging its exposure to fair value losses arising from increasing interest rates and is as follows: the average effectiveduration of the portfolio is not to exceed twenty-four months, and the maximum effective duration of any individualsecurity is not to exceed five years, unless otherwise specified.
Credit Risk: Investments are purchased in accordance with the 1998 Indenture of Trust and its SupplementalIndenture and General Fund investment parameters and generally include U.S. government obligations, money marketfunds, obligations of U.S. agencies or instrumentalities, and obligations of public agencies or municipalities rated in eitherof the two highest rating categories by Standard & Poor s Ratings or Moody s Investors Services. In accordance with the1998 Indenture of Trust and its Supplemental Indentures, the Authority invests in corporate bonds and commercial paperrated A-1 by Standard and Poor s Corporation. Guaranteed Income Contracts are collateralized by U.S. government andagency securities, and debt obligations having a rating in the highest rating category from Moody s Investors Service orStandard and Poor s Rating Services.
As of December 31, 2011, the Authority s investments had the following ratings:
Investment Standard & Poor's Moody's
Asset backed securities * *Commercial paper * P - 1Corporate bonds and notes * to AAA * to AAAMortgage pass-through securities * *Municipal bonds * to AAA BAA3 to AaaaU.S. federal agency notes and bonds * to AAA * to AAAU.S. government treasuries * to AAA * to AaaRepurchase agreements * ** investment not rated or no rating available
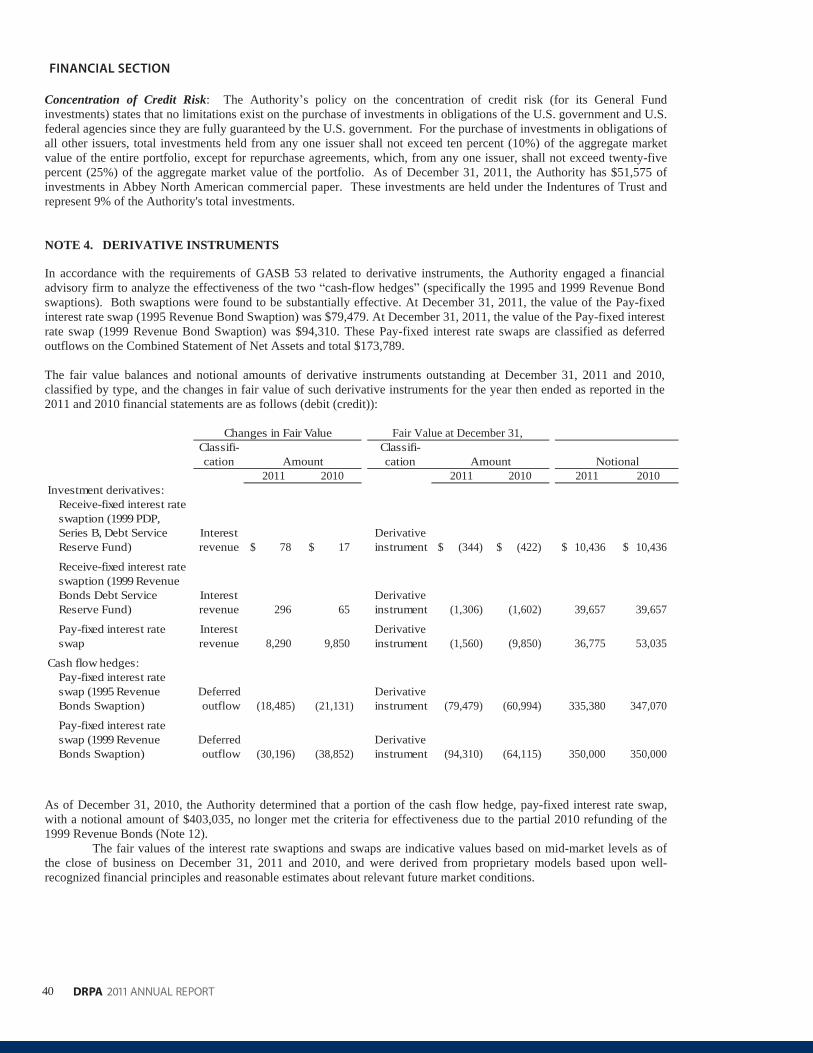
40
FINANCIAL SECTION
DRPA 2011 ANNUAL REPORT
Concentration of Credit Risk: The Authority s policy on the concentration of credit risk (for its General Fundinvestments) states that no limitations exist on the purchase of investments in obligations of the U.S. government and U.S. federal agencies since they are fully guaranteed by the U.S. government. For the purchase of investments in obligations of all other issuers, total investments held from any one issuer shall not exceed ten percent (10%) of the aggregate marketvalue of the entire portfolio, except for repurchase agreements, which, from any one issuer, shall not exceed twenty-fivepercent (25%) of the aggregate market value of the portfolio. As of December 31, 2011, the Authority has $51,575 ofinvestments in Abbey North American commercial paper. These investments are held under the Indentures of Trust andrepresent 9% of the Authority's total investments.
NOTE 4. DERIVATIVE INSTRUMENTS
In accordance with the requirements of GASB 53 related to derivative instruments, the Authority engaged a financialadvisory firm to analyze the effectiveness of the two cash-flow hedges (specifically the 1995 and 1999 Revenue Bondswaptions). Both swaptions were found to be substantially effective. At December 31, 2011, the value of the Pay-fixedinterest rate swap (1995 Revenue Bond Swaption) was $79,479. At December 31, 2011, the value of the Pay-fixed interest rate swap (1999 Revenue Bond Swaption) was $94,310. These Pay-fixed interest rate swaps are classified as deferredoutflows on the Combined Statement of Net Assets and total $173,789.
The fair value balances and notional amounts of derivative instruments outstanding at December 31, 2011 and 2010,classified by type, and the changes in fair value of such derivative instruments for the year then ended as reported in the2011 and 2010 financial statements are as follows (debit (credit)):
Classifi- Classifi-cation cation
2011 2010 2011 2010 2011 2010Investment derivatives:
Receive-fixed interest rateswaption (1999 PDP,Series B, Debt Service Interest DerivativeReserve Fund) revenue 78$ 17$ instrument (344)$ (422)$ 10,436$ 10,436$
Receive-fixed interest rateswaption (1999 RevenueBonds Debt Service Interest DerivativeReserve Fund) revenue 296 65 instrument (1,306) (1,602) 39,657 39,657
Pay-fixed interest rate Interest Derivativeswap revenue 8,290 9,850 instrument (1,560) (9,850) 36,775 53,035
Cash flow hedges:Pay-fixed interest rateswap (1995 Revenue Deferred DerivativeBonds Swaption) outflow (18,485) (21,131) instrument (79,479) (60,994) 335,380 347,070
Pay-fixed interest rateswap (1999 Revenue Deferred DerivativeBonds Swaption) outflow (30,196) (38,852) instrument (94,310) (64,115) 350,000 350,000
AmountAmount
Changes in Fair Value
Notional
Fair Value at December 31,
As of December 31, 2010, the Authority determined that a portion of the cash flow hedge, pay-fixed interest rate swap,with a notional amount of $403,035, no longer met the criteria for effectiveness due to the partial 2010 refunding of the1999 Revenue Bonds (Note 12).
The fair values of the interest rate swaptions and swaps are indicative values based on mid-market levels as ofthe close of business on December 31, 2011 and 2010, and were derived from proprietary models based upon well-recognized financial principles and reasonable estimates about relevant future market conditions.
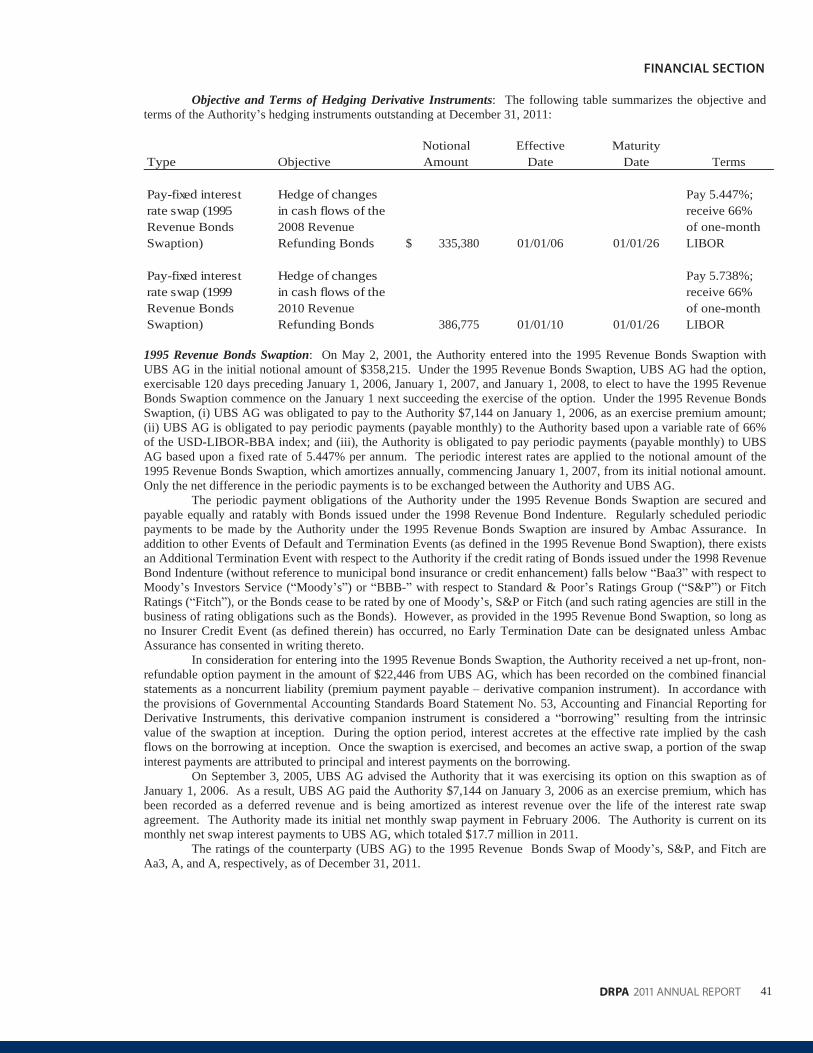
41DRPA 2011 ANNUAL REPORT
FINANCIAL SECTION
Objective and Terms of Hedging Derivative Instruments: The following table summarizes the objective andterms of the Authority s hedging instruments outstanding at December 31, 2011:
Notional Effective MaturityType Objective Amount Date Date Terms
Pay-fixed interest Hedge of changes Pay 5.447%;rate swap (1995 in cash flows of the receive 66% Revenue Bonds 2008 Revenue of one-monthSwaption) Refunding Bonds 335,380$ 01/01/06 01/01/26 LIBOR
Pay-fixed interest Hedge of changes Pay 5.738%;rate swap (1999 in cash flows of the receive 66% Revenue Bonds 2010 Revenue of one-monthSwaption) Refunding Bonds 386,775 01/01/10 01/01/26 LIBOR
1995 Revenue Bonds Swaption: On May 2, 2001, the Authority entered into the 1995 Revenue Bonds Swaption withUBS AG in the initial notional amount of $358,215. Under the 1995 Revenue Bonds Swaption, UBS AG had the option,exercisable 120 days preceding January 1, 2006, January 1, 2007, and January 1, 2008, to elect to have the 1995 RevenueBonds Swaption commence on the January 1 next succeeding the exercise of the option. Under the 1995 Revenue BondsSwaption, (i) UBS AG was obligated to pay to the Authority $7,144 on January 1, 2006, as an exercise premium amount;(ii) UBS AG is obligated to pay periodic payments (payable monthly) to the Authority based upon a variable rate of 66%of the USD-LIBOR-BBA index; and (iii), the Authority is obligated to pay periodic payments (payable monthly) to UBSAG based upon a fixed rate of 5.447% per annum. The periodic interest rates are applied to the notional amount of the1995 Revenue Bonds Swaption, which amortizes annually, commencing January 1, 2007, from its initial notional amount.Only the net difference in the periodic payments is to be exchanged between the Authority and UBS AG.
The periodic payment obligations of the Authority under the 1995 Revenue Bonds Swaption are secured andpayable equally and ratably with Bonds issued under the 1998 Revenue Bond Indenture. Regularly scheduled periodicpayments to be made by the Authority under the 1995 Revenue Bonds Swaption are insured by Ambac Assurance. Inaddition to other Events of Default and Termination Events (as defined in the 1995 Revenue Bond Swaption), there existsan Additional Termination Event with respect to the Authority if the credit rating of Bonds issued under the 1998 Revenue Bond Indenture (without reference to municipal bond insurance or credit enhancement) falls below Baa3 with respect toMoody s Investors Service ( Moody s ) or BBB- with respect to Standard & Poor s Ratings Group ( S&P ) or FitchRatings ( Fitch ), or the Bonds cease to be rated by one of Moody s, S&P or Fitch (and such rating agencies are still in thebusiness of rating obligations such as the Bonds). However, as provided in the 1995 Revenue Bond Swaption, so long asno Insurer Credit Event (as defined therein) has occurred, no Early Termination Date can be designated unless AmbacAssurance has consented in writing thereto.
In consideration for entering into the 1995 Revenue Bonds Swaption, the Authority received a net up-front, non-refundable option payment in the amount of $22,446 from UBS AG, which has been recorded on the combined financialstatements as a noncurrent liability (premium payment payable derivative companion instrument). In accordance withthe provisions of Governmental Accounting Standards Board Statement No. 53, Accounting and Financial Reporting forDerivative Instruments, this derivative companion instrument is considered a borrowing resulting from the intrinsicvalue of the swaption at inception. During the option period, interest accretes at the effective rate implied by the cashflows on the borrowing at inception. Once the swaption is exercised, and becomes an active swap, a portion of the swapinterest payments are attributed to principal and interest payments on the borrowing.
On September 3, 2005, UBS AG advised the Authority that it was exercising its option on this swaption as ofJanuary 1, 2006. As a result, UBS AG paid the Authority $7,144 on January 3, 2006 as an exercise premium, which hasbeen recorded as a deferred revenue and is being amortized as interest revenue over the life of the interest rate swapagreement. The Authority made its initial net monthly swap payment in February 2006. The Authority is current on itsmonthly net swap interest payments to UBS AG, which totaled $17.7 million in 2011.
The ratings of the counterparty (UBS AG) to the 1995 Revenue Bonds Swap of Moody s, S&P, and Fitch areAa3, A, and A, respectively, as of December 31, 2011.
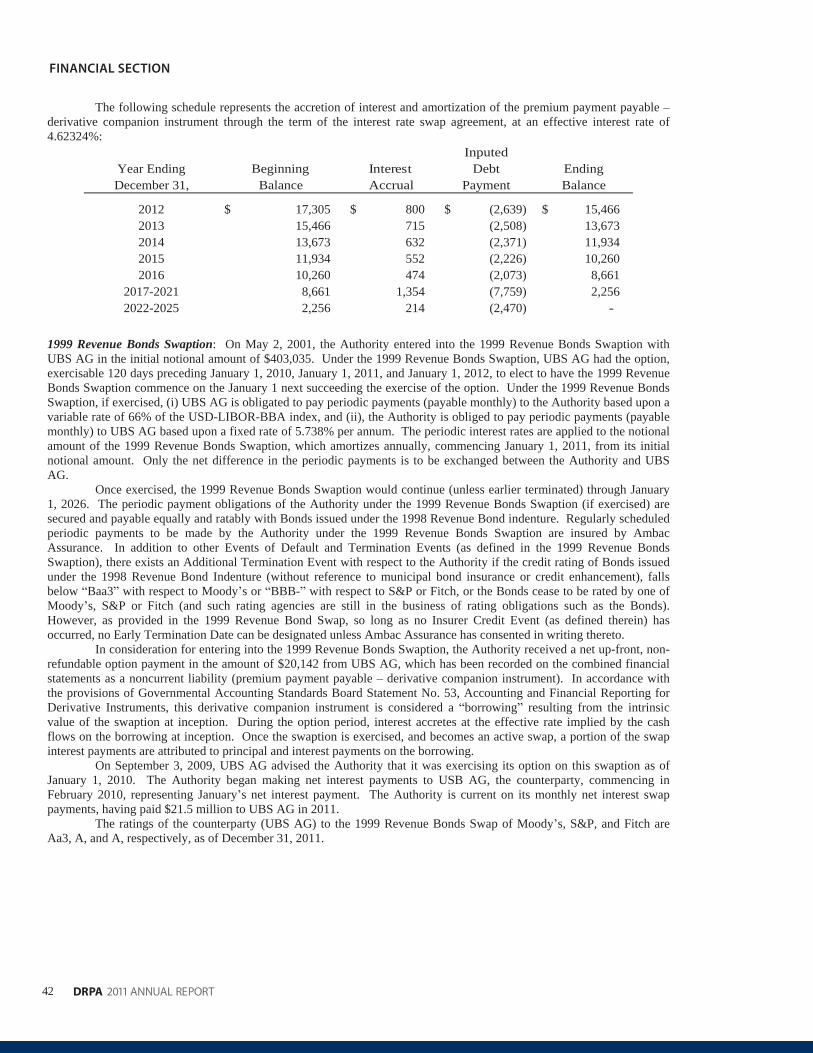
42
FINANCIAL SECTION
DRPA 2011 ANNUAL REPORT
The following schedule represents the accretion of interest and amortization of the premium payment payablederivative companion instrument through the term of the interest rate swap agreement, at an effective interest rate of4.62324%:
InputedYear Ending Beginning Interest Debt EndingDecember 31, Balance Accrual Payment Balance
2012 17,305$ 800$ (2,639)$ 15,466$2013 15,466 715 (2,508) 13,6732014 13,673 632 (2,371) 11,9342015 11,934 552 (2,226) 10,2602016 10,260 474 (2,073) 8,661
2017-2021 8,661 1,354 (7,759) 2,2562022-2025 2,256 214 (2,470) -
1999 Revenue Bonds Swaption: On May 2, 2001, the Authority entered into the 1999 Revenue Bonds Swaption withUBS AG in the initial notional amount of $403,035. Under the 1999 Revenue Bonds Swaption, UBS AG had the option,exercisable 120 days preceding January 1, 2010, January 1, 2011, and January 1, 2012, to elect to have the 1999 RevenueBonds Swaption commence on the January 1 next succeeding the exercise of the option. Under the 1999 Revenue BondsSwaption, if exercised, (i) UBS AG is obligated to pay periodic payments (payable monthly) to the Authority based upon a variable rate of 66% of the USD-LIBOR-BBA index, and (ii), the Authority is obliged to pay periodic payments (payablemonthly) to UBS AG based upon a fixed rate of 5.738% per annum. The periodic interest rates are applied to the notionalamount of the 1999 Revenue Bonds Swaption, which amortizes annually, commencing January 1, 2011, from its initialnotional amount. Only the net difference in the periodic payments is to be exchanged between the Authority and UBSAG.
Once exercised, the 1999 Revenue Bonds Swaption would continue (unless earlier terminated) through January1, 2026. The periodic payment obligations of the Authority under the 1999 Revenue Bonds Swaption (if exercised) aresecured and payable equally and ratably with Bonds issued under the 1998 Revenue Bond indenture. Regularly scheduledperiodic payments to be made by the Authority under the 1999 Revenue Bonds Swaption are insured by AmbacAssurance. In addition to other Events of Default and Termination Events (as defined in the 1999 Revenue BondsSwaption), there exists an Additional Termination Event with respect to the Authority if the credit rating of Bonds issuedunder the 1998 Revenue Bond Indenture (without reference to municipal bond insurance or credit enhancement), fallsbelow Baa3 with respect to Moody s or BBB- with respect to S&P or Fitch, or the Bonds cease to be rated by one ofMoody s, S&P or Fitch (and such rating agencies are still in the business of rating obligations such as the Bonds).However, as provided in the 1999 Revenue Bond Swap, so long as no Insurer Credit Event (as defined therein) hasoccurred, no Early Termination Date can be designated unless Ambac Assurance has consented in writing thereto.
In consideration for entering into the 1999 Revenue Bonds Swaption, the Authority received a net up-front, non-refundable option payment in the amount of $20,142 from UBS AG, which has been recorded on the combined financialstatements as a noncurrent liability (premium payment payable derivative companion instrument). In accordance withthe provisions of Governmental Accounting Standards Board Statement No. 53, Accounting and Financial Reporting forDerivative Instruments, this derivative companion instrument is considered a borrowing resulting from the intrinsicvalue of the swaption at inception. During the option period, interest accretes at the effective rate implied by the cashflows on the borrowing at inception. Once the swaption is exercised, and becomes an active swap, a portion of the swapinterest payments are attributed to principal and interest payments on the borrowing.
On September 3, 2009, UBS AG advised the Authority that it was exercising its option on this swaption as ofJanuary 1, 2010. The Authority began making net interest payments to USB AG, the counterparty, commencing inFebruary 2010, representing January s net interest payment. The Authority is current on its monthly net interest swappayments, having paid $21.5 million to UBS AG in 2011.
The ratings of the counterparty (UBS AG) to the 1999 Revenue Bonds Swap of Moody s, S&P, and Fitch areAa3, A, and A, respectively, as of December 31, 2011.
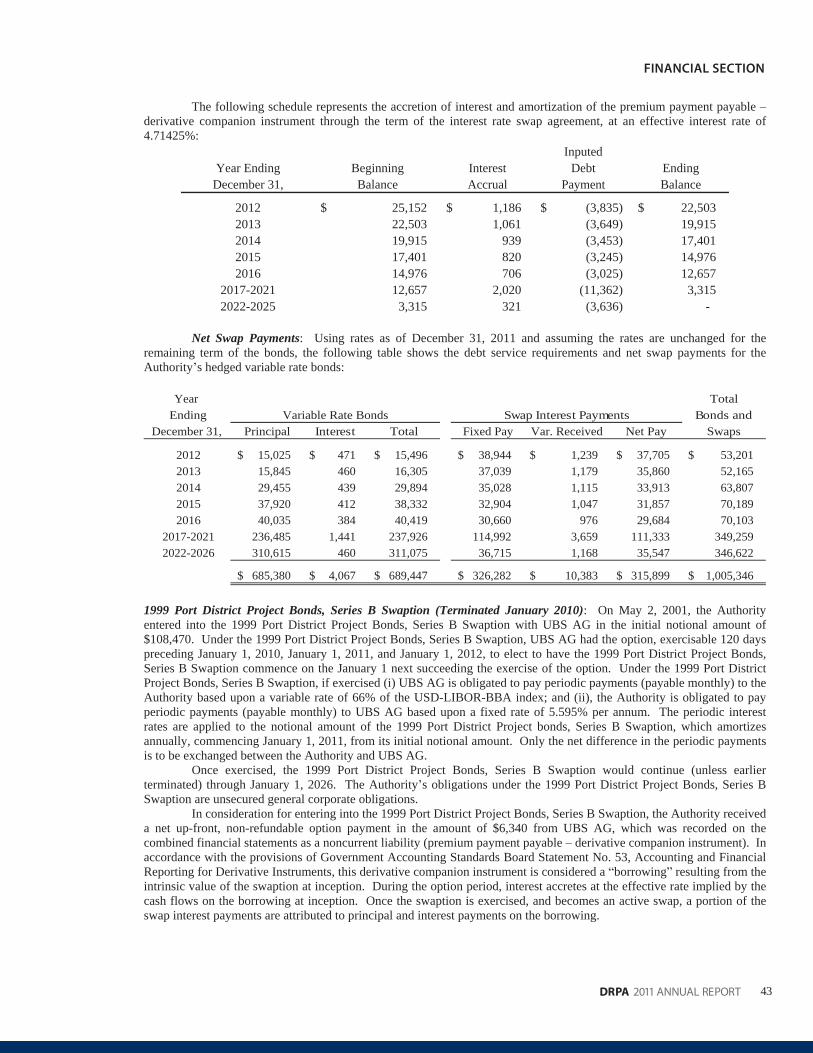
43DRPA 2011 ANNUAL REPORT
FINANCIAL SECTION
The following schedule represents the accretion of interest and amortization of the premium payment payablederivative companion instrument through the term of the interest rate swap agreement, at an effective interest rate of4.71425%:
InputedYear Ending Beginning Interest Debt Ending
December 31, Balance Accrual Payment Balance
2012 25,152$ 1,186$ (3,835)$ 22,503$2013 22,503 1,061 (3,649) 19,9152014 19,915 939 (3,453) 17,4012015 17,401 820 (3,245) 14,9762016 14,976 706 (3,025) 12,657
2017-2021 12,657 2,020 (11,362) 3,3152022-2025 3,315 321 (3,636) -
Net Swap Payments: Using rates as of December 31, 2011 and assuming the rates are unchanged for theremaining term of the bonds, the following table shows the debt service requirements and net swap payments for theAuthority s hedged variable rate bonds:
Year TotalEnding Bonds and
December 31, Principal Interest Total Fixed Pay Var. Received Net Pay Swaps
2012 15,025$ 471$ 15,496$ 38,944$ 1,239$ 37,705$ 53,201$2013 15,845 460 16,305 37,039 1,179 35,860 52,1652014 29,455 439 29,894 35,028 1,115 33,913 63,8072015 37,920 412 38,332 32,904 1,047 31,857 70,1892016 40,035 384 40,419 30,660 976 29,684 70,103
2017-2021 236,485 1,441 237,926 114,992 3,659 111,333 349,2592022-2026 310,615 460 311,075 36,715 1,168 35,547 346,622
685,380$ 4,067$ 689,447$ 326,282$ 10,383$ 315,899$ 1,005,346$
Swap Interest PaymentsVariable Rate Bonds
1999 Port District Project Bonds, Series B Swaption (Terminated January 2010): On May 2, 2001, the Authorityentered into the 1999 Port District Project Bonds, Series B Swaption with UBS AG in the initial notional amount of$108,470. Under the 1999 Port District Project Bonds, Series B Swaption, UBS AG had the option, exercisable 120 dayspreceding January 1, 2010, January 1, 2011, and January 1, 2012, to elect to have the 1999 Port District Project Bonds,Series B Swaption commence on the January 1 next succeeding the exercise of the option. Under the 1999 Port DistrictProject Bonds, Series B Swaption, if exercised (i) UBS AG is obligated to pay periodic payments (payable monthly) to the Authority based upon a variable rate of 66% of the USD-LIBOR-BBA index; and (ii), the Authority is obligated to payperiodic payments (payable monthly) to UBS AG based upon a fixed rate of 5.595% per annum. The periodic interestrates are applied to the notional amount of the 1999 Port District Project bonds, Series B Swaption, which amortizesannually, commencing January 1, 2011, from its initial notional amount. Only the net difference in the periodic paymentsis to be exchanged between the Authority and UBS AG.
Once exercised, the 1999 Port District Project Bonds, Series B Swaption would continue (unless earlierterminated) through January 1, 2026. The Authority s obligations under the 1999 Port District Project Bonds, Series BSwaption are unsecured general corporate obligations.
In consideration for entering into the 1999 Port District Project Bonds, Series B Swaption, the Authority received a net up-front, non-refundable option payment in the amount of $6,340 from UBS AG, which was recorded on thecombined financial statements as a noncurrent liability (premium payment payable derivative companion instrument). In accordance with the provisions of Government Accounting Standards Board Statement No. 53, Accounting and FinancialReporting for Derivative Instruments, this derivative companion instrument is considered a borrowing resulting from theintrinsic value of the swaption at inception. During the option period, interest accretes at the effective rate implied by thecash flows on the borrowing at inception. Once the swaption is exercised, and becomes an active swap, a portion of theswap interest payments are attributed to principal and interest payments on the borrowing.
44
FINANCIAL SECTION
DRPA 2011 ANNUAL REPORT
On September 3, 2009, UBS AG advised the Authority that it was exercising its option on this swaption as ofJanuary 1, 2010. As a result, on January 11, 2010, the Authority made a payment of $33,695 to UBS AG to terminate the1999 Port District Project Bonds, Series B Swaption. The termination payment was recorded by the Authority as areduction of the corresponding noncurrent liability for the derivative instrument interest rate swap ($33,194), and thecorresponding removal of the deferred outflow of accumulated decrease in fair value of hedging derivatives was recordedas a reduction to interest revenues ($33,194). The corresponding noncurrent liability for the premium payments payablecompanion derivative instrument was extinguished, and recorded by the Authority as an increase to interest revenue($9,588).
Objective and Terms of Investment Derivative Instruments: On August 21, 2000, the Authority entered intotwo (2) interest rate agreements with Bank of America N.A. in the notional amounts of $39,657 (the 2000 Swaption #1 )and $10,436 (the 2000 Swaption #2 , and together with the 2000 Swaption #1, the 2000 Swaptions ). Under the 2000Swaptions, Bank of America N.A. has the option on certain future dates (two business days preceding July 1, 2005 andeach January 1 and July 1 thereafter through and including July 1, 2025 with respect to the 2000 Swaption #1 and twobusiness days preceding January 2, 2006 and each July 1 and January 1 thereafter through and including July 1, 2025 withrespect to the 2000 Swaption #2) to cause the 2000 Swaption #1 or the 2000 Swaption #2, as applicable, to commence onthe next succeeding January 1 or July 1. If an option is exercised, the 2000 Swaption #1, or the 2000 Swaption #2, asapplicable, would continue (unless earlier terminated) through January 1, 2026. The Authority s obligations under the2000 Swaptions are general unsecured corporate obligations.
If the options relating to the 2000 Swaption #1 or the 2000 Swaption #2 are exercised, Bank of America N.A. isobligated to pay periodic interest payments (payable monthly) to the Authority based upon a fixed rate of 5.9229% perannum and the Authority is obligated to pay periodic interest payments (payable monthly) to Bank of America N.A. at avariable rate based upon the Securities Industry and Financing Markets Association (SIFMA) (formerly the BMAMunicipal Swap Index) (a tax-exempt variable rate index). Only the net difference in the periodic payments owed wouldbe exchanged between Bank of America N.A. and the Authority. As of December 31, 2011, Bank of America N.A. hasnot exercised its options on the aforementioned swaptions.
In consideration for entering into the 2000 Swaptions, the Authority received net up-front, non-refundable optionpayments in the aggregate amount of $1,400 from Bank of America N.A., which represented the time value for holding the written option. Such payments have been recorded as deferred revenue and amortized as interest revenue in prior years.
Risks Related to Derivative Instruments
Credit Risk: For the year ended December 31, 2011, the Authority is not exposed to credit risk on its hedging derivativeinstruments or investment derivatives as all such derivative instruments are in a liability position based on their fair values.The credit ratings of the counterparties, however, are Aa3, A+, and A+ as rated by Moody s, S&P, and Fitch, respectively.
Interest Rate Risk: The Authority is exposed to interest rate risk on its derivative instruments. On its pay-variable,received-fixed interest rate swaptions, as the Securities Industry and Financing Markets Association (SIFMA) rateincreases, the Authority s net payments on the swaptions, if exercised, increases. On its pay-fixed, receive-variableinterest rate swaps, as the LIBOR rate decreases, the Authority s net payments on the swaps increases. While theAuthority s net payments may increase, these increases are partially offset by the variable rate bonds rate.
Basis Risk: The Authority is exposed to basis risk on its pay-fixed interest rate swap hedging derivative instrumentsbecause the variable-rate payments received by the Authority on these hedging derivative instruments are based on a rateor index other than interest rates the Authority pays on its hedged variable-rate debt, which is remarketed every five (5)days.
Termination Risk: The Authority or its counterparties may terminate a derivative instrument if the other party fails toperform under the terms of the contract.
Rollover Risk: The Authority is not exposed to rollover risk on its hedging derivative instruments. The Authority shedging derivative instruments terminate on the same day as the hedged debt matures, unless the Authority opts for earliertermination.
Market-Access Risk: If a particular option is exercised and refunding bonds are not issued, the affected series of bondswould not be refunded, and the Authority would make net swap payments as required by the terms of the applicableaforementioned contracts. If the option is exercised and the variable-rate bonds issued, the actual difference ultimatelyrecognized by the transaction will be affected by the relationship between the interest rate terms of the to-be-issuedvariable-rate bonds versus the payment as stipulated in the swaption agreement.
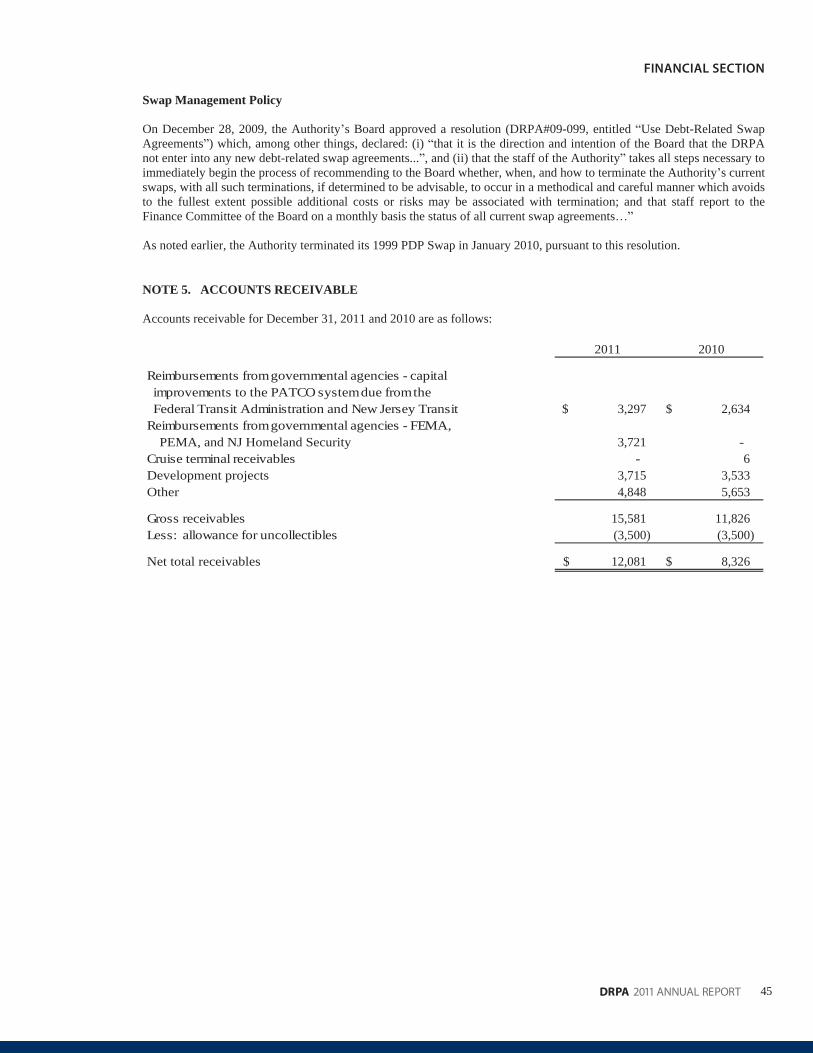
45DRPA 2011 ANNUAL REPORT
FINANCIAL SECTION
Swap Management Policy
On December 28, 2009, the Authority s Board approved a resolution (DRPA#09-099, entitled Use Debt-Related SwapAgreements ) which, among other things, declared: (i) that it is the direction and intention of the Board that the DRPAnot enter into any new debt-related swap agreements... , and (ii) that the staff of the Authority takes all steps necessary toimmediately begin the process of recommending to the Board whether, when, and how to terminate the Authority s currentswaps, with all such terminations, if determined to be advisable, to occur in a methodical and careful manner which avoids to the fullest extent possible additional costs or risks may be associated with termination; and that staff report to theFinance Committee of the Board on a monthly basis the status of all current swap agreements
As noted earlier, the Authority terminated its 1999 PDP Swap in January 2010, pursuant to this resolution.
NOTE 5. ACCOUNTS RECEIVABLE
Accounts receivable for December 31, 2011 and 2010 are as follows:
2011 2010
Reimbursements fromgovernmental agencies - capitalimprovements to the PATCO systemdue fromtheFederal Transit Administration and New Jersey Transit 3,297$ 2,634$
Reimbursements fromgovernmental agencies - FEMA,PEMA, and NJ Homeland Security 3,721 -
Cruise terminal receivables - 6Development projects 3,715 3,533Other 4,848 5,653
Gross receivables 15,581 11,826Less: allowance for uncollectibles (3,500) (3,500)
Net total receivables 12,081$ 8,326$
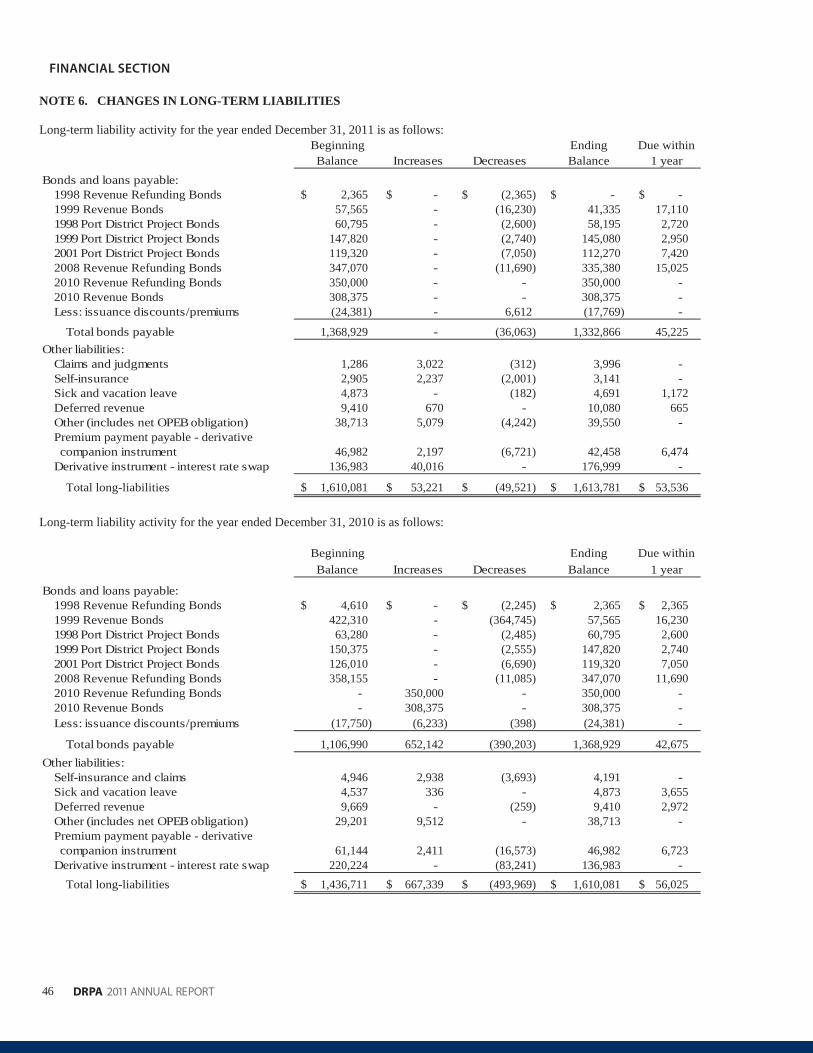
46
FINANCIAL SECTION
DRPA 2011 ANNUAL REPORT
NOTE 6. CHANGES IN LONG-TERM LIABILITIES
Long-term liability activity for the year ended December 31, 2011 is as follows:Beginning Ending Due withinBalance Increases Decreases Balance 1 year
Bonds and loans payable:1998 Revenue Refunding Bonds 2,365$ -$ (2,365)$ -$ -$1999 Revenue Bonds 57,565 - (16,230) 41,335 17,1101998 Port District Project Bonds 60,795 - (2,600) 58,195 2,7201999 Port District Project Bonds 147,820 - (2,740) 145,080 2,9502001 Port District Project Bonds 119,320 - (7,050) 112,270 7,4202008 Revenue Refunding Bonds 347,070 - (11,690) 335,380 15,0252010 Revenue Refunding Bonds 350,000 - - 350,000 -2010 Revenue Bonds 308,375 - - 308,375 -Less: issuance discounts/premiums (24,381) - 6,612 (17,769) -
Total bonds payable 1,368,929 - (36,063) 1,332,866 45,225Other liabilities:
Claims and judgments 1,286 3,022 (312) 3,996 -Self-insurance 2,905 2,237 (2,001) 3,141 -Sick and vacation leave 4,873 - (182) 4,691 1,172Deferred revenue 9,410 670 - 10,080 665Other (includes net OPEB obligation) 38,713 5,079 (4,242) 39,550 -Premium payment payable - derivativecompanion instrument 46,982 2,197 (6,721) 42,458 6,474
Derivative instrument - interest rate swap 136,983 40,016 - 176,999 -
Total long-liabilities 1,610,081$ 53,221$ (49,521)$ 1,613,781$ 53,536$
Long-term liability activity for the year ended December 31, 2010 is as follows:
Beginning Ending Due withinBalance Increases Decreases Balance 1 year
Bonds and loans payable:1998 Revenue Refunding Bonds 4,610$ -$ (2,245)$ 2,365$ 2,365$1999 Revenue Bonds 422,310 - (364,745) 57,565 16,2301998 Port District Project Bonds 63,280 - (2,485) 60,795 2,6001999 Port District Project Bonds 150,375 - (2,555) 147,820 2,7402001 Port District Project Bonds 126,010 - (6,690) 119,320 7,0502008 Revenue Refunding Bonds 358,155 - (11,085) 347,070 11,6902010 Revenue Refunding Bonds - 350,000 - 350,000 -2010 Revenue Bonds - 308,375 - 308,375 -Less: issuance discounts/premiums (17,750) (6,233) (398) (24,381) -
Total bonds payable 1,106,990 652,142 (390,203) 1,368,929 42,675Other liabilities:
Self-insurance and claims 4,946 2,938 (3,693) 4,191 -Sick and vacation leave 4,537 336 - 4,873 3,655Deferred revenue 9,669 - (259) 9,410 2,972Other (includes net OPEB obligation) 29,201 9,512 - 38,713 -Premium payment payable - derivativecompanion instrument 61,144 2,411 (16,573) 46,982 6,723
Derivative instrument - interest rate swap 220,224 - (83,241) 136,983 -Total long-liabilities 1,436,711$ 667,339$ (493,969)$ 1,610,081$ 56,025$
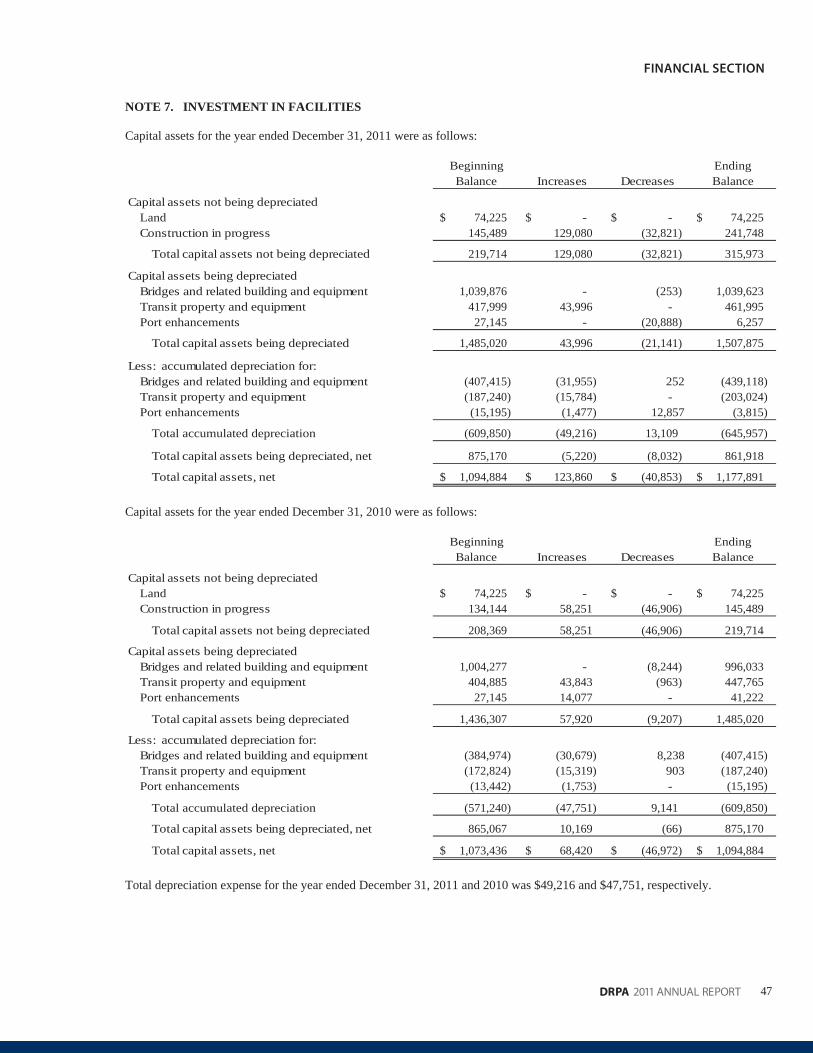
47DRPA 2011 ANNUAL REPORT
FINANCIAL SECTION
NOTE 7. INVESTMENT IN FACILITIES
Capital assets for the year ended December 31, 2011 were as follows:
Beginning EndingBalance Increases Decreases Balance
Capital assets not being depreciatedLand 74,225$ -$ -$ 74,225$Construction in progress 145,489 129,080 (32,821) 241,748
Total capital assets not being depreciated 219,714 129,080 (32,821) 315,973
Capital assets being depreciatedBridges and related building and equipment 1,039,876 - (253) 1,039,623Transit property and equipment 417,999 43,996 - 461,995Port enhancements 27,145 - (20,888) 6,257
Total capital assets being depreciated 1,485,020 43,996 (21,141) 1,507,875
Less: accumulated depreciation for:Bridges and related building and equipment (407,415) (31,955) 252 (439,118)Transit property and equipment (187,240) (15,784) - (203,024)Port enhancements (15,195) (1,477) 12,857 (3,815)
Total accumulated depreciation (609,850) (49,216) 13,109 (645,957)
Total capital assets being depreciated, net 875,170 (5,220) (8,032) 861,918
Total capital assets, net 1,094,884$ 123,860$ (40,853)$ 1,177,891$
Capital assets for the year ended December 31, 2010 were as follows:
Beginning EndingBalance Increases Decreases Balance
Capital assets not being depreciatedLand 74,225$ -$ -$ 74,225$Construction in progress 134,144 58,251 (46,906) 145,489
Total capital assets not being depreciated 208,369 58,251 (46,906) 219,714
Capital assets being depreciatedBridges and related building and equipment 1,004,277 - (8,244) 996,033Transit property and equipment 404,885 43,843 (963) 447,765Port enhancements 27,145 14,077 - 41,222
Total capital assets being depreciated 1,436,307 57,920 (9,207) 1,485,020
Less: accumulated depreciation for:Bridges and related building and equipment (384,974) (30,679) 8,238 (407,415)Transit property and equipment (172,824) (15,319) 903 (187,240)Port enhancements (13,442) (1,753) - (15,195)
Total accumulated depreciation (571,240) (47,751) 9,141 (609,850)
Total capital assets being depreciated, net 865,067 10,169 (66) 875,170
Total capital assets, net 1,073,436$ 68,420$ (46,972)$ 1,094,884$
Total depreciation expense for the year ended December 31, 2011 and 2010 was $49,216 and $47,751, respectively.
48
FINANCIAL SECTION
DRPA 2011 ANNUAL REPORT
Loss on Abandonment of Aerial Tram Project: In its Board Resolution DRPA# DRPA-11-105, dated December 14,2011, the Authority s Board approved the 2012 Capital Budget. In doing so, the Board approved the termination of theAerial Tram project. As a result, the construction in progress for the Aerial Tram project was written off and the loss onabandonment of the project was $18,318.
Loss on Disposal of Capital Assets: In its Board Resolution DRPA #11-003, dated January 5, 2011, the Authority sBoard approved the closure of the Cruise Terminal. The Board authorized staff to negotiate a termination agreement forthe Cruise Terminal and parking lot, with the right to remain in the terminal rent free (except operating expenses) toaccommodate booked events through June 30, 2011. Upon acceptance of the lease termination agreement offered byPhiladelphia Authority Industrial Development ( PAID ), PAID agreed to pay the Authority $250. In addition, theAuthority received approximately $92 in cash receipts related to the disposal. The loss on the disposal of the capital assetsrelating to the Cruise Terminal was $7,929.
NOTE 8. DEFERRED COMPENSATION PLAN
The Authority offers its employees a deferred compensation plan in accordance with Internal Revenue Code Section 457.The plan, available to all full-time employees, permits them to defer a portion of their salary until future years. Thedeferred compensation is not available to employees until termination, retirement, death, or unforeseeable emergency.The Authority does not make any contributions to the plan. To comply with changes in federal regulations and GASB 32,Accounting and Financial Reporting for Internal Revenue Code 457 Deferred Compensation Plans, the Authority amended the Plan in 1998 so that all amounts of compensation deferred under the plan, all property and rights purchased with thoseamounts, and all income attributable to those amounts, property, or rights are solely the property of the employees.
NOTE 9. PENSION PLANS
Employees of the Authority participate in the Pennsylvania State Employees Retirement System, the Public EmployeesRetirement System of New Jersey, or the Teamsters Pension Plan of Philadelphia and Vicinity.
Pennsylvania State Employees Retirement System
Plan Description: Permanent full-time and part-time employees are eligible and required to participate in thiscost-sharing multiple-employer defined benefit plan that provides pension, death and disability benefits. A member mayretire after completing three years of service and after reaching normal retirement age (the age of 60, except police officersat age 50, or the age at which 35 years of service has been completed, whichever occurs first). Benefits vest after fiveyears of service. If an employee terminates his or her employment after at least five years of service but before the normalretirement age, he or she may receive pension benefits immediately or defer pension benefits until reaching retirement age.Employees who retire after reaching the normal retirement age with at least three years of credited service are entitled toreceive pension benefits equal to 2.50% of their final average compensation (average of the three highest years inearnings) times the number of years for which they were a participant in the plan. The pension benefits received by anemployee who retires after five years of credited service but before normal retirement age are reduced for the number ofyears that person is under normal retirement age.
Pension provisions include death benefits, under which the surviving beneficiary may be entitled to receive theemployee s accumulated contributions less the amount of pension payments that the employee received, the present valueof the employees account at retirement less the amount of pension benefits received by the employee, the same pensionbenefits formerly received by the employee, or one-half of the monthly pension payment formerly received by theemployee. The maximum pension benefit to the employee previously described may be reduced depending on the benefits elected for the surviving beneficiary.
The Pennsylvania State Employees Retirement System issues a publicly available annual financial report,including financial statements, which may be obtained by writing to Pennsylvania State Employees Retirement System,30 North Third Street, Harrisburg, Pennsylvania 17108-1147.
Funding Policy: The contribution requirements of plan members and the Authority are established and amended by the Pennsylvania State Employees Retirement System Board. As of January 1, 2002, employees are required tocontribute 6.25% of their gross earnings to the plan. The Authority was required to, and did, contribute an actuariallydetermined amount to the plan, which equaled 6.03%, 4.18% and 3.68%, of covered payroll in 2011, 2010 and 2009,respectively. In 2011, 2010 and 2009, the Authority s required contributions to the plan were $2,604, $1,817 and $1,647,respectively, which represented 100% of the required contribution for the aforementioned years.
49DRPA 2011 ANNUAL REPORT
FINANCIAL SECTION
New Jersey Public Employees Retirement System (NJ PERS)
Plan Description: Permanent full-time employees, hired after January 1, 2002, who were members of NJPERSwhen they were hired, are eligible to participate in the cost-sharing multiple-employer defined benefit plan (administeredby the New Jersey Division of Pensions and Benefits). The PERS was established in 1955. The PERS providesretirement, death and disability, and medical benefits to qualified members. Vesting and benefit provisions are established by N.J.S.A. 43:15A and 43:3B.
Funding Policy: The contribution requirements of plan members are determined by State statute. In accordance with Chapter 92, P.L. 2007 and Chapter 103, P.L. 2007, plan members enrolled in the Public Employees RetirementSystem were required to contribute 5.5% of their annual covered salary, effective July 1, 2007. However, under the newprovisions of Chapter 78, P.L. 2011, employee pension contribution rates will be increased by the following amounts: theemployee pension contribution rate will increase from 5.5% to 6.5% of salary, effective October 1, 2011. An additionalincrease to be phased over the next 7 years will bring the total pension contribution rate to 7.5% of salary. The phasedincrease from 6.5% to 7.5% will be applied equally over a 7-year period beginning July 1, 2012. The contribution rate will increase by 0.14% each year with the first payroll of July 2012 until the 7.5% contribution rate is reached in July 2018.The State Treasurer has the right under the current law to make temporary reductions in member rates based on theexistence of surplus pension assets in the retirement system; however, the statute also requires the return to the normal ratewhen such surplus pension assets no longer exist. The Authority is billed annually for its normal contribution, plus anyaccrued liability. The Authority began sending employee contributions to NJ PERS beginning in January 2006. The fiscal year 2008 was the first year that the Authority was required to, and did, contribute an actuarially determined amount to the plan. For the years ended December 31, 2011, 2010 and 2009, the Authority s total contribution to the plan was $135,$197 and $63, respectively, which represented 100% of the required contribution for the aforementioned years. For theyears ended December 31, 2011, 2010 and 2009, the contributions consisted of a normal contribution amount of $45, $80and $29, respectively and an accrued liability amount of $90, $117 and $34, respectively.
Teamsters Pension Plan of Philadelphia and Vicinity
Plan Description: Certain represented employees are eligible and required to participate in the TeamstersPension Plan of Philadelphia and Vicinity, which is a cost-sharing, multiple-employer benefit plan which providespension, death and disability benefits. A member may retire at the later of (a) the date the employee reaches 65 or (b) thetenth anniversary of the employee s commencement of participation in the plan. Additionally, employees are eligible forearly retirement after 10 years of participation in the plan and (a) completion of 30 years of vested service or (b)attainment of age 50 and completion of 10 years of vested service. Benefits vest after 10 years of service. An employeewho retires on or after his or her normal retirement age is entitled to receive benefits based on his or her credited years ofservice multiplied by a monthly benefit rate, which is determined based on the employer s daily contributions. Thebenefits are subject to maximum rates that vary according to employer daily contribution rates. Members may also receive benefits after early retirement at reduced rates depending on age at retirement.
An employee who qualifies for disability retirement benefits (total and permanent disability with 10 years ofvested service and 5 years of continuous service with at least 300 covered days of contributions) is entitled to receive twohundred dollars per month until retirement age, when retirement benefits would commence.
Provisions include surviving spouse death benefits, under which the surviving spouse is entitled to a 50%survivor annuity in certain cases.
The Teamsters Pension Plan of Philadelphia and Vicinity issues a publicly available annual financial report,including financial statements, which may be obtained by writing to Teamsters Pension Plan of Philadelphia and Vicinity,Fourth and Cherry Streets, Philadelphia, Pennsylvania 19106.
Funding Policy: The Teamsters Pension Plan is controlled by the Teamsters Pension Plan of Philadelphia andVicinity Board. The employer s contribution requirements are determined under the terms of one Collective BargainingAgreement in force between the employer and the Teamsters. During 2011, the Authority was required to and didcontribute twenty-one dollars and eighty cents ($21.80) per day for each PATCO participating employee. The Authority scontributions totaled 9.81%, 9.6% and 9.89% of covered payroll in 2011, 2010 and 2009, respectively. The employees ofthe Authority make no contributions to the plan. The Authority contributed $1,077, $1,090 and $1,068 in 2011, 2010 and2009, respectively, which represented 100% of the required contribution for the aforementioned years.
50
FINANCIAL SECTION
DRPA 2011 ANNUAL REPORT
NOTE 10. POST-EMPLOYMENT HEALTHCARE PLAN
Plan Description: The Authority provides certain health care and life insurance benefits for retired employees,where such benefits are established and amended by the Authority s Board of Commissioners. The Authority s planprovides two agent multiple-employer post-employment healthcare plans which cover two retiree populations: eligibleretirees under the age of sixty-five (65) receive benefits through Amerihealth and eligible retirees sixty-five (65) and overreceive benefits through the United Health Group (in partnership with AARP) and Aetna. Life insurance benefits toqualifying retirees are provided through Prudential. The plans are administered by the Authority; therefore, premiumpayments are made directly by the Authority to the insurance carriers.
Funding Policy: Employees become eligible for retirement benefits based on hire date and years of service. Foremployees hired after January 1, 2007, no subsidized retiree benefits are offered. The contribution requirements of planmembers and the Authority are established and may be amended by the Authority s Board of Commissioners. Planmembers receiving benefits contribute the following amounts: $65 per month for retiree-only coverage for the base plan,$130 per month for retiree/spouse (or retiree/child) coverage, and $195 per month for retiree/family (or children) coverageto age sixty-five (65) for the base plan, and $55 per month per retiree, per dependent for both the United Health Group (inpartnership with AARP) and Aetna coverages. An additional amount is required for those retirees, under age sixty-five(65), who opt to participate in the buy-up plan for retirees and their dependents.
Retirees: The Authority presently funds its current retiree post employment benefit costs on a pay-as-you-gobasis and, as shown above, receives annual contributions from retirees to offset a portion of this annual cost. TheAuthority s contributions to the plan for the years ended 2011, 2010 and 2009 were $4,242, $4,256 and $4,251,respectively.
Future Retirees: In accordance with Statement No.45 of the Government Accounting Standards Board, theAuthority is required to expense the annual required contribution of the employer (ARC), an amount actuariallydetermined in accordance with the parameters of Statement No. 45. The ARC represents a level of funding that, if paid on an ongoing basis, is projected to cover normal cost each year and amortize any unfunded actuarial liabilities (or fundingexcess) over a period not to exceed thirty (30) years. The ARC includes the costs of both current and future retirees. Thecurrent ARC was determined to be $5,230 at an unfunded discount rate of 5%. As stated above, the Authority has fundedthe cost of existing retirees in the amount of $4,242, and in 2011, the Authority has accrued the benefit costs for futureeligible employees, but has not yet begun funding this outstanding liability. The Authority plans to begin funding aportion of this outstanding liability during the fourth quarter of 2012.
Annual OPEB Cost: The Authority s annual required contribution (ARC), the interest on the net OPEBobligation, the adjustment to the ARC, the increase or decrease in the net OPEB obligation, the net OPEB obligation, andthe percentage of annual OPEB cost contributed to the plan for 2011, 2010 and 2009 are as follows:
2011 2010 2009
Annual Required Contribution (ARC) 5,230$ 13,763$ 13,763$Interest on the net OPEB Obligation 1,897 1,439 975Adjustment to the ARC (1,270) (1,782) (1,208)
Annual OPEB Cost 5,857 13,420 13,530Pay as You Go Cost (Existing Retirees) (4,242) (4,256) (4,251)
Increase (Decrease) in the Net OPEB Obligation 1,615 9,164 9,279
Net OPEB Obligation, January 1 37,935 28,771 19,492
Net OPEB Obligation, December 31 39,550$ 37,935$ 28,771$
Percentage of Annual OPEB Cost Contributed 72% 32% 31%
51DRPA 2011 ANNUAL REPORT
FINANCIAL SECTION
Funded Status and Funding Progress: As of January 1, 2011, the most recent actuarial valuation date, theAuthority s Plan was 0% funded. The actuarial accrued liability for benefits was $113,422, and the actuarial value of plan assets was $0, resulting in an unfunded actuarial accrued liability (UAAL) of $113,422. The covered payroll (annualpayroll of active employees covered by the plan) was $56,820 and the ratio of the UAAL to the covered payroll was199.6%. (For additional information, please refer to the Required Supplementary Information Schedule of FundingProgress for Health Benefits Plan shown at the end of the footnote section.) Actuarial valuations of an ongoing planinvolve estimates of the value of reported amounts and assumptions about the probability of occurrence of events far intothe future.
Examples include assumptions about future employment, mortality and the healthcare cost trend. Amountsdetermined regarding the funded status of the plan and the annual required contributions of the employer are subject tocontinual revision as actual results are compared with past expectations and new estimates are made about the future. Theschedule of funding progress, presented as required supplementary information following the notes to the financialstatements, presents multiyear trend information that shows whether the actuarial value of the plan assets is increasing ordecreasing over time relative to the actuarial accrued liabilities for benefits.
Actuarial Methods and Assumptions: Projections of benefits for financial reporting purposes are based on thesubstantive plan (the plan as understood by the employer and plan members) and include the types of benefits provided atthe time of each valuation and the historical pattern of sharing benefit costs between the employer and plan members tothat point. The actuarial methods and assumptions used include techniques that are designed to reduce short-termvolatility in actuarial accrued liabilities and the actuarial value of assets, consistent with the long-term perspective of thecalculations.
In the January 1, 2011 actuarial valuation, the projected unit credit actuarial cost method was used. Under thismethod an actuarial accrued liability is determined as the actuarial present value of the portion of projected benefits whichis allocated to service before the current plan year. In addition, a normal cost is determined as the actuarial present valueof the portion of projected benefits which is allocated to service in the current plan year for each active participant underthe assumed retirement age. The UAAL is being amortized (straight-line) for thirty (30) year on an open basis. Theactuarial assumptions included the following:
Mortality. The mortality table employed in the valuation was the RP2000 Table Male and Female.Discount Rate. Future costs have been discounted at the rate of 5.00% compounded annually forGASB 45 purposes.Turnover. Assumptions for terminations of employment other than for death or retirement will vary byage and years of service with rates of turnover based on State Employees Retirement System ofPennsylvania.Disability. No terminations of employment due to disability were assumed. Retirees resulting from adisability were factored into the determination of age at retirement.Age of Retirement. The assumption that the active participants, on average, will receive their benefitswhen eligible, but no earlier than age 55.Spousal Coverage. Married employees will remain married.Prior Service. No prior service for active employees was assumed.Health Care Inflation:
Year Pre-65 Post 65Initial Trend 01/01/13 to 01/01/17 10.0% 10.0%Ultimate Trend 01/01/18 to later 5.0% 5.0%Grading Per Year 1.0% 1.0%
Administration Expenses. The annual cost to administer the retiree claims was assumed at 2.5% whichwas included in the annual health care costs.Employee Contributions. It was assumed that employees will contribute two thousand three hundredforty dollars ($2,345) per year for family medical coverage and seven hundred eighty dollars ($792) for single medical coverage.Change in Assumptions. Effective January 1, 2011, assumptions were changed for mortality, medicaltrend costs and turnover.
52
FINANCIAL SECTION
DRPA 2011 ANNUAL REPORT
NOTE 11. INDENTURES OF TRUST
The Authority is subject to the provisions of the following indentures of Trust: Revenue Refunding Bonds of 1998 withTD Bank N.A. (as successor trustee to Commerce Bank NA), dated July 1, 1998; and the Revenue Bonds of 1999 with TD Bank N.A., dated December 1, 1999; the Revenue Refunding Bonds of 2008, with TD Bank, National Association asTrustee, dated July 25, 2008 and the Revenue Refunding Bonds of 2010 and the 2010 Revenue Bonds (Series D), with TD Bank N.A. as Trustee dated May 15, 2010 and July 15, 2010, respectively (collectively the Bond Resolution ); PortDistrict Project Bonds of 1998 with The Bank of New York Mellon (as successor trustee to U.S. Trust Company of newJersey), dated August 15, 1998; Port District Bonds of 1999 with The Bank of New York Mellon (as successor trustee toSummit Bank), dated December 1, 1999; Port District Project Bonds of 2001 with TD Bank NA., dated December 1, 2001.The Bond Resolution requires the maintenance of the following accounts:
Project Fund: This restricted account was established in accordance with Section 6.02 of the Bond Resolution.The Project Fund is held by the Trustee and is applied to pay the cost of the Projects and is pledged, pending application to such payment of costs for the security of the payment of principal and interest on the Revenue, Revenue Refunding, andProject Bonds (the Bonds ).
Debt Service Fund: This restricted account was established in accordance with Section 6.04 of the BondResolution for the payment of maturing interest and principal on the Bonds. The balance on deposit must be sufficient toenable the Trustee to withdraw amounts equal to interest due on the Bonds, principal amounts maturing on Bonds, accrued interest included in the purchase price of the bonds purchased for retirement, and sinking fund installments whenpayments are required.
Debt Service Reserve Fund: This restricted account was established in accordance with Section 6.05 of theBond Resolution. The amount of funds on deposit must be maintained at a level equal to the Maximum Debt Service toinsure funds are available for payment of Debt Service.
Bond Redemption Fund: This restricted account was established in accordance with section 6.06 of the BondResolution to account for amounts received from any source for the redemption of Bonds, other than mandatory sinkingfund payments.
Rebate Fund: This restricted account was established in accordance with Section 6.07 of the bond Resolutionaccount for amounts deposited from time to time in order to comply with the arbitrage rebate requirements of Section 148of the Code as applicable to any Series of Tax-Exempt Bonds issued.
Revenue Fund: This unrestricted account was established in accordance with Section 6.03 of the BondResolution for the Authority to deposit all Revenues. On or before the 20th day of each calendar month, the Trustee shall,to the extent money is available, transfer to or credit funds needed in the following order: (1) the Debt Service Fund, (2)the Debt Service Reserve Fund, (3) any Reserve Fund Credit Facility Issuer, (4) the Trustee s Rebate Fund, (5) theMaintenance Reserve Fund, (6) the General Fund.
Maintenance Reserve Fund: This restricted account was established in accordance with Section 6.08 of theBond Resolution. These funds are maintained for reasonable and necessary expenses with respect to the system for majorrepairs, renewals, replacements, additions, betterments, enlargements, improvements and extraordinary expenses, all to the extent not provided for in the then current Annual Budget. Money in this account is pledged for the security of paymentprincipal and interest on the bonds. Whenever the amount in this account exceeds the Maintenance Reserve FundRequirement , the excess shall be deposited in the General Fund. The Maintenance Reserve Fund Requirement on anydate is at least $3,000.
General Fund: This unrestricted account was established in accordance with Section 6.09 of the BondResolution. All excess funds of the Authority are recorded in the General Account. If the Authority is not in default in thepayment of bond principal or interest and all fund requirements are satisfied, the excess funds may be used by theAuthority for any lawful purpose.
53DRPA 2011 ANNUAL REPORT
FINANCIAL SECTION
NOTE 12. FUNDED AND LONG-TERM DEBT
At December 31, 2011, the Authority had $1,332,866 in Revenue, Revenue Refunding, and Port District Project Bondsoutstanding, consisting of bonds issued in 1998, 1999, 2001, 2008 and 2010. The 1998 Revenue Refunding Bonds wereissued pursuant to the Indenture of Trust, dated July 1, 1998, and a First Supplemental Indenture thereto. The 1998 PortDistrict Project Bonds were issued pursuant to an Indenture of Trust dated August 15, 1998. The 1999 Revenue Bondswere issued pursuant to the Indenture of Trust dated July 1, 1998, a Second Supplemental Indenture dated August 15,1998, and a Third Supplemental Indenture dated December 1, 1999. The 1999 Port District Project Bonds were issued toan Indenture of Trust dated December 1, 1999. Under the terms of the 1998 Revenue Refunding Bonds Indenture ofTrust, the Authority covenanted not to issue any additional bonds under the 1995 Indenture of Trust. The 2001 PortDistrict Project Bonds were issued pursuant to an Indenture of Trust dated December 1, 2001. The 2008 RevenueRefunding Bonds were issued pursuant to the Indenture of Trust dated July 1, 1998, as supplemented by a FourthSupplemental Indenture dated October 1, 2007 and a Fifth Supplemental Indenture dated July 15, 2008. The 2010Revenue Refunding Bonds were issued pursuant an Indenture of Trust dated as of July 1, 1998 as previously supplemented by five supplemental indentures thereto and as further supplemented by a Sixth Supplemental Indenture dated as of March15, 2010. The 2010 Revenue Bonds are being issued pursuant to the Compact, the New Jersey Act, the Pennsylvania Act(as such terms are defined herein) and an Indenture of Trust, dated as of July 1, 1998, by and between the Authority andTD Bank, National Association, Cherry Hill, as successor to Commerce Bank, National Association (the Trustee ), assupplemented by a First Supplemental Indenture, dated as of July 1, 1998, a Second Supplemental Indenture, dated as ofAugust 15, 1998, a Third Supplemental Indenture, dated as of December 1, 1999, a Fourth Supplemental Indenture, datedas of October 1, 2007, a Fifth Supplemental Indenture, dated as of July 15, 2008, a Sixth Supplemental Indenture, dated as of March 15, 2010, and a Seventh Supplemental Indenture, dated as of July 1, 2010 (collectively, the 1998 Revenue BondIndenture ).
1998 Revenue Refunding Bonds: On July 6, 1998, the Authority issued $63,190 of Revenue Refunding Bonds, Series A,to provide funds, together with other funds available, to advance refund $79,980 principal amount of the Authority sCapital Appreciation Bonds, Series of 1989. In addition, the Authority issued on October 6, 1998, $125,200 of RevenueRefunding Bonds, Series B, for the purpose of refunding $120,380 aggregate principal amount of the Serial and TermBonds, Series of 1989, which completed the defeasance of all bonds issued under the 1985 General Bond Resolution.
The 1998 Revenue Refunding Bonds, Series B, serial bonds matured and were paid in full in January 2011.
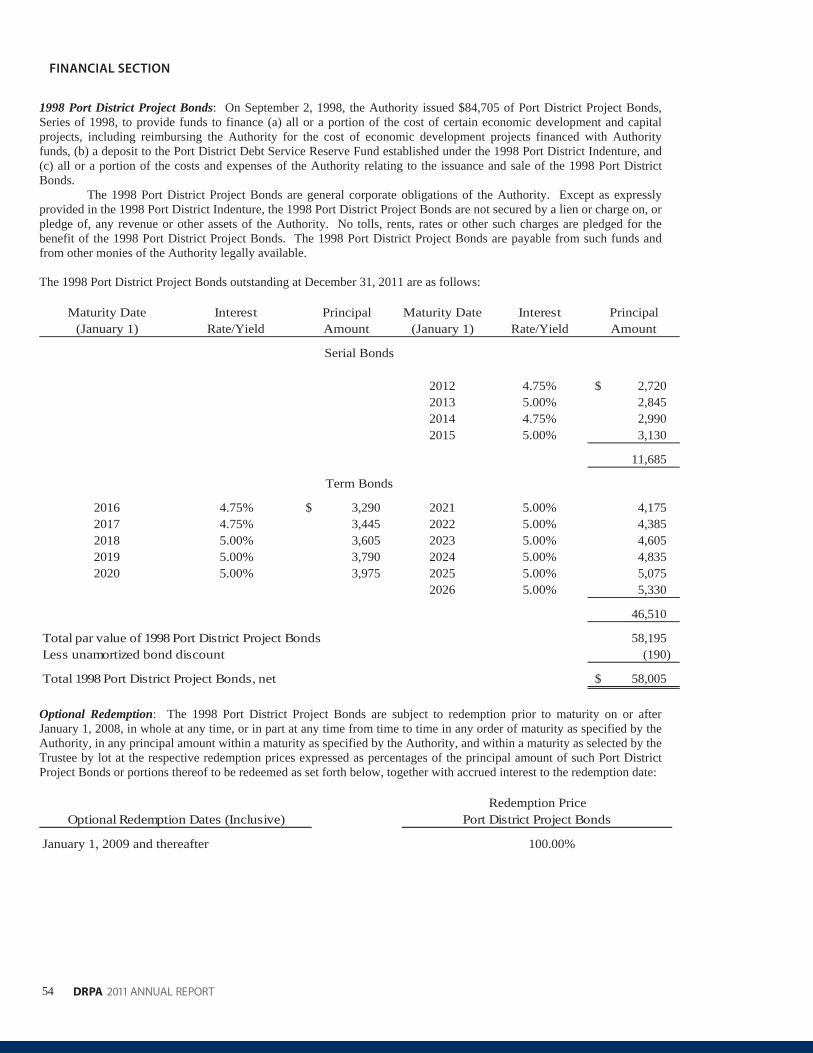
54
FINANCIAL SECTION
DRPA 2011 ANNUAL REPORT
1998 Port District Project Bonds: On September 2, 1998, the Authority issued $84,705 of Port District Project Bonds,Series of 1998, to provide funds to finance (a) all or a portion of the cost of certain economic development and capitalprojects, including reimbursing the Authority for the cost of economic development projects financed with Authorityfunds, (b) a deposit to the Port District Debt Service Reserve Fund established under the 1998 Port District Indenture, and(c) all or a portion of the costs and expenses of the Authority relating to the issuance and sale of the 1998 Port DistrictBonds.
The 1998 Port District Project Bonds are general corporate obligations of the Authority. Except as expresslyprovided in the 1998 Port District Indenture, the 1998 Port District Project Bonds are not secured by a lien or charge on, or pledge of, any revenue or other assets of the Authority. No tolls, rents, rates or other such charges are pledged for thebenefit of the 1998 Port District Project Bonds. The 1998 Port District Project Bonds are payable from such funds andfrom other monies of the Authority legally available.
The 1998 Port District Project Bonds outstanding at December 31, 2011 are as follows:
Maturity Date Interest Principal Maturity Date Interest Principal(January 1) Rate/Yield Amount (January 1) Rate/Yield Amount
2012 4.75% 2,720$2013 5.00% 2,8452014 4.75% 2,9902015 5.00% 3,130
11,685
2016 4.75% 3,290$ 2021 5.00% 4,1752017 4.75% 3,445 2022 5.00% 4,3852018 5.00% 3,605 2023 5.00% 4,6052019 5.00% 3,790 2024 5.00% 4,8352020 5.00% 3,975 2025 5.00% 5,075
2026 5.00% 5,330
46,510
Total par value of 1998 Port District Project Bonds 58,195Less unamortized bond discount (190)
Total 1998 Port District Project Bonds, net 58,005$
Serial Bonds
Term Bonds
Optional Redemption: The 1998 Port District Project Bonds are subject to redemption prior to maturity on or afterJanuary 1, 2008, in whole at any time, or in part at any time from time to time in any order of maturity as specified by theAuthority, in any principal amount within a maturity as specified by the Authority, and within a maturity as selected by the Trustee by lot at the respective redemption prices expressed as percentages of the principal amount of such Port DistrictProject Bonds or portions thereof to be redeemed as set forth below, together with accrued interest to the redemption date:
Optional Redemption Dates (Inclusive)
January 1, 2009 and thereafter 100.00%
Redemption PricePort District Project Bonds
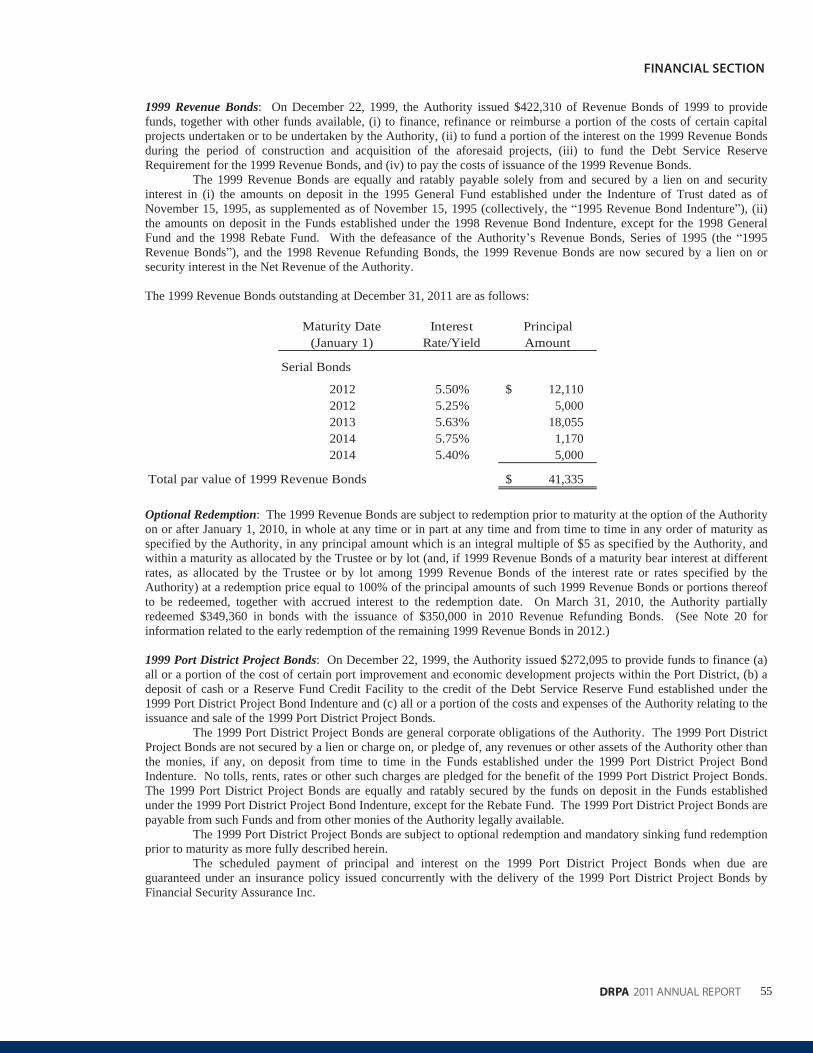
55DRPA 2011 ANNUAL REPORT
FINANCIAL SECTION
1999 Revenue Bonds: On December 22, 1999, the Authority issued $422,310 of Revenue Bonds of 1999 to providefunds, together with other funds available, (i) to finance, refinance or reimburse a portion of the costs of certain capitalprojects undertaken or to be undertaken by the Authority, (ii) to fund a portion of the interest on the 1999 Revenue Bondsduring the period of construction and acquisition of the aforesaid projects, (iii) to fund the Debt Service ReserveRequirement for the 1999 Revenue Bonds, and (iv) to pay the costs of issuance of the 1999 Revenue Bonds.
The 1999 Revenue Bonds are equally and ratably payable solely from and secured by a lien on and securityinterest in (i) the amounts on deposit in the 1995 General Fund established under the Indenture of Trust dated as ofNovember 15, 1995, as supplemented as of November 15, 1995 (collectively, the 1995 Revenue Bond Indenture ), (ii)the amounts on deposit in the Funds established under the 1998 Revenue Bond Indenture, except for the 1998 GeneralFund and the 1998 Rebate Fund. With the defeasance of the Authority s Revenue Bonds, Series of 1995 (the 1995Revenue Bonds ), and the 1998 Revenue Refunding Bonds, the 1999 Revenue Bonds are now secured by a lien on orsecurity interest in the Net Revenue of the Authority.
The 1999 Revenue Bonds outstanding at December 31, 2011 are as follows:
Maturity Date Interest Principal(January 1) Rate/Yield Amount
Serial Bonds
2012 5.50% 12,110$2012 5.25% 5,0002013 5.63% 18,0552014 5.75% 1,1702014 5.40% 5,000
Total par value of 1999 Revenue Bonds 41,335$
Optional Redemption: The 1999 Revenue Bonds are subject to redemption prior to maturity at the option of the Authority on or after January 1, 2010, in whole at any time or in part at any time and from time to time in any order of maturity asspecified by the Authority, in any principal amount which is an integral multiple of $5 as specified by the Authority, andwithin a maturity as allocated by the Trustee or by lot (and, if 1999 Revenue Bonds of a maturity bear interest at differentrates, as allocated by the Trustee or by lot among 1999 Revenue Bonds of the interest rate or rates specified by theAuthority) at a redemption price equal to 100% of the principal amounts of such 1999 Revenue Bonds or portions thereofto be redeemed, together with accrued interest to the redemption date. On March 31, 2010, the Authority partiallyredeemed $349,360 in bonds with the issuance of $350,000 in 2010 Revenue Refunding Bonds. (See Note 20 forinformation related to the early redemption of the remaining 1999 Revenue Bonds in 2012.)
1999 Port District Project Bonds: On December 22, 1999, the Authority issued $272,095 to provide funds to finance (a)all or a portion of the cost of certain port improvement and economic development projects within the Port District, (b) adeposit of cash or a Reserve Fund Credit Facility to the credit of the Debt Service Reserve Fund established under the1999 Port District Project Bond Indenture and (c) all or a portion of the costs and expenses of the Authority relating to theissuance and sale of the 1999 Port District Project Bonds.
The 1999 Port District Project Bonds are general corporate obligations of the Authority. The 1999 Port DistrictProject Bonds are not secured by a lien or charge on, or pledge of, any revenues or other assets of the Authority other thanthe monies, if any, on deposit from time to time in the Funds established under the 1999 Port District Project BondIndenture. No tolls, rents, rates or other such charges are pledged for the benefit of the 1999 Port District Project Bonds.The 1999 Port District Project Bonds are equally and ratably secured by the funds on deposit in the Funds establishedunder the 1999 Port District Project Bond Indenture, except for the Rebate Fund. The 1999 Port District Project Bonds are payable from such Funds and from other monies of the Authority legally available.
The 1999 Port District Project Bonds are subject to optional redemption and mandatory sinking fund redemptionprior to maturity as more fully described herein.
The scheduled payment of principal and interest on the 1999 Port District Project Bonds when due areguaranteed under an insurance policy issued concurrently with the delivery of the 1999 Port District Project Bonds byFinancial Security Assurance Inc.
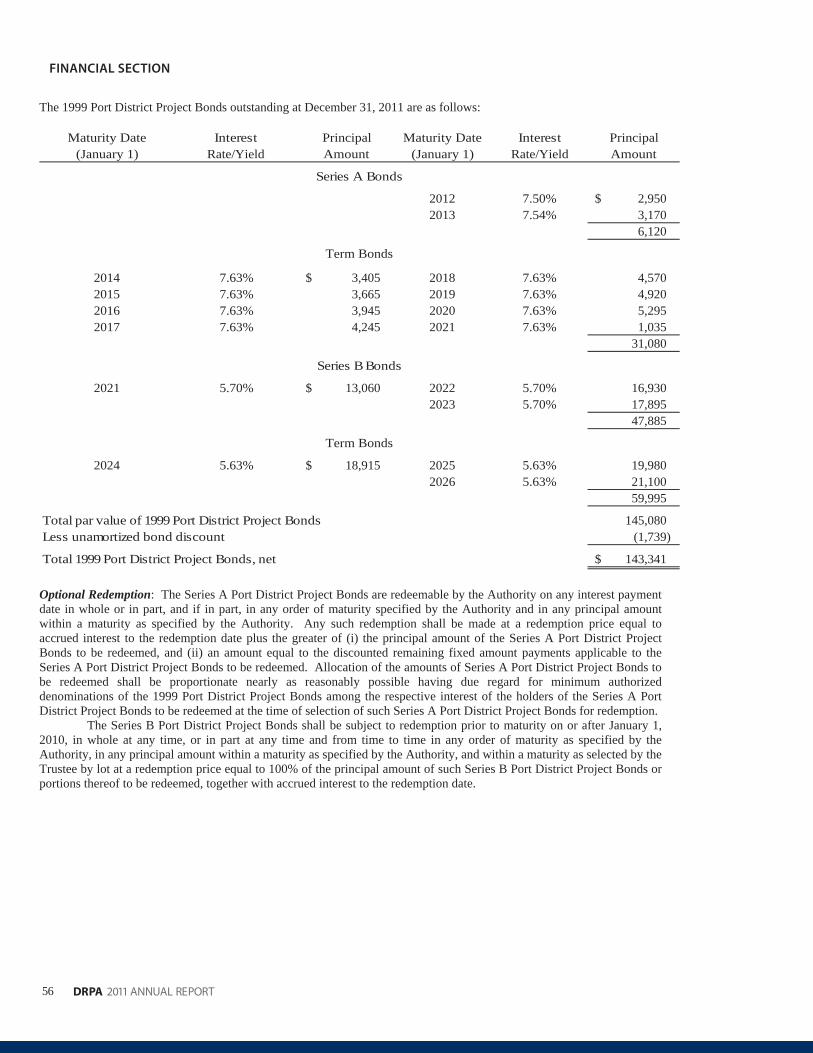
56
FINANCIAL SECTION
DRPA 2011 ANNUAL REPORT
The 1999 Port District Project Bonds outstanding at December 31, 2011 are as follows:
Maturity Date Interest Principal Maturity Date Interest Principal(January 1) Rate/Yield Amount (January 1) Rate/Yield Amount
2012 7.50% 2,950$2013 7.54% 3,170
6,120
2014 7.63% 3,405$ 2018 7.63% 4,5702015 7.63% 3,665 2019 7.63% 4,9202016 7.63% 3,945 2020 7.63% 5,2952017 7.63% 4,245 2021 7.63% 1,035
31,080
2021 5.70% 13,060$ 2022 5.70% 16,9302023 5.70% 17,895
47,885
2024 5.63% 18,915$ 2025 5.63% 19,9802026 5.63% 21,100
59,995
Total par value of 1999 Port District Project Bonds 145,080Less unamortized bond discount (1,739)
Total 1999 Port District Project Bonds, net 143,341$
Series A Bonds
Term Bonds
Series B Bonds
Term Bonds
Optional Redemption: The Series A Port District Project Bonds are redeemable by the Authority on any interest paymentdate in whole or in part, and if in part, in any order of maturity specified by the Authority and in any principal amountwithin a maturity as specified by the Authority. Any such redemption shall be made at a redemption price equal toaccrued interest to the redemption date plus the greater of (i) the principal amount of the Series A Port District ProjectBonds to be redeemed, and (ii) an amount equal to the discounted remaining fixed amount payments applicable to theSeries A Port District Project Bonds to be redeemed. Allocation of the amounts of Series A Port District Project Bonds tobe redeemed shall be proportionate nearly as reasonably possible having due regard for minimum authorizeddenominations of the 1999 Port District Project Bonds among the respective interest of the holders of the Series A PortDistrict Project Bonds to be redeemed at the time of selection of such Series A Port District Project Bonds for redemption.
The Series B Port District Project Bonds shall be subject to redemption prior to maturity on or after January 1,2010, in whole at any time, or in part at any time and from time to time in any order of maturity as specified by theAuthority, in any principal amount within a maturity as specified by the Authority, and within a maturity as selected by the Trustee by lot at a redemption price equal to 100% of the principal amount of such Series B Port District Project Bonds orportions thereof to be redeemed, together with accrued interest to the redemption date.
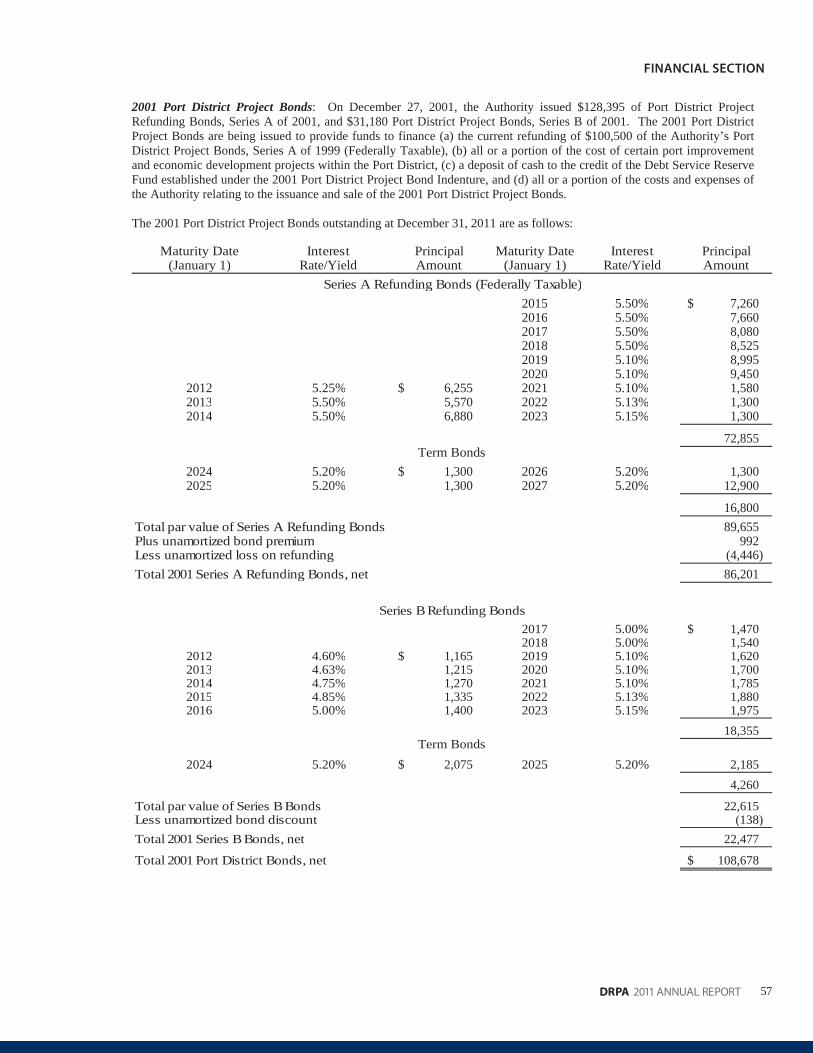
57DRPA 2011 ANNUAL REPORT
FINANCIAL SECTION
2001 Port District Project Bonds: On December 27, 2001, the Authority issued $128,395 of Port District ProjectRefunding Bonds, Series A of 2001, and $31,180 Port District Project Bonds, Series B of 2001. The 2001 Port DistrictProject Bonds are being issued to provide funds to finance (a) the current refunding of $100,500 of the Authority s PortDistrict Project Bonds, Series A of 1999 (Federally Taxable), (b) all or a portion of the cost of certain port improvementand economic development projects within the Port District, (c) a deposit of cash to the credit of the Debt Service ReserveFund established under the 2001 Port District Project Bond Indenture, and (d) all or a portion of the costs and expenses ofthe Authority relating to the issuance and sale of the 2001 Port District Project Bonds.
The 2001 Port District Project Bonds outstanding at December 31, 2011 are as follows:
Maturity Date Interest Principal Maturity Date Interest Principal(January 1) Rate/Yield Amount (January 1) Rate/Yield Amount
2015 5.50% 7,260$2016 5.50% 7,6602017 5.50% 8,0802018 5.50% 8,5252019 5.10% 8,9952020 5.10% 9,450
2012 5.25% 6,255$ 2021 5.10% 1,5802013 5.50% 5,570 2022 5.13% 1,3002014 5.50% 6,880 2023 5.15% 1,300
72,855
2024 5.20% 1,300$ 2026 5.20% 1,3002025 5.20% 1,300 2027 5.20% 12,900
16,800Total par value of Series A Refunding Bonds 89,655Plus unamortized bond premium 992Less unamortized loss on refunding (4,446)Total 2001 Series A Refunding Bonds, net 86,201
Series A Refunding Bonds (Federally Taxable)
Term Bonds
2017 5.00% 1,470$2018 5.00% 1,540
2012 4.60% 1,165$ 2019 5.10% 1,6202013 4.63% 1,215 2020 5.10% 1,7002014 4.75% 1,270 2021 5.10% 1,7852015 4.85% 1,335 2022 5.13% 1,8802016 5.00% 1,400 2023 5.15% 1,975
18,355
2024 5.20% 2,075$ 2025 5.20% 2,1854,260
Total par value of Series B Bonds 22,615Less unamortized bond discount (138)Total 2001 Series B Bonds, net 22,477
Total 2001 Port District Bonds, net 108,678$
Series B Refunding Bonds
Term Bonds

58
FINANCIAL SECTION
DRPA 2011 ANNUAL REPORT
The 2001 Port District Bonds are general corporate obligations of the Authority. The 2001 Port District Project Bonds arenot secured by a lien or charge on, or pledge of, any revenues or other assets of the Authority other than the monies, if any,on deposit from time to time in the Funds established under the 2001 Port District Project Bond Indenture. No tolls, rents, rates or other such charges are pledged for the benefit of the 2001 Port District Project Bonds.
Optional Redemption: The Series A Port District Project Refunding Bonds, and the Series B Port District Project Bonds,maturing on or after January 1, 2013 are subject to redemption prior to maturity at the option of the Authority on or afterJanuary 1, 2012, in whole at any time, or in part at any time and from time to time, in any order of maturity as specified bythe Authority and within a maturity as selected by the Trustee by lot, at a redemption price equal to 100% of the principalamount of such Series A Port District Project Refunding or Series B Port District Project Bonds or portions thereof to beredeemed, together with accrued interest to the redemption date. (See Note 20 for additional information relating to earlyredemptions in 2012.)
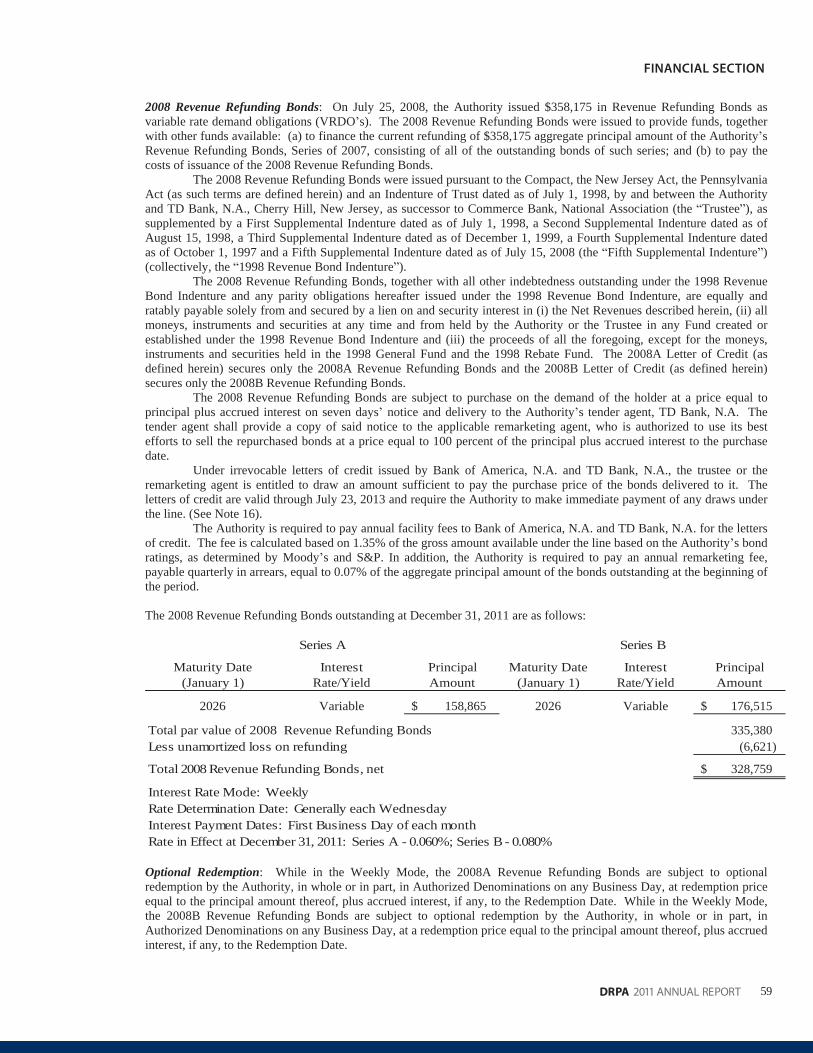
59DRPA 2011 ANNUAL REPORT
FINANCIAL SECTION
2008 Revenue Refunding Bonds: On July 25, 2008, the Authority issued $358,175 in Revenue Refunding Bonds asvariable rate demand obligations (VRDO s). The 2008 Revenue Refunding Bonds were issued to provide funds, togetherwith other funds available: (a) to finance the current refunding of $358,175 aggregate principal amount of the Authority sRevenue Refunding Bonds, Series of 2007, consisting of all of the outstanding bonds of such series; and (b) to pay thecosts of issuance of the 2008 Revenue Refunding Bonds.
The 2008 Revenue Refunding Bonds were issued pursuant to the Compact, the New Jersey Act, the Pennsylvania Act (as such terms are defined herein) and an Indenture of Trust dated as of July 1, 1998, by and between the Authorityand TD Bank, N.A., Cherry Hill, New Jersey, as successor to Commerce Bank, National Association (the Trustee ), assupplemented by a First Supplemental Indenture dated as of July 1, 1998, a Second Supplemental Indenture dated as ofAugust 15, 1998, a Third Supplemental Indenture dated as of December 1, 1999, a Fourth Supplemental Indenture datedas of October 1, 1997 and a Fifth Supplemental Indenture dated as of July 15, 2008 (the Fifth Supplemental Indenture )(collectively, the 1998 Revenue Bond Indenture ).
The 2008 Revenue Refunding Bonds, together with all other indebtedness outstanding under the 1998 RevenueBond Indenture and any parity obligations hereafter issued under the 1998 Revenue Bond Indenture, are equally andratably payable solely from and secured by a lien on and security interest in (i) the Net Revenues described herein, (ii) allmoneys, instruments and securities at any time and from held by the Authority or the Trustee in any Fund created orestablished under the 1998 Revenue Bond Indenture and (iii) the proceeds of all the foregoing, except for the moneys,instruments and securities held in the 1998 General Fund and the 1998 Rebate Fund. The 2008A Letter of Credit (asdefined herein) secures only the 2008A Revenue Refunding Bonds and the 2008B Letter of Credit (as defined herein)secures only the 2008B Revenue Refunding Bonds.
The 2008 Revenue Refunding Bonds are subject to purchase on the demand of the holder at a price equal toprincipal plus accrued interest on seven days notice and delivery to the Authority s tender agent, TD Bank, N.A. Thetender agent shall provide a copy of said notice to the applicable remarketing agent, who is authorized to use its bestefforts to sell the repurchased bonds at a price equal to 100 percent of the principal plus accrued interest to the purchasedate.
Under irrevocable letters of credit issued by Bank of America, N.A. and TD Bank, N.A., the trustee or theremarketing agent is entitled to draw an amount sufficient to pay the purchase price of the bonds delivered to it. Theletters of credit are valid through July 23, 2013 and require the Authority to make immediate payment of any draws underthe line. (See Note 16).
The Authority is required to pay annual facility fees to Bank of America, N.A. and TD Bank, N.A. for the lettersof credit. The fee is calculated based on 1.35% of the gross amount available under the line based on the Authority s bondratings, as determined by Moody s and S&P. In addition, the Authority is required to pay an annual remarketing fee,payable quarterly in arrears, equal to 0.07% of the aggregate principal amount of the bonds outstanding at the beginning of the period.
The 2008 Revenue Refunding Bonds outstanding at December 31, 2011 are as follows:
Maturity Date Interest Principal Maturity Date Interest Principal(January 1) Rate/Yield Amount (January 1) Rate/Yield Amount
2026 Variable 158,865$ 2026 Variable 176,515$
Total par value of 2008 Revenue Refunding Bonds 335,380Less unamortized loss on refunding (6,621)
Total 2008 Revenue Refunding Bonds, net 328,759$
Interest Rate Mode: WeeklyRate Determination Date: Generally each WednesdayInterest Payment Dates: First Business Day of each monthRate in Effect at December 31, 2011: Series A - 0.060%; Series B - 0.080%
Series A Series B
Optional Redemption: While in the Weekly Mode, the 2008A Revenue Refunding Bonds are subject to optionalredemption by the Authority, in whole or in part, in Authorized Denominations on any Business Day, at redemption priceequal to the principal amount thereof, plus accrued interest, if any, to the Redemption Date. While in the Weekly Mode,the 2008B Revenue Refunding Bonds are subject to optional redemption by the Authority, in whole or in part, inAuthorized Denominations on any Business Day, at a redemption price equal to the principal amount thereof, plus accrued interest, if any, to the Redemption Date.
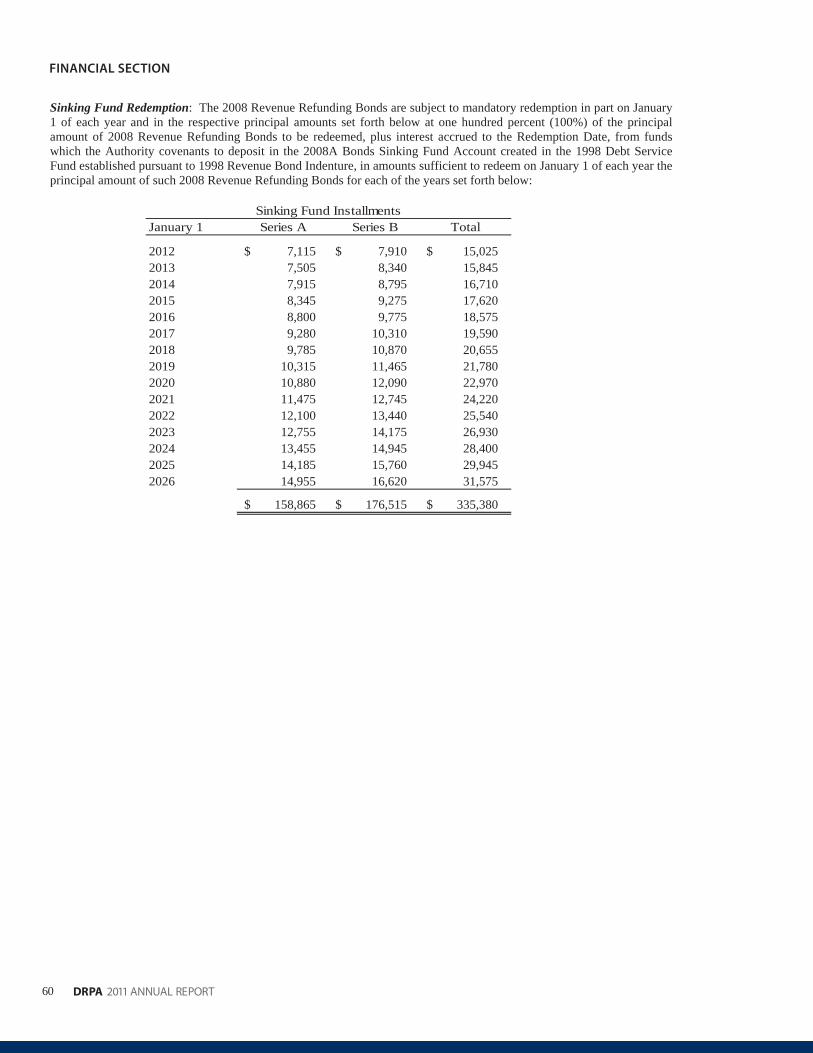
60
FINANCIAL SECTION
DRPA 2011 ANNUAL REPORT
Sinking Fund Redemption: The 2008 Revenue Refunding Bonds are subject to mandatory redemption in part on January1 of each year and in the respective principal amounts set forth below at one hundred percent (100%) of the principalamount of 2008 Revenue Refunding Bonds to be redeemed, plus interest accrued to the Redemption Date, from fundswhich the Authority covenants to deposit in the 2008A Bonds Sinking Fund Account created in the 1998 Debt ServiceFund established pursuant to 1998 Revenue Bond Indenture, in amounts sufficient to redeem on January 1 of each year the principal amount of such 2008 Revenue Refunding Bonds for each of the years set forth below:
January 1 Series A Series B Total
2012 7,115$ 7,910$ 15,025$2013 7,505 8,340 15,8452014 7,915 8,795 16,7102015 8,345 9,275 17,6202016 8,800 9,775 18,5752017 9,280 10,310 19,5902018 9,785 10,870 20,6552019 10,315 11,465 21,7802020 10,880 12,090 22,9702021 11,475 12,745 24,2202022 12,100 13,440 25,5402023 12,755 14,175 26,9302024 13,455 14,945 28,4002025 14,185 15,760 29,9452026 14,955 16,620 31,575
158,865$ 176,515$ 335,380$
Sinking Fund Installments
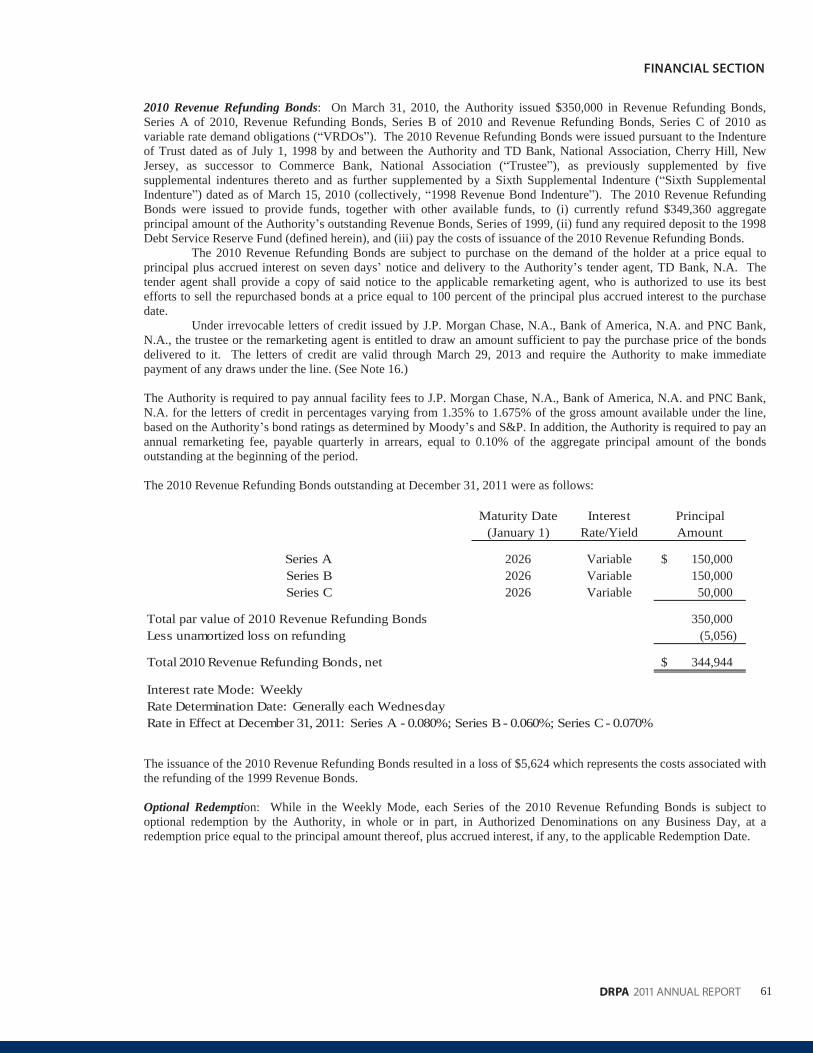
61DRPA 2011 ANNUAL REPORT
FINANCIAL SECTION
2010 Revenue Refunding Bonds: On March 31, 2010, the Authority issued $350,000 in Revenue Refunding Bonds,Series A of 2010, Revenue Refunding Bonds, Series B of 2010 and Revenue Refunding Bonds, Series C of 2010 asvariable rate demand obligations ( VRDOs ). The 2010 Revenue Refunding Bonds were issued pursuant to the Indentureof Trust dated as of July 1, 1998 by and between the Authority and TD Bank, National Association, Cherry Hill, NewJersey, as successor to Commerce Bank, National Association ( Trustee ), as previously supplemented by fivesupplemental indentures thereto and as further supplemented by a Sixth Supplemental Indenture ( Sixth SupplementalIndenture ) dated as of March 15, 2010 (collectively, 1998 Revenue Bond Indenture ). The 2010 Revenue RefundingBonds were issued to provide funds, together with other available funds, to (i) currently refund $349,360 aggregateprincipal amount of the Authority s outstanding Revenue Bonds, Series of 1999, (ii) fund any required deposit to the 1998Debt Service Reserve Fund (defined herein), and (iii) pay the costs of issuance of the 2010 Revenue Refunding Bonds.
The 2010 Revenue Refunding Bonds are subject to purchase on the demand of the holder at a price equal toprincipal plus accrued interest on seven days notice and delivery to the Authority s tender agent, TD Bank, N.A. Thetender agent shall provide a copy of said notice to the applicable remarketing agent, who is authorized to use its bestefforts to sell the repurchased bonds at a price equal to 100 percent of the principal plus accrued interest to the purchasedate.
Under irrevocable letters of credit issued by J.P. Morgan Chase, N.A., Bank of America, N.A. and PNC Bank,N.A., the trustee or the remarketing agent is entitled to draw an amount sufficient to pay the purchase price of the bondsdelivered to it. The letters of credit are valid through March 29, 2013 and require the Authority to make immediatepayment of any draws under the line. (See Note 16.)
The Authority is required to pay annual facility fees to J.P. Morgan Chase, N.A., Bank of America, N.A. and PNC Bank,N.A. for the letters of credit in percentages varying from 1.35% to 1.675% of the gross amount available under the line,based on the Authority s bond ratings as determined by Moody s and S&P. In addition, the Authority is required to pay anannual remarketing fee, payable quarterly in arrears, equal to 0.10% of the aggregate principal amount of the bondsoutstanding at the beginning of the period.
The 2010 Revenue Refunding Bonds outstanding at December 31, 2011 were as follows:
Maturity Date Interest Principal(January 1) Rate/Yield Amount
Series A 2026 Variable 150,000$Series B 2026 Variable 150,000Series C 2026 Variable 50,000
Total par value of 2010 Revenue Refunding Bonds 350,000Less unamortized loss on refunding (5,056)
Total 2010 Revenue Refunding Bonds, net 344,944$
Interest rate Mode: WeeklyRate Determination Date: Generally each WednesdayRate in Effect at December 31, 2011: Series A - 0.080%; Series B - 0.060%; Series C - 0.070%
The issuance of the 2010 Revenue Refunding Bonds resulted in a loss of $5,624 which represents the costs associated with the refunding of the 1999 Revenue Bonds.
Optional Redemption: While in the Weekly Mode, each Series of the 2010 Revenue Refunding Bonds is subject tooptional redemption by the Authority, in whole or in part, in Authorized Denominations on any Business Day, at aredemption price equal to the principal amount thereof, plus accrued interest, if any, to the applicable Redemption Date.
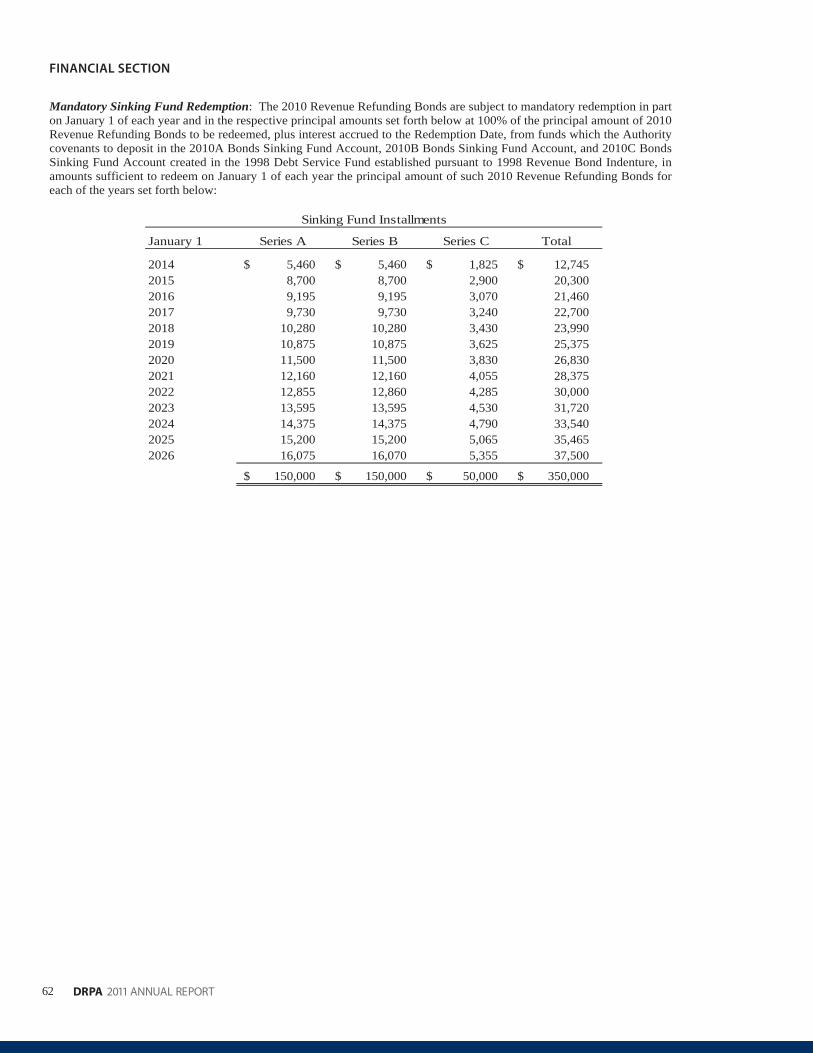
62
FINANCIAL SECTION
DRPA 2011 ANNUAL REPORT
Mandatory Sinking Fund Redemption: The 2010 Revenue Refunding Bonds are subject to mandatory redemption in part on January 1 of each year and in the respective principal amounts set forth below at 100% of the principal amount of 2010 Revenue Refunding Bonds to be redeemed, plus interest accrued to the Redemption Date, from funds which the Authoritycovenants to deposit in the 2010A Bonds Sinking Fund Account, 2010B Bonds Sinking Fund Account, and 2010C BondsSinking Fund Account created in the 1998 Debt Service Fund established pursuant to 1998 Revenue Bond Indenture, inamounts sufficient to redeem on January 1 of each year the principal amount of such 2010 Revenue Refunding Bonds foreach of the years set forth below:
January 1 Series A Series B Series C Total
2014 5,460$ 5,460$ 1,825$ 12,745$2015 8,700 8,700 2,900 20,3002016 9,195 9,195 3,070 21,4602017 9,730 9,730 3,240 22,7002018 10,280 10,280 3,430 23,9902019 10,875 10,875 3,625 25,3752020 11,500 11,500 3,830 26,8302021 12,160 12,160 4,055 28,3752022 12,855 12,860 4,285 30,0002023 13,595 13,595 4,530 31,7202024 14,375 14,375 4,790 33,5402025 15,200 15,200 5,065 35,4652026 16,075 16,070 5,355 37,500
150,000$ 150,000$ 50,000$ 350,000$
Sinking Fund Installments

63DRPA 2011 ANNUAL REPORT
FINANCIAL SECTION
2010 Revenue Bonds: On July 15, 2010, the Authority issued its Revenue Bonds, Series D of 2010 (the 2010 RevenueBonds ). The 2010 Revenue Bonds were issued by means of a book-entry-only system evidencing ownership and transfer of 2010 Revenue Bonds on the records of The Depository Trust Company, New York, New York ( DTC ), and itsparticipants. Interest on the 2010 Revenue Bonds will be payable semi-annually on January 1 and July 1 of each yearcommencing January 1, 2011 (each an Interest Payment Date ).
The 2010 Revenue Bonds were issued pursuant to the Compact, the New Jersey Act, the Pennsylvania Act (assuch terms are defined herein) and an Indenture of Trust, dated as of July 1, 1998, by and between the Authority and TDBank, National Association, Cherry Hill, New Jersey, as successor to Commerce Bank, National Association (theTrustee ), as supplemented by a First Supplemental Indenture, dated as of July 1, 1998, a Second Supplemental
Indenture, dated as of August 15, 1998, a Third Supplemental Indenture, dated as of December 1, 1999, a FourthSupplemental Indenture, dated as of October 1, 2007, a Fifth Supplemental Indenture, dated as of July 15, 2008, a SixthSupplemental Indenture, dated as of March 15, 2010, and a Seventh Supplemental Indenture, dated as of July 1, 2010(collectively, the 1998 Revenue Bond Indenture ). The 2010 Revenue Bonds were issued for the purpose of: (i)financing a portion of the costs of the Authority s approved Capital improvement Program; (ii) funding the Debt ServiceReserve Requirement for the 2010 Revenue Bonds; and (iii) paying the costs of issuance of the 2010 Revenue Bonds(Series D). (Note: As per its 2008 Reimbursement Resolution, upon issuance of the 2010 Revenue Bonds, the Authorityreimbursed its General Fund, for approximately $100 million, for prior capital expenditures made during the periodOctober 2008 through July 2010).
The 2010 Revenue Bonds are limited obligations of the Authority and are payable solely from the sourcesreferred to in the 2010 Revenue Bonds and the 1998 Revenue Bond Indenture. Neither the credit nor the taxing power ofthe Commonwealth of Pennsylvania (the Commonwealth ) or the State of New Jersey (the State ) or of any county,city, borough, village, township or other municipality of the Commonwealth or the State is or shall be pledged for thepayment of the principal, redemption premium, if any, or interest on the 2010 Revenue Bonds. The 2010 Revenue Bondsare not and shall not be deemed to be a debt or liability of the Commonwealth or the State or of any such county, city,borough, village, township or other municipality, and neither the Commonwealth nor the State nor any such county, city,borough, village, township or other municipality is or shall be liable for the payment of such principal or, redemptionpremium, or interest. The Authority has no taxing power.
Mandatory Sinking Fund Redemption: The 2010 Revenue Bonds maturing January 1, 2035 and January 1, 2040 aresubject to mandatory redemption prior to maturity by the Authority, in part, on January 1 of each year in the respectiveprincipal amounts set forth below at 100% of the principal amount thereof, plus accrued interest to the Redemption Datefrom sinking fund installments which are required to be paid in amounts sufficient to redeem on January 1 of each year the principal amount of such 2010 Revenue Bonds specified for each of the years set forth below. Payment of principal andinterest on the 2010 Revenue Bonds (the 2010 Insured Bonds ), in the principal amount of $60,000 maturing January 1,2040 is guaranteed under an insurance policy issued by Assured Guaranty Municipal Corp. (formerly known as FinancialSecurity Assured, Inc.).
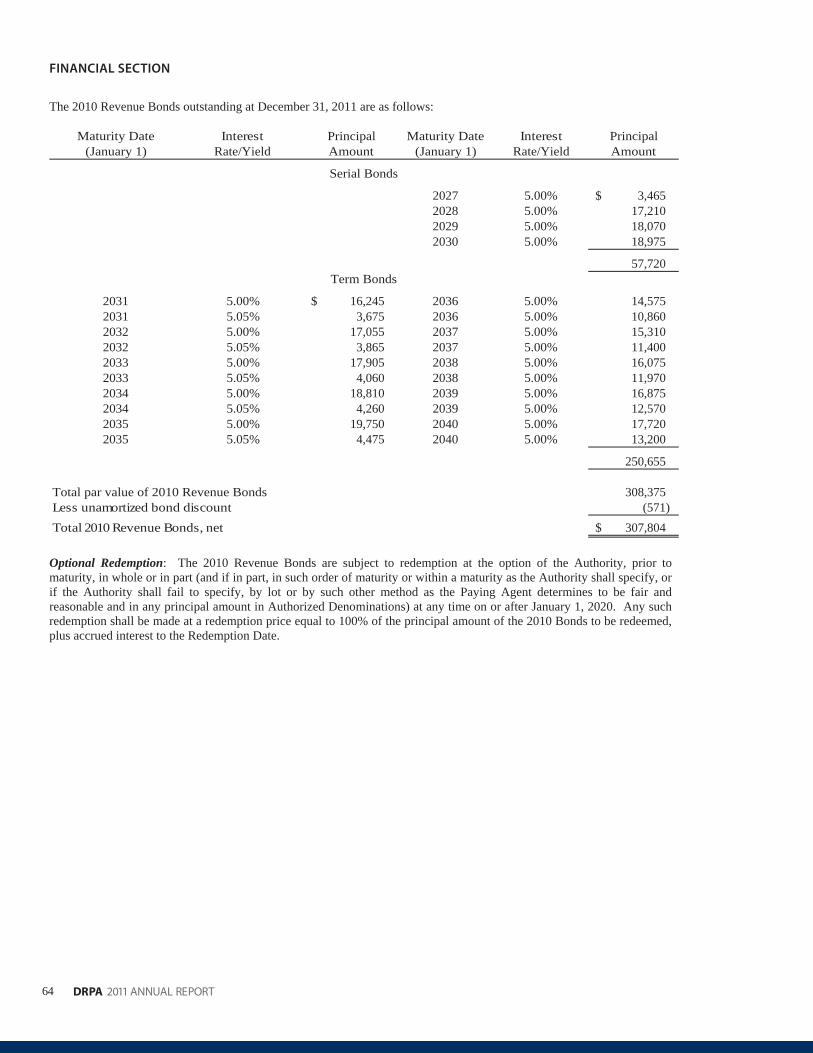
64
FINANCIAL SECTION
DRPA 2011 ANNUAL REPORT
The 2010 Revenue Bonds outstanding at December 31, 2011 are as follows:
Maturity Date Interest Principal Maturity Date Interest Principal(January 1) Rate/Yield Amount (January 1) Rate/Yield Amount
2027 5.00% 3,465$2028 5.00% 17,2102029 5.00% 18,0702030 5.00% 18,975
57,720
2031 5.00% 16,245$ 2036 5.00% 14,5752031 5.05% 3,675 2036 5.00% 10,8602032 5.00% 17,055 2037 5.00% 15,3102032 5.05% 3,865 2037 5.00% 11,4002033 5.00% 17,905 2038 5.00% 16,0752033 5.05% 4,060 2038 5.00% 11,9702034 5.00% 18,810 2039 5.00% 16,8752034 5.05% 4,260 2039 5.00% 12,5702035 5.00% 19,750 2040 5.00% 17,7202035 5.05% 4,475 2040 5.00% 13,200
250,655
Total par value of 2010 Revenue Bonds 308,375Less unamortized bond discount (571)Total 2010 Revenue Bonds, net 307,804$
Serial Bonds
Term Bonds
Optional Redemption: The 2010 Revenue Bonds are subject to redemption at the option of the Authority, prior tomaturity, in whole or in part (and if in part, in such order of maturity or within a maturity as the Authority shall specify, orif the Authority shall fail to specify, by lot or by such other method as the Paying Agent determines to be fair andreasonable and in any principal amount in Authorized Denominations) at any time on or after January 1, 2020. Any suchredemption shall be made at a redemption price equal to 100% of the principal amount of the 2010 Bonds to be redeemed,plus accrued interest to the Redemption Date.
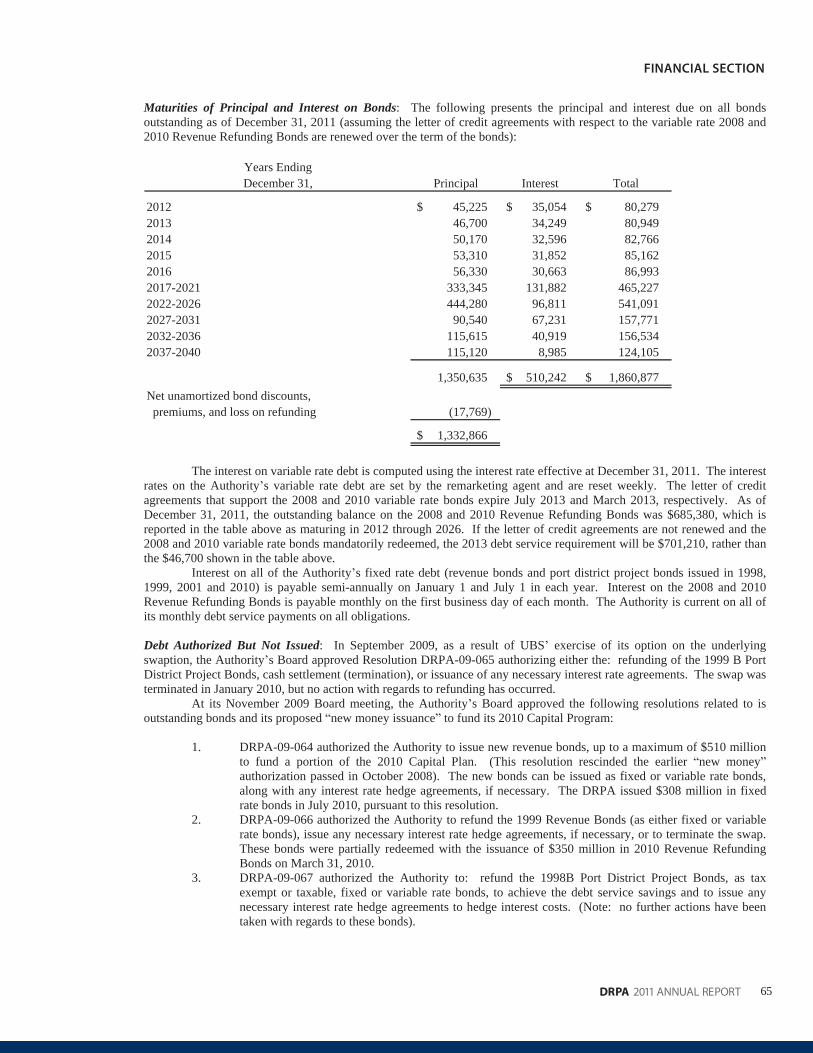
65DRPA 2011 ANNUAL REPORT
FINANCIAL SECTION
Maturities of Principal and Interest on Bonds: The following presents the principal and interest due on all bondsoutstanding as of December 31, 2011 (assuming the letter of credit agreements with respect to the variable rate 2008 and2010 Revenue Refunding Bonds are renewed over the term of the bonds):
Years EndingDecember 31, Principal Interest Total
2012 45,225$ 35,054$ 80,279$2013 46,700 34,249 80,9492014 50,170 32,596 82,7662015 53,310 31,852 85,1622016 56,330 30,663 86,9932017-2021 333,345 131,882 465,2272022-2026 444,280 96,811 541,0912027-2031 90,540 67,231 157,7712032-2036 115,615 40,919 156,5342037-2040 115,120 8,985 124,105
1,350,635 510,242$ 1,860,877$Net unamortized bond discounts, premiums, and loss on refunding (17,769)
1,332,866$
The interest on variable rate debt is computed using the interest rate effective at December 31, 2011. The interest rates on the Authority s variable rate debt are set by the remarketing agent and are reset weekly. The letter of creditagreements that support the 2008 and 2010 variable rate bonds expire July 2013 and March 2013, respectively. As ofDecember 31, 2011, the outstanding balance on the 2008 and 2010 Revenue Refunding Bonds was $685,380, which isreported in the table above as maturing in 2012 through 2026. If the letter of credit agreements are not renewed and the2008 and 2010 variable rate bonds mandatorily redeemed, the 2013 debt service requirement will be $701,210, rather thanthe $46,700 shown in the table above.
Interest on all of the Authority s fixed rate debt (revenue bonds and port district project bonds issued in 1998,1999, 2001 and 2010) is payable semi-annually on January 1 and July 1 in each year. Interest on the 2008 and 2010Revenue Refunding Bonds is payable monthly on the first business day of each month. The Authority is current on all ofits monthly debt service payments on all obligations.
Debt Authorized But Not Issued: In September 2009, as a result of UBS exercise of its option on the underlyingswaption, the Authority s Board approved Resolution DRPA-09-065 authorizing either the: refunding of the 1999 B PortDistrict Project Bonds, cash settlement (termination), or issuance of any necessary interest rate agreements. The swap was terminated in January 2010, but no action with regards to refunding has occurred.
At its November 2009 Board meeting, the Authority s Board approved the following resolutions related to isoutstanding bonds and its proposed new money issuance to fund its 2010 Capital Program:
1. DRPA-09-064 authorized the Authority to issue new revenue bonds, up to a maximum of $510 millionto fund a portion of the 2010 Capital Plan. (This resolution rescinded the earlier new moneyauthorization passed in October 2008). The new bonds can be issued as fixed or variable rate bonds,along with any interest rate hedge agreements, if necessary. The DRPA issued $308 million in fixedrate bonds in July 2010, pursuant to this resolution.
2. DRPA-09-066 authorized the Authority to refund the 1999 Revenue Bonds (as either fixed or variablerate bonds), issue any necessary interest rate hedge agreements, if necessary, or to terminate the swap.These bonds were partially redeemed with the issuance of $350 million in 2010 Revenue RefundingBonds on March 31, 2010.
3. DRPA-09-067 authorized the Authority to: refund the 1998B Port District Project Bonds, as taxexempt or taxable, fixed or variable rate bonds, to achieve the debt service savings and to issue anynecessary interest rate hedge agreements to hedge interest costs. (Note: no further actions have beentaken with regards to these bonds).
66
FINANCIAL SECTION
DRPA 2011 ANNUAL REPORT
Bond Ratings
Moody s Investors Service Bond Ratings: In September 2007, concurrent with the issuance of the 2007 RevenueRefunding Bonds, Moody s affirmed the Authority s existing underlying ratings on all revenue and port district projectbonds (which are A3 and Baa3, respectively) and assigned a rating of A3 to the 2007 Revenue Refunding Bonds. Inaddition, Moody s revised its outlook on the Authority s bonds to stable .
Concurrent with the issuance of $358 million in Revenue Refunding Bonds on July 9, 2008, Moody s assignedan A3 rating to the new issue, with a stable outlook. Moody s also affirmed the A3 ratings on all outstanding revenuebond debt issued under the 1998 Indenture, and its Baa3 ratings on all existing port district project bonds.
Concurrent with the issuance of $350 million in Revenue Refunding Bonds on March 31, 2010, in its reportdated March 2010, Moody s assigned its A3 underlying ratings to the Authority s 2010 Revenue Refunding Bonds Series(A thru C). Moody s affirmed its A3 underlying ratings, on the Authority s existing revenue bond debt, and the Baa3long term ratings on its PDP Bonds. The outlook was changed from stable to a negative outlook on all of theAuthority s bonds.
Concurrent with the issuance of $308.4 million in Revenue Bonds on July 15, 2010, in its report dated May 4,2010, Moody s assigned its A3 underlying ratings to the Authority s 2010 Revenue Bonds (Series D). Moody s affirmedits A3 underlying ratings, on the Authority s existing revenue bond debt, and the Baa3 long term ratings on its PDPBonds. (Note: Moody s also assigned a rating of Aa3 negative outlook to the 2010 Insured Revenue Bonds). As ofDecember 31, 2011, all Authority bonds remain with a negative outlook.
Standard & Poor s Ratings Services Bond Ratings: On October 2, 2007, concurrent with the issuance of the 2007Revenue Refunding Bonds, S&P affirmed the Authority s existing underlying BBB+ ratings on all revenue bonds andassigned a rating of BBB+ to the 2007 Revenue Refunding Bonds. S&P also affirmed its BBB- underlying ratings on allport district project bonds and revised its outlook on the Authority s bonds to stable from negative.
On July 8, 2008, concurrent with the issuance of the 2008 Revenue Refunding Bonds described herein, S&Passigned its BBB+ rating to the new bonds. S&P also affirmed its BBB+ underlying ratings on all outstanding revenuebonds and revised its outlook on these bonds from stable to positive . S&P also affirmed its BBB- ratings on all PortDistrict Project Bonds, which carry a stable outlook.
On July 13, 2009, S&P raised the underlying rate (SPUR) on all of the Authority s revenue/revenue refundingbonds from BBB+ to A- with a stable outlook. S&P reaffirmed the existing BBB- ratings on the port district project bonds with a positive outlook.
Concurrent with the issuance of $350 million in revenue refunding bonds on March 31, 2010, in its report datedFebruary 24, 2010, S&P assigned its A- underlying rating (SPUR) to the Authority s 2010 Revenue Refunding BondSeries A thru C. S&P affirmed its A- underlying ratings, on the Authority s existing revenue bond debt, and the BBB-long term ratings on its PDP Bonds. The outlook remained as stable.
Concurrent with the issuance of $308.4 million in revenue bonds on July 15, 2010, in its report dated May 4,2010, S&P assigned its A- underlying rating (SPUR) to the Authority s 2010 Revenue Bonds (Series D). S&P affirmedits A- underlying ratings, on the Authority s existing revenue bond debt, and the BBB- long term ratings on its PDPBonds. (Note: S&P also assigned a rating of AAA negative outlook to the 2010 Insured Revenue Bonds). As ofDecember 31, 2011, the outlook remains as stable on all of the Authority s bonds.
Ratings on Jointly Supported Transactions: Moody s Investors Service ( Moody s ) and Standard & Poor s RatingsServices, a division of The McGraw-Hill Companies, Inc. ( S&P ), initially assigned their municipal bond ratings to the2008 Revenue Refunding Bonds as set forth in the following chart based upon the understanding that upon delivery of the2008A Revenue Refunding Bonds or 2008B Revenue Refunding Bonds, the respective Letter of Credit securing thepayment when due of the principal of, or purchase price of 2008A Revenue Refunding Bonds or 2008B RevenueRefunding Bonds tendered for purchase and not otherwise remarketed and interest on the 2008A Revenue RefundingBonds or 2008B Revenue Refunding Bonds will be delivered by Bank of America, N.A. and TD Bank, N.A., respectively.
Long-term Short-term
2008A Revenue Refunding Bonds Moody's: Aaa VMIG 1S&P: AA+ A-1+
2008 B Revenue Refunding Bonds Moody's: Aaa VMIG 1S&P: AA- A-1+
67DRPA 2011 ANNUAL REPORT
FINANCIAL SECTION
The long-term ratings assigned by Moody s and S&P reflect each organization s approach to rating jointlysupported transactions and are based upon the Direct Pay Letters of Credit provided by Bank of America, N.A. for the2008A Revenue Refunding Bonds and TD Bank, N.A. for the 2008B Revenue Refunding Bonds. Since a loss to abondholder of a 2008A Revenue Refunding Bond or a 2008B Revenue Refunding Bond would occur only if both the bank providing the applicable Letter of Credit and the Authority default in payment, Moody s and S&P have assigned a long-term rating to the 2008 Revenue Refunding Bonds based upon the joint probability of default by both applicable parties.In determining the joint probability of default, Moody s considers the level of correlation between the bank providing theapplicable Letter of Credit and the Authority. Moody s has determined that there is a low level of correlation between thebank providing the applicable Letter of Credit and the Authority. Given this correlation, Moody s believes the jointprobability of default results in credit risk consistent with a Aaa rating for the 2008 Revenue Refunding Bonds.
No provider of a Letter of Credit is obligated to maintain its present or any other credit rating and shall have noliability if any such credit rating is lowered, withdrawn, or suspended
In May 2009, the Authority was advised that Standard & Poor s Ratings Services had updated its methodologyand assumptions for rating jointly supported obligations when each obligor is fully responsible for the entire obligation.In this situation, a default on the obligation would occur only if both obligors default. As a result, in its report dated April22, 2009 ( List of U.S. Public Finance Ratings Placed on CreditWatch Positive As A Result of Joint-Supported CriteriaUpdate ), S&P changed its ratings on the 2008 Revenue Refunding Bonds (Series A), supported by a Letter of Credit byBank of America, N.A., from AA+/A-1 + to A-/A-1.
NOTE 13. CONDUIT DEBT OBLIGATIONS
The Authority is authorized to plan, finance, develop, acquire, construct, purchase, lease, maintain, market, improve andoperate any project within the Port District including, but not limited to, any terminal, terminal facility, transportationfacility, or any other facility of commerce or economic development activity, from funds available after appropriateallocation for maintenance of bridge and other capital facilities. Utilizing this authorization, the Authority has issuedcertain debt bearing its name to lower the cost of borrowing for specific governmental entities. This debt is commonlyreferred to as conduit (or non-commitment) debt. Typically, the debt proceeds are used to finance facilities within theAuthority s jurisdiction that are transferred to the third party either by lease or by sale. The underlying lease or mortgageloan agreement, which serves as collateral for the promise of payments by the third party, calls for payments that areessentially the same as collateral for the promise of payments by the third party, calls for payments that are essentially thesame as those required by the debt. These payments are made by the third-party directly to an independent trustee, who isappointed to service and administer the arrangement. The Authority assumes no responsibility for repayment of this debtbeyond the resources provided by the underlying leases or mortgage loans.
As of December 31, 2011, there was one series of Charter School Project Bonds outstanding, issued for theLEAP Academy Charter School, Inc. The corresponding aggregate principal totaling $8,500 is treated strictly as conduitdebt obligations under Interpretation No. 2 of the Governmental Accounting Standards Board (GASB) and accordingly isnot included in the financial statements. The following schedule details the series together with the amount outstanding:
1/1/2010 12/31/2010 12/31/2011Issue Issued Beginning Ending Ending
Issue Date Amount Balance Paid Balance Paid Balance
Charter School Project Bonds, Series 2003 09/01/03 8,500$ 7,570$ 260$ 7,310$ 270$ 7,040$
68
FINANCIAL SECTION
DRPA 2011 ANNUAL REPORT
NOTE 14. GOVERNMENT CONTRIBUTIONS FOR CAPITAL IMPROVEMENTS, ADDITIONS AND OTHER PROJECTS
The Authority receives contributions in aid for financing capital improvements to the rapid transit system from the Federal Transit Administration and New Jersey Transit. Capital improvement grant funds of $33,021 and $20,603 were receivedin 2011 and 2010, respectively. The Authority receives federal and state grants for specific construction purposes that aresubject to review and audit by the grantor agencies. Although such audits could result in disallowances under terms of the grants, it is the opinion of management that any required reimbursements will not be material to the Authority s net assets.
NOTE 15. CONTINGENCIES
Public Liability claim exposures are self-insured by the Authority within its self insured retention limit of $5 million foreach occurrence, after which, exists a $25 million limit of Claims made Excess Liability Insurance per occurrence, and inthe aggregate, to respond to any large losses exceeding the retention. The Authority, excluding PATCO, self-insures theinitial $1 million limit, per accident, for Workers Compensation claims, after which a $5 million limit of Excess WorkersCompensation insurance is retained to respond to significant claims. PATCO is completely self-insured for WorkersCompensation claims.
The Authority purchases commercial insurance for all other risks of loss. The Authority reviews annually andwhere appropriate adjusts policy loss limits and deductibles as recommended by its insurance consultants in response toprevailing market conditions, loss experience, and revenues. Policy loss limits are established when the professionalassistance of independent insurance and engineering consultants to ensure that sufficient coverage exists to accommodatethe maximum probable loss that may result in the ordinary course of business. In addition, the amounts of settlements forthe last three years have not exceeded the insurance coverage provided in those years.
Self-Insurance 2011 2010
Beginning balance 2,905$ 3,039$Incurred claims 2,225 2,307Payment of claims (2,001) (2,445)Other - administrative fees, recoveries 12 4
Ending balance 3,141$ 2,905$
The Authority is involved in various actions arising in the ordinary course of business and from workerscompensation claims. In the opinion of management, the ultimate outcome of these actions will not have a materialadverse effect on the Authority s combined financial position and combined results of operations.
NOTE 16. COMMITMENTS
A. Development Projects: In support of previously authorized economic development projects, the DRPA s Board ofCommissioners authorized loan guarantees to various banks, in an amount not-to-exceed $27,000, to complete thefinancing of particular projects, as shown below.
As of December 31, 2011, the Authority had executed loan guarantees with various banks, totaling$19,500. The loan guarantees include: L3 Communications ($10.0 million), World Trade Center ($8.0 million), and theHome Port Alliance ($1.0 million), and Ship Recycling Research ($0.5 million). These guarantees all remain in force;however, the Authority has made no cash outlays relating to these guarantees.
69DRPA 2011 ANNUAL REPORT
FINANCIAL SECTION
L3 Communications Loan Guarantee: At its March 2010 meeting, the Authority s Board approved a modification of the$10 million guarantee relating to a letter of credit (LOC) supporting the L3 Communications project in order toaccommodate a change in the bank providing the letter of credit, following the expiration of the original LOC. Theguarantee survives the expiration of the original LOC. Following the modification, in April 2010, NJ EDA provided a $20 million guarantee to the LOC provider, while the Authority provided a $10 million guarantee in favor of NJ EDA, (and not the bank). The changes in the guarantee do not increase exposure or risk. As was the case with the original guarantee, the Authority s guarantee will be accessed only if NJ EDA must pay more than $10 million on its guarantee.
FastShip Loan Guarantee (terminated 2010): Since 1994, the Authority had guaranteed a $3.5 million loan from MellonBank to FastShip, which guarantee was then held by Citizens Bank. No revenues or assets of the Authority were pledgedto secure the guarantee. The guarantee had been extended on several occasions. In May of 2010, Citizens Bank demanded payment under the guarantee. On June 30th, 2010, as a result of discussions between the Authority and Citizens Bank, the Authority made a payment of $3.54 million from its 1998 General Fund in full satisfaction of the Authority s obligationunder the guarantee. As a result of such payment, the guarantee has been terminated and the Authority has no furtherobligations to Citizens Bank with regard to FastShip. The Authority has acquired Citizens Bank s security priority.
B. Community Impact: The Authority has an agreement with the City of Philadelphia (City) for Community Impactregarding the PATCO high-speed transit system. The agreement expires on December 31, 2050. In 2011, the baseamount payable to the City totaled $3,060 as adjusted for the cumulative increases in the Consumer Price Index (CPI)between 1999 and 2010. Base payments for 2012 through 2017 shall equal the previous year s base payment adjusted byany increase in the CPI for that year. For the years 2018 through 2050, the annual base payment shall equal one dollar.
In addition, for the duration of the lease the Authority is required to annually create a PATCO CommunityImpact Fund in the amount of $500, with payment of such fund to be divided annually between communities within theCommonwealth and the State, based on PATCO track miles in the respective states.
The minimum commitment, adjusted for the effect of the increase in the CPI at December 31, 2011, are asfollows:
Year Amount
2012 3,612$2013 3,7312014 3,8302015 3,9122016 4,006
Thereafter 20,603
39,694$
C. OCIP Letters of Credit: In May 2008, the Authority entered into two new separate irrevocable standby Letters ofCredit with TD Bank, N.A. (formerly Commerce Bank) and Wachovia Bank in support of the Authority s OwnerControlled Insurance Program (OCIP) . Under this program, the Authority purchased coverage for all contractorsworking on major construction projects.
The Letter of Credit with Wells Fargo Bank (formerly Wachovia Bank) is for a four-year term in the amount of$5,000 with an expiration date of May 7, 2012. The Letter of Credit with TD Bank, N.A. (formerly Commerce Bank) is in an initial amount of $3,015 and automatically increases annually each May, in the amount of $816, until it expires on May7, 2012. (See Note 20 for additional information with respect to these Letters of Credit).
As of December 31, 2011, the unused amount of the Letter of Credits totaled $10,462. No draw downs have been made against any Letter of Credit.
Direct Pay Letters of Credit (2008 Revenue Refunding Bonds):
The Authority s 2008 Revenue Refunding Bonds (Series A and B), are secured by irrevocable transferable Direct PayLetters of Credit (DPLOC) issued by two credit providers, the Bank of America, N.A. and TD Bank, N.A., in the initialamounts of $172.6 million and $191.8 million, respectively. The Authority entered into separate ReimbursementAgreements with each credit provider to facilitate the issuance of said DPLOCs.
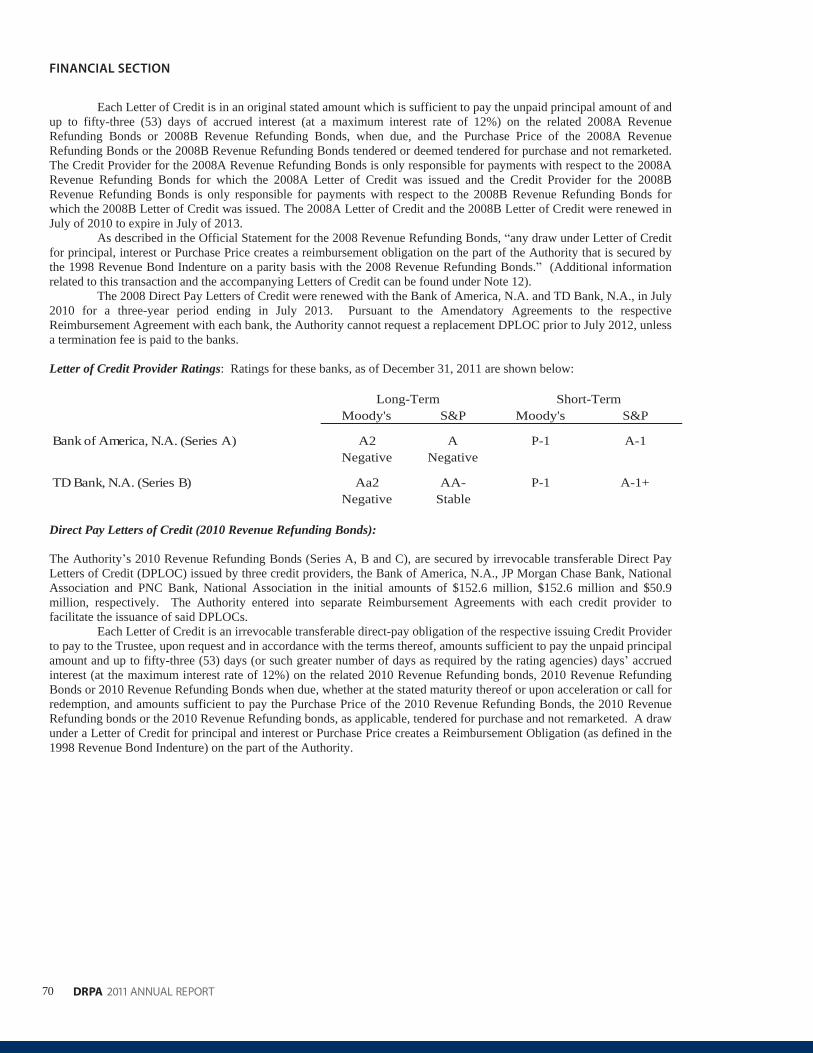
70
FINANCIAL SECTION
DRPA 2011 ANNUAL REPORT
Each Letter of Credit is in an original stated amount which is sufficient to pay the unpaid principal amount of and up to fifty-three (53) days of accrued interest (at a maximum interest rate of 12%) on the related 2008A RevenueRefunding Bonds or 2008B Revenue Refunding Bonds, when due, and the Purchase Price of the 2008A RevenueRefunding Bonds or the 2008B Revenue Refunding Bonds tendered or deemed tendered for purchase and not remarketed.The Credit Provider for the 2008A Revenue Refunding Bonds is only responsible for payments with respect to the 2008ARevenue Refunding Bonds for which the 2008A Letter of Credit was issued and the Credit Provider for the 2008BRevenue Refunding Bonds is only responsible for payments with respect to the 2008B Revenue Refunding Bonds forwhich the 2008B Letter of Credit was issued. The 2008A Letter of Credit and the 2008B Letter of Credit were renewed inJuly of 2010 to expire in July of 2013.
As described in the Official Statement for the 2008 Revenue Refunding Bonds, any draw under Letter of Creditfor principal, interest or Purchase Price creates a reimbursement obligation on the part of the Authority that is secured bythe 1998 Revenue Bond Indenture on a parity basis with the 2008 Revenue Refunding Bonds. (Additional informationrelated to this transaction and the accompanying Letters of Credit can be found under Note 12).
The 2008 Direct Pay Letters of Credit were renewed with the Bank of America, N.A. and TD Bank, N.A., in July 2010 for a three-year period ending in July 2013. Pursuant to the Amendatory Agreements to the respectiveReimbursement Agreement with each bank, the Authority cannot request a replacement DPLOC prior to July 2012, unless a termination fee is paid to the banks.
Letter of Credit Provider Ratings: Ratings for these banks, as of December 31, 2011 are shown below:
Moody's S&P Moody's S&P
Bank of America, N.A. (Series A) A2 A P-1 A-1Negative Negative
TD Bank, N.A. (Series B) Aa2 AA- P-1 A-1+Negative Stable
Long-Term Short-Term
Direct Pay Letters of Credit (2010 Revenue Refunding Bonds):
The Authority s 2010 Revenue Refunding Bonds (Series A, B and C), are secured by irrevocable transferable Direct PayLetters of Credit (DPLOC) issued by three credit providers, the Bank of America, N.A., JP Morgan Chase Bank, NationalAssociation and PNC Bank, National Association in the initial amounts of $152.6 million, $152.6 million and $50.9million, respectively. The Authority entered into separate Reimbursement Agreements with each credit provider tofacilitate the issuance of said DPLOCs.
Each Letter of Credit is an irrevocable transferable direct-pay obligation of the respective issuing Credit Provider to pay to the Trustee, upon request and in accordance with the terms thereof, amounts sufficient to pay the unpaid principal amount and up to fifty-three (53) days (or such greater number of days as required by the rating agencies) days accruedinterest (at the maximum interest rate of 12%) on the related 2010 Revenue Refunding bonds, 2010 Revenue RefundingBonds or 2010 Revenue Refunding Bonds when due, whether at the stated maturity thereof or upon acceleration or call for redemption, and amounts sufficient to pay the Purchase Price of the 2010 Revenue Refunding Bonds, the 2010 RevenueRefunding bonds or the 2010 Revenue Refunding bonds, as applicable, tendered for purchase and not remarketed. A draw under a Letter of Credit for principal and interest or Purchase Price creates a Reimbursement Obligation (as defined in the1998 Revenue Bond Indenture) on the part of the Authority.
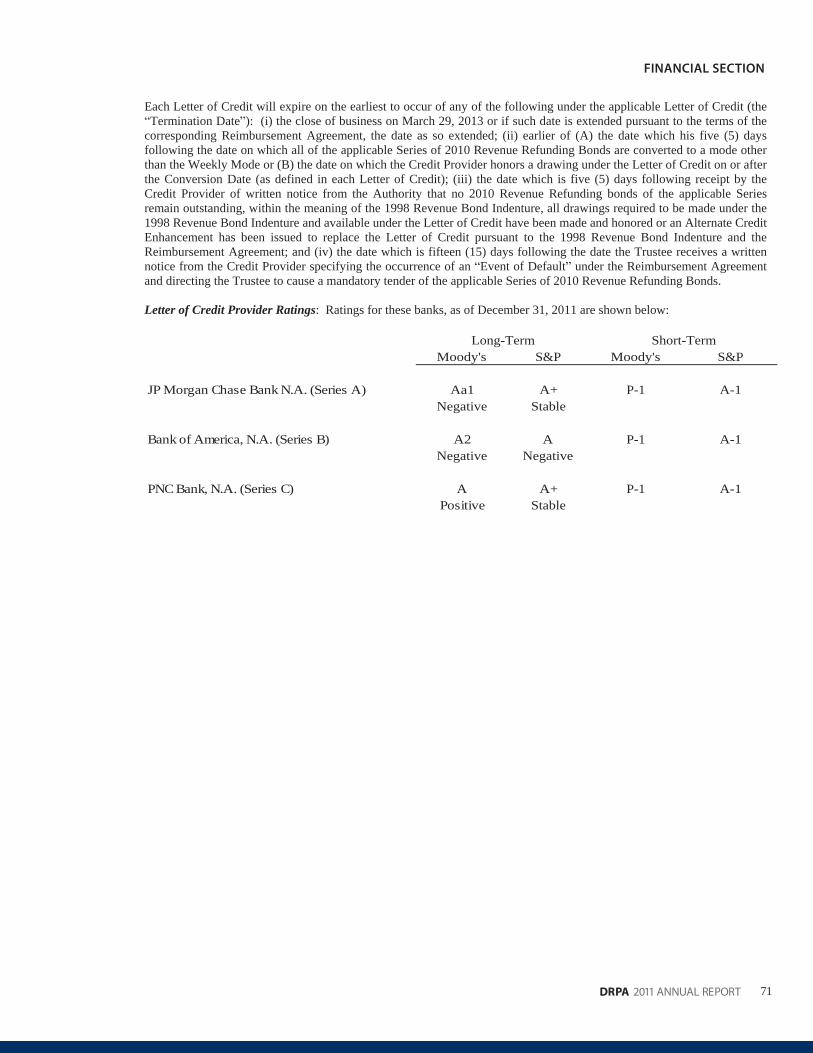
71DRPA 2011 ANNUAL REPORT
FINANCIAL SECTION
Each Letter of Credit will expire on the earliest to occur of any of the following under the applicable Letter of Credit (theTermination Date ): (i) the close of business on March 29, 2013 or if such date is extended pursuant to the terms of the
corresponding Reimbursement Agreement, the date as so extended; (ii) earlier of (A) the date which his five (5) daysfollowing the date on which all of the applicable Series of 2010 Revenue Refunding Bonds are converted to a mode otherthan the Weekly Mode or (B) the date on which the Credit Provider honors a drawing under the Letter of Credit on or after the Conversion Date (as defined in each Letter of Credit); (iii) the date which is five (5) days following receipt by theCredit Provider of written notice from the Authority that no 2010 Revenue Refunding bonds of the applicable Seriesremain outstanding, within the meaning of the 1998 Revenue Bond Indenture, all drawings required to be made under the1998 Revenue Bond Indenture and available under the Letter of Credit have been made and honored or an Alternate Credit Enhancement has been issued to replace the Letter of Credit pursuant to the 1998 Revenue Bond Indenture and theReimbursement Agreement; and (iv) the date which is fifteen (15) days following the date the Trustee receives a writtennotice from the Credit Provider specifying the occurrence of an Event of Default under the Reimbursement Agreementand directing the Trustee to cause a mandatory tender of the applicable Series of 2010 Revenue Refunding Bonds.
Letter of Credit Provider Ratings: Ratings for these banks, as of December 31, 2011 are shown below:
Moody's S&P Moody's S&P
JP Morgan Chase Bank N.A. (Series A) Aa1 A+ P-1 A-1Negative Stable
Bank of America, N.A. (Series B) A2 A P-1 A-1Negative Negative
PNC Bank, N.A. (Series C) A A+ P-1 A-1Positive Stable
Long-Term Short-Term
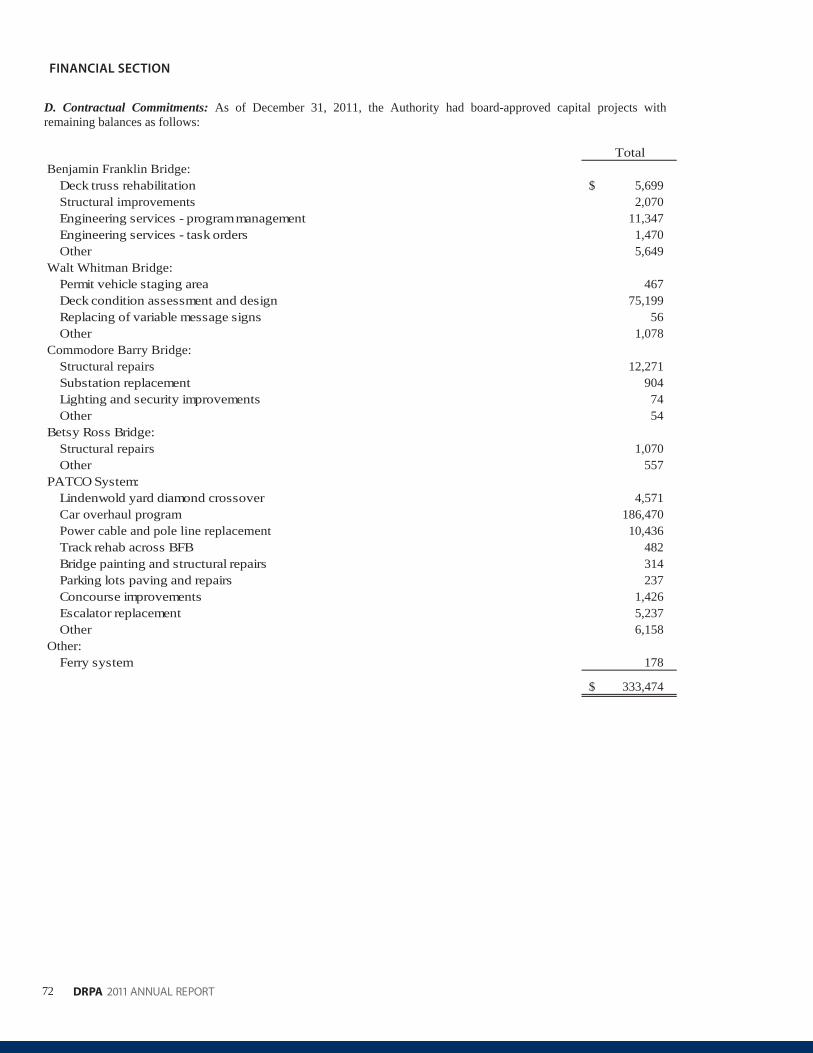
72
FINANCIAL SECTION
DRPA 2011 ANNUAL REPORT
D. Contractual Commitments: As of December 31, 2011, the Authority had board-approved capital projects withremaining balances as follows:
TotalBenjamin Franklin Bridge:
Deck truss rehabilitation 5,699$Structural improvements 2,070Engineering services - programmanagement 11,347Engineering services - task orders 1,470Other 5,649
Walt Whitman Bridge:Permit vehicle staging area 467Deck condition assessment and design 75,199Replacing of variable message signs 56Other 1,078
Commodore Barry Bridge:Structural repairs 12,271Substation replacement 904Lighting and security improvements 74Other 54
Betsy Ross Bridge:Structural repairs 1,070Other 557
PATCO System:Lindenwold yard diamond crossover 4,571Car overhaul program 186,470Power cable and pole line replacement 10,436Track rehab across BFB 482Bridge painting and structural repairs 314Parking lots paving and repairs 237Concourse improvements 1,426Escalator replacement 5,237Other 6,158
Other:Ferry system 178
333,474$
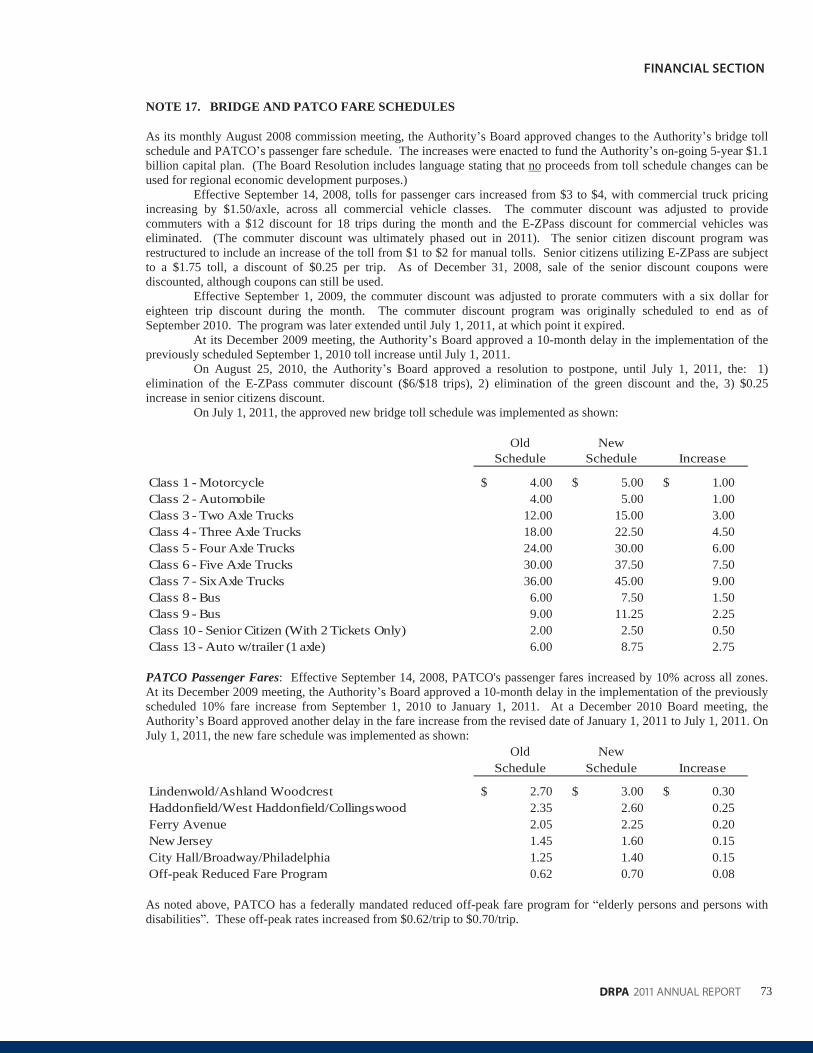
73DRPA 2011 ANNUAL REPORT
FINANCIAL SECTION
NOTE 17. BRIDGE AND PATCO FARE SCHEDULES
As its monthly August 2008 commission meeting, the Authority s Board approved changes to the Authority s bridge tollschedule and PATCO s passenger fare schedule. The increases were enacted to fund the Authority s on-going 5-year $1.1 billion capital plan. (The Board Resolution includes language stating that no proceeds from toll schedule changes can beused for regional economic development purposes.)
Effective September 14, 2008, tolls for passenger cars increased from $3 to $4, with commercial truck pricingincreasing by $1.50/axle, across all commercial vehicle classes. The commuter discount was adjusted to providecommuters with a $12 discount for 18 trips during the month and the E-ZPass discount for commercial vehicles waseliminated. (The commuter discount was ultimately phased out in 2011). The senior citizen discount program wasrestructured to include an increase of the toll from $1 to $2 for manual tolls. Senior citizens utilizing E-ZPass are subjectto a $1.75 toll, a discount of $0.25 per trip. As of December 31, 2008, sale of the senior discount coupons werediscounted, although coupons can still be used.
Effective September 1, 2009, the commuter discount was adjusted to prorate commuters with a six dollar foreighteen trip discount during the month. The commuter discount program was originally scheduled to end as ofSeptember 2010. The program was later extended until July 1, 2011, at which point it expired.
At its December 2009 meeting, the Authority s Board approved a 10-month delay in the implementation of thepreviously scheduled September 1, 2010 toll increase until July 1, 2011.
On August 25, 2010, the Authority s Board approved a resolution to postpone, until July 1, 2011, the: 1)elimination of the E-ZPass commuter discount ($6/$18 trips), 2) elimination of the green discount and the, 3) $0.25increase in senior citizens discount.
On July 1, 2011, the approved new bridge toll schedule was implemented as shown:
Old NewSchedule Schedule Increase
Class 1 - Motorcycle 4.00$ 5.00$ 1.00$Class 2 - Automobile 4.00 5.00 1.00Class 3 - Two Axle Trucks 12.00 15.00 3.00Class 4 - Three Axle Trucks 18.00 22.50 4.50Class 5 - Four Axle Trucks 24.00 30.00 6.00Class 6 - Five Axle Trucks 30.00 37.50 7.50Class 7 - SixAxle Trucks 36.00 45.00 9.00Class 8 - Bus 6.00 7.50 1.50Class 9 - Bus 9.00 11.25 2.25Class 10 - Senior Citizen (With 2 Tickets Only) 2.00 2.50 0.50Class 13 - Auto w/trailer (1 axle) 6.00 8.75 2.75
PATCO Passenger Fares: Effective September 14, 2008, PATCO's passenger fares increased by 10% across all zones.At its December 2009 meeting, the Authority s Board approved a 10-month delay in the implementation of the previouslyscheduled 10% fare increase from September 1, 2010 to January 1, 2011. At a December 2010 Board meeting, theAuthority s Board approved another delay in the fare increase from the revised date of January 1, 2011 to July 1, 2011. OnJuly 1, 2011, the new fare schedule was implemented as shown:
Old NewSchedule Schedule Increase
Lindenwold/Ashland Woodcrest 2.70$ 3.00$ 0.30$Haddonfield/West Haddonfield/Collingswood 2.35 2.60 0.25Ferry Avenue 2.05 2.25 0.20New Jersey 1.45 1.60 0.15City Hall/Broadway/Philadelphia 1.25 1.40 0.15Off-peak Reduced Fare Program 0.62 0.70 0.08
As noted above, PATCO has a federally mandated reduced off-peak fare program for elderly persons and persons withdisabilities . These off-peak rates increased from $0.62/trip to $0.70/trip.
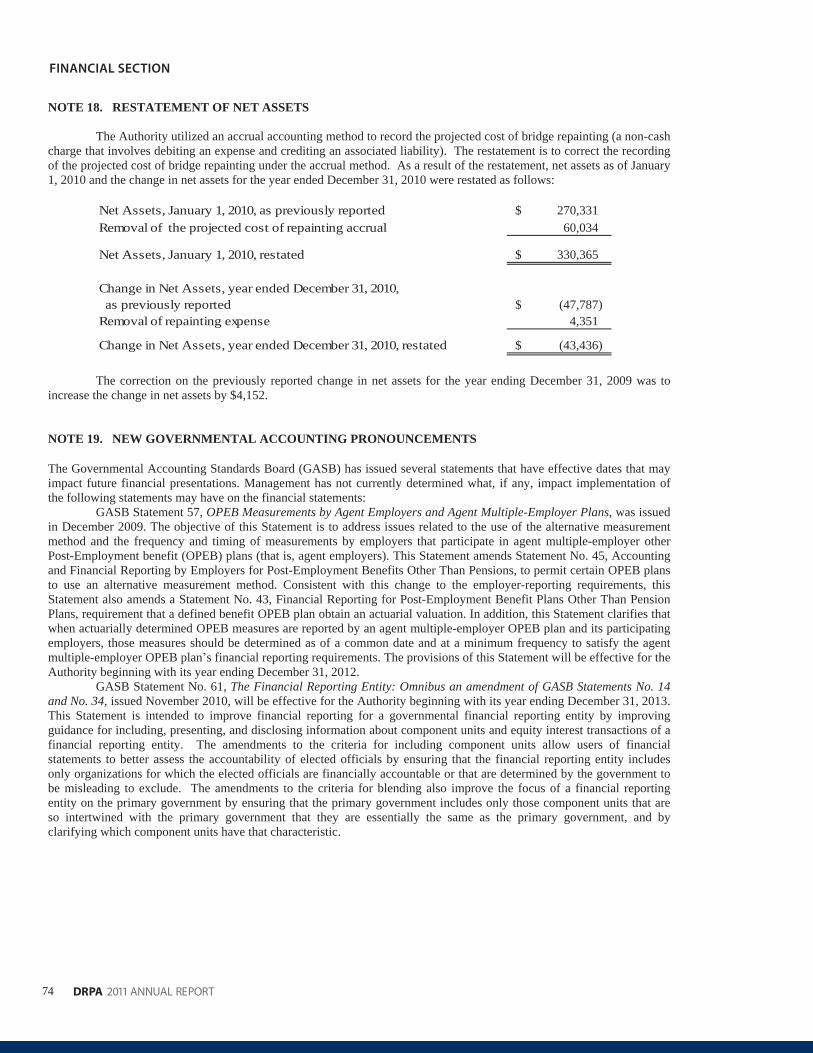
74
FINANCIAL SECTION
DRPA 2011 ANNUAL REPORT
NOTE 18. RESTATEMENT OF NET ASSETS
The Authority utilized an accrual accounting method to record the projected cost of bridge repainting (a non-cashcharge that involves debiting an expense and crediting an associated liability). The restatement is to correct the recordingof the projected cost of bridge repainting under the accrual method. As a result of the restatement, net assets as of January 1, 2010 and the change in net assets for the year ended December 31, 2010 were restated as follows:
Net Assets, January 1, 2010, as previously reported 270,331$Removal of the projected cost of repainting accrual 60,034
Net Assets, January 1, 2010, restated 330,365$
Change in Net Assets, year ended December 31, 2010,as previously reported (47,787)$
Removal of repainting expense 4,351
Change in Net Assets, year ended December 31, 2010, restated (43,436)$
The correction on the previously reported change in net assets for the year ending December 31, 2009 was toincrease the change in net assets by $4,152.
NOTE 19. NEW GOVERNMENTAL ACCOUNTING PRONOUNCEMENTS
The Governmental Accounting Standards Board (GASB) has issued several statements that have effective dates that mayimpact future financial presentations. Management has not currently determined what, if any, impact implementation ofthe following statements may have on the financial statements:
GASB Statement 57, OPEB Measurements by Agent Employers and Agent Multiple-Employer Plans, was issuedin December 2009. The objective of this Statement is to address issues related to the use of the alternative measurementmethod and the frequency and timing of measurements by employers that participate in agent multiple-employer otherPost-Employment benefit (OPEB) plans (that is, agent employers). This Statement amends Statement No. 45, Accountingand Financial Reporting by Employers for Post-Employment Benefits Other Than Pensions, to permit certain OPEB plansto use an alternative measurement method. Consistent with this change to the employer-reporting requirements, thisStatement also amends a Statement No. 43, Financial Reporting for Post-Employment Benefit Plans Other Than PensionPlans, requirement that a defined benefit OPEB plan obtain an actuarial valuation. In addition, this Statement clarifies thatwhen actuarially determined OPEB measures are reported by an agent multiple-employer OPEB plan and its participatingemployers, those measures should be determined as of a common date and at a minimum frequency to satisfy the agentmultiple-employer OPEB plan s financial reporting requirements. The provisions of this Statement will be effective for the Authority beginning with its year ending December 31, 2012.
GASB Statement No. 61, The Financial Reporting Entity: Omnibus an amendment of GASB Statements No. 14and No. 34, issued November 2010, will be effective for the Authority beginning with its year ending December 31, 2013.This Statement is intended to improve financial reporting for a governmental financial reporting entity by improvingguidance for including, presenting, and disclosing information about component units and equity interest transactions of afinancial reporting entity. The amendments to the criteria for including component units allow users of financialstatements to better assess the accountability of elected officials by ensuring that the financial reporting entity includesonly organizations for which the elected officials are financially accountable or that are determined by the government tobe misleading to exclude. The amendments to the criteria for blending also improve the focus of a financial reportingentity on the primary government by ensuring that the primary government includes only those component units that areso intertwined with the primary government that they are essentially the same as the primary government, and byclarifying which component units have that characteristic.
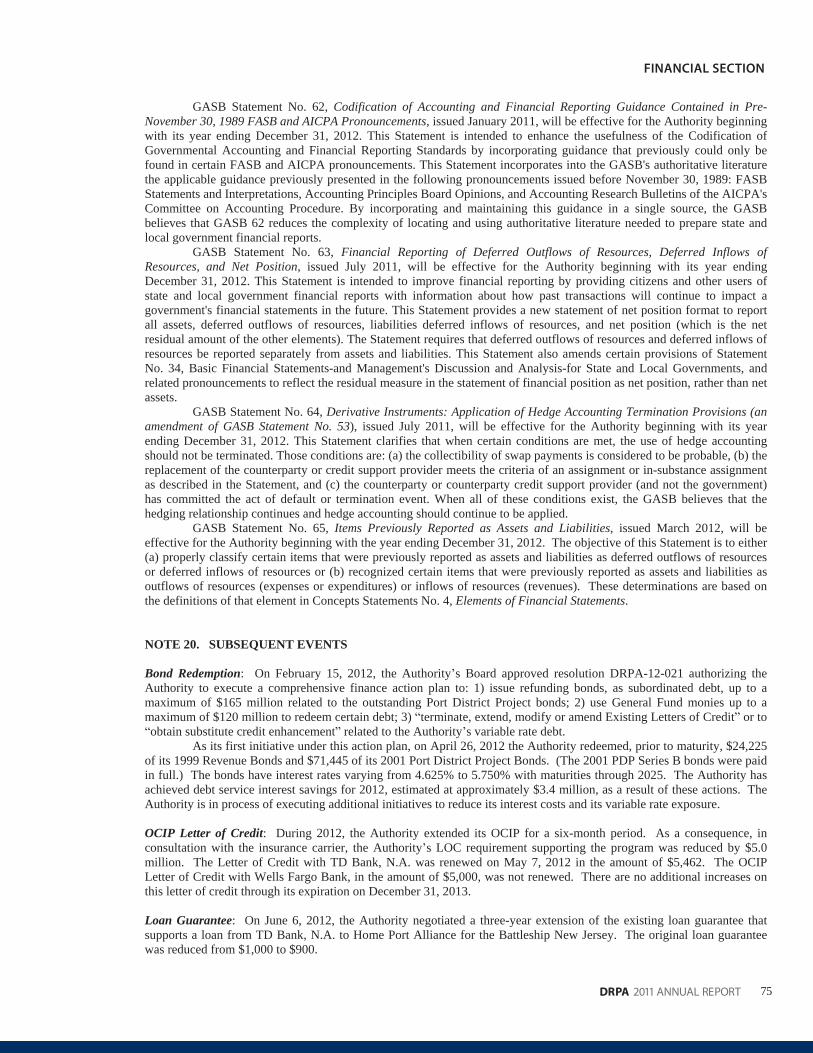
75DRPA 2011 ANNUAL REPORT
FINANCIAL SECTION
GASB Statement No. 62, Codification of Accounting and Financial Reporting Guidance Contained in Pre-November 30, 1989 FASB and AICPA Pronouncements, issued January 2011, will be effective for the Authority beginning with its year ending December 31, 2012. This Statement is intended to enhance the usefulness of the Codification ofGovernmental Accounting and Financial Reporting Standards by incorporating guidance that previously could only befound in certain FASB and AICPA pronouncements. This Statement incorporates into the GASB's authoritative literaturethe applicable guidance previously presented in the following pronouncements issued before November 30, 1989: FASBStatements and Interpretations, Accounting Principles Board Opinions, and Accounting Research Bulletins of the AICPA's Committee on Accounting Procedure. By incorporating and maintaining this guidance in a single source, the GASBbelieves that GASB 62 reduces the complexity of locating and using authoritative literature needed to prepare state andlocal government financial reports.
GASB Statement No. 63, Financial Reporting of Deferred Outflows of Resources, Deferred Inflows ofResources, and Net Position, issued July 2011, will be effective for the Authority beginning with its year endingDecember 31, 2012. This Statement is intended to improve financial reporting by providing citizens and other users ofstate and local government financial reports with information about how past transactions will continue to impact agovernment's financial statements in the future. This Statement provides a new statement of net position format to reportall assets, deferred outflows of resources, liabilities deferred inflows of resources, and net position (which is the netresidual amount of the other elements). The Statement requires that deferred outflows of resources and deferred inflows ofresources be reported separately from assets and liabilities. This Statement also amends certain provisions of StatementNo. 34, Basic Financial Statements-and Management's Discussion and Analysis-for State and Local Governments, andrelated pronouncements to reflect the residual measure in the statement of financial position as net position, rather than net assets.
GASB Statement No. 64, Derivative Instruments: Application of Hedge Accounting Termination Provisions (anamendment of GASB Statement No. 53), issued July 2011, will be effective for the Authority beginning with its yearending December 31, 2012. This Statement clarifies that when certain conditions are met, the use of hedge accountingshould not be terminated. Those conditions are: (a) the collectibility of swap payments is considered to be probable, (b) thereplacement of the counterparty or credit support provider meets the criteria of an assignment or in-substance assignmentas described in the Statement, and (c) the counterparty or counterparty credit support provider (and not the government)has committed the act of default or termination event. When all of these conditions exist, the GASB believes that thehedging relationship continues and hedge accounting should continue to be applied.
GASB Statement No. 65, Items Previously Reported as Assets and Liabilities, issued March 2012, will beeffective for the Authority beginning with the year ending December 31, 2012. The objective of this Statement is to either (a) properly classify certain items that were previously reported as assets and liabilities as deferred outflows of resourcesor deferred inflows of resources or (b) recognized certain items that were previously reported as assets and liabilities asoutflows of resources (expenses or expenditures) or inflows of resources (revenues). These determinations are based onthe definitions of that element in Concepts Statements No. 4, Elements of Financial Statements.
NOTE 20. SUBSEQUENT EVENTS
Bond Redemption: On February 15, 2012, the Authority s Board approved resolution DRPA-12-021 authorizing theAuthority to execute a comprehensive finance action plan to: 1) issue refunding bonds, as subordinated debt, up to amaximum of $165 million related to the outstanding Port District Project bonds; 2) use General Fund monies up to amaximum of $120 million to redeem certain debt; 3) terminate, extend, modify or amend Existing Letters of Credit or toobtain substitute credit enhancement related to the Authority s variable rate debt.
As its first initiative under this action plan, on April 26, 2012 the Authority redeemed, prior to maturity, $24,225of its 1999 Revenue Bonds and $71,445 of its 2001 Port District Project Bonds. (The 2001 PDP Series B bonds were paid in full.) The bonds have interest rates varying from 4.625% to 5.750% with maturities through 2025. The Authority hasachieved debt service interest savings for 2012, estimated at approximately $3.4 million, as a result of these actions. TheAuthority is in process of executing additional initiatives to reduce its interest costs and its variable rate exposure.
OCIP Letter of Credit: During 2012, the Authority extended its OCIP for a six-month period. As a consequence, inconsultation with the insurance carrier, the Authority s LOC requirement supporting the program was reduced by $5.0million. The Letter of Credit with TD Bank, N.A. was renewed on May 7, 2012 in the amount of $5,462. The OCIPLetter of Credit with Wells Fargo Bank, in the amount of $5,000, was not renewed. There are no additional increases onthis letter of credit through its expiration on December 31, 2013.
Loan Guarantee: On June 6, 2012, the Authority negotiated a three-year extension of the existing loan guarantee thatsupports a loan from TD Bank, N.A. to Home Port Alliance for the Battleship New Jersey. The original loan guaranteewas reduced from $1,000 to $900.

76
FINANCIAL SECTION
DRPA 2011 ANNUAL REPORT
Bond Ratings: In April 2012, Fitch Ratings assigned a rating of A/F1 (stable outlook) to the Authority s 2008 Series Aand 2010 Series B Revenue Refunding Bonds, based on the DPLOC support provided by the Bank of America ( A/F1 ,stable outlook) on the bonds.
On June 21, 2012, Moody's Investor's Service ("Moody's") lowered certain bank ratings. Moody s: (i) loweredthe long-term financial strength rating of Bank of America, N.A. from "A2" to "A3" with a "stable" outlook; and (ii)lowered the short-term financial strength rating of Bank of America, N.A. from "P-1" to "P-2". As a result of such ratingsdowngrades, Moody's: (i) lowered the respective long-term ratings assigned to the 2008A Revenue Refunding Bonds and2010B Revenue Refunding Bonds to "A2" from "A1", based upon a joint rating criteria methodology consisting of, among other things, the financial strength of each of Bank of America, N.A. and the Authority, and placed the long-term reviewstatus of each of the 2008A Revenue Refunding Bonds and 2010B Revenue Refunding Bonds on "Review forDowngrade"; and (ii) lowered the respective short-term ratings assigned to the 2008A Revenue Refunding Bonds and the2010B Revenue Refunding Bonds to "VMIG2" from "VMIG1", based solely on the financial strength of Bank of America, N.A. and placed the short-term review status of each of the 2008A Revenue Refunding Bonds and 2010B RevenueRefunding Bonds on "Review for Downgrade".
Moody s also lowered the long-term financial strength rating of JPMorgan Chase from "Aa1" to "Aa3" with a"stable" outlook. As a result of such rating downgrade, Moody's lowered the long-term rating assigned to the 2010ARevenue Refunding Bonds to "Aa2" from "Aa1", based upon a joint rating criteria methodology consisting of, amongother things, the financial strength of each of JPMorgan Chase and the Authority, and placed the long-term review statusof the 2010A Revenue Refunding Bonds on "Review for Downgrade". The respective underlying unenhanced ratingsassigned by Moody's to the Bonds remain "A3".
As a result of these bank downgrades, the Authority issued a Material Event Notice on June 26, 2012.None of the ratings heretofore assigned to the Bonds by Standard and Poor's Rating Services, a division of The
McGraw Hill Companies ("S&P"), have been revised as of the date of the filing of the Material Event Notice. In addition,none of the ratings heretofore assigned to the 2008A Revenue Refunding Bonds or the 2010B Revenue Refunding Bondsby Fitch Ratings ("Fitch") have been revised as of the date of the filing of the Material Event Notice. The 2010A RevenueRefunding Bonds are not rated by Fitch.
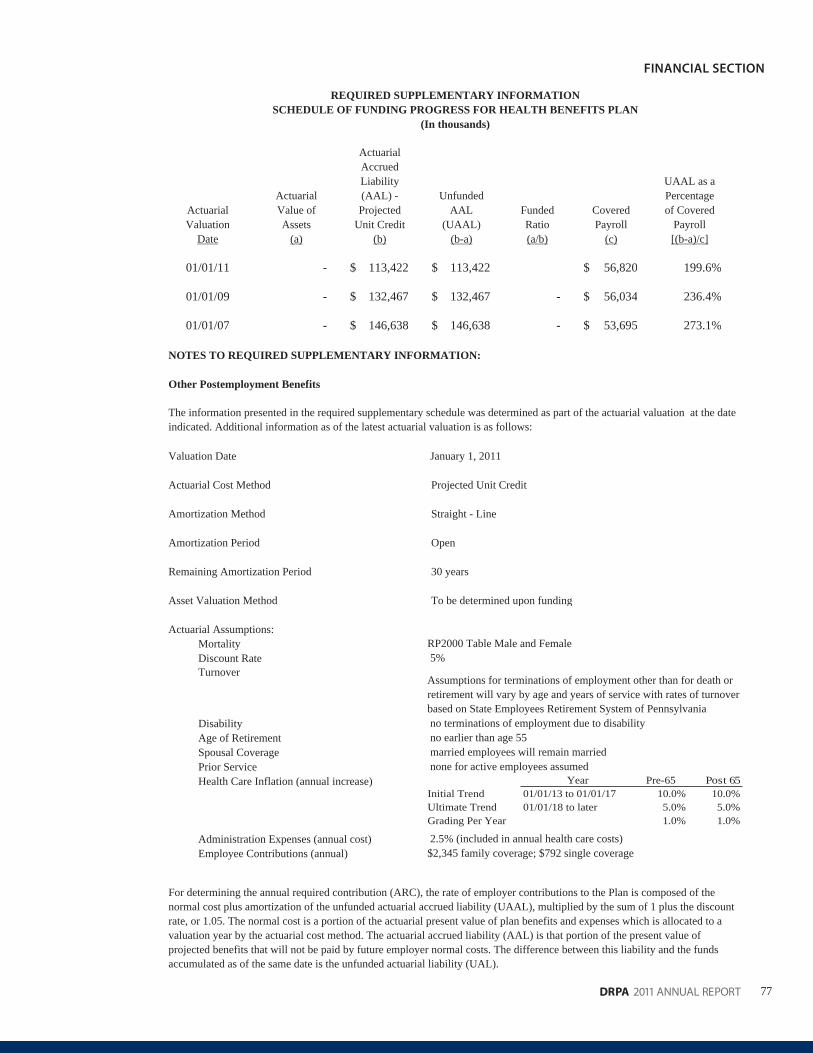
77DRPA 2011 ANNUAL REPORT
FINANCIAL SECTION
REQUIRED SUPPLEMENTARY INFORMATIONSCHEDULE OF FUNDING PROGRESS FOR HEALTH BENEFITS PLAN
(In thousands)
ActuarialAccruedLiability UAAL as a
Actuarial (AAL) - Unfunded PercentageActuarial Value of Projected AAL Funded Covered of CoveredValuation Assets Unit Credit (UAAL) Ratio Payroll Payroll
Date (a) (b) (b-a) (a/b) (c) [(b-a)/c]
01/01/11 - 113,422$ 113,422$ 56,820$ 199.6%
01/01/09 - 132,467$ 132,467$ - 56,034$ 236.4%
01/01/07 - 146,638$ 146,638$ - 53,695$ 273.1%
NOTES TO REQUIRED SUPPLEMENTARY INFORMATION:
Other Postemployment Benefits
Valuation Date January 1, 2011
Actuarial Cost Method Projected Unit Credit
Amortization Method Straight - Line
Amortization Period Open
Remaining Amortization Period 30 years
Asset Valuation Method To be determined upon funding
Actuarial Assumptions:MortalityDiscount RateTurnover
DisabilityAge of RetirementSpousal CoveragePrior ServiceHealth Care Inflation (annual increase)
Administration Expenses (annual cost)Employee Contributions (annual)
The information presented in the required supplementary schedule was determined as part of the actuarial valuation at the date indicated. Additional information as of the latest actuarial valuation is as follows:
For determining the annual required contribution (ARC), the rate of employer contributions to the Plan is composed of the normal cost plus amortization of the unfunded actuarial accrued liability (UAAL), multiplied by the sum of 1 plus the discount rate, or 1.05. The normal cost is a portion of the actuarial present value of plan benefits and expenses which is allocated to a valuation year by the actuarial cost method. The actuarial accrued liability (AAL) is that portion of the present value of projected benefits that will not be paid by future employer normal costs. The difference between this liability and the funds accumulated as of the same date is the unfunded actuarial liability (UAL).
no terminations of employment due to disability
RP2000 Table Male and Female
no earlier than age 55
$2,345 family coverage; $792 single coverage 2.5% (included in annual health care costs)
none for active employees assumed
5%
married employees will remain married
Assumptions for terminations of employment other than for death or retirement will vary by age and years of service with rates of turnover based on State Employees Retirement System of Pennsylvania
Year Pre-65 Post 65Initial Trend 01/01/13 to 01/01/17 10.0% 10.0%Ultimate Trend 01/01/18 to later 5.0% 5.0%Grading Per Year 1.0% 1.0%
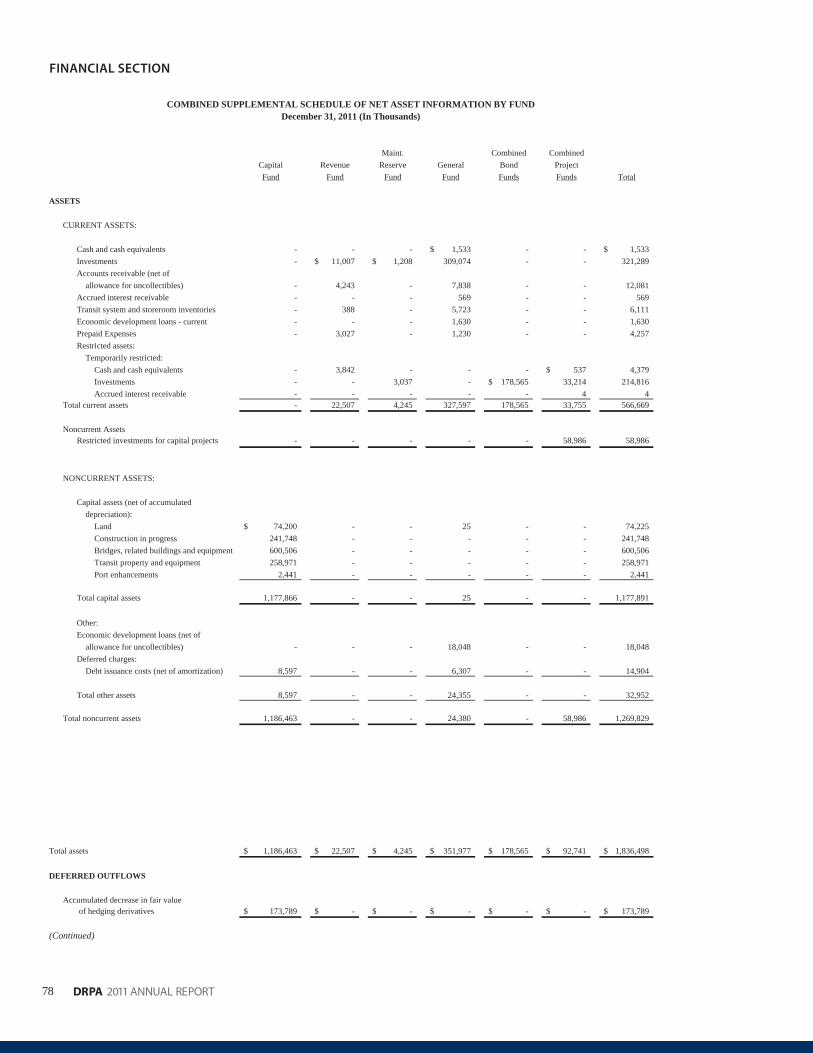
78
FINANCIAL SECTION
DRPA 2011 ANNUAL REPORT
COMBINED SUPPLEMENTAL SCHEDULE OF NET ASSET INFORMATION BY FUNDDecember 31, 2011 (In Thousands)
Maint. Combined CombinedCapital Revenue Reserve General Bond ProjectFund Fund Fund Fund Funds Funds Total
ASSETS
CURRENT ASSETS:
Cash and cash equivalents - - - 1,533$ - - 1,533$Investments - 11,007$ 1,208$ 309,074 - - 321,289Accounts receivable (net of
allowance for uncollectibles) - 4,243 - 7,838 - - 12,081Accrued interest receivable - - - 569 - - 569Transit system and storeroom inventories - 388 - 5,723 - - 6,111Economic development loans - current - - - 1,630 - - 1,630Prepaid Expenses - 3,027 - 1,230 - - 4,257Restricted assets:
Temporarily restricted:Cash and cash equivalents - 3,842 - - - 537$ 4,379Investments - - 3,037 - 178,565$ 33,214 214,816Accrued interest receivable - - - - - 4 4
Total current assets - 22,507 4,245 327,597 178,565 33,755 566,669
- - - - - 58,986 58,986
NONCURRENT ASSETS:
Capital assets (net of accumulateddepreciation):
Land 74,200$ - - 25 - - 74,225Construction in progress 241,748 - - - - - 241,748Bridges, related buildings and equipment 600,506 - - - - - 600,506Transit property and equipment 258,971 - - - - - 258,971Port enhancements 2,441 - - - - - 2,441
Total capital assets 1,177,866 - - 25 - - 1,177,891
Other:Economic development loans (net of
allowance for uncollectibles) - - - 18,048 - - 18,048Deferred charges:
Debt issuance costs (net of amortization) 8,597 - - 6,307 - - 14,904
Total other assets 8,597 - - 24,355 - - 32,952
Total noncurrent assets 1,186,463 - - 24,380 - 58,986 1,269,829
Total assets 1,186,463$ 22,507$ 4,245$ 351,977$ 178,565$ 92,741$ 1,836,498$
DEFERRED OUTFLOWS
Accumulated decrease in fair value of hedging derivatives 173,789$ -$ -$ -$ -$ -$ 173,789$
Noncurrent Assets Restricted investments for capital projects
(Continued)
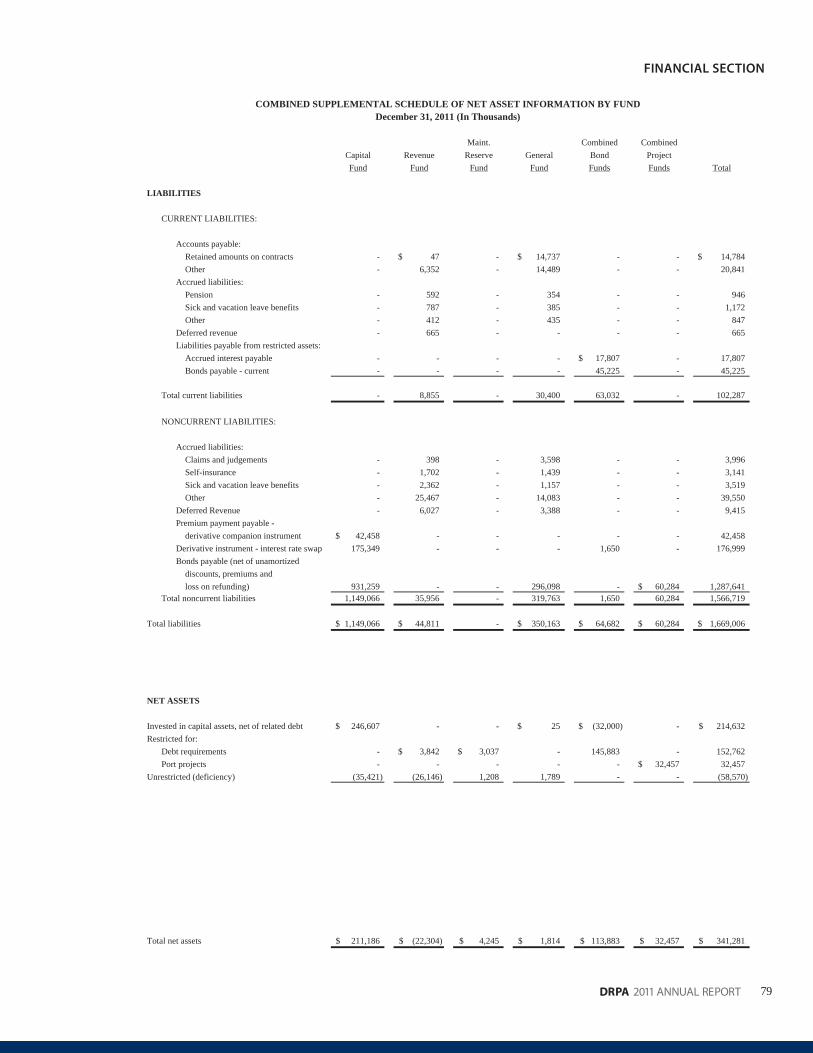
79DRPA 2011 ANNUAL REPORT
FINANCIAL SECTION
COMBINED SUPPLEMENTAL SCHEDULE OF NET ASSET INFORMATION BY FUNDDecember 31, 2011 (In Thousands)
Maint. Combined CombinedCapital Revenue Reserve General Bond ProjectFund Fund Fund Fund Funds Funds Total
LIABILITIES
CURRENT LIABILITIES:
Accounts payable:Retained amounts on contracts - 47$ - 14,737$ - - 14,784$Other - 6,352 - 14,489 - - 20,841
Accrued liabilities:Pension - 592 - 354 - - 946Sick and vacation leave benefits - 787 - 385 - - 1,172Other - 412 - 435 - - 847
Deferred revenue - 665 - - - - 665Liabilities payable from restricted assets:
Accrued interest payable - - - - 17,807$ - 17,807Bonds payable - current - - - - 45,225 - 45,225
Total current liabilities - 8,855 - 30,400 63,032 - 102,287
NONCURRENT LIABILITIES:
Accrued liabilities:Claims and judgements - 398 - 3,598 - - 3,996Self-insurance - 1,702 - 1,439 - - 3,141Sick and vacation leave benefits - 2,362 - 1,157 - - 3,519Other - 25,467 - 14,083 - - 39,550
Deferred Revenue - 6,027 - 3,388 - - 9,415Premium payment payable -
derivative companion instrument 42,458$ - - - - - 42,458Derivative instrument - interest rate swap 175,349 - - - 1,650 - 176,999Bonds payable (net of unamortized
discounts, premiums andloss on refunding) 931,259 - - 296,098 - 60,284$ 1,287,641
Total noncurrent liabilities 1,149,066 35,956 - 319,763 1,650 60,284 1,566,719
Total liabilities 1,149,066$ 44,811$ - 350,163$ 64,682$ 60,284$ 1,669,006$
NET ASSETS
Invested in capital assets, net of related debt 246,607$ - - 25$ (32,000)$ - 214,632$Restricted for:
Debt requirements - 3,842$ 3,037$ - 145,883 - 152,762Port projects - - - - - 32,457$ 32,457
Unrestricted (deficiency) (35,421) (26,146) 1,208 1,789 - - (58,570)
Total net assets 211,186$ (22,304)$ 4,245$ 1,814$ 113,883$ 32,457$ 341,281$
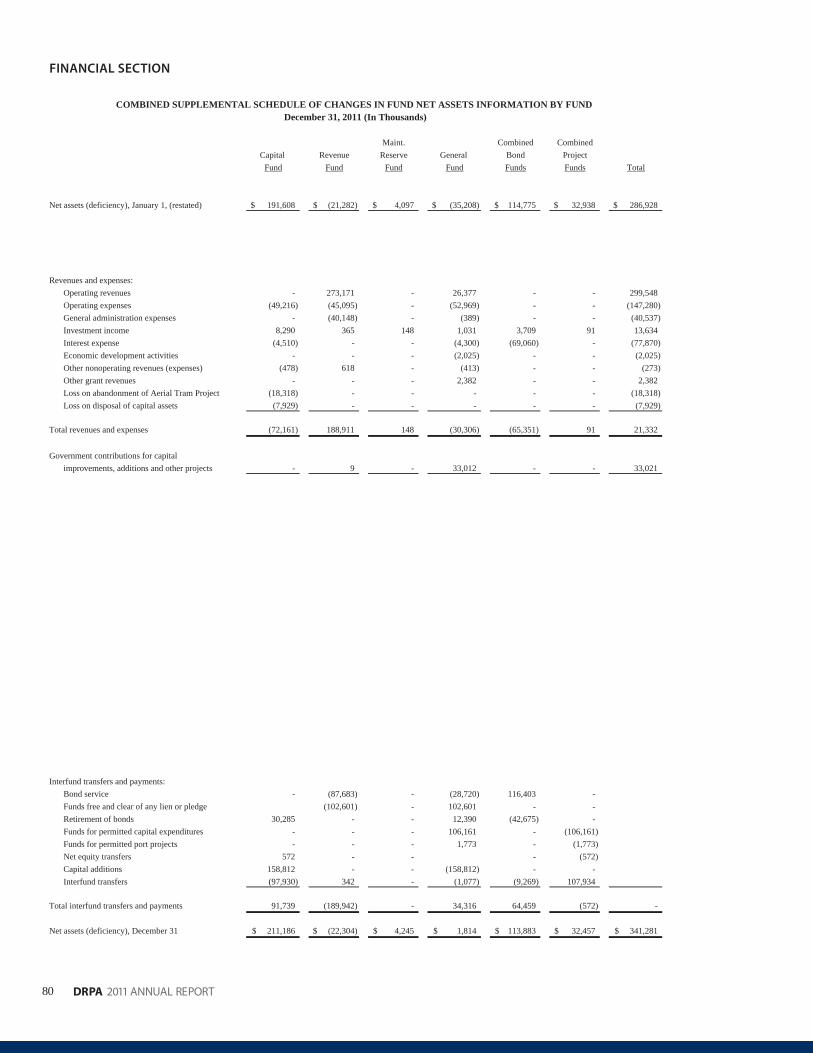
80
FINANCIAL SECTION
DRPA 2011 ANNUAL REPORT
COMBINED SUPPLEMENTAL SCHEDULE OF CHANGES IN FUND NET ASSETS INFORMATION BY FUND December 31, 2011 (In Thousands)
Maint. Combined CombinedCapital Revenue Reserve General Bond Project
Fund Fund Fund Fund Funds Funds Total
Net assets (deficiency), January 1, (restated) 191,608$ (21,282)$ 4,097$ (35,208)$ 114,775$ 32,938$ 286,928$
Revenues and expenses:Operating revenues - 273,171 - 26,377 - - 299,548Operating expenses (49,216) (45,095) - (52,969) - - (147,280)General administration expenses - (40,148) - (389) - - (40,537)Investment income 8,290 365 148 1,031 3,709 91 13,634Interest expense (4,510) - - (4,300) (69,060) - (77,870)Economic development activities - - - (2,025) - - (2,025)Other nonoperating revenues (expenses) (478) 618 - (413) - - (273)Other grant revenues - - - 2,382 - - 2,382Loss on abandonment of Aerial Tram Project (18,318) - - - - - (18,318)Loss on disposal of capital assets (7,929) - - - - - (7,929)
Total revenues and expenses (72,161) 188,911 148 (30,306) (65,351) 91 21,332
Government contributions for capitalimprovements, additions and other projects - 9 - 33,012 - - 33,021
Interfund transfers and payments:Bond service - (87,683) - (28,720) 116,403 -Funds free and clear of any lien or pledge (102,601) - 102,601 - -Retirement of bonds 30,285 - - 12,390 (42,675) -Funds for permitted capital expenditures - - - 106,161 - (106,161)Funds for permitted port projects - - - 1,773 - (1,773)Net equity transfers 572 - - - (572)Capital additions 158,812 - - (158,812) - -Interfund transfers (97,930) 342 - (1,077) (9,269) 107,934
(203)Total interfund transfers and payments 91,739 (189,942) - 34,316 64,459 (572) -
Net assets (deficiency), December 31 211,186$ (22,304)$ 4,245$ 1,814$ 113,883$ 32,457$ 341,281$
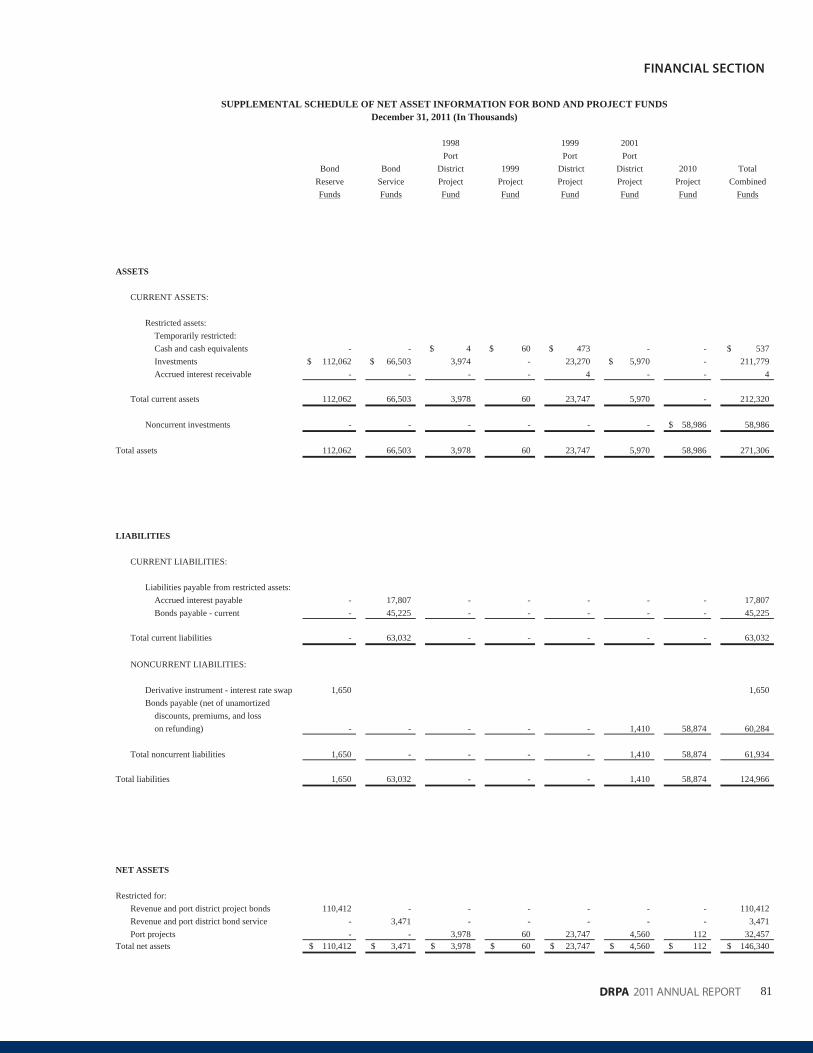
81DRPA 2011 ANNUAL REPORT
FINANCIAL SECTION
SUPPLEMENTAL SCHEDULE OF NET ASSET INFORMATION FOR BOND AND PROJECT FUNDSDecember 31, 2011 (In Thousands)
1998 1999 2001Port Port Port
Bond Bond District 1999 District District 2010 TotalReserve Service Project Project Project Project Project CombinedFunds Funds Fund Fund Fund Fund Fund Funds
ASSETS
CURRENT ASSETS:
Restricted assets:Temporarily restricted:Cash and cash equivalents - - 4$ 60$ 473$ - - 537$Investments 112,062$ 66,503$ 3,974 - 23,270 5,970$ - 211,779Accrued interest receivable - - - - 4 - - 4
Total current assets 112,062 66,503 3,978 60 23,747 5,970 - 212,320
Noncurrent investments - - - - - - 58,986$ 58,986
Total assets 112,062 66,503 3,978 60 23,747 5,970 58,986 271,306
LIABILITIES
CURRENT LIABILITIES:
Liabilities payable from restricted assets:Accrued interest payable - 17,807 - - - - - 17,807Bonds payable - current - 45,225 - - - - - 45,225
Total current liabilities - 63,032 - - - - - 63,032
NONCURRENT LIABILITIES:
Derivative instrument - interest rate swap 1,650 1,650Bonds payable (net of unamortized
discounts, premiums, and losson refunding) - - - - - 1,410 58,874 60,284
Total noncurrent liabilities 1,650 - - - - 1,410 58,874 61,934
Total liabilities 1,650 63,032 - - - 1,410 58,874 124,966
NET ASSETS
Restricted for:Revenue and port district project bonds 110,412 - - - - - - 110,412Revenue and port district bond service - 3,471 - - - - - 3,471Port projects - - 3,978 60 23,747 4,560 112 32,457
Total net assets 110,412$ 3,471$ 3,978$ 60$ 23,747$ 4,560$ 112$ 146,340$
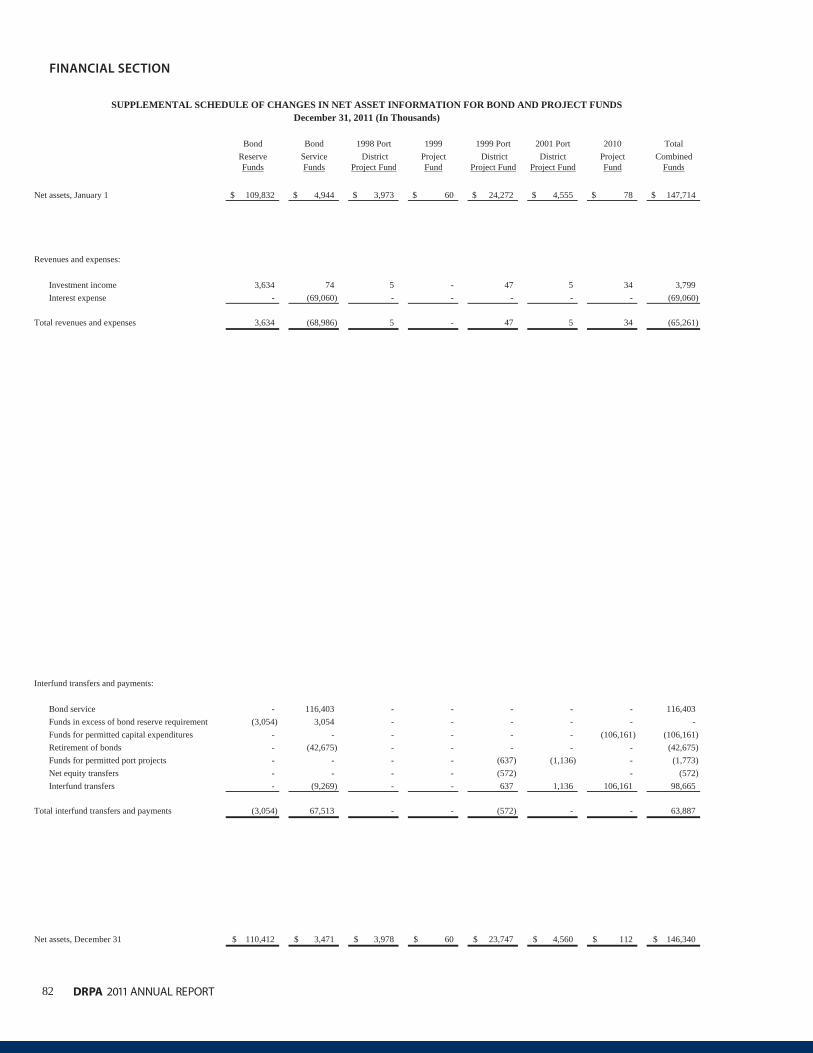
82
FINANCIAL SECTION
DRPA 2011 ANNUAL REPORT
SUPPLEMENTAL SCHEDULE OF CHANGES IN NET ASSET INFORMATION FOR BOND AND PROJECT FUNDSDecember 31, 2011 (In Thousands)
Bond Bond 1998 Port 1999 1999 Port 2001 Port 2010 TotalReserve Service District Project District District Project CombinedFunds Funds Project Fund Fund Project Fund Project Fund Fund Funds
Net assets, January 1 109,832$ 4,944$ 3,973$ 60$ 24,272$ 4,555$ 78$ 147,714$
Revenues and expenses:
Investment income 3,634 74 5 - 47 5 34 3,799Interest expense - (69,060) - - - - - (69,060)
Total revenues and expenses 3,634 (68,986) 5 - 47 5 34 (65,261)
Interfund transfers and payments:
Bond service - 116,403 - - - - - 116,403Funds in excess of bond reserve requirement (3,054) 3,054 - - - - - -Funds for permitted capital expenditures - - - - - - (106,161) (106,161)Retirement of bonds - (42,675) - - - - - (42,675)Funds for permitted port projects - - - - (637) (1,136) - (1,773)Net equity transfers - - - - (572) - (572)Interfund transfers - (9,269) - - 637 1,136 106,161 98,665
Total interfund transfers and payments (3,054) 67,513 - - (572) - - 63,887
Net assets, December 31 110,412$ 3,471$ 3,978$ 60$ 23,747$ 4,560$ 112$ 146,340$

StatisticalSection

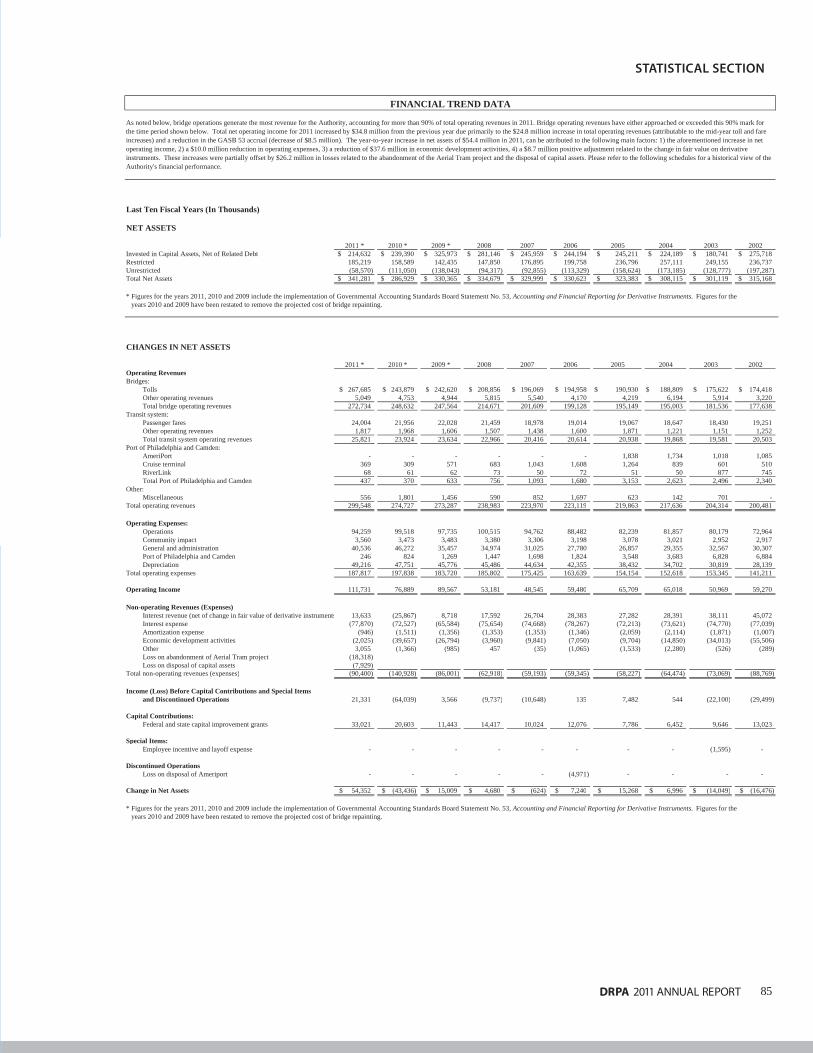
85DRPA 2011 ANNUAL REPORT
STATISTICAL SECTION
FINANCIAL TREND DATA
Last Ten Fiscal Years (In Thousands)
NET ASSETS
2011 * 2010 * 2009 * 2008 2007 2006 2005 2004 2003 2002Invested in Capital Assets, Net of Related Debt 214,632$ 239,390$ 325,973$ 281,146$ 245,959$ 244,194$ 245,211$ 224,189$ 180,741$ 275,718$Restricted 185,219 158,589 142,435 147,850 176,895 199,758 236,796 257,111 249,155 236,737Unrestricted (58,570) (111,050) (138,043) (94,317) (92,855) (113,329) (158,624) (173,185) (128,777) (197,287)Total Net Assets 341,281$ 286,929$ 330,365$ 334,679$ 329,999$ 330,623$ 323,383$ 308,115$ 301,119$ 315,168$
* Figures for the years 2011, 2010 and 2009 include the implementation of Governmental Accounting Standards Board Statement No. 53, Accounting and Financial Reporting for Derivative Instruments. Figures for the years 2010 and 2009 have been restated to remove the projected cost of bridge repainting.
CHANGES IN NET ASSETS
2011 * 2010 * 2009 * 2008 2007 2006 2005 2004 2003 2002Operating RevenuesBridges:
Tolls 267,685$ 243,879$ 242,620$ 208,856$ 196,069$ 194,958$ 190,930$ 188,809$ 175,622$ 174,418$Other operating revenues 5,049 4,753 4,944 5,815 5,540 4,170 4,219 6,194 5,914 3,220Total bridge operating revenues 272,734 248,632 247,564 214,671 201,609 199,128 195,149 195,003 181,536 177,638
Transit system:Passenger fares 24,004 21,956 22,028 21,459 18,978 19,014 19,067 18,647 18,430 19,251Other operating revenues 1,817 1,968 1,606 1,507 1,438 1,600 1,871 1,221 1,151 1,252Total transit system operating revenues 25,821 23,924 23,634 22,966 20,416 20,614 20,938 19,868 19,581 20,503
Port of Philadelphia and Camden:AmeriPort - - - - - - 1,838 1,734 1,018 1,085Cruise terminal 369 309 571 683 1,043 1,608 1,264 839 601 510RiverLink 68 61 62 73 50 72 51 50 877 745Total Port of Philadelphia and Camden 437 370 633 756 1,093 1,680 3,153 2,623 2,496 2,340
Other:Miscellaneous 556 1,801 1,456 590 852 1,697 623 142 701 -
Total operating revenues 299,548 274,727 273,287 238,983 223,970 223,119 219,863 217,636 204,314 200,481
Operating Expenses:Operations 94,259 99,518 97,735 100,515 94,762 88,482 82,239 81,857 80,179 72,964Community impact 3,560 3,473 3,483 3,380 3,306 3,198 3,078 3,021 2,952 2,917General and administration 40,536 46,272 35,457 34,974 31,025 27,780 26,857 29,355 32,567 30,307Port of Philadelphia and Camden 246 824 1,269 1,447 1,698 1,824 3,548 3,683 6,828 6,884Depreciation 49,216 47,751 45,776 45,486 44,634 42,355 38,432 34,702 30,819 28,139
Total operating expenses 187,817 197,838 183,720 185,802 175,425 163,639 154,154 152,618 153,345 141,211
Operating Income 111,731 76,889 89,567 53,181 48,545 59,480 65,709 65,018 50,969 59,270
Non-operating Revenues (Expenses)Interest revenue (net of change in fair value of derivative instruments 13,633 (25,867) 8,718 17,592 26,704 28,383 27,282 28,391 38,111 45,072Interest expense (77,870) (72,527) (65,584) (75,654) (74,668) (78,267) (72,213) (73,621) (74,770) (77,039)Amortization expense (946) (1,511) (1,356) (1,353) (1,353) (1,346) (2,059) (2,114) (1,871) (1,007)Economic development activities (2,025) (39,657) (26,794) (3,960) (9,841) (7,050) (9,704) (14,850) (34,013) (55,506)Other 3,055 (1,366) (985) 457 (35) (1,065) (1,533) (2,280) (526) (289)Loss on abandonment of Aerial Tram project (18,318)Loss on disposal of capital assets (7,929)
Total non-operating revenues (expenses) (90,400) (140,928) (86,001) (62,918) (59,193) (59,345) (58,227) (64,474) (73,069) (88,769)
Income (Loss) Before Capital Contributions and Special Itemsand Discontinued Operations 21,331 (64,039) 3,566 (9,737) (10,648) 135 7,482 544 (22,100) (29,499)
Capital Contributions:Federal and state capital improvement grants 33,021 20,603 11,443 14,417 10,024 12,076 7,786 6,452 9,646 13,023
Special Items:Employee incentive and layoff expense - - - - - - - - (1,595) -
Discontinued Operations Loss on disposal of Ameriport - - - - - (4,971) - - - -
Change in Net Assets 54,352$ (43,436)$ 15,009$ 4,680$ (624)$ 7,240$ 15,268$ 6,996$ (14,049)$ (16,476)$
* Figures for the years 2011, 2010 and 2009 include the implementation of Governmental Accounting Standards Board Statement No. 53, Accounting and Financial Reporting for Derivative Instruments. Figures for the years 2010 and 2009 have been restated to remove the projected cost of bridge repainting.
As noted below, bridge operations generate the most revenue for the Authority, accounting for more than 90% of total operating revenues in 2011. Bridge operating revenues have either approached or exceeded this 90% mark for the time period shown below. Total net operating income for 2011 increased by $34.8 million from the previous year due primarily to the $24.8 million increase in total operating revenues (attributable to the mid-year toll and fare increases) and a reduction in the GASB 53 accrual (decrease of $8.5 million). The year-to-year increase in net assets of $54.4 million in 2011, can be attributed to the following main factors: 1) the aforementioned increase in net operating income, 2) a $10.0 million reduction in operating expenses, 3) a reduction of $37.6 million in economic development activities, 4) a $8.7 million positive adjustment related to the change in fair value on derivative instruments. These increases were partially offset by $26.2 million in losses related to the abandonment of the Aerial Tram project and the disposal of capital assets. Please refer to the following schedules for a historical view of the Authority's financial performance.
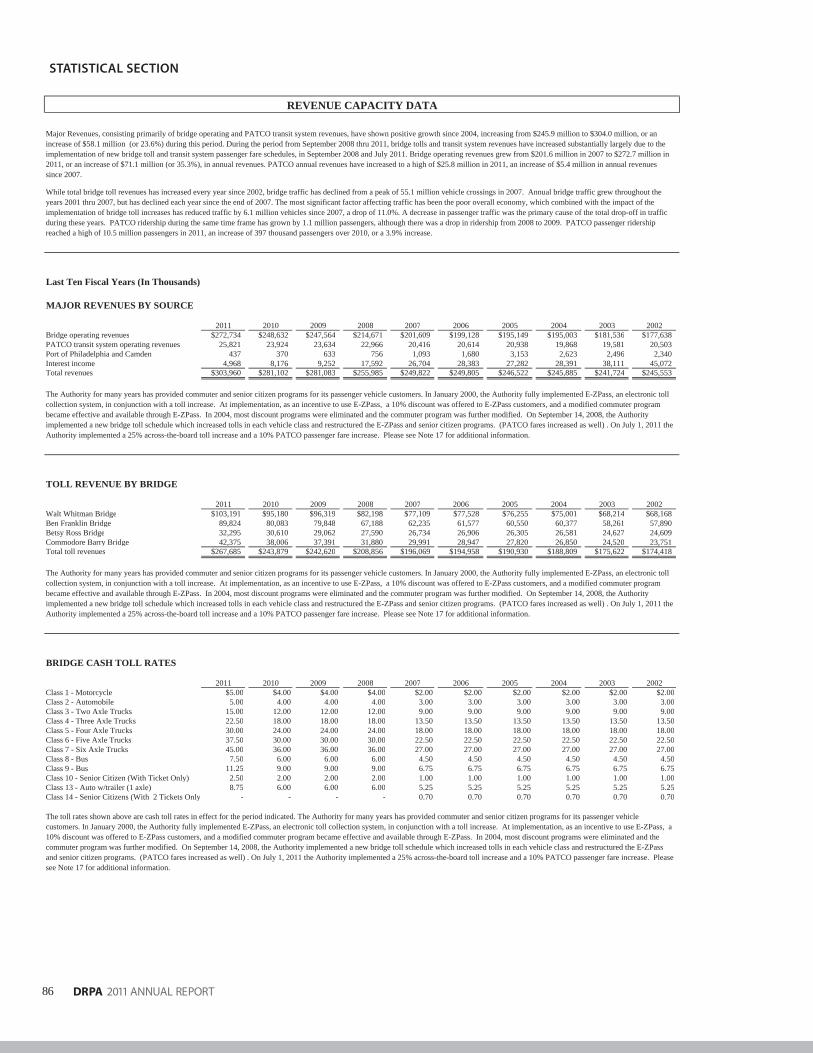
86
STATISTICAL SECTION
DRPA 2011 ANNUAL REPORT
Last Ten Fiscal Years (In Thousands)
MAJOR REVENUES BY SOURCE
2011 2010 2009 2008 2007 2006 2005 2004 2003 2002Bridge operating revenues $272,734 $248,632 $247,564 $214,671 $201,609 $199,128 $195,149 $195,003 $181,536 $177,638PATCO transit system operating revenues 25,821 23,924 23,634 22,966 20,416 20,614 20,938 19,868 19,581 20,503Port of Philadelphia and Camden 437 370 633 756 1,093 1,680 3,153 2,623 2,496 2,340Interest income 4,968 8,176 9,252 17,592 26,704 28,383 27,282 28,391 38,111 45,072Total revenues $303,960 $281,102 $281,083 $255,985 $249,822 $249,805 $246,522 $245,885 $241,724 $245,553
TOLL REVENUE BY BRIDGE
2011 2010 2009 2008 2007 2006 2005 2004 2003 2002Walt Whitman Bridge $103,191 $95,180 $96,319 $82,198 $77,109 $77,528 $76,255 $75,001 $68,214 $68,168Ben Franklin Bridge 89,824 80,083 79,848 67,188 62,235 61,577 60,550 60,377 58,261 57,890Betsy Ross Bridge 32,295 30,610 29,062 27,590 26,734 26,906 26,305 26,581 24,627 24,609Commodore Barry Bridge 42,375 38,006 37,391 31,880 29,991 28,947 27,820 26,850 24,520 23,751Total toll revenues $267,685 $243,879 $242,620 $208,856 $196,069 $194,958 $190,930 $188,809 $175,622 $174,418
BRIDGE CASH TOLL RATES
2011 2010 2009 2008 2007 2006 2005 2004 2003 2002Class 1 - Motorcycle $5.00 $4.00 $4.00 $4.00 $2.00 $2.00 $2.00 $2.00 $2.00 $2.00Class 2 - Automobile 5.00 4.00 4.00 4.00 3.00 3.00 3.00 3.00 3.00 3.00Class 3 - Two Axle Trucks 15.00 12.00 12.00 12.00 9.00 9.00 9.00 9.00 9.00 9.00Class 4 - Three Axle Trucks 22.50 18.00 18.00 18.00 13.50 13.50 13.50 13.50 13.50 13.50Class 5 - Four Axle Trucks 30.00 24.00 24.00 24.00 18.00 18.00 18.00 18.00 18.00 18.00Class 6 - Five Axle Trucks 37.50 30.00 30.00 30.00 22.50 22.50 22.50 22.50 22.50 22.50Class 7 - Six Axle Trucks 45.00 36.00 36.00 36.00 27.00 27.00 27.00 27.00 27.00 27.00Class 8 - Bus 7.50 6.00 6.00 6.00 4.50 4.50 4.50 4.50 4.50 4.50Class 9 - Bus 11.25 9.00 9.00 9.00 6.75 6.75 6.75 6.75 6.75 6.75Class 10 - Senior Citizen (With Ticket Only) 2.50 2.00 2.00 2.00 1.00 1.00 1.00 1.00 1.00 1.00Class 13 - Auto w/trailer (1 axle) 8.75 6.00 6.00 6.00 5.25 5.25 5.25 5.25 5.25 5.25Class 14 - Senior Citizens (With 2 Tickets Only) - - - - 0.70 0.70 0.70 0.70 0.70 0.70
REVENUE CAPACITY DATA
The Authority for many years has provided commuter and senior citizen programs for its passenger vehicle customers. In January 2000, the Authority fully implemented E-ZPass, an electronic toll collection system, in conjunction with a toll increase. At implementation, as an incentive to use E-ZPass, a 10% discount was offered to E-ZPass customers, and a modified commuter program became effective and available through E-ZPass. In 2004, most discount programs were eliminated and the commuter program was further modified. On September 14, 2008, the Authority implemented a new bridge toll schedule which increased tolls in each vehicle class and restructured the E-ZPass and senior citizen programs. (PATCO fares increased as well) . On July 1, 2011 the Authority implemented a 25% across-the-board toll increase and a 10% PATCO passenger fare increase. Please see Note 17 for additional information.
The Authority for many years has provided commuter and senior citizen programs for its passenger vehicle customers. In January 2000, the Authority fully implemented E-ZPass, an electronic toll collection system, in conjunction with a toll increase. At implementation, as an incentive to use E-ZPass, a 10% discount was offered to E-ZPass customers, and a modified commuter program became effective and available through E-ZPass. In 2004, most discount programs were eliminated and the commuter program was further modified. On September 14, 2008, the Authority implemented a new bridge toll schedule which increased tolls in each vehicle class and restructured the E-ZPass and senior citizen programs. (PATCO fares increased as well) . On July 1, 2011 the Authority implemented a 25% across-the-board toll increase and a 10% PATCO passenger fare increase. Please see Note 17 for additional information.
The toll rates shown above are cash toll rates in effect for the period indicated. The Authority for many years has provided commuter and senior citizen programs for its passenger vehicle customers. In January 2000, the Authority fully implemented E-ZPass, an electronic toll collection system, in conjunction with a toll increase. At implementation, as an incentive to use E-ZPass, a 10% discount was offered to E-ZPass customers, and a modified commuter program became effective and available through E-ZPass. In 2004, most discount programs were eliminated and the commuter program was further modified. On September 14, 2008, the Authority implemented a new bridge toll schedule which increased tolls in each vehicle class and restructured the E-ZPass and senior citizen programs. (PATCO fares increased as well) . On July 1, 2011 the Authority implemented a 25% across-the-board toll increase and a 10% PATCO passenger fare increase. Please see Note 17 for additional information.
Major Revenues, consisting primarily of bridge operating and PATCO transit system revenues, have shown positive growth since 2004, increasing from $245.9 million to $304.0 million, or an increase of $58.1 million (or 23.6%) during this period. During the period from September 2008 thru 2011, bridge tolls and transit system revenues have increased substantially largely due to the implementation of new bridge toll and transit system passenger fare schedules, in September 2008 and July 2011. Bridge operating revenues grew from $201.6 million in 2007 to $272.7 million in 2011, or an increase of $71.1 million (or 35.3%), in annual revenues. PATCO annual revenues have increased to a high of $25.8 million in 2011, an increase of $5.4 million in annual revenues since 2007.
While total bridge toll revenues has increased every year since 2002, bridge traffic has declined from a peak of 55.1 million vehicle crossings in 2007. Annual bridge traffic grew throughout the years 2001 thru 2007, but has declined each year since the end of 2007. The most significant factor affecting traffic has been the poor overall economy, which combined with the impact of the implementation of bridge toll increases has reduced traffic by 6.1 million vehicles since 2007, a drop of 11.0%. A decrease in passenger traffic was the primary cause of the total drop-off in traffic during these years. PATCO ridership during the same time frame has grown by 1.1 million passengers, although there was a drop in ridership from 2008 to 2009. PATCO passenger ridership reached a high of 10.5 million passengers in 2011, an increase of 397 thousand passengers over 2010, or a 3.9% increase.
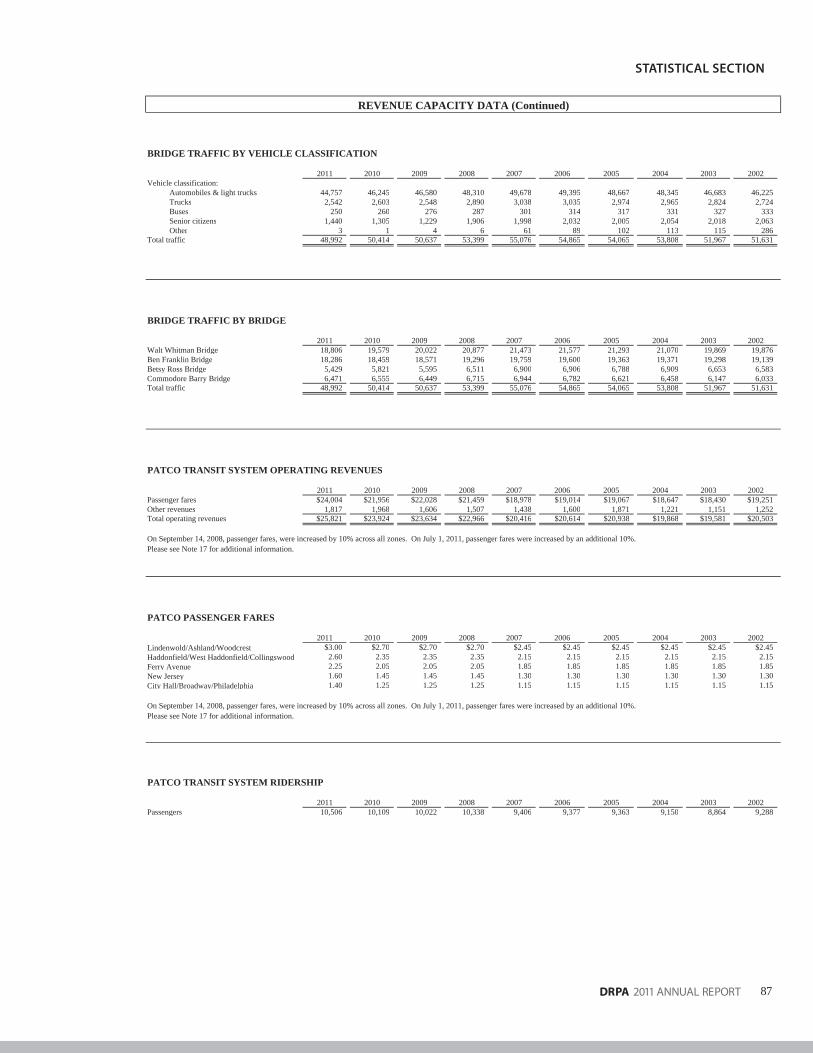
87DRPA 2011 ANNUAL REPORT
STATISTICAL SECTION
BRIDGE TRAFFIC BY VEHICLE CLASSIFICATION
2011 2010 2009 2008 2007 2006 2005 2004 2003 2002Vehicle classification:
Automobiles & light trucks 44,757 46,245 46,580 48,310 49,678 49,395 48,667 48,345 46,683 46,225Trucks 2,542 2,603 2,548 2,890 3,038 3,035 2,974 2,965 2,824 2,724Buses 250 260 276 287 301 314 317 331 327 333Senior citizens 1,440 1,305 1,229 1,906 1,998 2,032 2,005 2,054 2,018 2,063Other 3 1 4 6 61 89 102 113 115 286
Total traffic 48,992 50,414 50,637 53,399 55,076 54,865 54,065 53,808 51,967 51,631
BRIDGE TRAFFIC BY BRIDGE
2011 2010 2009 2008 2007 2006 2005 2004 2003 2002Walt Whitman Bridge 18,806 19,579 20,022 20,877 21,473 21,577 21,293 21,070 19,869 19,876Ben Franklin Bridge 18,286 18,459 18,571 19,296 19,759 19,600 19,363 19,371 19,298 19,139Betsy Ross Bridge 5,429 5,821 5,595 6,511 6,900 6,906 6,788 6,909 6,653 6,583Commodore Barry Bridge 6,471 6,555 6,449 6,715 6,944 6,782 6,621 6,458 6,147 6,033Total traffic 48,992 50,414 50,637 53,399 55,076 54,865 54,065 53,808 51,967 51,631
PATCO TRANSIT SYSTEM OPERATING REVENUES
2011 2010 2009 2008 2007 2006 2005 2004 2003 2002Passenger fares $24,004 $21,956 $22,028 $21,459 $18,978 $19,014 $19,067 $18,647 $18,430 $19,251Other revenues 1,817 1,968 1,606 1,507 1,438 1,600 1,871 1,221 1,151 1,252Total operating revenues $25,821 $23,924 $23,634 $22,966 $20,416 $20,614 $20,938 $19,868 $19,581 $20,503
Please see Note 17 for additional information.
PATCO PASSENGER FARES
2011 2010 2009 2008 2007 2006 2005 2004 2003 2002Lindenwold/Ashland/Woodcrest $3.00 $2.70 $2.70 $2.70 $2.45 $2.45 $2.45 $2.45 $2.45 $2.45Haddonfield/West Haddonfield/Collingswood 2.60 2.35 2.35 2.35 2.15 2.15 2.15 2.15 2.15 2.15Ferry Avenue 2.25 2.05 2.05 2.05 1.85 1.85 1.85 1.85 1.85 1.85New Jersey 1.60 1.45 1.45 1.45 1.30 1.30 1.30 1.30 1.30 1.30City Hall/Broadway/Philadelphia 1.40 1.25 1.25 1.25 1.15 1.15 1.15 1.15 1.15 1.15
Please see Note 17 for additional information.
PATCO TRANSIT SYSTEM RIDERSHIP
2011 2010 2009 2008 2007 2006 2005 2004 2003 2002Passengers 10,506 10,109 10,022 10,338 9,406 9,377 9,363 9,150 8,864 9,288
On September 14, 2008, passenger fares, were increased by 10% across all zones. On July 1, 2011, passenger fares were increased by an additional 10%.
On September 14, 2008, passenger fares, were increased by 10% across all zones. On July 1, 2011, passenger fares were increased by an additional 10%.
REVENUE CAPACITY DATA (Continued)
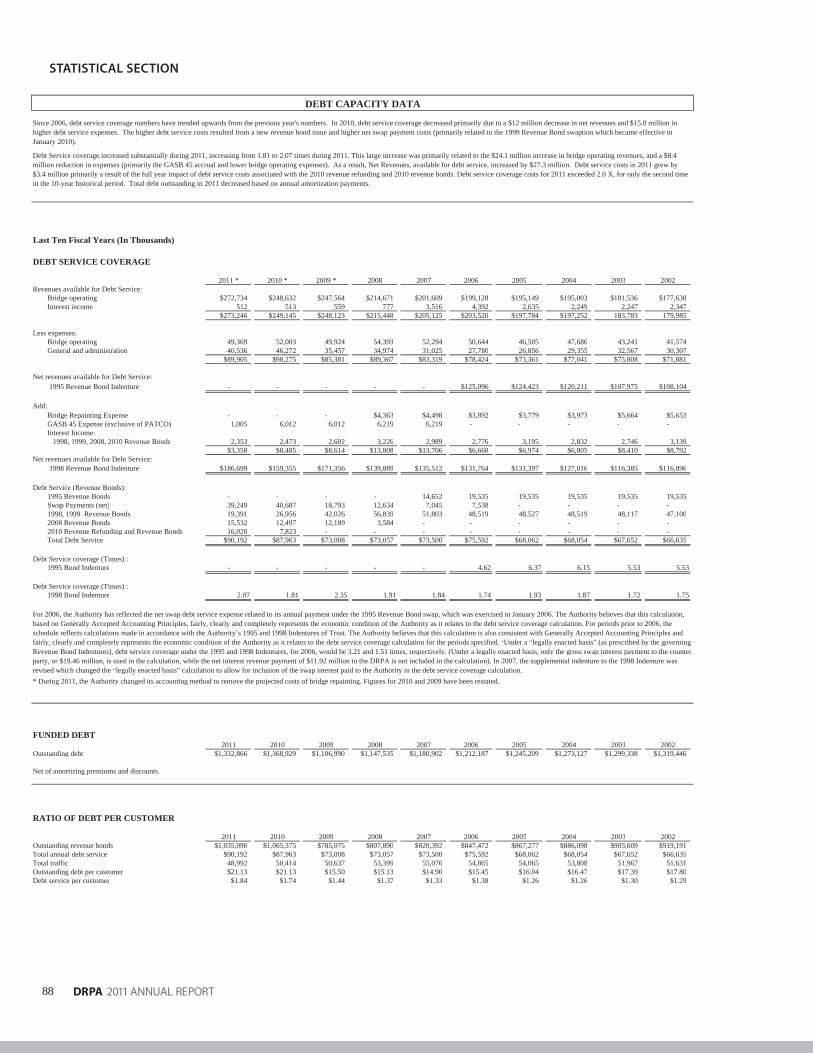
88
STATISTICAL SECTION
DRPA 2011 ANNUAL REPORT
Last Ten Fiscal Years (In Thousands)
DEBT SERVICE COVERAGE
2011 * 2010 * 2009 * 2008 2007 2006 2005 2004 2003 2002Revenues available for Debt Service:
Bridge operating $272,734 $248,632 $247,564 $214,671 $201,609 $199,128 $195,149 $195,003 $181,536 $177,638Interest income 512 513 559 777 3,516 4,392 2,635 2,249 2,247 2,347
$273,246 $249,145 $248,123 $215,448 $205,125 $203,520 $197,784 $197,252 183,783 179,985
Less expenses:Bridge operating 49,369 52,003 49,924 54,393 52,294 50,644 46,505 47,686 43,241 41,574General and administration 40,536 46,272 35,457 34,974 31,025 27,780 26,856 29,355 32,567 30,307
$89,905 $98,275 $85,381 $89,367 $83,319 $78,424 $73,361 $77,041 $75,808 $71,881
Net revenues available for Debt Service: 1995 Revenue Bond Indenture - - - - - $125,096 $124,423 $120,211 $107,975 $108,104
Add:Bridge Repainting Expense - - - $4,363 $4,498 $3,892 $3,779 $3,973 $5,664 $5,653GASB 45 Expense (exclusive of PATCO) 1,005 6,012 6,012 6,219 6,219 - - - - -Interest Income: 1998, 1999, 2008, 2010 Revenue Bonds 2,353 2,473 2,602 3,226 2,989 2,776 3,195 2,832 2,746 3,139
$3,358 $8,485 $8,614 $13,808 $13,706 $6,668 $6,974 $6,805 $8,410 $8,792Net revenues available for Debt Service:
1998 Revenue Bond Indenture $186,699 $159,355 $171,356 $139,889 $135,512 $131,764 $131,397 $127,016 $116,385 $116,896
Debt Service (Revenue Bonds):1995 Revenue Bonds - - - - 14,652 19,535 19,535 19,535 19,535 19,535Swap Payments (net) 39,249 40,687 18,793 12,634 7,045 7,538 - - - -1998, 1999 Revenue Bonds 19,391 26,956 42,026 56,839 51,803 48,519 48,527 48,519 48,117 47,1002008 Revenue Bonds 15,532 12,497 12,189 3,584 - - - - - -2010 Revenue Refunding and Revenue Bonds 16,020 7,823 - - - - - - - -Total Debt Service $90,192 $87,963 $73,008 $73,057 $73,500 $75,592 $68,062 $68,054 $67,652 $66,635
Debt Service coverage (Times) :1995 Bond Indenture - - - - - 4.62 6.37 6.15 5.53 5.53
Debt Service coverage (Times) :1998 Bond Indenture 2.07 1.81 2.35 1.91 1.84 1.74 1.93 1.87 1.72 1.75
* During 2011, the Authority changed its accounting method to remove the projected costs of bridge repainting. Figures for 2010 and 2009 have been restated.
FUNDED DEBT2011 2010 2009 2008 2007 2006 2005 2004 2003 2002
Outstanding debt $1,332,866 $1,368,929 $1,106,990 $1,147,535 $1,180,902 $1,212,187 $1,245,209 $1,273,127 $1,299,338 $1,319,446
Net of amortizing premiums and discounts.
RATIO OF DEBT PER CUSTOMER
2011 2010 2009 2008 2007 2006 2005 2004 2003 2002Outstanding revenue bonds $1,035,090 $1,065,375 $785,075 $807,890 $820,392 $847,472 $867,277 $886,098 $903,609 $919,191Total annual debt service $90,192 $87,963 $73,008 $73,057 $73,500 $75,592 $68,062 $68,054 $67,652 $66,635Total traffic 48,992 50,414 50,637 53,399 55,076 54,865 54,065 53,808 51,967 51,631Outstanding debt per customer $21.13 $21.13 $15.50 $15.13 $14.90 $15.45 $16.04 $16.47 $17.39 $17.80Debt service per customer $1.84 $1.74 $1.44 $1.37 $1.33 $1.38 $1.26 $1.26 $1.30 $1.29
DEBT CAPACITY DATA
Debt Service coverage increased substantially during 2011, increasing from 1.81 to 2.07 times during 2011. This large increase was primarily related to the $24.1 million increase in bridge operating revenues, and a $8.4 million reduction in expenses (primarily the GASB 45 accrual and lower bridge operating expenses). As a result, Net Revenues, available for debt service, increased by $27.3 million. Debt service costs in 2011 grew by $3.4 million primarily a result of the full year impact of debt service costs associated with the 2010 revenue refunding and 2010 revenue bonds. Debt service coverage costs for 2011 exceeded 2.0 X, for only the second time in the 10-year historical period. Total debt outstanding in 2011 decreased based on annual amortization payments.
For 2006, the Authority has reflected the net swap debt service expense related to its annual payment under the 1995 Revenue Bond swap, which was exercised in January 2006. The Authority believes that this calculation, based on Generally Accepted Accounting Principles, fairly, clearly and completely represents the economic condition of the Authority as it relates to the debt service coverage calculation. For periods prior to 2006, the schedule reflects calculations made in accordance with the Authority s 1995 and 1998 Indentures of Trust. The Authority believes that this calculation is also consistent with Generally Accepted Accounting Principles andfairly, clearly and completely represents the economic condition of the Authority as it relates to the debt service coverage calculation for the periods specified. Under a legally enacted basis (as prescribed by the governingRevenue Bond Indentures), debt service coverage under the 1995 and 1998 Indentures, for 2006, would be 3.21 and 1.51 times, respectively. (Under a legally enacted basis, only the gross swap interest payment to the counter party, or $19.46 million, is used in the calculation, while the net interest revenue payment of $11.92 million to the DRPA is not included in the calculation). In 2007, the supplemental indenture to the 1998 Indenture was revised which changed the legally enacted basis calculation to allow for inclusion of the swap interest paid to the Authority in the debt service coverage calculation.
Since 2006, debt service coverage numbers have trended upwards from the previous year's numbers. In 2010, debt service coverage decreased primarily due to a $12 million decrease in net revenues and $15.0 million in higher debt service expenses. The higher debt service costs resulted from a new revenue bond issue and higher net swap payment costs (primarily related to the 1999 Revenue Bond swaption which became effective in January 2010).
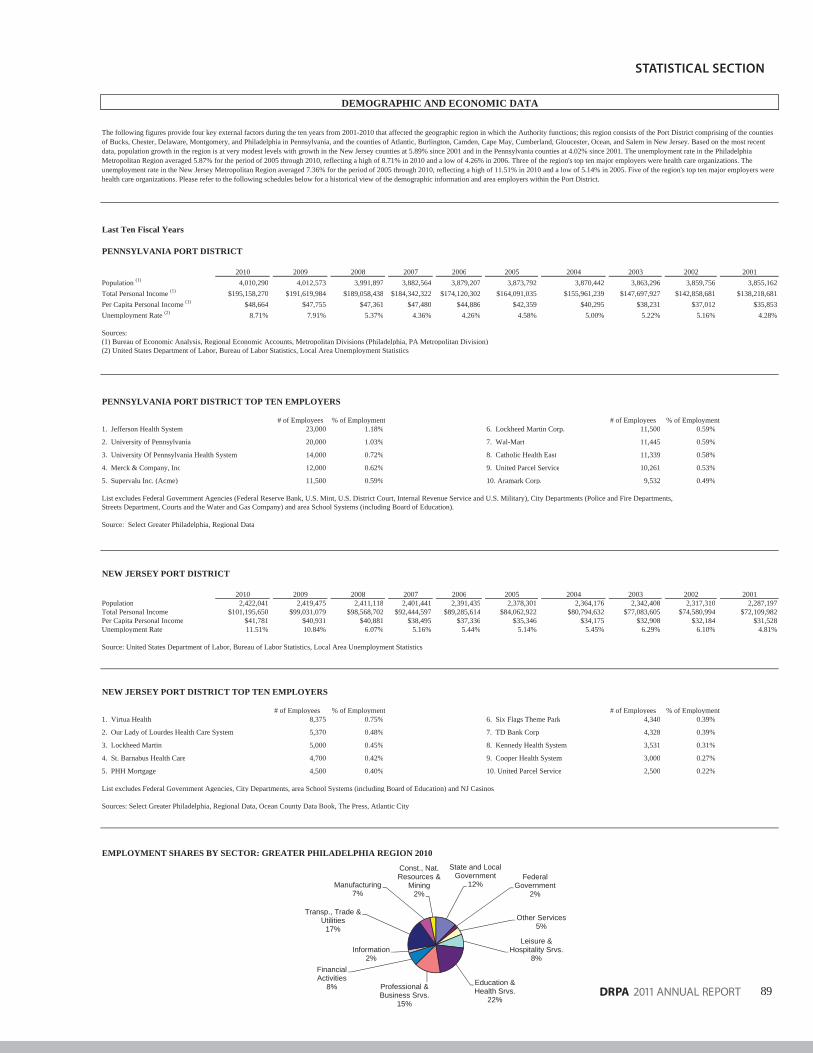
89DRPA 2011 ANNUAL REPORT
STATISTICAL SECTION
DEMOGRAPHIC AND ECONOMIC DATA
Last Ten Fiscal Years
PENNSYLVANIA PORT DISTRICT
2010 2009 2008 2007 2006 2005 2004 2003 2002 2001Population (1) 4,010,290 4,012,573 3,991,897 3,882,564 3,879,207 3,873,792 3,870,442 3,863,296 3,859,756 3,855,162Total Personal Income (1) $195,158,270 $191,619,984 $189,058,438 $184,342,322 $174,120,302 $164,091,035 $155,961,239 $147,697,927 $142,858,681 $138,218,681Per Capita Personal Income (1) $48,664 $47,755 $47,361 $47,480 $44,886 $42,359 $40,295 $38,231 $37,012 $35,853Unemployment Rate (2) 8.71% 7.91% 5.37% 4.36% 4.26% 4.58% 5.00% 5.22% 5.16% 4.28%
Sources:(1) Bureau of Economic Analysis, Regional Economic Accounts, Metropolitan Divisions (Philadelphia, PA Metropolitan Division)(2) United States Department of Labor, Bureau of Labor Statistics, Local Area Unemployment Statistics
PENNSYLVANIA PORT DISTRICT TOP TEN EMPLOYERS
# of Employees % of Employment # of Employees % of Employment1. Jefferson Health System 23,000 1.18% 6. Lockheed Martin Corp. 11,500 0.59%
2. University of Pennsylvania 20,000 1.03% 7. Wal-Mart 11,445 0.59%
3. University Of Pennsylvania Health System 14,000 0.72% 8. Catholic Health East 11,339 0.58%
4. Merck & Company, Inc 12,000 0.62% 9. United Parcel Service 10,261 0.53%
5. Supervalu Inc. (Acme) 11,500 0.59% 10. Aramark Corp. 9,532 0.49%
List excludes Federal Government Agencies (Federal Reserve Bank, U.S. Mint, U.S. District Court, Internal Revenue Service and U.S. Military), City Departments (Police and Fire Departments, Streets Department, Courts and the Water and Gas Company) and area School Systems (including Board of Education).
Source: Select Greater Philadelphia, Regional Data
NEW JERSEY PORT DISTRICT
2010 2009 2008 2007 2006 2005 2004 2003 2002 2001Population 2,422,041 2,419,475 2,411,118 2,401,441 2,391,435 2,378,301 2,364,176 2,342,408 2,317,310 2,287,197Total Personal Income $101,195,650 $99,031,079 $98,568,702 $92,444,597 $89,285,614 $84,062,922 $80,794,632 $77,083,605 $74,580,994 $72,109,982Per Capita Personal Income $41,781 $40,931 $40,881 $38,495 $37,336 $35,346 $34,175 $32,908 $32,184 $31,528Unemployment Rate 11.51% 10.84% 6.07% 5.16% 5.44% 5.14% 5.45% 6.29% 6.10% 4.81%
Source: United States Department of Labor, Bureau of Labor Statistics, Local Area Unemployment Statistics
NEW JERSEY PORT DISTRICT TOP TEN EMPLOYERS
# of Employees % of Employment # of Employees % of Employment1. Virtua Health 8,375 0.75% 6. Six Flags Theme Park 4,340 0.39%
2. Our Lady of Lourdes Health Care System 5,370 0.48% 7. TD Bank Corp 4,328 0.39%
3. Lockheed Martin 5,000 0.45% 8. Kennedy Health System 3,531 0.31%
4. St. Barnabus Health Care 4,700 0.42% 9. Cooper Health System 3,000 0.27%
5. PHH Mortgage 4,500 0.40% 10. United Parcel Service 2,500 0.22%
List excludes Federal Government Agencies, City Departments, area School Systems (including Board of Education) and NJ Casinos
Sources: Select Greater Philadelphia, Regional Data, Ocean County Data Book, The Press, Atlantic City
EMPLOYMENT SHARES BY SECTOR: GREATER PHILADELPHIA REGION 2010
The following figures provide four key external factors during the ten years from 2001-2010 that affected the geographic region in which the Authority functions; this region consists of the Port District comprising of the counties of Bucks, Chester, Delaware, Montgomery, and Philadelphia in Pennsylvania, and the counties of Atlantic, Burlington, Camden, Cape May, Cumberland, Gloucester, Ocean, and Salem in New Jersey. Based on the most recent data, population growth in the region is at very modest levels with growth in the New Jersey counties at 5.89% since 2001 and in the Pennsylvania counties at 4.02% since 2001. The unemployment rate in the Philadelphia Metropolitan Region averaged 5.87% for the period of 2005 through 2010, reflecting a high of 8.71% in 2010 and a low of 4.26% in 2006. Three of the region's top ten major employers were health care organizations. The unemployment rate in the New Jersey Metropolitan Region averaged 7.36% for the period of 2005 through 2010, reflecting a high of 11.51% in 2010 and a low of 5.14% in 2005. Five of the region's top ten major employers were health care organizations. Please refer to the following schedules below for a historical view of the demographic information and area employers within the Port District.
State and Local Government
12%Federal
Government2%
Other Services5%
Leisure & Hospitality Srvs.
8%
Education & Health Srvs.
22%
Professional & Business Srvs.
15%
FinancialActivities
8%
Information2%
Transp., Trade &Utilities
17%
Manufacturing7%
Const., Nat. Resources &
Mining2%
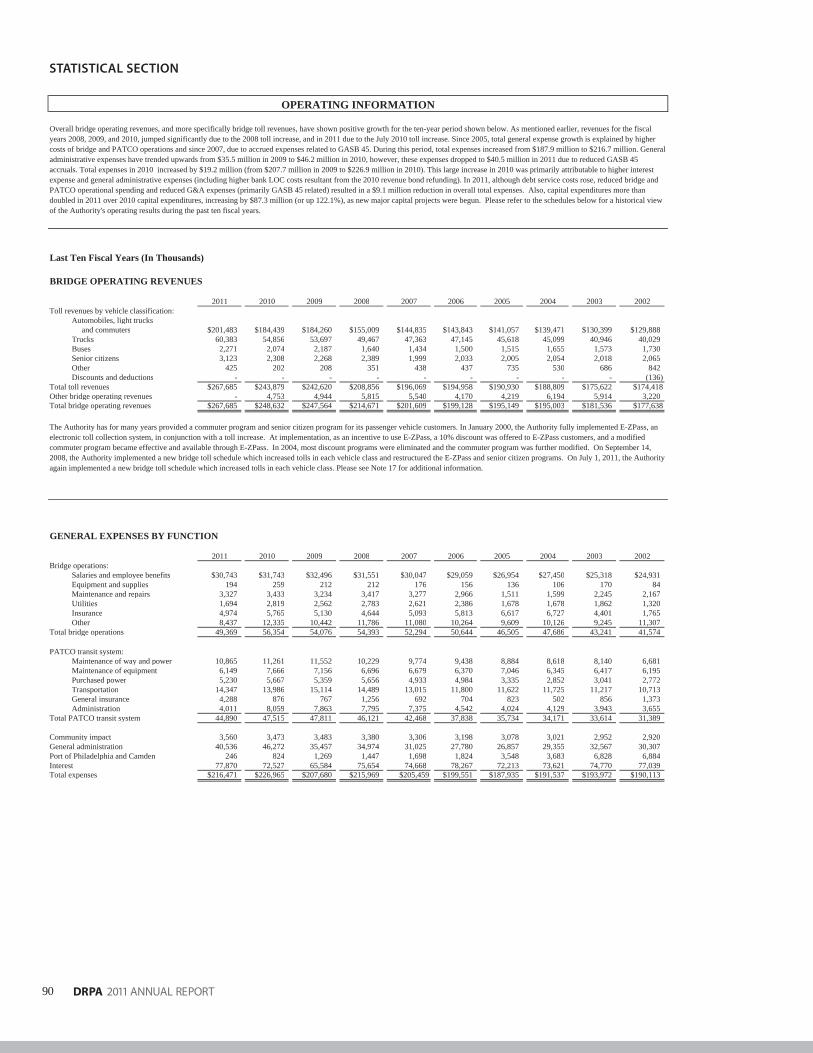
90
STATISTICAL SECTION
DRPA 2011 ANNUAL REPORT
Last Ten Fiscal Years (In Thousands)
BRIDGE OPERATING REVENUES
2011 2010 2009 2008 2007 2006 2005 2004 2003 2002Toll revenues by vehicle classification:
Automobiles, light trucks and commuters $201,483 $184,439 $184,260 $155,009 $144,835 $143,843 $141,057 $139,471 $130,399 $129,888Trucks 60,383 54,856 53,697 49,467 47,363 47,145 45,618 45,099 40,946 40,029Buses 2,271 2,074 2,187 1,640 1,434 1,500 1,515 1,655 1,573 1,730Senior citizens 3,123 2,308 2,268 2,389 1,999 2,033 2,005 2,054 2,018 2,065Other 425 202 208 351 438 437 735 530 686 842Discounts and deductions - - - - - - - - - (136)
Total toll revenues $267,685 $243,879 $242,620 $208,856 $196,069 $194,958 $190,930 $188,809 $175,622 $174,418Other bridge operating revenues - 4,753 4,944 5,815 5,540 4,170 4,219 6,194 5,914 3,220Total bridge operating revenues $267,685 $248,632 $247,564 $214,671 $201,609 $199,128 $195,149 $195,003 $181,536 $177,638
GENERAL EXPENSES BY FUNCTION
2011 2010 2009 2008 2007 2006 2005 2004 2003 2002Bridge operations:
Salaries and employee benefits $30,743 $31,743 $32,496 $31,551 $30,047 $29,059 $26,954 $27,450 $25,318 $24,931Equipment and supplies 194 259 212 212 176 156 136 106 170 84Maintenance and repairs 3,327 3,433 3,234 3,417 3,277 2,966 1,511 1,599 2,245 2,167Utilities 1,694 2,819 2,562 2,783 2,621 2,386 1,678 1,678 1,862 1,320Insurance 4,974 5,765 5,130 4,644 5,093 5,813 6,617 6,727 4,401 1,765Other 8,437 12,335 10,442 11,786 11,080 10,264 9,609 10,126 9,245 11,307
Total bridge operations 49,369 56,354 54,076 54,393 52,294 50,644 46,505 47,686 43,241 41,574
PATCO transit system:Maintenance of way and power 10,865 11,261 11,552 10,229 9,774 9,438 8,884 8,618 8,140 6,681Maintenance of equipment 6,149 7,666 7,156 6,696 6,679 6,370 7,046 6,345 6,417 6,195Purchased power 5,230 5,667 5,359 5,656 4,933 4,984 3,335 2,852 3,041 2,772Transportation 14,347 13,986 15,114 14,489 13,015 11,800 11,622 11,725 11,217 10,713General insurance 4,288 876 767 1,256 692 704 823 502 856 1,373Administration 4,011 8,059 7,863 7,795 7,375 4,542 4,024 4,129 3,943 3,655
Total PATCO transit system 44,890 47,515 47,811 46,121 42,468 37,838 35,734 34,171 33,614 31,389
Community impact 3,560 3,473 3,483 3,380 3,306 3,198 3,078 3,021 2,952 2,920General administration 40,536 46,272 35,457 34,974 31,025 27,780 26,857 29,355 32,567 30,307Port of Philadelphia and Camden 246 824 1,269 1,447 1,698 1,824 3,548 3,683 6,828 6,884Interest 77,870 72,527 65,584 75,654 74,668 78,267 72,213 73,621 74,770 77,039Total expenses $216,471 $226,965 $207,680 $215,969 $205,459 $199,551 $187,935 $191,537 $193,972 $190,113
OPERATING INFORMATION
Overall bridge operating revenues, and more specifically bridge toll revenues, have shown positive growth for the ten-year period shown below. As mentioned earlier, revenues for the fiscal years 2008, 2009, and 2010, jumped significantly due to the 2008 toll increase, and in 2011 due to the July 2010 toll increase. Since 2005, total general expense growth is explained by higher costs of bridge and PATCO operations and since 2007, due to accrued expenses related to GASB 45. During this period, total expenses increased from $187.9 million to $216.7 million. General administrative expenses have trended upwards from $35.5 million in 2009 to $46.2 million in 2010, however, these expenses dropped to $40.5 million in 2011 due to reduced GASB 45 accruals. Total expenses in 2010 increased by $19.2 million (from $207.7 million in 2009 to $226.9 million in 2010). This large increase in 2010 was primarily attributable to higher interest expense and general administrative expenses (including higher bank LOC costs resultant from the 2010 revenue bond refunding). In 2011, although debt service costs rose, reduced bridge and PATCO operational spending and reduced G&A expenses (primarily GASB 45 related) resulted in a $9.1 million reduction in overall total expenses. Also, capital expenditures more than doubled in 2011 over 2010 capital expenditures, increasing by $87.3 million (or up 122.1%), as new major capital projects were begun. Please refer to the schedules below for a historical view of the Authority's operating results during the past ten fiscal years.
The Authority has for many years provided a commuter program and senior citizen program for its passenger vehicle customers. In January 2000, the Authority fully implemented E-ZPass, an electronic toll collection system, in conjunction with a toll increase. At implementation, as an incentive to use E-ZPass, a 10% discount was offered to E-ZPass customers, and a modified commuter program became effective and available through E-ZPass. In 2004, most discount programs were eliminated and the commuter program was further modified. On September 14, 2008, the Authority implemented a new bridge toll schedule which increased tolls in each vehicle class and restructured the E-ZPass and senior citizen programs. On July 1, 2011, the Authority again implemented a new bridge toll schedule which increased tolls in each vehicle class. Please see Note 17 for additional information.
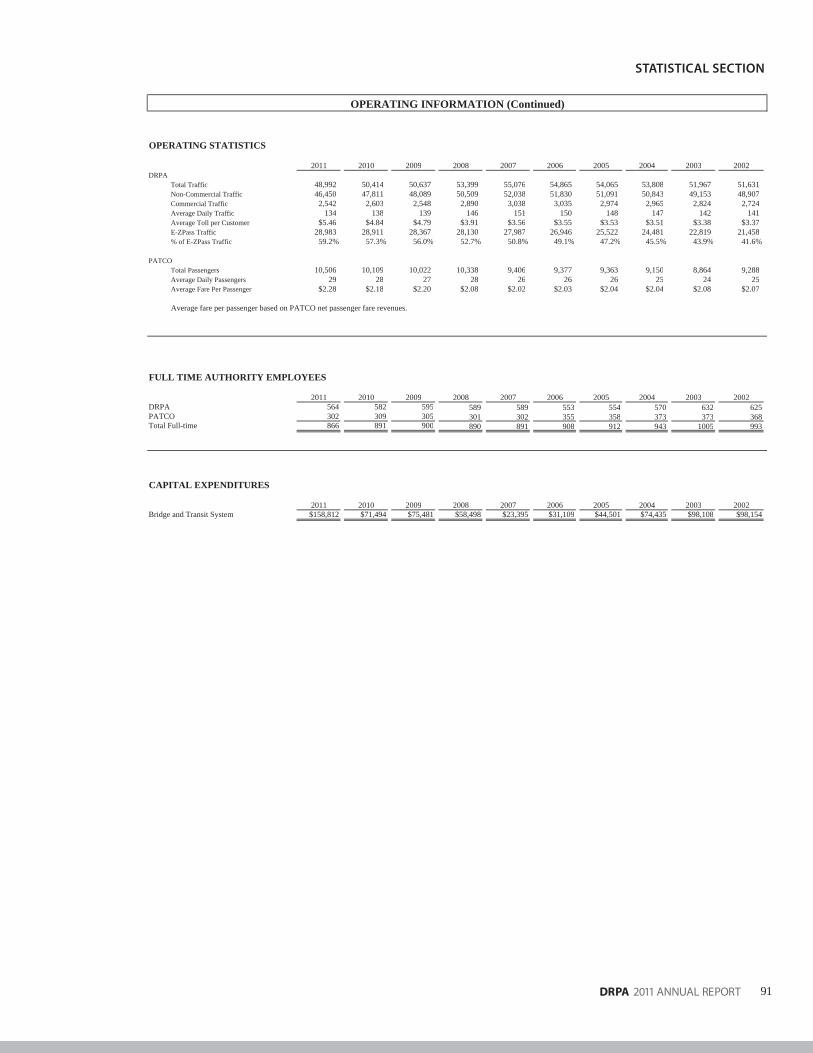
91DRPA 2011 ANNUAL REPORT
STATISTICAL SECTION
OPERATING STATISTICS
2011 2010 2009 2008 2007 2006 2005 2004 2003 2002DRPA
Total Traffic 48,992 50,414 50,637 53,399 55,076 54,865 54,065 53,808 51,967 51,631Non-Commercial Traffic 46,450 47,811 48,089 50,509 52,038 51,830 51,091 50,843 49,153 48,907Commercial Traffic 2,542 2,603 2,548 2,890 3,038 3,035 2,974 2,965 2,824 2,724Average Daily Traffic 134 138 139 146 151 150 148 147 142 141Average Toll per Customer $5.46 $4.84 $4.79 $3.91 $3.56 $3.55 $3.53 $3.51 $3.38 $3.37E-ZPass Traffic 28,983 28,911 28,367 28,130 27,987 26,946 25,522 24,481 22,819 21,458% of E-ZPass Traffic 59.2% 57.3% 56.0% 52.7% 50.8% 49.1% 47.2% 45.5% 43.9% 41.6%
PATCOTotal Passengers 10,506 10,109 10,022 10,338 9,406 9,377 9,363 9,150 8,864 9,288Average Daily Passengers 29 28 27 28 26 26 26 25 24 25Average Fare Per Passenger $2.28 $2.18 $2.20 $2.08 $2.02 $2.03 $2.04 $2.04 $2.08 $2.07
Average fare per passenger based on PATCO net passenger fare revenues.
FULL TIME AUTHORITY EMPLOYEES
2011 2010 2009 2008 2007 2006 2005 2004 2003 2002DRPA 564 582 595 589 589 553 554 570 632 625PATCO 302 309 305 301 302 355 358 373 373 368Total Full-time 866 891 900 890 891 908 912 943 1005 993
CAPITAL EXPENDITURES
2011 2010 2009 2008 2007 2006 2005 2004 2003 2002Bridge and Transit System $158,812 $71,494 $75,481 $58,498 $23,395 $31,109 $44,501 $74,435 $98,108 $98,154
OPERATING INFORMATION (Continued)
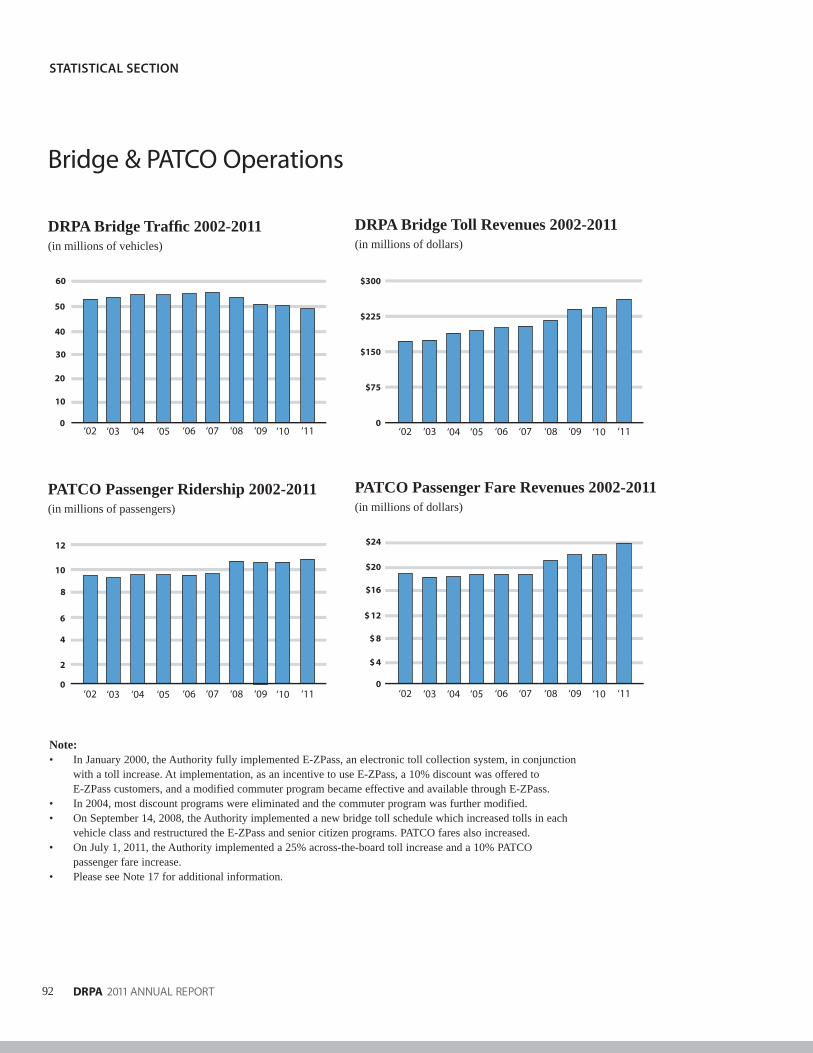
92
STATISTICAL SECTION
DRPA 2011 ANNUAL REPORT
0 0
$300
$225
$150
$75
$ 8
$ 4
0
$ 12
$16
$20
$24
10
20
30
40
50
60
4
2
0
6
8
12
10
Note:In January 2000, the Authority fully implemented E-ZPass, an electronic toll collection system, in conjunction • with a toll increase. At implementation, as an incentive to use E-ZPass, a 10% discount was offered to E-ZPass customers, and a modified commuter program became effective and available through E-ZPass. In 2004, most discount programs were eliminated and the commuter program was further modified. • On September 14, 2008, the Authority implemented a new bridge toll schedule which increased tolls in each • vehicle class and restructured the E-ZPass and senior citizen programs. PATCO fares also increased. On July 1, 2011, the Authority implemented a 25% across-the-board toll increase and a 10% PATCO • passenger fare increase. Please see Note 17 for additional information• .
‘03 ‘04 ‘06 ‘07 ‘08 ‘09 ‘10 ‘11‘02
‘03 ‘04 ‘06 ‘07 ‘08 ‘09 ‘10 ‘11‘02 ‘03 ‘04 ‘06 ‘07 ‘08 ‘09 ‘10 ‘11‘02
‘04‘05
‘05 ‘05
‘05 ‘06 ‘07 ‘08 ‘09 ‘10 ‘11‘02 ‘03
DRPA Bridge Traffi c 2002-2011(in millions of vehicles)
PATCO Passenger Ridership 2002-2011(in millions of passengers)
DRPA Bridge Toll Revenues 2002-2011(in millions of dollars)
PATCO Passenger Fare Revenues 2002-2011(in millions of dollars)
Bridge & PATCO Operations

Delaware River Port Authority
Comprehensive Annual Financial Report
for the Year Ended December 31, 2011
PRODUCED BY:
The Offi ce of Corporate Communications
DESIGNED BY:
Michael D. Williams
PHOTOGRAPHY:
DRPA Archives
PRINTED BY:
DRPA Printing Services
FINANCIAL DATA COMPILED BY: Christopher J. Clifton, Jr. Jennifer A. DePoder Ronnie Gilbert James M. White, Jr., CCM

One Port Center • 2 Riverside Drive, PO Box 1949 • Camden, NJ 08101-1949
(856) 968-2000 • (215) 218-3750 • www.drpa.org