Embed Size (px)
Citation preview

community profile
City of Melton
2011 Census results
Comparison year: 2006Benchmark area: Greater Melbourne
Compiled and presented in profile.id®. http://profile.id.com.au/melton

Table of contents
Estimated Resident Population (ERP) 2
Population highlights 4
About the areas 6
Five year age groups 9
Ancestry 12
Birthplace 15
Year of arrival in Australia 17
Proficiency in English 19
Language spoken at home 22
Religion 25
Qualifications 27
Highest level of schooling 29
Education institution attending 32
Need for assistance 35
Employment status 38
Industry sectors of employment 41
Occupations of employment 44
Method of travel to work 47
Volunteer work 49
Unpaid care 51
Individual income 53
Household income 55
Households summary 57
Household size 60
Dwelling type 63
Number of bedrooms per dwelling 65
Internet connection 67
Number of cars per household 69
Housing tenure 70
Housing loan repayments 72
Housing rental payments 74
SEIFA - disadvantage 77
About the community profile 78
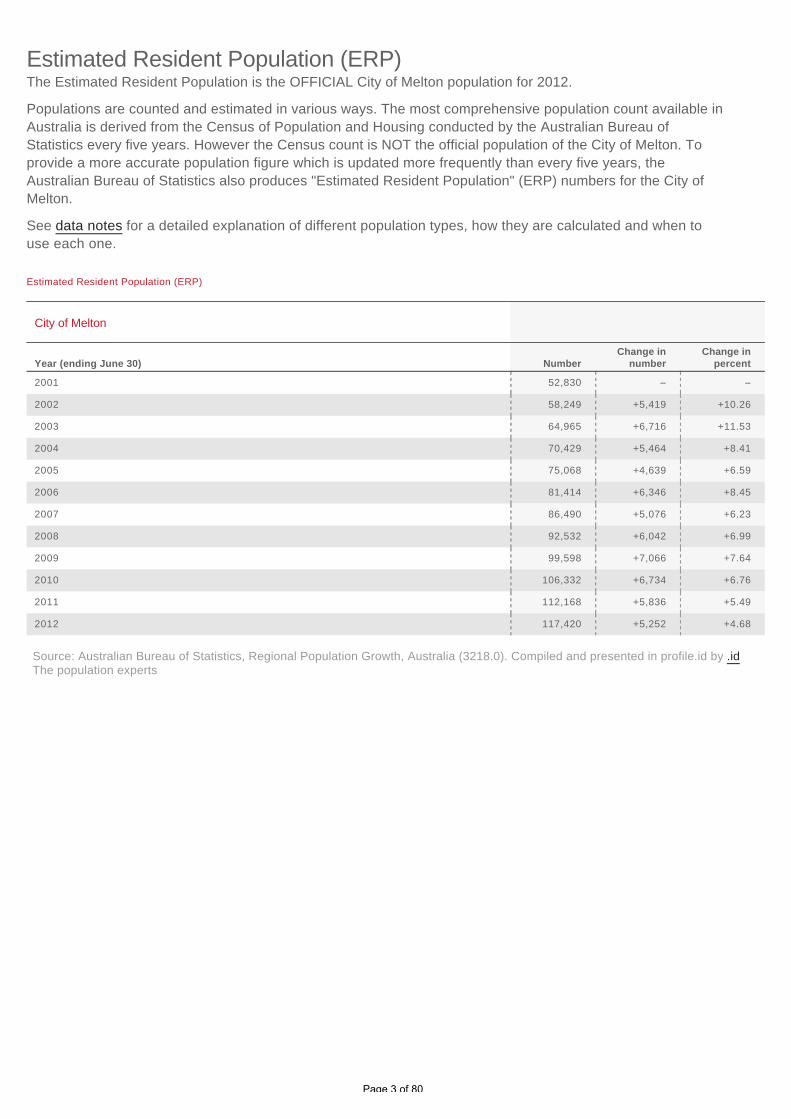
The Estimated Resident Population is the OFFICIAL City of Melton population for 2012.
Populations are counted and estimated in various ways. The most comprehensive population count available in
Australia is derived from the Census of Population and Housing conducted by the Australian Bureau of
Statistics every five years. However the Census count is NOT the official population of the City of Melton. To
provide a more accurate population figure which is updated more frequently than every five years, the
Australian Bureau of Statistics also produces "Estimated Resident Population" (ERP) numbers for the City of
Melton.
See data notes for a detailed explanation of different population types, how they are calculated and when to
use each one.
Estimated Resident Population (ERP)
Estimated Resident Population (ERP)
City of Melton
Year (ending June 30) NumberChange in
numberChange in
percent
2001 52,830 -- --
2002 58,249 +5,419 +10.26
2003 64,965 +6,716 +11.53
2004 70,429 +5,464 +8.41
2005 75,068 +4,639 +6.59
2006 81,414 +6,346 +8.45
2007 86,490 +5,076 +6.23
2008 92,532 +6,042 +6.99
2009 99,598 +7,066 +7.64
2010 106,332 +6,734 +6.76
2011 112,168 +5,836 +5.49
2012 117,420 +5,252 +4.68
Source: Australian Bureau of Statistics, Regional Population Growth, Australia (3218.0). Compiled and presented in profile.id by .idThe population experts
Page 3 of 80

Estimated Resident Population (ERP)
Source: Australian Bureau of Statistics, Regional Population Growth, Australia (3218.0). Compiled and presented by.id the population experts
Annual change in Estimated Resident Population (ERP)
Source: Australian Bureau of Statistics, Regional Population Growth, Australia (3218.0). Compiled and presented by.id the population experts
Page 4 of 80

2011 City of Melton Greater Melbourne Victoria Australia
Median age 3236 37 37
Median weeklyhouseholdincome
$1,363$1,333 $1,216 $1,234
Couples withchildren 43%
34% 32% 31%
Older coupleswithout children 5%
8% 9% 9%
Medium andhigh densityHousing
10%28% 23% 25%
Householdswith amortgage
53%35% 34% 33%
Median weeklyrent $270
$300 $277 $285
Householdsrenting 19%
26% 26% 29%
Non-Englishspeakingbackgrounds
22%24%
20% 16%
Universityattendance 3%
5% 5% 4%
Bachelor orHigher degree 14%
24% 21% 19%
Vocational 20%15% 16% 18%
Public transport(to work) 9%
14% 11% 10%
Population highlights
Page 5 of 80
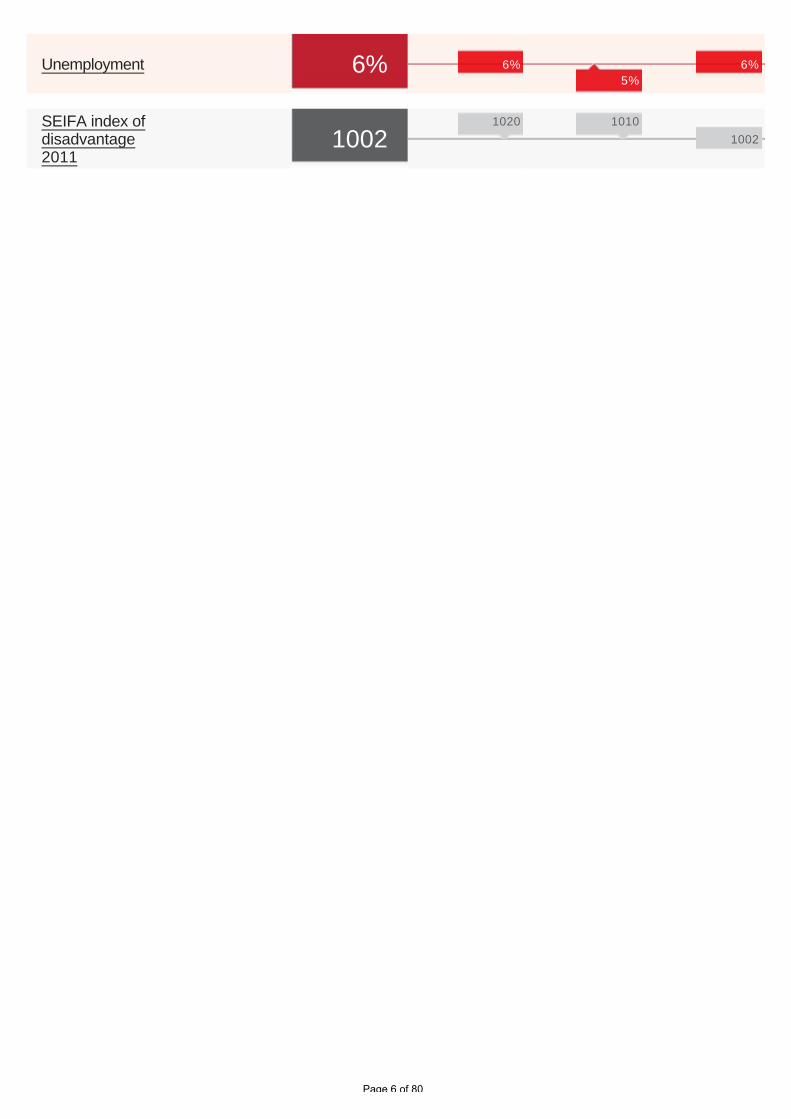
Unemployment 6% 6%
5%
6%
SEIFA index ofdisadvantage2011
10021020 1010
1002
Page 6 of 80

Location and boundaries
The City of Melton is located in the outer western fringe of Melbourne, about 40 kilometres west of the Melbourne
GPO. The City of Melton is bounded by Macedon Ranges Shire in the north, Hume City and the City of Brimbank in
the east, the City of Wyndham in the south, and Moorabool Shire in the west.
Name origin
Melton is named after Melton Mowbray, an English town renowned for its fox hunting and coursing.
About the area
Important
Statistics
Population
109,2582011 Usual residents
Land area
52,728hectares (527
Km )2
Population density
2.07persons per hectare
City of Melton
Report a map errorMap data ©2013 Google - Terms of Use
Legend
Suburbs
City of Melton
Overlay areas
Page 7 of 80
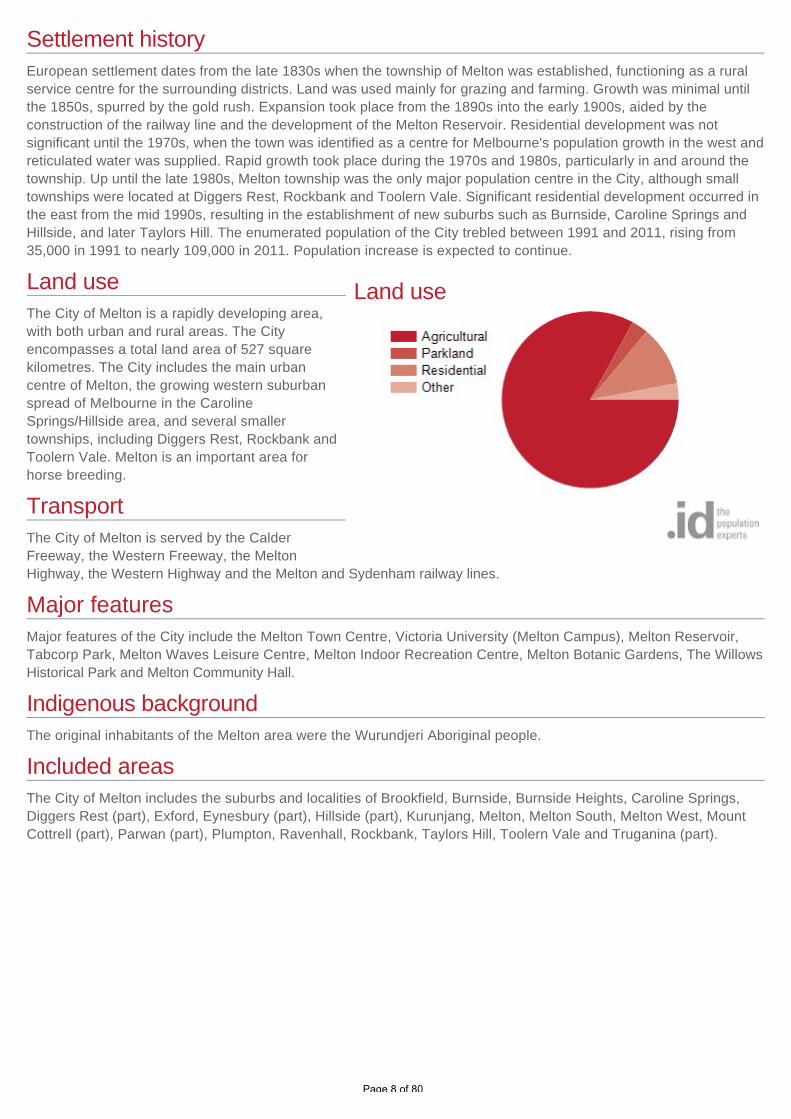
Settlement history
European settlement dates from the late 1830s when the township of Melton was established, functioning as a rural
service centre for the surrounding districts. Land was used mainly for grazing and farming. Growth was minimal until
the 1850s, spurred by the gold rush. Expansion took place from the 1890s into the early 1900s, aided by the
construction of the railway line and the development of the Melton Reservoir. Residential development was not
significant until the 1970s, when the town was identified as a centre for Melbourne's population growth in the west and
reticulated water was supplied. Rapid growth took place during the 1970s and 1980s, particularly in and around the
township. Up until the late 1980s, Melton township was the only major population centre in the City, although small
townships were located at Diggers Rest, Rockbank and Toolern Vale. Significant residential development occurred in
the east from the mid 1990s, resulting in the establishment of new suburbs such as Burnside, Caroline Springs and
Hillside, and later Taylors Hill. The enumerated population of the City trebled between 1991 and 2011, rising from
35,000 in 1991 to nearly 109,000 in 2011. Population increase is expected to continue.
Land use
The City of Melton is a rapidly developing area,
with both urban and rural areas. The City
encompasses a total land area of 527 square
kilometres. The City includes the main urban
centre of Melton, the growing western suburban
spread of Melbourne in the Caroline
Springs/Hillside area, and several smaller
townships, including Diggers Rest, Rockbank and
Toolern Vale. Melton is an important area for
horse breeding.
Transport
The City of Melton is served by the Calder
Freeway, the Western Freeway, the Melton
Highway, the Western Highway and the Melton and Sydenham railway lines.
Major features
Major features of the City include the Melton Town Centre, Victoria University (Melton Campus), Melton Reservoir,
Tabcorp Park, Melton Waves Leisure Centre, Melton Indoor Recreation Centre, Melton Botanic Gardens, The Willows
Historical Park and Melton Community Hall.
Indigenous background
The original inhabitants of the Melton area were the Wurundjeri Aboriginal people.
Included areas
The City of Melton includes the suburbs and localities of Brookfield, Burnside, Burnside Heights, Caroline Springs,
Diggers Rest (part), Exford, Eynesbury (part), Hillside (part), Kurunjang, Melton, Melton South, Melton West, Mount
Cottrell (part), Parwan (part), Plumpton, Ravenhall, Rockbank, Taylors Hill, Toolern Vale and Truganina (part).
Land use
Page 8 of 80

The Age Structure of the City of Melton provides key insights into the level of demand for age based services and
facilities such as child care. It is also an indicator of the City of Melton's residential role and function and how it is
likely to change in the future.
Five year age groups present a classic age profile of the population. Each age group covers exactly five years, which
enables direct comparison between each group.
To get a more complete picture the City of Melton's Age Structure should be viewed in conjunction with Household
Types and Dwelling Types.
Five year age groups
Age structure - Five year age groups
City of Melton 2011 2006 Change
Five year age groups(years) Number %
GreaterMelbourne Number %
GreaterMelbourne 2006 to 2011
0 to 4 10,123 9.3 6.5 7,015 8.9 6.3 +3,108
5 to 9 8,908 8.2 6.0 6,393 8.1 6.3 +2,515
10 to 14 7,975 7.3 5.9 6,001 7.6 6.4 +1,974
15 to 19 7,272 6.7 6.3 5,741 7.3 6.7 +1,531
20 to 24 7,288 6.7 7.5 5,484 6.9 7.4 +1,804
25 to 29 8,634 7.9 7.9 6,863 8.7 7.1 +1,771
30 to 34 10,131 9.3 7.5 7,601 9.6 7.7 +2,530
35 to 39 10,013 9.2 7.5 6,753 8.6 7.9 +3,260
40 to 44 8,508 7.8 7.5 5,694 7.2 7.5 +2,814
45 to 49 6,943 6.4 6.9 5,253 6.7 7.2 +1,690
50 to 54 6,140 5.6 6.4 5,038 6.4 6.4 +1,102
55 to 59 5,625 5.1 5.6 4,228 5.4 5.9 +1,397
60 to 64 4,548 4.2 5.1 2,361 3.0 4.5 +2,187
65 to 69 2,728 2.5 3.9 1,470 1.9 3.6 +1,258
70 to 74 1,735 1.6 3.0 1,089 1.4 3.0 +646
75 to 79 1,210 1.1 2.4 851 1.1 2.6 +359
80 to 84 826 0.8 2.0 617 0.8 2.0 +209
85 and over 651 0.6 1.8 457 0.6 1.6 +194
Total 109,258 100.0 100.0 78,909 100.0 100.0 +30,349
Source: Australian Bureau of Statistics, Census of Population and Housing 2006 and 2011. Compiled and presented in profile.id by.id, the population experts.
Page 9 of 80
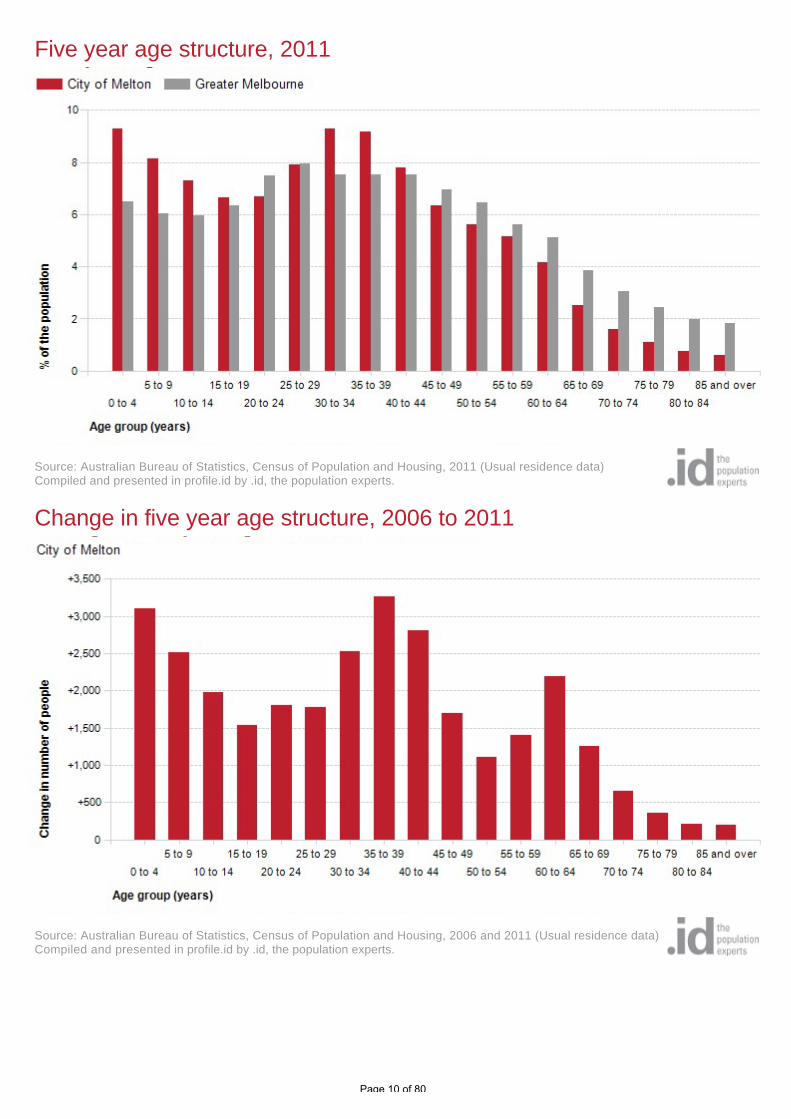
Five year age structure, 2011
Source: Australian Bureau of Statistics, Census of Population and Housing, 2011 (Usual residence data)Compiled and presented in profile.id by .id, the population experts.
Change in five year age structure, 2006 to 2011
Source: Australian Bureau of Statistics, Census of Population and Housing, 2006 and 2011 (Usual residence data)Compiled and presented in profile.id by .id, the population experts.
Page 10 of 80
Dominant groups
Analysis of the five year age groups of the City of Melton in 2011 compared to Greater Melbourne shows that there
was a higher proportion of people in the younger age groups (under 15) and a lower proportion of people in the older
age groups (65+).
Overall, 24.7% of the population was aged between 0 and 15, and 6.5% were aged 65 years and over, compared with
18.5% and 13.1% respectively for Greater Melbourne.
The major differences between the age structure of the City of Melton and Greater Melbourne were:
A larger percentage of persons aged 0 to 4 (9.3% compared to 6.5%)
A larger percentage of persons aged 5 to 9 (8.2% compared to 6.0%)
A larger percentage of persons aged 30 to 34 (9.3% compared to 7.5%)
A larger percentage of persons aged 35 to 39 (9.2% compared to 7.5%)
Emerging groups
From 2006 to 2011, City of Melton's population increased by 30,349 people (38.5%). This represents an average
annual population change of 6.72% per year over the period.
The largest changes in age structure in this area between 2006 and 2011 were in the age groups:
35 to 39 (+3,260 persons)
0 to 4 (+3,108 persons)
40 to 44 (+2,814 persons)
30 to 34 (+2,530 persons)
Page 11 of 80
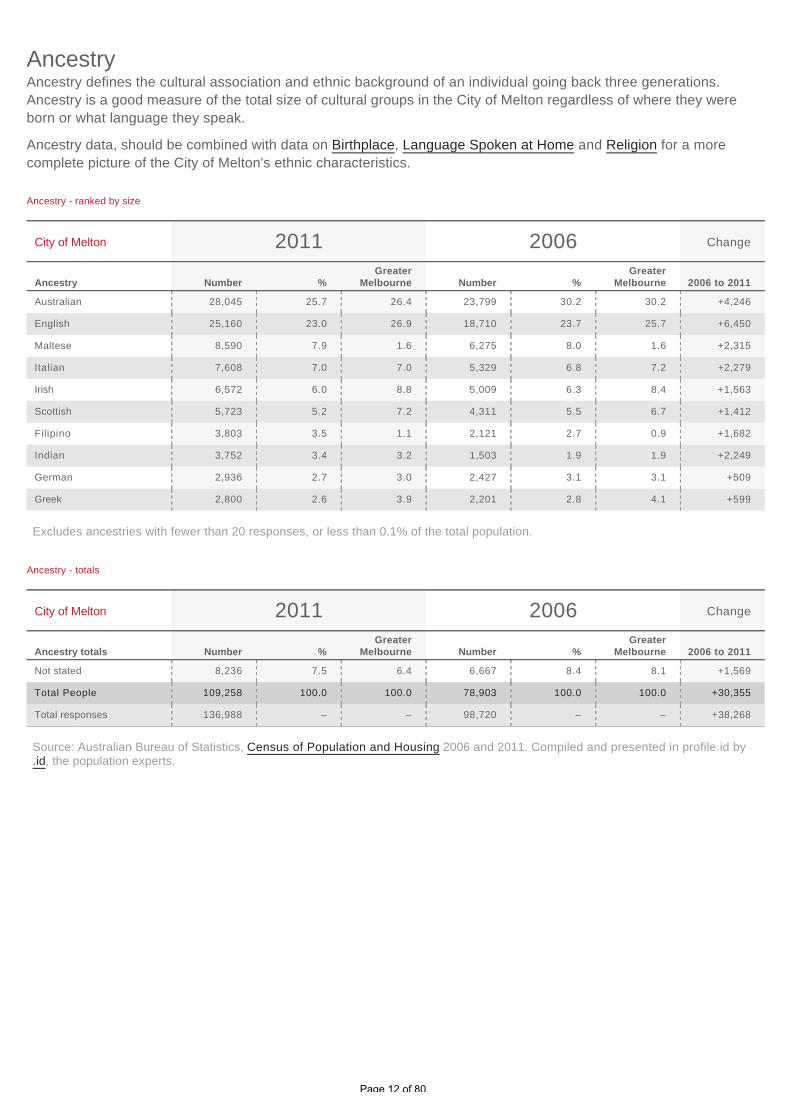
Ancestry defines the cultural association and ethnic background of an individual going back three generations.
Ancestry is a good measure of the total size of cultural groups in the City of Melton regardless of where they were
born or what language they speak.
Ancestry data, should be combined with data on Birthplace, Language Spoken at Home and Religion for a more
complete picture of the City of Melton's ethnic characteristics.
Ancestry
Ancestry - ranked by size
City of Melton 2011 2006 Change
Ancestry Number %Greater
Melbourne Number %Greater
Melbourne 2006 to 2011
Australian 28,045 25.7 26.4 23,799 30.2 30.2 +4,246
English 25,160 23.0 26.9 18,710 23.7 25.7 +6,450
Maltese 8,590 7.9 1.6 6,275 8.0 1.6 +2,315
Italian 7,608 7.0 7.0 5,329 6.8 7.2 +2,279
Irish 6,572 6.0 8.8 5,009 6.3 8.4 +1,563
Scottish 5,723 5.2 7.2 4,311 5.5 6.7 +1,412
Filipino 3,803 3.5 1.1 2,121 2.7 0.9 +1,682
Indian 3,752 3.4 3.2 1,503 1.9 1.9 +2,249
German 2,936 2.7 3.0 2,427 3.1 3.1 +509
Greek 2,800 2.6 3.9 2,201 2.8 4.1 +599
Excludes ancestries with fewer than 20 responses, or less than 0.1% of the total population.
Ancestry - totals
City of Melton 2011 2006 Change
Ancestry totals Number %Greater
Melbourne Number %Greater
Melbourne 2006 to 2011
Not stated 8,236 7.5 6.4 6,667 8.4 8.1 +1,569
Total People 109,258 100.0 100.0 78,903 100.0 100.0 +30,355
Total responses 136,988 -- -- 98,720 -- -- +38,268
Source: Australian Bureau of Statistics, Census of Population and Housing 2006 and 2011. Compiled and presented in profile.id by.id, the population experts.
Page 12 of 80

Ancestry, 2011
Source: Australian Bureau of Statistics, Census of Population and Housing, 2011 (Usual residence data)Compiled and presented in profile.id by .id, the population experts.
Change in ancestry, 2006 to 2011
Source: Australian Bureau of Statistics, Census of Population and Housing, 2006 and 2011 (Usual residence data)Compiled and presented in profile.id by .id, the population experts.
Page 13 of 80

Dominant groups
Analysis of the ancestry responses of the population in City of Melton in 2011 shows that the top five ancestries
nominated were:
Australian (28,045 people or 25.7%)
English (25,160 people or 23.0%)
Maltese (8,590 people or 7.9%)
Italian (7,608 people or 7.0%)
Irish (6,572 people or 6.0%)
In combination these five ancestries account for 75,975 responses in total, or 69.54% of all responses.
The major differences between the ancestries of the population in the City of Melton and Greater Melbourne were:
A larger percentage of people with Maltese ancestry (7.9% compared to 1.6%)
A larger percentage of people with Filipino ancestry (3.5% compared to 1.1%)
A larger percentage of people with Macedonian ancestry (2.5% compared to 1.0%)
A larger percentage of people with Croatian ancestry (2.0% compared to 0.9%)
Emerging groups
The largest changes in the reported ancestries of the population in this area between 2006 and 2011 were:
English (+6,450 persons)
Australian (+4,246 persons)
Maltese (+2,315 persons)
Italian (+2,279 persons)
Page 14 of 80
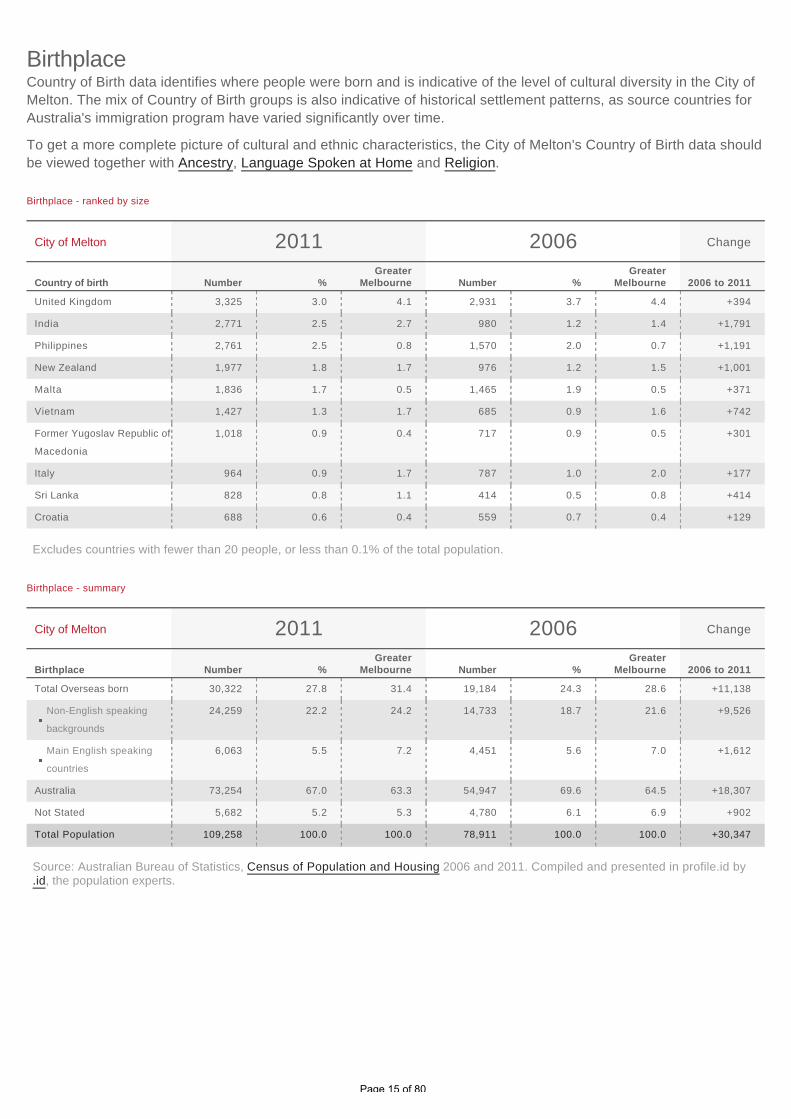
Country of Birth data identifies where people were born and is indicative of the level of cultural diversity in the City of
Melton. The mix of Country of Birth groups is also indicative of historical settlement patterns, as source countries for
Australia's immigration program have varied significantly over time.
To get a more complete picture of cultural and ethnic characteristics, the City of Melton's Country of Birth data should
be viewed together with Ancestry, Language Spoken at Home and Religion.
Birthplace
Birthplace - ranked by size
City of Melton 2011 2006 Change
Country of birth Number %Greater
Melbourne Number %Greater
Melbourne 2006 to 2011
United Kingdom 3,325 3.0 4.1 2,931 3.7 4.4 +394
India 2,771 2.5 2.7 980 1.2 1.4 +1,791
Philippines 2,761 2.5 0.8 1,570 2.0 0.7 +1,191
New Zealand 1,977 1.8 1.7 976 1.2 1.5 +1,001
Malta 1,836 1.7 0.5 1,465 1.9 0.5 +371
Vietnam 1,427 1.3 1.7 685 0.9 1.6 +742
Former Yugoslav Republic of
Macedonia
1,018 0.9 0.4 717 0.9 0.5 +301
Italy 964 0.9 1.7 787 1.0 2.0 +177
Sri Lanka 828 0.8 1.1 414 0.5 0.8 +414
Croatia 688 0.6 0.4 559 0.7 0.4 +129
Excludes countries with fewer than 20 people, or less than 0.1% of the total population.
Birthplace - summary
City of Melton 2011 2006 Change
Birthplace Number %Greater
Melbourne Number %Greater
Melbourne 2006 to 2011
Total Overseas born 30,322 27.8 31.4 19,184 24.3 28.6 +11,138
Non-English speaking
backgrounds
24,259 22.2 24.2 14,733 18.7 21.6 +9,526
Main English speaking
countries
6,063 5.5 7.2 4,451 5.6 7.0 +1,612
Australia 73,254 67.0 63.3 54,947 69.6 64.5 +18,307
Not Stated 5,682 5.2 5.3 4,780 6.1 6.9 +902
Total Population 109,258 100.0 100.0 78,911 100.0 100.0 +30,347
Source: Australian Bureau of Statistics, Census of Population and Housing 2006 and 2011. Compiled and presented in profile.id by.id, the population experts.
Page 15 of 80
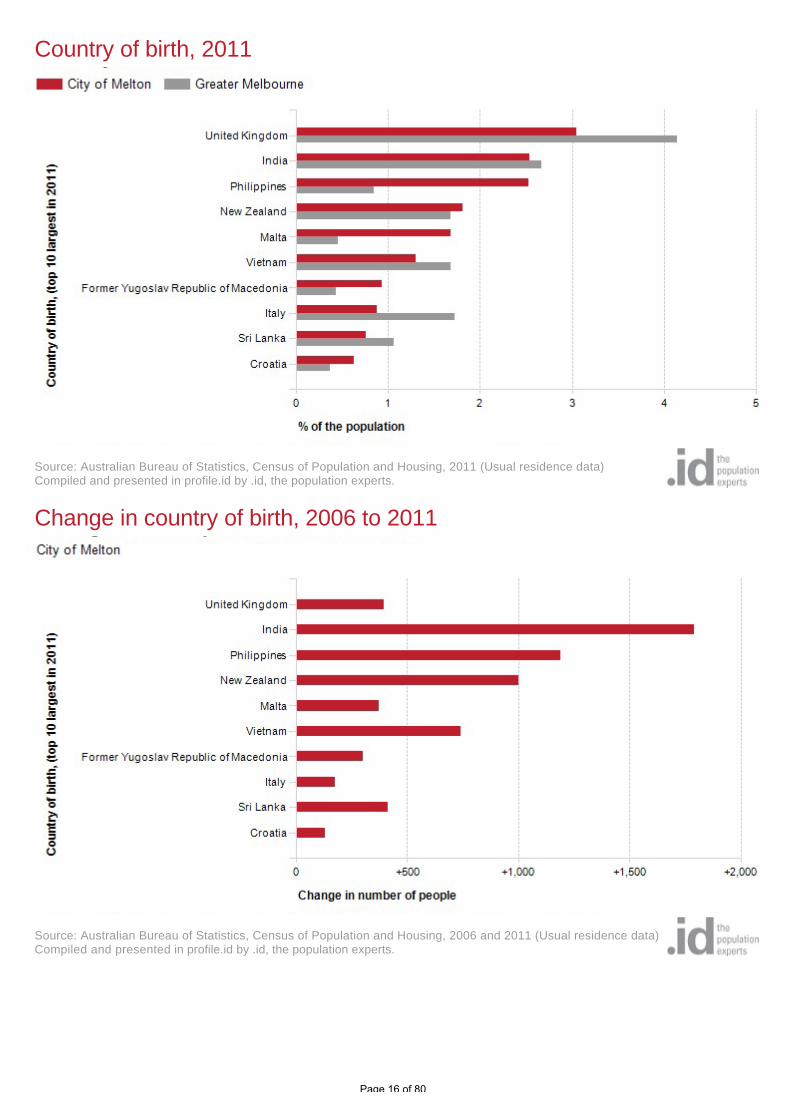
Country of birth, 2011
Source: Australian Bureau of Statistics, Census of Population and Housing, 2011 (Usual residence data)Compiled and presented in profile.id by .id, the population experts.
Change in country of birth, 2006 to 2011
Source: Australian Bureau of Statistics, Census of Population and Housing, 2006 and 2011 (Usual residence data)Compiled and presented in profile.id by .id, the population experts.
Page 16 of 80

Dominant groups
Analysis of the country of birth of the population in the City of Melton in 2011 compared to Greater Melbourne shows
that there was a smaller proportion of people born overseas, as well as a smaller proportion of people from a non-
English speaking background.
Overall, 27.8% of the population was born overseas, and 22.2% were from a non-English speaking background,
compared with 31.4% and 24.2% respectively for Greater Melbourne.
The major differences between the countries of birth of the population in the City of Melton and Greater Melbourne
were:
A larger percentage of people born in Philippines (2.5% compared to 0.8%)
A larger percentage of people born in Malta (1.7% compared to 0.5%)
A smaller percentage of people born in China (0.6% compared to 2.3%)
A smaller percentage of people born in United Kingdom (3.0% compared to 4.1%)
Emerging groups
Between 2006 and 2011, the number of people born overseas increased by 11,138 or 58.1%, and the number of
people from a non-English speaking background increased by 9,526 or 64.7%.
The largest changes in birthplace countries of the population in this area between 2006 and 2011 were for those
born in:
India (+1,791 persons)
Philippines (+1,191 persons)
New Zealand (+1,001 persons)
Vietnam (+742 persons)
Page 17 of 80
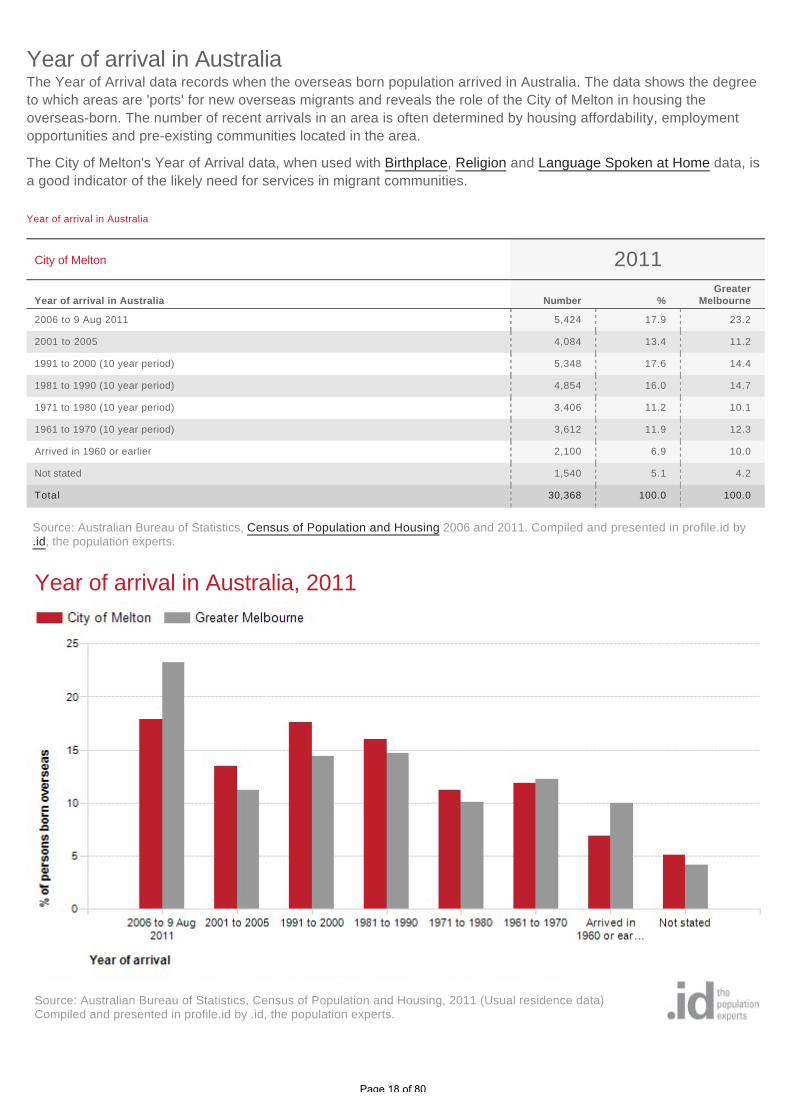
The Year of Arrival data records when the overseas born population arrived in Australia. The data shows the degree
to which areas are 'ports' for new overseas migrants and reveals the role of the City of Melton in housing the
overseas-born. The number of recent arrivals in an area is often determined by housing affordability, employment
opportunities and pre-existing communities located in the area.
The City of Melton's Year of Arrival data, when used with Birthplace, Religion and Language Spoken at Home data, is
a good indicator of the likely need for services in migrant communities.
Year of arrival in Australia
Year of arrival in Australia
City of Melton 2011
Year of arrival in Australia Number %Greater
Melbourne
2006 to 9 Aug 2011 5,424 17.9 23.2
2001 to 2005 4,084 13.4 11.2
1991 to 2000 (10 year period) 5,348 17.6 14.4
1981 to 1990 (10 year period) 4,854 16.0 14.7
1971 to 1980 (10 year period) 3,406 11.2 10.1
1961 to 1970 (10 year period) 3,612 11.9 12.3
Arrived in 1960 or earlier 2,100 6.9 10.0
Not stated 1,540 5.1 4.2
Total 30,368 100.0 100.0
Source: Australian Bureau of Statistics, Census of Population and Housing 2006 and 2011. Compiled and presented in profile.id by.id, the population experts.
Year of arrival in Australia, 2011
Source: Australian Bureau of Statistics, Census of Population and Housing, 2011 (Usual residence data)Compiled and presented in profile.id by .id, the population experts.
Page 18 of 80
Dominant groups
Analysis of the year of arrival for the overseas born population of the City of Melton in 2011 compared to Greater
Melbourne shows that there was a larger proportion of people who arrived before 2001, and a smaller proportion of
recent arrivals (those who arrived between 2006 and 2011).
Overall, 63.6% of the overseas born population arrived before 2001, and 17.9% arrived during or after 2006,
compared with 61.4% and 23.2% respectively for Greater Melbourne.
The major differences between the year of arrival data of the City of Melton and Greater Melbourne were:
A larger percentage of arrivals between 1991 and 2000 (17.6% compared to 14.4%)
A larger percentage of arrivals between 2001 and 2005 (13.4% compared to 11.2%)
A larger percentage of arrivals between 1981 and 1990 (16.0% compared to 14.7%)
A larger percentage of arrivals between 1971 and 1980 (11.2% compared to 10.1%)
Page 19 of 80

Proficiency in English measures the self-assessed proficiency in spoken English of people who speak a language
other than English at home. The data, when viewed with other ethnic and cultural indicators, such as Ancestry,
Country of Birth, Language Spoken at Home and Religion, reflects the City of Melton's ethnic composition and how
long the overseas born have been in Australia. This helps service providers determine whether they need to
communicate with the local population in languages other than English.
Proficiency in English
Proficiency in English
City of Melton 2011 2006 Change
English proficiency Number %Greater
Melbourne Number %Greater
Melbourne 2006 to 2011
Speaks English only 71,892 65.8 66.3 55,405 70.2 68.5 +16,487
Speaks another language,
and English well or very well
27,797 25.4 24.0 16,753 21.2 21.1 +11,044
Speaks another language,
and English not well or not
at all
3,802 3.5 5.0 2,332 3.0 4.9 +1,470
Not Stated 5,766 5.3 4.6 4,421 5.6 5.6 +1,345
Total population 109,257 100.0 100.0 78,911 100.0 100.0 +30,346
Source: Australian Bureau of Statistics, Census of Population and Housing 2006 and 2011. Compiled and presented in profile.id by.id, the population experts.
Proficiency in English, 2011
Source: Australian Bureau of Statistics, Census of Population and Housing, 2011 (Usual residence data)Compiled and presented in profile.id by .id, the population experts.
Page 20 of 80

Dominant groups
Analysis of the proficiency in English data for the City of Melton in 2011 compared to Greater Melbourne shows that
there was a lower proportion of persons who spoke English only, as well as a lower proportion of persons who spoke
another language and English not well or not at all.
Overall, 65.8% of persons spoke English only, and 3.5% spoke another language and English not well or not at all,
compared with 66.3% and 5.0% respectively for Greater Melbourne.
Emerging groups
The most significant changes in the proficiency in English of the population in this area between 2006 and 2011 were
in those speaking:
Speaks English only (+16,487 persons)
Speaks another language, and English well or very well (+11,044 persons)
Speaks another language, and English not well or not at all (+1,470 persons)
Change in proficiency in English, 2006 to 2011
Source: Australian Bureau of Statistics, Census of Population and Housing, 2006 and 2011 (Usual residence data)Compiled and presented in profile.id by .id, the population experts.
Page 21 of 80
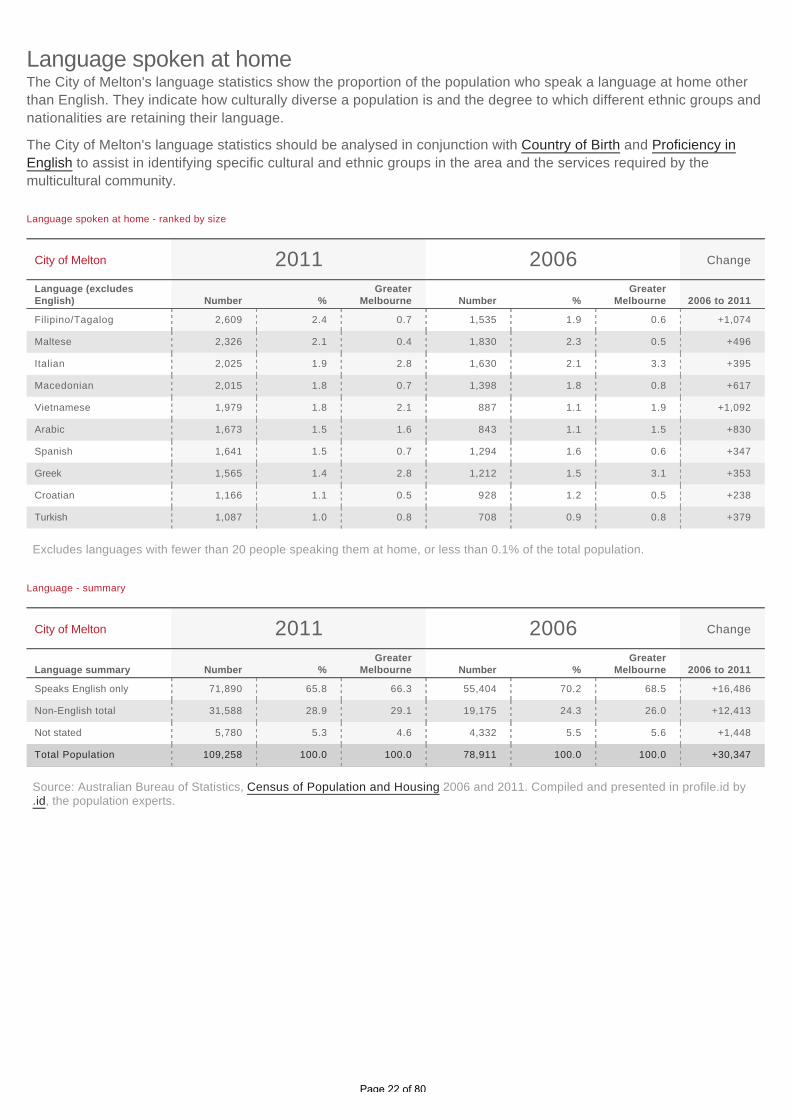
The City of Melton's language statistics show the proportion of the population who speak a language at home other
than English. They indicate how culturally diverse a population is and the degree to which different ethnic groups and
nationalities are retaining their language.
The City of Melton's language statistics should be analysed in conjunction with Country of Birth and Proficiency in
English to assist in identifying specific cultural and ethnic groups in the area and the services required by the
multicultural community.
Language spoken at home
Language spoken at home - ranked by size
City of Melton 2011 2006 Change
Language (excludesEnglish) Number %
GreaterMelbourne Number %
GreaterMelbourne 2006 to 2011
Filipino/Tagalog 2,609 2.4 0.7 1,535 1.9 0.6 +1,074
Maltese 2,326 2.1 0.4 1,830 2.3 0.5 +496
Italian 2,025 1.9 2.8 1,630 2.1 3.3 +395
Macedonian 2,015 1.8 0.7 1,398 1.8 0.8 +617
Vietnamese 1,979 1.8 2.1 887 1.1 1.9 +1,092
Arabic 1,673 1.5 1.6 843 1.1 1.5 +830
Spanish 1,641 1.5 0.7 1,294 1.6 0.6 +347
Greek 1,565 1.4 2.8 1,212 1.5 3.1 +353
Croatian 1,166 1.1 0.5 928 1.2 0.5 +238
Turkish 1,087 1.0 0.8 708 0.9 0.8 +379
Excludes languages with fewer than 20 people speaking them at home, or less than 0.1% of the total population.
Language - summary
City of Melton 2011 2006 Change
Language summary Number %Greater
Melbourne Number %Greater
Melbourne 2006 to 2011
Speaks English only 71,890 65.8 66.3 55,404 70.2 68.5 +16,486
Non-English total 31,588 28.9 29.1 19,175 24.3 26.0 +12,413
Not stated 5,780 5.3 4.6 4,332 5.5 5.6 +1,448
Total Population 109,258 100.0 100.0 78,911 100.0 100.0 +30,347
Source: Australian Bureau of Statistics, Census of Population and Housing 2006 and 2011. Compiled and presented in profile.id by.id, the population experts.
Page 22 of 80

Language spoken at home, 2011
Source: Australian Bureau of Statistics, Census of Population and Housing, 2011 (Usual residence data)Compiled and presented in profile.id by .id, the population experts.
Change in language spoken at home, 2006 to 2011
Source: Australian Bureau of Statistics, Census of Population and Housing, 2006 and 2011 (Usual residence data)Compiled and presented in profile.id by .id, the population experts.
Page 23 of 80

Dominant groups
Analysis of the language spoken at home by the population of the City of Melton in 2011 compared to Greater
Melbourne shows that there was a smaller proportion of people who spoke English only, and a similar proportion of
those speaking a non-English language (either exclusively, or in addition to English).
Overall, 65.8% of the population spoke English only, and 28.9% spoke a non-English language, compared with 66.3%
and 29.1% respectively for Greater Melbourne.
The dominant language spoken at home, other than English, in the City of Melton was Filipino/Tagalog, with 2.4% of
the population, or 2,609 people speaking this language at home.
The major differences between the languages spoken at home for the population of the City of Melton and Greater
Melbourne in 2011 were:
A larger percentage speaking Maltese at home (2.1% compared to 0.4%)
A larger percentage speaking Filipino/Tagalog at home (2.4% compared to 0.7%)
A larger percentage speaking Macedonian at home (1.8% compared to 0.7%)
A smaller percentage speaking Mandarin at home (0.7% compared to 2.5%)
Emerging groups
Between 2006 and 2011, the number of people who spoke a language other than English at home increased by
12,413 or 64.7%, and the number of people who spoke English only increased by 16,486 or 29.8%.
The largest changes in the spoken languages of the population in the City of Melton between 2006 and 2011 were for
those speaking:
Vietnamese (+1,092 persons)
Filipino/Tagalog (+1,074 persons)
Arabic (+830 persons)
Punjabi (+675 persons)
Page 24 of 80
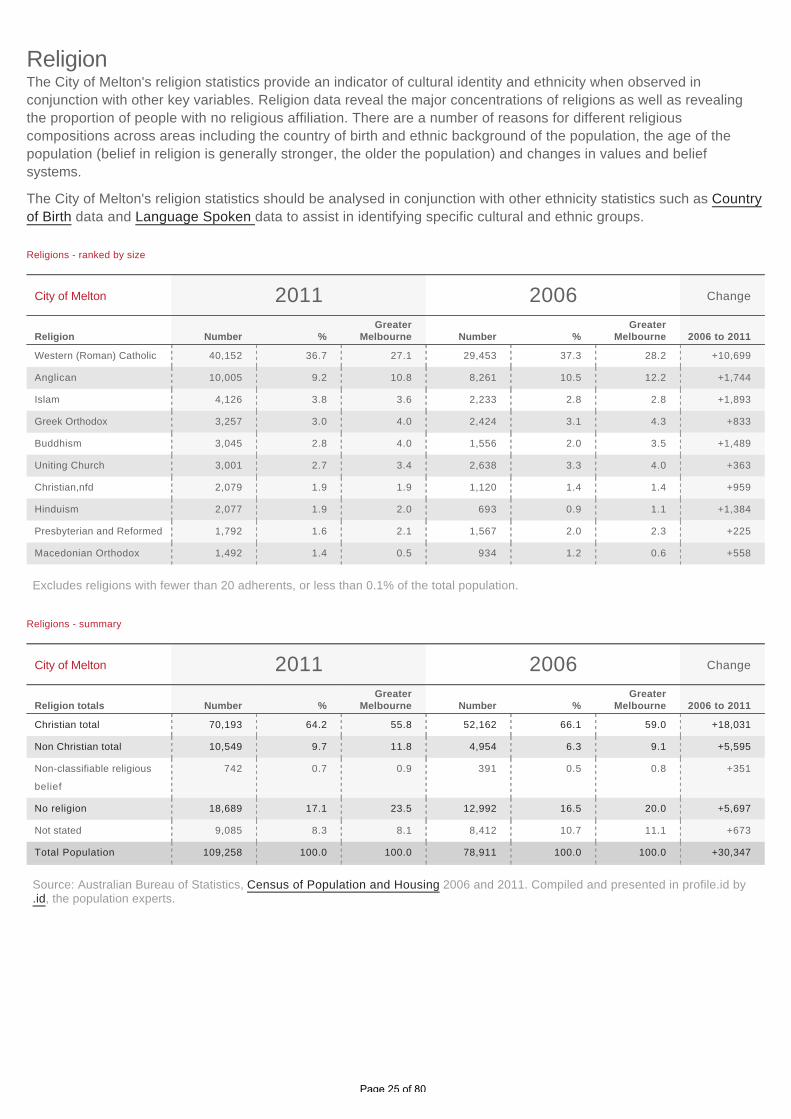
The City of Melton's religion statistics provide an indicator of cultural identity and ethnicity when observed in
conjunction with other key variables. Religion data reveal the major concentrations of religions as well as revealing
the proportion of people with no religious affiliation. There are a number of reasons for different religious
compositions across areas including the country of birth and ethnic background of the population, the age of the
population (belief in religion is generally stronger, the older the population) and changes in values and belief
systems.
The City of Melton's religion statistics should be analysed in conjunction with other ethnicity statistics such as Country
of Birth data and Language Spoken data to assist in identifying specific cultural and ethnic groups.
Religion
Religions - ranked by size
City of Melton 2011 2006 Change
Religion Number %Greater
Melbourne Number %Greater
Melbourne 2006 to 2011
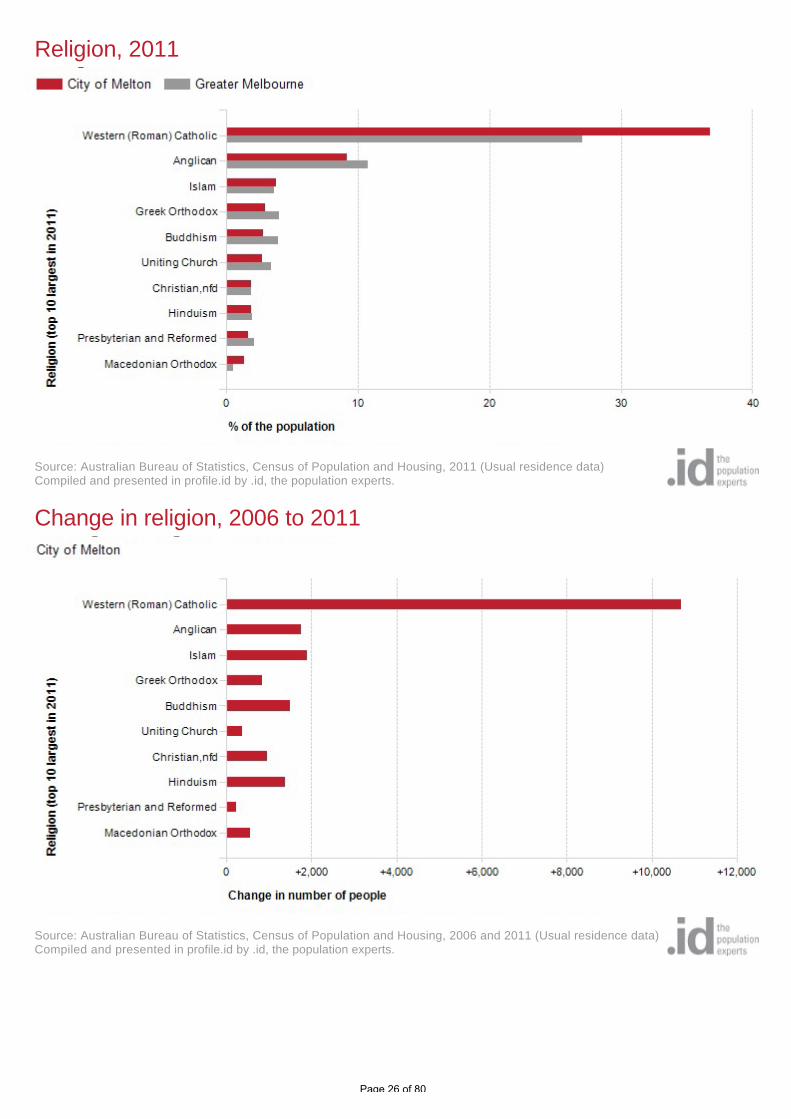
Western (Roman) Catholic 40,152 36.7 27.1 29,453 37.3 28.2 +10,699
Anglican 10,005 9.2 10.8 8,261 10.5 12.2 +1,744
Islam 4,126 3.8 3.6 2,233 2.8 2.8 +1,893
Greek Orthodox 3,257 3.0 4.0 2,424 3.1 4.3 +833
Buddhism 3,045 2.8 4.0 1,556 2.0 3.5 +1,489
Uniting Church 3,001 2.7 3.4 2,638 3.3 4.0 +363
Christian,nfd 2,079 1.9 1.9 1,120 1.4 1.4 +959
Hinduism 2,077 1.9 2.0 693 0.9 1.1 +1,384
Presbyterian and Reformed 1,792 1.6 2.1 1,567 2.0 2.3 +225
Macedonian Orthodox 1,492 1.4 0.5 934 1.2 0.6 +558
Excludes religions with fewer than 20 adherents, or less than 0.1% of the total population.
Religions - summary
City of Melton 2011 2006 Change
Religion totals Number %Greater
Melbourne Number %Greater
Melbourne 2006 to 2011
Christian total 70,193 64.2 55.8 52,162 66.1 59.0 +18,031
Non Christian total 10,549 9.7 11.8 4,954 6.3 9.1 +5,595
Non-classifiable religious
belief
742 0.7 0.9 391 0.5 0.8 +351
No religion 18,689 17.1 23.5 12,992 16.5 20.0 +5,697
Not stated 9,085 8.3 8.1 8,412 10.7 11.1 +673
Total Population 109,258 100.0 100.0 78,911 100.0 100.0 +30,347
Source: Australian Bureau of Statistics, Census of Population and Housing 2006 and 2011. Compiled and presented in profile.id by.id, the population experts.
Page 25 of 80
Religion, 2011
Source: Australian Bureau of Statistics, Census of Population and Housing, 2011 (Usual residence data)Compiled and presented in profile.id by .id, the population experts.
Change in religion, 2006 to 2011
Source: Australian Bureau of Statistics, Census of Population and Housing, 2006 and 2011 (Usual residence data)Compiled and presented in profile.id by .id, the population experts.
Page 26 of 80

Dominant groups
Analysis of the religious affiliation of the population of the City of Melton in 2011 compared to Greater Melbourne
shows that there was a higher proportion of people who professed a religion and a lower proportion who stated they
had no religion.
Overall, 73.9% of the population nominated a religion, and 17.1% said they had no religion, compared with 67.6%
and 23.5% respectively for Greater Melbourne.
The largest single religion in the City of Melton was Western (Roman) Catholic, with 36.7% of the population or
40,152 people as adherents.
The major differences between the religious affiliation for the population of the City of Melton and Greater Melbourne
were:
A larger percentage who nominated Western (Roman) Catholic (36.7% compared to 27.1%)
A smaller percentage who nominated Anglican (9.2% compared to 10.8%)
A smaller percentage who nominated Buddhism (2.8% compared to 4.0%)
A smaller percentage who nominated Greek Orthodox (3.0% compared to 4.0%)
Emerging groups
The largest changes in the religious affiliation of the population in the City of Melton between 2006 and 2011 were for
those who nominated:
Western (Roman) Catholic (+10,699 persons)
Islam (+1,893 persons)
Anglican (+1,744 persons)
Buddhism (+1,489 persons)
Page 27 of 80

Educational Qualifications relate to education outside of primary and secondary school and are one of the most
important indicators of socio-economic status. With other data sources, such as Employment Status, Income and
Occupation, the City of Melton's Educational Qualifications help to evaluate the economic opportunities and socio-
economic status of the area and identify skill gaps in the labour market.
Qualifications
Highest qualification achieved
City of Melton 2011 2006 Change
Qualification level Number %Greater
Melbourne Number %Greater
Melbourne 2006 to 2011
Bachelor or Higher degree 11,107 13.5 23.6 6,184 10.4 19.6 +4,923
Advanced Diploma or
Diploma
6,099 7.4 8.8 3,701 6.2 7.7 +2,398
Vocational 16,197 19.7 15.0 11,222 18.9 14.2 +4,975
No qualification 39,585 48.1 42.4 30,804 51.8 45.8 +8,781
Not stated 9,272 11.3 10.3 7,589 12.8 12.8 +1,683
Total persons aged 15+ 82,260 100.0 100.0 59,500 100.0 100.0 +22,760
Source: Australian Bureau of Statistics, Census of Population and Housing 2006 and 2011. Compiled and presented in profile.id by.id, the population experts.
Highest qualification achieved, 2011
Source: Australian Bureau of Statistics, Census of Population and Housing, 2011 (Usual residence data)Compiled and presented in profile.id by .id, the population experts.
Page 28 of 80
Dominant groups
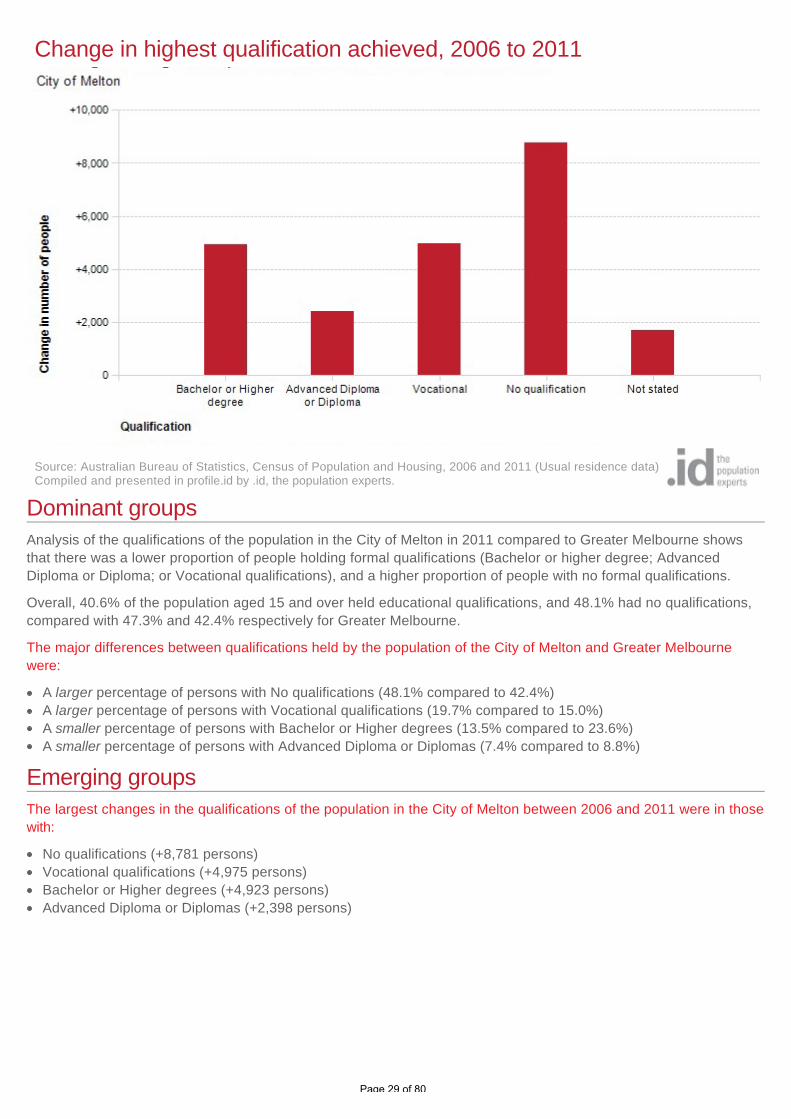
Analysis of the qualifications of the population in the City of Melton in 2011 compared to Greater Melbourne shows
that there was a lower proportion of people holding formal qualifications (Bachelor or higher degree; Advanced
Diploma or Diploma; or Vocational qualifications), and a higher proportion of people with no formal qualifications.
Overall, 40.6% of the population aged 15 and over held educational qualifications, and 48.1% had no qualifications,
compared with 47.3% and 42.4% respectively for Greater Melbourne.
The major differences between qualifications held by the population of the City of Melton and Greater Melbourne
were:
A larger percentage of persons with No qualifications (48.1% compared to 42.4%)
A larger percentage of persons with Vocational qualifications (19.7% compared to 15.0%)
A smaller percentage of persons with Bachelor or Higher degrees (13.5% compared to 23.6%)
A smaller percentage of persons with Advanced Diploma or Diplomas (7.4% compared to 8.8%)
Emerging groups
The largest changes in the qualifications of the population in the City of Melton between 2006 and 2011 were in those
with:
No qualifications (+8,781 persons)
Vocational qualifications (+4,975 persons)
Bachelor or Higher degrees (+4,923 persons)
Advanced Diploma or Diplomas (+2,398 persons)
Change in highest qualification achieved, 2006 to 2011
Source: Australian Bureau of Statistics, Census of Population and Housing, 2006 and 2011 (Usual residence data)Compiled and presented in profile.id by .id, the population experts.
Page 29 of 80
The City of Melton's school completion data is a useful indicator of socio-economic status. With other indicators, such
as Proficiency in English, the data informs planners and decision-makers about people's ability to access services.
Combined with Educational Qualifications it also allows assessment of the skill base of the population.
Highest level of schooling
Highest level of secondary schooling completed
City of Melton 2011 2006 Change
Level of schooling Number %Greater
Melbourne Number %Greater
Melbourne 2006 to 2011
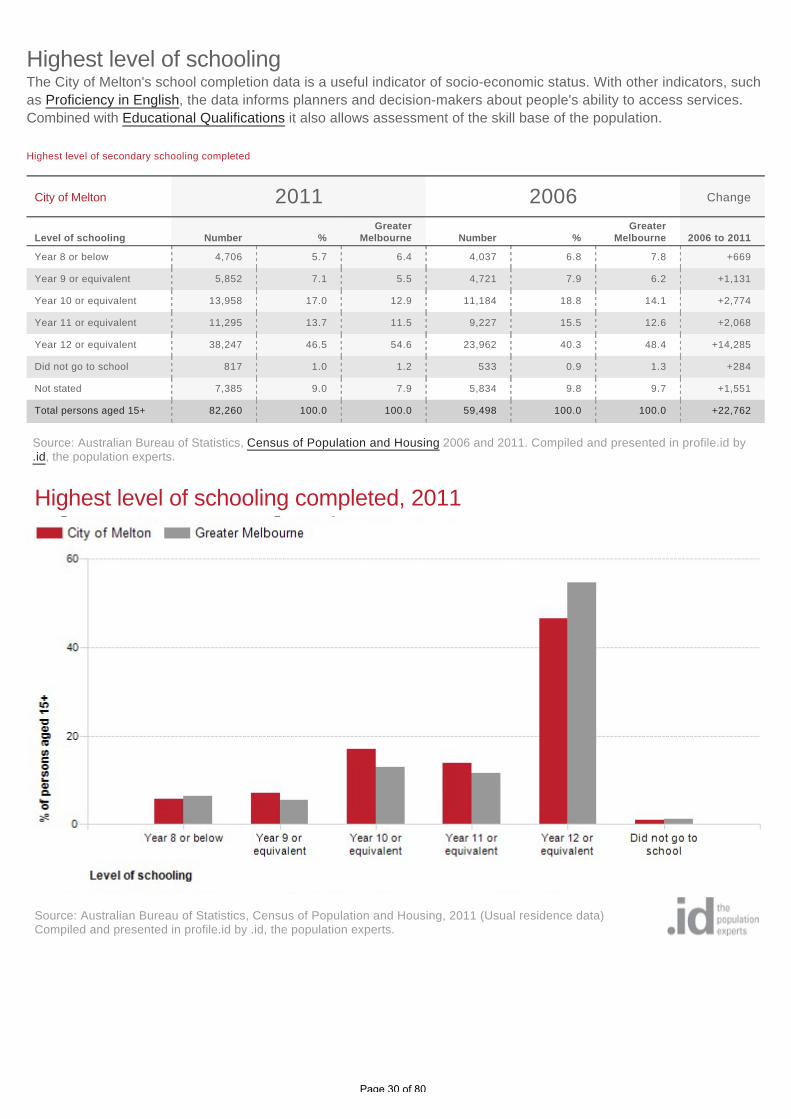
Year 8 or below 4,706 5.7 6.4 4,037 6.8 7.8 +669
Year 9 or equivalent 5,852 7.1 5.5 4,721 7.9 6.2 +1,131
Year 10 or equivalent 13,958 17.0 12.9 11,184 18.8 14.1 +2,774
Year 11 or equivalent 11,295 13.7 11.5 9,227 15.5 12.6 +2,068
Year 12 or equivalent 38,247 46.5 54.6 23,962 40.3 48.4 +14,285
Did not go to school 817 1.0 1.2 533 0.9 1.3 +284
Not stated 7,385 9.0 7.9 5,834 9.8 9.7 +1,551
Total persons aged 15+ 82,260 100.0 100.0 59,498 100.0 100.0 +22,762
Source: Australian Bureau of Statistics, Census of Population and Housing 2006 and 2011. Compiled and presented in profile.id by.id, the population experts.
Highest level of schooling completed, 2011
Source: Australian Bureau of Statistics, Census of Population and Housing, 2011 (Usual residence data)Compiled and presented in profile.id by .id, the population experts.
Page 30 of 80
Dominant groups
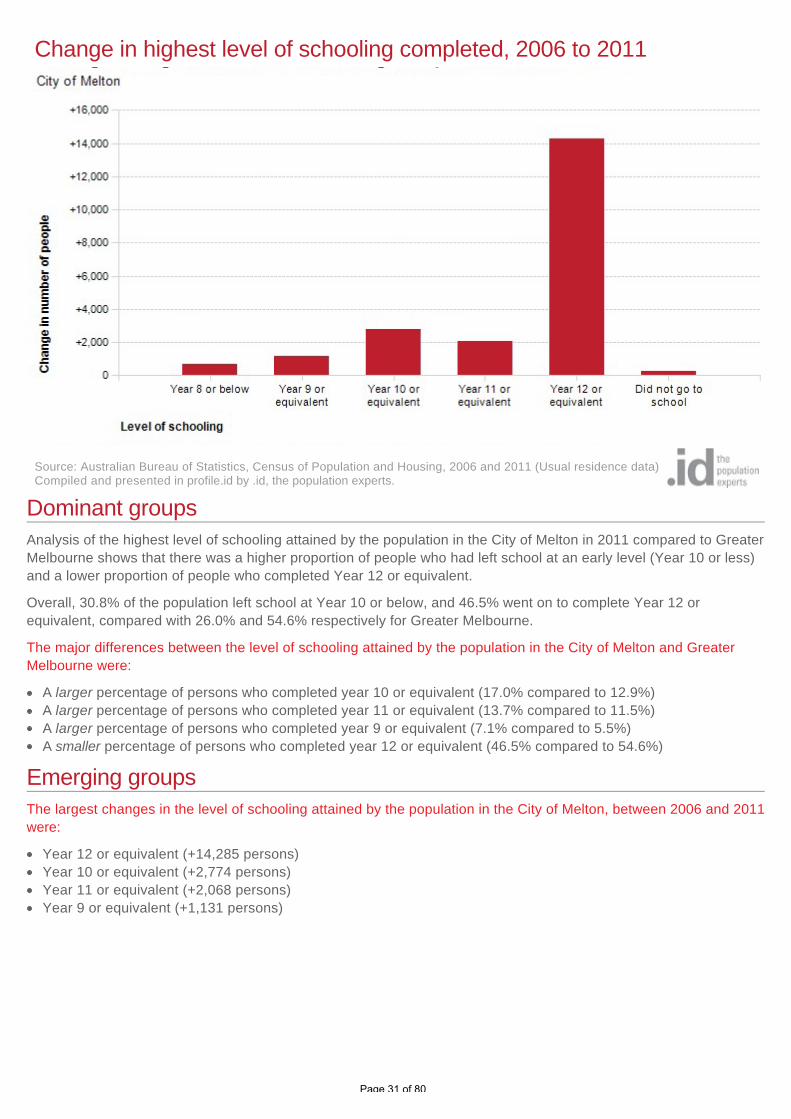
Analysis of the highest level of schooling attained by the population in the City of Melton in 2011 compared to Greater
Melbourne shows that there was a higher proportion of people who had left school at an early level (Year 10 or less)
and a lower proportion of people who completed Year 12 or equivalent.
Overall, 30.8% of the population left school at Year 10 or below, and 46.5% went on to complete Year 12 or
equivalent, compared with 26.0% and 54.6% respectively for Greater Melbourne.
The major differences between the level of schooling attained by the population in the City of Melton and Greater
Melbourne were:
A larger percentage of persons who completed year 10 or equivalent (17.0% compared to 12.9%)
A larger percentage of persons who completed year 11 or equivalent (13.7% compared to 11.5%)
A larger percentage of persons who completed year 9 or equivalent (7.1% compared to 5.5%)
A smaller percentage of persons who completed year 12 or equivalent (46.5% compared to 54.6%)
Emerging groups
The largest changes in the level of schooling attained by the population in the City of Melton, between 2006 and 2011
were:
Year 12 or equivalent (+14,285 persons)
Year 10 or equivalent (+2,774 persons)
Year 11 or equivalent (+2,068 persons)
Year 9 or equivalent (+1,131 persons)
Change in highest level of schooling completed, 2006 to 2011
Source: Australian Bureau of Statistics, Census of Population and Housing, 2006 and 2011 (Usual residence data)Compiled and presented in profile.id by .id, the population experts.
Page 31 of 80
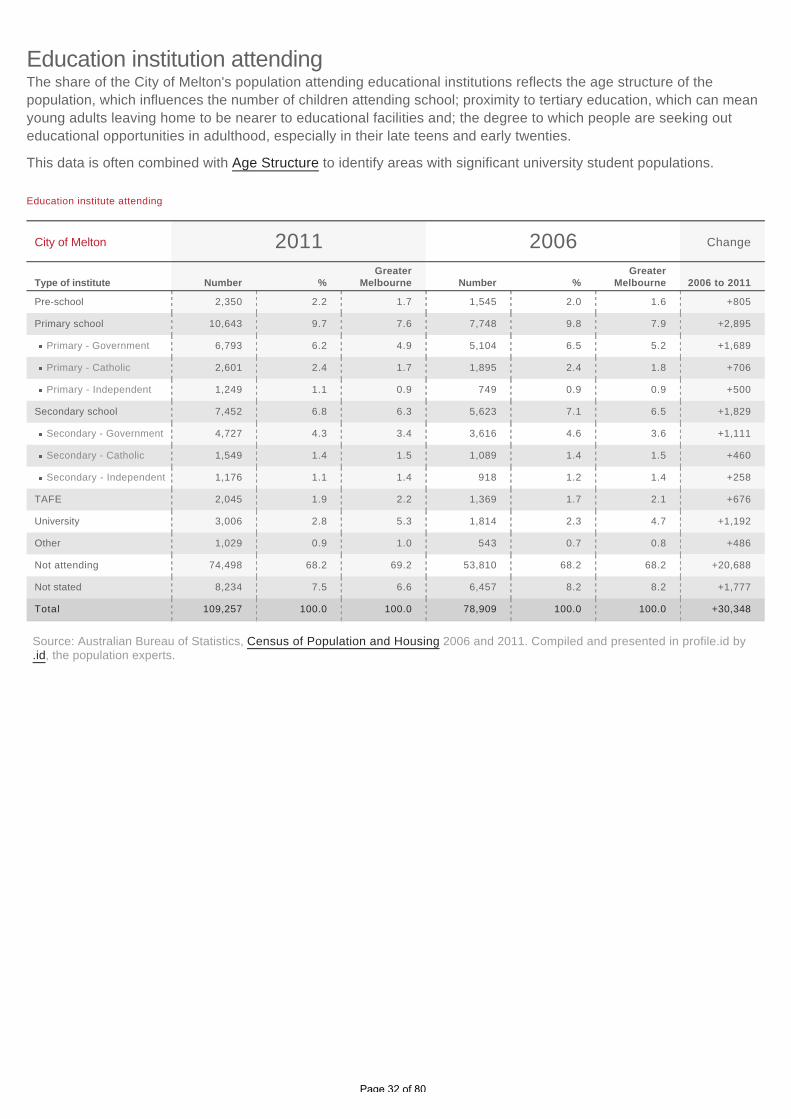
The share of the City of Melton's population attending educational institutions reflects the age structure of the
population, which influences the number of children attending school; proximity to tertiary education, which can mean
young adults leaving home to be nearer to educational facilities and; the degree to which people are seeking out
educational opportunities in adulthood, especially in their late teens and early twenties.
This data is often combined with Age Structure to identify areas with significant university student populations.
Education institution attending
Education institute attending
City of Melton 2011 2006 Change
Type of institute Number %Greater
Melbourne Number %Greater
Melbourne 2006 to 2011
Pre-school 2,350 2.2 1.7 1,545 2.0 1.6 +805
Primary school 10,643 9.7 7.6 7,748 9.8 7.9 +2,895
Primary - Government 6,793 6.2 4.9 5,104 6.5 5.2 +1,689
Primary - Catholic 2,601 2.4 1.7 1,895 2.4 1.8 +706
Primary - Independent 1,249 1.1 0.9 749 0.9 0.9 +500
Secondary school 7,452 6.8 6.3 5,623 7.1 6.5 +1,829
Secondary - Government 4,727 4.3 3.4 3,616 4.6 3.6 +1,111
Secondary - Catholic 1,549 1.4 1.5 1,089 1.4 1.5 +460
Secondary - Independent 1,176 1.1 1.4 918 1.2 1.4 +258
TAFE 2,045 1.9 2.2 1,369 1.7 2.1 +676
University 3,006 2.8 5.3 1,814 2.3 4.7 +1,192
Other 1,029 0.9 1.0 543 0.7 0.8 +486
Not attending 74,498 68.2 69.2 53,810 68.2 68.2 +20,688
Not stated 8,234 7.5 6.6 6,457 8.2 8.2 +1,777
Total 109,257 100.0 100.0 78,909 100.0 100.0 +30,348
Source: Australian Bureau of Statistics, Census of Population and Housing 2006 and 2011. Compiled and presented in profile.id by.id, the population experts.
Page 32 of 80

Education institute attending, 2011
Source: Australian Bureau of Statistics, Census of Population and Housing, 2011 (Usual residence data)Compiled and presented in profile.id by .id, the population experts.
Change in education institute attending, 2006 to 2011
Source: Australian Bureau of Statistics, Census of Population and Housing, 2006 and 2011 (Usual residence data)Compiled and presented in profile.id by .id, the population experts.
Page 33 of 80

Dominant groups
Analysis of the share of the population attending educational institutions in the City of Melton in 2011 compared to
Greater Melbourne shows that there was a higher proportion attending primary school, a higher proportion attending
secondary school, and a lower proportion engaged in tertiary level education.
Overall, 9.7% of the population were attending primary school, 6.8% of the population were attending secondary
institutions, and 4.6% were learning at a tertiary level, compared with 7.6%, 6.3% and 7.6% respectively for Greater
Melbourne.
The major differences between the share of the population attending learning institutions in the City of Melton and
Greater Melbourne were:
A larger percentage of persons attending a Government primary school (9.7% compared to 7.6%)
A larger percentage of persons attending a Catholic primary school (6.2% compared to 4.9%)
A smaller percentage of persons attending University (2.8% compared to 5.3%)
A smaller percentage of persons not attending (68.2% compared to 69.2%)
Emerging groups
From 2006 to 2011, City of Melton's population aged 15 years and over increased by 30,348 people (+38.5%). This
represents an average annual change of 6.72% per year over the period.
The largest changes in the number of people attending education institutions in the City of Melton, between 2006 and
2011 were in those who nominated:
Primary school (+2,895 persons)
Secondary school (+1,829 persons)
Primary - Government (+1,689 persons)
University (+1,192 persons)
Page 34 of 80

The City of Melton's disability statistics relate directly to need for assistance due to a severe or profound disability.
The information may be used in the planning of local facilities, services such as day-care and occasional care and in
the provision of information and support to carers. The City of Melton's disability statistics help in understanding the
prevalence of people who need support in the community, and along with information on Unpaid Care to a person with
a disability, how that support is provided.
Please note: A person's reported need for assistance is based on a subjective assessment and should therefore be
treated with caution. See the specific data notes for further detail.
Need for assistance
Need for assistance with core activities
City of Melton 2011 2006 Change
Assistance needed by agegroup (years) Number
% of total agegroup
GreaterMelbourne Number
% of total agegroup
GreaterMelbourne 2006 to 2011
0 to 4 89 0.9 1.0 86 1.2 0.8 +3
5 to 9 279 3.1 2.5 155 2.4 2.0 +124
10 to 19 425 2.8 2.0 295 2.5 1.5 +130
20 to 59 1,577 2.5 2.0 968 2.1 1.8 +609
60 to 64 488 10.7 6.1 218 9.2 5.6 +270
65 to 69 345 12.7 7.8 157 10.7 6.9 +188
70 to 74 297 17.1 11.6 143 13.1 10.7 +154
75 to 79 286 23.6 18.7 226 26.5 16.9 +60
80 to 84 322 39.0 28.9 220 35.5 27.9 +102
85 and over 380 58.3 48.4 241 53.4 46.9 +139
Total persons needing
assistance
4,488 4.1 4.5 2,709 3.4 4.0 +1,779
Need for assistance with core activities
City of Melton 2011 2006 Change
Assistance needed by agegroup (years) Number %
GreaterMelbourne Number %
GreaterMelbourne 2006 to 2011
Total persons needing
assistance
4,488 4.1 4.5 2,709 3.4 4.0 +1,779
Total persons not needing
assistance
98,241 89.9 90.3 71,296 90.3 89.7 +26,945
Not stated 6,529 6.0 5.2 4,907 6.2 6.3 +1,622
Total population 109,258 100.0 100.0 78,912 100.0 100.0 +30,346
Source: Australian Bureau of Statistics, Census of Population and Housing 2006 and 2011. Compiled and presented in profile.id by.id, the population experts.
Page 35 of 80

Need for assistance with core activities, 2011
Source: Australian Bureau of Statistics, Census of Population and Housing, 2011 (Usual residence data)Compiled and presented in profile.id by .id, the population experts.
Change in need for assistance with core activities, 2006 to 2011
Source: Australian Bureau of Statistics, Census of Population and Housing, 2006 and 2011 (Usual residence data)Compiled and presented in profile.id by .id, the population experts.
Page 36 of 80

Dominant groups
Analysis of the need for assistance of persons in the City of Melton compared to Greater Melbourne shows that there
was a similar proportion of persons who reported needing assistance with core activities.
Overall, 4.1% of the population reported needing assistance with core activities, compared with 4.5% for Greater
Melbourne.
The major differences in the age groups reporting a need for assistance in the City of Melton and Greater Melbourne
were:
A larger percentage of persons aged 80 to 84 (39.0% compared to 28.9%)
A larger percentage of persons aged 85 and over (58.3% compared to 48.4%)
A larger percentage of persons aged 70 to 74 (17.1% compared to 11.6%)
A larger percentage of persons aged 75 to 79 (23.6% compared to 18.7%)
Emerging groups
The major differences in the age groups reporting a need for assistance between 2006 and 2011 in the City of Melton
were in the age groups:
20 to 59 (+609 persons)
60 to 64 (+270 persons)
65 to 69 (+188 persons)
70 to 74 (+154 persons)
Page 37 of 80
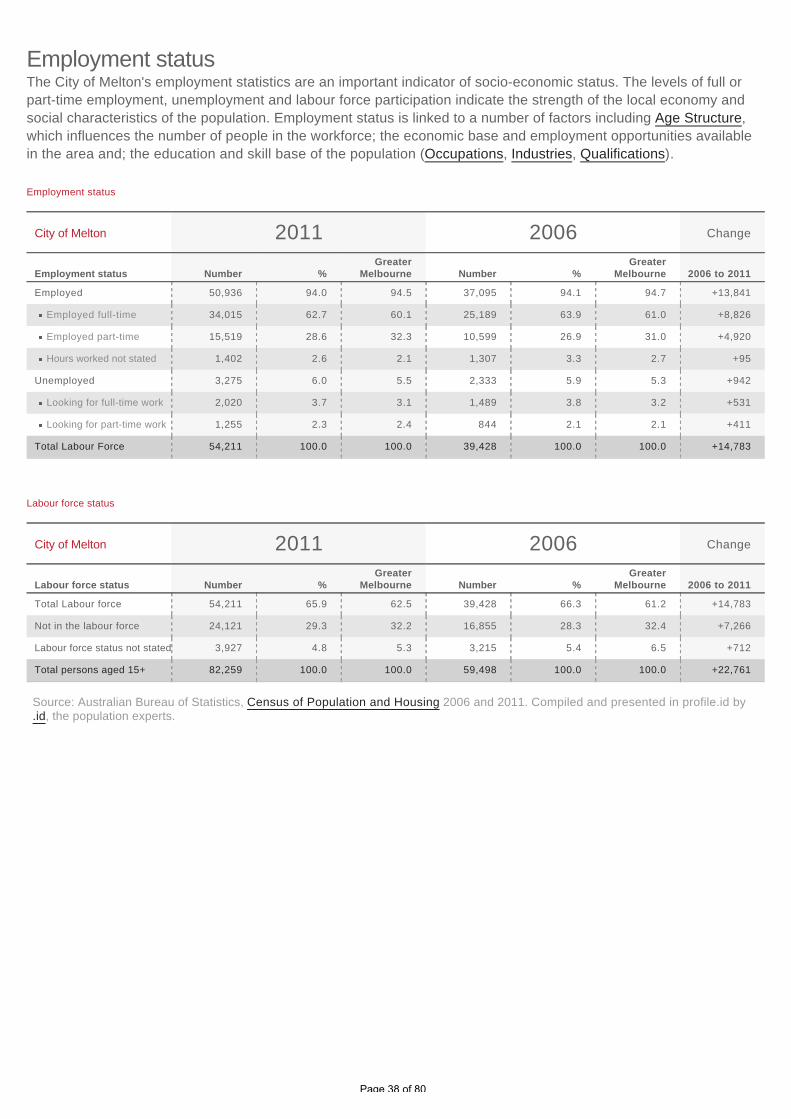
The City of Melton's employment statistics are an important indicator of socio-economic status. The levels of full or
part-time employment, unemployment and labour force participation indicate the strength of the local economy and
social characteristics of the population. Employment status is linked to a number of factors including Age Structure,
which influences the number of people in the workforce; the economic base and employment opportunities available
in the area and; the education and skill base of the population (Occupations, Industries, Qualifications).
Employment status
Employment status
City of Melton 2011 2006 Change
Employment status Number %Greater
Melbourne Number %Greater
Melbourne 2006 to 2011
Employed 50,936 94.0 94.5 37,095 94.1 94.7 +13,841
Employed full-time 34,015 62.7 60.1 25,189 63.9 61.0 +8,826
Employed part-time 15,519 28.6 32.3 10,599 26.9 31.0 +4,920
Hours worked not stated 1,402 2.6 2.1 1,307 3.3 2.7 +95
Unemployed 3,275 6.0 5.5 2,333 5.9 5.3 +942
Looking for full-time work 2,020 3.7 3.1 1,489 3.8 3.2 +531
Looking for part-time work 1,255 2.3 2.4 844 2.1 2.1 +411
Total Labour Force 54,211 100.0 100.0 39,428 100.0 100.0 +14,783
Labour force status
City of Melton 2011 2006 Change
Labour force status Number %Greater
Melbourne Number %Greater
Melbourne 2006 to 2011
Total Labour force 54,211 65.9 62.5 39,428 66.3 61.2 +14,783
Not in the labour force 24,121 29.3 32.2 16,855 28.3 32.4 +7,266
Labour force status not stated 3,927 4.8 5.3 3,215 5.4 6.5 +712
Total persons aged 15+ 82,259 100.0 100.0 59,498 100.0 100.0 +22,761
Source: Australian Bureau of Statistics, Census of Population and Housing 2006 and 2011. Compiled and presented in profile.id by.id, the population experts.
Page 38 of 80
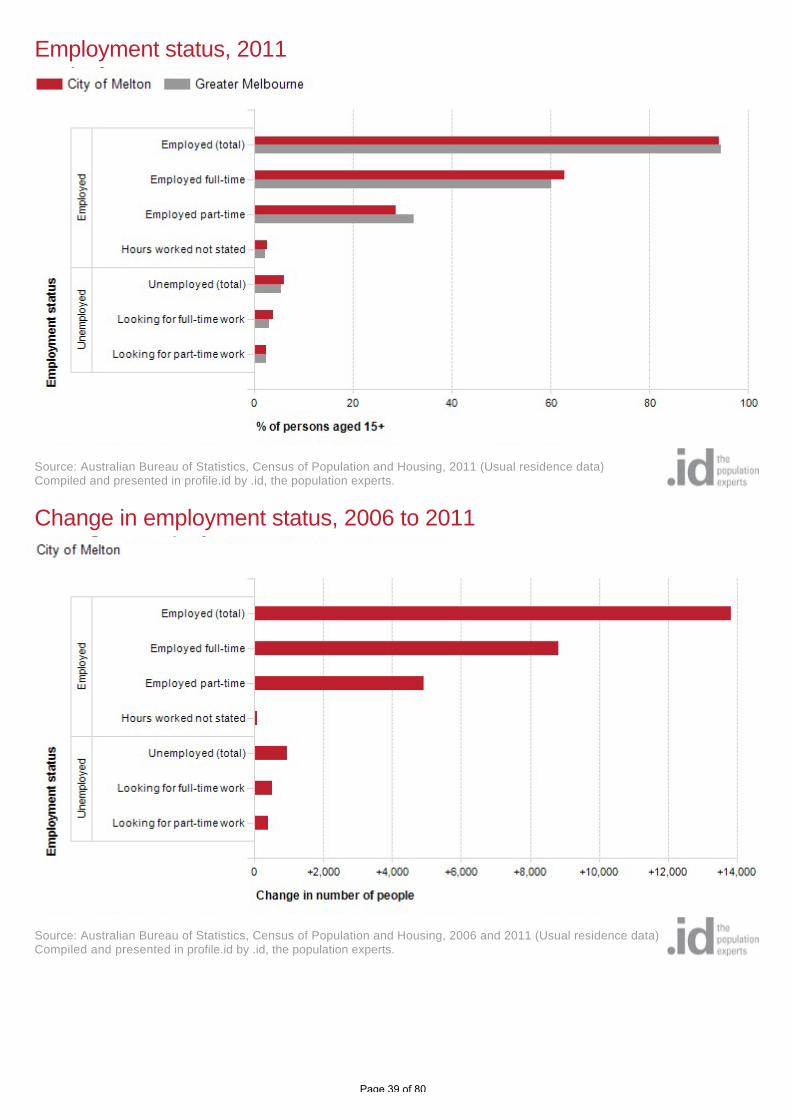
Employment status, 2011
Source: Australian Bureau of Statistics, Census of Population and Housing, 2011 (Usual residence data)Compiled and presented in profile.id by .id, the population experts.
Change in employment status, 2006 to 2011
Source: Australian Bureau of Statistics, Census of Population and Housing, 2006 and 2011 (Usual residence data)Compiled and presented in profile.id by .id, the population experts.
Page 39 of 80
Dominant groups
The size of the City of Melton's labour force in 2011 was 54,211 persons, of which 15,519 were employed part-time
and 34,015 were full time workers.
Analysis of the employment status (as a percentage of the labour force) in the City of Melton in 2011 compared to
Greater Melbourne shows that there was a lower proportion in employment, and a higher proportion unemployed.
Overall, 94.0% of the labour force was employed (61.9% of the population aged 15+), and 6.0% unemployed (4.0% of
the population aged 15+), compared with 94.5% and 5.5% respectively for Greater Melbourne.
The labour force participation rate refers to the proportion of the population over 15 years of age that was employed
or actively looking for work. "The labour force is a fundamental input to domestic production. Its size and composition
are therefore crucial factors in economic growth. From the viewpoint of social development, earnings from paid work
are a major influence on levels of economic well-being." (Australian Social Trends 1995).
Analysis of the labour force participation rate of the population in the City of Melton in 2011 shows that there was a
higher proportion in the labour force (65.9%) compared with Greater Melbourne (62.5%).
Emerging groups
Between 2006 and 2011, the number of people employed in the City of Melton showed an increase of 13,841 persons
and the number unemployed showed an increase of 942 persons. In the same period, the number of people in the
labour force showed an increase of 14,783 persons, or 37.5%.
Page 40 of 80
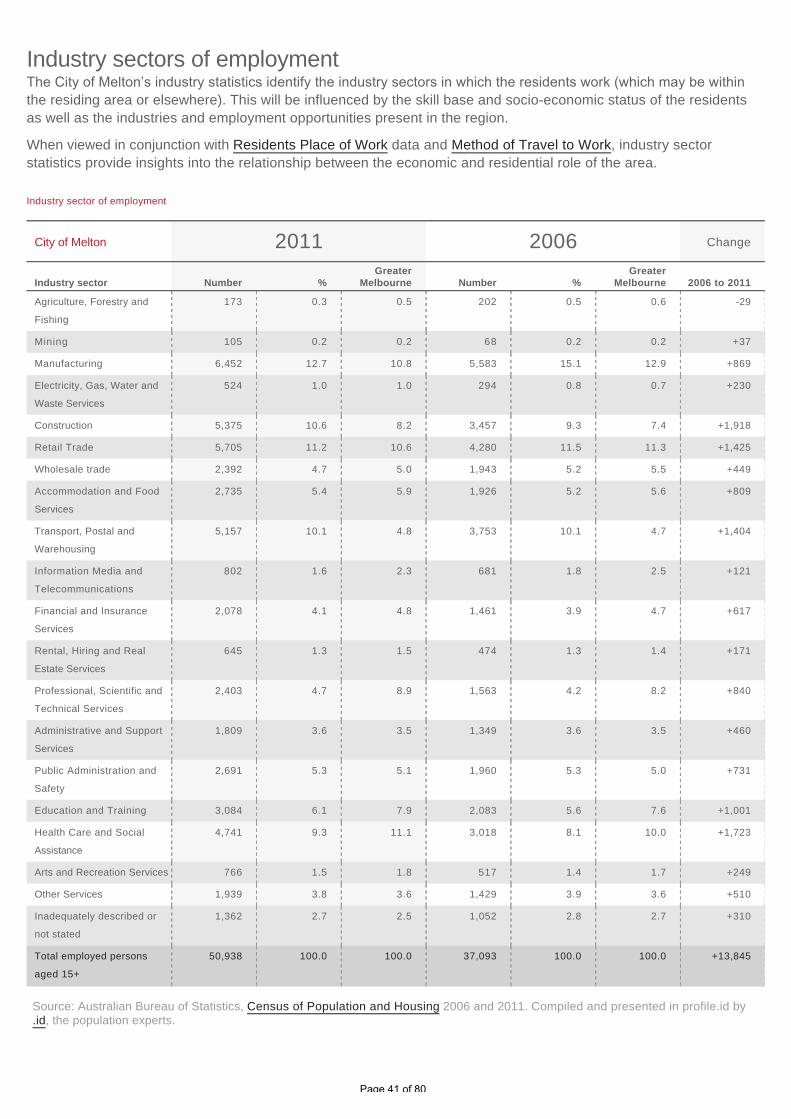
The City of Melton’s industry statistics identify the industry sectors in which the residents work (which may be withinthe residing area or elsewhere). This will be influenced by the skill base and socio-economic status of the residents
as well as the industries and employment opportunities present in the region.
When viewed in conjunction with Residents Place of Work data and Method of Travel to Work, industry sector
statistics provide insights into the relationship between the economic and residential role of the area.
Industry sectors of employment
Industry sector of employment
City of Melton 2011 2006 Change
Industry sector Number %Greater
Melbourne Number %Greater
Melbourne 2006 to 2011
Agriculture, Forestry and
Fishing
173 0.3 0.5 202 0.5 0.6 -29
Mining 105 0.2 0.2 68 0.2 0.2 +37
Manufacturing 6,452 12.7 10.8 5,583 15.1 12.9 +869
Electricity, Gas, Water and
Waste Services
524 1.0 1.0 294 0.8 0.7 +230
Construction 5,375 10.6 8.2 3,457 9.3 7.4 +1,918
Retail Trade 5,705 11.2 10.6 4,280 11.5 11.3 +1,425
Wholesale trade 2,392 4.7 5.0 1,943 5.2 5.5 +449
Accommodation and Food
Services
2,735 5.4 5.9 1,926 5.2 5.6 +809
Transport, Postal and
Warehousing
5,157 10.1 4.8 3,753 10.1 4.7 +1,404
Information Media and
Telecommunications
802 1.6 2.3 681 1.8 2.5 +121
Financial and Insurance
Services
2,078 4.1 4.8 1,461 3.9 4.7 +617
Rental, Hiring and Real
Estate Services
645 1.3 1.5 474 1.3 1.4 +171
Professional, Scientific and
Technical Services
2,403 4.7 8.9 1,563 4.2 8.2 +840
Administrative and Support
Services
1,809 3.6 3.5 1,349 3.6 3.5 +460
Public Administration and
Safety
2,691 5.3 5.1 1,960 5.3 5.0 +731
Education and Training 3,084 6.1 7.9 2,083 5.6 7.6 +1,001
Health Care and Social
Assistance
4,741 9.3 11.1 3,018 8.1 10.0 +1,723
Arts and Recreation Services 766 1.5 1.8 517 1.4 1.7 +249
Other Services 1,939 3.8 3.6 1,429 3.9 3.6 +510
Inadequately described or
not stated
1,362 2.7 2.5 1,052 2.8 2.7 +310
Total employed persons
aged 15+
50,938 100.0 100.0 37,093 100.0 100.0 +13,845
Source: Australian Bureau of Statistics, Census of Population and Housing 2006 and 2011. Compiled and presented in profile.id by.id, the population experts.
Page 41 of 80
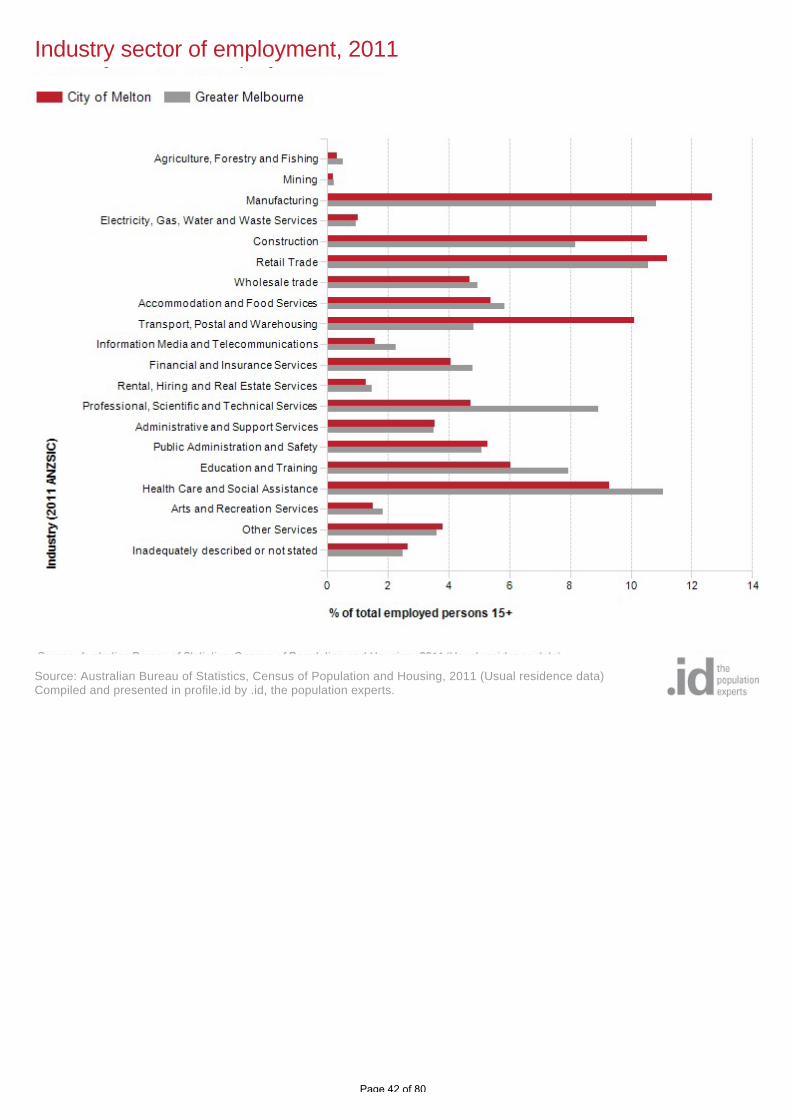
Industry sector of employment, 2011
Source: Australian Bureau of Statistics, Census of Population and Housing, 2011 (Usual residence data)Compiled and presented in profile.id by .id, the population experts.
Page 42 of 80

Change in industry sector of employment, 2006 to 2011
Source: Australian Bureau of Statistics, Census of Population and Housing, 2006 and 2011 (Usual residence data)Compiled and presented in profile.id by .id, the population experts.
Page 43 of 80
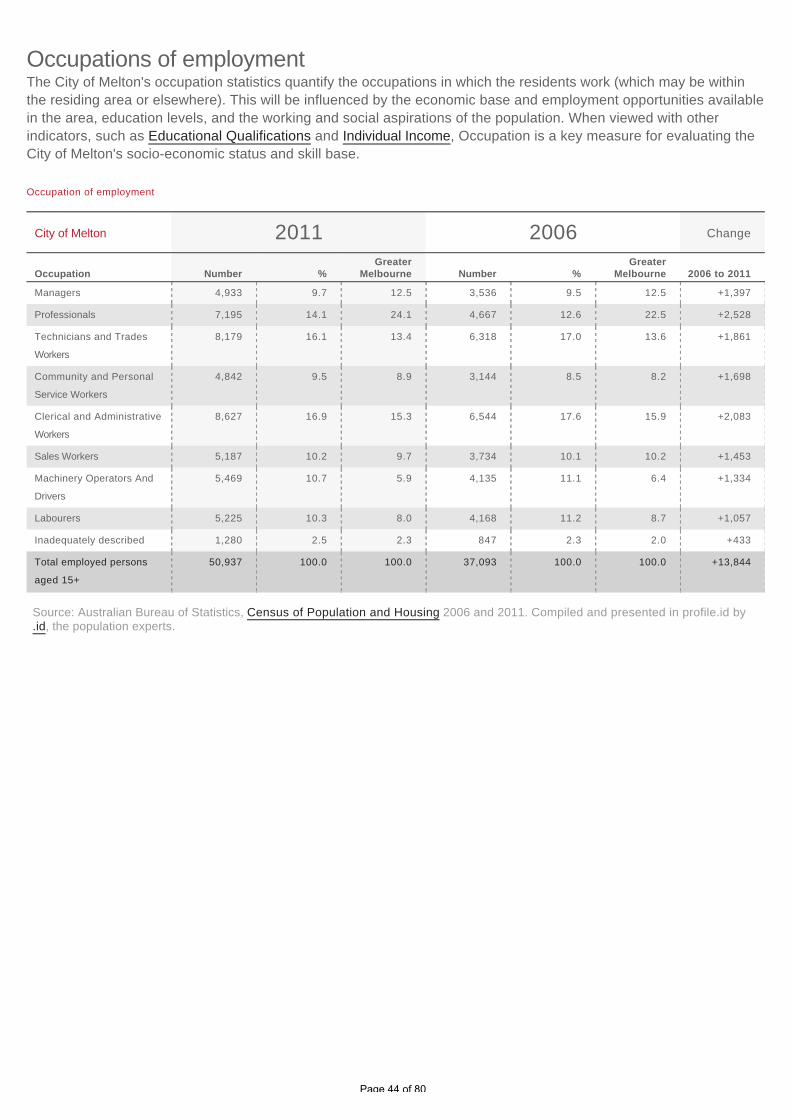
The City of Melton's occupation statistics quantify the occupations in which the residents work (which may be within
the residing area or elsewhere). This will be influenced by the economic base and employment opportunities available
in the area, education levels, and the working and social aspirations of the population. When viewed with other
indicators, such as Educational Qualifications and Individual Income, Occupation is a key measure for evaluating the
City of Melton's socio-economic status and skill base.
Occupations of employment
Occupation of employment
City of Melton 2011 2006 Change
Occupation Number %Greater
Melbourne Number %Greater
Melbourne 2006 to 2011
Managers 4,933 9.7 12.5 3,536 9.5 12.5 +1,397
Professionals 7,195 14.1 24.1 4,667 12.6 22.5 +2,528
Technicians and Trades
Workers
8,179 16.1 13.4 6,318 17.0 13.6 +1,861
Community and Personal
Service Workers
4,842 9.5 8.9 3,144 8.5 8.2 +1,698
Clerical and Administrative
Workers
8,627 16.9 15.3 6,544 17.6 15.9 +2,083
Sales Workers 5,187 10.2 9.7 3,734 10.1 10.2 +1,453
Machinery Operators And
Drivers
5,469 10.7 5.9 4,135 11.1 6.4 +1,334
Labourers 5,225 10.3 8.0 4,168 11.2 8.7 +1,057
Inadequately described 1,280 2.5 2.3 847 2.3 2.0 +433
Total employed persons
aged 15+
50,937 100.0 100.0 37,093 100.0 100.0 +13,844
Source: Australian Bureau of Statistics, Census of Population and Housing 2006 and 2011. Compiled and presented in profile.id by.id, the population experts.
Page 44 of 80

Occupation of employment, 2011
Source: Australian Bureau of Statistics, Census of Population and Housing, 2011 (Usual residence data)Compiled and presented in profile.id by .id, the population experts.
Change in occupation of employment, 2006 to 2011
Source: Australian Bureau of Statistics, Census of Population and Housing, 2006 and 2011 (Usual residence data)Compiled and presented in profile.id by .id, the population experts.
Page 45 of 80
Dominant groups
An analysis of the jobs held by the resident population in City of Melton in 2011 shows the three most popular
occupations were:
Clerical and Administrative Workers (8,627 people or 16.9%)
Technicians and Trades Workers (8,179 people or 16.1%)
Professionals (7,195 people or 14.1%)
In combination these three occupations accounted for 24,001 people in total or 47.1% of the employed resident
population.
In comparison, Greater Melbourne employed 15.3% in Clerical and Administrative Workers; 13.4% in Technicians and
Trades Workers; and 24.1% in Professionals.
The major differences between the jobs held by the population of the City of Melton and Greater Melbourne were:
A larger percentage of persons employed as Machinery Operators And Drivers (10.7% compared to 5.9%)
A larger percentage of persons employed as Technicians and Trades Workers (16.1% compared to 13.4%)
A larger percentage of persons employed as Labourers (10.3% compared to 8.0%)
A larger percentage of persons employed as Clerical and Administrative Workers (16.9% compared to 15.3%)
Emerging groups
The number of employed people in City of Melton increased by 13,844 between 2006 and 2011.
The largest changes in the occupations of residents between 2006 and 2011 in the City of Melton were for those
employed as:
Professionals (+2,528 persons)
Clerical and Administrative Workers (+2,083 persons)
Technicians and Trades Workers (+1,861 persons)
Community and Personal Service Workers (+1,698 persons)
Page 46 of 80

The City of Melton's commuting statistics reveal the main modes of transport by which residents get to work. There
are a number of reasons why people use different modes of transport to get to work including the availability of
affordable and effective public transport options, the number of motor vehicles available within a household, and the
distance travelled to work.
Commuting data is very useful in transport planning as it informs decision-makers about the availability, effectiveness
and utilisation of local transport options, particularly when analysed with Residents Place of Work data and Car
Ownership.
Method of travel to work
Method of travel to work
City of Melton 2011 2006 Change
Main method of travel Number %Greater
Melbourne Number %Greater
Melbourne 2006 to 2011
Train 3,998 7.9 10.0 2,645 7.2 8.5 +1,353
Bus 368 0.7 1.5 201 0.5 1.2 +167
Tram or Ferry 30 0.1 2.3 23 0.1 2.0 +7
Taxi 72 0.1 0.2 41 0.1 0.2 +31
Car - as driver 35,108 69.3 60.6 25,191 68.5 61.2 +9,917
Car - as passenger 2,750 5.4 4.3 2,179 5.9 4.7 +571
Truck 617 1.2 0.7 512 1.4 0.9 +105
Motorbike 157 0.3 0.4 143 0.4 0.5 +14
Bicycle 77 0.2 1.3 57 0.2 1.1 +20
Walked only 408 0.8 2.9 319 0.9 3.0 +89
Other 419 0.8 1.0 291 0.8 0.9 +128
Worked at home 1,131 2.2 3.7 851 2.3 3.7 +280
Did not go to work 4,544 9.0 9.4 3,493 9.5 10.2 +1,051
Not stated 967 1.9 1.6 814 2.2 1.9 +153
Total employed persons
aged 15+
50,646 100.0 100.0 36,760 100.0 100.0 +13,886
Source: Australian Bureau of Statistics, Census of Population and Housing 2006 and 2011. Compiled and presented in profile.id by.id, the population experts.
Page 47 of 80

Method of travel to work, 2011
Source: Australian Bureau of Statistics, Census of Population and Housing, 2011 (Enumerated data)Compiled and presented in profile.id by .id, the population experts.
Change in method of travel to work, 2006 to 2011
Source: Australian Bureau of Statistics, Census of Population and Housing, 2006 and 2011 (Enumerated data)Compiled and presented in profile.id by .id, the population experts.
Page 48 of 80

Dominant groups
In 2011, there were 4,396 people who caught public transport to work (train, bus, tram or ferry) in City of Melton,
compared with 38,632 who drove in private vehicles (car – as driver, car – as passenger, motorbike, or truck).
Analysis of the method of travel to work of the residents in the City of Melton in 2011 compared to Greater Melbourne
shows that 8.7% used public transport, while 76.3% used a private vehicle, compared with 13.8% and 66.1%
respectively in Greater Melbourne.
The major differences between the method of travel to work of the City of Melton and Greater Melbourne were:
A larger percentage of persons who travelled by car (as driver) (69.3% compared to 60.6%)
A larger percentage of persons who travelled by car (as a passenger) (5.4% compared to 4.3%)
A smaller percentage of persons who travelled by tram or ferry (0.1% compared to 2.3%)
A smaller percentage of persons who walked only (0.8% compared to 2.9%)
Emerging groups
The number of employed people in City of Melton increased by 13,886 between 2006 and 2011.
The largest changes in the method of travel to work by resident population in the City of Melton between 2006 and
2011 were for those nominated:
Car - as driver (+9,917 persons)
Train (+1,353 persons)
Did not go to work (+1,051 persons)
Car - as passenger (+571 persons)
Page 49 of 80

The voluntary work sector is an important part of Australia's economy. The level of volunteering can indicate the
cohesiveness of the community and how readily individuals are able to contribute to that community. Factors
impacting on the level of volunteering in the City of Melton include the Age Structure of the population, the level of
Proficiency in English, Income and Education levels.
Volunteer work
Voluntary work
City of Melton 2011 2006 Change
Volunteer status Number %Greater
Melbourne Number %Greater
Melbourne 2006 to 2011
Volunteer 8,653 10.5 15.8 6,392 10.7 15.7 +2,261
Not a volunteer 66,584 80.9 76.4 47,484 79.8 74.8 +19,100
Volunteer work not stated 7,021 8.5 7.8 5,624 9.5 9.5 +1,397
Total persons aged 15+ 82,258 100.0 100.0 59,500 100.0 100.0 +22,758
Source: Australian Bureau of Statistics, Census of Population and Housing 2006 and 2011. Compiled and presented in profile.id by.id, the population experts.
Voluntary work, 2011
Source: Australian Bureau of Statistics, Census of Population and Housing, 2011 (Usual residence data)Compiled and presented in profile.id by .id, the population experts.
Page 50 of 80
Dominant groups
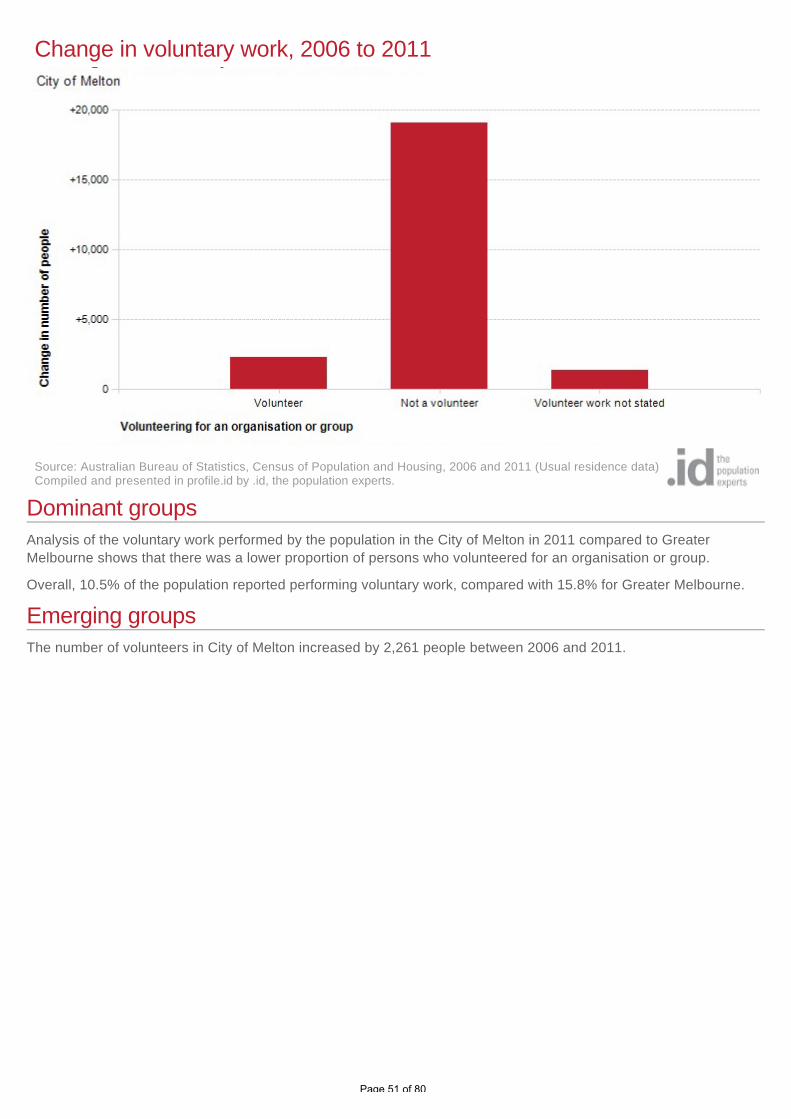
Analysis of the voluntary work performed by the population in the City of Melton in 2011 compared to Greater
Melbourne shows that there was a lower proportion of persons who volunteered for an organisation or group.
Overall, 10.5% of the population reported performing voluntary work, compared with 15.8% for Greater Melbourne.
Emerging groups
The number of volunteers in City of Melton increased by 2,261 people between 2006 and 2011.
Change in voluntary work, 2006 to 2011
Source: Australian Bureau of Statistics, Census of Population and Housing, 2006 and 2011 (Usual residence data)Compiled and presented in profile.id by .id, the population experts.
Page 51 of 80

The proportion of people providing unpaid care for the aged and disabled in the City of Melton can be an important
indicator of the level of demand for aged care services and facilities by local and state governments. An increasing
proportion of carers among the population may indicate inadequate aged care provision, or the need for in-home
support, or support for the carers themselves. The level of care provided by individuals is likely to be affected by
Household Income, Age Structure and the ethnic makeup of the community (Language Spoken), as well as the sense
of community cohesiveness.
Unpaid care
Unpaid care
City of Melton 2011 2006 Change
Assistance to a person witha disability, long termillness or old age Number %
GreaterMelbourne Number %
GreaterMelbourne 2006 to 2011
Provided unpaid assistance 8,780 10.7 10.9 5,728 9.6 10.0 +3,052
No unpaid assistance
provided
66,373 80.7 81.1 47,848 80.4 79.9 +18,525
Not stated 7,107 8.6 8.0 5,922 10.0 10.0 +1,185
Total persons aged 15+ 82,260 100.0 100.0 59,498 100.0 100.0 +22,762
Source: Australian Bureau of Statistics, Census of Population and Housing 2006 and 2011. Compiled and presented in profile.id by.id, the population experts.
Unpaid care, 2011
Source: Australian Bureau of Statistics, Census of Population and Housing, 2011 (Usual residence data)Compiled and presented in profile.id by .id, the population experts.
Page 52 of 80

Dominant groups
Analysis of the unpaid care provided by the population in the City of Melton in 2011 compared to Greater Melbourne
shows that there was a similar proportion of persons who provided unpaid care either to family members or others.
Overall, 10.7% of the population provided unpaid care, compared with 10.9% for Greater Melbourne.
Emerging groups
The number of people who provided unpaid assistance to a person with a disability, long term illness or old age in the
City of Melton increased by 3,052 people between 2006 and 2011.
Change in unpaid care, 2006 to 2011
Source: Australian Bureau of Statistics, Census of Population and Housing, 2006 and 2011 (Usual residence data)Compiled and presented in profile.id by .id, the population experts.
Page 53 of 80

Individual Income statistics are an indicator of socio-economic status. With other data sources, such as Household
Income, Educational Qualifications and Occupation, they help tell the story of the economic opportunities and socio-
economic status of the City of Melton. The amount of income an individual receives is linked to a number of factors
including employment status, age (as for instance students and retirees often receive a lower income), qualifications
and type of employment.
The incomes presented on this page are for the latest Census year only. For comparison of incomes over time, go to
Individual Income Quartiles.
Individual income
Weekly individual gross income
City of Melton 2011
Weekly income Number %Greater
Melbourne
Negative Income/ Nil income 7,844 9.5 9.4
$1-$199 6,529 7.9 7.8
$200-$299 7,583 9.2 9.8
$300-$399 6,530 7.9 8.9
$400-$599 8,708 10.6 10.8
$600-$799 9,712 11.8 10.2
$800-$999 8,356 10.2 8.5
$1000-$1249 7,904 9.6 8.3
$1250-$1499 5,041 6.1 5.8
$1500-$1999 4,575 5.6 6.4
$2000 or more 2,559 3.1 6.5
Not stated 6,918 8.4 7.7
Total persons aged 15+ 82,259 100.0 100.0
Source: Australian Bureau of Statistics, Census of Population and Housing 2011 and 2011. Compiled and presented in profile.id by.id, the population experts.
Page 54 of 80
Dominant groups
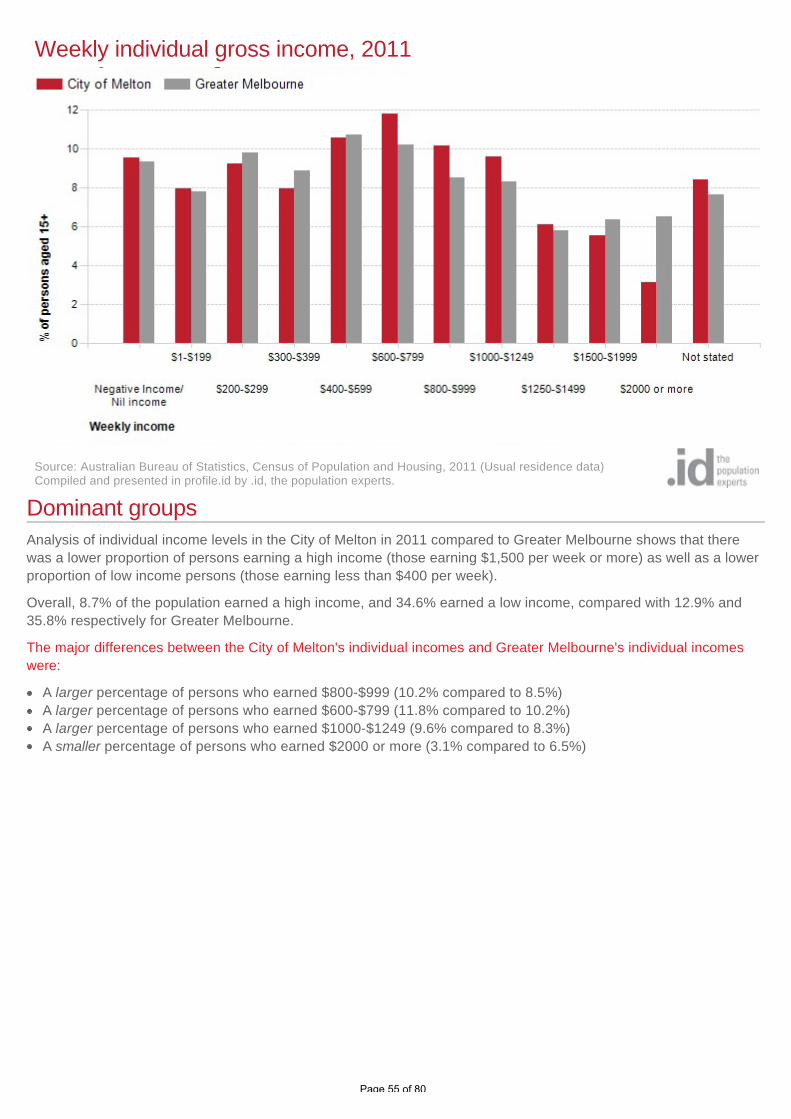
Analysis of individual income levels in the City of Melton in 2011 compared to Greater Melbourne shows that there
was a lower proportion of persons earning a high income (those earning $1,500 per week or more) as well as a lower
proportion of low income persons (those earning less than $400 per week).
Overall, 8.7% of the population earned a high income, and 34.6% earned a low income, compared with 12.9% and
35.8% respectively for Greater Melbourne.
The major differences between the City of Melton's individual incomes and Greater Melbourne's individual incomes
were:
A larger percentage of persons who earned $800-$999 (10.2% compared to 8.5%)
A larger percentage of persons who earned $600-$799 (11.8% compared to 10.2%)
A larger percentage of persons who earned $1000-$1249 (9.6% compared to 8.3%)
A smaller percentage of persons who earned $2000 or more (3.1% compared to 6.5%)
Weekly individual gross income, 2011
Source: Australian Bureau of Statistics, Census of Population and Housing, 2011 (Usual residence data)Compiled and presented in profile.id by .id, the population experts.
Page 55 of 80
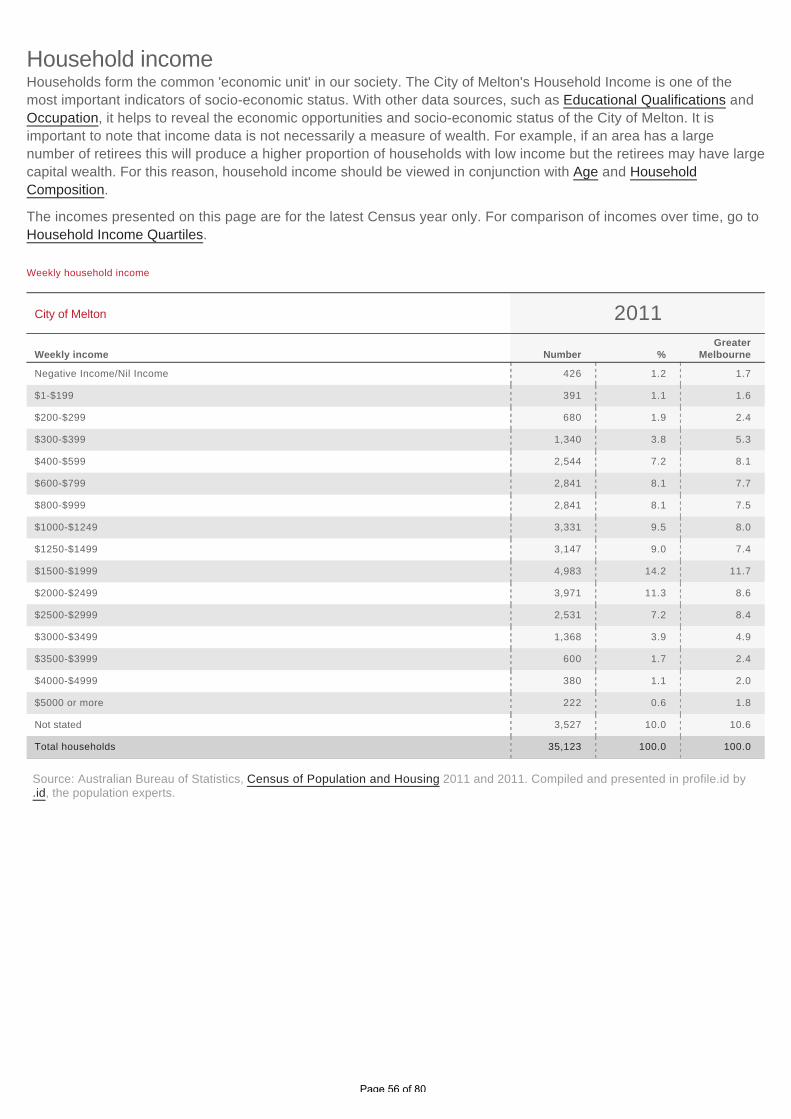
Households form the common 'economic unit' in our society. The City of Melton's Household Income is one of the
most important indicators of socio-economic status. With other data sources, such as Educational Qualifications and
Occupation, it helps to reveal the economic opportunities and socio-economic status of the City of Melton. It is
important to note that income data is not necessarily a measure of wealth. For example, if an area has a large
number of retirees this will produce a higher proportion of households with low income but the retirees may have large
capital wealth. For this reason, household income should be viewed in conjunction with Age and Household
Composition.
The incomes presented on this page are for the latest Census year only. For comparison of incomes over time, go to
Household Income Quartiles.
Household income
Weekly household income
City of Melton 2011
Weekly income Number %Greater
Melbourne
Negative Income/Nil Income 426 1.2 1.7
$1-$199 391 1.1 1.6
$200-$299 680 1.9 2.4
$300-$399 1,340 3.8 5.3
$400-$599 2,544 7.2 8.1
$600-$799 2,841 8.1 7.7
$800-$999 2,841 8.1 7.5
$1000-$1249 3,331 9.5 8.0
$1250-$1499 3,147 9.0 7.4
$1500-$1999 4,983 14.2 11.7
$2000-$2499 3,971 11.3 8.6
$2500-$2999 2,531 7.2 8.4
$3000-$3499 1,368 3.9 4.9
$3500-$3999 600 1.7 2.4
$4000-$4999 380 1.1 2.0
$5000 or more 222 0.6 1.8
Not stated 3,527 10.0 10.6
Total households 35,123 100.0 100.0
Source: Australian Bureau of Statistics, Census of Population and Housing 2011 and 2011. Compiled and presented in profile.id by.id, the population experts.
Page 56 of 80
Dominant groups
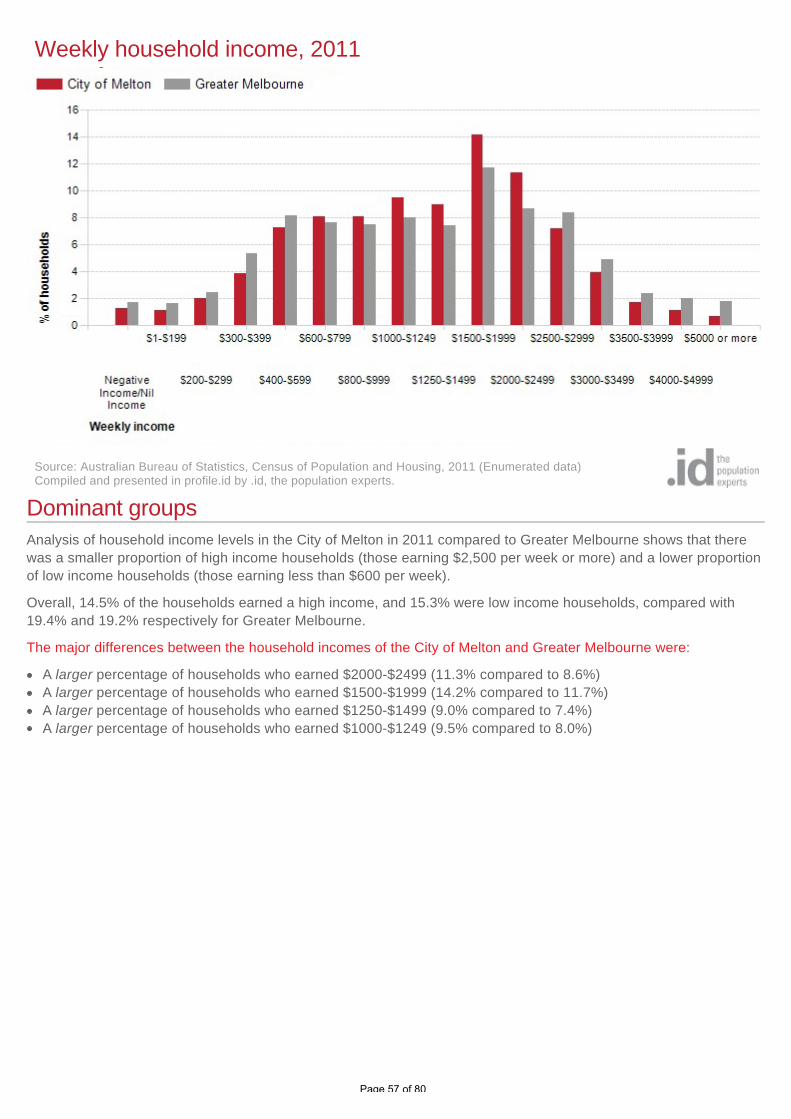
Analysis of household income levels in the City of Melton in 2011 compared to Greater Melbourne shows that there
was a smaller proportion of high income households (those earning $2,500 per week or more) and a lower proportion
of low income households (those earning less than $600 per week).
Overall, 14.5% of the households earned a high income, and 15.3% were low income households, compared with
19.4% and 19.2% respectively for Greater Melbourne.
The major differences between the household incomes of the City of Melton and Greater Melbourne were:
A larger percentage of households who earned $2000-$2499 (11.3% compared to 8.6%)
A larger percentage of households who earned $1500-$1999 (14.2% compared to 11.7%)
A larger percentage of households who earned $1250-$1499 (9.0% compared to 7.4%)
A larger percentage of households who earned $1000-$1249 (9.5% compared to 8.0%)
Weekly household income, 2011
Source: Australian Bureau of Statistics, Census of Population and Housing, 2011 (Enumerated data)Compiled and presented in profile.id by .id, the population experts.
Page 57 of 80
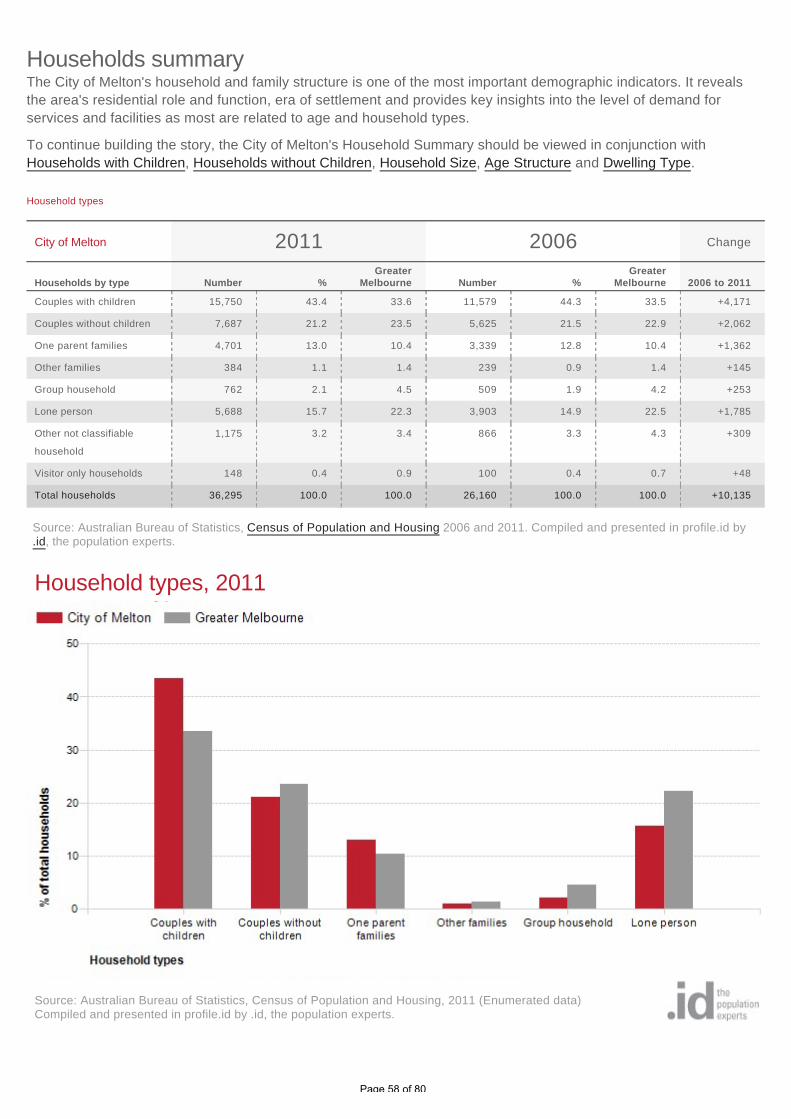
The City of Melton's household and family structure is one of the most important demographic indicators. It reveals
the area's residential role and function, era of settlement and provides key insights into the level of demand for
services and facilities as most are related to age and household types.
To continue building the story, the City of Melton's Household Summary should be viewed in conjunction with
Households with Children, Households without Children, Household Size, Age Structure and Dwelling Type.
Households summary
Household types
City of Melton 2011 2006 Change
Households by type Number %Greater
Melbourne Number %Greater
Melbourne 2006 to 2011
Couples with children 15,750 43.4 33.6 11,579 44.3 33.5 +4,171
Couples without children 7,687 21.2 23.5 5,625 21.5 22.9 +2,062
One parent families 4,701 13.0 10.4 3,339 12.8 10.4 +1,362
Other families 384 1.1 1.4 239 0.9 1.4 +145
Group household 762 2.1 4.5 509 1.9 4.2 +253
Lone person 5,688 15.7 22.3 3,903 14.9 22.5 +1,785
Other not classifiable
household
1,175 3.2 3.4 866 3.3 4.3 +309
Visitor only households 148 0.4 0.9 100 0.4 0.7 +48
Total households 36,295 100.0 100.0 26,160 100.0 100.0 +10,135
Source: Australian Bureau of Statistics, Census of Population and Housing 2006 and 2011. Compiled and presented in profile.id by.id, the population experts.
Household types, 2011
Source: Australian Bureau of Statistics, Census of Population and Housing, 2011 (Enumerated data)Compiled and presented in profile.id by .id, the population experts.
Page 58 of 80
Dominant groups
Analysis of the household/family types in the City of Melton in 2011 compared to Greater Melbourne shows that there
was a higher proportion of couple families with child(ren) as well as a higher proportion of one-parent families.
Overall, 43.4% of total families were couple families with child(ren), and 13.0% were one-parent families, compared
with 33.6% and 10.4% respectively for Greater Melbourne.
There were a lower proportion of lone person households and a lower proportion of couples without children. Overall,
the proportion of lone person households was 15.7% compared to 22.3% in Greater Melbourne while the proportion
of couples without children was 21.2% compared to 23.5% in Greater Melbourne.
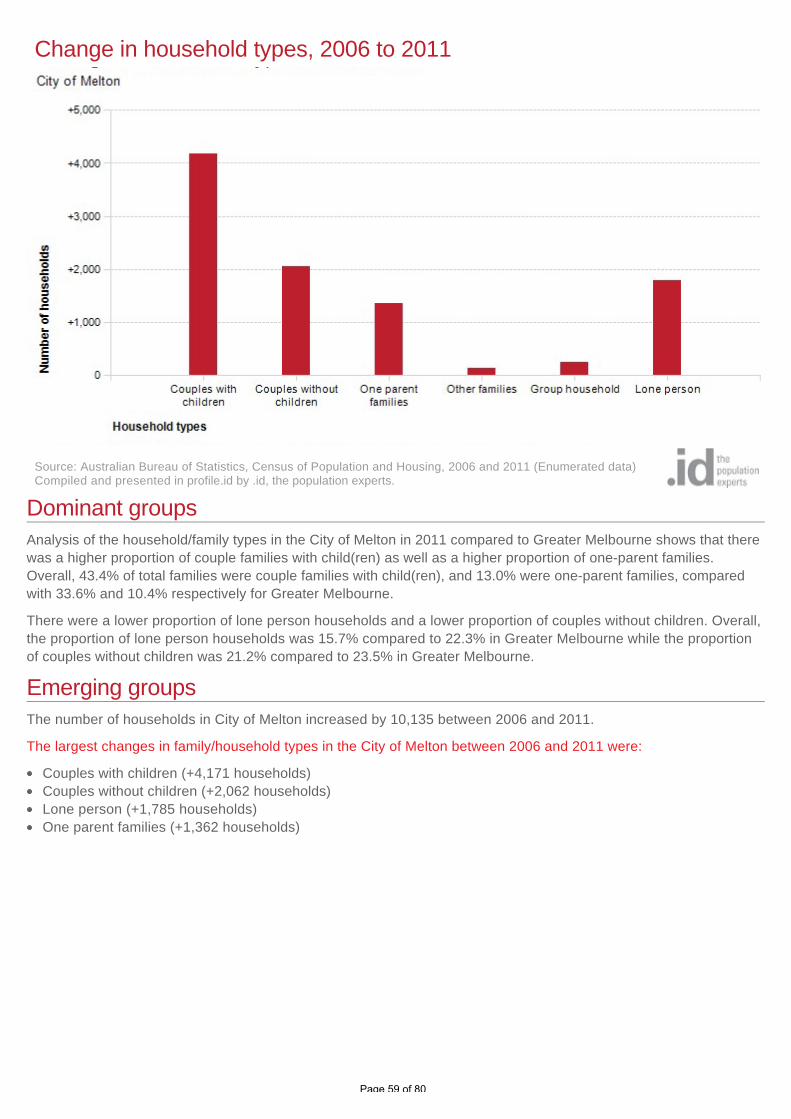
Emerging groups
The number of households in City of Melton increased by 10,135 between 2006 and 2011.
The largest changes in family/household types in the City of Melton between 2006 and 2011 were:
Couples with children (+4,171 households)
Couples without children (+2,062 households)
Lone person (+1,785 households)
One parent families (+1,362 households)
Change in household types, 2006 to 2011
Source: Australian Bureau of Statistics, Census of Population and Housing, 2006 and 2011 (Enumerated data)Compiled and presented in profile.id by .id, the population experts.
Page 59 of 80
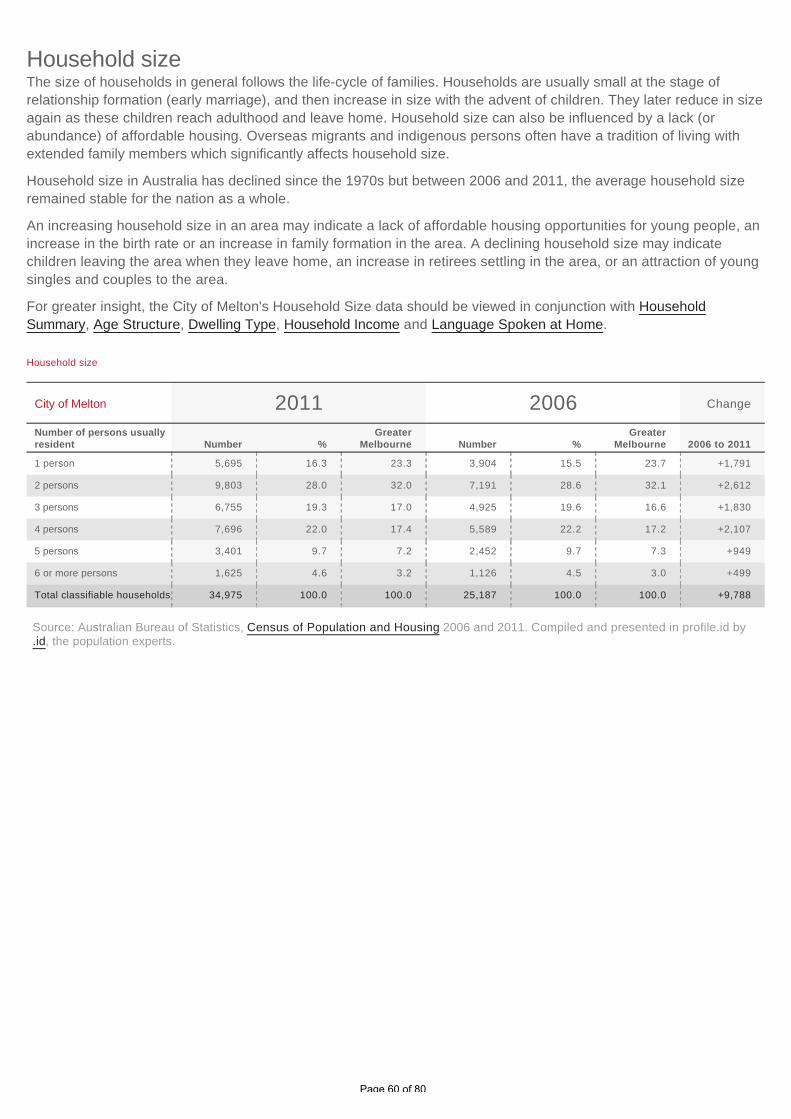
The size of households in general follows the life-cycle of families. Households are usually small at the stage of
relationship formation (early marriage), and then increase in size with the advent of children. They later reduce in size
again as these children reach adulthood and leave home. Household size can also be influenced by a lack (or
abundance) of affordable housing. Overseas migrants and indigenous persons often have a tradition of living with
extended family members which significantly affects household size.
Household size in Australia has declined since the 1970s but between 2006 and 2011, the average household size
remained stable for the nation as a whole.
An increasing household size in an area may indicate a lack of affordable housing opportunities for young people, an
increase in the birth rate or an increase in family formation in the area. A declining household size may indicate
children leaving the area when they leave home, an increase in retirees settling in the area, or an attraction of young
singles and couples to the area.
For greater insight, the City of Melton's Household Size data should be viewed in conjunction with Household
Summary, Age Structure, Dwelling Type, Household Income and Language Spoken at Home.
Household size
Household size
City of Melton 2011 2006 Change
Number of persons usuallyresident Number %
GreaterMelbourne Number %
GreaterMelbourne 2006 to 2011
1 person 5,695 16.3 23.3 3,904 15.5 23.7 +1,791
2 persons 9,803 28.0 32.0 7,191 28.6 32.1 +2,612
3 persons 6,755 19.3 17.0 4,925 19.6 16.6 +1,830
4 persons 7,696 22.0 17.4 5,589 22.2 17.2 +2,107
5 persons 3,401 9.7 7.2 2,452 9.7 7.3 +949
6 or more persons 1,625 4.6 3.2 1,126 4.5 3.0 +499
Total classifiable households 34,975 100.0 100.0 25,187 100.0 100.0 +9,788
Source: Australian Bureau of Statistics, Census of Population and Housing 2006 and 2011. Compiled and presented in profile.id by.id, the population experts.
Page 60 of 80

Household size, 2011
Source: Australian Bureau of Statistics, Census of Population and Housing, 2011 (Enumerated data)Compiled and presented in profile.id by .id, the population experts.
Change in household size, 2006 to 2011
Source: Australian Bureau of Statistics, Census of Population and Housing, 2006 and 2011 (Enumerated data)Compiled and presented in profile.id by .id, the population experts.
Page 61 of 80
Dominant groups
Analysis of the number of persons usually resident in a household in the City of Melton compared with Greater
Melbourne shows that there were a lower proportion of lone person households, and a higher proportion of larger
households (those with 4 persons or more). Overall there were 16.3% of lone person households, and 36.4% of
larger households, compared with 23.3% and 27.8% respectively for Greater Melbourne.
The major differences in the household size for the City of Melton and Greater Melbourne were:
A larger percentage of households with 4 persons usually resident (22.0% compared to 17.4%)
A larger percentage of households with 5 persons usually resident (9.7% compared to 7.2%)
A larger percentage of households with 3 persons usually resident (19.3% compared to 17.0%)
A larger percentage of households with 6 or more persons usually resident (4.6% compared to 3.2%)
Emerging groups
The number of households in City of Melton increased by 9,788 between 2006 and 2011.
The largest changes in the number of persons usually resident in a household in the City of Melton between 2006
and 2011 were:
2 persons (+2,612 households)
4 persons (+2,107 households)
3 persons (+1,830 households)
1 person (+1,791 households)
Page 62 of 80
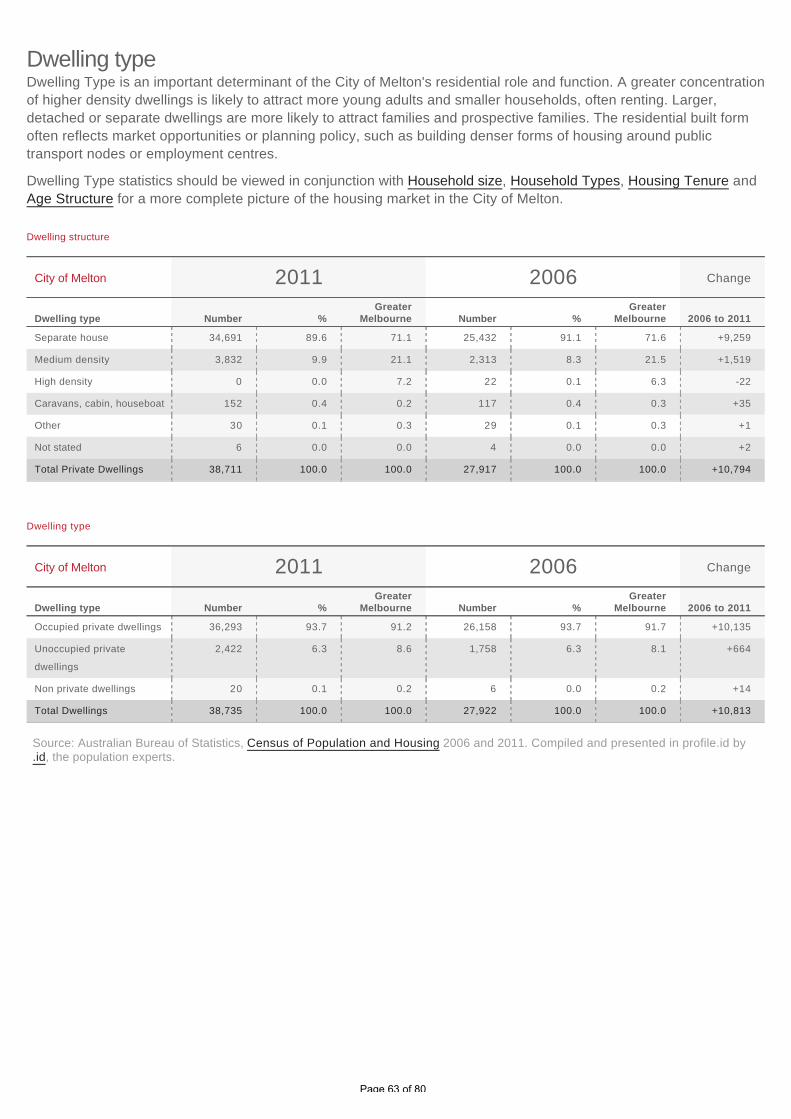
Dwelling Type is an important determinant of the City of Melton's residential role and function. A greater concentration
of higher density dwellings is likely to attract more young adults and smaller households, often renting. Larger,
detached or separate dwellings are more likely to attract families and prospective families. The residential built form
often reflects market opportunities or planning policy, such as building denser forms of housing around public
transport nodes or employment centres.
Dwelling Type statistics should be viewed in conjunction with Household size, Household Types, Housing Tenure and
Age Structure for a more complete picture of the housing market in the City of Melton.
Dwelling type
Dwelling structure
City of Melton 2011 2006 Change
Dwelling type Number %Greater
Melbourne Number %Greater
Melbourne 2006 to 2011
Separate house 34,691 89.6 71.1 25,432 91.1 71.6 +9,259
Medium density 3,832 9.9 21.1 2,313 8.3 21.5 +1,519
High density 0 0.0 7.2 22 0.1 6.3 -22
Caravans, cabin, houseboat 152 0.4 0.2 117 0.4 0.3 +35
Other 30 0.1 0.3 29 0.1 0.3 +1
Not stated 6 0.0 0.0 4 0.0 0.0 +2
Total Private Dwellings 38,711 100.0 100.0 27,917 100.0 100.0 +10,794
Dwelling type
City of Melton 2011 2006 Change
Dwelling type Number %Greater
Melbourne Number %Greater
Melbourne 2006 to 2011
Occupied private dwellings 36,293 93.7 91.2 26,158 93.7 91.7 +10,135
Unoccupied private
dwellings
2,422 6.3 8.6 1,758 6.3 8.1 +664
Non private dwellings 20 0.1 0.2 6 0.0 0.2 +14
Total Dwellings 38,735 100.0 100.0 27,922 100.0 100.0 +10,813
Source: Australian Bureau of Statistics, Census of Population and Housing 2006 and 2011. Compiled and presented in profile.id by.id, the population experts.
Page 63 of 80

Dwelling structure, 2011
Source: Australian Bureau of Statistics, Census of Population and Housing, 2011 (Enumerated data)Compiled and presented in profile.id by .id, the population experts.
Change in dwelling structure, 2006 to 2011
Source: Australian Bureau of Statistics, Census of Population and Housing, 2006 and 2011 (Enumerated data)Compiled and presented in profile.id by .id, the population experts.
Page 64 of 80
Dominant groups
In 2011, there were 34,691 separate houses in the area, 3,832 medium density dwellings, and no high density
dwellings.
Analysis of the types of dwellings in the City of Melton in 2011 shows that 89.6% of all dwellings were separate
houses; 9.9% were medium density dwellings, and none% were high density dwellings, compared with 71.1%, 21.1%,
and 7.2% in the Greater Melbourne respectively.
In 2011, a total of 93.7% of the dwellings in the City of Melton were occupied on Census night, compared to 91.2% in
Greater Melbourne. The proportion of unoccupied dwellings was 6.3%, which is smaller compared to that found in
Greater Melbourne (8.6%).
Emerging groups
The total number of dwellings in the City of Melton increased by 10,813 between 2006 and 2011.
The largest changes in the type of dwellings found in the City of Melton between 2006 and 2011 were:
Separate house (+9,259 dwellings)
Medium density (+1,519 dwellings)
Page 65 of 80

The Number of Bedrooms in a dwelling is an indicator of the size of dwellings, and when combined with dwelling type
information, provides insight into the role the City of Melton plays in the housing market. For example, an area of high
density dwellings that are predominantly 1-2 bedroom are likely to attract students, single workers and young
couples, whereas a high density area with dwellings that are predominantly 2-3 bedroom may attract more empty
nesters and some families.
In combination with Household type and Household size, the Number of Bedrooms can also indicate issues around
housing affordability, overcrowding and other socio-economic factors.
Number of bedrooms per dwelling
Number of bedrooms per dwelling
City of Melton 2011 2006 Change
Number of bedrooms Number %Greater
Melbourne Number %Greater
Melbourne 2006 to 2011
0 or 1 bedrooms 416 1.1 5.5 254 1.0 5.0 +162
2 bedrooms 2,157 5.9 19.3 1,519 5.8 19.6 +638
3 bedrooms 17,277 47.6 43.8 13,461 51.5 45.2 +3,816
4 bedrooms 12,981 35.8 22.0 8,483 32.4 20.1 +4,498
5 bedrooms or more 1,694 4.7 4.3 1,100 4.2 3.9 +594
Not stated 1,772 4.9 5.1 1,344 5.1 6.2 +428
Total households 36,297 100.0 100.0 26,161 100.0 100.0 +10,136
Source: Australian Bureau of Statistics, Census of Population and Housing 2006 and 2011. Compiled and presented in profile.id by.id, the population experts.
Number of bedrooms per dwelling, 2011
Source: Australian Bureau of Statistics, Census of Population and Housing, 2011 (Enumerated data)Compiled and presented in profile.id by .id, the population experts.
Page 66 of 80

Dominant groups
Analysis of the number of bedrooms in dwellings in City of Melton in 2011 compared to Greater Melbourne shows that
there was a lower proportion of dwellings with 1 and 2 bedrooms, and a higher proportion of dwellings with 4 or more
bedrooms.
Overall, 7.1% of households were in 1-2 bedroom dwellings, and 40.4% of 4-plus bedroom dwellings, compared with
24.8% and 26.3% for Greater Melbourne respectively.
The major differences between the number of bedrooms per dwelling of the City of Melton and Greater Melbourne
were:
A larger percentage of 4 bedroom dwellings (35.8% compared to 22.0%)
A larger percentage of 3 bedroom dwellings (47.6% compared to 43.8%)
A smaller percentage of 2 bedroom dwellings (5.9% compared to 19.3%)
A smaller percentage of dwellings with no bedrooms (includes bedsitters) (1.1% compared to 5.5%)
Emerging groups
The largest changes in the number of bedrooms per dwelling in the City of Melton between 2006 and 2011 were:
4 bedrooms (+4,498 dwellings)
3 bedrooms (+3,816 dwellings)
2 bedrooms (+638 dwellings)
5 bedrooms or more (+594 dwellings)
Change in number of bedrooms per dwelling, 2006 to 2011
Source: Australian Bureau of Statistics, Census of Population and Housing, 2006 and 2011 (Enumerated data)Compiled and presented in profile.id by .id, the population experts.
Page 67 of 80

A fast Internet Connection is increasingly required for accessing essential information and undertaking domestic and
non-domestic business. Households with dial-up or no internet service are being left behind in the digital divide' as
both government and the private sector are increasingly conducting their business, or aspects of it, on-line.
Internet connectivity in the City of Melton can be affected by availability of connection, Education, Household Income
and Age Structure.
Internet connection
Type of internet connection
City of Melton 2011 2006 Change
Connection type Number %Greater
Melbourne Number %Greater
Melbourne 2006 to 2011
Total internet connection 28,398 78.2 76.4 16,254 62.1 61.0 +12,144
Broadband connection 25,957 71.5 70.0 10,264 39.2 42.7 +15,693
Dial-up connection 1,024 2.8 2.7 5,834 22.3 17.8 -4,810
Other connection 1,417 3.9 3.7 156 0.6 0.5 +1,261
No internet connection 5,464 15.1 16.8 8,240 31.5 31.5 -2,776
Not stated 2,432 6.7 6.8 1,663 6.4 7.5 +769
Total households 36,294 100.0 100.0 26,157 100.0 100.0 +10,137
Source: Australian Bureau of Statistics, Census of Population and Housing 2006 and 2011. Compiled and presented in profile.id by.id, the population experts.
Type of internet connection, 2011
Source: Australian Bureau of Statistics, Census of Population and Housing, 2011 (Enumerated data)Compiled and presented in profile.id by .id, the population experts.
Page 68 of 80
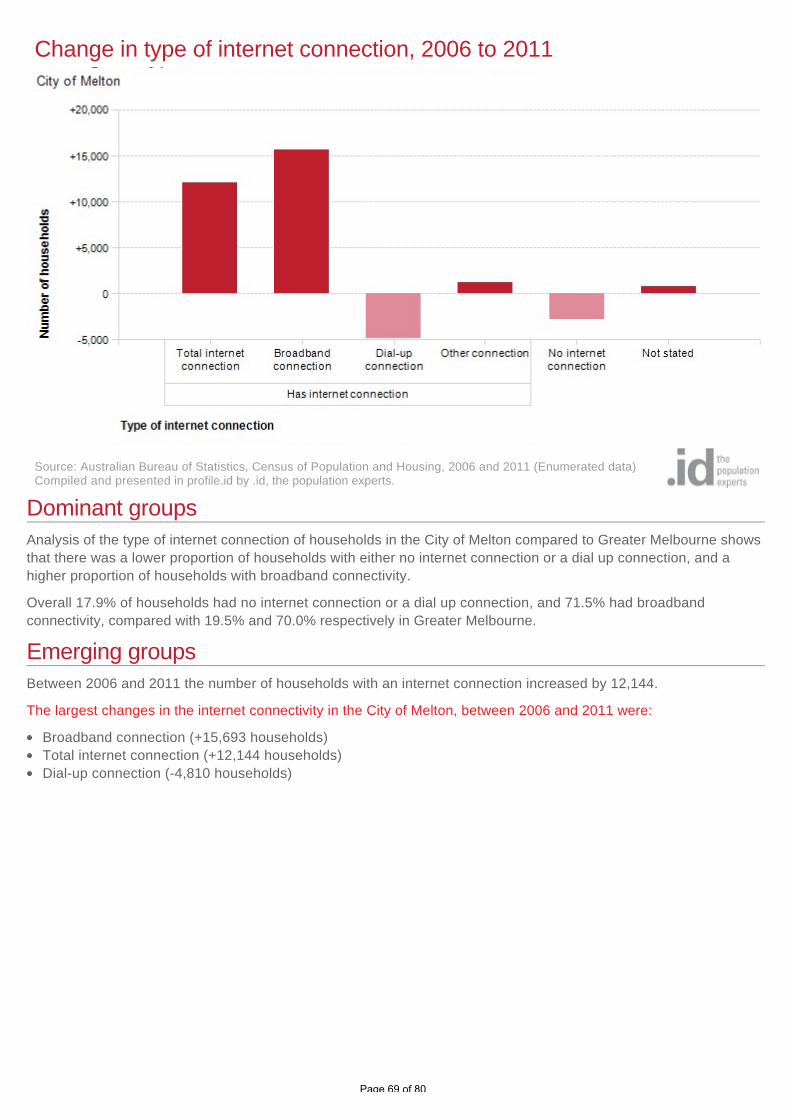
Dominant groups
Analysis of the type of internet connection of households in the City of Melton compared to Greater Melbourne shows
that there was a lower proportion of households with either no internet connection or a dial up connection, and a
higher proportion of households with broadband connectivity.
Overall 17.9% of households had no internet connection or a dial up connection, and 71.5% had broadband
connectivity, compared with 19.5% and 70.0% respectively in Greater Melbourne.
Emerging groups
Between 2006 and 2011 the number of households with an internet connection increased by 12,144.
The largest changes in the internet connectivity in the City of Melton, between 2006 and 2011 were:
Broadband connection (+15,693 households)
Total internet connection (+12,144 households)
Dial-up connection (-4,810 households)
Change in type of internet connection, 2006 to 2011
Source: Australian Bureau of Statistics, Census of Population and Housing, 2006 and 2011 (Enumerated data)Compiled and presented in profile.id by .id, the population experts.
Page 69 of 80
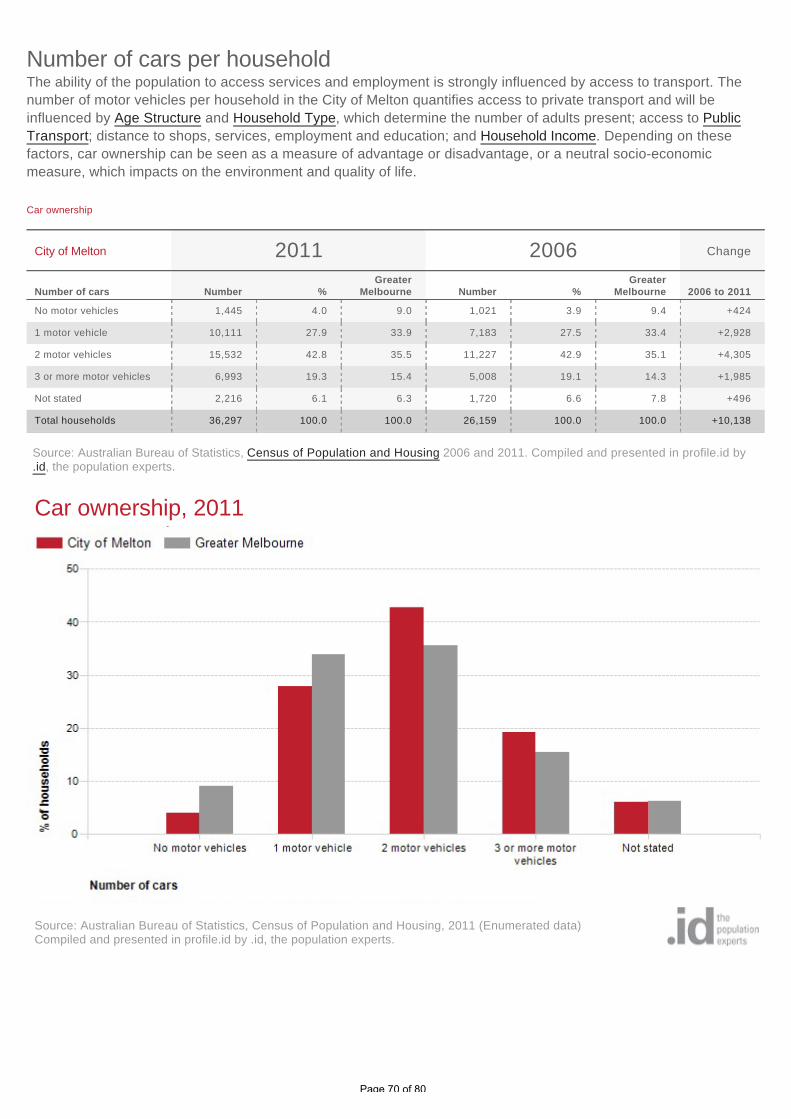
The ability of the population to access services and employment is strongly influenced by access to transport. The
number of motor vehicles per household in the City of Melton quantifies access to private transport and will be
influenced by Age Structure and Household Type, which determine the number of adults present; access to Public
Transport; distance to shops, services, employment and education; and Household Income. Depending on these
factors, car ownership can be seen as a measure of advantage or disadvantage, or a neutral socio-economic
measure, which impacts on the environment and quality of life.
Number of cars per household
Car ownership
City of Melton 2011 2006 Change
Number of cars Number %Greater
Melbourne Number %Greater
Melbourne 2006 to 2011
No motor vehicles 1,445 4.0 9.0 1,021 3.9 9.4 +424
1 motor vehicle 10,111 27.9 33.9 7,183 27.5 33.4 +2,928
2 motor vehicles 15,532 42.8 35.5 11,227 42.9 35.1 +4,305
3 or more motor vehicles 6,993 19.3 15.4 5,008 19.1 14.3 +1,985
Not stated 2,216 6.1 6.3 1,720 6.6 7.8 +496
Total households 36,297 100.0 100.0 26,159 100.0 100.0 +10,138
Source: Australian Bureau of Statistics, Census of Population and Housing 2006 and 2011. Compiled and presented in profile.id by.id, the population experts.
Car ownership, 2011
Source: Australian Bureau of Statistics, Census of Population and Housing, 2011 (Enumerated data)Compiled and presented in profile.id by .id, the population experts.
Page 70 of 80

Dominant groups
Analysis of the car ownership of the households in the City of Melton in 2011 compared to Greater Melbourne shows
that 89.9% of the households owned at least one car, while 4.0% did not, compared with 84.8% and 9.0% respectively
in Greater Melbourne.
Of those that owned at least one vehicle, there was a smaller proportion who owned just one car; a larger proportion
who owned two cars; and a larger proportion who owned three cars or more.
Overall, 27.9% of the households owned one car; 42.8% owned two cars; and 19.3% owned three cars or more,
compared with 33.9%; 35.5% and 15.4% respectively for Greater Melbourne.
Emerging groups
The largest changes in the household car ownership in the City of Melton between 2006 and 2011 were:
2 motor vehicles (+4,305 households)
1 motor vehicle (+2,928 households)
3 or more motor vehicles (+1,985 households)
No motor vehicles (+424 households)
Change in car ownership, 2006 to 2011
Source: Australian Bureau of Statistics, Census of Population and Housing, 2006 and 2011 (Enumerated data)Compiled and presented in profile.id by .id, the population experts.
Page 71 of 80

Oops! There seems to be an error on this page.We have been notified and will rectify the problem as soon as possible. To continue your analysis, please return to
the previous page.
Page 72 of 80

Mortgage repayments are directly related to house prices in the City of Melton, length of occupancy and the level of
equity of home owners. When viewed with Household Income data it may also indicate the level of housing stress
households in the community are under. In mortgage belt areas it is expected that households will be paying a higher
proportion of their income on their housing compared to well-established areas. First home buyer areas are also likely
to have larger mortgages than upgrader areas where households move in with equity from elsewhere.
Mortgage payment levels are not directly comparable over time because of inflation. For comparison of mortgage
payments over time, go to Housing Loan Quartiles.
Housing loan repayments
Monthly housing loan repayments
City of Melton 2011
Monthly repayment amount Number %Greater
Melbourne
Nil repayments 257 1.3 2.2
$1-$149 109 0.6 0.8
$150-$299 139 0.7 1.0
$300-$449 298 1.5 2.1
$450-$599 334 1.7 2.0
$600-$799 653 3.4 3.6
$800-$999 936 4.9 4.8
$1000-$1199 1,297 6.7 6.3
$1200-$1399 1,678 8.7 7.4
$1400-$1599 1,783 9.2 7.3
$1600-$1799 1,999 10.4 8.3
$1800-$1999 1,523 7.9 6.5
$2000-$2199 2,313 12.0 10.7
$2200-$2399 1,079 5.6 4.9
$2400-$2599 767 4.0 4.0
$2600-$2999 1,416 7.3 7.0
$3000-$3999 1,143 5.9 9.2
$4000-$4999 280 1.5 3.5
$5000 and over 216 1.1 3.0
Not stated 1,064 5.5 5.6
Total households with a mortgage 19,284 100.0 100.0
Source: Australian Bureau of Statistics, Census of Population and Housing 2011 and 2011. Compiled and presented in profile.id by.id, the population experts.
Page 73 of 80
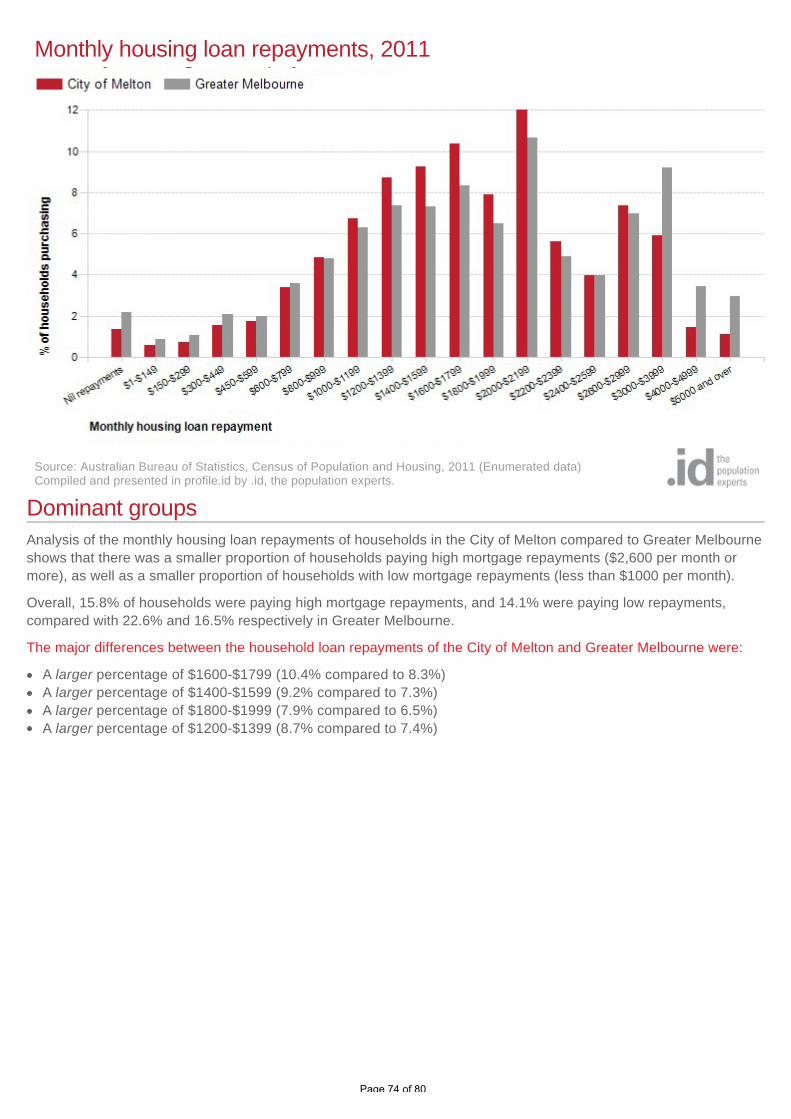
Dominant groups
Analysis of the monthly housing loan repayments of households in the City of Melton compared to Greater Melbourne
shows that there was a smaller proportion of households paying high mortgage repayments ($2,600 per month or
more), as well as a smaller proportion of households with low mortgage repayments (less than $1000 per month).
Overall, 15.8% of households were paying high mortgage repayments, and 14.1% were paying low repayments,
compared with 22.6% and 16.5% respectively in Greater Melbourne.
The major differences between the household loan repayments of the City of Melton and Greater Melbourne were:
A larger percentage of $1600-$1799 (10.4% compared to 8.3%)
A larger percentage of $1400-$1599 (9.2% compared to 7.3%)
A larger percentage of $1800-$1999 (7.9% compared to 6.5%)
A larger percentage of $1200-$1399 (8.7% compared to 7.4%)
Monthly housing loan repayments, 2011
Source: Australian Bureau of Statistics, Census of Population and Housing, 2011 (Enumerated data)Compiled and presented in profile.id by .id, the population experts.
Page 74 of 80
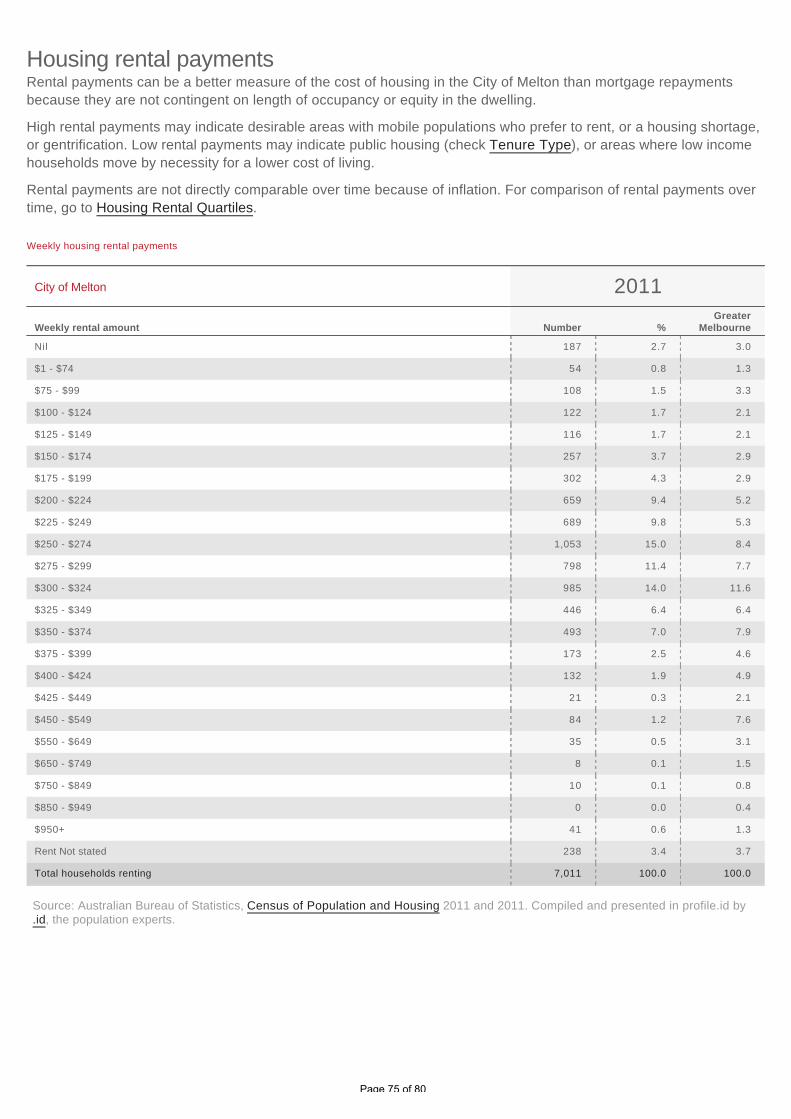
Rental payments can be a better measure of the cost of housing in the City of Melton than mortgage repayments
because they are not contingent on length of occupancy or equity in the dwelling.
High rental payments may indicate desirable areas with mobile populations who prefer to rent, or a housing shortage,
or gentrification. Low rental payments may indicate public housing (check Tenure Type), or areas where low income
households move by necessity for a lower cost of living.
Rental payments are not directly comparable over time because of inflation. For comparison of rental payments over
time, go to Housing Rental Quartiles.
Housing rental payments
Weekly housing rental payments
City of Melton 2011
Weekly rental amount Number %Greater
Melbourne
Nil 187 2.7 3.0
$1 - $74 54 0.8 1.3
$75 - $99 108 1.5 3.3
$100 - $124 122 1.7 2.1
$125 - $149 116 1.7 2.1
$150 - $174 257 3.7 2.9
$175 - $199 302 4.3 2.9
$200 - $224 659 9.4 5.2
$225 - $249 689 9.8 5.3
$250 - $274 1,053 15.0 8.4
$275 - $299 798 11.4 7.7
$300 - $324 985 14.0 11.6
$325 - $349 446 6.4 6.4
$350 - $374 493 7.0 7.9
$375 - $399 173 2.5 4.6
$400 - $424 132 1.9 4.9
$425 - $449 21 0.3 2.1
$450 - $549 84 1.2 7.6
$550 - $649 35 0.5 3.1
$650 - $749 8 0.1 1.5
$750 - $849 10 0.1 0.8
$850 - $949 0 0.0 0.4
$950+ 41 0.6 1.3
Rent Not stated 238 3.4 3.7
Total households renting 7,011 100.0 100.0
Source: Australian Bureau of Statistics, Census of Population and Housing 2011 and 2011. Compiled and presented in profile.id by.id, the population experts.
Page 75 of 80
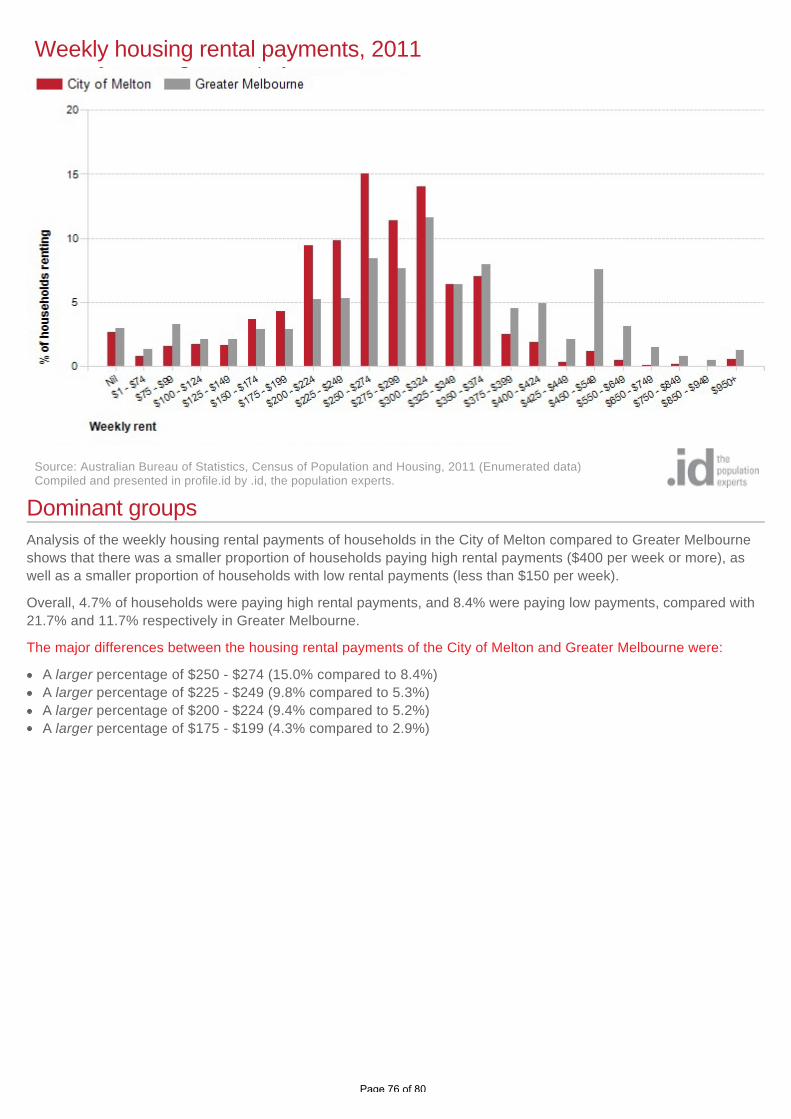
Dominant groups
Analysis of the weekly housing rental payments of households in the City of Melton compared to Greater Melbourne
shows that there was a smaller proportion of households paying high rental payments ($400 per week or more), as
well as a smaller proportion of households with low rental payments (less than $150 per week).
Overall, 4.7% of households were paying high rental payments, and 8.4% were paying low payments, compared with
21.7% and 11.7% respectively in Greater Melbourne.
The major differences between the housing rental payments of the City of Melton and Greater Melbourne were:
A larger percentage of $250 - $274 (15.0% compared to 8.4%)
A larger percentage of $225 - $249 (9.8% compared to 5.3%)
A larger percentage of $200 - $224 (9.4% compared to 5.2%)
A larger percentage of $175 - $199 (4.3% compared to 2.9%)
Weekly housing rental payments, 2011
Source: Australian Bureau of Statistics, Census of Population and Housing, 2011 (Enumerated data)Compiled and presented in profile.id by .id, the population experts.
Page 76 of 80
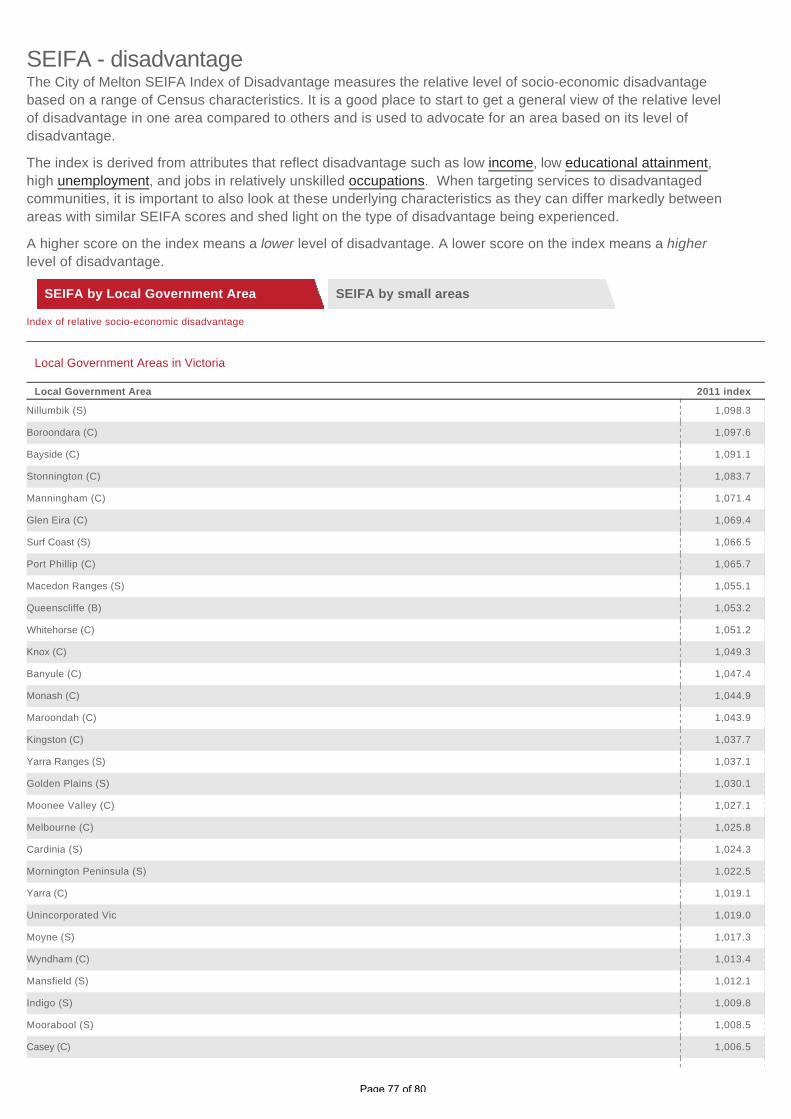
The City of Melton SEIFA Index of Disadvantage measures the relative level of socio-economic disadvantage
based on a range of Census characteristics. It is a good place to start to get a general view of the relative level
of disadvantage in one area compared to others and is used to advocate for an area based on its level of
disadvantage.
The index is derived from attributes that reflect disadvantage such as low income, low educational attainment,
high unemployment, and jobs in relatively unskilled occupations. When targeting services to disadvantaged
communities, it is important to also look at these underlying characteristics as they can differ markedly between
areas with similar SEIFA scores and shed light on the type of disadvantage being experienced.
A higher score on the index means a lower level of disadvantage. A lower score on the index means a higher
level of disadvantage.
SEIFA by Local Government Area SEIFA by small areas
SEIFA - disadvantage
Index of relative socio-economic disadvantage
Local Government Areas in Victoria
Local Government Area 2011 index
Nillumbik (S) 1,098.3
Boroondara (C) 1,097.6
Bayside (C) 1,091.1
Stonnington (C) 1,083.7
Manningham (C) 1,071.4
Glen Eira (C) 1,069.4
Surf Coast (S) 1,066.5
Port Phillip (C) 1,065.7
Macedon Ranges (S) 1,055.1
Queenscliffe (B) 1,053.2
Whitehorse (C) 1,051.2
Knox (C) 1,049.3
Banyule (C) 1,047.4
Monash (C) 1,044.9
Maroondah (C) 1,043.9
Kingston (C) 1,037.7
Yarra Ranges (S) 1,037.1
Golden Plains (S) 1,030.1
Moonee Valley (C) 1,027.1
Melbourne (C) 1,025.8
Cardinia (S) 1,024.3
Mornington Peninsula (S) 1,022.5
Yarra (C) 1,019.1
Unincorporated Vic 1,019.0
Moyne (S) 1,017.3
Wyndham (C) 1,013.4
Mansfield (S) 1,012.1
Indigo (S) 1,009.8
Moorabool (S) 1,008.5
Casey (C) 1,006.5
Page 77 of 80
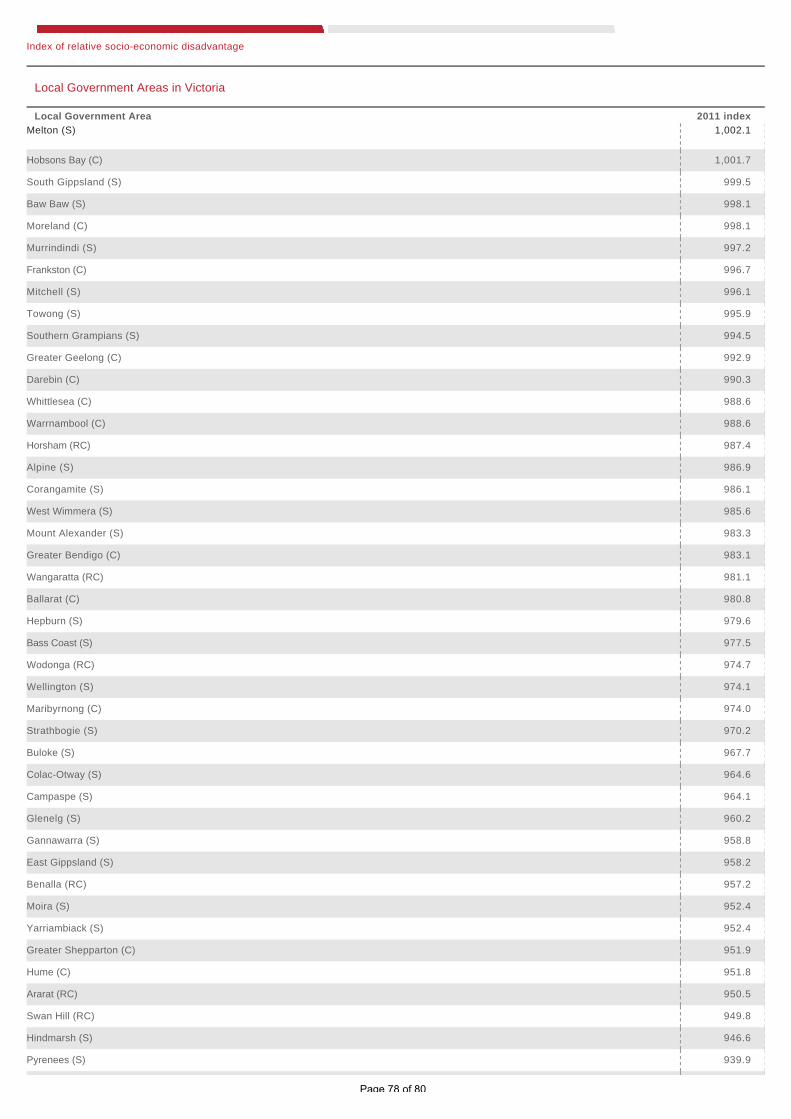
Index of relative socio-economic disadvantage
Local Government Areas in Victoria
Local Government Area 2011 index
Melton (S) 1,002.1
Hobsons Bay (C) 1,001.7
South Gippsland (S) 999.5
Baw Baw (S) 998.1
Moreland (C) 998.1
Murrindindi (S) 997.2
Frankston (C) 996.7
Mitchell (S) 996.1
Towong (S) 995.9
Southern Grampians (S) 994.5
Greater Geelong (C) 992.9
Darebin (C) 990.3
Whittlesea (C) 988.6
Warrnambool (C) 988.6
Horsham (RC) 987.4
Alpine (S) 986.9
Corangamite (S) 986.1
West Wimmera (S) 985.6
Mount Alexander (S) 983.3
Greater Bendigo (C) 983.1
Wangaratta (RC) 981.1
Ballarat (C) 980.8
Hepburn (S) 979.6
Bass Coast (S) 977.5
Wodonga (RC) 974.7
Wellington (S) 974.1
Maribyrnong (C) 974.0
Strathbogie (S) 970.2
Buloke (S) 967.7
Colac-Otway (S) 964.6
Campaspe (S) 964.1
Glenelg (S) 960.2
Gannawarra (S) 958.8
East Gippsland (S) 958.2
Benalla (RC) 957.2
Moira (S) 952.4
Yarriambiack (S) 952.4
Greater Shepparton (C) 951.9
Hume (C) 951.8
Ararat (RC) 950.5
Swan Hill (RC) 949.8
Hindmarsh (S) 946.6
Pyrenees (S) 939.9
Page 78 of 80
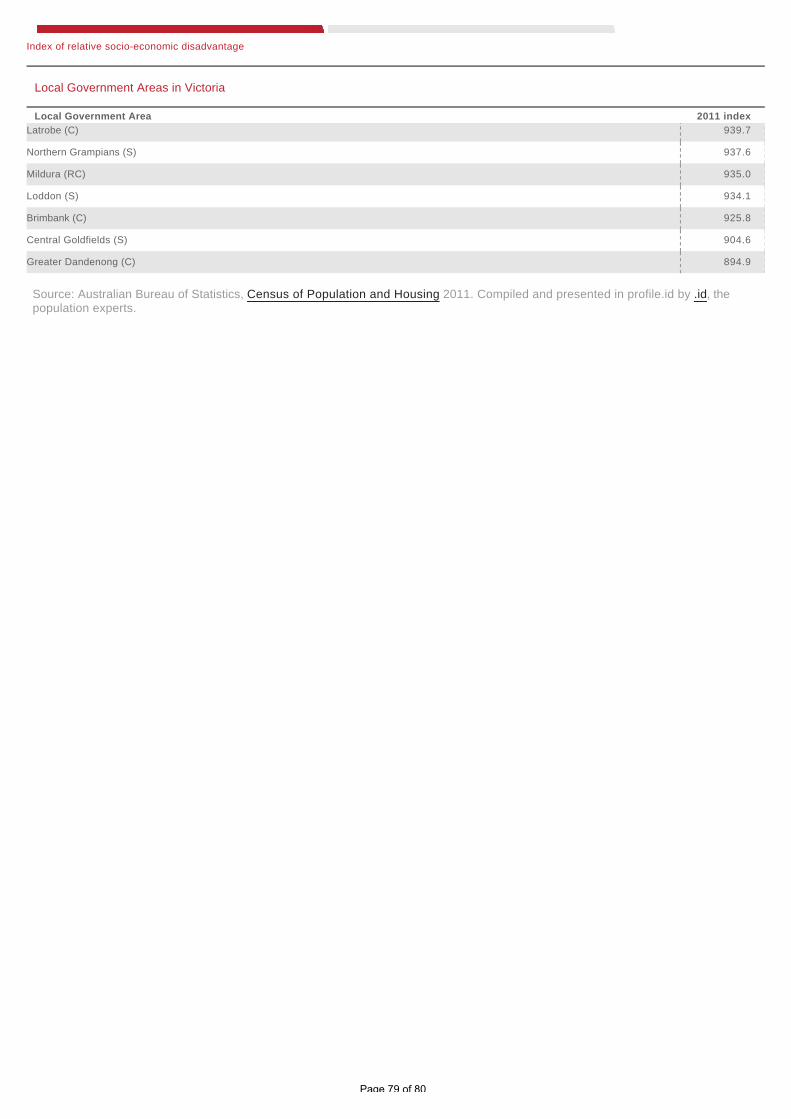
Index of relative socio-economic disadvantage
Local Government Areas in Victoria
Local Government Area 2011 index
Latrobe (C) 939.7
Northern Grampians (S) 937.6
Mildura (RC) 935.0
Loddon (S) 934.1
Brimbank (C) 925.8
Central Goldfields (S) 904.6
Greater Dandenong (C) 894.9
Source: Australian Bureau of Statistics, Census of Population and Housing 2011. Compiled and presented in profile.id by .id, thepopulation experts.
Page 79 of 80
Demographic change across Australia is recorded by the Australian Bureau of Statistics (ABS) in the Census
collections every five years. Population experts, .id, analyse and convert these raw figures into stories of place to
inform council staff, community groups, investors, business, students and the general public.
The City of Melton Community Profile provides demographic analysis for the City and its suburbs based on results
from the 2011, 2006, 2001, 1996 and 1991 Censuses of Population and Housing. The profile is updated with
population estimates when the Australian Bureau of Statistics (ABS) releases new figures such as the annual
Estimated Resident Population (ERP).
Suburb boundaries and Census questions change over time, but .id manages the data to ensure that there is an
accurate time series provided for the current geographic boundaries. You can read more about this in the Geography
Notes section.
Results for the City of Melton include population, age structure, ethnicity, ancestry, religion, income, qualifications,
occupations, employment, unemployment, disability, disadvantage, volunteering, childcare, family structure,
household structure, housing tenure, mortgage and rental payments, and the size and type of the dwellings people
live in.
The Community Profile presents this information in clear maps, tables and charts with concise factual commentary to
answer three important questions:
1. What are the characteristics of the people who live here?
2. How are they changing?
3. How do they compare to other areas?
This provides the basis for making evidence-based decisions about how to provide services for the community as it
changes.
You can be confident about the quality of the information as it is derived from Australian Bureau of Statistics data,
analysed and presented by population experts and funded by the City of Melton.
About the community profile
Page 80 of 80