Embed Size (px)
Citation preview

community profile
Indigo Shire
2011 Census results
Comparison year: 2006Benchmark area: Regional VIC
Compiled and presented in profile.id®. http://profile.id.com.au/indigo

Table of contents
Estimated Resident Population (ERP) 2
Population highlights 4
About the areas 6
Five year age groups 9
Ancestry 12
Birthplace 15
Year of arrival in Australia 17
Proficiency in English 19
Language spoken at home 22
Religion 25
Qualifications 27
Highest level of schooling 29
Education institution attending 32
Need for assistance 35
Employment status 38
Industry sectors of employment 41
Occupations of employment 44
Method of travel to work 47
Volunteer work 49
Unpaid care 51
Individual income 53
Household income 55
Households summary 57
Household size 60
Dwelling type 63
Number of bedrooms per dwelling 65
Internet connection 67
Number of cars per household 69
Housing tenure 71
Housing loan repayments 73
Housing rental payments 75
SEIFA - disadvantage 78
About the community profile 79

The Estimated Resident Population is the OFFICIAL Indigo Shire population for 2012.
Populations are counted and estimated in various ways. The most comprehensive population count available in
Australia is derived from the Census of Population and Housing conducted by the Australian Bureau of
Statistics every five years. However the Census count is NOT the official population of Indigo Shire. To provide
a more accurate population figure which is updated more frequently than every five years, the Australian
Bureau of Statistics also produces "Estimated Resident Population" (ERP) numbers for Indigo Shire.
See data notes for a detailed explanation of different population types, how they are calculated and when to
use each one.
Estimated Resident Population (ERP)
Estimated Resident Population (ERP)
Indigo Shire
Year (ending June 30) NumberChange in
numberChange in
percent
2001 14,716 -- --
2002 14,813 +97 +0.66
2003 14,898 +85 +0.57
2004 14,972 +74 +0.50
2005 15,162 +190 +1.27
2006 15,350 +188 +1.24
2007 15,329 -21 -0.14
2008 15,360 +31 +0.20
2009 15,430 +70 +0.46
2010 15,413 -17 -0.11
2011 15,376 -37 -0.24
2012 15,431 +55 +0.36
Source: Australian Bureau of Statistics, Regional Population Growth, Australia (3218.0). Compiled and presented in profile.id by .idThe population experts
Page 3 of 81

Estimated Resident Population (ERP)
Source: Australian Bureau of Statistics, Regional Population Growth, Australia (3218.0). Compiled and presented by.id the population experts
Annual change in Estimated Resident Population (ERP)
Source: Australian Bureau of Statistics, Regional Population Growth, Australia (3218.0). Compiled and presented by.id the population experts
Page 4 of 81

2011 Indigo Shire Regional VIC Victoria Australia
Median age 4441 37 37
Median weeklyhouseholdincome
$1,066$945
$1,216 $1,234
Couples withchildren 30%
27%
32% 31%
Older coupleswithout children 12%
11% 9% 9%
Medium andhigh densityHousing
6%11% 23% 25%
Householdswith amortgage
37%32% 34% 33%
Median weeklyrent $180
$190 $277 $285
Householdsrenting 18%
24% 26% 29%
Non-Englishspeakingbackgrounds
3%6% 20% 16%
Universityattendance 2% 2%
5% 4%
Bachelor orHigher degree 16%
13%
21% 19%
Vocational 22%21% 16% 18%
Public transport(to work) 0%
2% 11% 10%
Population highlights
Page 5 of 81
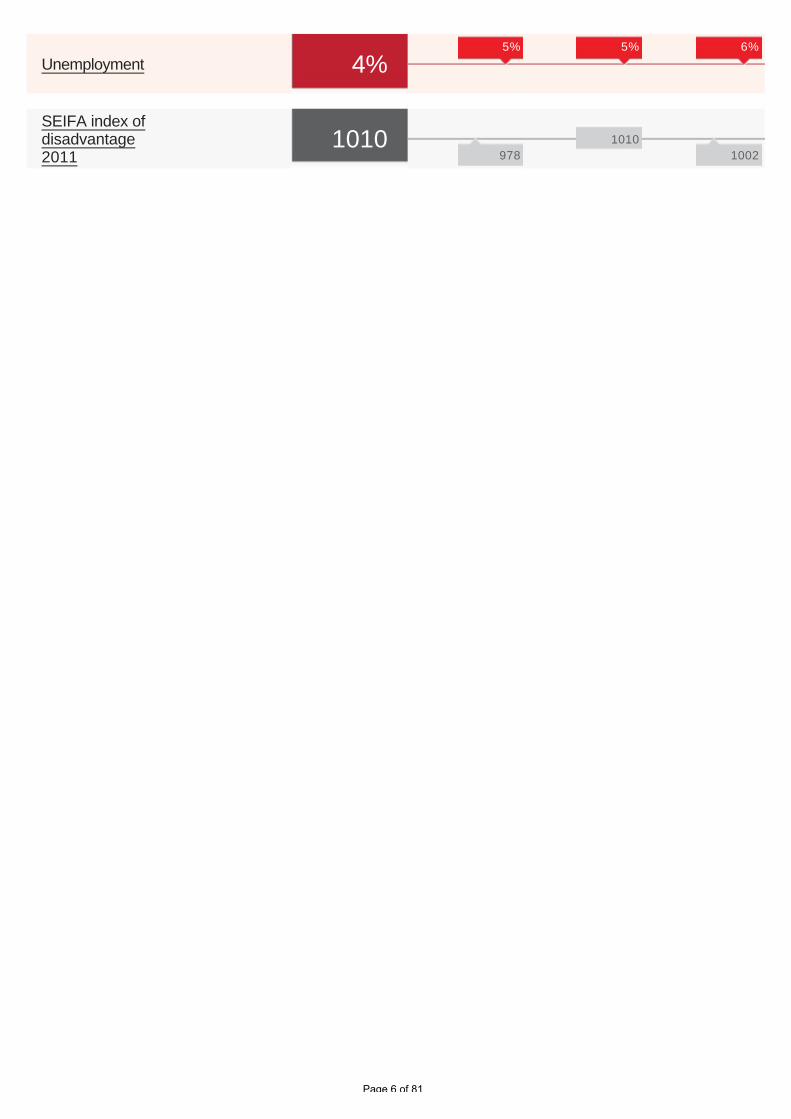
Unemployment 4%5% 5% 6%
SEIFA index ofdisadvantage2011
1010978
1010
1002
Page 6 of 81

Location and boundaries
Indigo Shire is located in north-eastern Victoria, between 220 and 270 kilometres north-east of Melbourne. Indigo
Shire is bounded by the Murray River and the New South Wales border in the north, the City of Wodonga and
Towong Shire in the east, Alpine Shire in the south, and the Rural City of Wangaratta and Moira Shire in the west.
Name origin
Indigo Shire is named after Indigo Creek, which was named after the pea-like flowers found on a shrub in the area
which resembled the Indigo plant.
About the area
Important
Statistics
Population
15,1802011 Usual residents
Land area
204,381hectares (2,044
Km )2
Population density
0.07persons per hectare
Indigo Shire
Report a map errorMap data ©2013 Google - Terms of Use
Legend
Districts
Indigo Shire
Overlay areas
Page 7 of 81

Settlement history
European settlement of the Indigo area dates from the late 1830s, with land used mainly for grazing. Rapid growth
took place from 1852 into the late 1860s, due to gold discoveries in the area and subsequent gold mining. The
townships of Beechworth and Yackandandah were established in the mid 1850s, followed by Chiltern and Rutherglen
in the early 1860s. The population declined from the 1870s as gold supplies waned, with mining ceasing in the early
1900s. The population of the Shire was then relatively stable until the 1980s, when some growth occurred. The
population increased marginally from the mid 1990s, rising from about 13,600 in 1996 to about 14,300 in 2006.
Land use
Indigo Shire is a predominantly rural area. The
main townships are Beechworth, Rutherglen,
Chiltern and Yackandandah. Smaller townships
include Barnawartha, Kiewa, Tangambalanga and
Wahgunyah. The Shire encompasses a total land
area of over 2,000 square kilometres. The main
industry is farming, particularly beef, sheep, dairy,
fruit and viticulture.
Transport
The Shire is served by the Hume Freeway, the
Murray Valley Highway and the Sydney to
Melbourne railway line.
Major features
Major features of the Shire include Chiltern-Mount Pilot National Park, Beechworth Historic Park, Beechworth Historic
and Cultural Precinct, Yackandandah Conservation Area, Murray to Mountains Rail Trail, the Murray River, part of
Lake Hume, La Trobe University (Beechworth Campus) and numerous wineries.
Included areas
Indigo Shire includes the townships and localities of Allans Flat, Barnawartha, Beechworth, Brimin, Browns Plains,
Bruarong, Carlyle, Charleroi, Chiltern, Chiltern Valley, Cornishtown, Eldorado (part), Gooramadda, Gundowring,
Huon, Indigo Valley, Kergunyah, Kiewa, Lilliput, Mudgegonga (part), Norong, Osbornes Flat, Rutherglen, Sandy
Creek, Staghorn Flat, Stanley, Tangambalanga, Wahgunyah, Wooragee and Yackandandah.
Land use
Page 8 of 81

The Age Structure of Indigo Shire provides key insights into the level of demand for age based services and facilities
such as child care. It is also an indicator of Indigo Shire's residential role and function and how it is likely to change in
the future.
Five year age groups present a classic age profile of the population. Each age group covers exactly five years, which
enables direct comparison between each group.
To get a more complete picture Indigo Shire's Age Structure should be viewed in conjunction with Household Types
and Dwelling Types.
Five year age groups
Age structure - Five year age groups
Indigo Shire 2006 2001 Change
Five year age groups(years) Number % Regional VIC Number % Regional VIC 2001 to 2006
0 to 4 835 5.6 6.0 861 6.1 6.6 -26
5 to 9 1,011 6.8 6.8 1,141 8.0 7.6 -130
10 to 14 1,253 8.5 7.5 1,233 8.7 7.8 +20
15 to 19 1,019 6.9 7.0 1,010 7.1 7.1 +9
20 to 24 508 3.4 5.5 477 3.4 5.2 +31
25 to 29 486 3.3 4.9 596 4.2 5.6 -110
30 to 34 766 5.2 5.8 822 5.8 6.4 -56
35 to 39 1,001 6.8 6.6 1,075 7.6 7.1 -74
40 to 44 1,215 8.2 7.1 1,239 8.7 7.6 -24
45 to 49 1,284 8.7 7.4 1,160 8.2 7.2 +124
50 to 54 1,205 8.1 7.1 1,096 7.7 6.8 +109
55 to 59 1,190 8.0 6.7 840 5.9 5.4 +350
60 to 64 863 5.8 5.4 668 4.7 4.7 +195
65 to 69 669 4.5 4.6 567 4.0 4.1 +102
70 to 74 494 3.3 3.8 536 3.8 4.0 -42
75 to 79 443 3.0 3.4 409 2.9 3.2 +34
80 to 84 300 2.0 2.5 220 1.5 2.0 +80
85 and over 258 1.7 2.0 262 1.8 1.7 -4
Total 14,800 100.0 100.0 14,212 100.0 100.0 +588
Source: Australian Bureau of Statistics, Census of Population and Housing 2001 and 2006. Compiled and presented in profile.id by.id, the population experts.
Page 9 of 81

Five year age structure, 2006
Source: Australian Bureau of Statistics, Census of Population and Housing, 2006 (Usual residence data)Compiled and presented in profile.id by .id, the population experts.
Change in five year age structure, 2001 to 2006
Source: Australian Bureau of Statistics, Census of Population and Housing, 2001 and 2006 (Usual residence data)Compiled and presented in profile.id by .id, the population experts.
Page 10 of 81

Dominant groups
Analysis of the five year age groups of Indigo Shire in 2006 compared to Regional VIC shows that there was a higher
proportion of people in the younger age groups (under 15) and a lower proportion of people in the older age groups
(65+).
Overall, 20.9% of the population was aged between 0 and 15, and 14.6% were aged 65 years and over, compared
with 20.2% and 16.2% respectively for Regional VIC.
The major differences between the age structure of Indigo Shire and Regional VIC were:
A larger percentage of persons aged 45 to 49 (8.7% compared to 7.4%)
A larger percentage of persons aged 55 to 59 (8.0% compared to 6.7%)
A larger percentage of persons aged 40 to 44 (8.2% compared to 7.1%)
A larger percentage of persons aged 50 to 54 (8.1% compared to 7.1%)
Emerging groups
From 2001 to 2006, Indigo Shire's population increased by 588 people (4.1%). This represents an average annual
population change of 0.81% per year over the period.
The largest changes in age structure in this area between 2001 and 2006 were in the age groups:
55 to 59 (+350 persons)
60 to 64 (+195 persons)
5 to 9 (-130 persons)
45 to 49 (+124 persons)
Page 11 of 81
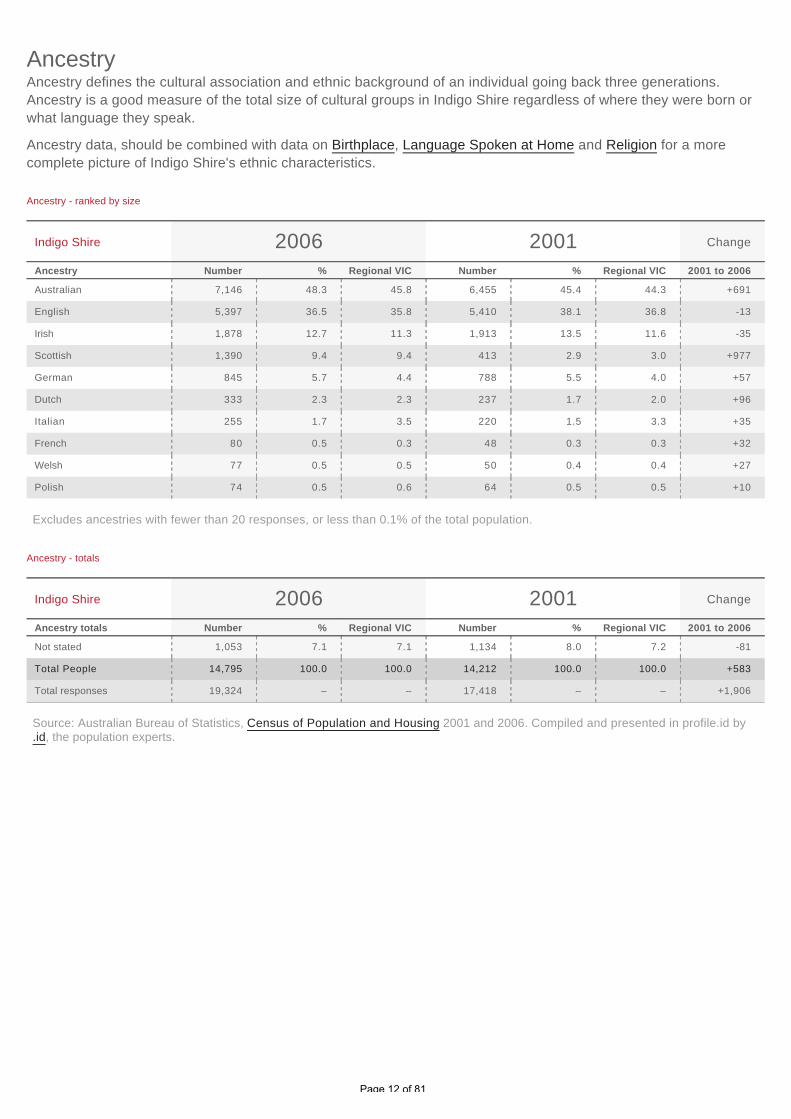
Ancestry defines the cultural association and ethnic background of an individual going back three generations.
Ancestry is a good measure of the total size of cultural groups in Indigo Shire regardless of where they were born or
what language they speak.
Ancestry data, should be combined with data on Birthplace, Language Spoken at Home and Religion for a more
complete picture of Indigo Shire's ethnic characteristics.
Ancestry
Ancestry - ranked by size
Indigo Shire 2006 2001 Change
Ancestry Number % Regional VIC Number % Regional VIC 2001 to 2006
Australian 7,146 48.3 45.8 6,455 45.4 44.3 +691
English 5,397 36.5 35.8 5,410 38.1 36.8 -13
Irish 1,878 12.7 11.3 1,913 13.5 11.6 -35
Scottish 1,390 9.4 9.4 413 2.9 3.0 +977
German 845 5.7 4.4 788 5.5 4.0 +57
Dutch 333 2.3 2.3 237 1.7 2.0 +96
Italian 255 1.7 3.5 220 1.5 3.3 +35
French 80 0.5 0.3 48 0.3 0.3 +32
Welsh 77 0.5 0.5 50 0.4 0.4 +27
Polish 74 0.5 0.6 64 0.5 0.5 +10
Excludes ancestries with fewer than 20 responses, or less than 0.1% of the total population.
Ancestry - totals
Indigo Shire 2006 2001 Change
Ancestry totals Number % Regional VIC Number % Regional VIC 2001 to 2006
Not stated 1,053 7.1 7.1 1,134 8.0 7.2 -81
Total People 14,795 100.0 100.0 14,212 100.0 100.0 +583
Total responses 19,324 -- -- 17,418 -- -- +1,906
Source: Australian Bureau of Statistics, Census of Population and Housing 2001 and 2006. Compiled and presented in profile.id by.id, the population experts.
Page 12 of 81

Ancestry, 2006
Source: Australian Bureau of Statistics, Census of Population and Housing, 2006 (Usual residence data)Compiled and presented in profile.id by .id, the population experts.
Change in ancestry, 2001 to 2006
Source: Australian Bureau of Statistics, Census of Population and Housing, 2001 and 2006 (Usual residence data)Compiled and presented in profile.id by .id, the population experts.
Page 13 of 81

Dominant groups
Analysis of the ancestry responses of the population in Indigo Shire in 2006 shows that the top five ancestries
nominated were:
Australian (7,146 people or 48.3%)
English (5,397 people or 36.5%)
Irish (1,878 people or 12.7%)
Scottish (1,390 people or 9.4%)
German (845 people or 5.7%)
In combination these five ancestries account for 16,656 responses in total, or 112.58% of all responses.
The major differences between the ancestries of the population in Indigo Shire and Regional VIC were:
A larger percentage of people with Australian ancestry (48.3% compared to 45.8%)
A larger percentage of people with Irish ancestry (12.7% compared to 11.3%)
A larger percentage of people with German ancestry (5.7% compared to 4.4%)
A smaller percentage of people with Italian ancestry (1.7% compared to 3.5%)
Emerging groups
The largest changes in the reported ancestries of the population in this area between 2001 and 2006 were:
Scottish (+977 persons)
Australian (+691 persons)
Dutch (+96 persons)
German (+57 persons)
Page 14 of 81

Country of Birth data identifies where people were born and is indicative of the level of cultural diversity in Indigo
Shire. The mix of Country of Birth groups is also indicative of historical settlement patterns, as source countries for
Australia's immigration program have varied significantly over time.
To get a more complete picture of cultural and ethnic characteristics, Indigo Shire's Country of Birth data should be
viewed together with Ancestry, Language Spoken at Home and Religion.
Birthplace
Birthplace - ranked by size
Indigo Shire 2006 2001 Change
Country of birth Number % Regional VIC Number % Regional VIC 2001 to 2006
United Kingdom 552 3.7 3.5 524 3.7 3.7 +28
New Zealand 83 0.6 0.9 94 0.7 0.7 -11
Germany 81 0.5 0.5 106 0.7 0.5 -25
Netherlands 78 0.5 0.6 80 0.6 0.7 -2
United States of America 28 0.2 0.2 20 0.1 0.1 +8
Philippines 26 0.2 0.2 18 0.1 0.2 +8
Italy 23 0.2 0.7 23 0.2 0.8 0
Croatia 20 0.1 0.2 21 0.1 0.2 -1
Excludes countries with fewer than 20 people, or less than 0.1% of the total population.
Birthplace - summary
Indigo Shire 2006 2001 Change
Birthplace Number % Regional VIC Number % Regional VIC 2001 to 2006
Total Overseas born 1,160 7.8 10.1 1,128 7.9 9.8 +32
Non-English speaking
backgrounds
454 3.1 5.2 437 3.1 4.9 +17
Main English speaking
countries
706 4.8 4.9 691 4.9 4.9 +15
Australia 12,819 86.6 84.3 12,429 87.6 85.2 +390
Not Stated 820 5.5 5.6 638 4.5 5.1 +182
Total Population 14,799 100.0 100.0 14,195 100.0 100.0 +604
Source: Australian Bureau of Statistics, Census of Population and Housing 2001 and 2006. Compiled and presented in profile.id by.id, the population experts.
Page 15 of 81

Country of birth, 2006
Source: Australian Bureau of Statistics, Census of Population and Housing, 2006 (Usual residence data)Compiled and presented in profile.id by .id, the population experts.
Change in country of birth, 2001 to 2006
Source: Australian Bureau of Statistics, Census of Population and Housing, 2001 and 2006 (Usual residence data)Compiled and presented in profile.id by .id, the population experts.
Page 16 of 81

Dominant groups
Analysis of the country of birth of the population in Indigo Shire in 2006 compared to Regional VIC shows that there
was a smaller proportion of people born overseas, as well as a smaller proportion of people from a non-English
speaking background.
Overall, 7.8% of the population was born overseas, and 3.1% were from a non-English speaking background,
compared with 10.1% and 5.2% respectively for Regional VIC.
There were no major differences between Indigo Shire and Regional VIC in 2006.
Emerging groups
Between 2001 and 2006, the number of people born overseas increased by 32 or 2.8%, and the number of people
from a non-English speaking background increased by 17 or 3.9%.
There were no major differences in Indigo Shire between 2001 and 2006.
Page 17 of 81

The Year of Arrival data records when the overseas born population arrived in Australia. The data shows the degree
to which areas are 'ports' for new overseas migrants and reveals the role of Indigo Shire in housing the overseas-
born. The number of recent arrivals in an area is often determined by housing affordability, employment opportunities
and pre-existing communities located in the area.
Indigo Shire's Year of Arrival data, when used with Birthplace, Religion and Language Spoken at Home data, is a
good indicator of the likely need for services in migrant communities.
Year of arrival in Australia
Year of arrival in Australia
Indigo Shire 2006Year of arrival in Australia Number % Regional VIC
2006 to 9 Aug 2011 10 0.9 2.0
2001 to 2005 46 4.0 9.3
1991 to 2000 (10 year period) 95 8.2 9.5
1981 to 1990 (10 year period) 929 80.2 73.7
1971 to 1980 (10 year period) 0 0.0 0.0
1961 to 1970 (10 year period) 0 0.0 0.0
Arrived in 1960 or earlier 0 0.0 0.0
Not stated 78 6.7 5.5
Total 1,158 100.0 100.0
Source: Australian Bureau of Statistics, Census of Population and Housing 2001 and 2006. Compiled and presented in profile.id by.id, the population experts.
Year of arrival in Australia, 2006
Source: Australian Bureau of Statistics, Census of Population and Housing, 2006 (Usual residence data)Compiled and presented in profile.id by .id, the population experts.
Page 18 of 81

Dominant groups
Analysis of the year of arrival for the overseas born population of Indigo Shire in 2006 compared to Regional VIC
shows that there was a larger proportion of people who arrived before 2001, and a smaller proportion of recent
arrivals (those who arrived between 2006 and 2011).
Overall, 88.4% of the overseas born population arrived before 2001, and 0.9% arrived during or after 2006,
compared with 83.2% and 2.0% respectively for Regional VIC.
The major differences between the year of arrival data of Indigo Shire and Regional VIC were:
A larger percentage of arrivals between 1981 and 1990 (80.2% compared to 73.7%)
A smaller percentage of arrivals between 2001 and 2005 (4.0% compared to 9.3%)
A smaller percentage of arrivals between 1991 and 2000 (8.2% compared to 9.5%)
A smaller percentage of arrivals between 2006 and 9 Aug 2011 (0.9% compared to 2.0%)
Page 19 of 81
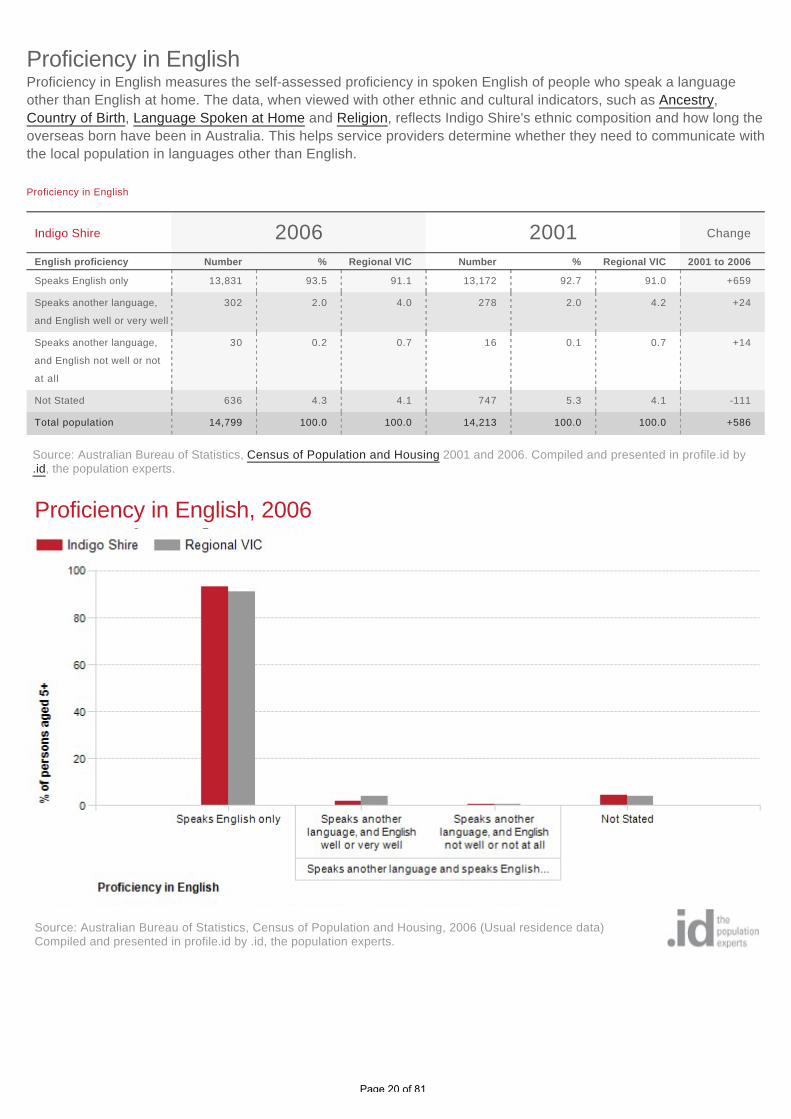
Proficiency in English measures the self-assessed proficiency in spoken English of people who speak a language
other than English at home. The data, when viewed with other ethnic and cultural indicators, such as Ancestry,
Country of Birth, Language Spoken at Home and Religion, reflects Indigo Shire's ethnic composition and how long the
overseas born have been in Australia. This helps service providers determine whether they need to communicate with
the local population in languages other than English.
Proficiency in English
Proficiency in English
Indigo Shire 2006 2001 Change
English proficiency Number % Regional VIC Number % Regional VIC 2001 to 2006
Speaks English only 13,831 93.5 91.1 13,172 92.7 91.0 +659
Speaks another language,
and English well or very well
302 2.0 4.0 278 2.0 4.2 +24
Speaks another language,
and English not well or not
at all
30 0.2 0.7 16 0.1 0.7 +14
Not Stated 636 4.3 4.1 747 5.3 4.1 -111
Total population 14,799 100.0 100.0 14,213 100.0 100.0 +586
Source: Australian Bureau of Statistics, Census of Population and Housing 2001 and 2006. Compiled and presented in profile.id by.id, the population experts.
Proficiency in English, 2006
Source: Australian Bureau of Statistics, Census of Population and Housing, 2006 (Usual residence data)Compiled and presented in profile.id by .id, the population experts.
Page 20 of 81

Dominant groups
Analysis of the proficiency in English data for Indigo Shire in 2006 compared to Regional VIC shows that there was a
higher proportion of persons who spoke English only, and a lower proportion of persons who spoke another language
and English not well or not at all.
Overall, 93.5% of persons spoke English only, and 0.2% spoke another language and English not well or not at all,
compared with 91.1% and 0.7% respectively for Regional VIC.
Emerging groups
The most significant change in the proficiency in English of the population in this area between 2001 and 2006 was in
those speaking:
Speaks English only (+659 persons)
Change in proficiency in English, 2001 to 2006
Source: Australian Bureau of Statistics, Census of Population and Housing, 2001 and 2006 (Usual residence data)Compiled and presented in profile.id by .id, the population experts.
Page 21 of 81

Indigo Shire's language statistics show the proportion of the population who speak a language at home other than
English. They indicate how culturally diverse a population is and the degree to which different ethnic groups and
nationalities are retaining their language.
Indigo Shire's language statistics should be analysed in conjunction with Country of Birth and Proficiency in English to
assist in identifying specific cultural and ethnic groups in the area and the services required by the multicultural
community.
Language spoken at home
Language spoken at home - ranked by size
Indigo Shire 2006 2001 Change
Language (excludesEnglish) Number % Regional VIC Number % Regional VIC 2001 to 2006
German 65 0.4 0.3 56 0.4 0.3 +9
Italian 34 0.2 1.0 26 0.2 1.2 +8
Dutch 27 0.2 0.2 27 0.2 0.3 0
Excludes languages with fewer than 20 people speaking them at home, or less than 0.1% of the total population.
Language - summary
Indigo Shire 2006 2001 Change
Language summary Number % Regional VIC Number % Regional VIC 2001 to 2006
Speaks English only 13,836 93.5 91.1 13,172 92.7 91.0 +664
Non-English total 317 2.1 4.7 253 1.8 4.6 +64
Not stated 645 4.4 4.2 782 5.5 4.4 -137
Total Population 14,798 100.0 100.0 14,207 100.0 100.0 +591
Source: Australian Bureau of Statistics, Census of Population and Housing 2001 and 2006. Compiled and presented in profile.id by.id, the population experts.
Page 22 of 81

Language spoken at home, 2006
Source: Australian Bureau of Statistics, Census of Population and Housing, 2006 (Usual residence data)Compiled and presented in profile.id by .id, the population experts.
Change in language spoken at home, 2001 to 2006
Source: Australian Bureau of Statistics, Census of Population and Housing, 2001 and 2006 (Usual residence data)Compiled and presented in profile.id by .id, the population experts.
Page 23 of 81

Dominant groups
Analysis of the language spoken at home by the population of Indigo Shire in 2006 compared to Regional VIC shows
that there was a larger proportion of people who spoke English only, and a smaller proportion of those speaking a
non-English language (either exclusively, or in addition to English).
Overall, 93.5% of the population spoke English only, and 2.1% spoke a non-English language, compared with 91.1%
and 4.7% respectively for Regional VIC.
The dominant language spoken at home, other than English, in Indigo Shire was German, with 0.4% of the
population, or 65 people speaking this language at home.
There were no major differences between Indigo Shire and Regional VIC in 2006.
Emerging groups
Between 2001 and 2006, the number of people who spoke a language other than English at home increased by 64 or
25.3%, and the number of people who spoke English only increased by 664 or 5.0%.
There were no major differences in Indigo Shire between 2001 and 2006.
Page 24 of 81

Indigo Shire's religion statistics provide an indicator of cultural identity and ethnicity when observed in conjunction with
other key variables. Religion data reveal the major concentrations of religions as well as revealing the proportion of
people with no religious affiliation. There are a number of reasons for different religious compositions across areas
including the country of birth and ethnic background of the population, the age of the population (belief in religion is
generally stronger, the older the population) and changes in values and belief systems.
Indigo Shire's religion statistics should be analysed in conjunction with other ethnicity statistics such as Country of
Birth data and Language Spoken data to assist in identifying specific cultural and ethnic groups.
Religion
Religions - ranked by size
Indigo Shire 2006 2001 Change
Religion Number % Regional VIC Number % Regional VIC 2001 to 2006
Western (Roman) Catholic 3,518 23.8 25.0 3,467 24.4 25.6 +51
Anglican 3,250 22.0 17.8 3,201 22.5 19.4 +49
Uniting Church 1,277 8.6 9.9 1,331 9.4 11.5 -54
Presbyterian and Reformed 537 3.6 4.5 570 4.0 5.2 -33
Christian,nfd 281 1.9 1.4 227 1.6 1.1 +54
Lutheran 221 1.5 1.4 202 1.4 1.4 +19
Baptist 208 1.4 1.4 204 1.4 1.4 +4
Pentecostal 98 0.7 0.9 115 0.8 0.9 -17
Buddhism 77 0.5 0.5 45 0.3 0.4 +32
Jehova's Witnesses 37 0.3 0.3 67 0.5 0.3 -30
Excludes religions with fewer than 20 adherents, or less than 0.1% of the total population.
Religions - summary
Indigo Shire 2006 2001 Change
Religion totals Number % Regional VIC Number % Regional VIC 2001 to 2006
Christian total 9,613 65.0 64.9 9,598 67.6 69.4 +15
Non Christian total 139 0.9 1.5 91 0.6 1.1 +48
Non-classifiable religious
belief
92 0.6 0.7 232 1.6 1.9 -140
No religion 3,349 22.6 21.5 2,537 17.9 17.5 +812
Not stated 1,604 10.8 11.4 1,744 12.3 10.1 -140
Total Population 14,797 100.0 100.0 14,202 100.0 100.0 +595
Source: Australian Bureau of Statistics, Census of Population and Housing 2001 and 2006. Compiled and presented in profile.id by.id, the population experts.
Page 25 of 81

Religion, 2006
Source: Australian Bureau of Statistics, Census of Population and Housing, 2006 (Usual residence data)Compiled and presented in profile.id by .id, the population experts.
Change in religion, 2001 to 2006
Source: Australian Bureau of Statistics, Census of Population and Housing, 2001 and 2006 (Usual residence data)Compiled and presented in profile.id by .id, the population experts.
Page 26 of 81

Dominant groups
Analysis of the religious affiliation of the population of Indigo Shire in 2006 compared to Regional VIC shows that
there was a similar proportion of people who professed a religion and a higher proportion who stated they had no
religion.
Overall, 65.9% of the population nominated a religion, and 22.6% said they had no religion, compared with 66.4%
and 21.5% respectively for Regional VIC.
The largest single religion in Indigo Shire was Western (Roman) Catholic, with 23.8% of the population or 3,518
people as adherents.
The major differences between the religious affiliation for the population of Indigo Shire and Regional VIC were:
A larger percentage who nominated Anglican (22.0% compared to 17.8%)
A smaller percentage who nominated Western (Roman) Catholic (23.8% compared to 25.0%)
A smaller percentage who nominated Uniting Church (8.6% compared to 9.9%)
Emerging groups
The largest changes in the religious affiliation of the population in Indigo Shire between 2001 and 2006 were for
those who nominated:
Uniting Church (-54 persons)
Christian,nfd (+54 persons)
Western (Roman) Catholic (+51 persons)
Page 27 of 81
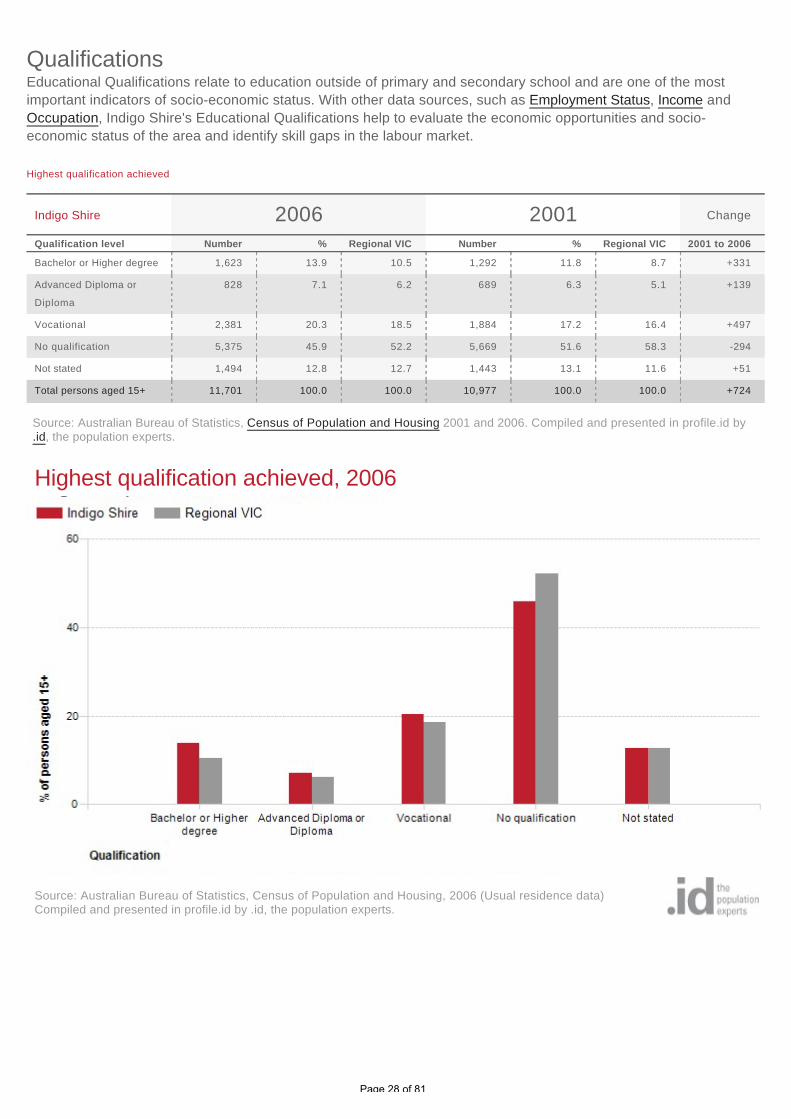
Educational Qualifications relate to education outside of primary and secondary school and are one of the most
important indicators of socio-economic status. With other data sources, such as Employment Status, Income and
Occupation, Indigo Shire's Educational Qualifications help to evaluate the economic opportunities and socio-
economic status of the area and identify skill gaps in the labour market.
Qualifications
Highest qualification achieved
Indigo Shire 2006 2001 Change
Qualification level Number % Regional VIC Number % Regional VIC 2001 to 2006
Bachelor or Higher degree 1,623 13.9 10.5 1,292 11.8 8.7 +331
Advanced Diploma or
Diploma
828 7.1 6.2 689 6.3 5.1 +139
Vocational 2,381 20.3 18.5 1,884 17.2 16.4 +497
No qualification 5,375 45.9 52.2 5,669 51.6 58.3 -294
Not stated 1,494 12.8 12.7 1,443 13.1 11.6 +51
Total persons aged 15+ 11,701 100.0 100.0 10,977 100.0 100.0 +724
Source: Australian Bureau of Statistics, Census of Population and Housing 2001 and 2006. Compiled and presented in profile.id by.id, the population experts.
Highest qualification achieved, 2006
Source: Australian Bureau of Statistics, Census of Population and Housing, 2006 (Usual residence data)Compiled and presented in profile.id by .id, the population experts.
Page 28 of 81

Dominant groups
Analysis of the qualifications of the population in Indigo Shire in 2006 compared to Regional VIC shows that there was
a higher proportion of people holding formal qualifications (Bachelor or higher degree; Advanced Diploma or Diploma;
or Vocational qualifications), and a lower proportion of people with no formal qualifications.
Overall, 41.3% of the population aged 15 and over held educational qualifications, and 45.9% had no qualifications,
compared with 35.1% and 52.2% respectively for Regional VIC.
The major differences between qualifications held by the population of Indigo Shire and Regional VIC were:
A larger percentage of persons with Bachelor or Higher degrees (13.9% compared to 10.5%)
A larger percentage of persons with Vocational qualifications (20.3% compared to 18.5%)
A smaller percentage of persons with No qualifications (45.9% compared to 52.2%)
Emerging groups
The largest changes in the qualifications of the population in Indigo Shire between 2001 and 2006 were in those with:
Vocational qualifications (+497 persons)
Bachelor or Higher degrees (+331 persons)
No qualifications (-294 persons)
Advanced Diploma or Diplomas (+139 persons)
Change in highest qualification achieved, 2001 to 2006
Source: Australian Bureau of Statistics, Census of Population and Housing, 2001 and 2006 (Usual residence data)Compiled and presented in profile.id by .id, the population experts.
Page 29 of 81

Indigo Shire's school completion data is a useful indicator of socio-economic status. With other indicators, such as
Proficiency in English, the data informs planners and decision-makers about people's ability to access services.
Combined with Educational Qualifications it also allows assessment of the skill base of the population.
Highest level of schooling
Highest level of secondary schooling completed
Indigo Shire 2006 2006 Change
Level of schooling Number % Regional VIC Number % Regional VIC 2006 to 2006
Year 8 or below 922 7.9 10.2 922 7.9 10.2 0
Year 9 or equivalent 1,140 9.8 10.3 1,140 9.8 10.3 0
Year 10 or equivalent 2,707 23.2 20.9 2,707 23.2 20.9 0
Year 11 or equivalent 1,975 16.9 17.2 1,975 16.9 17.2 0
Year 12 or equivalent 3,807 32.6 31.4 3,807 32.6 31.4 0
Did not go to school 24 0.2 0.5 24 0.2 0.5 0
Not stated 1,115 9.5 9.5 1,115 9.5 9.5 0
Total persons aged 15+ 11,690 100.0 100.0 11,690 100.0 100.0 0
Source: Australian Bureau of Statistics, Census of Population and Housing 2006 and 2006. Compiled and presented in profile.id by.id, the population experts.
Highest level of schooling completed, 2006
Source: Australian Bureau of Statistics, Census of Population and Housing, 2006 (Usual residence data)Compiled and presented in profile.id by .id, the population experts.
Page 30 of 81

Dominant groups
Analysis of the highest level of schooling attained by the population in Indigo Shire in 2006 compared to Regional VIC
shows that there was a lower proportion of people who had left school at an early level (Year 10 or less) and a higher
proportion of people who completed Year 12 or equivalent.
Overall, 41.0% of the population left school at Year 10 or below, and 32.6% went on to complete Year 12 or
equivalent, compared with 42.0% and 31.4% respectively for Regional VIC.
The major differences between the level of schooling attained by the population in Indigo Shire and Regional VIC
were:
A larger percentage of persons who completed year 10 or equivalent (23.2% compared to 20.9%)
A larger percentage of persons who completed year 12 or equivalent (32.6% compared to 31.4%)
A smaller percentage of persons who completed year 8 or below (7.9% compared to 10.2%)
Emerging groups
There were no major differences in Indigo Shire between 2006 and 2006.
Change in highest level of schooling completed, 2006 to 2006
Source: Australian Bureau of Statistics, Census of Population and Housing, 2006 and 2006 (Usual residence data)Compiled and presented in profile.id by .id, the population experts.
Page 31 of 81

The share of Indigo Shire's population attending educational institutions reflects the age structure of the population,
which influences the number of children attending school; proximity to tertiary education, which can mean young
adults leaving home to be nearer to educational facilities and; the degree to which people are seeking out
educational opportunities in adulthood, especially in their late teens and early twenties.
This data is often combined with Age Structure to identify areas with significant university student populations.
Education institution attending
Education institute attending
Indigo Shire 2006 2001 Change
Type of institute Number % Regional VIC Number % Regional VIC 2001 to 2006
Pre-school 260 1.8 1.5 217 1.5 1.5 +43
Primary school 1,407 9.5 8.9 1,586 11.2 10.1 -179
Primary - Government 1,103 7.5 6.5 1,198 8.4 7.5 -95
Primary - Catholic 239 1.6 1.8 322 2.3 2.0 -83
Primary - Independent 65 0.4 0.6 66 0.5 0.5 -1
Secondary school 1,244 8.4 7.4 1,296 9.1 7.8 -52
Secondary - Government 955 6.5 4.8 1,022 7.2 5.4 -67
Secondary - Catholic 217 1.5 1.6 218 1.5 1.6 -1
Secondary - Independent 72 0.5 0.9 56 0.4 0.8 +16
TAFE 343 2.3 1.9 369 2.6 2.3 -26
University 261 1.8 2.0 282 2.0 2.2 -21
Other 61 0.4 0.6 72 0.5 0.6 -11
Not attending 10,201 68.9 70.3 9,629 67.7 71.3 +572
Not stated 1,023 6.9 7.3 763 5.4 4.2 +260
Total 14,800 100.0 100.0 14,214 100.0 100.0 +586
Source: Australian Bureau of Statistics, Census of Population and Housing 2001 and 2006. Compiled and presented in profile.id by.id, the population experts.
Page 32 of 81
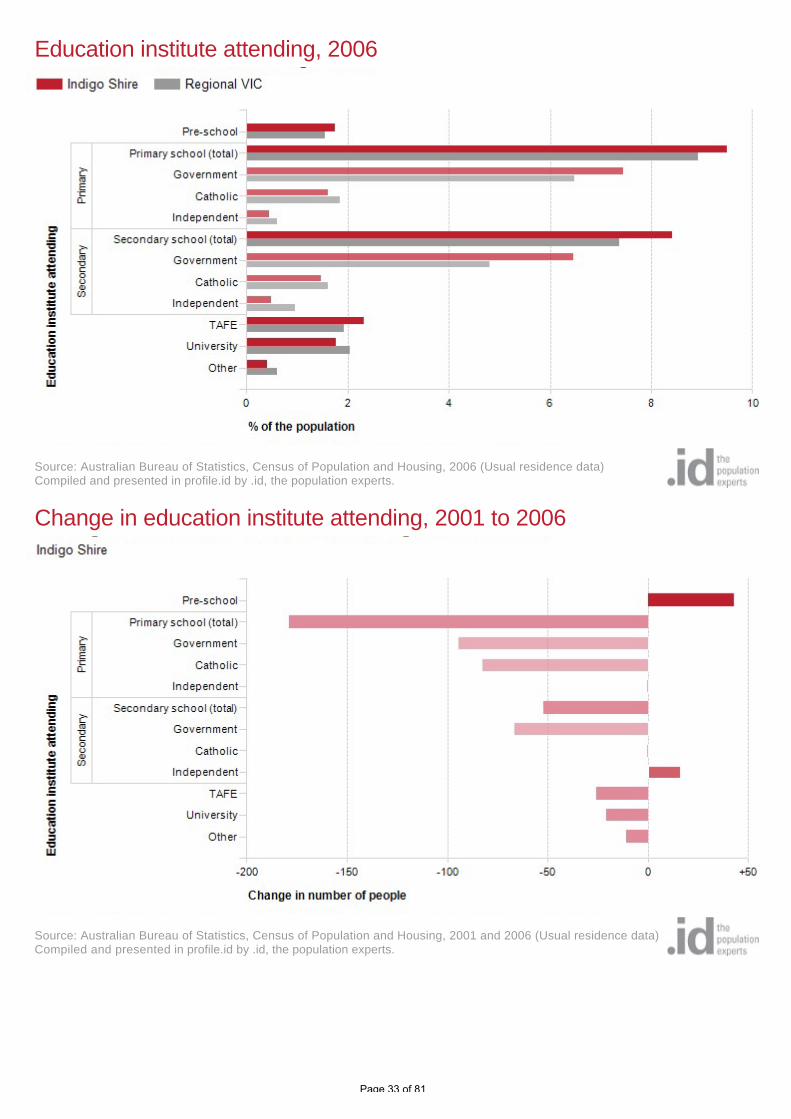
Education institute attending, 2006
Source: Australian Bureau of Statistics, Census of Population and Housing, 2006 (Usual residence data)Compiled and presented in profile.id by .id, the population experts.
Change in education institute attending, 2001 to 2006
Source: Australian Bureau of Statistics, Census of Population and Housing, 2001 and 2006 (Usual residence data)Compiled and presented in profile.id by .id, the population experts.
Page 33 of 81

Dominant groups
Analysis of the share of the population attending educational institutions in Indigo Shire in 2006 compared to
Regional VIC shows that there was a higher proportion attending primary school, a higher proportion attending
secondary school, and a similar proportion engaged in tertiary level education.
Overall, 9.5% of the population were attending primary school, 8.4% of the population were attending secondary
institutions, and 4.1% were learning at a tertiary level, compared with 8.9%, 7.4% and 4.0% respectively for Regional
VIC.
The major differences between the share of the population attending learning institutions in Indigo Shire and Regional
VIC were:
A larger percentage of persons attending a Catholic secondary school (6.5% compared to 4.8%)
A larger percentage of persons attending a Government secondary school (8.4% compared to 7.4%)
A smaller percentage of persons not attending (68.9% compared to 70.3%)
Emerging groups
From 2001 to 2006, Indigo Shire's population aged 15 years and over increased by 586 people (+4.1%). This
represents an average annual change of 0.81% per year over the period.
The largest changes in the number of people attending education institutions in Indigo Shire, between 2001 and 2006
were in those who nominated:
Primary school (-179 persons)
Primary - Government (-95 persons)
Primary - Catholic (-83 persons)
Secondary - Government (-67 persons)
Page 34 of 81

Indigo Shire's disability statistics relate directly to need for assistance due to a severe or profound disability. The
information may be used in the planning of local facilities, services such as day-care and occasional care and in the
provision of information and support to carers. Indigo Shire's disability statistics help in understanding the prevalence
of people who need support in the community, and along with information on Unpaid Care to a person with a disability,
how that support is provided.
Please note: A person's reported need for assistance is based on a subjective assessment and should therefore be
treated with caution. See the specific data notes for further detail.
Need for assistance
Need for assistance with core activities
Indigo Shire 2006 2006 Change
Assistance needed by agegroup (years) Number
% of total agegroup Regional VIC Number
% of total agegroup Regional VIC 2006 to 2006
0 to 4 6 0.7 1.0 6 0.7 1.0 0
5 to 9 13 1.3 2.4 13 1.3 2.4 0
10 to 19 21 0.9 2.1 21 0.9 2.1 0
20 to 59 175 2.3 2.8 175 2.3 2.8 0
60 to 64 49 5.7 5.8 49 5.7 5.8 0
65 to 69 49 7.3 6.1 49 7.3 6.1 0
70 to 74 30 6.1 8.3 30 6.1 8.3 0
75 to 79 80 18.1 13.5 80 18.1 13.5 0
80 to 84 97 32.3 24.9 97 32.3 24.9 0
85 and over 151 58.1 47.0 151 58.1 47.0 0
Total persons needing
assistance
671 4.5 4.9 671 4.5 4.9 0
Need for assistance with core activities
Indigo Shire 2006 2006 Change
Assistance needed by agegroup (years) Number % Regional VIC Number % Regional VIC 2006 to 2006
Total persons needing
assistance
671 4.5 4.9 671 4.5 4.9 0
Total persons not needing
assistance
13,372 90.4 90.1 13,372 90.4 90.1 0
Not stated 757 5.1 5.1 757 5.1 5.1 0
Total population 14,800 100.0 100.0 14,800 100.0 100.0 0
Source: Australian Bureau of Statistics, Census of Population and Housing 2006 and 2006. Compiled and presented in profile.id by.id, the population experts.
Page 35 of 81

Need for assistance with core activities, 2006
Source: Australian Bureau of Statistics, Census of Population and Housing, 2006 (Usual residence data)Compiled and presented in profile.id by .id, the population experts.
Change in need for assistance with core activities, 2006 to 2006
Source: Australian Bureau of Statistics, Census of Population and Housing, 2006 and 2006 (Usual residence data)Compiled and presented in profile.id by .id, the population experts.
Page 36 of 81

Dominant groups
Analysis of the need for assistance of persons in Indigo Shire compared to Regional VIC shows that there was a
similar proportion of persons who reported needing assistance with core activities.
Overall, 4.5% of the population reported needing assistance with core activities, compared with 4.9% for Regional
VIC.
The major differences in the age groups reporting a need for assistance in Indigo Shire and Regional VIC were:
A larger percentage of persons aged 85 and over (58.1% compared to 47.0%)
A larger percentage of persons aged 80 to 84 (32.3% compared to 24.9%)
A larger percentage of persons aged 75 to 79 (18.1% compared to 13.5%)
A larger percentage of persons aged 65 to 69 (7.3% compared to 6.1%)
Emerging groups
There were no major differences in Indigo Shire between 2006 and 2006.
Page 37 of 81

Indigo Shire's employment statistics are an important indicator of socio-economic status. The levels of full or part-time
employment, unemployment and labour force participation indicate the strength of the local economy and social
characteristics of the population. Employment status is linked to a number of factors including Age Structure, which
influences the number of people in the workforce; the economic base and employment opportunities available in the
area and; the education and skill base of the population (Occupations, Industries, Qualifications).
Employment status
Employment status
Indigo Shire 2006 2001 Change
Employment status Number % Regional VIC Number % Regional VIC 2001 to 2006
Employed 7,028 96.4 94.3 6,246 94.7 92.6 +782
Employed full-time 4,270 58.5 57.4 3,968 60.1 57.9 +302
Employed part-time 2,564 35.2 34.3 2,092 31.7 31.7 +472
Hours worked not stated 194 2.7 2.6 186 2.8 3.0 +8
Unemployed 265 3.6 5.7 351 5.3 7.4 -86
Looking for full-time work 164 2.2 3.7 247 3.7 5.4 -83
Looking for part-time work 101 1.4 2.0 104 1.6 2.0 -3
Total Labour Force 7,293 100.0 100.0 6,597 100.0 100.0 +696
Labour force status
Indigo Shire 2006 2001 Change
Labour force status Number % Regional VIC Number % Regional VIC 2001 to 2006
Total Labour force 7,293 62.4 58.2 6,597 60.1 57.7 +696
Not in the labour force 3,842 32.9 36.4 3,872 35.3 38.4 -30
Labour force status not stated 555 4.7 5.4 507 4.6 3.9 +48
Total persons aged 15+ 11,690 100.0 100.0 10,976 100.0 100.0 +714
Source: Australian Bureau of Statistics, Census of Population and Housing 2001 and 2006. Compiled and presented in profile.id by.id, the population experts.
Page 38 of 81

Employment status, 2006
Source: Australian Bureau of Statistics, Census of Population and Housing, 2006 (Usual residence data)Compiled and presented in profile.id by .id, the population experts.
Change in employment status, 2001 to 2006
Source: Australian Bureau of Statistics, Census of Population and Housing, 2001 and 2006 (Usual residence data)Compiled and presented in profile.id by .id, the population experts.
Page 39 of 81

Dominant groups
The size of Indigo Shire's labour force in 2006 was 7,293 persons, of which 2,564 were employed part-time and 4,270
were full time workers.
Analysis of the employment status (as a percentage of the labour force) in Indigo Shire in 2006 compared to Regional
VIC shows that there was a higher proportion in employment, and a lower proportion unemployed. Overall, 96.4% of
the labour force was employed (60.1% of the population aged 15+), and 3.6% unemployed (2.3% of the population
aged 15+), compared with 94.3% and 5.7% respectively for Regional VIC.
The labour force participation rate refers to the proportion of the population over 15 years of age that was employed
or actively looking for work. "The labour force is a fundamental input to domestic production. Its size and composition
are therefore crucial factors in economic growth. From the viewpoint of social development, earnings from paid work
are a major influence on levels of economic well-being." (Australian Social Trends 1995).
Analysis of the labour force participation rate of the population in Indigo Shire in 2006 shows that there was a higher
proportion in the labour force (62.4%) compared with Regional VIC (58.2%).
Emerging groups
Between 2001 and 2006, the number of people employed in Indigo Shire showed an increase of 782 persons and the
number unemployed showed a decrease of 86 persons. In the same period, the number of people in the labour force
showed an increase of 696 persons, or 10.6%.
Page 40 of 81

Indigo Shire’s industry statistics identify the industry sectors in which the residents work (which may be within theresiding area or elsewhere). This will be influenced by the skill base and socio-economic status of the residents as
well as the industries and employment opportunities present in the region.
When viewed in conjunction with Residents Place of Work data and Method of Travel to Work, industry sector
statistics provide insights into the relationship between the economic and residential role of the area.
Industry sectors of employment
Industry sector of employment
Indigo Shire 2006 2006 Change
Industry sector Number % Regional VIC Number % Regional VIC 2006 to 2006
Agriculture, Forestry and
Fishing
750 10.7 9.5 750 10.7 9.5 0
Mining 24 0.3 0.6 24 0.3 0.6 0
Manufacturing 1,054 15.0 11.8 1,054 15.0 11.8 0
Electricity, Gas, Water and
Waste Services
28 0.4 1.3 28 0.4 1.3 0
Construction 543 7.7 8.1 543 7.7 8.1 0
Retail Trade 725 10.3 12.3 725 10.3 12.3 0
Wholesale trade 161 2.3 3.3 161 2.3 3.3 0
Accommodation and Food
Services
466 6.6 6.4 466 6.6 6.4 0
Transport, Postal and
Warehousing
265 3.8 4.0 265 3.8 4.0 0
Information Media and
Telecommunications
41 0.6 1.3 41 0.6 1.3 0
Financial and Insurance
Services
73 1.0 2.0 73 1.0 2.0 0
Rental, Hiring and Real
Estate Services
54 0.8 1.1 54 0.8 1.1 0
Professional, Scientific and
Technical Services
261 3.7 3.6 261 3.7 3.6 0
Administrative and Support
Services
146 2.1 2.6 146 2.1 2.6 0
Public Administration and
Safety
535 7.6 5.7 535 7.6 5.7 0
Education and Training 578 8.2 7.8 578 8.2 7.8 0
Health Care and Social
Assistance
892 12.7 11.5 892 12.7 11.5 0
Arts and Recreation Services 58 0.8 1.2 58 0.8 1.2 0
Other Services 228 3.2 3.5 228 3.2 3.5 0
Inadequately described or
not stated
147 2.1 2.3 147 2.1 2.3 0
Total employed persons
aged 15+
7,029 100.0 100.0 7,029 100.0 100.0 0
Source: Australian Bureau of Statistics, Census of Population and Housing 2006 and 2006. Compiled and presented in profile.id by.id, the population experts.
Page 41 of 81

Industry sector of employment, 2006
Source: Australian Bureau of Statistics, Census of Population and Housing, 2006 (Usual residence data)Compiled and presented in profile.id by .id, the population experts.
Page 42 of 81

Change in industry sector of employment, 2006 to 2006
Source: Australian Bureau of Statistics, Census of Population and Housing, 2006 and 2006 (Usual residence data)Compiled and presented in profile.id by .id, the population experts.
Page 43 of 81

Indigo Shire's occupation statistics quantify the occupations in which the residents work (which may be within the
residing area or elsewhere). This will be influenced by the economic base and employment opportunities available in
the area, education levels, and the working and social aspirations of the population. When viewed with other
indicators, such as Educational Qualifications and Individual Income, Occupation is a key measure for evaluating
Indigo Shire's socio-economic status and skill base.
Occupations of employment
Occupation of employment
Indigo Shire 2006 2006 Change
Occupation Number % Regional VIC Number % Regional VIC 2006 to 2006
Managers 1,304 18.6 16.4 1,304 18.6 16.4 0
Professionals 1,278 18.2 15.5 1,278 18.2 15.5 0
Technicians and Trades
Workers
1,011 14.4 15.3 1,011 14.4 15.3 0
Community and Personal
Service Workers
586 8.3 9.1 586 8.3 9.1 0
Clerical and Administrative
Workers
740 10.5 11.7 740 10.5 11.7 0
Sales Workers 515 7.3 9.9 515 7.3 9.9 0
Machinery Operators And
Drivers
480 6.8 7.0 480 6.8 7.0 0
Labourers 1,010 14.4 13.3 1,010 14.4 13.3 0
Inadequately described 105 1.5 1.8 105 1.5 1.8 0
Total employed persons
aged 15+
7,029 100.0 100.0 7,029 100.0 100.0 0
Source: Australian Bureau of Statistics, Census of Population and Housing 2006 and 2006. Compiled and presented in profile.id by.id, the population experts.
Page 44 of 81

Occupation of employment, 2006
Source: Australian Bureau of Statistics, Census of Population and Housing, 2006 (Usual residence data)Compiled and presented in profile.id by .id, the population experts.
Change in occupation of employment, 2006 to 2006
Source: Australian Bureau of Statistics, Census of Population and Housing, 2006 and 2006 (Usual residence data)Compiled and presented in profile.id by .id, the population experts.
Page 45 of 81

Dominant groups
An analysis of the jobs held by the resident population in Indigo Shire in 2006 shows the three most popular
occupations were:
Managers (1,304 people or 18.6%)
Professionals (1,278 people or 18.2%)
Technicians and Trades Workers (1,011 people or 14.4%)
In combination these three occupations accounted for 3,593 people in total or 51.1% of the employed resident
population.
In comparison, Regional VIC employed 16.4% in Managers; 15.5% in Professionals; and 15.3% in Technicians and
Trades Workers.
The major differences between the jobs held by the population of Indigo Shire and Regional VIC were:
A larger percentage of persons employed as Professionals (18.2% compared to 15.5%)
A larger percentage of persons employed as Managers (18.6% compared to 16.4%)
A larger percentage of persons employed as Labourers (14.4% compared to 13.3%)
A smaller percentage of persons employed as Sales Workers (7.3% compared to 9.9%)
Emerging groups
The number of employed people in Indigo Shire remained stable 0 between 2006 and 2006.
There were no major differences in Indigo Shire between 2006 and 2006.
Page 46 of 81

Indigo Shire's commuting statistics reveal the main modes of transport by which residents get to work. There are a
number of reasons why people use different modes of transport to get to work including the availability of affordable
and effective public transport options, the number of motor vehicles available within a household, and the distance
travelled to work.
Commuting data is very useful in transport planning as it informs decision-makers about the availability, effectiveness
and utilisation of local transport options, particularly when analysed with Residents Place of Work data and Car
Ownership.
Method of travel to work
Method of travel to work
Indigo Shire 2006 2001 Change
Main method of travel Number % Regional VIC Number % Regional VIC 2001 to 2006
Train 6 0.1 0.7 3 0.0 0.7 +3
Bus 31 0.5 0.7 18 0.3 0.7 +13
Tram or Ferry 3 0.0 0.0 0 0.0 0.0 +3
Taxi 3 0.0 0.2 3 0.0 0.1 0
Car - as driver 4,316 63.1 62.3 3,706 60.8 59.9 +610
Car - as passenger 396 5.8 5.4 323 5.3 5.7 +73
Truck 98 1.4 1.2 100 1.6 1.5 -2
Motorbike 38 0.6 0.6 47 0.8 0.6 -9
Bicycle 43 0.6 1.1 48 0.8 1.2 -5
Walked only 328 4.8 5.3 299 4.9 5.2 +29
Other 86 1.3 1.2 49 0.8 1.5 +37
Worked at home 614 9.0 7.4 646 10.6 8.9 -32
Did not go to work 757 11.1 12.0 735 12.1 11.9 +22
Not stated 116 1.7 1.9 114 1.9 2.0 +2
Total employed persons
aged 15+
6,835 100.0 100.0 6,091 100.0 100.0 +744
Source: Australian Bureau of Statistics, Census of Population and Housing 2001 and 2006. Compiled and presented in profile.id by.id, the population experts.
Page 47 of 81

Method of travel to work, 2006
Source: Australian Bureau of Statistics, Census of Population and Housing, 2006 (Enumerated data)Compiled and presented in profile.id by .id, the population experts.
Change in method of travel to work, 2001 to 2006
Source: Australian Bureau of Statistics, Census of Population and Housing, 2001 and 2006 (Enumerated data)Compiled and presented in profile.id by .id, the population experts.
Page 48 of 81

Dominant groups
In 2006, there were 40 people who caught public transport to work (train, bus, tram or ferry) in Indigo Shire, compared
with 4,848 who drove in private vehicles (car – as driver, car – as passenger, motorbike, or truck).
Analysis of the method of travel to work of the residents in Indigo Shire in 2006 compared to Regional VIC shows that
0.6% used public transport, while 70.9% used a private vehicle, compared with 1.4% and 69.5% respectively in
Regional VIC.
The major difference between the method of travel to work of Indigo Shire and Regional VIC was:
A larger percentage of persons who worked at home (9.0% compared to 7.4%)
Emerging groups
The number of employed people in Indigo Shire increased by 744 between 2001 and 2006.
The largest changes in the method of travel to work by resident population in Indigo Shire between 2001 and 2006
were for those nominated:
Car - as driver (+610 persons)
Car - as passenger (+73 persons)
Page 49 of 81

The voluntary work sector is an important part of Australia's economy. The level of volunteering can indicate the
cohesiveness of the community and how readily individuals are able to contribute to that community. Factors
impacting on the level of volunteering in Indigo Shire include the Age Structure of the population, the level of
Proficiency in English, Income and Education levels.
Volunteer work
Voluntary work
Indigo Shire 2006 2006 Change
Volunteer status Number % Regional VIC Number % Regional VIC 2006 to 2006
Volunteer 3,606 30.8 24.3 3,606 30.8 24.3 0
Not a volunteer 7,057 60.4 66.8 7,057 60.4 66.8 0
Volunteer work not stated 1,027 8.8 8.9 1,027 8.8 8.9 0
Total persons aged 15+ 11,690 100.0 100.0 11,690 100.0 100.0 0
Source: Australian Bureau of Statistics, Census of Population and Housing 2006 and 2006. Compiled and presented in profile.id by.id, the population experts.
Voluntary work, 2006
Source: Australian Bureau of Statistics, Census of Population and Housing, 2006 (Usual residence data)Compiled and presented in profile.id by .id, the population experts.
Page 50 of 81

Dominant groups
Analysis of the voluntary work performed by the population in Indigo Shire in 2006 compared to Regional VIC shows
that there was a higher proportion of persons who volunteered for an organisation or group.
Overall, 30.8% of the population reported performing voluntary work, compared with 24.3% for Regional VIC.
Emerging groups
The number of volunteers in Indigo Shire remained stable 0 people between 2006 and 2006.
Change in voluntary work, 2006 to 2006
Source: Australian Bureau of Statistics, Census of Population and Housing, 2006 and 2006 (Usual residence data)Compiled and presented in profile.id by .id, the population experts.
Page 51 of 81

The proportion of people providing unpaid care for the aged and disabled in Indigo Shire can be an important
indicator of the level of demand for aged care services and facilities by local and state governments. An increasing
proportion of carers among the population may indicate inadequate aged care provision, or the need for in-home
support, or support for the carers themselves. The level of care provided by individuals is likely to be affected by
Household Income, Age Structure and the ethnic makeup of the community (Language Spoken), as well as the sense
of community cohesiveness.
Unpaid care
Unpaid care
Indigo Shire 2006 2006 Change
Assistance to a person witha disability, long termillness or old age Number % Regional VIC Number % Regional VIC 2006 to 2006
Provided unpaid assistance 1,378 11.8 11.3 1,378 11.8 11.3 0
No unpaid assistance
provided
9,239 79.0 79.1 9,239 79.0 79.1 0
Not stated 1,073 9.2 9.7 1,073 9.2 9.7 0
Total persons aged 15+ 11,690 100.0 100.0 11,690 100.0 100.0 0
Source: Australian Bureau of Statistics, Census of Population and Housing 2006 and 2006. Compiled and presented in profile.id by.id, the population experts.
Unpaid care, 2006
Source: Australian Bureau of Statistics, Census of Population and Housing, 2006 (Usual residence data)Compiled and presented in profile.id by .id, the population experts.
Page 52 of 81
Dominant groups
Analysis of the unpaid care provided by the population in Indigo Shire in 2006 compared to Regional VIC shows that
there was a higher proportion of persons who provided unpaid care either to family members or others.
Overall, 11.8% of the population provided unpaid care, compared with 11.3% for Regional VIC.
Emerging groups
The number of people who provided unpaid assistance to a person with a disability, long term illness or old age in
Indigo Shire remained stable 0 people between 2006 and 2006.
Change in unpaid care, 2006 to 2006
Source: Australian Bureau of Statistics, Census of Population and Housing, 2006 and 2006 (Usual residence data)Compiled and presented in profile.id by .id, the population experts.
Page 53 of 81

Individual Income statistics are an indicator of socio-economic status. With other data sources, such as Household
Income, Educational Qualifications and Occupation, they help tell the story of the economic opportunities and socio-
economic status of Indigo Shire. The amount of income an individual receives is linked to a number of factors
including employment status, age (as for instance students and retirees often receive a lower income), qualifications
and type of employment.
The incomes presented on this page are for the latest Census year only. For comparison of incomes over time, go to
Individual Income Quartiles.
Individual income
Weekly individual gross income
Indigo Shire 2006Weekly income Number % Regional VIC
Negative Income/ Nil income -- -- 0.0
$1-$199 -- -- 0.0
$200-$299 -- -- 0.0
$300-$399 -- -- 0.0
$400-$599 -- -- 0.0
$600-$799 -- -- 0.0
$800-$999 -- -- 0.0
$1000-$1249 -- -- 0.0
$1250-$1499 -- -- 0.0
$1500-$1999 -- -- 0.0
$2000 or more -- -- 0.0
Not stated -- -- 0.0
Total persons aged 15+ 0 100.0 100.0
Source: Australian Bureau of Statistics, Census of Population and Housing 2011 and 2006. Compiled and presented in profile.id by.id, the population experts.
Page 54 of 81

Dominant groups
Analysis of individual income levels in Indigo Shire in 2006 compared to Regional VIC shows that there was a similar
proportion of persons earning a high income (those earning $1,500 per week or more) as well as a similar proportion
of low income persons (those earning less than $400 per week).
Overall, 0.0% of the population earned a high income, and 0.0% earned a low income, compared with 0.0% and 0.0%
respectively for Regional VIC.
There were no major differences between Indigo Shire and Regional VIC in 2006.
Weekly individual gross income, 2006
Source: Australian Bureau of Statistics, Census of Population and Housing, 2006 (Usual residence data)Compiled and presented in profile.id by .id, the population experts.
Page 55 of 81

Households form the common 'economic unit' in our society. Indigo Shire's Household Income is one of the most
important indicators of socio-economic status. With other data sources, such as Educational Qualifications and
Occupation, it helps to reveal the economic opportunities and socio-economic status of Indigo Shire. It is important to
note that income data is not necessarily a measure of wealth. For example, if an area has a large number of retirees
this will produce a higher proportion of households with low income but the retirees may have large capital wealth. For
this reason, household income should be viewed in conjunction with Age and Household Composition.
The incomes presented on this page are for the latest Census year only. For comparison of incomes over time, go to
Household Income Quartiles.
Household income
Weekly household income
Indigo Shire 2006Weekly income Number % Regional VIC
Negative Income/Nil Income -- -- 0.0
$1-$199 -- -- 0.0
$200-$299 -- -- 0.0
$300-$399 -- -- 0.0
$400-$599 -- -- 0.0
$600-$799 -- -- 0.0
$800-$999 -- -- 0.0
$1000-$1249 -- -- 0.0
$1250-$1499 -- -- 0.0
$1500-$1999 -- -- 0.0
$2000-$2499 -- -- 0.0
$2500-$2999 -- -- 0.0
$3000-$3499 -- -- 0.0
$3500-$3999 -- -- 0.0
$4000-$4999 -- -- 0.0
$5000 or more -- -- 0.0
Not stated -- -- 100.0
Total households 0 100.0 100.0
Source: Australian Bureau of Statistics, Census of Population and Housing 2011 and 2006. Compiled and presented in profile.id by.id, the population experts.
Page 56 of 81

Dominant groups
Analysis of household income levels in Indigo Shire in 2006 compared to Regional VIC shows that there was a similar
proportion of high income households (those earning $2,500 per week or more) as well as a similar proportion of low
income households (those earning less than $600 per week).
Overall, 0.0% of the households earned a high income, and 0.0% were low income households, compared with 0.0%
and 0.0% respectively for Regional VIC.
The major difference between the household incomes of Indigo Shire and Regional VIC is:
A larger percentage of households who earned Not stated (641000000.0% compared to 100.0%)
Weekly household income, 2006
Source: Australian Bureau of Statistics, Census of Population and Housing, 2006 (Enumerated data)Compiled and presented in profile.id by .id, the population experts.
Page 57 of 81

Indigo Shire's household and family structure is one of the most important demographic indicators. It reveals the
area's residential role and function, era of settlement and provides key insights into the level of demand for services
and facilities as most are related to age and household types.
To continue building the story, Indigo Shire's Household Summary should be viewed in conjunction with Households
with Children, Households without Children, Household Size, Age Structure and Dwelling Type.
Households summary
Household types
Indigo Shire 2006 2001 Change
Households by type Number % Regional VIC Number % Regional VIC 2001 to 2006
Couples with children 1,843 33.4 28.7 1,812 35.4 31.1 +31
Couples without children 1,595 28.9 27.6 1,456 28.5 26.8 +139
One parent families 474 8.6 10.4 502 9.8 10.2 -28
Other families 35 0.6 0.9 41 0.8 0.9 -6
Group household 117 2.1 2.8 105 2.1 2.8 +12
Lone person 1,263 22.9 25.7 1,072 21.0 24.8 +191
Other not classifiable
household
134 2.4 2.5 77 1.5 1.9 +57
Visitor only households 58 1.1 1.4 49 1.0 1.5 +9
Total households 5,519 100.0 100.0 5,114 100.0 100.0 +405
Source: Australian Bureau of Statistics, Census of Population and Housing 2001 and 2006. Compiled and presented in profile.id by.id, the population experts.
Household types, 2006
Source: Australian Bureau of Statistics, Census of Population and Housing, 2006 (Enumerated data)Compiled and presented in profile.id by .id, the population experts.
Page 58 of 81

Dominant groups
Analysis of the household/family types in Indigo Shire in 2006 compared to Regional VIC shows that there was a
higher proportion of couple families with child(ren) as well as a lower proportion of one-parent families. Overall, 33.4%
of total families were couple families with child(ren), and 8.6% were one-parent families, compared with 28.7% and
10.4% respectively for Regional VIC.
There were a lower proportion of lone person households and a higher proportion of couples without children.
Overall, the proportion of lone person households was 22.9% compared to 25.7% in Regional VIC while the
proportion of couples without children was 28.9% compared to 27.6% in Regional VIC.
Emerging groups
The number of households in Indigo Shire increased by 405 between 2001 and 2006.
The largest changes in family/household types in Indigo Shire between 2001 and 2006 were:
Lone person (+191 households)
Couples without children (+139 households)
Change in household types, 2001 to 2006
Source: Australian Bureau of Statistics, Census of Population and Housing, 2001 and 2006 (Enumerated data)Compiled and presented in profile.id by .id, the population experts.
Page 59 of 81

The size of households in general follows the life-cycle of families. Households are usually small at the stage of
relationship formation (early marriage), and then increase in size with the advent of children. They later reduce in size
again as these children reach adulthood and leave home. Household size can also be influenced by a lack (or
abundance) of affordable housing. Overseas migrants and indigenous persons often have a tradition of living with
extended family members which significantly affects household size.
Household size in Australia has declined since the 1970s but between 2006 and 2011, the average household size
remained stable for the nation as a whole.
An increasing household size in an area may indicate a lack of affordable housing opportunities for young people, an
increase in the birth rate or an increase in family formation in the area. A declining household size may indicate
children leaving the area when they leave home, an increase in retirees settling in the area, or an attraction of young
singles and couples to the area.
For greater insight, Indigo Shire's Household Size data should be viewed in conjunction with Household Summary,
Age Structure, Dwelling Type, Household Income and Language Spoken at Home.
Household size
Household size
Indigo Shire 2006 2001 Change
Number of persons usuallyresident Number % Regional VIC Number % Regional VIC 2001 to 2006
1 person 1,263 23.7 26.7 1,072 21.5 25.7 +191
2 persons 1,899 35.7 36.1 1,804 36.2 35.0 +95
3 persons 791 14.9 14.0 758 15.2 14.5 +33
4 persons 838 15.7 13.8 783 15.7 14.4 +55
5 persons 374 7.0 6.7 385 7.7 7.4 -11
6 or more persons 161 3.0 2.7 186 3.7 3.1 -25
Total classifiable households 5,326 100.0 100.0 4,988 100.0 100.0 +338
Source: Australian Bureau of Statistics, Census of Population and Housing 2001 and 2006. Compiled and presented in profile.id by.id, the population experts.
Page 60 of 81
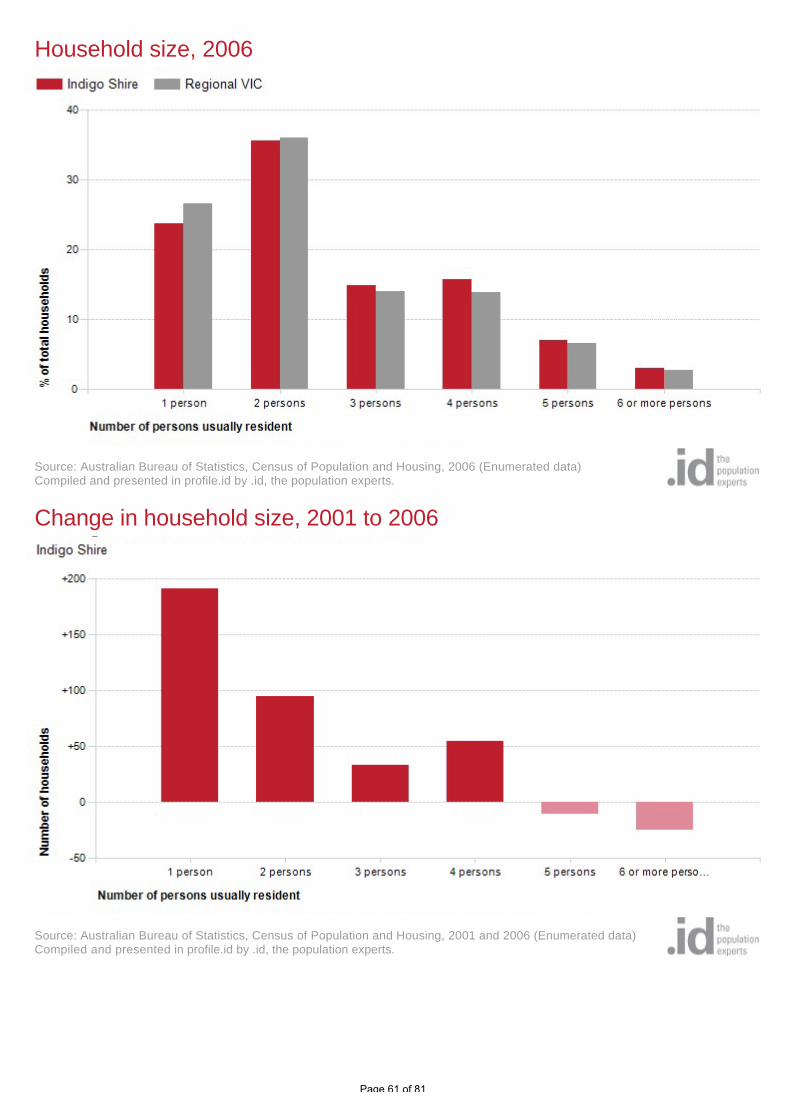
Household size, 2006
Source: Australian Bureau of Statistics, Census of Population and Housing, 2006 (Enumerated data)Compiled and presented in profile.id by .id, the population experts.
Change in household size, 2001 to 2006
Source: Australian Bureau of Statistics, Census of Population and Housing, 2001 and 2006 (Enumerated data)Compiled and presented in profile.id by .id, the population experts.
Page 61 of 81

Dominant groups
Analysis of the number of persons usually resident in a household in Indigo Shire compared with Regional VIC shows
that there were a lower proportion of lone person households, and a higher proportion of larger households (those
with 4 persons or more). Overall there were 23.7% of lone person households, and 25.8% of larger households,
compared with 26.7% and 23.2% respectively for Regional VIC.
The major differences in the household size for Indigo Shire and Regional VIC were:
A larger percentage of households with 4 persons usually resident (15.7% compared to 13.8%)
A smaller percentage of households with 1 person usually resident (23.7% compared to 26.7%)
Emerging groups
The number of households in Indigo Shire increased by 338 between 2001 and 2006.
The largest changes in the number of persons usually resident in a household in Indigo Shire between 2001 and
2006 were:
1 person (+191 households)
2 persons (+95 households)
4 persons (+55 households)
Page 62 of 81

Dwelling Type is an important determinant of Indigo Shire's residential role and function. A greater concentration of
higher density dwellings is likely to attract more young adults and smaller households, often renting. Larger, detached
or separate dwellings are more likely to attract families and prospective families. The residential built form often
reflects market opportunities or planning policy, such as building denser forms of housing around public transport
nodes or employment centres.
Dwelling Type statistics should be viewed in conjunction with Household size, Household Types, Housing Tenure and
Age Structure for a more complete picture of the housing market in Indigo Shire.
Dwelling type
Dwelling structure
Indigo Shire 2006 2001 Change
Dwelling type Number % Regional VIC Number % Regional VIC 2001 to 2006
Separate house 5,664 92.2 87.8 5,190 91.6 87.8 +474
Medium density 341 5.6 10.3 327 5.8 9.3 +14
High density 4 0.1 0.2 0 0.0 0.2 +4
Caravans, cabin, houseboat 68 1.1 1.1 53 0.9 1.2 +15
Other 66 1.1 0.6 81 1.4 0.7 -15
Not stated 0 0.0 0.0 15 0.3 0.7 -15
Total Private Dwellings 6,143 100.0 100.0 5,666 100.0 100.0 +477
Dwelling type
Indigo Shire 2006 2001 Change
Dwelling type Number % Regional VIC Number % Regional VIC 2001 to 2006
Occupied private dwellings 5,520 89.4 83.8 5,115 89.7 85.1 +405
Unoccupied private
dwellings
625 10.1 15.8 552 9.7 14.5 +73
Non private dwellings 32 0.5 0.4 37 0.6 0.4 -5
Total Dwellings 6,177 100.0 100.0 5,704 100.0 100.0 +473
Source: Australian Bureau of Statistics, Census of Population and Housing 2001 and 2006. Compiled and presented in profile.id by.id, the population experts.
Page 63 of 81

Dwelling structure, 2006
Source: Australian Bureau of Statistics, Census of Population and Housing, 2006 (Enumerated data)Compiled and presented in profile.id by .id, the population experts.
Change in dwelling structure, 2001 to 2006
Source: Australian Bureau of Statistics, Census of Population and Housing, 2001 and 2006 (Enumerated data)Compiled and presented in profile.id by .id, the population experts.
Page 64 of 81

Dominant groups
In 2006, there were 5,664 separate houses in the area, 341 medium density dwellings, and 4 high density dwellings.
In addition, there were 68 caravans/cabins/houseboats in the area.
Analysis of the types of dwellings in Indigo Shire in 2006 shows that 92.2% of all dwellings were separate houses;
5.6% were medium density dwellings, and 0.1% were high density dwellings, compared with 87.8%, 10.3%, and 0.2%
in the Regional VIC respectively.
In 2006, a total of 89.4% of the dwellings in Indigo Shire were occupied on Census night, compared to 83.8% in
Regional VIC. The proportion of unoccupied dwellings was 10.1%, which is smaller compared to that found in
Regional VIC (15.8%).
Emerging groups
The total number of dwellings in Indigo Shire increased by 473 between 2001 and 2006.
The largest change in the type of dwellings found in Indigo Shire between 2001 and 2006 was:
Separate house (+474 dwellings)
Page 65 of 81

The Number of Bedrooms in a dwelling is an indicator of the size of dwellings, and when combined with dwelling type
information, provides insight into the role Indigo Shire plays in the housing market. For example, an area of high
density dwellings that are predominantly 1-2 bedroom are likely to attract students, single workers and young
couples, whereas a high density area with dwellings that are predominantly 2-3 bedroom may attract more empty
nesters and some families.
In combination with Household type and Household size, the Number of Bedrooms can also indicate issues around
housing affordability, overcrowding and other socio-economic factors.
Number of bedrooms per dwelling
Number of bedrooms per dwelling
Indigo Shire 2006 2001 Change
Number of bedrooms Number % Regional VIC Number % Regional VIC 2001 to 2006
0 or 1 bedrooms 198 3.6 4.0 210 4.1 4.5 -12
2 bedrooms 807 14.6 16.7 818 16.0 17.8 -11
3 bedrooms 2,734 49.5 51.8 2,598 50.8 53.3 +136
4 bedrooms 1,302 23.6 19.6 1,148 22.4 18.2 +154
5 bedrooms or more 239 4.3 3.2 197 3.9 3.0 +42
Not stated 239 4.3 4.6 143 2.8 3.2 +96
Total households 5,519 100.0 100.0 5,114 100.0 100.0 +405
Source: Australian Bureau of Statistics, Census of Population and Housing 2001 and 2006. Compiled and presented in profile.id by.id, the population experts.
Number of bedrooms per dwelling, 2006
Source: Australian Bureau of Statistics, Census of Population and Housing, 2006 (Enumerated data)Compiled and presented in profile.id by .id, the population experts.
Page 66 of 81

Dominant groups
Analysis of the number of bedrooms in dwellings in Indigo Shire in 2006 compared to Regional VIC shows that there
was a lower proportion of dwellings with 1 and 2 bedrooms, and a higher proportion of dwellings with 4 or more
bedrooms.
Overall, 18.2% of households were in 1-2 bedroom dwellings, and 27.9% of 4-plus bedroom dwellings, compared with
20.8% and 22.8% for Regional VIC respectively.
The major differences between the number of bedrooms per dwelling of Indigo Shire and Regional VIC were:
A larger percentage of 4 bedroom dwellings (23.6% compared to 19.6%)
A larger percentage of 5 or more bedroom dwellings (4.3% compared to 3.2%)
A smaller percentage of 3 bedroom dwellings (49.5% compared to 51.8%)
A smaller percentage of 2 bedroom dwellings (14.6% compared to 16.7%)
Emerging groups
The largest changes in the number of bedrooms per dwelling in Indigo Shire between 2001 and 2006 were:
4 bedrooms (+154 dwellings)
3 bedrooms (+136 dwellings)
Change in number of bedrooms per dwelling, 2001 to 2006
Source: Australian Bureau of Statistics, Census of Population and Housing, 2001 and 2006 (Enumerated data)Compiled and presented in profile.id by .id, the population experts.
Page 67 of 81

A fast Internet Connection is increasingly required for accessing essential information and undertaking domestic and
non-domestic business. Households with dial-up or no internet service are being left behind in the digital divide' as
both government and the private sector are increasingly conducting their business, or aspects of it, on-line.
Internet connectivity in Indigo Shire can be affected by availability of connection, Education, Household Income and
Age Structure.
Internet connection
Type of internet connection
Indigo Shire 2011 2006 Change
Connection type Number % Regional VIC Number % Regional VIC 2006 to 2011
Total internet connection 4,176 71.5 68.4 3,143 56.9 51.8 +1,033
Broadband connection 3,784 64.8 60.9 1,810 32.8 27.4 +1,974
Dial-up connection 217 3.7 3.6 1,314 23.8 23.8 -1,097
Other connection 175 3.0 3.9 19 0.3 0.6 +156
No internet connection 1,349 23.1 25.3 2,091 37.9 42.4 -742
Not stated 315 5.4 6.4 285 5.2 5.8 +30
Total households 5,840 100.0 100.0 5,519 100.0 100.0 +321
Source: Australian Bureau of Statistics, Census of Population and Housing 2006 and 2011. Compiled and presented in profile.id by.id, the population experts.
Type of internet connection, 2011
Source: Australian Bureau of Statistics, Census of Population and Housing, 2011 (Enumerated data)Compiled and presented in profile.id by .id, the population experts.
Page 68 of 81

Dominant groups
Analysis of the type of internet connection of households in Indigo Shire compared to Regional VIC shows that there
was a lower proportion of households with either no internet connection or a dial up connection, and a higher
proportion of households with broadband connectivity.
Overall 26.8% of households had no internet connection or a dial up connection, and 64.8% had broadband
connectivity, compared with 28.8% and 60.9% respectively in Regional VIC.
Emerging groups
Between 2006 and 2011 the number of households with an internet connection increased by 1,033.
The largest changes in the internet connectivity in Indigo Shire, between 2006 and 2011 were:
Broadband connection (+1,974 households)
Dial-up connection (-1,097 households)
Total internet connection (+1,033 households)
Change in type of internet connection, 2006 to 2011
Source: Australian Bureau of Statistics, Census of Population and Housing, 2006 and 2011 (Enumerated data)Compiled and presented in profile.id by .id, the population experts.
Page 69 of 81

The ability of the population to access services and employment is strongly influenced by access to transport. The
number of motor vehicles per household in Indigo Shire quantifies access to private transport and will be influenced
by Age Structure and Household Type, which determine the number of adults present; access to Public Transport;
distance to shops, services, employment and education; and Household Income. Depending on these factors, car
ownership can be seen as a measure of advantage or disadvantage, or a neutral socio-economic measure, which
impacts on the environment and quality of life.
Number of cars per household
Car ownership
Indigo Shire 2006 2001 Change
Number of cars Number % Regional VIC Number % Regional VIC 2001 to 2006
No motor vehicles 229 4.1 7.1 278 5.4 7.8 -49
1 motor vehicle 1,534 27.8 33.0 1,553 30.4 35.1 -19
2 motor vehicles 2,146 38.9 36.3 2,041 39.9 35.8 +105
3 or more motor vehicles 1,285 23.3 17.4 1,005 19.7 15.7 +280
Not stated 326 5.9 6.2 235 4.6 5.5 +91
Total households 5,520 100.0 100.0 5,112 100.0 100.0 +408
Source: Australian Bureau of Statistics, Census of Population and Housing 2001 and 2006. Compiled and presented in profile.id by.id, the population experts.
Car ownership, 2006
Source: Australian Bureau of Statistics, Census of Population and Housing, 2006 (Enumerated data)Compiled and presented in profile.id by .id, the population experts.
Page 70 of 81

Dominant groups
Analysis of the car ownership of the households in Indigo Shire in 2006 compared to Regional VIC shows that 89.9%
of the households owned at least one car, while 4.1% did not, compared with 86.7% and 7.1% respectively in
Regional VIC.
Of those that owned at least one vehicle, there was a smaller proportion who owned just one car; a larger proportion
who owned two cars; and a larger proportion who owned three cars or more.
Overall, 27.8% of the households owned one car; 38.9% owned two cars; and 23.3% owned three cars or more,
compared with 33.0%; 36.3% and 17.4% respectively for Regional VIC.
Emerging groups
The largest changes in the household car ownership in Indigo Shire between 2001 and 2006 were:
3 or more motor vehicles (+280 households)
2 motor vehicles (+105 households)
Change in car ownership, 2001 to 2006
Source: Australian Bureau of Statistics, Census of Population and Housing, 2001 and 2006 (Enumerated data)Compiled and presented in profile.id by .id, the population experts.
Page 71 of 81

Indigo Shire's Housing Tenure data provides insights into its socio-economic status as well as the role it plays in the
housing market. For example, a high concentration of private renters may indicate a transient area attractive to young
singles and couples, while a concentration of home owners indicates a more settled area with mature families and
empty-nester Household Summary. Tenure can also reflect built form (Dwelling Type), with a significantly higher share
of renters in high density housing and a substantially larger proportion of home-owners in separate houses, although
this is not always the case.
In conjunction with other socio-economic status indicators in Indigo Shire, Tenure data is useful for analysing housing
markets, housing affordability and identifying public housing areas.
Housing tenure
Housing tenure
Indigo Shire 2006 2001 Change
Tenure type Number % Regional VIC Number % Regional VIC 2001 to 2006
Fully owned 2,235 40.5 39.1 2,452 47.9 45.8 -217
Mortgage 2,024 36.7 31.8 1,528 29.9 26.4 +496
Renting 928 16.8 22.7 903 17.7 22.6 +25
Renting - Social housing 120 2.2 4.2 106 2.1 4.4 +14
Renting - Private 754 13.7 17.5 764 14.9 17.4 -10
Renting - Not stated 54 1.0 1.0 33 0.6 0.8 +21
Other tenure type 40 0.7 0.8 62 1.2 1.2 -22
Not stated 291 5.3 5.6 169 3.3 4.1 +122
Total households 5,518 100.0 100.0 5,114 100.0 100.0 +404
Source: Australian Bureau of Statistics, Census of Population and Housing 2001 and 2006. Compiled and presented in profile.id by.id, the population experts.
Housing tenure, 2006
Source: Australian Bureau of Statistics, Census of Population and Housing, 2006 (Enumerated data)Compiled and presented in profile.id by .id, the population experts.
Page 72 of 81
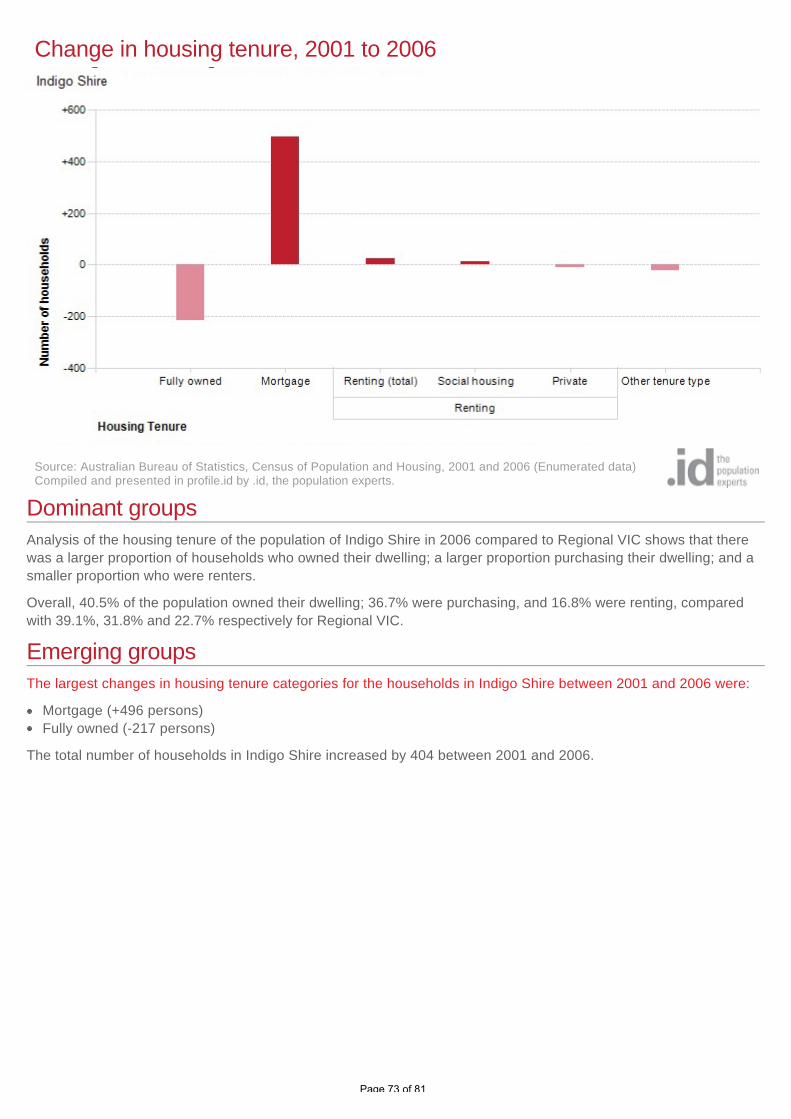
Dominant groups
Analysis of the housing tenure of the population of Indigo Shire in 2006 compared to Regional VIC shows that there
was a larger proportion of households who owned their dwelling; a larger proportion purchasing their dwelling; and a
smaller proportion who were renters.
Overall, 40.5% of the population owned their dwelling; 36.7% were purchasing, and 16.8% were renting, compared
with 39.1%, 31.8% and 22.7% respectively for Regional VIC.
Emerging groups
The largest changes in housing tenure categories for the households in Indigo Shire between 2001 and 2006 were:
Mortgage (+496 persons)
Fully owned (-217 persons)
The total number of households in Indigo Shire increased by 404 between 2001 and 2006.
Change in housing tenure, 2001 to 2006
Source: Australian Bureau of Statistics, Census of Population and Housing, 2001 and 2006 (Enumerated data)Compiled and presented in profile.id by .id, the population experts.
Page 73 of 81

Mortgage repayments are directly related to house prices in Indigo Shire, length of occupancy and the level of equity
of home owners. When viewed with Household Income data it may also indicate the level of housing stress
households in the community are under. In mortgage belt areas it is expected that households will be paying a higher
proportion of their income on their housing compared to well-established areas. First home buyer areas are also likely
to have larger mortgages than upgrader areas where households move in with equity from elsewhere.
Mortgage payment levels are not directly comparable over time because of inflation. For comparison of mortgage
payments over time, go to Housing Loan Quartiles.
Housing loan repayments
Monthly housing loan repayments
Indigo Shire 2006Monthly repayment amount Number % Regional VIC
Nil repayments -- -- 0.0
$1-$149 -- -- 0.0
$150-$299 -- -- 0.0
$300-$449 -- -- 0.0
$450-$599 -- -- 0.0
$600-$799 -- -- 0.0
$800-$999 -- -- 0.0
$1000-$1199 -- -- 0.0
$1200-$1399 -- -- 0.0
$1400-$1599 -- -- 0.0
$1600-$1799 -- -- 0.0
$1800-$1999 -- -- 0.0
$2000-$2199 -- -- 0.0
$2200-$2399 -- -- 0.0
$2400-$2599 -- -- 0.0
$2600-$2999 -- -- 0.0
$3000-$3999 -- -- 0.0
$4000-$4999 -- -- 0.0
$5000 and over -- -- 0.0
Not stated -- -- 0.0
Total households with a mortgage 0 100.0 100.0
Source: Australian Bureau of Statistics, Census of Population and Housing 2011 and 2006. Compiled and presented in profile.id by.id, the population experts.
Page 74 of 81

Dominant groups
Analysis of the monthly housing loan repayments of households in Indigo Shire compared to Regional VIC shows that
there was a similar proportion of households paying high mortgage repayments ($2,600 per month or more), as well
as a similar proportion of households with low mortgage repayments (less than $1000 per month).
Overall, 0.0% of households were paying high mortgage repayments, and 0.0% were paying low repayments,
compared with 0.0% and 0.0% respectively in Regional VIC.
There were no major differences between Indigo Shire and Regional VIC in 2006.
Monthly housing loan repayments, 2006
Source: Australian Bureau of Statistics, Census of Population and Housing, 2006 (Enumerated data)Compiled and presented in profile.id by .id, the population experts.
Page 75 of 81

Rental payments can be a better measure of the cost of housing in Indigo Shire than mortgage repayments because
they are not contingent on length of occupancy or equity in the dwelling.
High rental payments may indicate desirable areas with mobile populations who prefer to rent, or a housing shortage,
or gentrification. Low rental payments may indicate public housing (check Tenure Type), or areas where low income
households move by necessity for a lower cost of living.
Rental payments are not directly comparable over time because of inflation. For comparison of rental payments over
time, go to Housing Rental Quartiles.
Housing rental payments
Weekly housing rental payments
Indigo Shire 2006Weekly rental amount Number % Regional VIC
Nil -- -- 0.0
$1 - $74 -- -- 0.0
$75 - $99 -- -- 0.0
$100 - $124 -- -- 0.0
$125 - $149 -- -- 0.0
$150 - $174 -- -- 0.0
$175 - $199 -- -- 0.0
$200 - $224 -- -- 0.0
$225 - $249 -- -- 0.0
$250 - $274 -- -- 0.0
$275 - $299 -- -- 0.0
$300 - $324 -- -- 0.0
$325 - $349 -- -- 0.0
$350 - $374 -- -- 0.0
$375 - $399 -- -- 0.0
$400 - $424 -- -- 0.0
$425 - $449 -- -- 0.0
$450 - $549 -- -- 0.0
$550 - $649 -- -- 0.0
$650 - $749 -- -- 0.0
$750 - $849 -- -- 0.0
$850 - $949 -- -- 0.0
$950+ -- -- 0.0
Rent Not stated -- -- 0.0
Total households renting 0 100.0 100.0
Source: Australian Bureau of Statistics, Census of Population and Housing 2011 and 2006. Compiled and presented in profile.id by.id, the population experts.
Page 76 of 81
Dominant groups
Analysis of the weekly housing rental payments of households in Indigo Shire compared to Regional VIC shows that
there was a similar proportion of households paying high rental payments ($400 per week or more), as well as a
similar proportion of households with low rental payments (less than $150 per week).
Overall, 0.0% of households were paying high rental payments, and 0.0% were paying low payments, compared with
0.0% and 0.0% respectively in Regional VIC.
There were no major differences between Indigo Shire and Regional VIC in 2006.
Weekly housing rental payments, 2006
Source: Australian Bureau of Statistics, Census of Population and Housing, 2006 (Enumerated data)Compiled and presented in profile.id by .id, the population experts.
Page 77 of 81
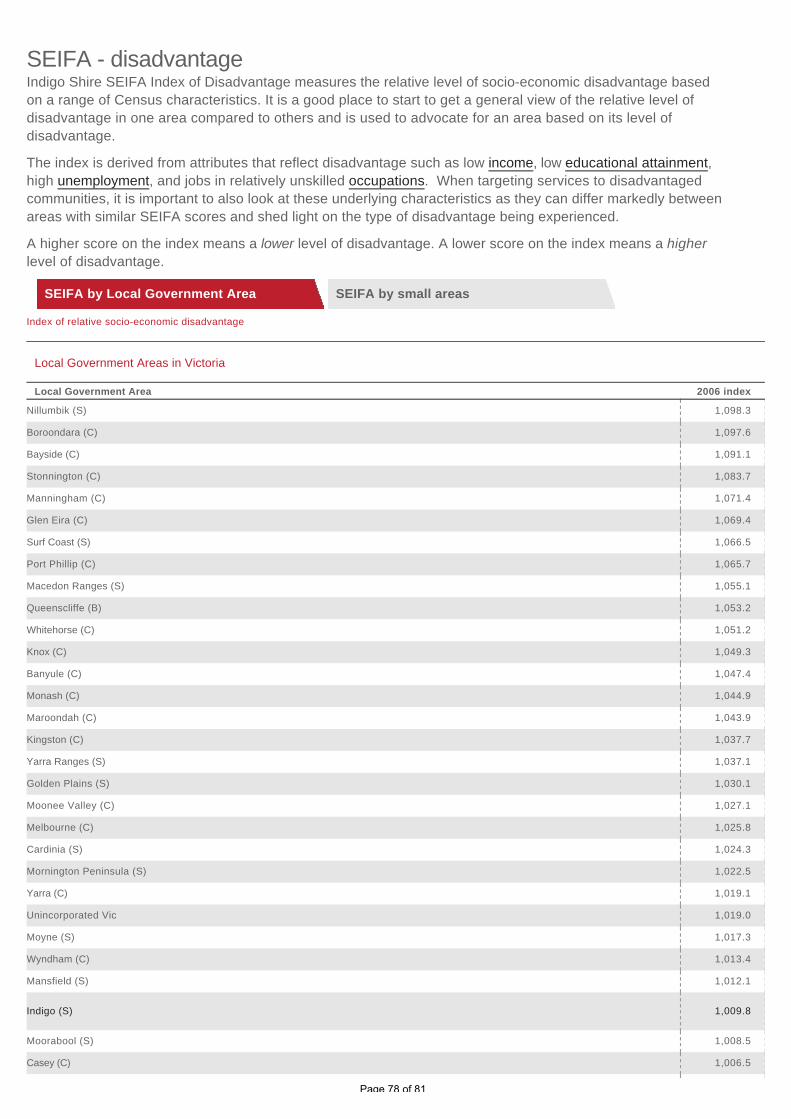
Indigo Shire SEIFA Index of Disadvantage measures the relative level of socio-economic disadvantage based
on a range of Census characteristics. It is a good place to start to get a general view of the relative level of
disadvantage in one area compared to others and is used to advocate for an area based on its level of
disadvantage.
The index is derived from attributes that reflect disadvantage such as low income, low educational attainment,
high unemployment, and jobs in relatively unskilled occupations. When targeting services to disadvantaged
communities, it is important to also look at these underlying characteristics as they can differ markedly between
areas with similar SEIFA scores and shed light on the type of disadvantage being experienced.
A higher score on the index means a lower level of disadvantage. A lower score on the index means a higher
level of disadvantage.
SEIFA by Local Government Area SEIFA by small areas
SEIFA - disadvantage
Index of relative socio-economic disadvantage
Local Government Areas in Victoria
Local Government Area 2006 index
Nillumbik (S) 1,098.3
Boroondara (C) 1,097.6
Bayside (C) 1,091.1
Stonnington (C) 1,083.7
Manningham (C) 1,071.4
Glen Eira (C) 1,069.4
Surf Coast (S) 1,066.5
Port Phillip (C) 1,065.7
Macedon Ranges (S) 1,055.1
Queenscliffe (B) 1,053.2
Whitehorse (C) 1,051.2
Knox (C) 1,049.3
Banyule (C) 1,047.4
Monash (C) 1,044.9
Maroondah (C) 1,043.9
Kingston (C) 1,037.7
Yarra Ranges (S) 1,037.1
Golden Plains (S) 1,030.1
Moonee Valley (C) 1,027.1
Melbourne (C) 1,025.8
Cardinia (S) 1,024.3
Mornington Peninsula (S) 1,022.5
Yarra (C) 1,019.1
Unincorporated Vic 1,019.0
Moyne (S) 1,017.3
Wyndham (C) 1,013.4
Mansfield (S) 1,012.1
Indigo (S) 1,009.8
Moorabool (S) 1,008.5
Casey (C) 1,006.5
Page 78 of 81

Index of relative socio-economic disadvantage
Local Government Areas in Victoria
Local Government Area 2006 index
Melton (S) 1,002.1
Hobsons Bay (C) 1,001.7
South Gippsland (S) 999.5
Baw Baw (S) 998.1
Moreland (C) 998.1
Murrindindi (S) 997.2
Frankston (C) 996.7
Mitchell (S) 996.1
Towong (S) 995.9
Southern Grampians (S) 994.5
Greater Geelong (C) 992.9
Darebin (C) 990.3
Whittlesea (C) 988.6
Warrnambool (C) 988.6
Horsham (RC) 987.4
Alpine (S) 986.9
Corangamite (S) 986.1
West Wimmera (S) 985.6
Mount Alexander (S) 983.3
Greater Bendigo (C) 983.1
Wangaratta (RC) 981.1
Ballarat (C) 980.8
Hepburn (S) 979.6
Bass Coast (S) 977.5
Wodonga (RC) 974.7
Wellington (S) 974.1
Maribyrnong (C) 974.0
Strathbogie (S) 970.2
Buloke (S) 967.7
Colac-Otway (S) 964.6
Campaspe (S) 964.1
Glenelg (S) 960.2
Gannawarra (S) 958.8
East Gippsland (S) 958.2
Benalla (RC) 957.2
Moira (S) 952.4
Yarriambiack (S) 952.4
Greater Shepparton (C) 951.9
Hume (C) 951.8
Ararat (RC) 950.5
Swan Hill (RC) 949.8
Hindmarsh (S) 946.6
Pyrenees (S) 939.9
Latrobe (C) 939.7
Page 79 of 81

Index of relative socio-economic disadvantage
Local Government Areas in Victoria
Local Government Area 2006 index
Northern Grampians (S) 937.6
Mildura (RC) 935.0
Loddon (S) 934.1
Brimbank (C) 925.8
Central Goldfields (S) 904.6
Greater Dandenong (C) 894.9
Source: Australian Bureau of Statistics, Census of Population and Housing 2006. Compiled and presented in profile.id by .id, thepopulation experts.
Page 80 of 81

Demographic change across Australia is recorded by the Australian Bureau of Statistics (ABS) in the Census
collections every five years. Population experts, .id, analyse and convert these raw figures into stories of place to
inform council staff, community groups, investors, business, students and the general public.
Indigo Shire Community Profile provides demographic analysis for the Shire and its suburbs based on results from the
2011, 2006, 2001, 1996 and 1991 Censuses of Population and Housing. The profile is updated with population
estimates when the Australian Bureau of Statistics (ABS) releases new figures such as the annual Estimated Resident
Population (ERP).
Suburb boundaries and Census questions change over time, but .id manages the data to ensure that there is an
accurate time series provided for the current geographic boundaries. You can read more about this in the Geography
Notes section.
Results for Indigo Shire include population, age structure, ethnicity, ancestry, religion, income, qualifications,
occupations, employment, unemployment, disability, disadvantage, volunteering, childcare, family structure,
household structure, housing tenure, mortgage and rental payments, and the size and type of the dwellings people
live in.
The Community Profile presents this information in clear maps, tables and charts with concise factual commentary to
answer three important questions:
1. What are the characteristics of the people who live here?
2. How are they changing?
3. How do they compare to other areas?
This provides the basis for making evidence-based decisions about how to provide services for the community as it
changes.
You can be confident about the quality of the information as it is derived from Australian Bureau of Statistics data,
analysed and presented by population experts and funded by Indigo Shire.
About the community profile
Page 81 of 81