Embed Size (px)
Citation preview

* MO-+-Z p5*P736Y
w #Pq
DOE/OR/20722-141
c
r
Formerly Utilized Sites Remedial Action Program (FUSRAP) Contract No. DE-AC05-810R20722
CHARACTERIZATION REPORT FOR THE HAZELWOOD INTERIM STORAGE SITE
Hazelwood, Missouri
June 1987
Bechtel IUational, Inc.
~$#w”~.~*~~~,x&~~-~i p r ,,a. ‘:*-.>, . s. I, .
m
LEGAL NOrrICE
This nport was prepared as an account of work sponsored by the United States Government. Neither the United States nor the United States Department of Energv, nor any of their employees, nor any of their contractors, subcontractors, or their employees, makes any warranty, express or implied, or assumes any legal liability or responsibility for the accuracy, completeness or usefulness of any information, apparatus, product or process disclosed, or represents that its use would not infringe privately owned rights.
I
-
m
1
T
1
m
1
II
1
1
-
w

DOE/OR/20722-141
CHARACTERIZATION REPORT FOR THE
HAZELWOOD INTERIM STORAGE SITE
HAZELWOOD, MISSOURI
JUNE 1987
Prepared for
UNITED STATES DEPARTMENT OF ENERGY
OAK RIDGE OPERATIONS OFFICE
Under Contract No. DE-AC05-810R20722
BY
K. C. Noey, C. R. Hickey, and A. M. Feldman
Bechtel National, Inc.
Oak Ridge, Tennessee
Bechtel Job No. 14501

ABSTRACT
-
During October and November 1986 a radiological survey was conducted at the Hazelwood Interim Storage Site (HISS) in Hazelwood, Missouri. The survey was performed as part of the Formerly Utilized Sites Remedial Action Program (FUSRAP), a U.S. Department of Energy (DOE) program to identify, clean up, Or otherwise control sites where residual radioactive contamination (exceeding current guidelines) remains from the early years of the nation’s atomic energy program or from conditions that Congress has mandated DOE to remedy. Although sampling for chemical contamination was not within the scope of this effort, chemical characterization of the site will be performed before remedial action commences.
It was established that contamination was present at the site on the basis of a radiological survey conducted by Oak Ridge National Laboratory in 1977. The purpose of the 1986 survey was to define the locations and boundaries of the contamination and to provide the data required to estimate the volume of contaminated material on the site. The survey was conducted by the FUSRAP Project Management Contractor, Bechtel National, Inc. (BNI) and its radiological subcontractor, Therm0 Analytical/ Eberline (TMA/E).
Measurements taken during the 1986 survey indicate that contamination is present on the site in concentrations exceeding current DOE guidelines. Above-guideline contamination was found to extend to a depth of 6 ft below the ground surface at one location. The average depth of contamination at the HISS was found to be approximately 3 ft. The 1986 survey supports the
finding of the 1977 ORNL survey that thorium-230 is the principal contaminant at the site.
ii
--

TABLE OF CONTENTS
Page
-
1.0
2.0
3.0
4.0
5.0
Abbreviations
Introduction and Summary 1.1 Introduction 1.2 Purpose and Objectives 1.3 Summary
Site Description and History 2.1 Location and Description 2.2 Site History and Previous Radiological
Surveys 2.3 Present Site Conditions
Health and Safety Plan 3.1 Subcontractor Training 3.2 Safety Requirements
Survey Procedures 4.1 Field Survey Procedures
4.1.1 Measurements Taken and Methods Used 4.1.2 Sample Collection and Analysis
Survey Results 5.1 Background Measurements 5.2 Surface and Subsurface Measurements
References
iii
vi
3 3
3 5
10 10 10 12
16 16 17
57

LIST OF FIGURES
Figure Title
2-l Location of the HISS 2-2 The HISS and Its Immediate Vicinity 4-l Survey Grid for the HISS 4-2 PIC Measurement Locations at the HISS
4-3 Soil Sampling Locations at the HISS 5-l Areas and Depths of Contamination
at the HISS
iv
Page
4 6
11 13 15
18
_. _-_-_ -‘ _- - -
,-
LIST OF TABLES
Table Title Page
5-l Summary of Residual Contamination Guidelines for the HISS 20
*-
I-
5-2 Background Radionuclide Concentrations and Radiation Levels in Soil in the St. Louis Area 21
5-3 Gamma Radiation Exposure Rates at the HISS 22
5-4 Down-hole Gamma Logging Results for the HISS 23
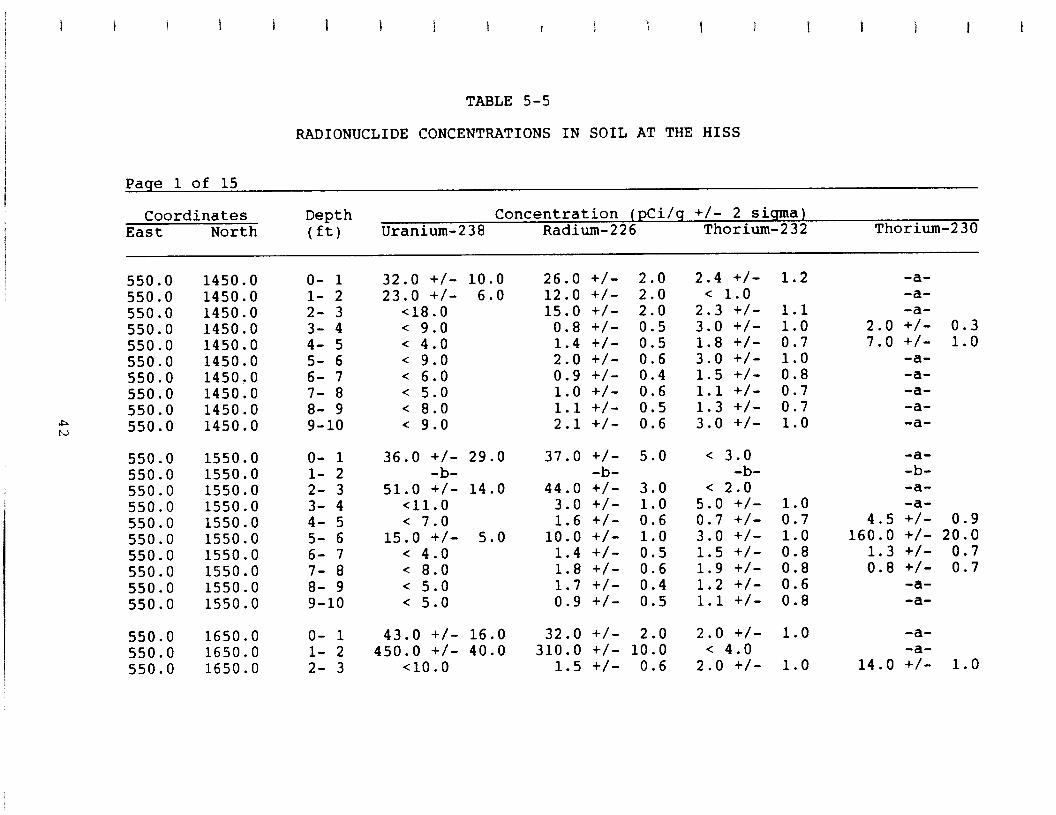
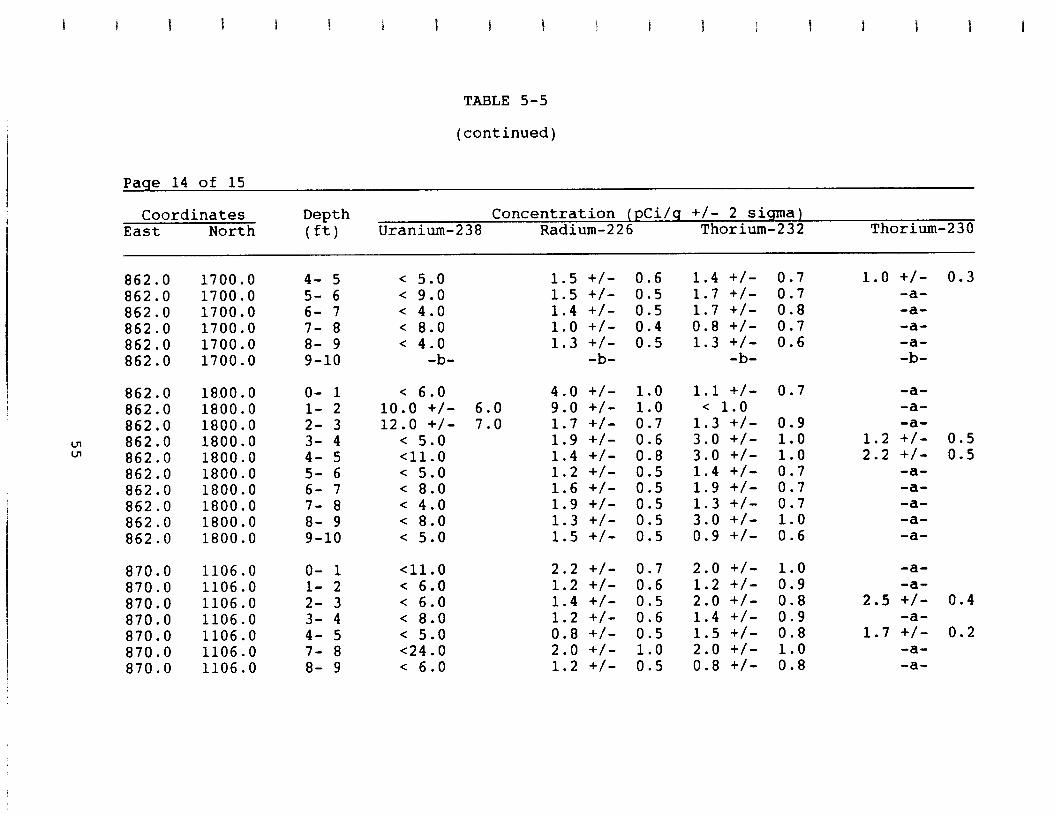
5-5 Radionuclide Concentrations in Soil at the HISS 42
V
-1~1 _ “. I -_ . - . . _ - - * . -

cm
cm ft h in. m2
mi
M/h
pCi/g
ABBREVIATIONS
centimeter counts per minute foot hour inch square meter mile microroentgens per hour picocuries per gram
vi

1.0 INTRODUCTION AND SUMMARY
1.1 INTRODUCTION
,-
<-
,-
.-
This report describes the procedures used to conduct a radiological survey during October and November 1986 at the Hazelwood Interim Storage Site (HISS) in Hazelwood, Missouri. The results of the survey are also discussed. The survey was conducted as part of the Formerly Utilized Sites Remedial Action Program (FUSRAP), a U.S. Department of Energy (DOE) program to identify, clean up, or otherwise control sites where residual radioactive contamination (exceeding current guidelines) remains from the early years of the nation's atomic energy program or from commercial operations causing conditions that Congress has mandated DOE to remedy. Under contract to the DOE, Bechtel National, Inc. (BNI) acts as the Project Management Contractor (PMC) for FUSRAP. The 1986 survey was conducted by BNI and its radiological subcontractor, Therm0 Analytical/Eberline (TMA/E).
1.2 PURPOSE AND OBJECTIVES
A radiological survey performed in 1977 by Oak Ridge National Laboratory (ORNL) established that contamination existed at the site (Ref. 1). Although the contamination at Hazelwood did not result directly from the atomic energy program, the Hazelwood properties were added to FUSRAP by Congress to expedite decontamination of the properties. The 1986 radiological survey was necessary to define the locations and boundaries of the contamination identified in the ORNL survey and permit estimation of the volume of contaminated material presently on the site. Although sampling for chemical contaminants was not within the scope of this survey, chemical characterization will
be performed before remedial action commences.
1
-.--- I- -

1.3 SUMMARY
*-
-
I-
I-
This characterization confirmed the finding of the 1977 survey that thorium-230 is the principal radioactive contaminant at the HISS, although analysis also identified elevated levels of radium-226 and uranium-238. Thorium-232 concentrations ranged from 0.7 to 5 pCi/g. The maximum concentrations of radium-226 and uranium-238 were found to be 700 and 800 pCi/g, respectively. Selected samples were also analyzed for thorium-230. The maximum thorium-230 concentration detected in these samples was 790 pCi/g; however, the samples that exhibited high concentrations of radium-226 and uranium-238 were not analyzed for thorium-230. Some of these samples can be expected to contain thorium-230 concentrations far in excess of 790 pCi/g.
External gamma radiation levels ranged from 13 to 55 uR/h. The normal background level for the St. Louis area is approximately 8 uR/h.
Gamma logging data and subsurface soil sample analyses were used to determine the depths of contamination. Analysis results indicate the presence of both surface and subsurface contamination. Contamination was found 6 ft below the ground surface at one location. The average depth of contamination at the HISS is approximately 3 ft.
The two contaminated waste storage piles on the HISS were not included as part of the 1986 survey.
.- 2
-- _I*

2.0 SITE DESCRIPTION AND HISTORY
.-
.-
2.1 LOCATION AND DESCRIPTION
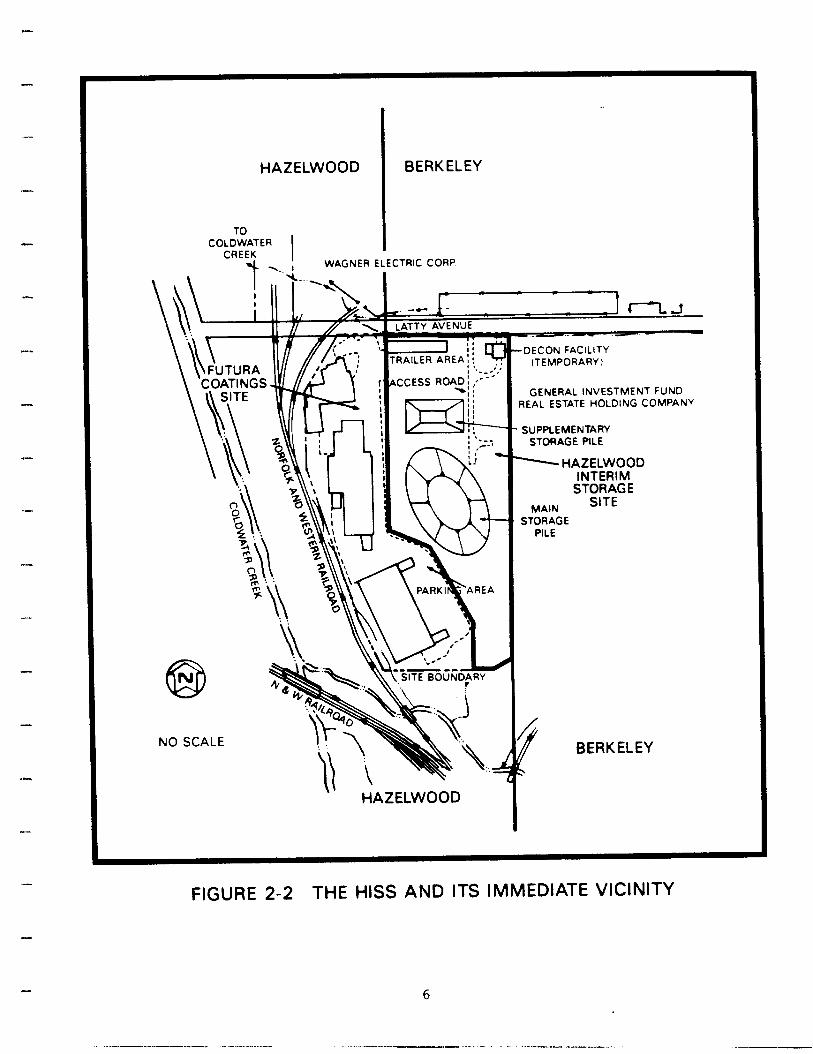
The HISS occupies the eastern half of the property located at 9200 Latty Avenue in northern St. Louis County within the city limits of Hazelwood, Missouri. It is approximately 2 mi
northeast of the control tower of the Lambert-St. Louis International Airport. The location of the HISS is shown in
Figure 2-l. The property is owned by Jarboe Realty and Investment Company. A chain link fence separates the HISS from the western half of the property at 9200 Latty Avenue, which is known as the Futura Coatings site (Figure 2-2).
2.2 SITE HISTORY AND PREVIOUS RADIOLOGICAL SURVEYS
,-
,-
.-
.-
In 1966, ore residues and uranium- and radium-bearing process wastes being stored at the St. Louis Airport Site (SLAPS) were purchased by the Continental Mining and Milling Company of Chicago, Illinois and placed in storage at 9200 Latty Avenue. These wastes were generated by a St. Louis plant between 1942
and the late 1950s under contracts with the Atomic Energy Commission (AEC) and its predecessor, the Manhattan Engineer District (MED). These residues included pitchblende raffinates, Colorado raffinates, uranium-bearing residues, and barium sulfate cake. The Commercial Discount Corporation of Chicago purchased the residues in January 1967; much of the material was then dried and shipped to the Cotter Corporation facilities in Canon City, Colorado. The material remaining at the Latty Avenue site was sold to the Cotter Corporation in December 1969. Between August and November of 1970, Cotter Corporation dried some of the residues remaining at the site and shipped them to its mill in Canon City. In December 1970, an estimated 10,000 tons of Colorado raffinate and 8,700 tons of leached barium sulfate remained at the Latty Avenue site.
-_____- ,* .
3
-.-, ---.-..

t I I t I i I i I I i i t i
/ COLOWAICR CREEK
/AVE 1’ ’
ST&AGE SITE ,
I AMBER1 51 LOUIS INTERNATIONAL AIRPORT
\ 10.65 WI OOWNTOWN $7 LOUIS
FIGURE 2-1 LOCATION OF THE HISS

. I
“-
,c
In Apr i l 1 9 7 4 , th e new ly es tab l i shed Nuc lea r R e g u l a tory Commiss i on (NRC) was in fo rmed by C o tte r Co rpo ra tio n th a t th e rema in ing Co lo rado raf f inate h a d b e e n sh i pped in m id -1973 to C a n o n City wi thout hav ing b e e n d r ied a n d th a t ba r i um sul fate res idues h a d b e e n d i lu ted wi th soi l f rom th e si te a n d t ranspor ted to a l and fill a r ea in S t. Lou i s C o u n ty. R e p o r tedly, a 12 - to 18- in . layer o f topso i l was r e m o v e d wi th th e res idues.
In 1 9 7 6 , m e a s u r e m e n ts ta k e n by th e N R C o f rad ia t ion leve ls a n d o f rad ionuc l ide c o n c e n trat ions in th e soi l ind ica ted th a t res idua l u ran i um a n d tho r i um c o n c e n trat ions a n d exposu re leve ls a t 9 2 0 0 L a tty A v e n u e e x c e e d e d ex is t ing gu ide l i nes fo r re lease fo r unrest r ic ted use . A rad io log ica l character izat ion o f th e si te was a lso pe r fo rmed by O R N L in th e s u m m e r o f 1 9 7 7 pr ior to o c c u p a tio n o f th e si te by th e cur rent o w n e r (Ref. 1). S u r f a c e c o n ta m i n a tio n exceed ing D O E gu ide l i nes fo r tho r i um a n d rad ium was fo u n d in a n d a r o u n d th e bu i ld ings o n th e wes te rn hal f o f th e proper ty ( the Fu tu ra C o a tin g s site). S u b s u r fa c e soi l c o n ta m i n a tio n was fo u n d a t d e p ths as g rea t as 1 8 in.
In 1 9 8 1 O a k R idge Assoc ia ted Univers i t ies ( O R A U ) charac ter ized th e s to rage p i le o n th e e a s te rn hal f o f th e proper ty ( now ca l led th e H IS S ) a n d pe r fo rmed a rad io log ica l survey o f th e nor thern a n d e a s te rn bounda r i es o f th e proper ty (Ref. 2). Leve ls o f
c o n ta m i n a tio n (pr inc ipa l ly tho r i um-230 ) s imi lar to th o s e o n th e proper ty we re fo u n d in b o th areas. A s a fo l l ow-up to th is survey, O R N L c o n d u c te d a d e ta i led rad io log ica l survey o f th e nor th a n d s o u th shou lde rs o f L a tty A v e n u e fo r D O E in Janua ry a n d Februa ry 1 9 8 4 . Resul ts ind ica ted th a t c o n ta m i n a tio n in excess o f D O E gu ide l i nes was p resen t a l o n g m o s t o f L a tty A v e n u e , a lmos t
as fa r as H a z e l w o o d A v e n u e . P roper t ies ad j acen t to th e H IS S we re a lso fo u n d to b e c o n ta m i n a te d .
2 .3 P R E S E N T S ITE C O N D ITIO N S
T h e H IS S current ly consists o f access roads, a veh ic le .L d e c o n ta m i n a tio n facil i ty, a n d two s to rage p i les (F igure 2-2) .
5
. .^ . - ^_ s, f l
#^
, M
,.-
,-
,-
. .- . . . .
* -
“sm.
I _ -
H A Z E L W O O D B E R K E L E Y
T O C O L D W A T E R
C R E E K I I
d-. W A G N E R E L E C T R I C C O R P
N O S C A L E
l-
S U P P L E M E N T A R Y S T O R A G E P ILE
B :.
- H A Z E L W O O D INTERIM
1’ H A Z E L W O O D
\ 1 7 B E R K E L E Y
FIG U R E 2 -2 T H E H IS S A N D ITS IM M E D IA T E V IC IN ITY
6
__ -_ _.._ -- -.
In preparing the western half of the property for commercial use, the owner demolished one building, excavated several areas, paved several others, and erected a number of new buildings. The materials excavated during these activities (approximately 13,000 yd3) formed the original pile on the HISS.
Remedial action was conducted at Latty Avenue in 1984 and 1985; it continued in 1986, when it was performed concurrently with a drainage system improvement project being conducted by the cities of Hazelwood and Berkeley. The contaminated materials excavated from Latty Avenue during the course of construction activities were hauled to the HISS and placed in a supplementary storage pile that was developed specifically to accommodate these materials.

,-
3.0 HEALTH AND SAFETY PLAN I-
.-
BNI is responsible for protecting the health and safety of personnel assigned to work at the site. AS such, BNI and Eberline personnel must comply with the requirements of the applicable Project Instructions (PI) contained in the FUSRAP Radiological Protection Program Manual (Ref. 3) as directed by the on-site BNI representative.
3.1 SUBCONTRACTOR TRAINING
Before the start of work, all characterization personnel attended an orientation session presented by the BNI representative to explain the nature of the material that would be encountered during the course of the characterization and the personnel monitoring and safety measures that would be required.
3.2 SAFETY REQUIREMENTS
*-
IN
Personnel were required to comply with the BNI safety requirements set forth in the applicable Project Instructions contained in Reference 3 and summarized below:
o Bioassay (PI 21.18) -- Personnel shall submit bioassay samples before or at the beginning of on-site activity, upon completion of the activity, and periodically during site activities as requested by BNI.
0 Protective Clothing/Equipment (PI 21.12) -- Personnel must wear the protective clothing/equipment specified by the BNI representative.
o Dosimetry (PI 21.05) -- Personnel are required to wear the dosimeters and monitors issued by BNI and return them to the BNI representative at the end of each day.
0 controlled Area Access/Egress (PI 21.08, 21.10) -- Personnel and equipment entering areas where access and egress are controlled for the purpose of radiological safety will be radiologically surveyed by the BNI representative before leaving the area.
._ ~_.. -. -- ._ ._

,-
I-
* -
I-
Heal th a n d safety surve i l lance o f a l l act ivi t ies re la ted to th e scope o f work was c o n d u c te d u n d e r th e di rect superv is ion o f pe rsonne l rep resen t ing B N I. T h e hea l th protect ion r equ i r emen ts app l i cab le to act ivi t ies th a t invo lve rad ia t ion o r th e hand l i ng o f rad ioact ive m a ter ia ls a re de l i nea ted in P I 2 0 .0 1 , R e fe rence 3 . Cop ies o f th e app l i cab le P roject Inst ruct ions we re ava i lab le a t th e si te du r i ng th e character izat ion.
.-- - -__-

4.0 SURVEY PROCEDURES
,-
“C
,I-
/-
1-
4.1 FIELD SURVEY PROCEDURES
A civil surveyor established a 50-ft grid on the HISS by staking the intersections of a series of mutually perpendicular lines. The grid spanned the entire HISS with the exception of the two contaminated waste storage piles, which were not included in the survey. The grid origin used during the remedial action conducted in 1984 along the Latty Avenue right-of-way was reestablished (Figure 4-l). All characterization data correspond to coordinates on this grid. The types of radiological measurements taken and the methods used are described in the following subsections.
4.1.1 Measurements Taken and Methods Used
An initial walkover survey was performed within the grid blocks of the entire HISS (with the exception of the storage piles) using an unshielded gamma scintillation detector. Areas in which readings exceeded twice normal background levels were marked on a site drawing.
Near-surface gamma measurements were made 12 in. above the ground surface at 12.5-ft intervals in areas identified as contaminated on the basis of the walkover survey. A 2- by 2-in. sodium-iodide (NaI) detector was used during this survey. This detector (EIC model SPA-31 was mounted in a probe assembly surrounded with a conical lead shield to reduce the gamma intensity through the sides, thus producing a downward directional response.
Gamma exposure rates at 3 ft above the ground were measured using a pressurized ionization chamber (PIG) with a response to
10 .-
.-l---- I *,. _- -_-,-

*-
I-
.-
.-
I-
.-
\ 0 * 0 0 L A ? T Y A V C N U C
D E C O N FACIL ITY I T E M P O R A R Y ,
I - - \’ \ , GR ID
’ ORIGIN
\
\
\
t
\ c, t 0 ‘0 5
? a \ “9 0
\ 7 - A F
\
\
\
t
cl n l
0 5 0 l O O F T I ,
FIG U R E 4- l S U R V E Y G R ID F O R T H E H IS S
.- 1 1
~ . -- ̂ _ _ _ _ - - -_-.. _ .~ - - -_ - .^._

“-
,-
,I
“..m
*cm--
I-
a -
*.-
-..
g a m m a rad ia t ion th a t is p ropor t iona l to exposu re in r oen tg e n s . Read ings we re m a d e a t 1 5 se lec ted gr id po in ts o n th e si te (F igure 4-2) .
T h e subsur face invest igat ion was c o n d u c te d by dr i l l ing 3 6 boreho les , e a c h to a d e p th o f 1 0 ft, a t m o s t lO O -ft g r id intersect ions. T h e 100 - ft in terval was d e s i g n e d to max im ize th e a m o u n t o f in format ion to b e o b ta i n e d in th e m o s t cost-effect ive m a n n e r poss ib le . T h e n u m b e r o f bo reho les in e a c h a rea a n d th e locat ions o f th e ho les we re b a s e d o n near -sur face g a m m a m e a s u r e m e n ts m a d e in th e a rea .
A lth o u g h g a m m a logg ing is typical ly u s e d to d e te rm ine th e d e p th o f subsur face c o n ta m i n a tio n , tho r i um-230 ( the pr inc ipa l c o n ta m i n a n t) c a n n o t b e d e tec ted in situ; the re fore, c o n tin u o u s subsur face soi l samp les we re co l lec ted f rom th e sur face to a d e p th o f 1 0 ft by rotat ing a Conso l i da ted M ine E q u i p m e n t ( C M E ) samp le r in a d v a n c e o f th e a u g e r . E a c h character izat ion ho le was g a m m a l o g g e d to d e te rm ine th e d e p th o f g a m m a - e m i ttin g c o n ta m i n a tio n . G a m m a logg ing was c o n d u c te d by lower ing a g a m m a scint i l lometer in to th e ho le a n d tak ing rad ia t ion m e a s u r e m e n ts a t 6- in. vert ical in tervals in o rde r to o b ta in a prof i le o f th e d e p th o f g a m m a - e m i ttin g c o n ta m i n a tio n .
4 .1 .2 S a m p l e Col lec t ion a n d Ana lys is
C o n tin u o u s samp l i ng was pe r fo rmed in e a c h ho le in l-ft increments . A ll samp les we re ana l yzed fo r u ran i um-238 , r ad i um-226 , a n d tho r i um-232 . Expe r i ence h a s s h o w n th a t as l ong as r ad i um-226 c o n c e n trat ions a re e levated, it is r easonab le to a s s u m e th a t th e tho r i um-230 c o n c e n trat ion exceeds th e D O E gu ide l i ne o f 1 5 pCi /g fo r soi l . S ince ana lys is fo r tho r i um-230 is costly, th e n u m b e r o f samp les sub jec ted to th is type o f ana lys is was m in imized. For e a c h bo reho le , samp les we re se lec ted fo r tho r i um-230 ana lys is beg i nn i ng a t th e d e p th w h e r e down -ho l e g a m m a logs ind ica ted th a t r ad i um-226 concen trat ions
1 2 ,-
_ _ ^ _ - l l _ - ^_ - -~___ _* I -.-- __--. . .--

I-
/-
>-
1-
se
.-
.-
,H
.I_
*-
.m..
\ GRID
‘. ORIGIN
\
\ : \ 1. \ c,
t 0 6 ‘.. f 3 \ %
c, \ P
% ‘. 5.
\
\
\
\,
\
\
........... .....................
t ~~~.5:i THE HISS
CD N
0 50 1DDFT L I I
DECON FACILITY
LAITY AVENUE CrEMPioRARyr -NZOOO , I 1 rl .* I
N1900
N1700
I It ill I II I
N1400
N1300
N1200 ; 1 I ., \, I 1 I I \I 1 I\ I I
\ NllOO
\
r-,-‘--‘-b-)*-=-
PROPERTY BOUNDARY NlOOO I I
I
8 3 8 2
i! 8 L
H Y w u !
FIGURE 4-2 P IC MEASUREMENT LOCATIONS AT THE HISS
13

c
_-
.-
SW
,-
te
*-
c-
.-
were below guidelines. From this point, samples from successively greater depths were analyzed for thorium -230 until below-guideline results for thorium -230 were also obtained. Based on what is known about the history of the site and the means by which it became contam inated, it was assumed that no stratified layer of thorium -230 existed below the depths at which sampling indicated thorium -230 concentrations to be in compliance with DOE remedial action guidelines.
For boreholes where gamma logs did not indicate the presence of gamma-emitting contam ination exceeding guideline levels, samples were collected from areas of interest in the respective borehole and analyzed for thorium -230. Such areas of interest may include isolated spots that exhibit elevated gamma log results, areas that exhibit trends in the gamma log results regardless of level, and surface soil samples.
Soil samples were collected at the 36 borehole locations (Figure 4-3). Each sample was counted for 10 m inutes using an intrinsic germanium detector housed in a lead shield lined with cadmium and copper. The pulse height distribution was sorted using a computer-based, multi-channel analyzer. Radionuclide concentrations were determ ined by comparing the gamma spectrum of each sample with the spectrum of a certified counting standard for the radionuclide of interest.
14

I-
ORIGIN
\
\
\
t
\
c, \ 0 “0 -2 ? a \ B
c, \ % %
\
\
\
\
\
\
T H E H IS S
0 5 0 l O O F T I
L A T T V A V E N U E
D E C O N FACIL ITY I T E M P O R A R Y 1
I - N 2 0 0 0 I
I I . I
N 1 9 0 0
N 1 8 0 0
N 1 7 0 0
I 1 , I
,._ . . . . . . . . . . . . . . . . . : + 3 J P P L E M E N T A R Y ::
\ L t N 1 5 0 0 I
N 1 4 0 0
N 1 3 0 0
FIG U R E 4 -3 S O IL S A M P L IN G L O C A T IO N S A T T H E H IS S
1 5
---- _.”

.-
5.0 SURVEY RESULTS
I-
,-
,-
The results of the surveys described in Section 4.0 are presented in this section. To permit comparison of the results to current DOE guidelines for radionuclides in soil, these guidelines are presented in Table 5-1 (Ref. 4).
All direct field measurements and laboratory results in this
report represent gross readings: background measurements and concentrations have not been subtracted.
5.1 BACKGROUND MEASUREMENTS
Near-surface gamma levels, gamma exposure rates, and gamma radiation at 3 ft above the ground surface were measured at three background locations in the St. Louis area. The average near-surface gamma level was approximately 4,000 cpm, and gamma radiation levels 3 ft above the ground surface averaged approximately 7,000 cpm. The average background gamma exposure rate was 8 uR/h. Individual background measurements are listed in Table 5-2.
Background external gamma exposure rates have also been measured in the St. Louis Area by Oak Ridge National Laboratory: the average rate was found to be approximately 6 uR/h (Ref. 5).
Average background concentrations of uranium-234, -235, and -238 measured in surface soils at the three background locations were 1.0, less than 0.1, and 1.0 pCi/g, respectively. The average
background concentration of radium-226 was 0.5 pCi/g. Average background concentrations of thorium-230 and thorium-232 were 0.2 and 0.4 pCi/g, respectively. The average background concentration of lead-210 was 1.0 pCi/g. Analysis results for each background location are listed in Table 5-2.
16
., _-. -..

.-
.-
,-
.-
,,-
5.2 SURFACE AND SUBSURFACE MEASUREMENTS
Near-surface gamma radiation levels at the HISS ranged from approximately 10,000 cpm to approximately 475,000 cpm. Gamma
radiation exposure rates ranged from 13 to 55 uR/h. The average
exposure rate for the site was 24 uR/h. Gamma radiation exposure rates at the HISS are presented in Table 5-3.
The field survey at the HISS revealed areas with elevated concentrations of radium-226 and thorium-230 in surface and subsurface samples. Thorium-230 was identified as the major contaminant.
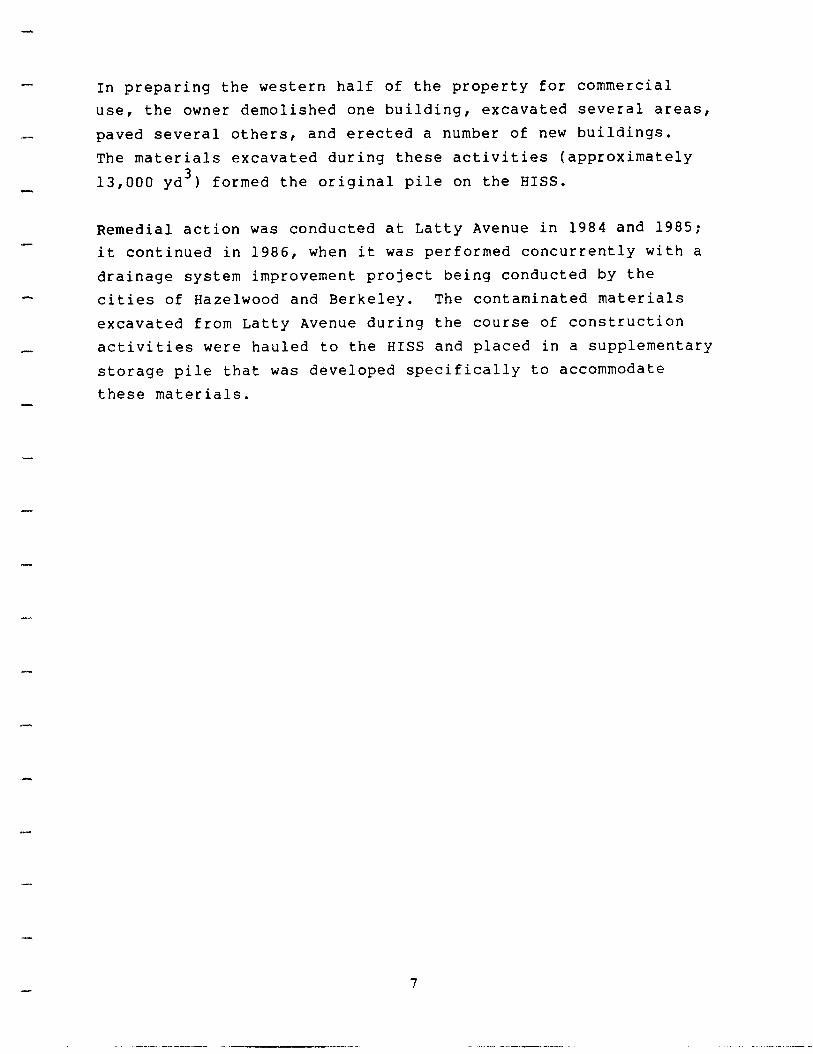
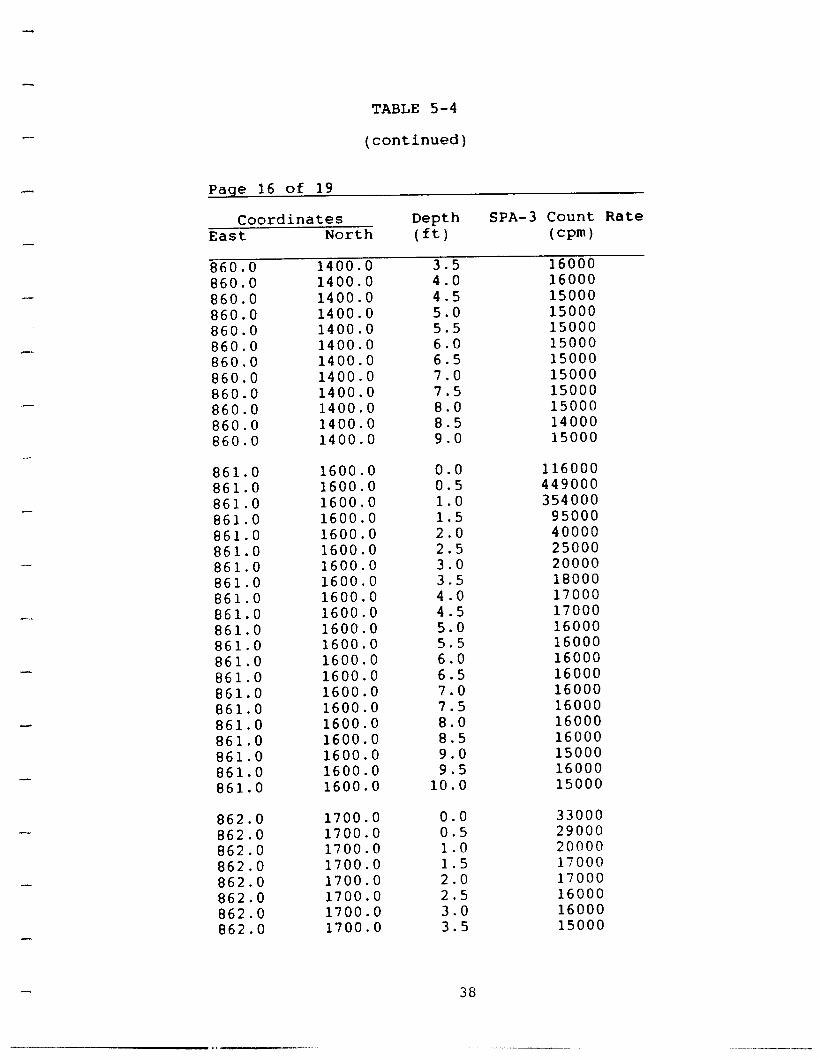
Down-hole gamma logging was performed to indicate the general depth and concentration of gamma-emitting contamination. Detailed gamma logging results are reported in Table 5-4. The depth of contamination was found to range from surface contamination to subsurface contamination at a depth of 6 ft. Only one location exhibited contamination at the maximum depth of 6 ft. The average depth of contamination on the site is approximately 3 ft.
The area1 limits of contamination were determined on the basis of the DOE guideline of 5 pCi/g for thorium-230, thorium-232, and radium-226 when averaged over the uppermost 15-cm layer of soil, and 15 pCi/g when averaged over 15-cm thick layers of soil more than 15 cm below the surface (Table 5-1). The areas and
depths of contamination at the HISS are shown in Figure 5-l.
Analysis results for soil are provided in Table 5-5. Use of the
"less than" ( 4 ) notation indicates that the radionuclide was not present in measurable concentrations. The value following
the less than notation is the minimum detectable amount (MDA). The MDA is based on various factors, including the volume, size,
and weight of the sample; the type of detector used: the counting time, and the background count rate. In addition,
17
---111----- I ,* -.. --.-.

*-
.-
“-
.c
*-
“-
#-
I-
.-
1-
I-
‘I
\ o+oo \’ \ , GRID
’ ORIGIN
\
\,
\
t
\ 0
\ 0 6,. 5 ?i
\ %
c, \ 9
$ ‘. F.
\
\
0 50 lOOFT I I
\
t
DECON FACILITY
LATTY AVENUE ‘TEMPloRARy’
N19DO ! , II*\r. I I, ,,,I I
N19DO
N17DO
N1600
SUPPLEMENTARY SUPPLEMENTARY STORAGE PILE STORAGE PILE
I I I I
I I I I : :
\ \ * * I I
\ \ : : 1 b111 I !! I !I 7 I n I II MAIN
STORAGE PILE
CLEANED IN 1984 8 8 8 c 2 H E w E w
F IGURE 5-l AREAS AND DEPTHS OF CONTAMINATION AT THE HISS
18
-.-- --.. -- ._ _ -I___ ~--_____-

.-
.m-
“-
“I
*-
.-
I-
.-
.-
since radioactive decay is a random process, a correlation between the rate of disintegration and a given radionuclide concentration cannot be precisely established; therefore, the exact concentration of the radionuclide cannot be determ ined. As such, each value that is equal to or greater than the MDA has an associated uncertainty
term (21, which represents the maximum amount by which the actual value can be expected to differ from the value given in the table. The uncertainty term has an associated confidence level of 95 percent.
Thorium -232 concentrations ranged from background levels to 5 pCi/g. Radium-226 concentrations above the DOE guideline were found in several samples, with concentrations up to 700 pCi/g. Uranium -238 concentrations ranged from 4 to 800 pCi/g. Concentrations of thorium -230 ranged from 0.8 to 790 pCi/g in the selected samples analyzed: however, it is highly probable that the maximum thorium -230 concentration on the property is much greater than was indicated by analysis results, since only those samples with no associated gamma-emitting radionuclides were analyzed for thorium -230.
,-
._..^
19
-- ~___.-l

BASIC DDSE LIMITS n-
TABLE 5-l
SUMMARY CF RESIDUAL CONTAMINATION GUIDELINES FOR THE HISS
latlon dose rece blved by an Individual member of the general pub The basic Ilmlt for the annual rad IO0 mran/yr.
SOIL (LAND) GUIDELINES (MAXIMUM LIMITS FOR UNRESTRICTED USE)
Ic Is
Rsdlonucl Ide Sol I Concentration (pCl/g) above backgrounda~b~C
Rad I urn-226 5 PCl/9, averaged over the first I5 cm of sol I below Rsd I urn-228 the surfae; I5 pCi /g when averaged over any 15-cm- Thor 11~~230 Thor I urn-232
thick sol I layer below the surfae layer.
Dther radlonucl Ides Sol I guldel lnes wll I be calculated on a site-specl bas 1s using the DOE manual developed for thls use.
f Ic
aThese guldellnes take into acount lngrowth of radium-226 fran thorium-230 and of radian-228 frun thorium-232, and assume secular equl I lbrlum. If elther thorlum-230 and radium-226 or thorium-232 and radium-228 are both present, not In secular equiilbriun, the guldellnes apply to the hlgher concentration. If other mixtures of radlonucl ides occur, the concentrations of lndlvldual radionuclides shall be reduced so that the dose for the mixtures will not exceed the bsslc dose I Imlt.
bThese guidellnes represent unrestricted-use residual concentrations above background averaged aross any l5-cm-thick I ayer to any depth and over any contiguous 100-111~ surface area.
CLocallzed concentrations In excess of these llmlts are allowable provided that the average concentration over a lDO-m2 area does not exceed these I imlts.
20

i I 5 I 1 f
TMXE 5-2
BACKGRCUH) RADlONlJCiIoE CONCENTRATIONS AND RADIATION LEVELS IN SOIL IN THE ST, LOUIS AREA
I I
Gawm EXpOSUf7. Camna Near-Surface Rate at Radlatlon Ganma
I4o.asurament 3 1t Locat Ion (uR/h)
at 3 tt (cpm)
Radlet Ion (cpm)
Radlcmucllde Concentretlon tpCl/g) Uranlum-234 Uranium-235 Uranl urn-238 Radl urn-226 Thor I urn-230 Thor I Ml-232 Lee6210
I 6 7000 4000 I.2 * 0.2 0.1 I.2 + 0.2 0.7 + 0.1 0.1 + 0.1 0.3 l 0.1 0.6 + 0.4 -
2 6 7000 4DDo 0.6 + 0.2 0.1 0.6 + 0.1 0.3 + 0.1 0.3 + 0.1 0.5 + 0.1 2.0 + 0.5 -
3 8 8000 5000 I.3 + 0.3 0.1 + 0.1 I.3 + 0.2 0.4 + 0.1 0.3 + 0.1 0.3 + 0.1 0.5 + 0.4 - -
Average 8 7000 4000 I.0 + 0.2 0.1 1.0 + 0.2 0.5 + 0.1 0.2 + 0.1 0.4 + 0.1 1.0 + 0.4 - tJ t-J

-
_ -
T A B L E 5 -3
G A M M A R A D IA T IO N E X P O S U R E R A T E S
A T T H E H IS S
Coord ina tes E a s t Nor th p R /h
5 5 0 .0 5 5 0 .0 6 0 0 .0 6 0 0 .0 6 0 0 .0 6 0 0 .0 7 0 0 .0 7 0 0 .0 7 0 0 .0 8 0 0 .0 8 0 0 .0 8 0 0 .0 8 5 0 .0 8 5 0 .0 8 5 0 .0
1 5 5 0 .0 1 8 0 0 .0 1 4 0 0 .0 1 7 0 0 .0 1 8 5 0 .0 1 9 2 5 .0 1 3 5 0 .0 1 7 0 0 .0 1 9 0 0 .0 1 3 0 0 .0 1 6 0 0 .0 1 7 5 0 .0 1 1 5 0 .0 1 4 5 0 .0 1 8 0 0 .0
3 5 5 5 1 9 4 7 3 6 1 4 1 7 2 3 1 5 1 6 1 5 1 6 2 2 2 2 1 3
2 2
-.~. --. _ _ _ _-- - - __”

-
TABLE 5-4
DOWN-HOLE GAMMA LOGGING RESULTS FOR THE HISS
Page 1 of 19
Coordinates Depth SPA-3 Count Rate East North (ft) (cpm)
550.0 1450.0 0.0 54000 550.0 550.0 550.0 550.0 550.0 550.0 550.0 550.0 550.0 550.0 550.0 550.0 550.0 550.0 550.0 550.0 550.0 550.0 550.0 550.0
550.0 550.0 550.0 550.0 550.0 550.0 550.0 550.0 550.0 550.0 550.0 550.0 550.0 550.0 550.0 550.0 550.0 550.0 550.0 550.0 550.0
1450.0 1450.0 1450.0 1450.0 1450.0 1450.0 1450.0 1450.0 1450.0 1450.0 1450.0 1450.0 1450.0 1450.0 1450.0 1450.0 1450.0 1450.0 1450.0 1450.0
1550.0 1550.0 1550.0 1550.0 1550.0 1550.0 1550.0 1550.0 1550.0 1550.0 1550.0 1550.0 1550.0 1550.0 1550.0 1550.0 1550.0 1550.0 1550.0 1550.0 1550.0
0.5 103000 1.0 92000 1.5 65000 2.0 83000 2.5 62000 3.0 27000 3.5 19000 4.0 17000 4.5 16000 5.0 15000 5.5 14000 6.0 14000 6.5 13000 7.0 12000 7.5 13000 8.0 13000 8.5 13000 9.0 13000 9.5 13000
10.0 14000
0.0 69000 0.5 154000 1.0 128000 1.5 42000 2.0 22000 2.5 16000 3.0 16000 3.5 15000 4.0 15000 4.5 15000 5.0 15000 5.5 15000 6.0 14000 6.5 13000 7.0 13000 7.5 13000 8.0 13000 8.5 13000 9.0 13000 9.5 14000
10.0 14000
27

“I
.-
T A B L E 5 -4
(con tinued )
P a q e 2 o f 1 9
Coord ina tes D e p th S P A -3 C o u n t R a te E a s t Nor th W ) (= p m )
5 5 0 .0 5 5 0 .0 5 5 0 .0 5 5 0 .0 5 5 0 .0 5 5 0 .0 5 5 0 .0 5 5 0 .0 5 5 0 .0 5 5 0 .0 5 5 0 .0 5 5 0 .0 5 5 0 .0 5 5 0 .0 5 5 0 .0 5 5 0 .0 5 5 0 .0 5 5 0 .0 5 5 0 .0 5 5 0 .0 5 5 0 .0
5 5 0 .0 5 5 0 .0 5 5 0 .0 5 5 0 .0 5 5 0 .0 5 5 0 .0 5 5 0 .0 5 5 0 .0 5 5 0 .0 5 5 0 .0 5 5 0 .0 5 5 0 .0 5 5 0 .0 5 5 0 .0 5 5 0 .0 5 5 0 .0 5 5 0 .0 5 5 0 .0 5 5 0 .0 5 5 0 .0
1 6 5 0 .0 0 .0 1 4 9 0 0 0 1 6 5 0 .0 0 .5 3 2 4 0 0 0 1 6 5 0 .0 1 .0 5 6 4 0 0 0 1 6 5 0 .0 1 .5 6 1 3 0 0 0 1 6 5 0 .0 2 .0 6 1 1 0 0 0 1 6 5 0 .0 2 .5 3 0 0 0 0 0 1 6 5 0 .0 3 .0 7 9 0 0 0 1 6 5 0 .0 3 .5 3 4 0 0 0 1 6 5 0 .0 4 .0 2 1 0 0 0 1 6 5 0 .0 4 .5 1 7 0 0 0 1 6 5 0 .0 5 .0 1 6 0 0 0 1 6 5 0 .0 5 .5 1 5 0 0 0 1 6 5 0 .0 6 .0 1 5 0 0 0 1 6 5 0 .0 6 .5 1 5 0 0 0 1 6 5 0 .0 7 .0 1 5 0 0 0 1 6 5 0 .0 7 .5 1 4 0 0 0 1 6 5 0 .0 8 .0 1 4 0 0 0 1 6 5 0 .0 8 .5 1 4 0 0 0 1 6 5 0 .0 9 .0 1 4 0 0 0 1 6 5 0 .0 9 .5 1 4 0 0 0 1 6 5 0 .0 1 0 .0 1 7 0 0 0
1 7 5 0 .0 0 .0 1 1 8 0 0 0 1 7 5 0 .0 0 .5 3 5 2 0 0 0 1 7 5 0 .0 1 .0 5 2 3 0 0 0 1 7 5 0 .0 1 .5 2 3 7 0 0 0 1 7 5 0 .0 2 .0 9 7 0 0 0 1 7 5 0 .0 2 .5 4 6 0 0 0 1 7 5 0 .0 3 .0 2 8 0 0 0 1 7 5 0 .0 3 .5 2 1 0 0 0 1 7 5 0 .0 4 .0 1 8 0 0 0 1 7 5 0 .0 4 .5 1 6 0 0 0 1 7 5 0 .0 5 .0 1 5 0 0 0 1 7 5 0 .0 5 .5 1 5 0 0 0 1 7 5 0 .0 6 .0 1 5 0 0 0 1 7 5 0 .0 6 .5 1 5 0 0 0 1 7 5 0 .0 7.0 1 5 0 0 0 1 7 5 0 .0 7.5 1 5 0 0 0 1 7 5 0 .0 8 .0 1 4 0 0 0 1 7 5 0 .0 8 .5 1 4 0 0 0 1 7 5 0 .0 9 .0 1 4 0 0 0 1 7 5 0 .0 9 .5 1 3 0 0 0
2 4
_.Ix..^“_ _ _ _ _ _ _ -_-- -.- ____ I_ _ -_ -.--.

TABLE 5-4
(continued)
Paqe 3 of 19
Coordinates Depth SPA-3 Count Rate East North (ft) (=Pm)
550.0 1750.0 10.0 15000
550.0 1850.0 0.0 82000 550.0 1850.0 0.5 47000 550.0 1850.0 1.0 28000 550.0 1850.0 1.5 21000 550.0 1850.0 2.0 18000 550.0 1850.0 2.5 16000 550.0 1850.0 3.0 16000 550.0 1850.0 3.5 15000 550.0 1850.0 4.0 14000 550.0 1850.0 4.5 14000 550.0 1850.0 5.0 14000 550.0 1850.0 5.5 14000 550.0 1850.0 6.0 14000 550.0 1850.0 6.5 14000 550.0 1850.0 7.0 14000 550.0 1850.0 7.5 14000 550.0 1850.0 8.0 14000 550.0 1850.0 8.5 14000 550.0 1850.0 9.0 14000 550.0 1850.0 9.5 14000 550.0 1850.0 10.0 13000
573.0 573.0 573.0 573.0 573.0 573.0 573.0 573.0 573.0 573.0 573.0 573.0 573.0 573.0 573.0 573.0 573.0 573.0 573.0
1550.0 0.0 48000 1550.0 0.5 33000 1550.0 1.0 20000 1550.0 1.5 17000 1550.0 2.0 16000 1550.0 2.5 15000 1550.0 3.0 15000 1550.0 3.5 15000 1550.0 4.0 15000 1550.0 4.5 15000 1550.0 5.0 15000 1550.0 5.5 15000 1550.0 6.0 14000 1550.0 6.5 14000 1550.0 7.0 14000 1550.0 7.5 13000 1550.0 8.0 13000 1550.0 8.5 13000 1550.0 9.0 13000
25
.--__^_. _ _ll.-
. 1 . -

TABLE 5-4
(continued)
-1
Coordinates Depth SPA-3 Count Rate East North (ft) (cpm)
573.0 1550.0 9.5 14000 573.0 1550.0 10.0 16000
576.0 576.0 576.0 576.0 576.0 576.0 576.0 576.0 576.0 576.0
-5 576.0 576.0 576.0
4.. 576.0 576.0 576.0 576.0 576.0 576.0 576.0 576.0
1650.0 0.0 100000 1650.0 0.5 164000 1650.0 1.0 244000 1650.0 1.5 333000 1650.0 2.0 400000 1650.0 2.5 190000 1650.0 3.0 58000 1650.0 3.5 26000 1650.0 4.0 20000 1650.0 4.5 16000 1650.0 5.0 15000 1650.0 5.5 15000 1650.0 6.0 15000 1650.0 6.5 15000 1650.0 7.0 14000 1650.0 7.5 14000 1650.0 8.0 14000 1650.0 8.5 13000 1650.0 9.0 14000 1650.0 9.5 14000 1650.0 10.0 14000
588.0 588.0 588.0 588.0 588.0 588.0 588.0 588.0 588.0 588.0 588.0 588.0 -..I
588.0 588.0 588.0
- 588.0 588.0 588.0
1450.0 0.0 152000 1450.0 0.5 324000 1450.0 1.0 173000 1450.0 1.5 61000 1450.0 2.0 26000 1450.0 2.5 19000 1450.0 3.0 17000 1450.0 3.5 16000 1450.0 4.0 16000 1450.0 4.5 15000 1450.0 5.0 15000 1450.0 5.5 15000 1450.0 6.0 14000 1450.0 6.5 14000 1450.0 7.0 13000 1450.0 7.5 14000 1450.0 8.0 13000 1450.0 8.5 13000
26
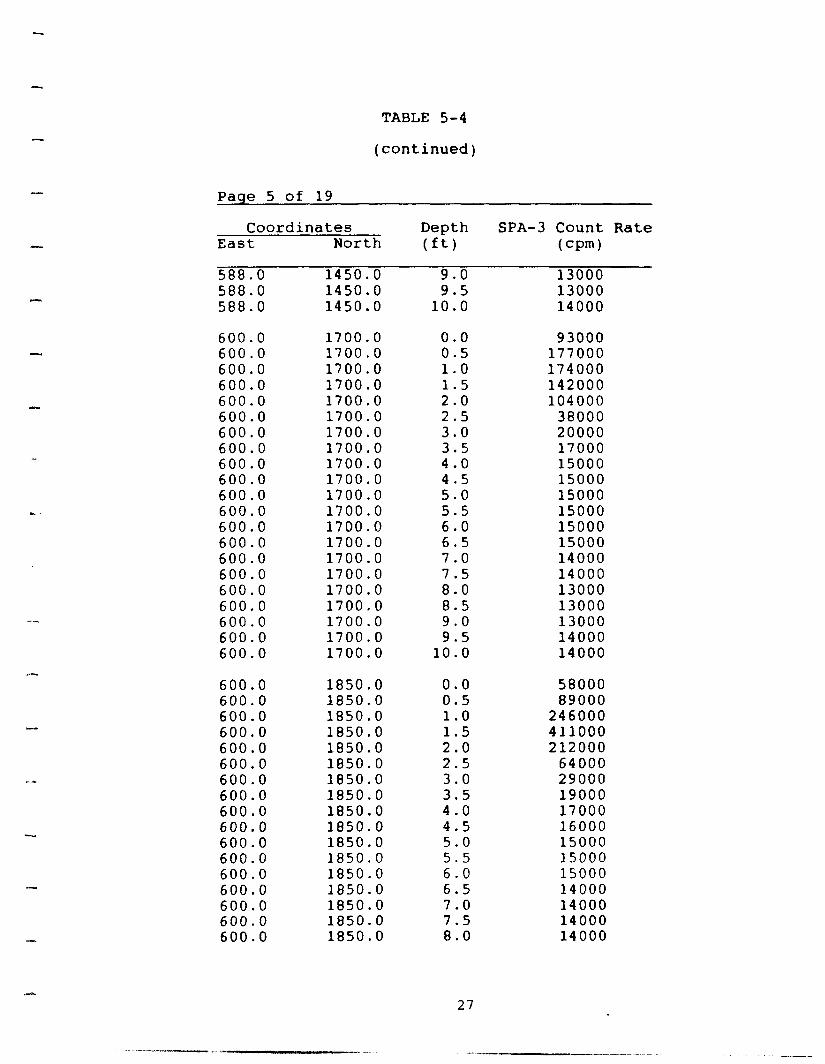
TABLE 5-4
(continued)
Page 5 of 19
Coordinates Depth SPA-3 Count Rate East North (ft) (=pm)
588.0 1450.0 9.0 13000 588.0 1450.0 9.5 13000 588.0 1450.0 10.0 14000
600.0 1700.0 600.0 1700.0 600.0 1700.0 600.0 1700.0 600.0 1700.0 600.0 1700.0 600.0 1700.0 600.0 1700.0 600.0 1700.0 600.0 1700.0 600.0 1700.0 600.0 1700.0 600.0 1700.0 600.0 1700.0 600.0 1700.0 600.0 1700.0 600.0 1700.0 600.0 1700.0 600.0 1700.0 600.0 1700.0 600.0 1700.0
0.0 0.5 1.0 1.5 2.0 2.5 3.0 3.5 4.0 4.5 5.0
2:; 6.5 7.0
2; 8.5 9.0 9.5
10.0
93000 177000 174000 142000 104000
38000 20000 17000 15000 15000 15000 15000 15000 15000 14000 14000 13000 13000 13000 14000 14000
600.0 1850.0 600.0 1850.0 600.0 1850.0 600.0 1850.0 600.0 1850.0 600.0 1850.0 600.0 1850.0 600.0 1850.0 600.0 1850.0 600.0 1850.0 600.0 1850.0 600.0 1850.0 600.0 1850.0 600.0 1850.0 600.0 1850.0 600.0 1850.0 600.0 1850.0
0.0 0.5 1.0
::; 2.5 3.0 3.5 4.0 4.5 5.0 5.5 6.0 6.5 7.0 7.5 8.0
58000 89000
246000 411000 212000
64000 29000 19000 17000 16000 15000 15000 15000 14000 14000 14000 14000
27
. - . _ . -
. - . -- -I_-- -._-... ----

-
--
.(c.
*’
(I
..-
*-
.h
,-
..a..
TABLE 5-4
(continued)
Coordinates Depth SPA-3 Count Rate East North (W (cpm)
600.0 1850.0 8.5 13000 600.0 1850.0 9.0 13000 600.0 1850.0 9.5 14000 600.0 1850.0 10.0 14000
600.0 600.0 600.0 600.0 600.0 600.0 600.0 600.0 600.0 600.0 600.0 600.0 600.0 600.0 600.0 600.0 600.0 600.0 600.0 600.0 600.0
605.0 605.0 605.0 605.0 605.0 605.0 605.0 605.0 605.0 605.0 605.0 605.0 605.0 605.0 605.0 605.0
1925.0 1925.0 1925.0 1925.0 1925.0 1925.0 1925.0 1925.0 1925.0 1925.0 1925.0 1925.0 1925.0 1925.0 1925.0 1925.0 1925.0 1925.0 1925.0 1925.0 1925.0
1400.0 1400.0 1400.0 1400.0 1400.0 1400.0 1400.0 1400.0 1400.0 1400.0 1400.0 1400.0 1400.0 1400.0 1400.0 1400.0
0.0 23000 0.5 27000 1.0 46000 1.5 121000 2.0 359000 2.5 428000 3.0 251000 3.5 81000 4.0 32000 4.5 20000 5.0 17000 5.5 16000 6.0 16000 6.5 15000 7.0 14000 7.5 14000 8.0 13000 8.5 13000 9.0 13000 9.5 13000
10.0 14000
0.0 28000 0.5 48000 1.0 62000 1.5 26000 2.0 20000 2.5 17000 3.0 16000 3.5 15000 4.0 15000 4.5 15000 5.0 14000 5.5 14000 6.0 13000 6.5 13000 7.0 13000 7.5 13000
28
_.. --_-I “. ._ -.-.

.-
TABLE 5-4
(continued)
Paqe 7 of 19
Coordinates Depth SPA-3 Count Rate East North (W (cpm)
605.0 1400.0 8.0 13000
.-
605.0 605.0 605.0 605.0
695.0 695.0 695.0 695.0 695.0 695.0 695.0 695.0 695.0 695.0 695.0 695.0 695.0 695.0 695.0 695.0 695.0 695.0 695.0 695.0 695.0
700.0 700.0 700.0 700.0 700.0 700.0 700.0 700.0 700.0 700.0 700.0 700.0 700.0 700.0 700.0
1400.0 1400.0 1400.0 1400.0
1350.0 1350.0 1350.0 1350.0 1350.0 1350.0 1350.0 1350.0 1350.0 1350.0 1350.0 1350.0 1350.0 1350.0 1350.0 1350.0 1350.0 1350.0 1350.0 1350.0 1350.0
1700.0 1700.0 1700.0 1700.0 1700.0 1700.0 1700.0 1700.0 1700.0 1700.0 1700.0 1700.0 1700.0 1700.0 1700.0
8.5 13000 9.0 13000 9.5 13000
10.0 14000
0.0 0.5 1.0 1.5 2.0 2.5 3.0 3.5 4.0 4.5 5.0
i:'o 6.5 7.0 7.5 8.0 8.5 9.0 9.5
10.0
26000 64000 44000 23000 18000 17000 16000 16000 16000 14000 14000 14000 13000 14000 14000 14000 14000 14000 13000 14000 13000
0.0 0.5 1.0
2; 2.5 3.0 3.5 4.0 4.5 5.0 5.5 6.0 6.5 7.0
43000 74000 99000 89000 70000 39000 22000 17000 16000 16000 15000 15000 15000 15000 14000
29
-- _-__.- .*..- ^_.. --...-.

.-
--
.-
-
,m
(.
TABLE 5-4
(continued)
Coordinates Depth SPA-3 Count Rate East North (ft) (wW
700.0 1700.0 7.5 13000 700.0 700.0 700.0 700.0 700.0
700.0 700.0 700.0 700.0 700.0 700.0 700.0 700.0 700.0 700.0 700.0 700.0 700.0 700.0 700.0 700.0 700.0 700.0 700.0 700.0 700.0
700.0 700.0 700.0 700.0 700.0 700.0 700.0 700.0 700.0 700.0 700.0 700.0 700.0 700.0
1700.0 1700.0 1700.0 1700.0 1700.0
8.0
i:; 9.5
10.0
14000 13000 13000 14000 14000
1823.0 1823.0 1823.0 1823.0 1823.0 1823.0 1823.0 1823.0 1823.0 1823.0 1823.0 1823.0 1823.0 1823.0 1823.0 1823.0 1823.0 1823.0 1823.0 1823.0 1823.0
0.0 0.5 1.0 1.5 2.0 2.5 3.0 3.5 4.0 4.5 5.0 5.5 6.0 6.5 7.0
;:; 8.5 9.0 9.5
10.0
21000 37000 50000 25000 18000 16000 15000 15000 15000 15000 15000 14000 14000 14000 14000 14000 14000 13000 13000 13000 14000
1900.0 0.0 18000 1900.0 0.5 25000 1900.0 1.0 25000 1900.0 1.5 19000 1900.0 2.0 17000 1900.0 2.5 16000 1900.0 3.0 16000 1900.0 3.5 16000 1900.0 4.0 15000 1900.0 4.5 15000 1900.0 5.0 15000 1900.0 5.5 15000 1900.0 6.0 14000 1900.0 6.5 13000
30
____ .---

TABLE 5-4
(continued)
Paqe 9 of 19
Coordinates Depth SPA-3 Count Rate East North PI (=pm) 700.0 1900.0 7.0 12000
a--
,-
-
700.0 700.0 700.0 700.0 700.0 700.0
737.5 737.5 737.5 737.5 737.5 737.5 737.5 737.5 737.5 737.5 737.5 737.5 737.5 737.5 737.5 737.5 737.5 737.5 737.5 737.5 737.5
750.0 750.0 750.0 750.0 750.0 750.0 750.0 750.0 750.0 750.0 750.0 750.0 750.0
1900.0 1900.0 1900.0 1900.0 1900.0 1900.0
1300.0 1300.0 1300.0 1300.0 1300.0 1300.0 1300.0 1300.0 1300.0 1300.0 1300.0 1300.0 1300.0 1300.0 1300.0 1300.0 1300.0 1300.0 1300.0 1300.0 1300.0
1050.0 1050.0 1050.0 1050.0 1050.0 1050.0 1050.0 1050.0 1050.0 1050.0 1050.0 1050.0 1050.0
7.5 12000 8.0 13000 8.5 13000 9.0 13000 9.5 13000
10.0 14000
0.0 20000 0.5 26000 1.0 27000 1.5 28000 2.0 19000 2.5 17000 3.0 16000 3.5 16000 4.0 15000 4.5 15000 5.0 14000 5.5 14000 6.0 14000 6.5 14000 7.0 14000 7.5 14000 8.0 14000 8.5 13000 9.0 13000 9.5 13000
10.0 14000
0.0 71000 0.5 117000 1.0 102000 1.5 57000 2.0 40000 2.5 30000 3.0 20000 3.5 17000 4.0 16000 4.5 16000 5.0 15000 5.5 15000 6.0 14000
31
_-ll__l_---..

TABLE 5-4
(continued)
Page 10 of 19
Coordinates Depth SPA-3 Count Rate East North (ft) (=Pm)
750.0 1050.0 6.5 14000
-
. -
750.0 1050.0 7.0 14000 750.0 1050.0 7.5 14000 750.0 1050.0 8.0 14000 750.0 1050.0 8.5 14000 750.0 1050.0 9.0 14000 750.0 1050.0 9.5 14000 750.0 1050.0 10.0 15000
750.0 750.0 750.0 750.0 750.0 750.0 750.0 750.0 750.0 750.0 750.0 750.0 750.0 750.0 750.0 750.0 750.0 750.0 750.0 750.0 750.0
797.0 1653.0 0.0 24000 797.0 1653.0 0.5 34000 797.0 1653.0 1.0 55000 797.0 1653.0 1.5 106000 797.0 1653.0 2.0 230000 797.0 1653.0 2.5 166000 797.0 1653.0 3.0 45000 797.0 1653.0 3.5 23000 797.0 1653.0 4.0 20000 797.0 1653.0 4.5 16000 797.0 1653.0 5.0 16000 797.0 1653.0 5.5 15000
1100.0 1100.0 1100.0 1100.0 1100.0 1100.0 1100.0 1100.0 1100.0 1100.0 1100.0 1100.0 1100.0 1100.0 1100.0 1100.0 1100.0 1100.0 1100.0 1100.0 1100.0
0.0 0.5 1.0 1.5 2.0 2.5 3.0 3.5 4.0 4.5 5.0 5.5 6.0 6.5 7.0 7.5
EL: 9.0 9.5
10.0
32
55000 81000 61000 29000 20000 17000 16000 16000 16000 16000 15000 15000 14000 14000 14000 14000 13000 13000 13000 13000 13000
. .- “.
.C_. ___. .

TABLE 5-4
(continued)
Paqe 11 of 19
Coordinates Depth SPA-3 Count Rate East North W) (cpm)
797.0 1653.0 6.0 15000 797.0 ,- 797.0 797.0 797.0
- 797.0 797.0 797.0 797.0
1653.0 6.5 15000 1653.0 7.0 15000 1653.0 7.5 15000 1653.0 8.0 15000 1653.0 8.5 15000 1653.0 9.0 15000 1653.0 9.5 14000 1653.0 10.0 13000
800.0 1250.0 800.0 1250.0 800.0 1250.0 800.0 1250.0 800.0 1250.0 800.0 1250.0 800.0 1250.0 800.0 1250.0 800.0 1250.0 800.0 1250.0 800.0 1250.0 800.0 1250.0 kX 800.0 1250.0 800.0 1250.0 800.0 1250.0 800.0 1250.0 800.0 1250.0 800.0 1250.0 800.0 1250.0 800.0 1250.0 800.0 1250.0
0.0 0.5 1.0 1.5 2.0 2.5 3.0 3.5 4.0 4.5 5.0 5.5 6.0 6.5 7.0 7.5
i:: 9.0 9.5
10.0
16000 29000 30000 18000 17000 16000 15000 15000 15000 14000 14000 15000 15000 14000 14000 14000 14000 14000 14000 13000 14000
800.0 1350.0 0.0 21000 800.0 1350.0 0.5 30000 800.0 1350.0 1.0 33000 800.0 1350.0 1.5 28000 800.0 1350.0 2.0 19000 800.0 1350.0 2.5 17000 800.0 1350.0 3.0 16000 800.0 1350.0 3.5 16000 800.0 1350.0 4.0 16000 800.0 1350.0 4.5 16000 800.0 1350.0 5.0 15000
33

-
,-
(-
TABLE 5-4
(continued)
Page 12 of 19
Coordinates Depth SPA-3 Count Rate East North (ft) (=pm)
800.0 1350.0 5.5 15000 800.0 1350.0 800.0 1350.0 800.0 1350.0 800.0 1350.0 800.0 1350.0 800.0 1350.0 800.0 1350.0 800.0 1350.0 800.0 1350.0
6.0 6.5 7.0 7.5 8.0 8.5
;:; 10.0
15000 14000 14000 15000 15000 14000 14000 14000 15000
800.0 1750.0 0.0 16000 800.0 1750.0 0.5 21000 800.0 1750.0 1.0 23000 800.0 1750.0 1.5 22000 800.0 1750.0 2.0 19000 800.0 1750.0 2.5 17000 800.0 1750.0 3.0 19000 800.0 1750.0 3.5 21000 800.0 1750.0 4.0 21000 800.0 1750.0 4.5 17000 800.0 1750.0 5.0 14000 800.0 1750.0 5.5 14000 800.0 1750.0 6.0 15000 800.0 1750.0 6.5 15000 800.0 1750.0 7.0 14000 800.0 1750.0 7.5 14000 800.0 1750.0 8.0 14000 800.0 1750.0 8.5 13000 800.0 1750.0 9.0 13000 800.0 1750.0 9.5 13000 800.0 1750.0 10.0 13000
804.0 1839.0 0.0 48000 804.0 1839.0 0.5 105000 804.0 1839.0 1.0 147000 804.0 1839.0 1.5 223000 804.0 1839.0 2.0 100000 804.0 1839.0 2.5 42000 804.0 1839.0 3.0 28000 804.0 1839.0 3.5 22000 804.0 1839.0 4.0 18000 804.0 1839.0 4.5 16000
_- -. --

TABLE 5-4
(continued)
Page 13 of 19
Coordinates Depth SPA-3 Count Rate East North W) Wpm)
804.0 1839.0 5.0 15000 804.0 1839.0 804.0 1839.0 804.0 1839.0 804.0 1839.0 804.0 1839.0 804.0 1839.0 804.0 1839.0 804.0 1839.0 804.0 1839.0 804.0 1839.0
5.5 6.0 6.5 7.0 7.5 8.0 8.5 9.0 9.5
10.0
15000 14000 13000 12000 12000 12000 12000 10000 10000 13000
805.0 805.0 805.0 805.0 805.0 805.0 805.0 805.0 805.0 805.0 805.0 805.0 805.0 805.0 805.0 805.0 805.0 805.0 805.0 805.0 805.0
806.0 806.0 806.0 806.0 806.0 806.0 806.0 806.0 806.0
1450.0 1450.0 1450.0 1450.0 1450.0 1450.0 1450.0 1450.0 1450.0 1450.0 1450.0 1450.0 1450.0 1450.0 1450.0 1450.0 1450.0 1450.0 1450.0 1450.0 1450.0
1150.0 1150.0 1150.0 1150.0 1150.0 1150.0 1150.0 1150.0 1150.0
0.0 28000 0.5 37000 1.0 29000 1.5 19000 2.0 17000 2.5 16000 3.0 18000 3.5 16000 4.0 15000 4.5 15000 5.0 15000 5.5 15000 6.0 15000 6.5 14000 7.0 14000 7.5 14000 8.0 15000 8.5 14000 9.0 14000 9.5 14000
10.0 14000
0.0 44000 0.5 43000 1.0 21000 1.5 17000 2.0 16000 2.5 16000 3.0 16000 3.5 15000 4.0 15000
35
--_.

-
TABLE 5-4
(continued)
Page 14 of 19
Coordinates Depth SPA-3 Count Rate East North tft) (=Pm)
806.0 1150.0 4.5 14000
, - -
. -
852.0 1062.5 0.0 12000 852.0 1062.5 0.5 14000 852.0 1062.5 1.0 17000 852.0 1062.5 1.5 16000 852.0 1062.5 2.0 15000 852.0 1062.5 2.5 15000 852.0 1062.5 3.0 15000 852.0 1062.5 3.5 16000
36
- - _ - . - . I . . . - - . .__- _.___
- 1 , . . . “_.
806.0 806.0 806.0 806.0 806.0 806.0 806.0 806.0 806.0 806.0 806.0
1150.0 1150.0 1150.0 1150.0 1150.0 1150.0 1150.0 1150.0 1150.0 1150.0 1150.0
807.0 1550.0 807.0 1550.0 807.0 1550.0 807.0 1550.0 807.0 1550.0 807.0 1550.0 807.0 1550.0 807.0 1550.0 807.0 1550.0 807.0 1550.0 807.0 1550.0 807.0 1550.0 807.0 1550.0 807.0 1550.0 807.0 1550.0 807.0 1550.0 807.0 1550.0 807.0 1550.0 807.0 1550.0 807.0 1550.0 807.0 1550.0
5.0 5.5 6.0 6.5 7.0
20’ 8.5 9.0 9.5
10.0
0.0 0.5 1.0 1.5 2.0 2.5 3.0 3.5 4.0 4.5 5.0 5.5 6.0 6.5 7.0
2; 8.5 9.0 9.5
10.0
14000 14000 14000 14000 14000 14000 13000 13000 13000 13000 14000
18000 26000 32000 32000 27000 28000 22000 17000 16000 15000 15000 15000 15000 15000 15000 15000 14000 14000 14000 13000 14000

-
-
-
TABLE 5-4
(continued)
Page 15 of 19
Coordinates Depth SPA-3 Count Rate East North tft) (CPm) 852.0 1062.5 4.0 15000 852.0 1062.5 4.5 852.0 1062.5 5.0 852.0 1062.5 5.5 852.0 1062.5 6.0 852.0 1062.5 6.5 852.0 1062.5 7.0 852.0 1062.5 7.5 852.0 1062.5 8.0 852.0 1062.5 8.5 852.0 1062.5 9.0 852.0 1062.5 9.5 852.0 1062.5 10.0
15000 15000 15000 14000 14000 15000 14000 14000 14000 14000 14000 14000
859.0 859.0 859.0 859.0 859.0 859.0 859.0 859.0 859.0 859.0 859.0 859.0 859.0 859.0 859.0 859.0 859.0 859.0 859.0 859.0 859.0
860.0 860.0 860.0 860.0 860.0 860.0 860.0
1500.0 1500.0 1500.0 1500.0 1500.0 1500.0 1500.0 1500.0 1500.0 1500.0 1500.0 1500.0 1500.0 1500.0 1500.0 1500.0 1500.0 1500.0 1500.0 1500.0 1500.0
1400.0 1400.0 1400.0 1400.0 1400.0 1400.0 1400.0
0.0 24000 0.5 20000 1.0 17000 1.5 16000 2.0 16000 2.5 16000 3.0 18000 3.5 16000 4.0 16000 4.5 15000 5.0 15000 5.5 15000 6.0 15000 6.5 14000 7.0 14000 7.5 14000 8.0 14000 8.5 14000 9.0 14000 9.5 14000
10.0 14000
0.0 34000 0.5 20000 1.0 16000 1.5 16000 2.0 16000 2.5 16000 3.0 16000
3?
-
.c
-
-
m-
._-
TABLE 5-4
(continued)
Page 16 of 19
Coordinates Depth SPA-3 Count Rate East North (ft) (cpm )
860.0 1400.0 3.5 16000 860.0 1400.0 4.0 16000 860.0 1400.0 4.5 15000 860.0 1400.0 5.0 15000 860.0 1400.0 5.5 15000 860.0 1400.0 6.0 15000 860.0 1400.0 6.5 15000 860.0 1400.0 7.0 15000 860.0 1400.0 7.5 15000 860.0 1400.0 8.0 15000 860.0 1400.0 8.5 14000 860.0 1400.0 9.0 15000
861.0 1600.0 0.0 116000 861.0 1600.0 0.5 449000 861.0 1600.0 1.0 354000 861.0 1600.0 1.5 95000 861.0 1600.0 2.0 40000 861.0 1600.0 2.5 25000 861.0 1600.0 3.0 20000 861.0 1600.0 3.5 18000 861.0 1600.0 4.0 17000 861.0 1600.0 4.5 17000 861.0 1600.0 5.0 16000 861.0 1600.0 5.5 16000 861.0 1600.0 6.0 16000 861.0 1600.0 6.5 16000 861.0 1600.0 7.0 16000 861.0 1600.0 7.5 16000 861.0 1600.0 8.0 16000 861.0 1600.0 8.5 16000 861.0 1600.0 9.0 15000 861.0 1600.0 9.5 16000 861.0 1600.0 10.0 15000
862.0 1700.0 0.0 33000 862.0 1700.0 0.5 29000 862.0 1700.0 1.0 20000 862.0 1700.0 1.5 17000 862.0 1700.0 2.0 17000 862.0 1700.0 2.5 16000 862.0 1700.0 3.0 16000 862.0 1700.0 3.5 15000
38

I -
< -
-
. -
_ . . .
L. . . .
.-
* -
* l
T A B L E 5 -4
(c o n ti n u e d )
P a g e 1 7 o f 1 9
C o o rd i n a te s D e p th S P A -3 C o u n t R a te E a s t N o rth (ft) (c p m )
8 6 2 .0 1 7 0 0 .0 4 .0 1 4 0 0 0 8 6 2 .0 1 7 0 0 .0 4 .5 8 6 2 .0 1 7 0 0 .0 5 .0 8 6 2 .0 1 7 0 0 .0 5 .5 8 6 2 .0 1 7 0 0 .0 6 .0 8 6 2 .0 1 7 0 0 .0 6 .5 8 6 2 .0 1 7 0 0 .0 7 .0 8 6 2 .0 1 7 0 0 .0 7 .5 8 6 2 .0 1 7 0 0 .0 8 .0 8 6 2 .0 1 7 0 0 .0 8 .5 8 6 2 .0 1 7 0 0 .0 9 .0 8 6 2 .0 1 7 0 0 .0 9 .5 8 6 2 .0 1 7 0 0 .0 1 0 .0
1 4 0 0 0 1 4 0 0 0 1 4 0 0 0 1 5 0 0 0 1 4 0 0 0 1 4 0 0 0 1 4 0 0 0 1 4 0 0 0 1 3 0 0 0 1 4 0 0 0 1 4 0 0 0 1 3 0 0 0
8 6 2 .0 1 8 0 0 .0 0 .0 1 4 0 0 0 8 6 2 .0 1 8 0 0 .0 0 .5 1 9 0 0 0 8 6 2 .0 1 8 0 0 .0 1 .0 3 4 0 0 0 8 6 2 .0 1 8 0 0 .0 1 .5 7 3 0 0 0 8 6 2 .0 1 8 0 0 .0 2 .0 9 5 0 0 0 8 6 2 .0 1 8 0 0 .0 2 .5 5 6 0 0 0 8 6 2 .0 1 8 0 0 .0 3 .0 2 4 0 0 0 8 6 2 .0 1 8 0 0 .0 3 .5 1 9 0 0 0 8 6 2 .0 1 8 0 0 .0 4 .0 1 7 0 0 0 8 6 2 .0 1 8 0 0 .0 4 .5 1 6 0 0 0 8 6 2 .0 1 8 0 0 .0 5 .0 1 5 0 0 0 8 6 2 .0 1 8 0 0 .0 5 .5 1 5 0 0 0 8 6 2 .0 1 8 0 0 .0 6 .0 1 5 0 0 0 8 6 2 .0 1 8 0 0 .0 6 .5 1 4 0 0 0 8 6 2 .0 1 8 0 0 .0 7 .0 1 3 0 0 0 8 6 2 .0 1 8 0 0 .0 7 .5 1 2 0 0 0 8 6 2 .0 1 8 0 0 .0 8 .0 1 2 0 0 0 8 6 2 .0 1 8 0 0 .0 8 .5 1 2 0 0 0 8 6 2 .0 1 8 0 0 .0 9 .0 1 2 0 0 0 8 6 2 .0 1 8 0 0 .0 9 .5 1 2 0 0 0 8 6 2 .0 1 8 0 0 .0 1 0 .0 1 3 0 0 0
8 7 0 .0 1 1 0 6 .0 0 .0 1 0 0 0 0 8 7 0 .0 1 1 0 6 .0 0 .5 1 2 0 0 0 8 7 0 .0 1 1 0 6 .0 1 .0 1 4 0 0 0 8 7 0 .0 1 1 0 6 .0 1 .5 1 4 0 0 0 8 7 0 .0 1 1 0 6 .0 2 .0 1 5 0 0 0 8 7 0 .0 1 1 0 6 .0 2 .5 1 5 0 0 0 8 7 0 .0 1 1 0 6 .0 3 .0 1 4 0 0 0
3 9
-,-- .- . _ . - _ _ _ _ _ - e . I

TABLE 5-4
(continued)
--
Page 18 of 19
Coordinates Depth SPA-3 Count Rate East North tft) (CPm)
870.0 1106.0 3.5 15000 - 870.0 1106.0
870.0 1106.0 870.0 1106.0 870.0 1106.0 870.0 1106.0 870.0 1106.0 870.0 1106.0 870.0 1106.0 870.0 1106.0 870.0 1106.0 870.0 1106.0 870.0 1106.0 870.0 1106.0
870.0 870.0 870.0 870.0 870.0 870.0 870.0 870.0 870.0 870.0 870.0 870.0 870.0 870.0 870.0 870.0 870.0 870.0 870.0 870.0 870.0
872.0 872.0 872.0 872.0 872.0 872.0
1200.0 1200.0 1200.0 1200.0 1200.0 1200.0 1200.0 1200.0 1200.0 1200.0 1200.0 1200.0 1200.0 1200.0 1200.0 1200.0 1200.0 1200.0 1200.0 1200.0 1200.0
1300.0 1300.0 1300.0 1300.0 1300.0 1300.0
4.0 4.5 5.0 5.5
ii:; 7.0 7.5 8.0 8.5 9.0 9.5
10.0
0.0 0.5 1.0 1.5 2.0 2.5 3.0 3.5 4.0 4.5 5.0 5.5
i:! 7.0 7.5 8.0 8.5 9.0 9.5
10.0
0.0 12000 0.5 14000 1.0 15000 1.5 15000 2.0 15000 2.5 16000
40
14000 15000 15000 15000 13000 13000 13000 13000 13000 13000 13000 14000 14000
22000 52000 53000 47000 42000 27000 19000 17000 17000 16000 16000 17000 16000 16000 16000 16000 16000 15000 15000 15000 15000
-----_---~_ ---

TABLE 5-4
(continued)
Coordinates Depth SPA-3 Count Rate East North (ft) (=Pm)
872.0 1300.0 3.0 16000 872.0 1300.0 3.5 16000 872.0 1300.0 4.0 15000 872.0 1300.0 4.5 15000 872.0 1300.0 5.0 15000 872.0 1300.0 5.5 16000 872.0 1300.0 6.0 16000 872.0 1300.0 6.5 16000 872.0 1300.0 7.0 15000 872.0 1300.0 7.5 16000 872.0 1300.0 8.0 16000 872.0 1300.0 8.5 15000 872.0 1300.0 9.0 15000 872.0 1300.0 9.5 15000 872.0 1300.0 10.0 15000
-1 ..” __--. -~
i i j E i I 1 1 i i
TABLE 5-5
RADIONUCLIDE CONCENTRATIONS IN SOIL AT THE HISS
Page 1 of 15
Coordinates Depth Concentration (pCi/g +/- 2 sigma) East North (ft) Uranium-238 Radium-226 Thorium-232 Thorium-230
550.0 550.0 550.0 550.0 550.0 550.0 550.0 550.0 550.0 a. FJ 550.0
550.0 550.0 550.0 550.0 550.0 550.0 550.0 550.0 550.0 550.0
550.0 550.0 550.0
1450.0 o- 1 1450.0 l- 2 1450.0 2- 3 1450.0 3- 4 1450.0 4- 5 1450.0 5- 6 1450.0 6- 7 1450.0 7- 8 1450.0 8- 9 1450.0 9-10
1550.0 1550.0 1550.0 1550.0 1550.0 1550.0 1550.0 1550.0 1550.0 1550.0
1650.0 o- 1 1650.0 l- 2 1650.0 2- 3
o- 1 36.0 +/- 29.0 l- 2 -b- 2- 3 51.0 +/- 14.0 3- 4 c11.0 4- 5 < 7.0 5- 6 15.0 +/- 5.0 6- 7 < 4.0 7- 8 < 8.0 8- 9 < 5.0 9-10 < 5.0
;;.; I;- 10.0
i18.0 - 6.0
< 9.0 < 4.0 < 9.0 < 6.0 < 5.0 < 8.0 < 9.0
43.0 +/- 16.0 450.0 +/- 40.0
c10.0
26.0 +/- 2.0 12.0 +/- 2.0 15.0 +/- 2.0
0.8 +/- 0.5 1.4 +/- 0.5 2.0 +/- 0.6 0.9 +/- 0.4 1.0 +/- 0.6 1.1 +/- 0.5 2.1 +/- 0.6
37.0 +/- 5.0 -b-
44.0 +/- 3.0 3.0 +/- 1.0 1.6 +/- 0.6
10.0 +/- 1.0 1.4 +/- 0.5 1.8 +/- 0.6 1.7 +/- 0.4 0.9 +/- 0.5
32.0 +/- 2.0 310.0 +/- 10.0
1.5 +/- 0.6
2.4 +/- < 1.0
2.3 +/- 3.0 +/- 1.8 +/- 3.0 +/- 1.5 +/- 1.1 +/- 1.3 +/- 3.0 +/-
< 3.0 -b-
< 2.0 5.0 +/- 0.7 +/- 3.0 +/- 1.5 +/- 1.9 +/- 1.2 +/- 1.1 +/-
2.0 +/- < 4.0
2.0 +/-
1.2
1.1 1.0 0.7 1.0 0.8 0.7 0.7 1.0
1.0 0.7 1.0 0.8 0.8 0.6 0.8
1.0
1.0
-a- -a-
2.0 2 0.3 7.0 +/- 1.0
-a- -a- -a- -a- -a-
:;- -a-
4.5 z- 0.9 160.0 +/- 20.0
1.3 +/- 0.7 0.8 +/- 0.7
-a- -a-
-a-
14.0 z- 1.0

i ‘f i i i I i ! 1 f i I I i I 1 i I I
TABLE 5-5
(continued)
Coordinates Depth Concentration (pCi/q +/- 2 sigma) East North WI Uranium-238 Radium-226 Thorium-232 Thorium-230
550.0 550.0 550.0 550.0 550.0 550.0 550.0
550.0 bP 550.0 W 550.0
550.0 550.0 550.0 550.0 550.0 550.0
550.0 550.0 550.0 550.0 550.0 550.0 550.0
1650.0 3- 4 < 4.0 < 1.0 1650.0 4- 5 c15.0 1.5 +/- 1650.0 5- 6 < 8.0 1.6 +/- 1650.0 6- 7 c10.0 1.6 +/- 1650.0 7- 8 < 5.0 1.2 +/- 1650.0 8- 9 < 5.0 0.8 +/- 1650.0 9-10 < 9.0 1.1 +/-
1750.0 o- 1 1750.0 l- 2 1750.0 2- 3 1750.0 3- 4 1750.0 4- 5 1750.0 5- 6 1750.0 6- 7 1750.0 7- 8 1750.0 8- 9
1850.0 o- 1 12.0 +/- 5.0 5.0 +/- 1.0 4.0 +/- 1.0 1850.0 l- 2 < 7.0 1.4 +/- 0.5 1.5 +/- 0.8 1850.0 2- 3 < 7.0 2.1 +/- 0.7 2.0 +/- 1.0 1850.0 3- 4 c10.0 1.5 +/- 0.5 1.7 +/- 0.9 1850.0 4- 5 < 9.0 1.8 +/- 0.6 1.8 +/- 0.9 1850.0 5- 6 < 6.0 1.6 +/- 0.5 1.6 +/- 0.8 1850.0 6- 7 < 8.0 1.3 +/- 0.5 2.2 +/- 0.8
8;;.; ;;-100.0 . - 7.0 c10.0 < 8.0 < 6.0 < 9.0 < 7.0 < 8.0 < 6.0
0.4 0.6 0.6 0.5 0.5 0.4
700.0 +/-1 00.0 11.0 +/- 2.0
2.1 +/- 0.6 1.4 +/- 0.6 1.7 +/- 0.5 2.0 +/- 0.6 0.8 +/- 0.5 1.1 +/- 0.6 0.8 +/- 0.5
2.0 +/- 2.0 +/- 2.0 +/- 3.0 +/-
< 1.0 1.0 +/- 1.6 +/-
< 4.0 2.0 +/- 3.0 +/- 0.9 +/- 1.9 +/- 2.0 +/-
< 1.0 1.4 +/- 0.9 +/-
1.0 1.0 1.0 1.0
0.7 0.7
1.0 1.0 0.7 0.8 1.0
0.7 0.7
7.1 +/- 0.7 3.5 +/- 0.4
-a- -a- -a- -a- -a-
730.0 z- 10.0 9.0 +/- 1.0 2.1 +/- 0.5 4.9 +/- 1.0
-a- -a- -a- -a-
1.8 ;:- 0.7 1.4 +/- 0.4 1.7 +/- 0.5 3.2 +/- 0.6
-a- -a-

i 4 I i i i i r I 1 I I I I j I I I
TABLE 5-5
(continued)
Page 3 of 15
Coordinates Depth Concentration (pCi/g +/- 2 sigma) East North (W Uranium-238 Radium-226 Thorium-232 Thorium-230
550.0 1850.0 7- 8 550.0 1850.0 8- 9
573.0 1550.0 o- 1 573.0 1550.0 l- 2 573.0 1550.0 2- 3 573.0 1550.0 3- 4 573.0 1550.0 4- 5 573.0 1550.0 5- 6
a. 573.0 1550.0 6- 7 G 573.0 1550.0 7- 8 573.0 1550.0 8- 9 573.0 1550.0 9-10
576.0 1650.0 o- 1 576.0 1650.0 l- 2 576.0 1650.0 2- 3 576.0 1650.0 3- 4 576.0 1650.0 4- 5 576.0 1650.0 5- 6 576.0 1650.0 6- 7 576.0 1650.0 7- 8 576.0 1650.0 8- 9 576.0 1650.0 9-10
588.0 1450.0 o- 1
< 8.0 < 9.0
30.0 +/- 6.0 < 7.0 < 6.0 < 8.0 < 6.0 < 5.0 < 8.0 < 6.0 < 8.0 < 8.0
36.0 +/- 9.0 29.0 +/- 5.0
210.0 +/- 20.0 < 5.0 < 8.0 < 6.0 < 9.0 < 4.0 c10.0 < 6.0
100.0 +/- 20.0
1.5 +/- 0.4 < 1.0 -a- 2.7 +/- 0.7 2.1 +/- 0.9 -a-
27.0 +/- 2.0 1.2 +/- 0.5 1.7 +/- 0.6 2.0 +/- 0.6 1.5 +/- 0.6 1.5 +/- 0.6 1.2 +/- 0.4 1.7 +/- 0.5 1.4 +/- 0.5 2.0 +/- 1.0
39.0 +/- 2.0 27.0 +/- 2.0
110.0 +/- 10.0 1.7 +/- 0.6 2.0 +/- 0.5 1.0 +/- 0.6 1.4 +/- 0.5 1.8 +/- 0.6 1.3 +/- 0.5 0.6 +/- 0.4
60.0 +/- 10.0
2.0 +/- 1.0 1.2 +/- 0.8 1.3 +/- 0.7 3.0 +/- 1.0 1.7 +/- 0.8 2.2 +/- 0.8 1.1 +/- 0.6 1.2 +/- 0.7 2.1 +/- 0.9 2.0 +/- 1.0
2.6 ::- 0.5 1.7 +/- 0.8 3.6 +/- 2.2 2.9 +/- 1.4
-a- -a- -a- -a- -a-
3.0 +/- 1.0 < 1.0
4.0 +/- 2.0 1.7 +/- 0.8 1.9 +/- 0.8
< 1.0 1.0 +/- 0.7 1.1 +/- 0.8 1.8 +/- 0.9 1.0 +/- 0.7
-a- -a-
4.7 :?- 0.6 3.4 +/- 0.7
-a- -a- -a- -a- -a-
4.0 +/- 2.0 -a-

i i i i i i 1 i i i 1 i i I I 1 I i
TABLE 5-5
(continued)
Paqe 4 of 15
Coordinates Depth Concentration (pCi/q +/- 2 sigma) East North W) Uranium-238 Radium-226 Thorium-232 Thorium-230
588.0 588.0 588.0 588.0 588.0 588.0 588.0 588.0 588.0
& WI 600.0
600.0 600.0 600.0 600.0 600.0 600.0 600.0 600.0 600.0
1450.0 l- 2 < 4.0 1450.0 2- 3 c10.0 1450.0 3- 4 c11.0 1450.0 4- 5 < 4.0 1450.0 5- 6 < 6.0 1450.0 6- 7 < 8.0 1450.0 7- 8 < 3.0 1450.0 8- 9 < 8.0 1450.0 9-10 < 5.0
1700.0 o- 1 56.0 +/- 13.0 1700.0 l- 2 6.0 +/- 5.0 1700.0 2- 3 < 6.0 1700.0 3- 4 < 5.0 1700.0 4- 5 < 8.0 1700.0 5- 6 < 6.0 1700.0 6- 7 c10.0 1700.0 7- 8 < 7.0 1700.0 8- 9 < 8.0 1700.0 9-10 < 8.0
600.0 1850.0 o- 1 26.0 +/- 8.0 600.0 1850.0 l- 2 130.0 +/- 40.0 600.0 1850.0 2- 3 < 8.0 600.0 1850.0 3- 4 < 8.0
1.1 +/- 0.6 1.6 +/- 0.5 1.5 +/- 0.6 1.6 +/- 0.5 1.5 +/- 0.5 1.3 +/- 0.5 0.8 +/- 0.5 1.4 +/- 0.5 1.2 +/- 0.5
41.0 +/- 3.0 5.0 +/- 1.0 1.6 +/- 0.6 1.0 +/- 0.5 1.6 +/- 0.6 1.3 +/- 0.5 0.8 +/- 0.6 1.7 +/- 0.5 1.9 +/- 0.6 0.9 +/- 0.5
17.0 +/- 2.0 220.0 +/- 20.0
1.9 +/- 0.6 1.7 +/- 0.5
2.5 +/- 0.9 20.0 +/- 2.0 3.0 +/- 1.0 1.9 +/- 0.5 1.6 +/- 0.7 2.2 +/- 1.1 1.5 +/- 0.7 2.0 +/- 1.0 0.9 +/- 0.7 -a- 1.9 +/- 0.7 -a- 0.7 +/- 0.6 -a- 1.5 +/- 0.6 -a- 0.9 +/- 0.6 -a-
2.0 +/- 1.0 1.1 +/- 0.7 1.2 +/- 0.7 1.0 +/- 0.7 1.9 +/- 0.8 1.8 +/- 0.8 3.0 +/- 1.0 1.3 +/- 0.7 1.6 +/- 0.7 1.6 +/- 0.7
2.0 +/- 1.0 5.0 +/- 3.0 1.4 +/- 0.8 2.1 +/- 0.8
-a-
2.5 ::- 0.5 4.9 +/- 0.7 3.8 +/- 1.2
-a- -a- -a- -a- -a-
-a-
4.6 ?- 0.7 3.2 +/- 0.6

i
TABLE 5-5
(continued)
I I I
Coordinates Depth Concentration (pCi/q +/- 2 sigma) East North WI Uranium-238 Radium-226 Thorium-232 Thorium-230
600.0 1850.0 4- 5 < 8.0 600.0 1850.0 5- 6 < 8.0 600.0 1850.0 6- 7 c10.0 600.0 1850.0 7- 8 < 7.0 600.0 1850.0 8- 9 < 7.0 600.0 1850.0 9-10 < 8.0
600.0 600.0
IP 600.0 0 600.0 600.0 600.0 600.0 600.0 600.0
605.0 1400.0 l- 2 31.0 +/- 13.0 605.0 1400.0 2- 3 20.0 +/- 8.0 605.0 1400.0 3- 4 < 9.0 605.0 1400.0 4- 5 <lO.O 605.0 1400.0 5- 6 < 6.0 605.0 1400.0 6- 7 < 7.0 605.0 1400.0 7- 8 < 5.0 605.0 1400.0 8- 9 < 8.0
1925.0 1925.0 1925.0 1925.0 1925.0 1925.0 1925.0 1925.0 1925.0
o- 1 28.0 +/- 14.0 l- 2 100.0 +/- 20.0 2- 3 47.0 +/- 16.0 3- 4 < 8.0 4- 5 K11.0 5- 6 < 7.0 6- 7 < 6.0 7- 8 < 8.0 8- 9 < 7.0
0.9 +/- 0.5 2.8 +/- 0.7 0.9 +/- 0.6 1.3 +/- 0.5 1.5 +/- 0.5 3.0 +/- 0.8
39.0 +/- 3.0 210.0 +/- 20.0 120.0 +/- 10.0
1.6 +/- 0.7 1.5 +/- 0.6 0.8 +/- 0.5 1.4 +/- 0.5 1.4 +/- 0.5 3.0 +/- 1.0
15.0 +/- 3.0 10.0 +/- 1.0
3.8 +/- 0.8 2.9 +/- 0.7 1.3 +/- 0.6 2.1 +/- 0.6 1.2 +/- 0.5 1.1 +/- 0.5
1.4 +/- 1.4 +/- 0.9 +/-
< 1.0 1.6 +/- 4.0 +/-
c 1.0 < 1.0
2.0 +/- 1.3 +/- 3.0 +/- 1.6 +/- 1.6 +/- 1.6 +/- 2.0 +/-
< 2.0 3.0 +/- 1.9 +/- 2.0 +/- 1.4 +/- 1.5 +/- 3.0 +/- 2.6 +/-
0.7 0.8 0.8
0.6 1.0
2.0 0.9 1.0 0.7 0.7 0.6 1.0
1.0 0.8 1.0 0.8 0.7 1.0 0.8
2.3 +/- 0.6 -a- -a- -a- -a- -a-
-a- -a-
3.7 :?I 0.5 2.7 +/- 0.5
-a- -a- -a- -a-
790.0 z- 20.0
3.5 z- 1.3 -a- -a- -a- -a-

i I i i i I i I i i i i I i I 1 I I I I
TABLE 5-5
(continued)
Page 6 of 15
Coordinates Depth Concentration (pCi/g +/- 2 sigma) East North (W Uranium-238 Radium-226 Thorium-232 Thorium-230
695.0 695.0 695.0 695.0 695.0 695.0 695.0 695.0
I& 695.0 4
700.0 700.0 700.0 700.0 700.0 700.0 700.0 700.0 700.0
1350.0 o- 1 1350.0 l- 2 1350.0 2- 3 1350.0 3- 4 1350.0 4- 5 1350.0 5- 6 1350.0 6- 7 1350.0 7- 8 1350.0 8- 9
1700.0 o- 1 1700.0 l- 2 1700.0 2- 3 1700.0 3- 4 1700.0 4- 5 1700.0 5- 6 1700.0 6- 7 1700.0 7- 8 1700.0 8- 9
700.0 1823.0 o- 1 700.0 1823.0 l- 2 700.0 1823.0 2- 3 700.0 1823.0 3- 4
6.0 +/- 6.0 6.0 +/- 1.0 10.0 +/- 8.0 14.0 +/- 2.0
< 6.0 0.7 +/- 0.6 < 5.0 1.6 +/- 0.5 < 5.0 2.0 +/- 0.6 < 8.0 1.8 +/- 0.5 < 5.0 1.7 +/- 0.5 < 5.0 1.1 +/- 0.5 < 9.0 1.2 +/- 0.5
18.0 +/- 7.0 12.0 +/- 2.0 c10.0 2.0 +/- 0.6 c10.0 4.0 +/- 1.0 < 6.0 1.7 +/- 0.6 c10.0 1.5 +/- 0.6 < 8.0 1.5 +/- 0.6 < 8.0 1.1 +/- 0.5 < 5.0 1.3 +/- 0.6 < 9.0 1.5 +/- 0.5
< 9.0 5.0 +/- 1.0 < 6.0 1.4 +/- 0.5 < 8.0 1.3 +/- 0.5 < 5.0 1.4 +/- 0.5
< 1.0 1.3 +/- 1.0 1.1 +/- 0.9
< 1.0 2.1 +/- 0.8 2.0 +/- 0.7 1.9 +/- 0.8 1.5 +/- 0.8 2.8 +/- 0.9
< 1.0 2.0 +/- 1.0 4.0 +/- 1.0 1.6 +/- 0.9 1.7 +/- 0.8 1.2 +/- 0.7 1.2 +/- 1.0 1.7 +/- 0.7 3.0 +/- 1.0
< 1.0 0.9 +/- 0.8 0.8 +/- 0.7 1.7 +/- 0.7
-a-
3.5 z- 1.0
1.2 ::- 0.6 -a- -a- -a- -a-
120.0 z- 10.0
1.6 ;?- 0.4 5.3 +/- 0.9
-a- -a- -a- -a-
2.9 ;?- 0.6 -a- -a-

i i I 1 I t
TABLE 5-5
(continued)
, I t t
Paqe 7 of 15
Coordinates Depth Concentration (pCi/g +/- 2 sigma) East North W) Uranium-238 Radium-226 Thorium-232 Thorium-230
700.0 700.0 700.0 700.0 700.0 700.0
700.0 700.0
z 700.0 700.0 700.0 700.0 700.0 700.0 700.0
737.5 737.5 737.5 737.5 737.5 737.5 737.5 737.5
1823.0 4- 5 < 9.0 1823.0 5- 6 < 7.0 1823.0 6- 7 < 8.0 1823.0 7- 8 < 6.0 1823.0 8- 9 < 7.0 1823.0 9-10 < 8.0
1900.0 o- 1 c11.0 1900.0 l- 2 < 9.0 1900.0 2- 3 < 7.0 1900.0 3- 4 < 7.0 1900.0 4- 5 < 9.0 1900.0 5- 6 < 8.0 1900.0 6- 7 < 5.0 1900.0 7- 8 < 5.0 1900.0 8- 9 < 7.0
1300.0 o- 1 1300.0 l- 2 1300.0 2- 3 1300.0 3- 4 1300.0 4- 5 1300.0 5- 6 1300.0 6- 7 1300.0 7- 8
9.0 +/- 6.0 5.0 +/- 1.0 < 1.0 7.0 +/- 4.0 2.6 +/- 0.7 1.0 +/- 1.0
c 5.0 1.7 +/- 0.5 1.3 +/- 0.8 < 6.0 1.6 +/- 0.6 1.8 +/- 0.9 < 4.0 1.1 +/- 0.5 1.3 +/- 0.6 < 5.0 1.5 +/- 0.5 2.0 +/- 0.8 < 7.0 1.0 +/- 0.5 1.0 +/- 0.7 < 4.0 1.5 +/- 0.5 1.5 +/- 0.7
1.0 +/- 0.5 1.8 +/- 0.9 1.6 +/- 0.5 1.3 +/- 0.4 2.0 +/- 0.7 1.3 +/- 0.6 1.1 +/- 0.4 1.3 +/- 0.7 -a- 1.0 +/- 0.5 1.3 +/- 0.8 -a- 1.4 +/- 0.5 1.3 +/- 0.6 -a- 0.5 +/- 0.5 3.0 +/- 1.0 -a-
6.0 +/- 1.0 2.0 +/- 0.7 1.6 +/- 0.5 3.0 +/- 1.0 0.6 +/- 0.5 1.1 +/- 0.7 0.8 +/- 0.5 1.3 +/- 0.7 1.3 +/- 0.5 2.0 +/- 1.0 1.0 +/- 0.4 1.7 +/- 0.7 1.5 +/- 0.5 0.9 +/- 0.6 1.0 +/- 0.5 0.8 +/- 0.6 1.7 +/- 0.5 1.8 +/- 0.7
1.9 :9- 1.0 1.2 +/- 0.8 1.8 +/- 0.5 1.2 +/- 0.3
-a- -a- -a- -a-
-a-
1.9 z- 0.7
2.3 ?- 1.2 -a- -a- -a-

j i I :i i i i 3 i 1 \ i i t i I f I 1 i
TABLE 5-5
(continued)
Page 8 of 15
Coordinates Depth Concentration (pCi/g +/- 2 sigma) East North W) Uranium-238 Radium-226 Thorium-232 Thorium-230
737.5 1300.0 8- 9 < 1.0 -a-
750.0 750.0 750.0 750.0 750.0 750.0 750.0
lb 750.0 Lo 750.0
750.0 1100.0 o- 1 750.0 1100.0 3- 4 750.0 1100.0 4- 5 750.0 1100.0 5- 6 750.0 1100.0 6- 7 750.0 1100.0 7- 8 750.0 1100.0 8- 9
797.0 1653.0 o- 1 797.0 1653.0 l- 2 797.0 1653.0 2- 3 797.0 1653.0 3- 4 797.0 1653.0 4- 5
1050.0 o- 1 1050.0 l- 2 1050.0 2- 3 1050.0 3- 4 1050.0 4- 5 1050.0 5- 6 1050.0 6- 7 1050.0 7- 8 1050.0 8- 9
< 4.0
24.0 +/- 6.0 c17.0 c10.0 c12.0 < 8.0 c10.0 < 6.0 < 7.0 c15.0
25.0 +/- 11.0 < 9.0 < 7.0 c10.0 < 6.0 < 8.0 < 7.0
19.0 +/- 9.0 34.0 +/- 12.0
c10.0 < 5.0 c10.0
1.0 +/- 0.5
19.0 +/- 2.0 2.0 +/- 1.0 9.0 +/- 1.0 < 1.0 4.0 +/- 1.0 1.5 +/- 0.9 1.6 +/- 0.6 1.1 +/- 0.7 1.0 +/- 0.5 2.0 +/- 1.0 2.4 +/- 0.6 1.7 +/- 0.8 0.8 +/- 0.4 0.9 +/- 0.6 1.1 +/- 0.5 1.4 +/- 0.7 1.5 +/- 0.7 3.0 +/- 2.0
18.0 +/- 2.0 1.5 +/- 1.1 1.4 +/- 0.5 1.8 +/- 0.9 1.2 +/- 0.5 0.8 +/- 0.7 1.8 +/- 0.5 1.8 +/- 0.9 0.9 +/- 0.5 1.4 +/- 0.7 1.1 +/- 0.4 < 1.0 1.5 +/- 0.5 < 1.0
11.0 +/- 2.0 44.0 +/- 3.0
3.1 +/- 0.8 1.2 +/- 0.5 2.3 +/- 0.6
2.0 +/- 1.0 2.0 +/- 2.0 2.1 +/- 0.9 1.3 +/- 0.9 3.0 +/- 1.0
190.0 z- 10.0
2.4 ?- 0.9 1.5 +/- 0.8
-a- -a- -a- -a-
5.6 ;:- 1.2 2.9 +/- 1.3
-a- -a- -a- -a-
-a- -a-
1.6 $- 0.3 1.8 +/- 0.4

i i i i I I I i i
TABLE 5-5
(continued)
Page 9 of 15
Coordinates Depth Concentration (pCi/g +/- 2 sigma) East North WI Uranium-238 Radium-226 Thorium-232 Thorium-230
797.0 1653.0 5- 6 < 4.0 1.1 +/- 0.5 1.6 +/- 0.7 -a- 797.0 1653.0 6- 7 < 7.0 1.3 +/- 0.4 3.0 +/- 1.0 -a- 797.0 1653.0 7- 8 < 4.0 0.7 +/- 0.4 < 1.0 -a- 797.0 1653.0 8- 9 < 5.0 1.2 +/- 0.6 1.5 +/- 0.9 -a-
800.0 800.0 800.0 800.0 800.0 u1 0 800.0 800.0 800.0 800.0 800.0
1250.0 o- 1 9.0 +/- 6.0 5.0 +/- 1.0 2.0 +/- 1.0 1250.0 l- 2 < 8.0 5.0 +/- 1.0 < 1.0 1250.0 2- 3 < 8.0 1.5 +/- 0.6 1.2 +/- 0.8 1250.0 3- 4 < 5.0 1.2 +/- 0.6 < 1.0 1250.0 4- 5 < 9.0 2.1 +/- 0.6 2.7 +/- 0.9 1250.0 5- 6 < 7.0 0.6 +/- 0.5 1.0 +/- 0.8 1250.0 6- 7 < 9.0 1.1 +/- 0.5 1.9 +/- 0.8 1250.0 7- 8 < 9.0 1.5 +/- 0.5 2.3 +/- 0.9 1250.0 8- 9 < 4.0 1.4 +/- 0.5 1.3 +/- 0.7 1250.0 9-10 < 4.0 1.1 +/- 0.6 1.0 +/- 0.7
-a-
1.6 ;;- 0.3
1.3 z- 0.2 -a- -a- -a- -a- -a-
800.0 1350.0 o- 1 10.0 +/- 5.0 5.0 +/- 1.0 3.0 +/- 1.0 800.0 1350.0 l- 2 < 7.0 4.0 +/- 1.0 1.6 +/- 0.9 800.0 1350.0 2- 3 c13.0 1.5 +/- 0.6 2.0 +/- 1.0 800.0 1350.0 3- 4 < 9.0 1.7 +/- 0.6 1.2 +/- 0.8 800.0 1350.0 4- 5 < 6.0 1.2 +/- 0.6 1.5 +/- 0.8 800.0 1350.0 5- 6 c10.0 1.5 +/- 0.6 1.9 +/- 0.8 800.0 1350.0 6- 7 < 6.0 1.1 +/- 0.6 1.5 +/- 0.7 800.0 1350.0 7- 8 < 4.0 1.3 +/- 0.5 1.3 +/- 0.7 800.0 1350.0 8- 9 c14.0 2.3 +/- 0.8 4.0 +/- 1.0
-a- -a-
1.3 G- 0.4 1.1 +/- 0.2
-a- -a- -a- -a-

‘r i I I i i i i i i i i i I f i i I I
TABLE 5-5
(continued)
Coordinates Depth Concentration (pCi/g +/- 2 sigma) East North (ft) Uranium-238 Radium-226 Thorium-232 Thorium-230
800.0 800.0 800.0 800.0 800.0 800.0 800.0 800.0 800.0
Ln P
804.0 804.0 804.0 804.0 804.0 804.0 804.0 804.0 804.0 804.0
1750.0 o- 1 < 5.0 1750.0 l- 2 c10.0 1750.0 2- 3 < 5.0 1750.0 3- 4 c10.0 1750.0 4- 5 < 4.0 1750.0 5- 6 < 9.0 1750.0 6- 7 < 4.0 1750.0 7- 8 < 4.0 1750.0 8- 9 < 8.0
1839.0 o- 1 c19.0 1839.0 l- 2 22.0 +/- 11.0 1839.0 2- 3 15.0 +/- 7.0 1839.0 3- 4 < 9.0 1839.0 4- 5 < 8.0 1839.0 5- 6 < 6.0 1839.0 6- 7 < 9.0 1839.0 7- 8 ~18.0 1839.0 8- 9 < 8.0 1839.0 9-10 c13.0
2.9 +/- 0.7 3.3 +/- 0.9 1.2 +/- 0.5 2.4 +/- 0.8 0.9 +/- 0.4 1.2 +/- 0.5 1.2 +/- 0.5 1.0 +/- 0.4 1.0 +/- 0.5
7.0 +/- 1.0 23.0 +/- 2.0
7.0 +/- 1.0 1.5 +/- 0.5 1.9 +/- 0.6 1.5 +/- 0.5 1.8 +/- 0.6 1.2 +/- 0.5 1.5 +/- 0.4 3.0 +/- 1.0
805.0 1450.0 o- 1 8.0 +/- 6.0 6.0 +/- 1.0 805.0 1450.0 l- 2 10.0 +/- 8.0 4.0 +/- 1.0 805.0 1450.0 2- 3 c10.0 1.7 +/- 0.5
1.2 +/- 0.7 -a- 2.2 +/- 0.9 -a- 0.9 +/- 0.7 3.0 +/- 1.0 62.0 ?- 2.0 0.9 +/- 0.7 2.3 +/- 0.3 2.3 +/- 0.9 -a- 0.9 +/- 0.9 -a- 1.0 +/- 0.7 -a- 1.8 +/- 0.8 -a-
1.7 +/- 0.8 -a-
2.0 +/- 1.0 1.4 +/- 0.9 200.0 z- 10.0 1.8 +/- 0.8 10.0 +/- 1.0 1.1 +/- 0.8 3.7 +/- 0.7 1.4 +/- 0.7 -a- 2.0 +/- 0.8 -a- 1.1 +/- 0.7 -a- 1.4 +/- 0.7 -a- 2.0 +/- 1.0 -a-
1.4 +/- 1.0 -a- 2.0 +/- 1.0 -a- 2.2 +/- 0.8 -a-

i i i i i I i i 1 i I I 1 I i f I 1 1
TABLE 5-5
(continued)
Coordinates Depth Concentration (pCi/g +/- 2 sigma) East North (ft) Uranium-238 Radium-226 Thorium-232 Thorium-230
805.0 1450.0 3- 4 < 5.0 1.3 +/- 0.7 1.1 +/- 0.7 1.5 +/- 0.2 805.0 1450.0 4- 5 <ll.O 1.4 +/- 0.6 2.2 +/- 0.9 1.3 +/- 0.5 805.0 1450.0 5- 6 < 7.0 0.8 +/- 0.5 1.3 +/- 0.8 -a- 805.0 1450.0 6- 7 < 4.0 1.4 +/- 0.5 1.7 +/- 0.7 -a- 805.0 1450.0 7- 8 < 6.0 1.5 +/- 0.4 0.9 +/- 0.6 -a- 805.0 1450.0 8- 9 c15.0 3.0 +/- 2.0 5.0 +/- 2.0 -a-
806.0 806.0 806.0
yl N 806.0 806.0 806.0 806.0 806.0 806.0 806.0
1150.0 1150.0 1150.0 1150.0 1150.0 1150.0 1150.0 1150.0 1150.0 1150.0
o- 1 l- 2 2- 3 3- 4 4- 5 5- 6 6- 7 7- 8
FL;
9.0 +/- 7.0 9.0 +/- 2.0 2.0 +/- x13.0 2.0 +/- 0.7 1.8 +/- < 7.0 1.5 +/- 0.5 c 1.0 < 4.0 1.7 +/- 0.6 1.7 +/- < 9.0 1.7 +/- 0.5 1.5 +/- < 6.0 1.4 +/- 0.5 1.5 +/- < 9.0 1.7 +/- 0.6 1.7 +/- < 4.0 1.2 +/- 0.4 1.6 +/- < 9.0 1.4 +/- 0.5 1.7 +/- < 7.0 1.3 +/- 0.6 1.5 +/-
1.0 0.9
0.7 0.7 0.7 0.7 0.6 0.8 0.7
-a-
3.1 ;:I 0.6
1.1 z- 0.2 -a- -a- -a- -a- -a-
807.0 1550.0 o- 1 < 7.0 4.0 +/- 1.0 2.0 +/- 807.0 1550.0 l- 2 4.0 +/- 3.0 3.6 +/- 0.8 < 1.0 807.0 1550.0 2- 3 12.0 +/- 4.0 3.0 +/- 1.0 < 1.0 807.0 1550.0 3- 4 < 7.0 0.9 +/- 0.6 < 1.0 807.0 1550.0 4- 5 < 8.0 0.9 +/- 0.4 2.2 +/- 807.0 1550.0 5- 6 < 6.0 1.8 +/- 0.5 1.0 +/- 807.0 1550.0 6- 7 < 8.0 1.5 +/- 0.5 2.7 +/-
1.0
0.8 0.7 0.9
-a- -a-
1.2 z- 0.2 1.3 +/- 0.2
-a- -a-

i i i i i I i i i i i i t I i I I i 1
TABLE 5-5
(continued)
Page 12 of 15
Coordinates Depth Concentration (pCi/g +/- 2 sigma) East North W) Uranium-238 Radium-226 Thorium-232 Thorium-230
807.0 1550.0 7- 8 < 4.0 807.0 1550.0 8- 9 < 5.0
1.0 +/- < 1.0
0.6 -a- -a-
852.0 852.0 852.0 852.0 852.0 852.0 852.0
VI 852.0 W 852.0
852.0
1062.5 o- 1 c11.0 1062.5 l- 2 < 4.0 1062.5 2- 3 < 9.0 1062.5 3- 4 < 7.0 1062.5 4- 5 c 9.0 1062.5 5- 6 < 6.0 1062.5 6- 7 < 8.0 1062.5 7- 8 < 8.0 1062.5 8- 9 < 4.0 1062.5 9-10 < 7.0
859.0 1500.0 o- 1 5.0 +/- 4.0 859.0 1500.0 l- 2 < 6.0 859.0 1500.0 2- 3 < 4.0 859.0 1500.0 3- 4 c11.0 859.0 1500.0 4- 5 < 5.0 859.0 1500.0 5- 6 < 9.0 859.0 1500.0 6- 7 < 5.0 859.0 1500.0 7- 8 < 4.0 859.0 1500.0 8- 9 c11.0 859.0 1500.0 9-10 -b-
1.1 +/- 0.4 1.2 +/- 0.5
2.8 +/- 0.8 1.2 +/- 0.6 1.8 +/- 0.5 1.3 +/- 0.5 1.4 +/- 0.5 1.4 +/- 0.7 1.1 +/- 0.6 1.1 +/- 0.4 1.0 +/- 0.5 1.0 +/- 0.5
4.4 +/- 0.9 0.9 +/- 0.6 1.5 +/- 0.5 1.7 +/- 0.6 1.7 +/- 0.6 1.5 +/- 0.5 1.5 +/- 0.5 1.0 +/- 0.6 1.6 +/- 0.6
-b-
2.0 +/- 1.1 +/- 1.9 +/- 1.3 +/- 2.1 +/- 1.4 +/- 1.5 +/- 1.2 +/-
< 1.0 < 1.0
1.0 0.8 0.7 0.8 0.7 1.0 1.0 0.6
-a-
1.1 :f- 0.4
1.6 ;:- 1.2 -a- -a- -a- -a- -a-
1.2 +/- 2.0 +/- 2.1 +/- 2.0 +/- 0.9 +/- 1.2 +/-
< 1.0 < 1.0
3.0 +/- -b-
0.9 0.9 0.8 1.0 0.8 0.7
1.0
-a- -a-
1.6 ::- 0.3 15.0 +/- 1.0
-a- -a- -a-
:;-
860.0 1400.0 o- 1 60.0 +/- 20.0 46.0 +/- 3.0 4.0 +/- 1.0 -a-

i 1 i i f I i I i i : I i 1 t
TABLE 5-5
(continued)
1 f
Coordinates Depth Concentration (pCi/g +/- 2 sigma) East North W) Uranium-238 Radium-226 Thorium-232 Thorium-230
860.0 1400.0 l- 2 < 5.0 860.0 1400.0 2- 3 < 6.0 860.0 1400.0 3- 4 < 6.0 860.0 1400.0 4- 5 < 6.0 860.0 1400.0 5- 6 < 5.0 860.0 1400.0 6- 7 < 5.0 860.0 1400.0 7- 8 < 5.0 860.0 1400.0 8- 9 < 5.0 860.0 1400.0 9-10 < 5.0
1.2 +/- 0.5 1.7 +/- 0.8 0.9 +/- 0.6 1.4 +/- 0.8 1.5 +/- 0.6 1.9 +/- 0.9 1.7 +/- 0.6 1.4 +/- 0.9 0.9 +/- 0.6 1.2 +/- 0.8 1.1 +/- 0.5 1.2 +/- 0.7 1.3 +/- 0.5 1.0 +/- 0.8 1.0 +/- 0.5 1.2 +/- 0.7 1.2 +/- 0.5 1.5 +/- 0.7
ul 861.0 1600.0 o- 1 lb 861.0 1600.0 l- 2 861.0 1600.0 2- 3 861.0 1600.0 3- 4 861.0 1600.0 4- 5 861.0 1600.0 5- 6 861.0 1600.0 6- 7 861.0 1600.0 7- 8 861.0 1600.0 8- 9 861.0 1600.0 9-10
21.0 +/- 430.0 +/-
< 5.0 < 9.0 < 4.0 < 8.0 < 4.0 < 4.0
-b- -b-
6.0 9.0 +/- 50.0 250.0 +/-
1.6 +/- 1.6 +/- 1.2 +/- 1.7 +/- 1.1 +/- 1.4 +/-
-b- -b-
1.0 10.0
0.6 0.5 0.5 0.5 0.5 0.5
3.0 +/- 1.0 4.0 +/- 3.0 1.6 +/- 0.8 3.0 +/- 1.0 1.2 +/- 0.8 0.8 +/- 0.7 1.3 +/- 0.6 1.3 +/- 0.6
-b- -b-
862.0 1700.0 o- 1 7.0 +/- 6.0 8.0 +/- 1.0 1.0 +/- 0.9 862.0 1700.0 l- 2 c11.0 1.1 +/- 0.6 2.0 +/- 1.0 862.0 1700.0 2- 3 < 4.0 1.1 +/- 0.5 0.8 +/- 0.7 862.0 1700.0 3- 4 < 8.0 1.5 +/- 0.5 1.3 +/- 0.7
1.3 $- 0.8
2.3 ;:- 0.9 -a- -a- -a- -a- -a-
-a- -a-
1.8 $- 0.3 1.5 +/- 0.3
-a- -a- -a- -b- -b-
-a- -a-
3.5 z- 1.7
I i I I i i i i 1
TABLE 5-5
(continued)
Page 14 of 15
Coordinates Depth Concentration (pCi/g +/- 2 sigma) East North W) Uranium-238 Radium-226 Thorium-232 Thorium-230
862.0 1700.0 4- 5 < 5.0 1.5 +/- 0.6 1.4 +/- 862.0 1700.0 5- 6 < 9.0 1.5 +/- 0.5 1.7 +/- 862.0 1700.0 6- 7 < 4.0 1.4 +/- 0.5 1.7 +/- 862.0 1700.0 7- 8 < 8.0 1.0 +/- 0.4 0.8 +/- 862.0 1700.0 8- 9 < 4.0 1.3 +/- 0.5 1.3 +/- 862.0 1700.0 9-10 -b- -b- -b-
0.7 0.7 0.8 0.7 0.6
862.0 862.0 862.0
ul 862.0 cn 862.0 862.0 862.0 862.0 862.0 862.0
1800.0 o- 1 < 6.0 4.0 +/- 1.0 1.1 +/- 1800.0 l- 2 10.0 +/- 6.0 9.0 +/- 1.0 < 1.0 1800.0 2- 3 12.0 +/- 7.0 1.7 +/- 0.7 1.3 +/- 1800.0 3- 4 c 5.0 1.9 +/- 0.6 3.0 +/- 1800.0 4- 5 <ll.O 1.4 +/- 0.8 3.0 +/- 1800.0 5- 6 < 5.0 1.2 +/- 0.5 1.4 +/- 1800.0 6- 7 < 8.0 1.6 +/- 0.5 1.9 +/- 1800.0 7- 8 < 4.0 1.9 +/- 0.5 1.3 +/- 1800.0 8- 9 < 8.0 1.3 +/- 0.5 3.0 +/- 1800.0 9-10 c 5.0 1.5 +/- 0.5 0.9 +/-
0.7
0.9 1.0 1.0 0.7 0.7 0.7 1.0 0.6
870.0 1106.0 o- 1 c11.0 2.2 +/- 0.7 2.0 +/- 1.0 870.0 1106.0 l- 2 < 6.0 1.2 +/- 0.6 1.2 +/- 0.9 870.0 1106.0 2- 3 < 6.0 1.4 +/- 0.5 2.0 +/- 0.8 870.0 1106.0 3- 4 < 8.0 1.2 +/- 0.6 1.4 +/- 0.9 870.0 1106.0 4- 5 < 5.0 0.8 +/- 0.5 1.5 +/- 0.8 870.0 1106.0 7- 8 ~24.0 2.0 +/- 1.0 2.0 +/- 1.0 870.0 1106.0 8- 9 c 6.0 1.2 +/- 0.5 0.8 +/- 0.8
1.0 +/- 0.3 -a- -a- -a-
:;-
-a- -a-
1.2 z- 0.5 2.2 +/- 0.5
-a- -a- -a- -a- -a-
-a-
2.5 ;;- 0.4
1.7 3- 0.2 -a- -a-

TABLE 5-5
(continued)
i j 1 i I
Page 15 of 15
Coordinates Depth Concentration (pCi/g +/- 2 sigma) East North WI Uranium-238 Radium-226 Thorium-232 Thorium-230
870.0 1106.0 9-10 < 4.0 0.9 +/- 0.5 1.6 +/- 0.8 -a-
870.0 870.0 870.0 870.0 870.0 870.0 870.0 870.0
K 870.0 870.0
872.0 1300.0 o- 1 < 8.0 1.1 +/- 0.6 1.8 +/- 872.0 1300.0 l- 2 < 8.0 0.7 +/- 0.5 < 1.0 872.0 1300.0 2- 3 < 8.0 1.6 +/- 0.5 2.0 +/- 872.0 1300.0 3- 4 < 7.0 0.9 +/- 0.4 1.1 +/- 872.0 1300.0 4- 5 < 9.0 1.5 +/- 0.5 2.8 +/- 872.0 1300.0 7- 8 < 6.0 1.3 +/- 0.7 < 1.0 872.0 1300.0 8- 9 K10.0 1.2 +/- 0.5 2.5 +/- 872.0 1300.0 9-10 < 8.0 2.3 +/- 0.8 < 1.0
1200.0 o- 1 < 7.0 4.0 +/- 1.0 1.3 +/- 1.0 1200.0 l- 2 13.0 +/- 5.0 6.0 +/- 1.0 2.0 +/- 1.0 1200.0 2- 3 < 6.0 1.1 +/- 0.6 1.1 +/- 0.9 1200.0 3- 4 < 5.0 1.4 +/- 0.5 1.9 +/- 0.7 1200.0 4- 5 K12.0 1.7 +/- 0.6 1.9 +/- 0.8 1200.0 5- 6 < 7.0 1.7 +/- 0.6 1.2 +/- 0.9 1200.0 6- 7 <12.0 1.3 +/- 0.5 3.0 +/- 1.0 1200.0 7- 8 c 4.0 1.3 +/- 0.5 1.1 +/- 0.8 1200.0 8- 9 < 6.0 1.0 +/- 0.5 2.2 +/- 0.8 1200.0 9-10 x12.0 1.6 +/- 0.7 2.0 +/- 1.0
1.0
0.7 0.8 0.9
0.9
-a-
2.5 ;';- 0.4
1.5 z- 0.5 -a- -a- -a- -a- -a-
-a-
4.1 z- 0.5
1.5 z- 0.4 -a- -a- -a-
-a- Analysis not requested -b- No sample collected due to poor sample recovery

REFERENCES
1.
2. Oak Ridge Associated Universities. Radiological Evaluation
of Decontamination Debris Located at the Futura Chemical Company Facility, 9200 Latty Avenue, Hazelwood, Missouri, Oak Ridge, TN, September 1981.
3. Bechtel National, Inc. Radiological Protection Proqram Manual, Vol. I, Oak Ridge, TN, 1982.
5.
4. Letter, John E. Baublitz, Jr. to E. L. Keller. "Guidelines
for Residual Radioactivity at FUSRAP and Remote SFMP Sites" (Attachment: U.S. Department of Energy Guidelines for Residual Radioactivity at Formerly Utilized Sites Remedial Action Program and Remote Surplus Facilities Management Program Sites, Rev. 1, July 19851, July 22, 1985.
Oak Ridge National Laboratory. Radioloqical Survey of the Property at 9200 Latty Avenue, Hazelwood, Missouri, Oak Ridge, TN, September 1977.
Oak Ridge National Laboratory. Results of State Backqround Radiation Levels: Measurements Taken During 1975-1979, ORNL/TM-7343, Oak Ridge, TN, November 1981.
57
-- _-- ,... . . .._ -.