Embed Size (px)
Citation preview

34
CHAPTER 2
INVESTIGATION OF ANTIBIOTIC AND
ANTICANCER DRUG RELEASE FROM NANO
HYDROXYAPATITE AND AGAROSE COMPOSITES
2.1 INTRODUCTION
Nowadays, most of the people are affected by bone diseases such as
cancer, fracture and osteomyelitis (infection). Osteomyelitis is an
inflammation of the bone or bone marrow, usually caused by various
microorganisms such as bacteria and fungi. These microorganisms infect the
injuries and spread to the bones and adjacent areas through the blood stream
(Pineda et al 2006). There are several types of treatment for osteomyelitis and
cancer. They are chemotherapy, free tissue transfers, bone grafts, antibiotic
loaded biocompatible materials (beads, paste and solid) etc. This kind of
infections is a major problem in medical field due to poor accessibility of the
infected site by systemically administered antibiotics (Hendriks et al 2004).
For this reason, we require efficient and controlled manner of local drug
delivery system. From the last decade onwards, a lot of research is going on
to develop the novel drug storage and release systems. Nano biomaterials are
drug carriers that have greater efficiency, safety, biocompatibility and
effective relief from pain. They have a better therapeutic response due to
controlled and prolonged release (Di Silvio and Bonfield 1999). In recent
days, a large number of systems have been employed as local drug delivery
systems, such as biodegradable polymers (Di Silvio and Bonfield 1999),

35
xerogels (Yang et al 2002), hydrogels (Lin and Metters 2006) mesoporous
silica (Manzano and Vallet-Regi 2010), calcium phosphate cement
(hydroxyapatite) (Vallet-Regi et al 2006) and polymer composites
(Schnieders et al 2006).
Semisynthetic, orally absorbed broad spectrum antibiotic drug,
amoxicillin (AMX) has been extensively used against bacterial infections.
Slow and continuous release of drug during bone implantation is essential to
prevent infectious diseases. The possession of such property by HAp, other
calcium phosphates, porous HAp blocks and HAp coating on metals was
reported in literature (Joosten et al 2005, Kim et al 2005). 5-Fluorouracil
(5-Fcil) is an antineoplastic drug which is used in the treatment of cancer. It
is an acidic, water soluble and hydrophilic drug, used in the chemotherapy for
the treatment of solid tumours (Santos et al 2009).
Hydroxyapatite [(Ca10 (PO4)6(OH)2), HAp] is one of the major
inorganic compound of bone and teeth. Nanosized HAp has considerable
potential as remodeling implants, prosthetic bone replacement and for protein
and drug delivery systems (Nair et al 2008). Surface modified nanosized
HAp with different morphology (sphere, rod, needle and plate) can exist in
mesoporous form. They are used as efficient drug carriers for the local drug
delivery of a variety of pharmaceutical molecules because of their
biocompatibility, osteoconductivity, nontoxicity and non-inflammatory
properties (Vallet-Regi et al 2006). But, HAp is very brittle and could not be
used for load bearing bone replacements. The powder and block forms of
HAp ceramics are used as defect and crack fillers in bones. Powder ceramics
are best for filling small and irregular defects. However, there will be
migration of HAp particles from the implants. It is difficult to handle and
keep the implant compactly in the defect site (Holmes and Hagler 1987).
36
Thus, it is necessary to mix a suitable binder with the HAp granular material
to overcome these problems.
Agarose is a natural, thermally responsive polysaccharide that is
widely used in biological sciences (e.g., microbial cultivation and gel
electrophoresis) (De Lange et al 2011). It acts as gelling agent leading to
strong gels and allows fast room temperature polymerization. It is a linear
polymer that behaves like a hydrogel (Cabanas et al 2006). The hydrogel is a
biomaterial having physical properties similiar to that of living tissues. This
resemblance was due to its high water content, soft rubbery consistency and
low interfacial tension with lower decomposition temperature (Roman et al
2008). It is widely used as scaffold for hard tissue implants and drug delivery
systems.
HAp composites have attracted much attention because of its better
biocompatibility, mechanical properties and bone bonding ability. The
presence of HAp in the composite material improves the growth of osteoblast
cells, resulting to better osteoconductivity (Liu et al 1998). Recently,
composites of ceramics with natural degradable polymers could be used as
bone fillers (Verheyen et al 1993). Composites based on degradable
biopolymers such as collagen (Hsu et al 1999), fibrin glue, gelatin, chitosan,
alginate and hydroxy-propyl-methyl cellulose with inorganic powders were
used as bones (Sivakumar and Rao 2003). Tabata et al (2003) reported that
HAp/agarose composites showed better healing nature than pure HAp.
HAp/agarose scaffolds have been investigated in combination with stem cells
for generating a variety of replacements of cartilage, heart and nerves. Studies
have demonstrated the suitability of agarose scaffolds for promoting stem
cells to differentiate into chondrocytes (Xu et al 2005). In this chapter, the
synthesis of nanosized HAp/agarose composite powder by sol-gel method is
discussed. In this method, the pH of the sol-gel was maintained constant using
37
pH stat that was followed by microwave treatment. The effect of calcination
process and their biological and drug release behavior were investigated.
2.2 EXPERIMENTAL METHODS
2.2.1 Material Preparation
The powder form of nanosized HAp/agarose composite was
prepared by ethanol based sol-gel technique followed by microwave
treatment. Calcium nitrate tetrahydrate (Ca(NO3)2.4H2O, Merck), diamonium
hydrogen phosphate ((NH4)2HPO4, Merck), agarose (SRL), ethanol (Merck)
and ammonia solution (Merck) were used for the synthesis without further
purification. 0.3 M diammonium hydrogen phosphate was dissolved in
250 mL of ethanol and heated to about 85 ± 5 °C and subjected to vigorous
stirring. Then, 1 wt % of agarose was added to phosphate solution. 0.5 M
calcium nitrate tetrahydrate was dissolved in 250 mL of ethanol which was
added to phosphate/agarose solution at constant flow rate (2 mL/min) under
continuous stirring. After mixing, the resulting sol was subjected to vigorous
stirring for 3 h. The pH of the solution was maintained at 10.5 using ammonia
by pH stat (Radiometer analytical) (Figure 2.1) at constant temperature (85 ±
5 °C) during the entire reaction process. After one day aging, the resulting
sol-gel was washed with deionized water. The sol-gel was centrifuged at 3000
rpm using micro centrifuge (Eltek, Model: Labspin Tc 4815S) equipment and
dried at 70 °C using digital vacuum oven (Insref, Model-IRI-021). Before
aging a portion of the prepared sol-gel was subjected to microwave treatment
at 900 W for 30 min using domestic microwave oven (Whirlpool,
model:magicook, 900W). The final product was washed with deionized water
for the removal of organic solvent and excess/unreacted nitrate substance and
dried at 70 °C using hot air oven. The obtained powders were subjected to
calcination at 700 °C for 2 h. After calcination, the colour change was
observed on the powders from brown to white, due to the removal of agarose.

38
Experimental flow chart for the preparation of HAp/agarose composite is
shown in Figure 2.2. Hereafter, the samples as-synthesized, as-synthesized
calcined at 700 °C, microwave treated and microwave treated calcined at 700
°C are referred as SAS, SAS700, SMWT and SMWT700, respectively.
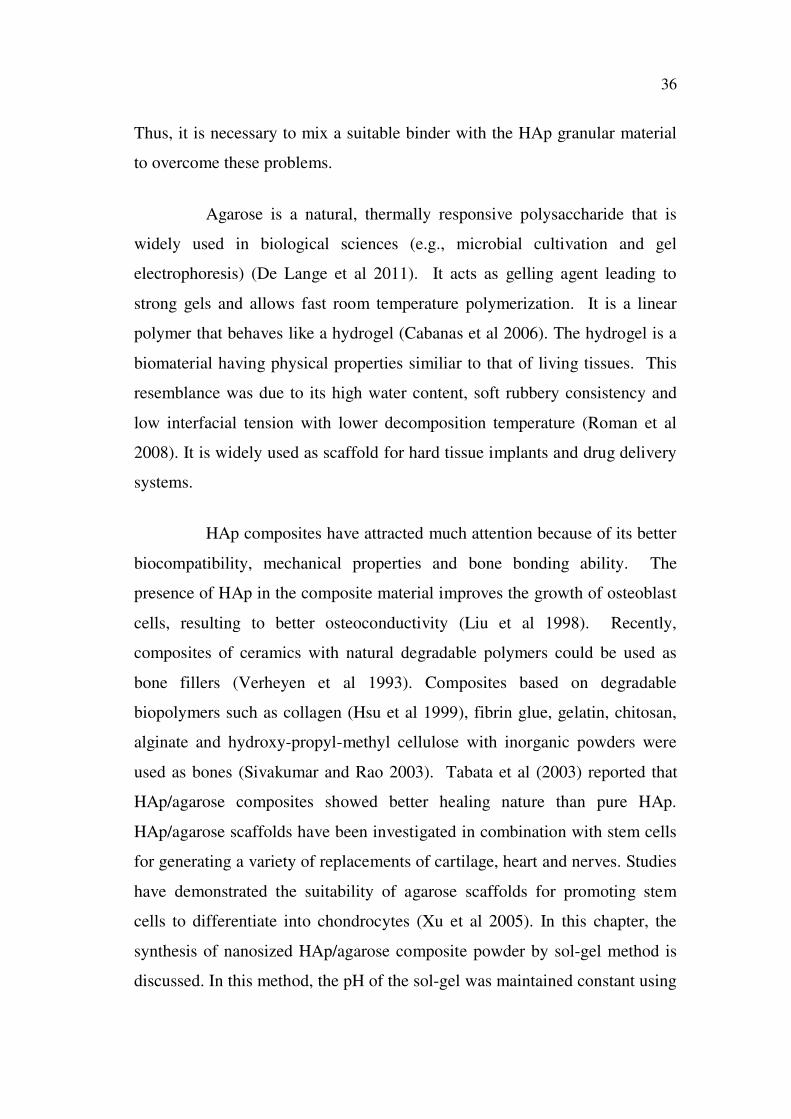
Figure 2.1 pH stat used for the preparation of nano HAp/agarose
composite
Figure 2.2 Experimental flow chart for the preparation of nano
HAp/agarose composite
Sol-gelpH=10.5 maintained by pH stat
0.5 M Ca(NO3)2.4H2O+ Ethanol
0.3 M (NH4)2HPO4 + EthanolStirring and heating at 85 °C
As-synthesized Microwave treated
Calcined 700 °C (2 h)
1 wt % Agarose

39
2.2.2 Characterization
Powder X-ray diffraction was measured using Siemens D500
diffractometer. The SAS, SAS700, SMWT and SMWT700 samples were
analyzed using CuK radiation source ( = 1.5406 ) with 40 kV and 20 mA.
The pattern was recorded in the range of 5 to 70 with increment steps of
0.02 /s. Fourier transform infrared (FTIR) spectra were recorded in the range
of 400 to 4000 cm-1 with Perkin-Elmer spectrum RXI FTIR system using KBr
pellet technique. Surface morphology and the elements present in the
samples, were studied by scanning electron microscope coupled with energy-
dispersive X-ray spectroscope (SEM-EDX) ESEM Quanta 400 FEG, FEI;
gold–palladium [80:20] - sputtered samples; EDX detector: S-UTW-Si (Li)
(Mondejar et al 2007). The specific surface area was determined by the
Brunauer-Emmett-Teller (BET) method using micromeritics (model-ASAP
2020 V3.00 H) surface area analyzer. The pore size and volume were
obtained from the BJH absorption/desorption isotherm.
2.2.3 In vitro Dissolution Study
Phosphate buffer saline (PBS) was prepared by dissolving the
chemicals in deionized water by the following order NaCl, KCl, KH2PO4,
NH2HPO4 and its pH was adjusted to 7.4 using HCl. The SAS, SAS700,
SMWT and SMWT700 samples were made into pellet of 8 mm diameter and
1 mm thickness. These pellets were immersed into 20 mL of PBS in plastic
containers incubated at 37 °C for different time intervals (one to four weeks).
Finally, the weight difference between before and after soaking into PBS were
measured using weighing (Sartorius) balance with an accuracy of ± 0.01 mg
at the end of the experiment (fourth week (W)). The pH of the dissolution
medium was measured after removing the samples (1W, 2W, 3W and 4W)
from the PBS solution.
40
2.2.4 In vitro Bioactivity Study
In vitro bioactivity of SAS, SAS700, SMWT and SMWT700
samples were investigated to form bone like apatite on the surface using
simulated body fluid (SBF). It was prepared using reagent grade chemicals
dissolved in the order of NaCl, NaHCO3, KCl, Na2HPO4.2H2O, MgCl2.6H2O,
CaCl2.2H2O, Na2SO4, TRIS buffer and 1M HCl in deionized water. Finally,
HCl was used to adjust pH 7.4 at 37 °C (Kokubo and Takadama 2006). All
the samples were made into a pellet (8 mm diameter and 1 mm thickness)
with constant weight (100 mg) and it was soaked into 20 mL of SBF in plastic
container at 37 °C for a period of one to four weeks. The solution was
renewed once in two days and it’s pH was measured using pH meter. After
incubation, the samples were gently washed with deionized water and dried at
37 °C for analysis. The samples were weighed using weighing (Sartorius)
balance with an accuracy of 0.01 mg before and after soaking in SBF. Apatite
deposition on the surface of the pellet was investigated by SEM.
2.2.5 Haemolysis Test
Fresh human blood was collected in a sterile centrifuge tube which
contains heparin to avoid the clot formation. 100 mg of SAS, SAS700,
SMWT and SMWT700 of pellets were equilibrated by 1 mL of sterile saline
and incubated at 37 ºC for 12 h. After incubation the saline was removed.
Then, 250 µL of human blood was added on the pellets and incubated for 20
min. Finally, 5 mL of saline was added on each sample to stop the haemolysis
and it was incubated for 1 h. The positive and negative controls were
produced by adding 250 µL of human blood in distilled water and saline
incubated at 37 ºC for 1 h. All the samples were centrifuged at 1000 rpm for
5 min. The absorbance (optical density) of the supernatant solution was
recorded at 545 nm using UV-Vis spectrophotometer (Shimadzu, UV-1601). The

41
percentage of haemolysis was calculated as per the formula and their values
were plotted in the graph.
[OD (test) OD (negative control)]Haemolysis (%) = × 100 [OD (positive control) OD (negative control)]
The accepted norm of haemolysis percentage is (i) Highly
haemocompatible (<5 % haemolysis), (ii) Haemocompatible (within 10 %
haemolysis) and (iii) Non-haemocompatible (>20 % haemolysis) (Pal and Pal
2006).
2.2.6 Drug Loading/Release
In vitro drug release experiment was carried out on antibiotic
(Amoxicillin, AMX) and anticancer (5-Fluorouracil, 5-Fcil) loaded HAp
pellets. AMX maximum absorption wavelength ( max) was 230 nm obtained
with the help of UV-Vis spectrophotometer (Shimadzu UV-1601). The
standard graph was obtained by plotting concentration versus absorbance.
A best linear fit with regression of 0.9998 was taken for the drug release
calculation. For, 5-Fcil maximum absorption wavelength ( max) was 265 nm
and the standard graph regression value was 0.9994.
The SAS, SAS700, SMWT and SMWT700 samples were mixed
with AMX and 5-Fcil in the ratio 1:0.5 using mortar and it was made into
8 mm pellet using hydraulic press with constant pressure (2 tons). The drug
loaded pellets were immersed in 200 ml of PBS with pH 7.4 in a conical flask
with shaking speed of 100 rpm at 37 °C using incubator-cum-orbital shaker
(Niolab). From the dissolution medium, 1 mL of AMX and 5-Fcil solutions
were removed at various time intervals and it was replaced by equal volume
of PBS. The quantity of drug release was determined using
UV-Vis spectrophotometer ( max = 230 nm for AMX and 265 nm for 5-Fcil).

42
All samples were performed in triplicate and its mean value of the data was
used to plot the graph.
2.2.7 Antimicrobial Activity Test
The bactericidal effect of SAS, SAS700, SMWT and SMWT700
with AMX drug loaded pellets were investigated using Gram negative
bacteria Escherichia coli (E.coli, MTCC 2939) and Gram-positive bacteria
Staphylococcus aureus (S. aureus, MTCC 3381), Staphylococcus epidermidis
(S. epidermidis, MTCC 3382). A qualitative diffusion disk test was carried
out using 105 colony forming units (CFU/mL) of the E.coli, S. aureus and
S. epidermidis. The culture was added to the plate and it was spread
uniformly on Muller-Hinton agar plates. After spreading, same size (8 mm
diameter) of without and with AMX loaded SAS, SAS700, SMWT and
SMWT700 were placed on the culture plate. The plates were incubated at
37 °C for 24 h. The inhibition zone was noticed and it was measured every
3 h and the image was documented.
2.2.8 Cell Viability Test
Human osteoblast-like cell line was derived from human
osteosarcoma (MG-63 cells obtained from NCCS-Pune). MG-63 cells were
cultured in 25 cm2 cell culture flask at 37 °C in Dulbecco’s Modified Eagles
Medium (DMEM) (Invitrogen, USA) supplemented with 10 % fetal bovine
serum (DMEM) (Invitrogen, USA) and 1 % penicillin and streptomycin in a
5 % CO2 incubator. When the cells had grown to confluence, they were
detached by trypsin/EDTA (0.05 % w/v trypsin/0.02 % EDTA) (Sigma) and
used for cell culture study on HAp samples. The SAS, SAS700, SMWT and
SMWT700 samples (pellet form with 8 mm diameter and 1 mm thickness)
were kept into a 48-well plate (Axygen, California). All the samples were
sterilized before starting the biocompatibility study. The grown MG-63 cells

43
were seeded (density of 5000 cells/cm2) on all samples with five trials for
each and compared with induced toxic agent (TritonX). It was incubated for
one day to allow cell adherence at 37 °C in 5 % CO2 atmosphere. Then,
50 µL of MTT reagent (5 µg/mL) was added to each well and incubated for
4 h at the same condition. Finally, 500 µL of dimethylsulfoxide (DMSO)
(Sigma-Aldrich) was added for dissolving the formasan crystals and
absorbance was measured at 570 nm in an ELISA (Thermo scientific) reader.
The cell culture medium was used as a negative control and a TritonX toxic
agent as a positive control.
2.3 RESULTS AND DISCUSSION
2.3.1 XRD Analysis
The XRD patterns of SAS, SAS700, SMWT and SMWT700 were
as shown in Figure 2.3(a-d). All the patterns were in good agreement with
JCPDS data (09-0432) corresponding to pure phase of HAp. The SAS
showed broad peaks of low intensity indicating the presence of nanosized
particles (Figure 2.3(a)). When, it was subjected to calcination the intensity
increased, well resolved and reduction in peak broadening was found on
SAS700 sample (Figure 2.3(b)). Increase in crystallinity and crystallite size
was due to the calcination process and decomposition of agarose. The
intensity of the planes (211), (112), (100), (101), (200) and (111) of the
SMWT increased (Figure 2.3(c)) compared to SAS sample. In addition,
SMWT700 also showed enhanced intensity (Figure 2.3(d)) and it was similar
to the SMWT.
The crystallite size (L) was calculated from XRD spectrum using
Scherrer formula for all samples. L = K 1/2 cos , Where, K is a constant as
0.9, is the X-ray wavelength (1.5406 Å), is the full width at half maximum
and is the diffraction angle at the particular plane (Rusu et al 2005).
44
Crystalline planes of the samples were indexed and its full width at half
maximum was analyzed by XRDA software (Desgreniers and Lagare, 1994).
The crystallite size was calculated for all crystalline planes in the XRD
patterns of the samples and its average values are tabulated (Table 2.1).
Compared to the XRD patterns of SAS700 and SMWT700 samples, the
microwave treated sample (SMWT) appeared to have higher crystallinity and
less crystallite size than calcinated samples. During calcination, temperature
might not be uniform through out the matrix, but it is uniform during
microwave treatment. It might be the reason for higher crystallinity during the
microwave treatment. The crystallite size of SAS and SMWT was less than
SAS700 and SMWT700 samples. Further, the crystallinity was examined by
the relation, Xc = 1-(V112/300 I300) where I300 is the intensity of (300) plane and
V112/300 is the intensity of the peaks appearing between (112) and (300) (Rusu
et al 2005, Landi et al 2000).
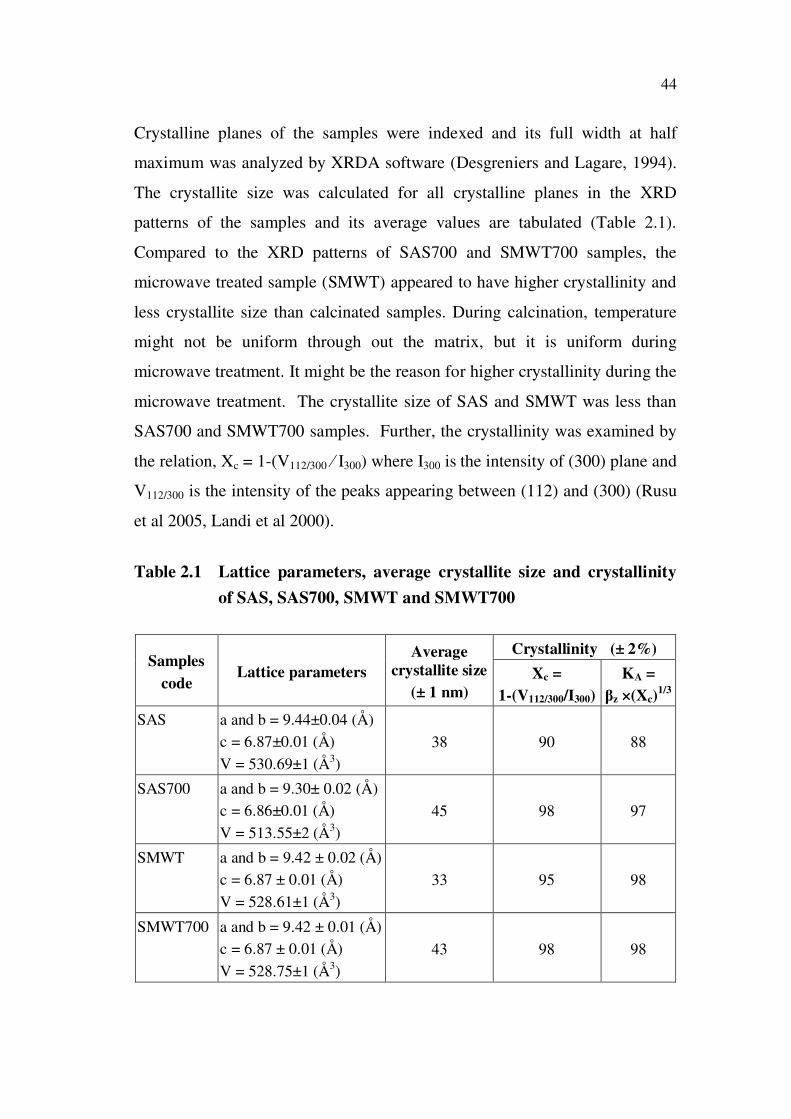
Table 2.1 Lattice parameters, average crystallite size and crystallinity
of SAS, SAS700, SMWT and SMWT700
Samples
codeLattice parameters
Average
crystallite size
(± 1 nm)
Crystallinity (± 2%)
Xc =
1-(V112/300/I300)
KA =
z ×(Xc)1/3
SAS a and b = 9.44±0.04 (Å)c = 6.87±0.01 (Å)V = 530.69±1 (Å3)
38 90 88
SAS700 a and b = 9.30± 0.02 (Å)c = 6.86±0.01 (Å)V = 513.55±2 (Å3)
45 98 97
SMWT a and b = 9.42 ± 0.02 (Å)c = 6.87 ± 0.01 (Å)V = 528.61±1 (Å3)
33 95 98
SMWT700 a and b = 9.42 ± 0.01 (Å)c = 6.87 ± 0.01 (Å)V = 528.75±1 (Å3)
43 98 98

45
10 20 30 40 50 60 70
41
35
11304
50
22
14
33
1
31
332
2
00
44
10
32
12
13
31
222
220
31
13
3113
10
301
202
3001
12
21
12
10
10
2
00
2
11
1
20
0
10
1
10
0
Two theta (degree)
(a)
(b)
41
35
11
304
50
22
14
331
31
33
220
04
41
032
12
13
3122
22
203
11
3
31
131
0
30
120
23
001
12
21
121
01
02
00
2
111
200
101
100
(c)
413
51
13
04
50
221
433
1
31
33
220
04
41
032
121
33
122
22
20
31
13
3113
10
3012
02
30
01
12
211
210
10
200
2
11
12
00
10
1
10
0
Inte
nsity (
a.u
)(d)
41
3
511
30
45
02
21
43
31
31
33
2200
44
10
321
21
331
2222
20
31
13
31
131
0
30
120
230
011
2
211
21
01
02
00
2
11
12
00
10
1
100
Figure 2.3 XRD patterns of (a) SAS (b) SAS700 (c) SMWT and
(d) SMWT700
Crystallinity has increased in the order of SAS, SMWT, SAS700
and SMWT700 samples (Table 2.1). A verification can be done with
empirical relation between Xc and z ie. z × (Xc)1/3 = KA, Where Xc is the
degree of crystallinity, z the full width at half maximum of (002) plane in
(degree-2 ), KA is a constant at 0.24 (Rusu et al 2005, Landi et al 2000). In
both method of calculation, almost same crystallinity has been found for all
samples.
46
2.3.2 FTIR Analysis
The FTIR spectra of SAS, SAS700, SMWT and SMWT700
samples were as shown in Figure 2.4 (a-d). In SAS sample, the high intense
broad envelope between 2600 and 3750 cm-1 was ascribed to the OH stretch
of hydroxyl groups along with the NH stretch of NH4+. A sharp peak at 1386 cm-1
was assigned to C-O-C stretch of the agarose and N-O stretch of NO3- (Anee
et al 2003, Sanchez-Vaquero et al 2010). The bending mode of water was
observed at 1638 cm-1. The sharp band at 1034 cm-1 was assigned to the
triply degenerate asymmetric P-O stretching mode ( 3). The low intensity
peak at 962 cm-1 was due to non-degenerate P-O symmetric stretching mode
1). The peak at 825 cm-1 was assigned to NO3- bending mode. The peak at
637 cm-1 was attributed to hydroxyl stretch vibration. Well resolved peaks at
606 and 562 cm-1 were attributed to the triply degenerate of O-P-O bending
mode ( 4). The doubly degenerate of O-P-O bending mode was observed at
475 cm-1. SAS spectrum provides the evidence for the formation of
HAp/agarose composite (Figure 2.4(a)).
For SAS700 sample, the intensity of peak decreased at region
between 2600 and 3750 cm-1. The reduction of peak intensity at 1638, 1386
and 3467 cm-1 was good evidence for the loss of water, decomposition of
agarose and NH4+, respectively. Compared to SAS spectrum, the sharp peak
observed at 3570 cm-1 was attributed to hydroxyl stretch in HAp crystal. The
phosphate peaks at 1034 and 637 cm-1 were resolved which confirmed the
improved crystallinity (Guo and Xiao 2006). In addition, the low intensity
peaks at 1460 and 1415 cm-1 were attributed to the carbonate group vibration.
It might be due to agarose decomposition and chemisorption of atmospheric
CO2 on the HAp during the thermal treatment (Kuriakose et al 2004).

47
4000 3500 3000 2500 2000 1500 1000 50087
58
25
82
5
14
60
14
15
56
260
66
37
56
26
066
37
56
26
06
637
96
29
62
96
2
10
34
10
34
10
34
10
98
109
810
98
13
83
138
6
16
38
16
38
16
38
20
40
20
40
20
40
236
723
67
23
67
35
70
35
70
357
0
378
83
78
837
88
34
67
318
5
378
8
23
67
20
40
163
8
13
86
10
98
103
4
96
2
637
60
6
(d)
(c)
(b)
(%)
Tra
nsm
itta
nce
Wavenumber (cm-1)
(a)
56
2
Figure 2.4 FTIR spectrum of (a) SAS (b) SAS700 (c) SMWT and
(d) SMWT700
A low intense peak at 1383 cm-1 was assigned to N-O stretch of
NO3- and agarose which confirmed the presence of agarose gel after
microwave treatment (Figure 2.4(c)). Compared to SAS sample, the peak at
1383 cm-1 was of low intense indicating the decomposition of agarose during
microwave treatment. In addition, the reduction in intensity of phosphate
peaks at 606, 562 cm-1 and water molecule vibration at 637 cm-1 were due to
loss of phosphate group from the crystal lattice. The absence of agarose peak
at 1383 cm-1 indicates the decomposition of agarose gel on microwave
treatment (Figure 2.4(d)).

48
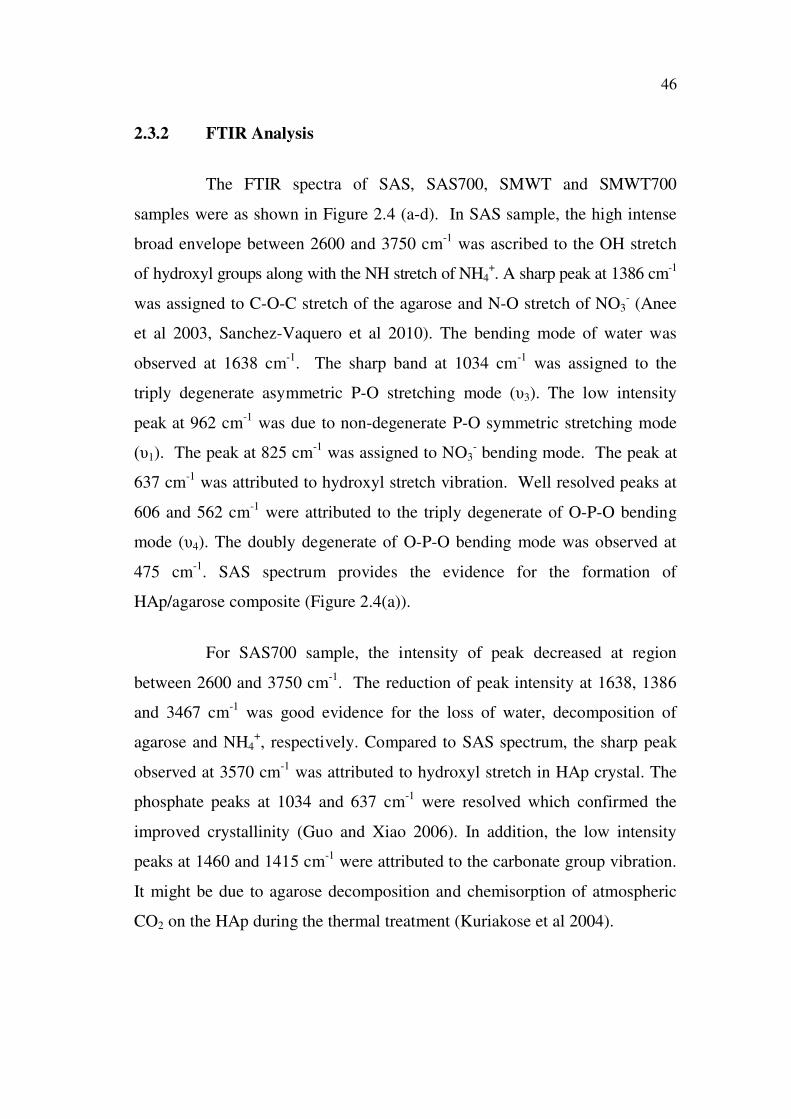
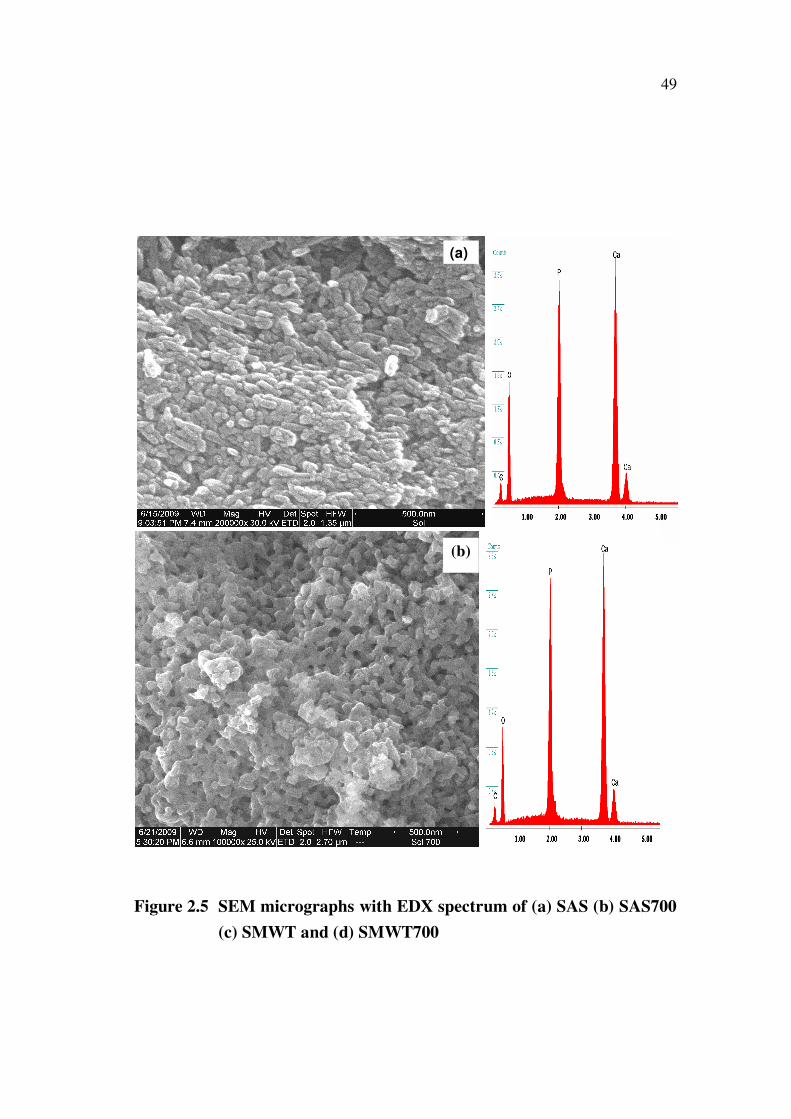
2.3.3 SEM and EDX Analysis
SEM micrographs and EDX of SAS, SAS700, SMWT and
SMWT700 were shown in Figure 2.5(a-d). The nano rods of length 10 to 100 nm
and width 5 to 20 nm were observed on SAS sample (Figure 2.5(a)). SAS700
showed agglomerated particles with non-uniform interconnected pores (100 to
150 nm), due to the decomposition of agarose and nitrate (Figure 2.5(b)). For
SMWT, the size of HAp/agarose rods (length 5-70 nm and width 5-30 nm)
were found to reduce compared with SAS sample. When SMWT was
subjected to calcination at 700 °C (SMWT700), irregular pores (100-250 nm)
with continuous network was observed. The aspect ratio (length/diameter)
was 2 to 5 and 1 to 2.3 for SAS and SMWT samples respectively. All the
samples were subjected to elemental analysis using SEM-EDX. Atomic Ca/P
ratio of SAS, SAS700, SMWT and SMWT700 was found to be 1.66, 1.68,
1.54 and 1.73 respectively (Table 2.2). Microwave treatment may produce
the calcium deficient HAp which was shown in EDX data of SMWT sample.
This may be due to loss of calcium during microwave treatment.
Table 2.2 The elemental data analyzed by EDX
SamplesWeight (± 1%) Atomic (± 1%) Ca/P
ratioCa P O C Ca P O C
SAS
SAS700
SMWT
SMWT700
32.79
36.98
31.65
43.37
15.21
16.99
15.93
19.38
43.37
37.15
43.62
28.45
8.62
8.88
8.79
8.79
17.26
20.36
16.58
25.65
10.37
12.11
10.80
14.83
57.22
51.23
57.25
42.16
15.15
16.31
15.37
17.36
1.66
1.68
1.54
1.73
49
(a)
(b)
Figure 2.5 SEM micrographs with EDX spectrum of (a) SAS (b) SAS700
(c) SMWT and (d) SMWT700

50
(c)
(d)
Figure 2.5 (Continued)

51
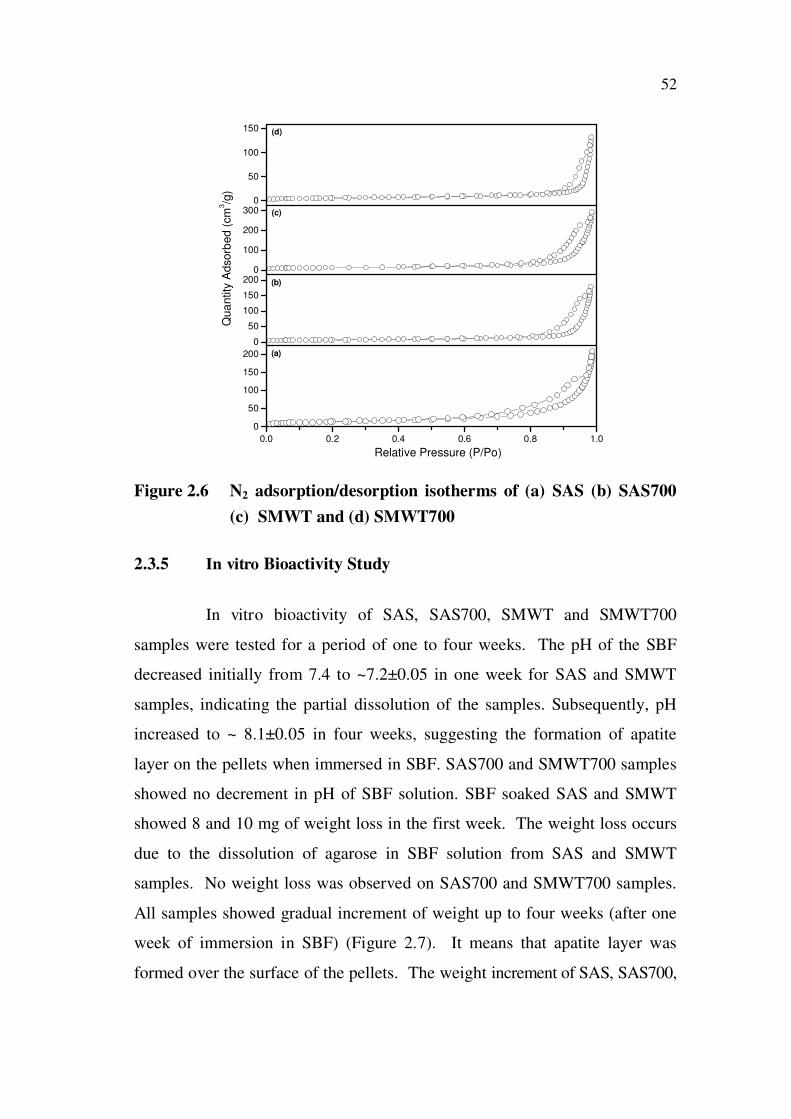
2.3.4 BET Analysis
The results of nitrogen adsorption/desorption isotherms of SAS,
SAS700, SMWT and SMWT700 samples were as shown in Figure 2.6(a-d).
All samples showed type IV isotherms and the typical H1-hysteresis loops,
demonstrating the properties of typical mesoporous materials (Haber 1991).
The BET surface area, pore volume and pore size of all samples were
presented in Table 2.3. SAS contain agarose and its surface area was 52 %
higher than SAS700. Microwave treated (SMWT) sample showed surface
area nearly to the SAS. SMWT700 showed 47 % decrease of the surface area
compared to SMWT sample. The variation in surface area for SAS and
SAS700 samples was also reflected in their pore volume. Similarly, SMWT
showed pore volume more than SMWT700. The pore of 17-34 nm diameter
was observed in all the samples. SAS sample showed lower pore size than
other samples. This is due to the presence of higher amount of agarose which
was mixed with HAp and it was confirmed by high intensity peak of agarose
(1386 cm-1) in FTIR spectrum (Figure 2.4(a)). The nanosized pore of
HAp/agarose composite could be useful for drug delivery as well as to enhance
the bone bonding ability.
Table 2.3 Pore size, volume and surface area for SAS, SAS700, SMWT
and SMWT700
Sample
code
Pore size (Dp)
(± 1 nm)
BET Surface area (SBET)
(± 1 m2/g)
Pore volume (Vp)
(± 0.002 cm3/g)
SAS
SAS700
SMWT
SMWT700
17.17
25.28
24.01
34.28
47.795
25.045
41.692
19.709
0.323
0.277
0.450
0.205
52
0.0 0.2 0.4 0.6 0.8 1.0
0
50
100
150
200
0
50
100
150
2000
100
200
3000
50
100
150
(a)
Qua
ntity
Adsorb
ed (
cm
3/g
)
Relative Pressure (P/Po)
(b)
(c)
(d)
Figure 2.6 N2 adsorption/desorption isotherms of (a) SAS (b) SAS700
(c) SMWT and (d) SMWT700
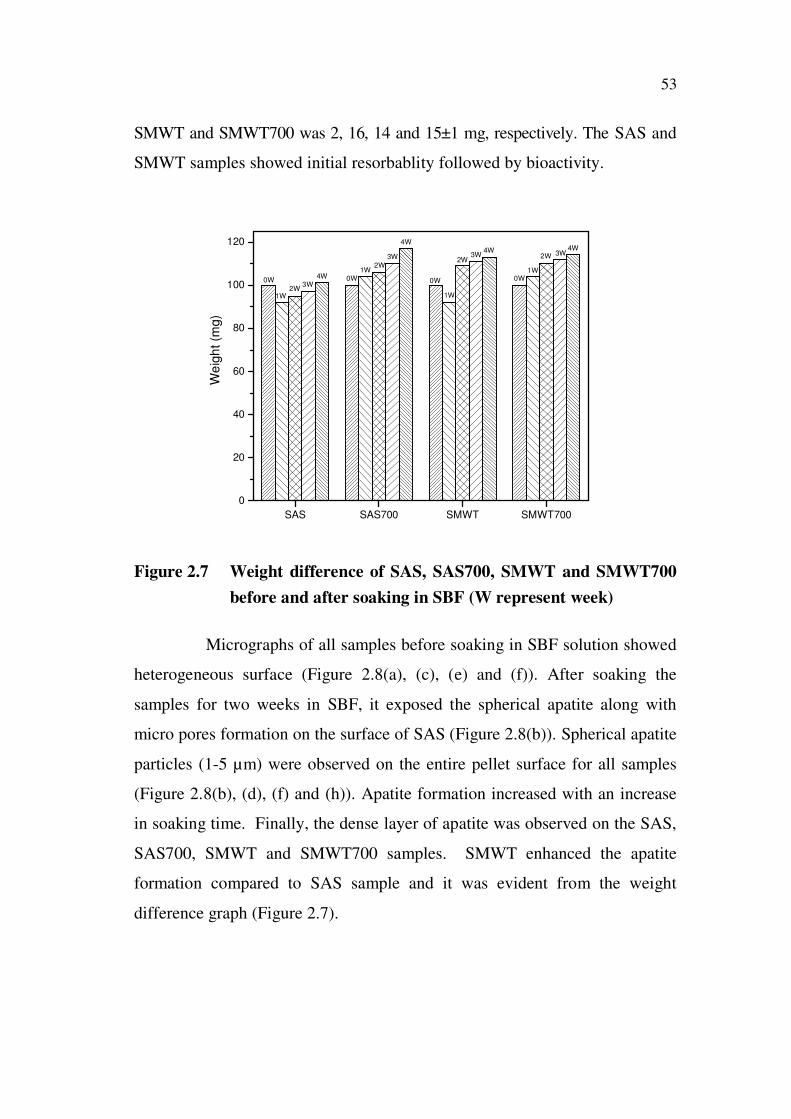
2.3.5 In vitro Bioactivity Study
In vitro bioactivity of SAS, SAS700, SMWT and SMWT700
samples were tested for a period of one to four weeks. The pH of the SBF
decreased initially from 7.4 to ~7.2±0.05 in one week for SAS and SMWT
samples, indicating the partial dissolution of the samples. Subsequently, pH
increased to ~ 8.1±0.05 in four weeks, suggesting the formation of apatite
layer on the pellets when immersed in SBF. SAS700 and SMWT700 samples
showed no decrement in pH of SBF solution. SBF soaked SAS and SMWT
showed 8 and 10 mg of weight loss in the first week. The weight loss occurs
due to the dissolution of agarose in SBF solution from SAS and SMWT
samples. No weight loss was observed on SAS700 and SMWT700 samples.
All samples showed gradual increment of weight up to four weeks (after one
week of immersion in SBF) (Figure 2.7). It means that apatite layer was
formed over the surface of the pellets. The weight increment of SAS, SAS700,
53
SAS SAS700 SMWT SMWT700
0
20
40
60
80
100
120
1W
4W4W4W
3W3W3W 2W2W
2W
1W
1W0W0W0W4W
3W2W
1W
We
igh
t (m
g)
0W
SMWT and SMWT700 was 2, 16, 14 and 15±1 mg, respectively. The SAS and
SMWT samples showed initial resorbablity followed by bioactivity.
Figure 2.7 Weight difference of SAS, SAS700, SMWT and SMWT700
before and after soaking in SBF (W represent week)
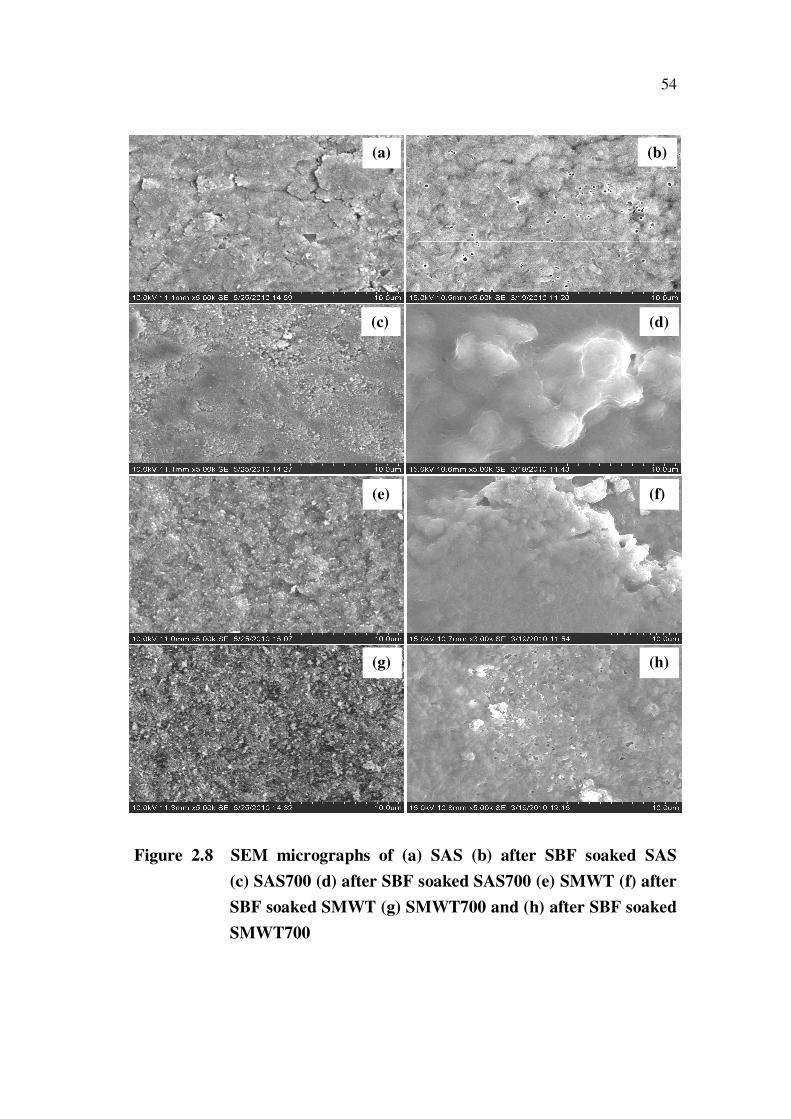
Micrographs of all samples before soaking in SBF solution showed
heterogeneous surface (Figure 2.8(a), (c), (e) and (f)). After soaking the
samples for two weeks in SBF, it exposed the spherical apatite along with
micro pores formation on the surface of SAS (Figure 2.8(b)). Spherical apatite
particles (1-5 µm) were observed on the entire pellet surface for all samples
(Figure 2.8(b), (d), (f) and (h)). Apatite formation increased with an increase
in soaking time. Finally, the dense layer of apatite was observed on the SAS,
SAS700, SMWT and SMWT700 samples. SMWT enhanced the apatite
formation compared to SAS sample and it was evident from the weight
difference graph (Figure 2.7).
54
(a) (b)
(c) (d)
(e) (f)
(g) (h)
Figure 2.8 SEM micrographs of (a) SAS (b) after SBF soaked SAS
(c) SAS700 (d) after SBF soaked SAS700 (e) SMWT (f) after
SBF soaked SMWT (g) SMWT700 and (h) after SBF soaked
SMWT700
55
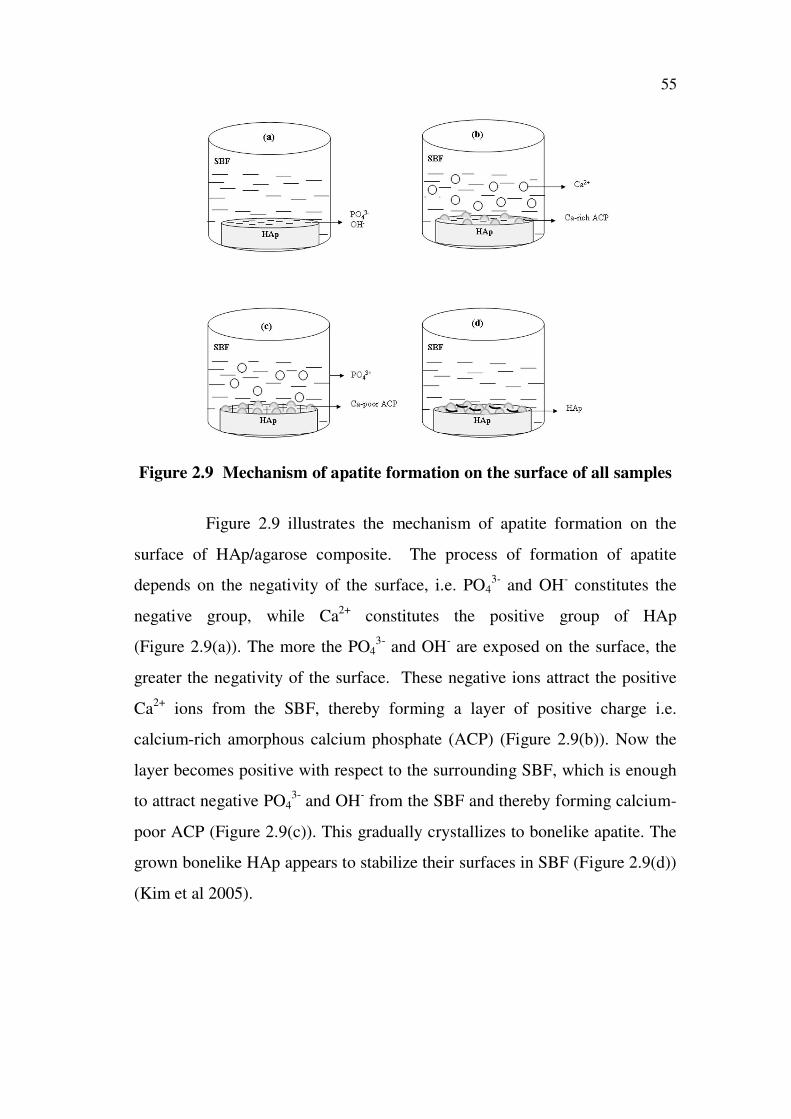
Figure 2.9 Mechanism of apatite formation on the surface of all samples
Figure 2.9 illustrates the mechanism of apatite formation on the
surface of HAp/agarose composite. The process of formation of apatite
depends on the negativity of the surface, i.e. PO43- and OH- constitutes the
negative group, while Ca2+ constitutes the positive group of HAp
(Figure 2.9(a)). The more the PO43- and OH- are exposed on the surface, the
greater the negativity of the surface. These negative ions attract the positive
Ca2+ ions from the SBF, thereby forming a layer of positive charge i.e.
calcium-rich amorphous calcium phosphate (ACP) (Figure 2.9(b)). Now the
layer becomes positive with respect to the surrounding SBF, which is enough
to attract negative PO43- and OH- from the SBF and thereby forming calcium-
poor ACP (Figure 2.9(c)). This gradually crystallizes to bonelike apatite. The
grown bonelike HAp appears to stabilize their surfaces in SBF (Figure 2.9(d))
(Kim et al 2005).
56
SAS SAS700 SMWT SMWT700
0
1
2
3
4
5
6
7
8
9
10
4W
4W
3W
3W
3W
4W
3W
2W
2W
2W
2W
1W
1W
1W
We
igh
t (m
g)
1W
0 1 Week 2 Week 3 Week 4 Week
0.0
0.1
0.2
0.3
7.2
7.3
7.4
pH
SAS
SAS700
SMWT
SMWT700
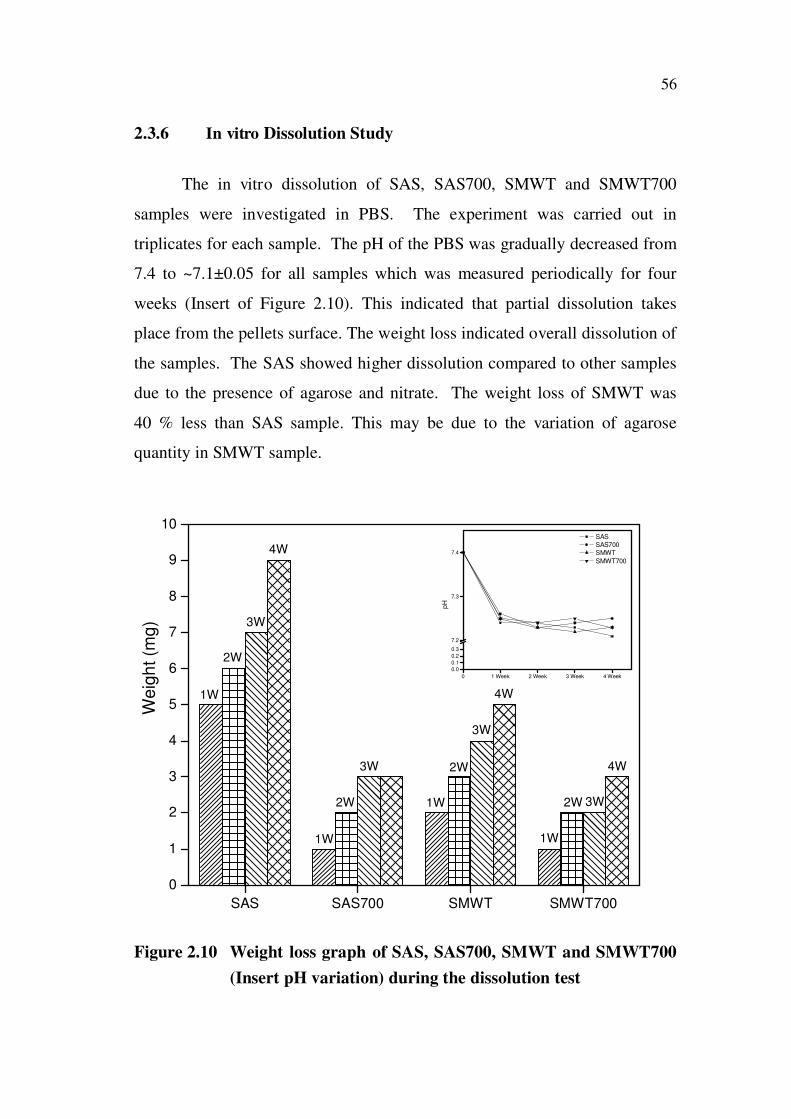
2.3.6 In vitro Dissolution Study
The in vitro dissolution of SAS, SAS700, SMWT and SMWT700
samples were investigated in PBS. The experiment was carried out in
triplicates for each sample. The pH of the PBS was gradually decreased from
7.4 to ~7.1±0.05 for all samples which was measured periodically for four
weeks (Insert of Figure 2.10). This indicated that partial dissolution takes
place from the pellets surface. The weight loss indicated overall dissolution of
the samples. The SAS showed higher dissolution compared to other samples
due to the presence of agarose and nitrate. The weight loss of SMWT was
40 % less than SAS sample. This may be due to the variation of agarose
quantity in SMWT sample.
Figure 2.10 Weight loss graph of SAS, SAS700, SMWT and SMWT700
(Insert pH variation) during the dissolution test
57
(d)
(b)
(c)
(a)
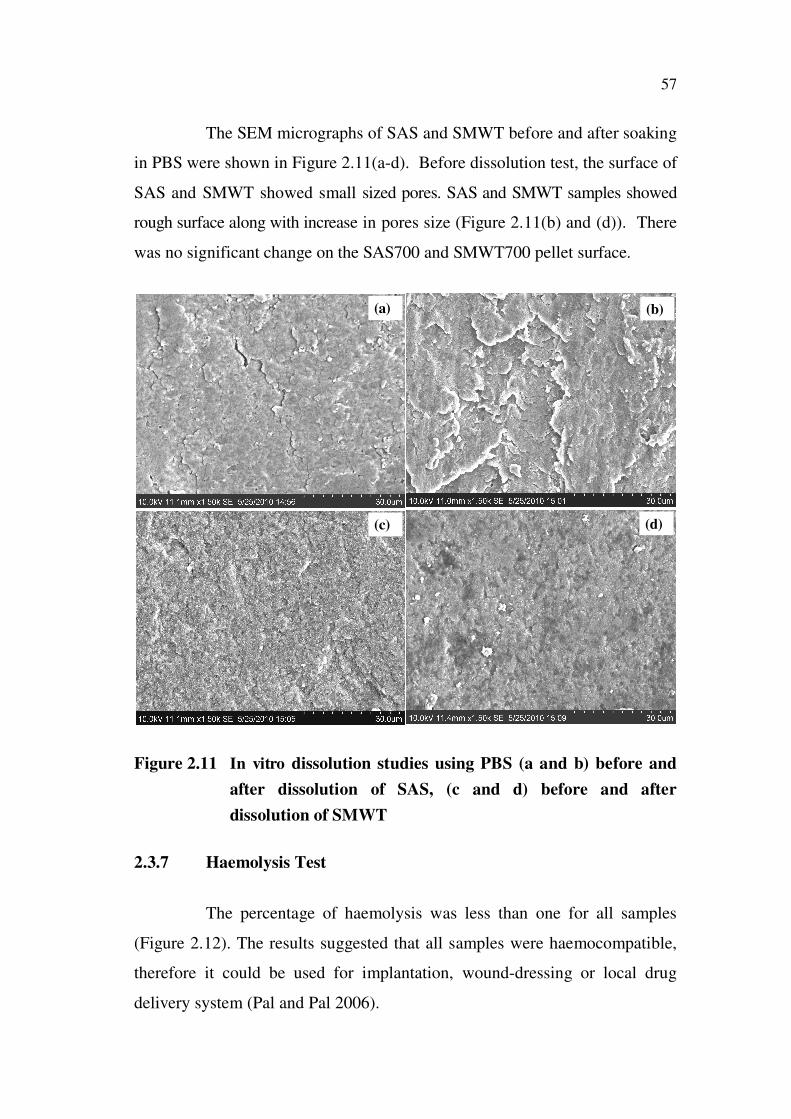
The SEM micrographs of SAS and SMWT before and after soaking
in PBS were shown in Figure 2.11(a-d). Before dissolution test, the surface of
SAS and SMWT showed small sized pores. SAS and SMWT samples showed
rough surface along with increase in pores size (Figure 2.11(b) and (d)). There
was no significant change on the SAS700 and SMWT700 pellet surface.
Figure 2.11 In vitro dissolution studies using PBS (a and b) before and
after dissolution of SAS, (c and d) before and after
dissolution of SMWT
2.3.7 Haemolysis Test
The percentage of haemolysis was less than one for all samples
(Figure 2.12). The results suggested that all samples were haemocompatible,
therefore it could be used for implantation, wound-dressing or local drug
delivery system (Pal and Pal 2006).

58
Figure 2.12 Percentage of haemolysis for SAS, SAS700, SMWT and
SMWT700
2.3.8 In vitro Drug Release
The cumulative percentage of AMX (antibiotic) release profiles
from SAS, SAS700, SMWT and SMWT700 samples as a function of release
time in PBS were as shown in Figure 2.13(a). SAS showed initial burst
release of about 60 % within 10 h, due to the dissolution of agarose in PBS.
Subsequently, controlled drug release was observed. The slow release was
attributed to the strong interaction between mesoporous surface of HAp and
the drug. SMWT released 20 % of drug at 1 h then it showed controlled
release. Each hour, it released 2 to 3 % of the drug, the controlled and
extended drug release was noted upto 125 h (100 %). When compared with
SAS, SMWT had low surface area and large pore size. However, SMWT
sample showed controlled and extended drug release. This may be due to high
crystallinity and reduction of particle size. SAS700 and SMWT700 samples
showed 77 and 92 % rapid release within 30 h. The controlled release was
extended upto 152 h for SMWT700 sample (Figure 2.13(a)). This is due to
high crystallinity of HAp particles which was produced by microwave
treatment along with calcination (Melville et al 2008).
SAS SMWT SAS700 SMWT700
0.0
0.1
0.2
0.3
0.4
0.5
0.6
0.7
0.8
0.9
1.0
(%)
of h
aem
oly
sis

59
0 10 20 30 40 50 60 70 80 90 100 110 120 130 140 150 160
0
20
40
60
80
100
(%)
of cum
ula
tive A
MX
re
lease
T ime (h)
SAS
SAS700
SMW T
SMW T700
0 20 40 60 80 100 120 140
0
20
40
60
80
100
(%)
of cu
mula
tive
AM
X r
ele
ase
T ime (h)
SMW T
(a)
0 10 20 30 40 50 60 70 80 90 100
0
20
40
60
80
100
Time (h)
(%)
of cum
ula
tive 5
-Fcil
rele
ase
SAS
SAS700
SMW T
SMWT700
0 20 40 60 80 100
0
20
40
60
80
100
Time (h)
(%)
of cu
mu
lative
5-F
cil re
lea
se
SMWT
(b)
Figure 2.13 In vitro drug release of (a) AMX and (b) 5-Fcil drug
(Insert SMWT drug release profile)
The cumulative percentage of drug release profiles for the 5-Fcil
(anticancer) drug loaded SAS, SAS700, SMWT and SMWT700 samples were
shown in Figure 2.13(b). Rapid release, followed by controlled release was
60
observed. SAS, SAS700, SMWT and SMWT700 samples showed burst
release of 79, 84, 87 and 95 % respectively at 10 h. 100 % of release was
observed on SMWT700 within 36 h. SAS700 released 95 % at 25 h then it
showed stable value upto 50 h. SAS and SMWT showed controlled release of
96 and 98 % at 80 h respectively. Gradual increase in the percentage of drug
release upto 95 h on SMWT sample was observed. The SAS and SMWT lead to
a significant decrease in 5-Fcil release. It indicates a stronger bonding of
5-Fcil to SAS and SMWT sample due to the presence of agarose. In addition,
high surface area and low pore size also contributes to the decrease in drug
release. Prolonged 5-Fcil drug release for cancer chemotherapy could
probably circumvent drug resistance which is an important impediment in
cancer therapy.
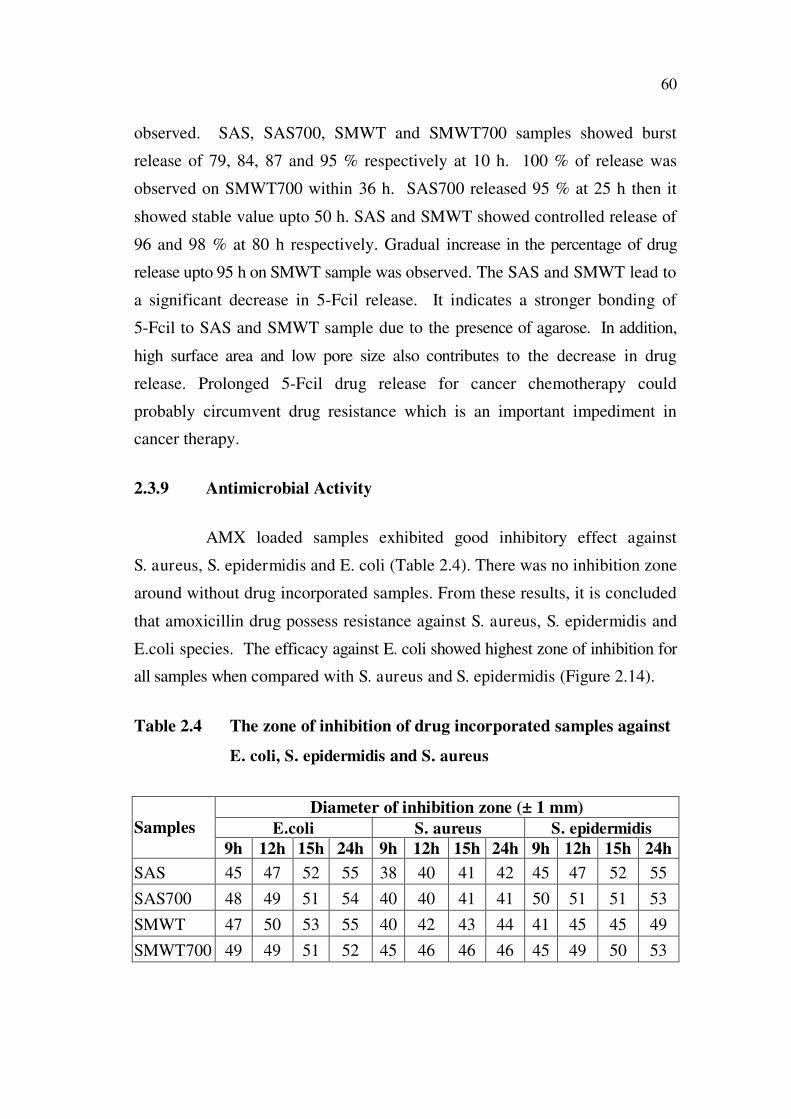
2.3.9 Antimicrobial Activity
AMX loaded samples exhibited good inhibitory effect against
S. aureus, S. epidermidis and E. coli (Table 2.4). There was no inhibition zone
around without drug incorporated samples. From these results, it is concluded
that amoxicillin drug possess resistance against S. aureus, S. epidermidis and
E.coli species. The efficacy against E. coli showed highest zone of inhibition for
all samples when compared with S. aureus and S. epidermidis (Figure 2.14).
Table 2.4 The zone of inhibition of drug incorporated samples against
E. coli, S. epidermidis and S. aureus
Samples
Diameter of inhibition zone (± 1 mm)
E.coli S. aureus S. epidermidis
9h 12h 15h 24h 9h 12h 15h 24h 9h 12h 15h 24h
SAS 45 47 52 55 38 40 41 42 45 47 52 55
SAS700 48 49 51 54 40 40 41 41 50 51 51 53
SMWT 47 50 53 55 40 42 43 44 41 45 45 49
SMWT700 49 49 51 52 45 46 46 46 45 49 50 53

61
(a)
(b)
(a) (a)
(b) (b)
(c) (c) (c)
(d) (d) (d)
E. coli
E. coli
E. coli
E. coli
S. aureus
S. aureus
S. aureus
S. aureus
S. epidermidis
S. epidermidis
S. epidermidis
S. epidermidis
Figure 2.14 Inhibition zone of without and with AMX loaded (a) SAS
(b) SAS700 (c) SMWT and (d) SMWT700 samples against
E. coli, S. aureus and S.epidermidis

62
SAS SAS700 SMWT SMWT700
0.0
0.2
0.4
0.6
0.8
1.0
Op
tica
l d
ensity
2.3.10 Cell Viability
The osteoblast behavior on the HAp/agarose composite was
investigated using MTT test. The percentage of viable cells was greater than
70 % for all the samples (Figure 2.15). The results suggested that there was
no toxicity on SAS, SAS700, SMWT and SMWT700 samples.
Figure 2.15 Cell viability study of SAS, SAS700, SMWT and SMWT700
2.4 CONCLUSION
Nano rods of HAp/agarose composite (10-100 nm) was synthesized
by sol-gel technique at low temperature with constant pH followed by
microwave treatment. HAp/agarose composite was confirmed by XRD and
FTIR. Microwave treated SMWT showed increase in crystallinity and
decrease in particle size (30 %) compared to the SAS. The calcined samples
showed interconnected porous structure which could help osteointegration
when used as an implant. The presence of pores allows the circulation of
physiological fluid to help the new bone formation which further improves
the mechanical fixation of the implant at the implantation site. Further, the
porous bioceramics could be used for local drug delivery system. The specific

63
surface areas of the as-synthesized and microwave treated samples were
higher (~ 50 %) than that of calcined samples. In vitro bioactivity tests
revealed initial absorption and subsequently exhibited bioactivity. Controlled
antibiotic and anticancer drug release was observed with microwave treated
samples. SMWT showed prolonged antibiotic release upto 125 h, which is
two times higher than SAS sample. Anticancer drug showed faster release
than the antibiotic. The antibacterial activity results showed that the entire
drug incorporated samples are strongly active against the most common
bacterial strains. It may be used as an implant material and for reconstructive
surgery applications. All samples showed haemocompatability and had no
cytotoxicity.