Embed Size (px)
Citation preview
i
ANTICANCER PROPERTIES AND CHEMICAL
INVESTIGATION OF SEEDS AND FRUITS OF PHALERIA
MACROCARPA (SCHEFF.) BOERL
MA MA LAY
FACULTY OF SCIENCE
UNIVERSITY OF MALAYA
KUALA LUMPUR
2014
ii
ANTICANCER PROPERTIES AND CHEMICAL
INVESTIGATION OF SEEDS AND FRUITS OF PHALERIA
MACROCARPA (SCHEFF.) BOERL
MA MA LAY
THESIS SUBMITTED IN FULFILLMENT OF THE
REQUIREMENTS FOR THE DEGREE OF
DOCTOR OF PHILOSOPHY
INSTITUTE OF BIOLOGICAL SCIENCES
FACULTY OF SCIENCE
UNIVERSITY OF MALAYA
KUALA LUMPUR
2014
iii
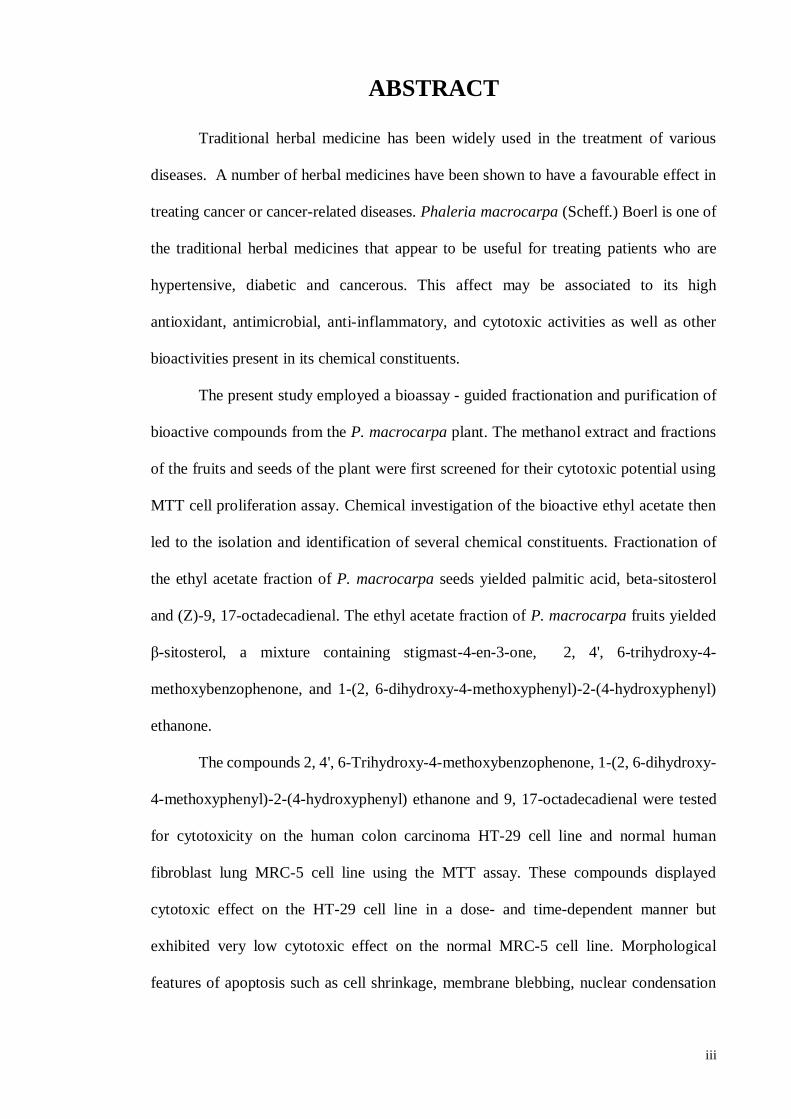
ABSTRACT
Traditional herbal medicine has been widely used in the treatment of various
diseases. A number of herbal medicines have been shown to have a favourable effect in
treating cancer or cancer-related diseases. Phaleria macrocarpa (Scheff.) Boerl is one of
the traditional herbal medicines that appear to be useful for treating patients who are
hypertensive, diabetic and cancerous. This affect may be associated to its high
antioxidant, antimicrobial, anti-inflammatory, and cytotoxic activities as well as other
bioactivities present in its chemical constituents.
The present study employed a bioassay - guided fractionation and purification of
bioactive compounds from the P. macrocarpa plant. The methanol extract and fractions
of the fruits and seeds of the plant were first screened for their cytotoxic potential using
MTT cell proliferation assay. Chemical investigation of the bioactive ethyl acetate then
led to the isolation and identification of several chemical constituents. Fractionation of
the ethyl acetate fraction of P. macrocarpa seeds yielded palmitic acid, beta-sitosterol
and (Z)-9, 17-octadecadienal. The ethyl acetate fraction of P. macrocarpa fruits yielded
β-sitosterol, a mixture containing stigmast-4-en-3-one, 2, 4', 6-trihydroxy-4-
methoxybenzophenone, and 1-(2, 6-dihydroxy-4-methoxyphenyl)-2-(4-hydroxyphenyl)
ethanone.
The compounds 2, 4', 6-Trihydroxy-4-methoxybenzophenone, 1-(2, 6-dihydroxy-
4-methoxyphenyl)-2-(4-hydroxyphenyl) ethanone and 9, 17-octadecadienal were tested
for cytotoxicity on the human colon carcinoma HT-29 cell line and normal human
fibroblast lung MRC-5 cell line using the MTT assay. These compounds displayed
cytotoxic effect on the HT-29 cell line in a dose- and time-dependent manner but
exhibited very low cytotoxic effect on the normal MRC-5 cell line. Morphological
features of apoptosis such as cell shrinkage, membrane blebbing, nuclear condensation
iv
and DNA fragmentation under inverted, phase and fluorescence microscopy were then
examined.
The effects of the compounds on cells were further analysed using the Annexin
V-FITC/PI assay. In this assay, the percentage of early apoptotic, late apoptotic, necrotic
and live cells were determined and it was observed that cell death was induced in a dose-
and time-dependent manner in HT-29 cells. Results of cell cycle analysis further
confirmed that G0/G1 arrest and S-phase accumulation of HT-29 cells declined in a time-
dependent manner after treatment with the compounds.
Taken together, these results suggested that the induced cell death resulting from
treatment with the compounds were possibly associated with changes in the protein
expression. The cell death also showed many characteristic of an apoptotic form of cell
death. Thus, these compounds merit further investigation as potential anticancer agents.
v
ABSTRAK
Ubat-ubatan herba tradisional telah digunakan secara meluas dalam rawatan
pelbagai penyakit. Kini, beberapa ubat-ubatan herba baik boleh merawat kanser atau
penyakit yang berkaitan dengan kanser. Phaleria macrocarpa (Scheff.) Boerl adalah
salah satu daripada ubat-ubatan herba tradisional Indonesia yang sangat berguna untuk
merawat pesakit yang menghidapi penyakit seperti kencing manis atau kanser kerana ia
mengandungi antioksidan yang tinggi, anti-mikrob, anti-radang, dan aktiviti sitotoksik
serta bioaktiviti lain yang disebabkan oleh kandungan bioaktif kimianya.
Eksperimen dalam kajian ini adalah berdasarkan bioesei yang berpandukan
pemeringkatan. Pada mulanya, ekstrak metanol dan fraksi-fraksi dari buah-buahan dan
biji P. macrocarpa saring keupayaan ketoksikannya menggunakan MTT. Kemudian,
penyiasatan kimia etil asetat bioaktif yang membawa kepada pengasingan dan
pengenalpastian beberapa juzuk kimia dijalankan. Dari esktrak etil asetat benih
macrocarpa P. macrocarpa, terdapat asid palmitik, beta-sitosterol dan (Z) -9, 17-
oktadekadienal. Dari fraksi etil asetat yang dijalankan buah P. macrocarpa terdapat β-
sitosterol, campuran mengandungi stigmast-4-en-3-satu, 2, 4, 6-trihydroksi-4-
metoksibenzofenon dan 1 - (2, 6-dihidroksi-4-metoksifenil) -2 - (4-hidroksifenil)
ethanon.
2, 4, 6-Trihidroksi-4- metoksibenzofenon, 1 - (2, 6- dihidroksi-4-metoksifenil) -2
- (4-hidroksifenil) ethanon dan 9, 17-oktadekadienal telah diuji ke atas sel kolon HT -29
dan fibroblast paru-paru manusia normal MRC-5. Sebatian didapati mempunyai kesan
mengikut dos dan masa tetapi menpunyai kesan sitotosik yang sangat rendah pada titsan
sel normal (MRC-5). Seterusnya, ciri morfologi badan apoptotik seperti pengecutan sel,
blebbing membran, pemeluwapan nuklear dan pemecahan DNA di bawah tertonggeng,
fasa dan pendarfluor mikroskop turut dijalankan.
vi
Dalam esei Annexin V-FITC/PI mendapati bahawa peratusan sel pada awal apoptotis,
lewat apoptotis atau sel nekrotik sekunder dan sel-sel hidup boleh ditentukan dengan
ketara mengikut perubahan dos dan cara. Selain itu, kajian ini juga mengesahkan bahawa
keputusan analisis kitaran sel menunjukkan G0/G1 dan pengumpulan S-fasa HT-29 sel-
sel merosot adalah bergantung kepada masa selepas rawatan.Kesimpulannya, Oleh itu,
keputusan dari kajian ini menujukkan bahawa biji Phaleria macrocarpa (Scheff.) Boerl
berpotensi untuk digunakan sebagai perubatan moden pada masa akan datang.

vii
ACKNOWLEDGEMENTS
In the name of Allah, the Most Gracious and the Most Merciful
Alhamdulillah, all praises to Allah for the strengths and His blessing in completing this
thesis.
First of all, I would like to express my most appreciation to Vice Chancellor of
University Malaya, Deputy Vice Chancellor of University Malaya, Dean and Deputy
Dean of Faculty Science, Head of Biological institute, all professors, associate professors,
lecturers, office staffs for their support and help towards my postgraduate affairs.
I would like to express my greatest special gratitude to Professor Dr. Rosli Bin
Hashim, the Deputy Dean of Faculty of Science, University of Malaya, for his kind
guidance and encouragement and for allowing me to use the laboratory facilities.
I also would like to express my sincere gratitude to my supervisors; Associate
Professor Dr. Saiful Anuar Karsani and Professor Datin Sri Nurestri Abd. Malek
Department of Biochemistry, Institute of Biological Sciences, University of Malaya for
their continuous guidance towards my research development process.
Moreover, I would also like to thank Professor Dr. Amru bin Nasrulhaq Boyce,
Institute of Biological Sciences, Faculty of Science, University of Malaya, for generously
allowing me the use of his laboratory during my bench work.
My heartfelt thanks are also extended to the Merit Scholarship awarded by the
Islamic Development Bank of Saudi Arabia for fully supporting my years of study. I
would also like to acknowledge the Ministry of Higher Education of Malaysia for
supporting me with the following grants (No. PS286/2009C and PS470/2010B).
I also convey my thanks to all my colleagues and friends who gave me their words
of encouragement and motivated me to finish my research. Special thanks for the
friendships and memories.
viii
Last but not the least, I would like to pay high regards to my beloved family-of
my mother, my brothers and sisters for their fulfillment of my needs, their constant
encouragement, and inspiration throughout my research work and lifting me uphill this
phase of life. I owe everything to them. Besides this, I offer my regards and blessings to
all of those who supported me in any respect during the successful completion of the
project. Thank you very much.
Ma Ma Lay
(2014)
ix
TABLE OF CONTANTS
ABSTRACT ................................................................................................................. i
ABSTRAK ................................................................................................................... v
ACKNOWLEDGEMENTS ........................................................................................ v
TABLE OF CONTANTS.......................................................................................... ixi
LIST OF FIGURES .................................................................................................. xii
LIST OF TABLES ................................................................................................... xxi
LIST OF APPENDICES ........................................................................................ xxiv
LIST OF SYMBOLS AND ABBREVIATIONS ................................................... xxvi
CHAPTER 1: INTRODUCTION............................................................................... 1
CHAPTER 2: LITERATURE REVIEW ................................................................... 6
2.1. Cancer ............................................................................................................. 6
2.2. Carcinogens .................................................................................................... 6
2.3. Carcinogenesis ................................................................................................ 7
2.4. Natural Products .............................................................................................. 8
2.4.1. Bioactive natural products ....................................................................... 8
2.4.2. Natural products with anticancer activity ................................................. 8
2.5. Plants .............................................................................................................. 9
2.6. The P. macrocarpa plant ................................................................................. 9
2.6.1. The Fruit of P. macrocarpa ................................................................... 10
2.6.2. The Leaves of P. macrocarpa ................................................................ 10
2.6.3. The Seeds of P. macrocarpa .................................................................. 11
2.7. Chemical components of P. marcrocapa ....................................................... 11
2.7.1. Chemical components of P. macrocarpa ............................................... 10
2.7.2. Chemical components of P. macrocarpa seeds ...................................... 16
2.7.3. Chemical components of P. macrocarpa fruits....................................... 19
2.8. Bioactivity of P. macrocarpa ........................................................................ 22
2.8.1. Bioactivity in P. macrocarpa leaves ...................................................... 22
2.8.2. Bioactivity in P. macrocarpa seeds ........................................................ 23
2.8.3. Bioactivity of P. macrocarpa fruits ........................................................ 24
2.9. Apoptosis and Cancer .................................................................................... 26
2.10. Apoptosis ...................................................................................................... 26
2.11. Apoptotic Pathway ........................................................................................ 27
2.11.1. Intrinsic pathway ................................................................................... 28
x
2.11.2. Extrinsic Pathway .................................................................................. 29
2.12. Cell Cycle ..................................................................................................... 30
2.13. Cell cycle in flow cytometry analysis ............................................................ 31
CHAPTER 3: MATERIAL AND METHODS ........................................................ 33
3.1. Plant Material ................................................................................................ 33
3.2. Extraction and Fractionation of P. macrocarpa ............................................. 33
3.3. In vitro cytotoxicity assay.............................................................................. 34
3.3.1. Cell lines and culture medium ................................................................ 34
3.3.2. Trypan blue exclusion test ..................................................................... 35
3.3.3. Selectivity Index .................................................................................... 35
3.3.4. In vitro neutral red cytotoxicity assay..................................................... 35
3.3.5. In vitro MTT assay ................................................................................ 37
3.4. Instrumentation ............................................................................................. 34
3.4.1. Column chromatography........................................................................ 34
3.4.2. Thin layer chromatography (TLC) ......................................................... 38
3.4.3. Preparative Thin Layer Chromatography (Prep-TLC) ............................ 38
3.4.4. Gas Chromatography-Mass Spectrophotometry (GC-MS)...................... 38
3.4.5. Nuclear Magnetic Resonance (NMR)..................................................... 38
3.5. Extraction, isolation and identification of chemical constituents from bioactive
extracts .......................................................................................................... 39
3.5.1. Separation of Compounds using Column Chromatography .................... 39
3.5.2. Combining eluent fractions obtained from column chromatography ....... 40
3.5.3. Isolation of bioactive compound(s) ........................................................ 40
3.6. Morphological changes associated with apoptosis ......................................... 41
3.6.1. Inverted and phase-contrast microscopy ................................................. 41
3.6.2. Fluorescence microscopy ....................................................................... 41
3.7. Annexin V staining assay .............................................................................. 41
3.8. Cell cycle analysis ......................................................................................... 42
3.9. Data analysis ................................................................................................. 43
3.10. Statistical analysis ......................................................................................... 43
CHAPTER 4: RESULTS AND DISCUSSION ........................................................ 44
4.1. Extraction and Fractionations ........................................................................ 44
4.2. Characterization and Identification of P. macrocarpa seeds........................... 46
4.2.1. Characterization and Identification of hexane fraction............................ 46
4.2.2. Characterization and Identification of chloroform fraction ..................... 47
xi
4.2.3. Separation and Isolation of ethyl acetate fraction ................................... 47
4.2.4. Identification of chemical components in hexane and chloroform
fractions................................................................................................. 50
4.3. Characterization and Identification of components in the P. macrocarpa fruit
extract…………………………………………………………………………53
4.3.1. Characterization and Identification of components in the hexane extract
fraction…………………………………………………………………..53
4.3.2. Characterization and Identification of components in the chloroform
fraction .................................................................................................. 54
4.3.3. Separation and Isolation of components in the ethyl acetate fraction ...... 55
4.3.4. Identification of chemical components in the Hexane and Chloroform
fractions from GC-MS analysis .............................................................. 58
4.4. Characterization and identification of isolated compounds from P. macrocarpa
...................................................................................................................... 60
4.4.1. Stigmast-4-en-3-one .............................................................................. 60
4.4.2. β-Sitosterol ............................................................................................ 60
4.4.3. Palmitic acid .......................................................................................... 61
4.4.4. (Z)-9, 17-Octadecadienal ....................................................................... 62
4.4.5. 2, 4’, 6-Trihydroxy-4-methoxy-benzophenone ....................................... 63
4.4.6. 1-(2, 6-Dihydroxy-4-methoxyphenyl)-2-(4-hydroxyphenyl) ethanone .... 66
4.5. In vitro Neutral Assay ................................................................................... 69
4.5.1. Screening of cytotoxic activity of P. macrocarpa seed extract and its
fractions.. ............................................................................................... 70
4.5.1.1 Human cervical carcinoma cell line (Ca Ski).......................................... 70
4.5.1.2 Hormone-dependent breast carcinoma cell line (MCF-7) ....................... 71
4.5.1.3 Human colon carcinoma cell line (HT-29) ............................................. 72
4.5.1.4 Human Lung carcinoma cell line (A-549) .............................................. 73
4.5.1.5 Human ovarian carcinoma cell line (SKOV-3) ....................................... 74
4.5.1.6 Human fibroblast cell line (MRC-5)....................................................... 75
4.5.1.7 Discussion ............................................................................................. 76
4.5.2. Screening of cytotoxic activity of P. macrocarpa fruits extract and its
fractions. ................................................................................................ 78
4.6. In vitro MTT cell proliferation assay ............................................................. 79
4.6.1. Screening for cytotoxic activity of P. macrocarpa seeds.. ....................... 80
4.6.1.1 Human cervical carcinoma cell line (Ca Ski).......................................... 80
4.6.1.2 Human hormone-dependent breast carcinoma cell line (MCF-7) ............ 81
4.6.1.3 Human colon carcinoma cell line (HT-29) ............................................. 84
xii
4.6.1.4 Human ovarian carcinoma cell line (SKOV-3) ....................................... 87
4.6.1.5 Human hormone-independent breast carcinoma cell line (MDA-MB231) ..
.............................................................................................................. 90
4.6.1.6 Discussions ............................................................................................ 92
4.6.2. Screening for cytotoxic activity of P. macrocarpa seeds ......................... 98
4.6.2.1 Human cervical carcinoma cell line (Ca Ski).......................................... 98
4.6.2.2 Human hormone-dependent breast carcinoma cell line (MCF-7) ............ 98
4.6.2.3 Human colon carcinoma cell line (HT-29) ........................................... 101
4.6.2.4 Human ovarian carcinoma cell line (SKOV-3) ..................................... 104
4.6.2.5 Human hormone-independentFigure 4.77
breast carcinoma cell line (MDA-MB231) ..............................................................
............................................................................................................ 107
4.6.2.6 Discussions .......................................................................................... 110
4.7. Cytotoxicity Screening of Bioactive Compounds ......................................... 115
4.7.1. 2, 4’, 6-Trihydroxy-4-methoxy-benzophenone.. ................................... 115
4.7.2. 1-(2, 6-Dihydroxy-4-methoxyphenyl)-2-(4-hydroxyphenyl) ethanone.. 118
4.7.3. (Z)-9, 17-Octadecadienal.. ................................................................... 120
4.8. Apoptosis Studies ........................................................................................ 121
4.8.1. 2, 4', 6-Trihydroxy-4-methoxybenzophenone.. ..................................... 121
4.8.1.1 Inverted and Phase contrast microscopic examination .......................... 121
4.8.1.2 Fluorescence microscopic examination ................................................ 125
4.8.1.3 Annexin V staining assay ..................................................................... 126
4.8.1.4 Cell cycle analysis ............................................................................... 130
4.8.2. 1-(2, 6-Dihydroxy-4-methoxyphenyl)-2-(4-hydroxyphenyl) ethanone.. 134
4.8.2.1 Inverted and Phase contrast microscopic examination .......................... 134
4.8.2.2 Fluorescence microscopic examination ................................................ 137
4.8.2.3 Annexin V staining assay ..................................................................... 138
4.8.2.4 Cell cycle analysis ............................................................................... 142
4.8.3. (Z)-9, 17-Octadecadienal. .................................................................... 145
4.8.3.1 Inverted and Phase contrast microscopic examination .......................... 145
4.8.3.2 Fluorescence microscopic examination ................................................ 148
4.8.3.3 Annexin V staining assay ..................................................................... 149
4.8.3.4 Cell cycle analysis ............................................................................... 154
4.9. General Discussion ...................................................................................... 157
CHAPTER 5: CONCLUSION ............................................................................... 162

xiii
5.1. Conclusion .................................................................................................. 162
5.2. Future work ................................................................................................. 163
REFERENCES ....................................................................................................... 164
LIST OF PUBLICATIONS .................................................................................... 170
LIST OF CONFERENCES AND SEMINARS ...................................................... 171
LIST OF COURSE AND WORKSHOP PARTICIPATIONS.............................. 172
LIST OF APPENDICES ......................................................................................... 173
xiv
LIST OF FIGURES
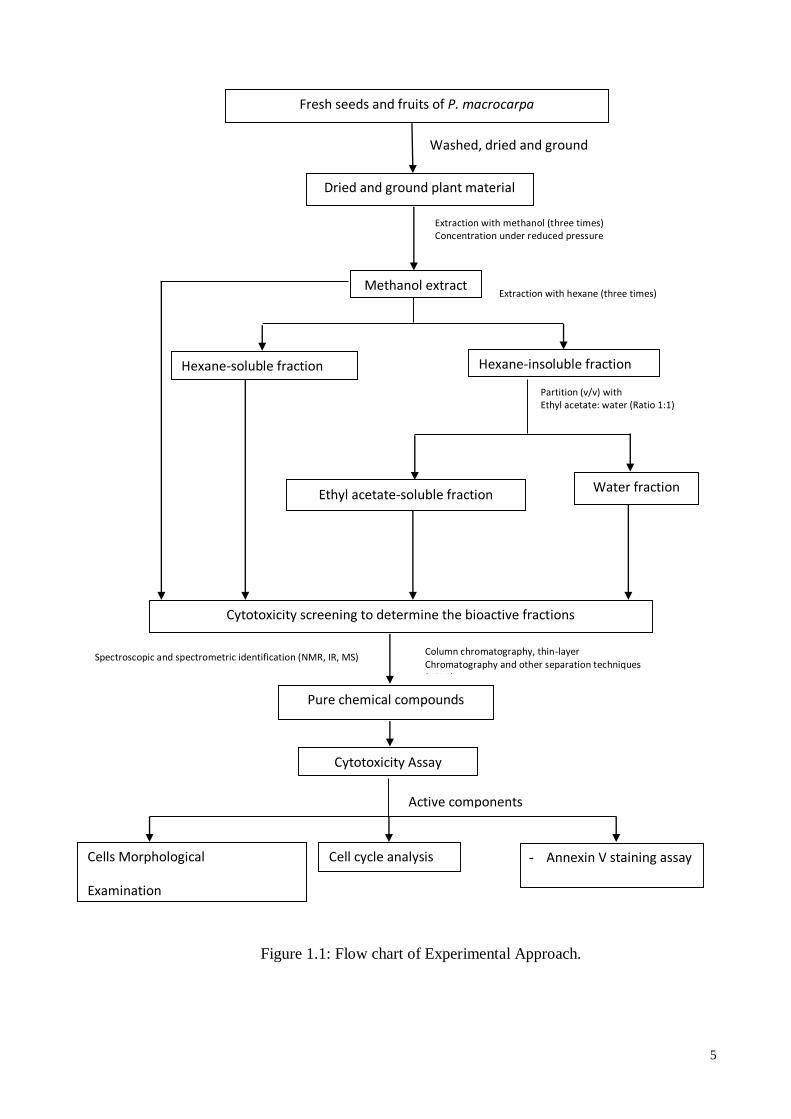
Figure 1.1 Flow chart of Experimental Approach 5
Figure 2.1 The P. macrocarpa (Scheff.) Boerl plant 9
Figure 2.2 The fruit of the P. macrocarpa (Scheff.) Boerl 10
Figure 2.3 The leaves of the P. macrocarpa (Scheff.) Boerl 10
Figure 2.4 The Seeds of P. macrocarpa (Scheff.) Boerl 11
Figure 2.5 Chemical structures of compounds reported present in P.
marcrocarpa
12
Figure 2.6 Chemical structures of compounds reported present in P.
marcrocarpa leaves
15
Figure 2.7 Chemical structures of compounds reported present in P.
macrocarpa seeds
17
Figure 2.8 Chemical structures of compounds reported present in P.
macrocarpa fruit
19
Figure 2.9 Morphological changes of apoptosis 27
Figure 2.10 Apoptotic pathways 28
Figure 2.11 Intrinsic pathway of apoptosis 29
Figure 2.12 Extrinsic Pathway of Apoptosis 30
Figure 2.13 Cell cycle analysis and cell cycle check point control 31
Figure 4.1 Procedure of extraction of P. macrocarpa seeds and fruits 44
Figure 4.2 Column chromatography separation for ethyl acetate fraction of P.
macrocarpa seeds
49
Figure 4.3 Column chromatography separation for ethyl acetate fraction of P.
macrocarpa fruits
56
Figure 4.4 Structure analysis of 2, 4', 6-trihydroxy-4-methoxybenzophenone
in 1H and 13C NMR spectra
64
Figure 4.5 Structure analysis of 2, 4', 6-trihydroxy-4-methoxybenzophenone
in mass spectrum data using gas-chromatography and mass-
spectrometry technique
66
xv
Figure 4.6 Structure analysis of 1-(2, 6-dihydroxy-4-methoxyphenyl)-2-(4-
hydroxyphenyl) ethanone
68
Figure 4.7 Structure analysis of 1-(2, 6-dihydroxy-4-methoxyphenyl)-2-(4-
hydroxyphenyl) ethanone in 1H and 13C NMR spectra
68
Figure 4.8
In vitro, growth inhibition of Ca Ski cells by P. macrocarpa seed
extract and its fractions were determined by neutral red cytotoxitiy
assay.
71
Figure 4.9 In vitro, growth inhibition of MCF-7 cells by P. macrocarpa Boerl
seed extract and its fractions were determined by neutral red
cytotoxicity assay.
72
Figure 4.10 In vitro, growth inhibition of HT-29 cells by P. macrocarpa seed
extract and its fractions were determined by neutral red
cytotoxicity assay.
73
Figure 4.11 In vitro, growth inhibition of A549 cells by P. macrocarpa seed
extract and its fractions were determined by neutral red cytoxicity
assay.
74
Figure 4.12 In vitro, growth inhibition of SKOV-3 cells by P. macrocarpa
seed extract and fractions were determined by neutral red
cytotoxicity assay.
75
Figure 4.13 In vitro, growth inhibition of MRC-5 cells by P. macrocarpa seed
extract and fractions were determined by neutral red cytotoxicity
assay.
76
Figure 4.14 In vitro, growth inhibitions of Ca Ski cells by seeds of P.
macrocarpa methanol extract determined by MTT assay
81
Figure 4.15 In vitro, growth inhibition of Ca Ski cells by the chloroform
extract of the P. macrocarpa seeds determined by MTT assay
81
Figure 4.16 In vitro, growth inhibitions of MCF-7 cells by methanol extract of
P. macrocarpa seeds determined by MTT assay.
83
Figure 4.17 In vitro, growth inhibition of MCF-7 cells by hexane fraction of P.
macrocarpa seeds determined by MTT assay.
83
Figure 4.18 In vitro, growth inhibition of MCF-7 cells by chloroform fraction
of P. macrocarpa seeds determined by MTT assay.
84
Figure 4.19 In vitro, growth inhibition of MCF-7 cells ethyl acetate fraction of
P. macrocarpa seeds determined by MTT assay.
84
xvi
Figure 4.20 In vitro, growth inhibition of HT-29 cells by methanol extract of
P. macrocarpa seeds determined by MTT assay.
85
Figure 4.21 In vitro, growth inhibition of HT-29 cells by ethyl acetate extract
of P. macrocarpa seeds determined by MTT assay.
86
Figure 4.22 In vitro, growth inhibition of HT-29 cells by chloroform fraction
of P. macrocarpa seeds determined by MTT assay.
86
Figure 4.23 In vitro, growth inhibition of HT-29 cells by hexane fraction of P.
macrocarpa seeds determined by MTT assay.
87
Figure 4.24 In vitro, growth inhibition of SKOV-3 cells by methanol extract of
P. macrocarpa seeds determined by MTT assay
88
Figure 4.25 In vitro, growth inhibition of SKOV-3 cells by hexane fraction of
P. macrocarpa seeds determined by MTT assay.
89
Figure 4.26 In vitro, growth inhibition of SKOV-3 cells by chloroform extract
of P. macrocarpa seeds determined by MTT assay.
89
Figure 4.27 In vitro, growth inhibition of SKOV-3 cells by ethyl acetate
fraction of P. macrocarpa seeds determined by MTT assay.
90
Figure 4.28 In vitro, growth inhibition of MDA-MB231 cells by ethyl acetate
fraction of P. macrocarpa seeds determined by MTT assay.
92
Figure 4.29 In vitro, cytotoxic effects of methanol extract and its fractions of
P. macrocarpa seeds on Ca Ski cervical cancer cells line. Cells
were treated with various concentrations of extract and all
fractions for 24h, 48h and 72h prior to the determination of
cytotoxicity by MTT cell proliferation assay.
95
Figure 4.30 In vitro, cytotoxic effects of methanol extract and its fraction of P.
macrocarpa seeds on MCF-7 breast cancer cells line. Cells were
treated with various concentrations of extract and all fractions for
24h, 48h and 72h prior to the determination of cytotoxicity by
MTT cell proliferation assay.
95
Figure 4.31 In vitro, cytotoxic effects of methanol extract and its fractions of
P. macrocarpa seeds on HT29 colon cancer cells line. Cells were
treated with various concerntrations of extract and all fractions for
24h, 48h and 72h prior to the determination of cytotoxicity by
using MTT cell proliferation assay.
96
Figure 4.32 In vitro, cytotoxic effects of methanol extract and its fractions of
P. macrocarpa seeds on SKOV-3 ovarian cancer cells line. Cells
were treated with various concentrations of extract and all
96
xvii
fractions for 24h, 48h and 72h prior to the determination of
cytotoxicity by using MTT cell proliferation assay.
Figure 4.33 In vitro, cytotoxic effects of methanol extract and its fractions of
P. macrocarpa seeds on MDA-MB231 breast cancer cells line.
Cells were treated with various concentrations of extract and all
fractions for 24h, 48h and 72h prior to the determination of
cytotoxicity by using MTT cell proliferation assay.
97
Figure 4.34 In vitro, growth inhibition of MCF-7 cells by methanol extract of
P. macrocarpa fruit determined by MTT assay.
99
Figure 4.35 In vitro, growth inhibition of MCF-7 cells by hexane fraction of P.
macrocarpa fruit determined by MTT assay.
100
Figure 4.36 In vitro growth inhibition of MCF-7 cells by chloroform fraction
of P. macrocarpa fruit determined by MTT assay.
100
Figure 4.37 In vitro, growth inhibition of MCF-7 cells by ethyl acetate fraction
of P. macrocarpa fruit determined by MTT assay.
101
Figure 4.38 In vitro, growth inhibition of HT-29 cells by methanol extract of
P. macrocarpa fruit determined by MTT assay.
102
Figure 4.39 In vitro, growth inhibition of HT-29 cells by hexane fraction of P.
macrocarpa fruit determined by MTT assay.
103
Figure 4.40 In vitro, growth inhibition of HT-29 cells by chloroform fraction
of P. macrocarpa fruit determined by MTT assay.
103
Figure 4.41 In vitro, growth inhibition of HT-29 cells by ethyl acetate fraction
of P. macrocarpa fruit determined by MTT assay.
104
Figure 4.42 In vitro, growth inhibition of SKOV-3 cells by methanol extract of
P. macrocarpa fruit determined by MTT assay.
105
Figure 4.43 In vitro, growth inhibition of HT-29 cells by chloroform fraction
of P. macrocarpa fruit determined by MTT assay.
105
Figure 4.44 In vitro, growth inhibition of SKOV-3 cells by chloroform fraction
of P. macrocarpa fruit determined by MTT assay.
106
Figure 4.45 In vitro, growth inhibition of SKOV-3 cells by ethyl acetate
fraction of P. macrocarpa fruit determined by MTT assay.
106
Figure 4.46 In vitro, growth inhibition of MDA-MB231 cells by methanol
extract of P. macrocarpa fruit determined by MTT assay.
108
xviii
Figure 4.47 In vitro, growth inhibition of MDA-MB231 cells by hexane
fraction of P. macrocarpa fruit determined by MTT assay.
108
Figure 4.48 In vitro, growth inhibition of MDA-MB231 cells by chloroform
fraction of P. macrocarpa fruit determined by MTT assay.
109
Figure 4.49 In vitro, growth inhibition of MDA-MB231 cells by ethyl acetate
fraction of P. macrocarpa fruit determined by MTT assay.
109
Figure 4.50 In vitro, cytotoxic effects of the methanolic extract, ethyl acetate
fraction, hexane fraction, chloroform fraction and water fraction of
P. macrocarpa fruit on MCF-7 breast cancer cell line. Cells were
treated with various concentrations of the extract and all fractions
for 24h, 48h and 72h prior to determining the cytotoxicity by MTT
cell proliferation assay.
114
Figure 4.51 In vitro, cytotoxic effects of methanolic extract, ethyl acetate
fraction, hexane fraction, chloroform fraction and water fraction of
P. macrocarpa fruit on HT-29 colon cancer cell line. Cells were
treated with various concentrations of extract and all fractions for
24h, 48h and 72h prior to determining the cytotoxicity by MTT
cell proliferation assay.
114
Figure 4.52 In vitro, cytotoxic effects of methanolic extract, ethyl acetate
fraction, hexane fraction, chloroform fraction and water fraction of
P. macrocarpa fruit on SKOV-3 ovarian cancer cell line. Cells
were treated with various concentrations of extract and all
fractions for 24h, 48h and 72h prior to determining the
cytotoxicity by MTT cell proliferation assay.
115
Figure 4.53 In vitro, cytotoxic effects of methanolic extract, ethyl acetate
fraction, hexane fraction, chloroform fraction and water fraction of
P. macrocarpa fruits on MDA-MB231 breast cancer cell line.
Cells were treated with various concentrations of extract and all
fractions for 24h, 48h and 72h prior to determining the
cytotoxicity by MTT cell proliferation assay.
115
Figure 4.54 In vitro, cytotoxic effects of the 2, 4', 6-trihydroxy-4-
methoxybenzophenone on HT-29 colon cancer cells. Cells were
treated with various concentrations of the compound derived from
the ethyl acetate fraction of P. macrocarpa fruit for 24h, 48h and
72h prior to determining the cytotoxicity by MTT cell
proliferation assay.
117
Figure 4.55 In vitro, cytotoxic effects of the 2, 4', 6-Trihydroxy-4-
methoxybenzophenone on normal fibroblast lung cells. Cells were
treated with various concentrations of the compound derived from
117
xix
the ethyl acetate fraction of P. macrocarpa fruit for 24h, 48h and
72h prior to determining the cytotoxicity by MTT cell
proliferation assay.
Figure 4.56 In vitro, cytotoxic effects of 1-(2, 6-Dihydroxy-4-methoxyphenyl)-
2-(4-hydroxyphenyl) ethanone on HT-29 colon cancer cells. Cells
were treated with various concentrations the 1-(2, 6-Dihydroxy-4-
methoxyphenyl)-2-(4-hydroxyphenyl) ethanone compound
derived from the ethyl acetate fraction of the P. macrocarpa fruit
for 24h, 48h and 72h, prior to determining cytotoxicity by MTT
cell proliferation assay.
119
Figure 4.57 In vitro, cytotoxic effects of 1-(2, 6-Dihydroxy-4-methoxyphenyl)-
2-(4-hydroxyphenyl) ethanone on normal fibroblast lung cells.
Cells were treated with various concentrations the 1-(2, 6-
Dihydroxy-4-methoxyphenyl)-2-(4-hydroxyphenyl) ethanone
derived from the ethyl acetate fraction of the P. macrocarpa fruit
for 24h, 48h and 72h, prior to determining cytotoxicity by MTT
cell proliferation assay.
119
Figure 4.58 In vitro, cytotoxic effects of 9, 17-octadecadienal on HT-29 colon
cancer cells. Cells were treated with various concentrations of 9,
17-octadecadienal (z) from ethyl acetate fraction of P. macrocarpa
fruit for 24h, 48h and 72h prior to determining cytotoxicity by
MTT cell proliferation assay.
120
Figure 4.59 In vitro, cytotoxic effects of 9, 17-octadecadienal (z) on normal
fibroblast lung cells. Cells were treated with various
concentrations of 9, 17-octadecadienal (z) from ethyl acetate
fraction of P. macrocarpa fruit for 24h, 48h and 72h prior to
determining cytotoxicity by MTT cell proliferation assay.
121
Figure 4.60 HT-29 cells treated with the compound (30 µg/mL) for 24h, 48h
and 72h were shown to undergo morphological changes typical of
apoptosis. Control or treated cells were observed under inverted
microscope and photographed.
123
Figure 4.61 Treatment with 2, 4', 6-trihydroxy-4-methoxybenzophenone for
24h, 48h and 72h induced morphological changes typical of
apoptosis in HT-29 colon cancer cells. Control or treated cells
were observed under phase contrast microscopy and
photographed.
124
Figure 4.62 Treatment with IC50 value (30 µg/mL) of 2, 4', 6-trihydroxy-4-
methoxybenzophenone for 48h induces morphological changes
typical of apoptosis in HT-29 colon cancer cells. After being
stained with acridine orange and propidium iodide, treated cells
125
xx
were observed under fluorescence microscopy for live cells
stained (green colour), apoptotic cells (orange colour) and necrotic
cells or dead cells (red colour).
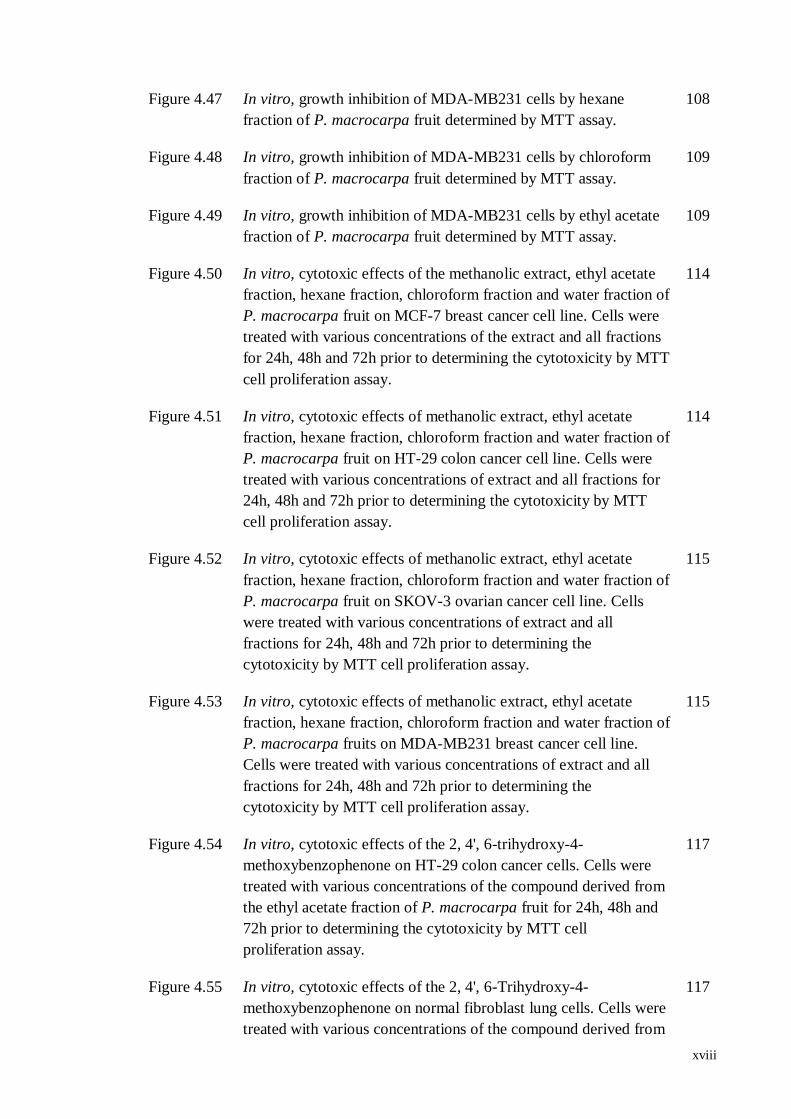
Figure 4.63 Effects of 2, 4', 6-trihydroxy-4-methoxybenzophenone on the
induction of apoptosis in HT-29 cells. The cells were treated with
different concentrations of the compound (25, 50 and 75 µg/mL)
and in a time dependent manner (24h, 48h and 72h), and stained
with PI staining. The viable cells (LL); the early apoptotic cells or
the later apoptotic cells or dead cells or the necrotic cells (UL).
129
Figure 4.64 Histogram representation of the quantitative percentage of viable
cells (LL), early apoptotic cells (LR), primary necrotic cells (UL)
and late apoptotic cells or secondary necrotic cells (UR) of HT-29
treatment with different concentrations of 2, 4', 6-Trihydroxy-4-
methoxybenzophenone for 24h, 48h and 72h.
130
Figure 4.65 : HT-29 cell treated with the IC50 value (30 µg/mL)
concentrations of 2, 4', 6-Trihydroxy-4-methoxybenzophenone for
24h, 48h and 72h, and analyzed by flow cytometry after staining
with PI was conducted. Percentages of the diploid cells (DNA
content) at G0/G1, S, and G2/M phases of HT-29 cells were
determined after 24h, 48h and 72h incubation periods.
132
Figure 4.66 Histogram showing quantitative percentage of diploid cells (DNA
content) in each cell cycle phase without treatment and with
treatment.
132
Figure 4.67 Treatment with 1-(2, 6-dihydroxy-4-methoxyphenyl)-2-(4-
hydroxyphenyl) ethanone for 24h, 48h and 72h induces
morphological changes typical of apoptosis in HT-29 colon cancer
cells. Control or treated cells were observed under inverted
microscope and photographed.
135
Figure 4.68 Treatment with 1-(2, 6-dihydroxy-4-methoxyphenyl)-2-(4-
hydroxyphenyl) ethanone for 24h, 48h and 72h induces
morphological changes typical of apoptosis in HT-29 colon cancer
cells. Control or treated cells were observed under phase contrast
microscope and photographed.
136
Figure 4.69 Treatment with IC50 value of 1-(2, 6-dihydroxy-4-
methoxyphenyl)-2-(4-hydroxyphenyl) ethanone for 48h induces
morphological changes typical of apoptosis in HT-29 colon cancer
cells. After being stained with acridine orange and propidium
iodide, treated cells were observed under fluorescence microscopy
and cells appeared under the imagez of live cells (green colour),
necrotic cells orange colour) and apoptotic cells or death cells (red
colour)..
137
xxi
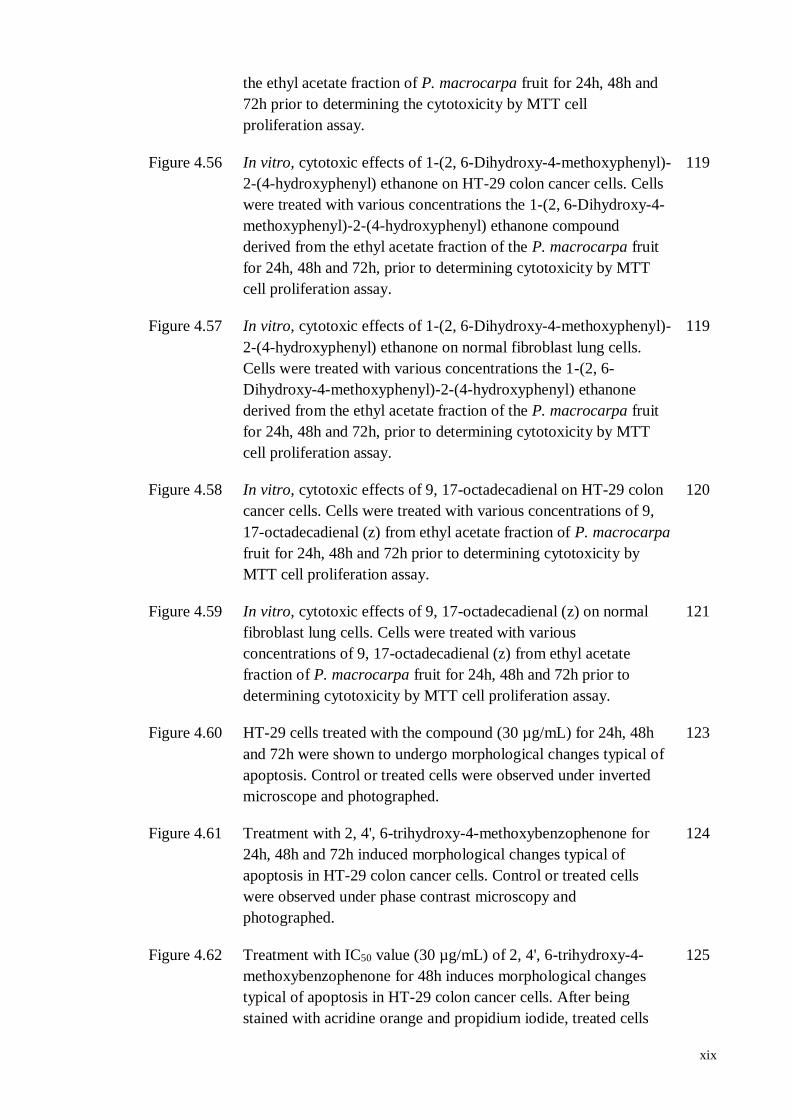
Figure 4.70 Effects of 1-(2, 6-dihydroxy-4-methoxyphenyl)-2-(4-
hydroxyphenyl) ethanone on the induction of apoptosis in HT-29
cells. The cells were treated with different concentration of
compound (25, 50 and 75 µg/mL ) in a time dependent manner
(24h, 48h and 72h), labelled with FITC annexin V and PI. Viable
cells (LL); Early apoptotic cells (LR); Late apoptotic cells or dead
cells (UR); Necrosis (UL).
139
Figure 4.71 Histogram representation of the quantitative percentage of viable
cells (LL), early apoptotic cells (LR), necrotic cells (UL) and late
apoptotic cells (UR) of HT-29 treatment done with different
concentration of 1-(2, 6-dihydroxy-4-methoxyphenyl)-2-(4-
hydroxyphenyl) ethanone (DMHE) for 24h, 48h and 72h.
140
Figure 4.72 Effect of 1-(2, 6-dihydroxy-4-methoxyphenyl)-2-(4-
hydroxyphenyl) ethanone (DMHE) on HT-29 cell cycle. Cells
treated with compound (25μg/mL) for 24h, 48h and 72h, and
analyzed by flow cytometry after staining with PI. Percentages of
the diploid cells (DNA content) at G0/G1, S, and G2/M phases of
HT-29 cells were determined after 24h, 48h and 72h incubation
periods.
143
Figure 4.73 Effects of isolated bioactive 1-(2, 6-dihydroxy-4-methoxyphenyl)-
2-(4-hydroxyphenyl) ethanone compound on the HT-29 cell cycle.
Cells treated with IC50 value of concentrations of compound for
24h, 48h and 72h, and analysed by flow cytometry after staining
with PI. Histogram showing quantitative percentage of DNA
content in each cell cycle phase without treatment and with
treatment.
144
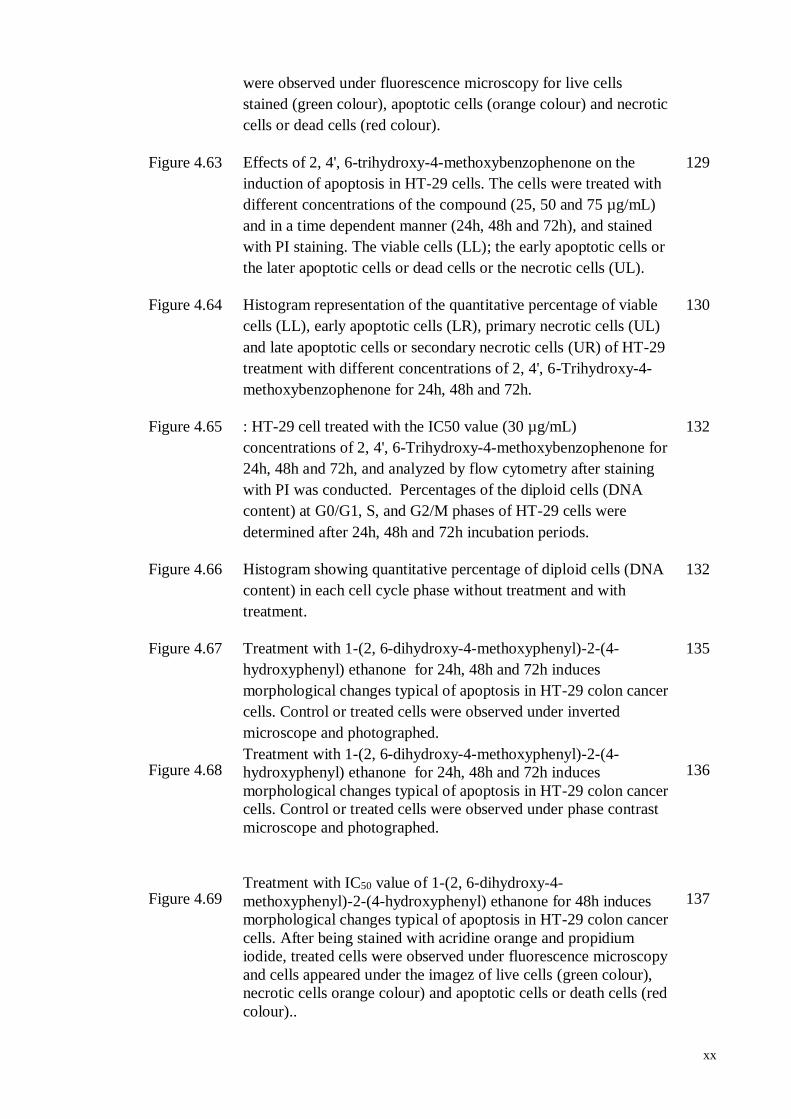
Figure 4.74 Treatment with compound for 24h, 48h and 72h induces
morphological changes that is typical of apoptosis in HT29 colon
cancer cells. Control or treated cells were observed under inverted
microscope and photographed.
146
Figure 4.75 Treatment with compound for 24h, 48h and 72h induces
morphological changes that is typical of apoptosis in HT29 colon
cancer cells. Control or treated cells were observed under phase
contrast microscope and photographed.
147
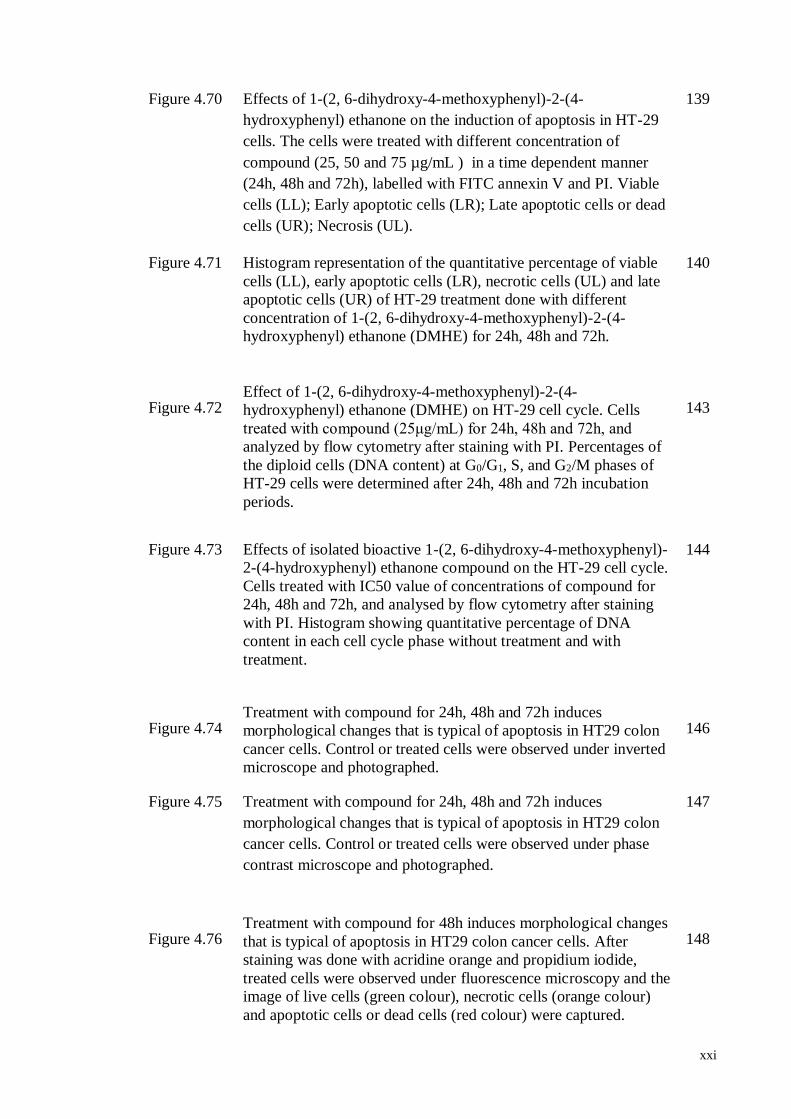
Figure 4.76 Treatment with compound for 48h induces morphological changes
that is typical of apoptosis in HT29 colon cancer cells. After
staining was done with acridine orange and propidium iodide,
treated cells were observed under fluorescence microscopy and the
image of live cells (green colour), necrotic cells (orange colour)
and apoptotic cells or dead cells (red colour) were captured.
148
xxii
Figure 4.77 Effects of 9, 17-octadecadienal on induction of apoptosis in HT29
cells. The cells were treated with different concentrations of
compound (5, 10 and 25 µg/mL ) in a time dependent manner
(24h, 48h and 72h), labelled with FITC Annexin V and PI.
150
Figure 4.78 Histogram representation of the quantitative percentage of viable
cells (LL), early apoptotic cells (LR), necrotic dead cells (UL) and
late apoptotic/secondary necrotic cells (UR) of HT-29 treatment
with different concentration of compound for 24h, 48h and 72h.
151
Figure 4.79 HT-29 cells treated with the concentrations (10 µg/mL) of 9, 17-
octadecadienal for 24h, 48h and 72h, and analysed by flow
cytometry after staining with PI. Percentages of diploid cells
(DNA content) at G0/G1, S, and G2/M phases of HT-29 cells were
determined after 24h, 48h and 72h incubation periods.
155
Figure 4.80 HT-29 cells treated with IC50 value of concentrations of (Z)-9, 17-
Octadecadienal (m/z 264) for 24h, 48h and 72h, and analyzed by
flow cytometry after staining with PI. Histogram showing
quantitative percentage of DNA content in each cell cycle phase
without treatment and with treatment.
156
xxiii
LIST OF TABLES
Table no. Title of Tables Pg. no.
Table 4.1 Yield of extracts and fractions from P. macrocarpa seeds and
fruits
45
Table 4.2 Characterization and Identification of compounds from
hexane fraction of P. macrocarpa seeds using GC-MS
46
Table 4.3 Characterization and Identification of compounds from
chloroform fraction of P. macrocarpa seeds using GC-MS
47
Table 4.4 Characterization and Identification of isolated compounds
from ethyl acetate fraction of P. macrocarpa seeds using
GC-MS
50
Table 4.5 Characterization and Identification of compounds from
hexane fraction of P. macrocarpa fruits using GC-MS
54
Table 4.6 Characterization and Identification of compounds from
chloroform fraction of P. macrocarpa fruits using GC-MS
55
Table 4.7 Characterization and Identification of compounds from ethyl
acetate fraction of P. macrocarpa fruits using GC-MS, NMR
techniques
57
Table 4.8 1H NMR (CDCl3/CD3OD, 400 MHz), 13C NMR
(CDCl3/CD3OD, 100 MHz), HMQC and HMBC Data of 2,
4’, 6-Trihydroxy-4-methoxybenzophenone
65
Table 4.9 IC50 values of the cytotoxic activity of P. macrocarpa seed
extract and its fractions against the Ca Ski cell line
70
Table 4.10 IC50 values of the cytotoxic activity of P. macrocarpa seed
extract and its fractions against the Ca Ski cell line
71
Table 4.11 IC50 values of cytotoxic activity of P. macrocarpa seed
extract and its fractions against the HT-29 cell line
72
xxiv
Table 4.12 IC50 values of cytotoxic activity of P. macrocarpa seed
extract and its fractions against the A549 cell line
74
Table 4.13 IC50 values of cytotoxic activity of P. macrocarpa seed
extract and fractions against the SKOV-3 cell line
75
Table 4.14 IC50 values of cytotoxic activity of the P. macrocarpa seed
extract and fractions against the MRC-5 cell line
76
Table 4.15 IC50 values of Methanol Extract and Fractions of P.
macrocarpa seeds using Neutral Red assay
77
Table 4.16 IC50 values of methanol extract and its fractions of the P.
macrocarpa fruits Neutral Red assay
79
Table 4.17 IC50 values of cytotoxic activity of P. macrocarpa seed
extract and its fractions against the Ca Ski cell line
80
Table 4.18 IC50 values of cytotoxic activity of P. macrocarpa seed
extract and its fractions against the MCF-7 cell line
82
Table 4.19 IC50 values of cytotoxic activity of P. macrocarpa seed
extract and its fractions against the HT-29 cell line
85
Table 4.20 IC50 values of cytotoxic activity of P. macrocarpa seed
extract and its fractions against the SKOV-3 cell line
87
Table 4.21 IC50 values of cytotoxic activity of P. macrocarpa seed
extract and fractions against the MDA-MB231 cell line
91
Table 4.22 In vitro, cytotoxic effects of methanol extract and its
fractions of P. macrocarpa seeds on Ca Ski, MCF-7, HT29,
SKOV3 and MDA-MB231 cancer cells lines. Cells were
treated with various concentrations of the extract and
fractions for 24h, 48h and 72h prior to determine cytotoxicity
by using MTT cell proliferation assay
94
Table 4.23 IC50 values of cytotoxic activity of P. macrocarpa fruit
extract and fractions against the Ca Ski cell line
98
Table 4.24 IC50 values of cytotoxic activity of P. macrocarpa fruit
extract and fractions against the MCF-7 cell line.
99
xxv
Table 4.25 IC50 values of cytotoxic activity of P. macrocarpa fruit
extract and its fractions against the HT-29 cell line
101
Table 4.26 IC50 values of cytotoxic activity of P. macrocarpa fruit
extracts against the SKOV-3 cell line
104
Table 4.27 IC50 values of cytotoxic activity of P. macrocarpa fruit
extract and fractions against the MDA-MB231 cell line
107
Table 4.28 In vitro, cytotoxic effects of methanolic extract, ethyl acetate
fraction, hexane fraction and chloroform fraction of the P.
macrocarpa fruits on Ca Ski, MCF-7, HT-29, SKOV-3 and
MDA-MB231 cancer cell lines and normal human fibroblast
lung cell line MRC-5. The cells were treated with various
concentrations of the extract and all fractions for 24h, 48h
and 72h prior to determining cytotoxicity by the MTT cell
proliferation assay.
113
Table 4.29 Total cells percentage of viable cells (LL), early apoptotic
cells (LR), necrotic dead cells (UL) and late
apoptotic/secondary necrotic cells (UR) of HT-29 treatment
with different concentration of 2, 4', 6-trihydroxy-4-
methoxybenzophenone for 24h, 48h and 72h.
127
Table 4.30 Total cells percentage of viable cells (LL), early apoptotic
cells (LR), necrotic dead cells (UL) and late
apoptotic/secondary necrotic cells (UR) of HT-29 treatment
with different concentration of 1-(2, 6-dihydroxy-4-
methoxyphenyl)-2-(4-hydroxyphenyl) ethanone for 24h,
48h and 72h.
141
Table 4.31 Total cells percentage of viable cells (LL), early apoptotic
cells (LR), necrotic dead cells (UL) and late
apoptotic/secondary necrotic cells (UR) of HT-29 treatment
with different concentration of 9, 17-octadecadienal for 24h,
48h and 72h.
152
xxvi
LIST OF APPENDIANCES
Appendix 1 Ion chromatogram of gas chromatography- mass spectrometry
(GC-MS) analysis of hexane fraction of P.macrocarpa seeds
174
Appendix 2 Ion chromatogram of gas chromatography- mass spectrometry
(GC-MS) analysis of hexane fraction of P.macrocarpa seeds
175
Appendix 3 Ion chromatogram of gas chromatography- mass spectrometry
(GC-MS) analysis of palmitic acid
176
Appendix 4 Mass- spectrum of gas chromatography- mass spectrometry (GC-
MS) analysis of isolated palmitic acid
177
Appendix 5 Ion chromatogram of gas chromatography- mass spectrometry
(GC-MS) analysis of β-sitosterol
178
Appendix 6 Mass- spectrum of gas chromatography- mass spectrometry (GC-
MS) analysis of β-sitosterol
179
Appendix 7 Ion Chromatogram of gas chromatography- mass spectrometry
(GC-MS) analysis of 9, 17-Octadecadienal (Z)
180
Appendix 8 Mass- spectrum of gas chromatography- mass spectrometry (GC-
MS) analysis of 9, 17-Octadecadienal (Z)-
181
Appendix 9 Appendix 9:Ion chromatogram obtained from proton- NMR (1H)
analysis of isolated 9,17-Octadecadienal (Z)-
182
Appendix 10 Ion chromatogram of gas chromatography- mass spectrometry
(GC-MS) analysis of 2, 4', 6-trihydroxy-4-
methoxybenzophenone (or) 2, 6-dihydroxy-4-methoxyphenyl 4-
hydroxyphenyl methanone
183
Appendix 11 Mass- spectrum of gas chromatography- mass spectrometry (GC-
MS) analysis of 2, 4', 6-trihydroxy-4-methoxybenzophenone (or)
2, 6-dihydroxy-4-methoxyphenyl 4-hydroxyphenyl methanone
184
xxvii
Appendix 12 Ion chromatogram obtained from proton- NMR (1H) analysis of
2, 4', 6-trihydroxy-4-methoxybenzophenone (or) 2, 6-dihydroxy-
4-methoxyphenyl 4-hydroxyphenyl methanone
185
Appendix 13 13C-NMR analysis of 2, 4', 6-trihydroxy-4-
methoxybenzophenone (or) 2, 6-dihydroxy-4-methoxyphenyl 4-
hydroxyphenyl methanone
186
Appendix 14 HMBC analysis of 2, 4', 6-trihydroxy-4-methoxybenzophenone
(or) 2, 6-dihydroxy-4-methoxyphenyl 4-hydroxyphenyl
methanone
187
Appendix 15 HMQC analysis of 2, 4', 6-trihydroxy-4-methoxybenzophenone
(or) 2, 6-dihydroxy-4-methoxyphenyl 4-hydroxyphenyl
methanone
188
Appendix 16 Ion chromatogram of gas chromatography- mass spectrometry
(GC-MS) analysis of 1-(2, 6-dihydroxy-4-methoxyphenyl)-2-(4-
hydroxyphenyl) ethanone
189
Appendix 17 Mass spectrum of gas chromatography- mass spectrometry (GC-
MS) analysis of 1-(2, 6-dihydroxy-4-methoxyphenyl)-2-(4-
hydroxyphenyl) ethanon
190
xxviii
LIST OF SYMBOLS AND ABBREVIATIONS
α Alpha
AR Analytical reagent
ATCC American Tissue Culture Collection
A549 Human Lung Carcinoma Cell line
β Beta
CO2 Carbon dioxide
cm centimeter
COSY Correlation spectroscopy
13C Carbon-13
C Carbon
oC Degree Celsius
CDCL3 Deutirium chloroform
DEPT Distortionless Enhancement by Polarization Transfer
DMSO Dimethyl sulfoxide
DAB 3,3'-Diaminobenzidine
DNA deoxyribonucleic acid
EDTA Ethylene diamine tetra acetic acid
ELISA Enzyme-linked immunosorbent assay
ETOAc Ethyl acetate
(EI) electron ionization
FBS Foetal Bovine Serum
FME Methanolic extract of fruits
FHF Hexane fraction of fruits
FCF Chloroform fraction of fruits
xxix
FEAF Ethyl acetate fraction of fruits
FWF Water fraction of fruits
GC-MS Gas chromatography mass spectrum
g gram
> Greater than
HEPES N-2-Hydroxylethyl-Piperazine-N-2-Ethane-Sulfonoc
hr or h Hour
HCl Hydrochloric acid
HMBC Heteronuclear multiple bond coherence
1H Proton-1
HMQC Heteronuclear multiple quantum coherence
H Hydrogen
H2O Water
(HPLC) High Performance Liquid Chromatography
IC50 50% Inhibitory concentration
kg kilogram
< Less than
L Litre
LC-MS/MS Liquid Chromatography-Mass Spectrophotometry
µ Micro
µg Microgram
µg/ml Microgram per mililitre
µl Microlitre
µM Micromolar
mg miligram
xxx
mg/mL Milligram per mililitre
ml Mililitre
mm Milimetre
MCF-7 Hormone-dependent breast carcinoma cell line
MRC-5 Non-cancer human fibroblast cell line
min minute
MHz Megahertz
MS Mass Spectrometry
MTT 3, 4, 5-dimethylthiazol-2-yl)-2-5-diphenyltetrazolium bromide
NOESY Nuclear overhause effect spectroscopy
NMR Nuclear magnetic resonance
nm nanomiter
PBS phosphate buffered saline
P. macrocarpa Phaleria macrocarpa (Scheff.) Boerl
rpm Revolutions per minute
RNase Ribonuclease
PVDF polyvinylidene difluoride
PUMA p53 up-regulated modulator of apoptosis
S.D Standard deviation
SDS PAGE Sodium dodecyl sulfate polyacrylamide gel electrophoresis
SI selectivity index
SMF Methanolic extract of seeds
SHF Hexane fraction of seeds
SCF Chloroform fraction of seeds
SEAF Ethyl acetate fraction of seeds

xxxi
SWF Water fraction of seeds
t time
TLC Thin layered chromatography
% Percent
± Plus-minus
1
CHAPTER 1
INTRODUCTION
Today, herbal medicine plays a prominent role in our health and it has become
almost as essential as modern medicine. However, traditional herbal medicine has not
been standardized in its usage mainly because it has not been very much explored. Herbal
medicine is a traditional form of treatment performed by locals who gather raw
ingredients from one or more plants and apply them as therapeutic treatments or as
medication.
Moreover, herbal medicine has contributed enormously to human healthcare and
this has been increasingly acknowledged in medical practice for generations (Farnsworth
et al., 1985). An estimate by the World Health Organization (WHO) indicated that up to
80% of the world’s population still relied on traditional herbal medicine as their primary
source of healthcare. Traditional herbal medicine has been used to maintain and promote
human health, as well as to prevent or reduce symptomatic disorders and to date herbal
medicine has made great contributions to healthcare in general.
Furthermore, herbal medicine has played a key role in the world’s pharmaceutical
products companies. Therefore, it follows that there is a high demand for natural or herbal
medicine in the global market. Approximately 10,000 plants have been listed as medicinal
plants but only 300 species are used commercially in traditional medicine. Several
researchers are currently investigating their values scientifically in order to study their
medicinal properties. In the current research, several classifications have been
implemented in order to define and classify herbal medicine.
Indonesia has an abundance of natural resources and one of its most important
features has always been its abundant plant life (Jemal et al., 2007). Traditional herbal
medicine has been used by the Indonesian society since ancient times where knowledge
2
has been passed down from generation to generation. Traditional herbal medicine has
been a cultural mainstay in Indonesia for a good many centuries as it is believed to help
locals maintain their health as well as to treat diseases. Despite the increasing awareness
of modern medical treatments, traditional herbal medicine still remains as a popular
choice in Indonesia.
In this study, the focus was on a plant known as Phaleria macrocarpa which is
renowned in Indonesia for its ability to treat a variety of ailments including cancer,
diabetes mellitus, allergies, cardiac problems, hepatic diseases, kidney failure,
hypertension, skin diseases, and many others (Harmanto et al., 2002; Jemal et al., 2007).
The fruits and leaves of the P. macrocarpa are most commonly consumed in traditional
medicine when mixed with other medicinal plants. Its seeds, however, are very toxic and
they produce an unpleasant smell. It is, however, used in Indonesia to treat skin diseases.
The fruits and leaves of the Phaleria macrocarpa contain alkaloids, saponins,
flavonoids, polyphenols, triterpenoids and many other components. The seeds on the
other hand contain alkaloids, triterpenoids and coumarin groups (Hartani et al., 2005) as
well as steroids (Susanthy et al., 2005). The major flavanoids present in the pericarp are
kaempferol, myricetin, naringin and rutin and those found in the seeds and mesocarps are
naringin and quercetin (Rudi et al., 2011). Ethyl acetate fractions derived from the flesh
of the fruit contains flavonoids, triterpenoids and coumarin groups (Hartati et al., 2005).
The major components of the flavonoids contained in the fruits of P. macrocarpa
have been shown to be useful for blood circulation and in preventing blockages of blood
vessels, the lowering of cholesterol levels, reducing fat collected in blood vessel walls,
and also in lowering the risk of coronary heart disease. They also contain anti-
inflammatory agents and antioxidants, and help alleviate pain if there is bleeding or
swelling. It is believed that the flesh of the P. macrocarpa (Mahkota Dewa) fruit contains
anti-oxidative compounds that can fight cancer.
3
In addition, a powder derived from the dried flesh of the P. macrocarpa fruits has
been used for medicinal purposes where it was reported to remedy dysentery, diabetes
mellitus, hypertension, cancer and certain skin diseases (Harmanto et al., 2002). The fruit
of the P. macrocarpa is potent in treating hypertension, diabetes, cancer and diuretic
problems. It has a long history of pharmacological usage, and the lack of information
about its biological activities has led to ongoing investigations (Hendra et al., 2011).
Consumption of P. macrocarpa has a synergistic effect on Adriamycin-
cyclophosphamide treatment in decreasing the tumour growth and protects the kidney and
liver from damage (Chong S.C al., 2011). Moreover, P. macrocarpa extract has been
shown to reduce body weight, cholesterol, triglycerides and HDL LDL levels (Riwanto
et al., 2011).
The antibacterial, radical scavenging activities and cytotoxic properties of crude
extracts from P. macrocarpa leaves have been reported by Andriani et al., (2011). Among
the important sources of newer chemotherapeutic agents discovered were the chemicals
derived from such herbal sources. Also, the use of complementary and alternative
medicine such as botanical extracts is becoming increasingly popular among cancer
patients (Harmanto, 2003 & Nahleh, 2003) while a number of phytochemicals have been
proven to possess anticancer properties (Wong et al., 2005).
With the various potential benefits reported for P. macrocarpa, the present study
therefore was performed with the following main objectives:
1. To examine the cytotoxicity of extracts and fractions from the fruits and seeds of
P. macrocarpa in selected human cancer and non-cancer cell lines;
2. To isolate bioactive compounds from the fruits and seeds of P. macrocarpa;
3. To elucidate the structure(s) of the chemical components of the active extract by
using spectroscopic and spectrometric methods (GC-MS, LC-MS/MS and NMR
analysis);
4
4. To investigate the cytotoxic activity of bioactive compounds isolated from
objectives (2) and (3) by determining the effects of the compounds on human
colon cancer cells (HT-29) and human fibroblast cell line (MRC-5);
5. To identify the molecular pathways of apoptosis effected/involved following
treatment of cancer cell lines (HT-29 and MRC-5) with bioactive compounds
from P. macrocarpa through cell cycle analysis and morphological examination
of cancer cells.
5
Figure 1.1: Flow chart of research proje
Fresh seeds and fruits of P. macrocarpa
Washed, dried and ground
Dried and ground plant material
Extraction with methanol (three times) Concentration under reduced pressure
Methanol extract
Partition (v/v) with Ethyl acetate: water (Ratio 1:1)
Ethyl acetate-soluble fraction Water fraction
Pure chemical compounds
Column chromatography, thin-layer Chromatography and other separation techniques (HPLC)
Spectroscopic and spectrometric identification (NMR, IR, MS)
Extraction with hexane (three times)
Hexane-soluble fraction
Cytotoxicity Assay
Active components
Hexane-insoluble fraction
Cytotoxicity screening to determine the bioactive fractions
Cell cycle analysis Cells Morphological
Examination
- Annexin V staining assay
Figure 1.1: Flow chart of Experimental Approach.
6
CHAPTER 2
LITERATURE REVIEW
2.1. Cancer
Cancer is a major public health problem all over the world. Cancer refers to a
family of diseases in which tissues grow and spread uncontrollably throughout the body,
and can gradually become fatal (Lewis, 2003). Cancer comes in the form of abnormal
cells which multiply in an uncontrolled fashion and it can spread throughout the body.
Such cells can emerge in a variety of tissues and organs, and each of these sites may carry
different cell types that have been or are currently receiving the impact of the disease
(Farnsworth et al., 1985). The net result of this is more than a hundred types of cancer
distinguishable from one another on the basis of their original location and the cell type
that is involved (Farnsworth et al., 1985).
Cancers are caused by multiple factors; namely genetic and environmental factors,
diet and lifestyle factors, which include smoking, alcohol consumption, stress, lack of
exercise and so on. Cancer brings about significant morbidity and mortality and poses a
major public health problem worldwide (Lewis, 2003). The most common types of cancer
are breast and prostate cancers followed by lung, colon, bladder, and lymphoma.
2.2. Carcinogens
The term carcinogen refers to a substance directly involved in causing cancer. A
substance that elevates the risk of cancer, while not directly causing it, is called
carcinogenic. While a great many substances are thought to cause cancer, a substance
may only be called carcinogenic if ample evidence has been found to prove its
carcinogenicity. Carcinogens react with DNA (deoxyribonucleic acid) by inciting deadly
alterations or by causing the rate of cell division to escalate erratically. This alteration in
the regularity of cell division may subsequently increase the probability of intrinsic
7
changes in DNA (Deorukhkar et al., 2007). Evidence of the correlation between exposure
to alleged carcinogens and the advancement of cancer itself is worthy of consideration
(Hanaha et al., 2000). Commonly known carcinogens include certain types of pesticides,
radon, asbestos, arsenic, and cigarette smoke. Ironically, certain substances that are
beneficial such as chlorine (used to disinfect water) may also be carcinogenic where its
by-products have been found to cause a variety of diseases.
It is interesting to note that one of the major known carcinogens emanates from
an element necessary to life itself. The ultraviolet rays produced by the sun are
carcinogenic as exposure to ultraviolet radiation has been found to cause an array of
cancers affecting the skin. A substance cannot be said to be carcinogenic unless there has
been prolonged and sustained human exposure to it. In addition to this, the breath taking
number of substances said to be potential carcinogens is so immense that it has become
increasingly difficult to ascertain exactly what is safe to use and consume.
2.3. Carcinogenesis
The process in which normal, healthy cells are mutated into cancer cells and thus
contribute to the likely onset of cancer is known as carcinogenesis. Despite modern
advances in cancer treatment as well as the increasing knowledge of its mechanisms, there
is still a gap in understanding the molecular events preceding it. Twenty five years of
scientific advancement in cancer research has resulted in a varied and detailed body of
knowledge, where this deadly disease has been revealed to be the culmination of a number
of dynamic alterations in the genome itself (Deorukhkar et al., 2007).
Although carcinogenesis involves a complex interplay between genes, the
environment and multiple cumulative mutational events are required for the progression
from normal to a fully malignant phenotype. The quintessential traits of cancer cells are
fundamental alterations in cell physiology that collectively dictate malignant growth
(Hanaha et al., 2000).
8
2.4. Natural Products
Natural products are derived from organic matters such as animals, plants, or
microbes, and their pharmacological and biological potentials can be used to treat
diseases. Natural products derived from plants in particular, have formed the very
foundations of traditional medicine in many of the great civilizations of old, including
Egypt, China, and India (Balandrin et al., 1993). The World health organization (WHO)
has indicated that herbal medicine is still the primary choice for 80% of the world’s
population.
2.4.1. Bioactive natural products
Each natural product has one or more bioactivity. Some may possess antioxidant,
antimicrobial, antibacterial, antifungal, anti-cancer, anti-hypertensive and anti-diabetic
activities.
2.4.2. Natural products with anticancer activity
The last 20 years has seen great strides in the never-ending battle to eliminate
cancer. Our understanding of the various mechanisms of this disease has been greatly
assisted by advances in cellular and molecular biology. Natural products have greatly
contributed to the development of anti-cancer drugs and vaccines (Cooper. 1993).
Most natural anticancer agents are secondary metabolites produced from one of
the two protection mechanisms of the plant or from organisms which defend it from
pathogens and growth regulations (Kintios & Barberaki, 2004). These metabolites may
constitute a compound cytotoxin or are capable of modulating tumor development
(Kintios & Barberaki, 2004). These are just examples of the various natural compounds
that have been found to have great potential in treating cancer through mechanism-based
approaches which employ bioactive compounds.
9
2.5. Plants
Although medicinal plants can be found worldwide, they are, however, most
abundant in tropical regions. As such, classifying them systematically is important, in
order to understand as well as to study them extensively and efficiently. The Phaleria
macrocarpa (Scheff.) Boerl plant is one such medicinal plant and it originates from Irian
Jaya, Indonesia.
2.6. The P. macrocarpa plant
P. macrocarpa belongs to the Thymelaeceae family and is called Mahkota Dewa
in Indonesia which means 'God's Crown' in the Indonesian language. The name given to
this fruit infers that it came from heaven, as a benediction from divinity to help mankind.
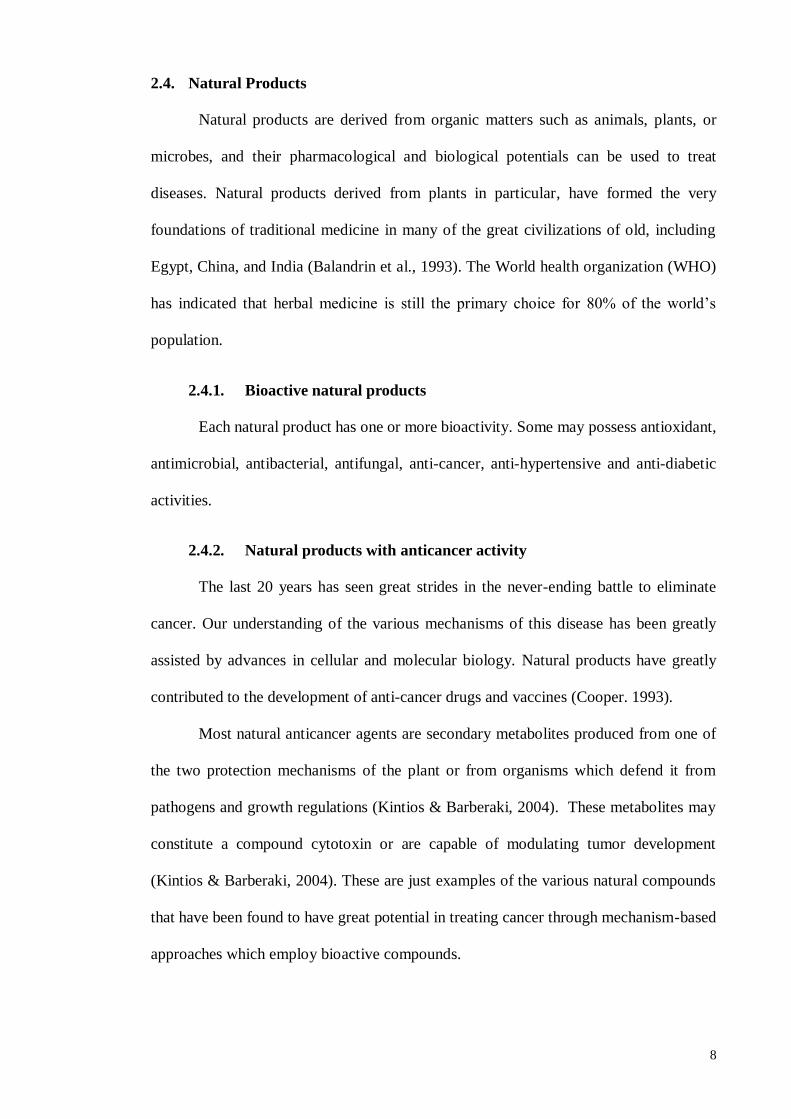
The P. macrocarpa plant is perennial and is usually planted to provide shade. It
is of medium size and its height can reach up to four meters. Its stem is full of sap and
has a greenish brown bark, a white stem, taproots and also, flowers, leaves, fruits and
seeds. Its small flowers are white and have a pleasant smell; physically, it resembles the
clover. Moreover, all parts of the P. macrocarpa, namely the flesh of its fruits, seeds,
leaves and stem, are beneficial components commonly used in herbal medicine.
Figure 2.1: The P. macrocarpa (Scheff.) Boerl plant.
10
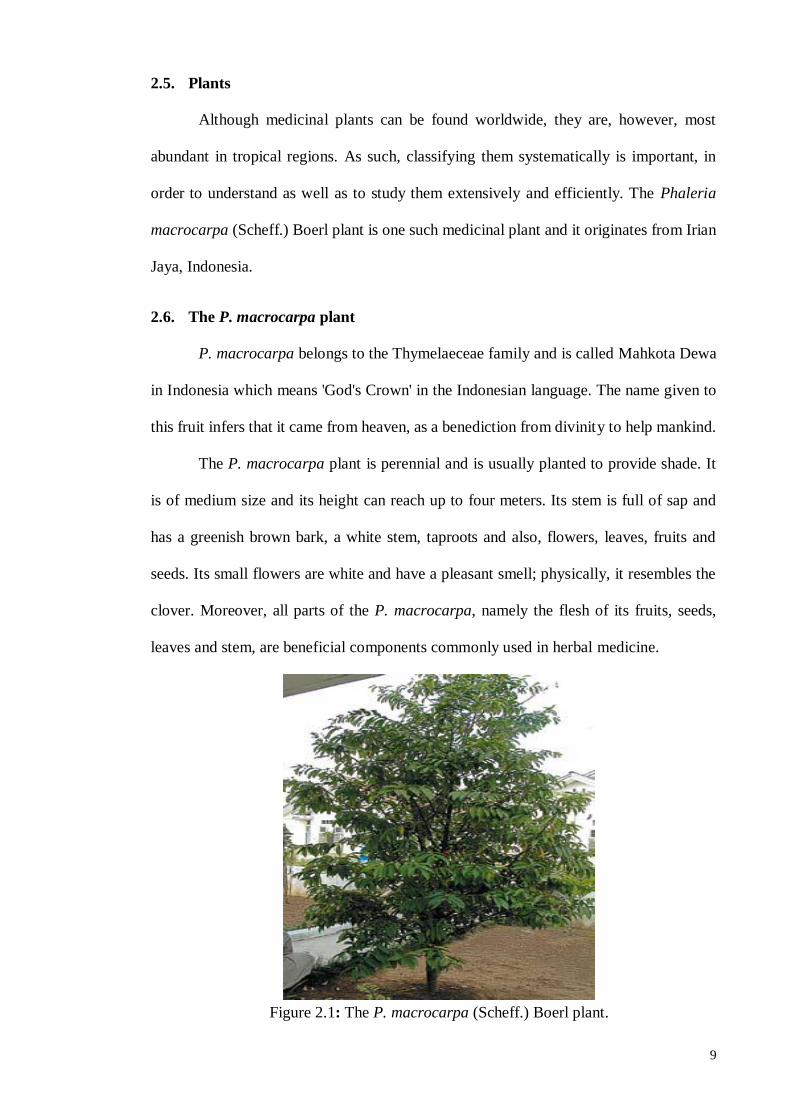
2.6.1. The Fruit of P. macrocarpa
The fruit of the P. macrocarpa consists of a skin which is bright red, flesh, shell
and seeds. It has white flesh, which is fibrous and watery (Figure 2.2). The flesh is round
in shape, of orbicular to apple size (3-5cm), has a smooth surface, and dull green in color
when young but becomes red when ripened. The fruits grow on the trunks and branches
of the trees and has very short stalks making it look like it is attached to the branches.
Figure 2. 2: The fruit of the P. macrocarpa (Scheff.) Boerl
(http://farmasi.ugm.ac.id).
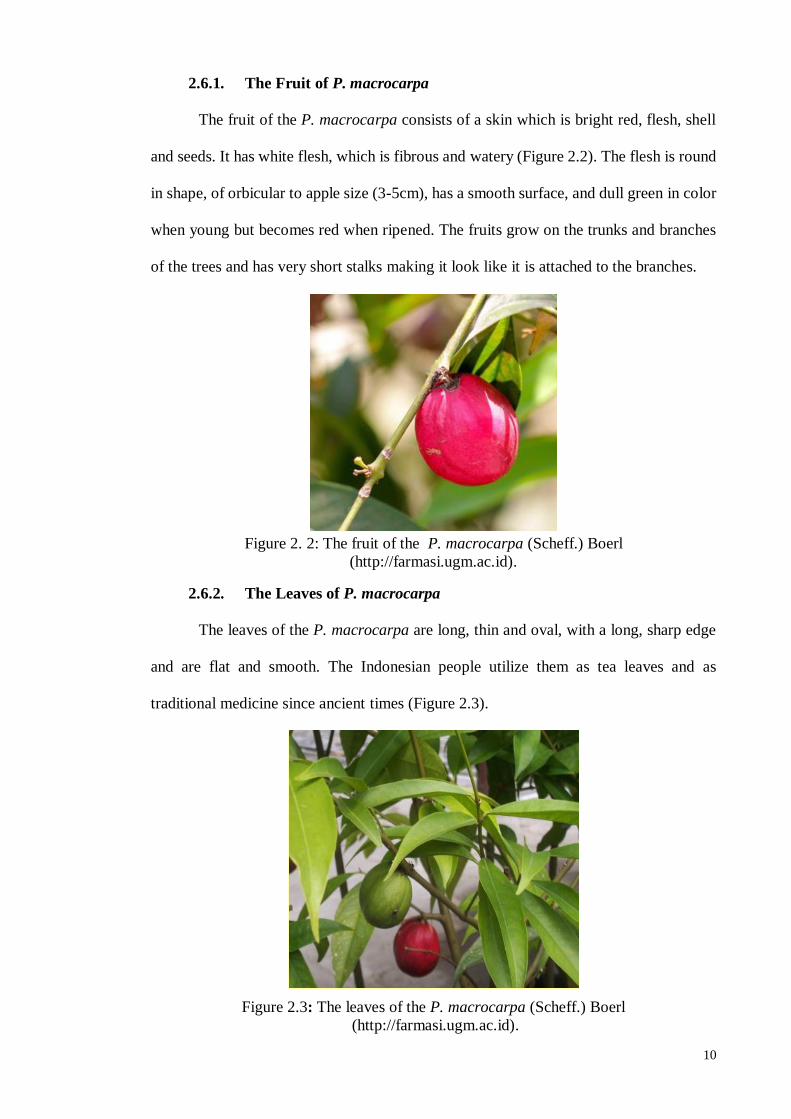
2.6.2. The Leaves of P. macrocarpa
The leaves of the P. macrocarpa are long, thin and oval, with a long, sharp edge
and are flat and smooth. The Indonesian people utilize them as tea leaves and as
traditional medicine since ancient times (Figure 2.3).
Figure 2.3: The leaves of the P. macrocarpa (Scheff.) Boerl
(http://farmasi.ugm.ac.id).
11
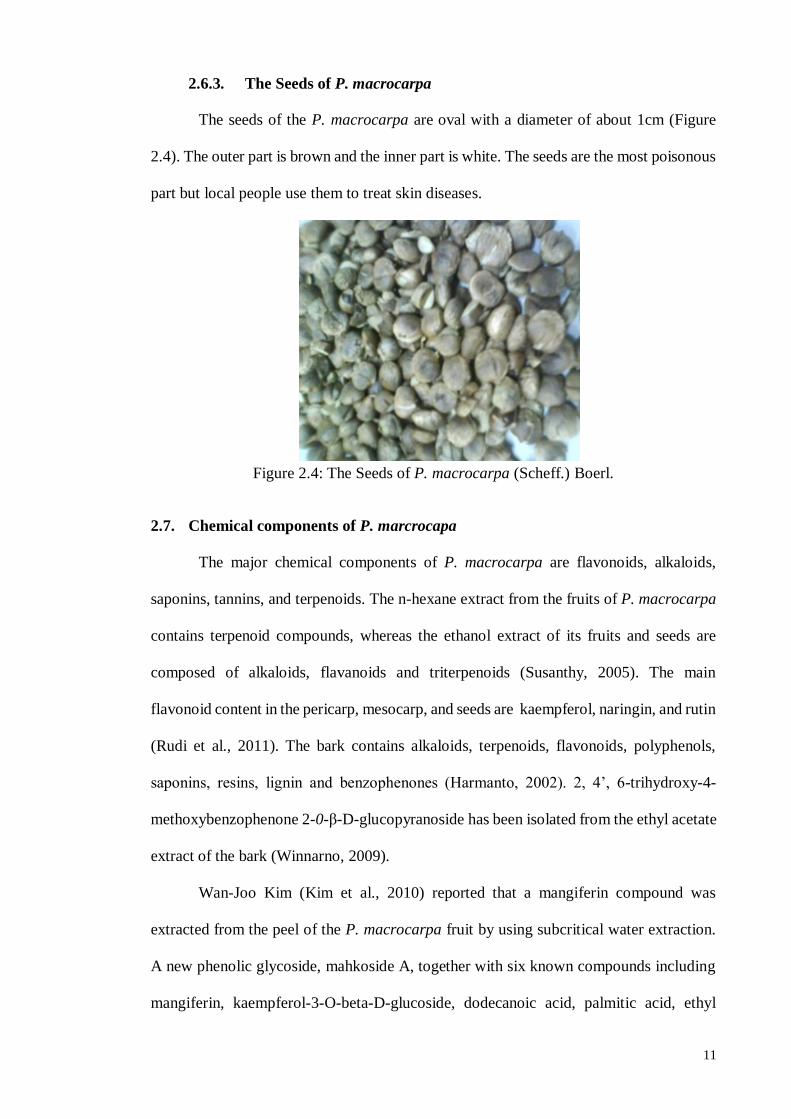
2.6.3. The Seeds of P. macrocarpa
The seeds of the P. macrocarpa are oval with a diameter of about 1cm (Figure
2.4). The outer part is brown and the inner part is white. The seeds are the most poisonous
part but local people use them to treat skin diseases.
Figure 2.4: The Seeds of P. macrocarpa (Scheff.) Boerl.
2.7. Chemical components of P. marcrocapa
The major chemical components of P. macrocarpa are flavonoids, alkaloids,
saponins, tannins, and terpenoids. The n-hexane extract from the fruits of P. macrocarpa
contains terpenoid compounds, whereas the ethanol extract of its fruits and seeds are
composed of alkaloids, flavanoids and triterpenoids (Susanthy, 2005). The main
flavonoid content in the pericarp, mesocarp, and seeds are kaempferol, naringin, and rutin
(Rudi et al., 2011). The bark contains alkaloids, terpenoids, flavonoids, polyphenols,
saponins, resins, lignin and benzophenones (Harmanto, 2002). 2, 4’, 6-trihydroxy-4-
methoxybenzophenone 2-0-β-D-glucopyranoside has been isolated from the ethyl acetate
extract of the bark (Winnarno, 2009).
Wan-Joo Kim (Kim et al., 2010) reported that a mangiferin compound was
extracted from the peel of the P. macrocarpa fruit by using subcritical water extraction.
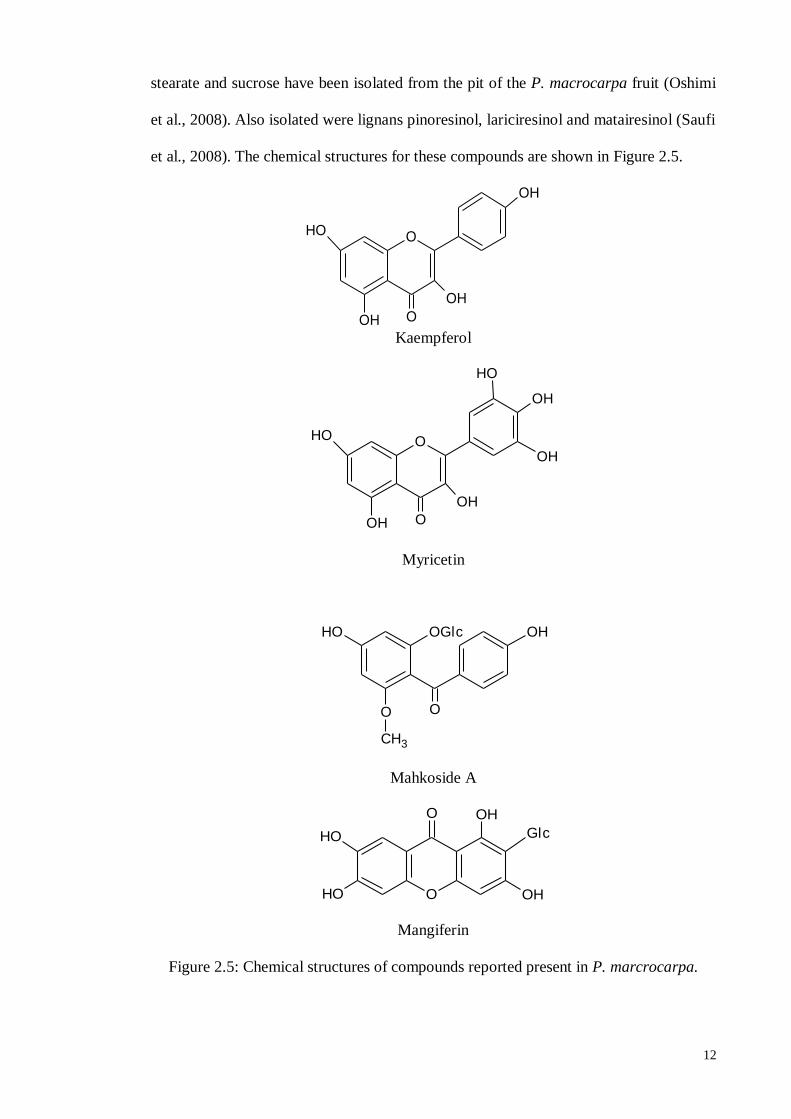
A new phenolic glycoside, mahkoside A, together with six known compounds including
mangiferin, kaempferol-3-O-beta-D-glucoside, dodecanoic acid, palmitic acid, ethyl
12
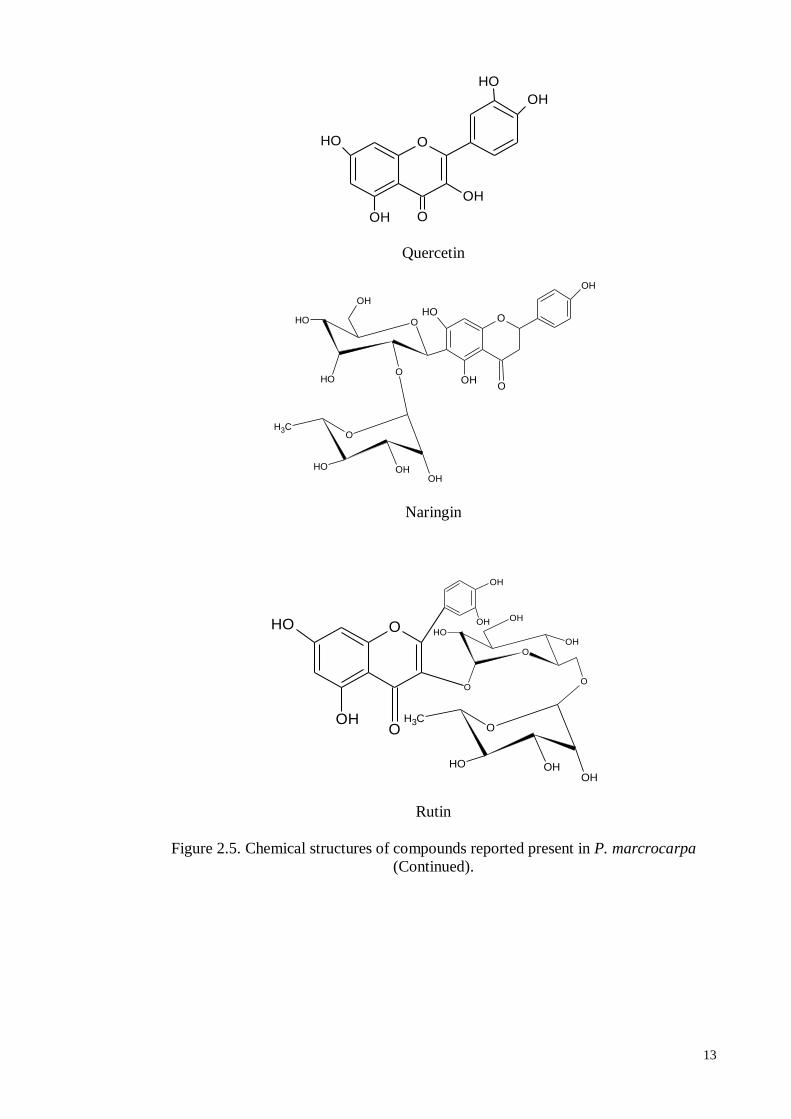
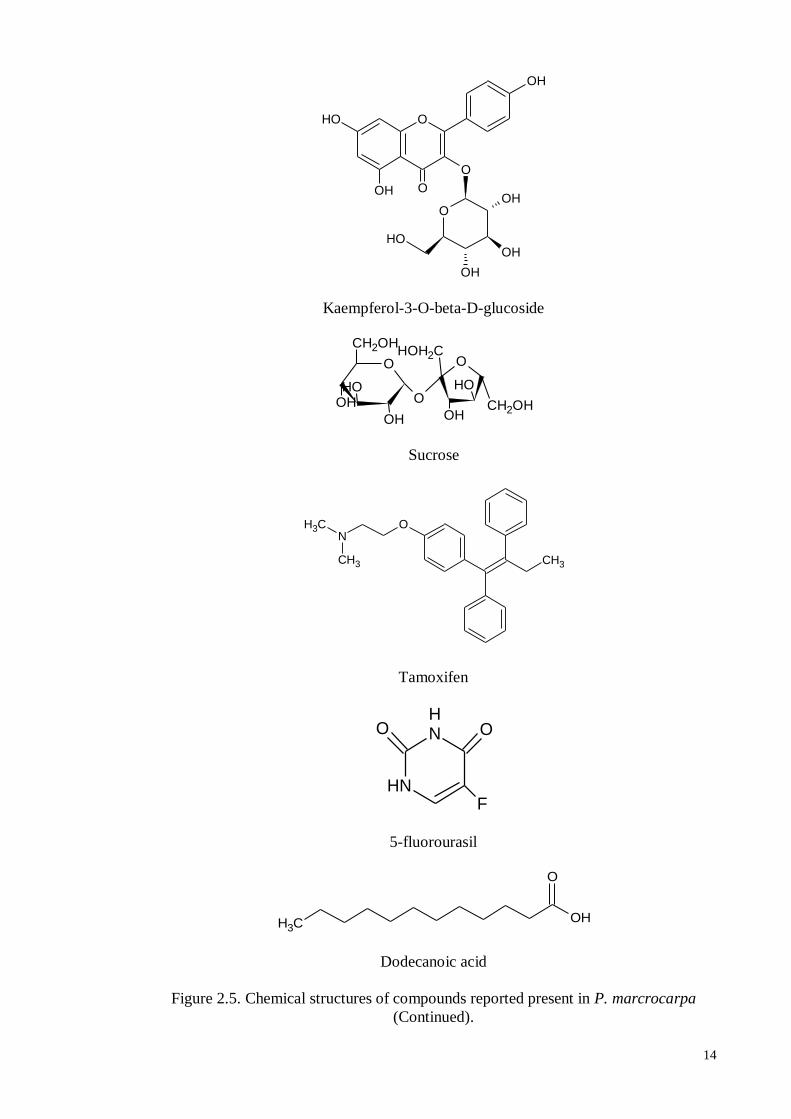
stearate and sucrose have been isolated from the pit of the P. macrocarpa fruit (Oshimi
et al., 2008). Also isolated were lignans pinoresinol, lariciresinol and matairesinol (Saufi
et al., 2008). The chemical structures for these compounds are shown in Figure 2.5.
Kaempferol
Myricetin
Mahkoside A
Mangiferin
Figure 2.5: Chemical structures of compounds reported present in P. marcrocarpa.
O
OH
OH
OOH
OH
OH
OH
OGlc OHOH
O O
CH3
O
O
OH
OH OH
OH
Glc
O
OH
OH
OOH
OH
13
Quercetin
Naringin
Rutin
Figure 2.5. Chemical structures of compounds reported present in P. marcrocarpa
(Continued).
O
OH
OOH
OH
OH
OH
OOH
OHO
OH
OOH
OHO
OH
O
OHOH
OH
CH3
O
O
OH
O
OOH
OH OH
OH
OH
OH
O
O
OHOH
OH
CH3
14
Kaempferol-3-O-beta-D-glucoside
Sucrose
Tamoxifen
5-fluorourasil
Dodecanoic acid
Figure 2.5. Chemical structures of compounds reported present in P. marcrocarpa
(Continued).
O
O
OH O
OH
OOH
OH
OH
OH
OH
O
O
O
OHOH
OH
CH2OHHOH2C
CH2OHOH
OH
CH3
ON
CH3
CH3
NH
NH
OO
F
CH3OH
O
15
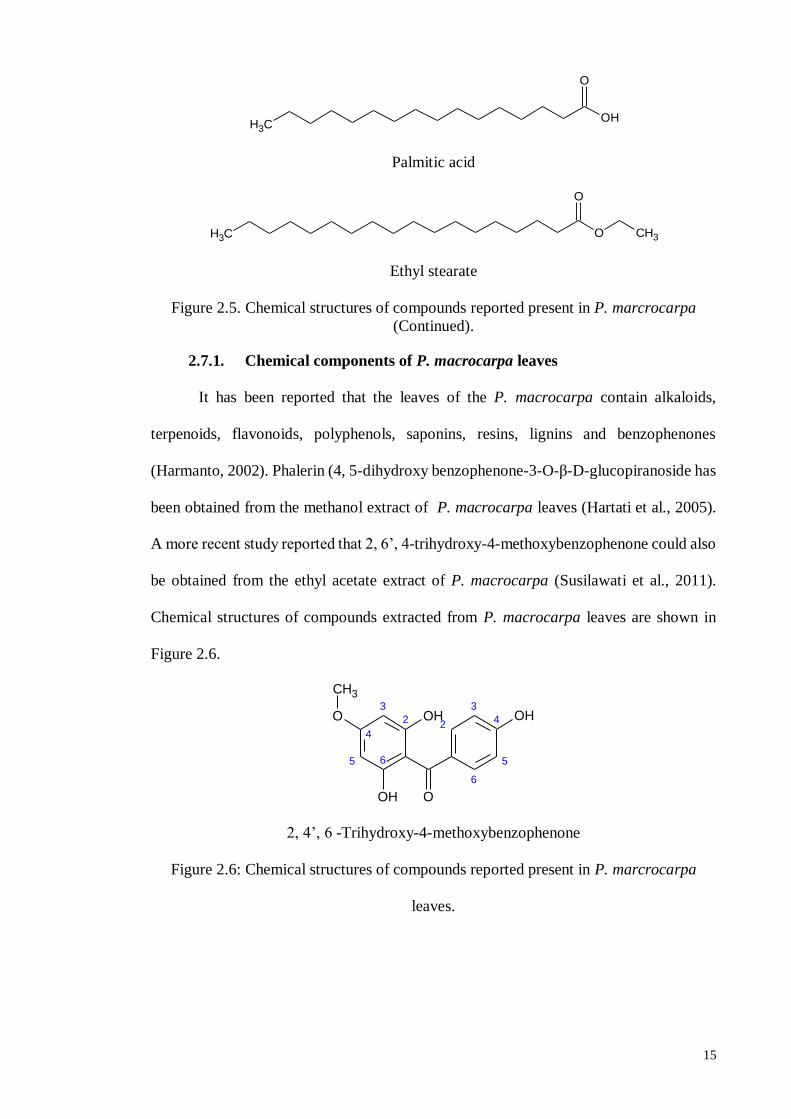
Palmitic acid
Ethyl stearate
Figure 2.5. Chemical structures of compounds reported present in P. marcrocarpa
(Continued).
2.7.1. Chemical components of P. macrocarpa leaves
It has been reported that the leaves of the P. macrocarpa contain alkaloids,
terpenoids, flavonoids, polyphenols, saponins, resins, lignins and benzophenones
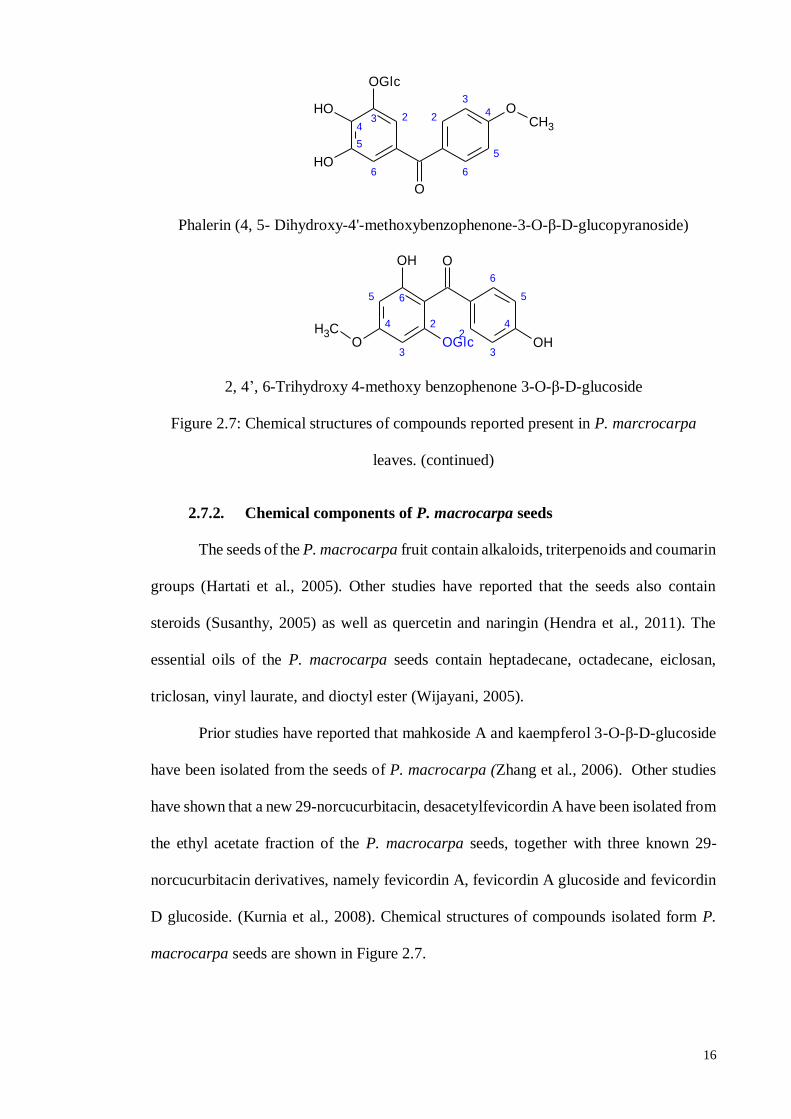
(Harmanto, 2002). Phalerin (4, 5-dihydroxy benzophenone-3-O-β-D-glucopiranoside has
been obtained from the methanol extract of P. macrocarpa leaves (Hartati et al., 2005).
A more recent study reported that 2, 6’, 4-trihydroxy-4-methoxybenzophenone could also
be obtained from the ethyl acetate extract of P. macrocarpa (Susilawati et al., 2011).
Chemical structures of compounds extracted from P. macrocarpa leaves are shown in
Figure 2.6.
2
3
6
4
5
2OH 4
5
3
6
OHO
CH3
OH O
2, 4’, 6 -Trihydroxy-4-methoxybenzophenone
Figure 2.6: Chemical structures of compounds reported present in P. marcrocarpa
leaves.
CH3OH
O
CH3 O CH3
O
16
23
6
4
5
2 4
5
3
6
OH
O
OH
OCH3
OGlc
Phalerin (4, 5- Dihydroxy-4'-methoxybenzophenone-3-O-β-D-glucopyranoside)
2
6
3
5
4
OGlc2
6
5
3
4
OCH3
OH
OOH
2, 4’, 6-Trihydroxy 4-methoxy benzophenone 3-O-β-D-glucoside
Figure 2.7: Chemical structures of compounds reported present in P. marcrocarpa
leaves. (continued)
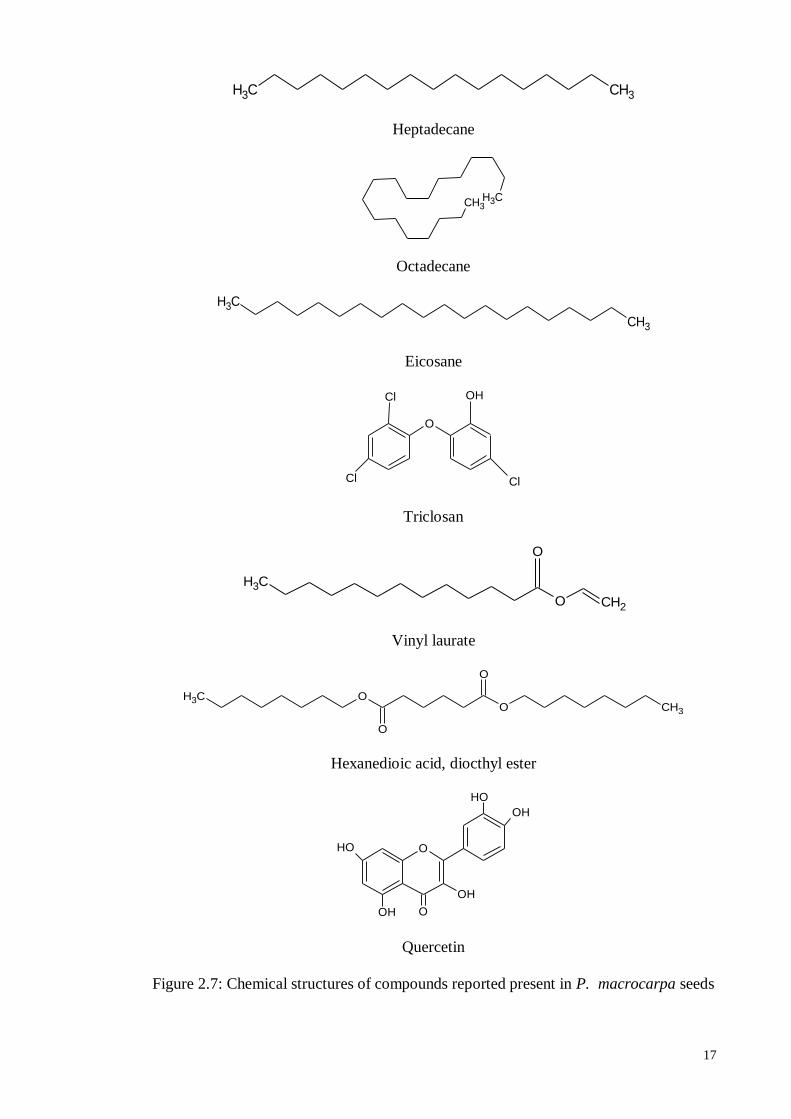
2.7.2. Chemical components of P. macrocarpa seeds
The seeds of the P. macrocarpa fruit contain alkaloids, triterpenoids and coumarin
groups (Hartati et al., 2005). Other studies have reported that the seeds also contain
steroids (Susanthy, 2005) as well as quercetin and naringin (Hendra et al., 2011). The
essential oils of the P. macrocarpa seeds contain heptadecane, octadecane, eiclosan,
triclosan, vinyl laurate, and dioctyl ester (Wijayani, 2005).
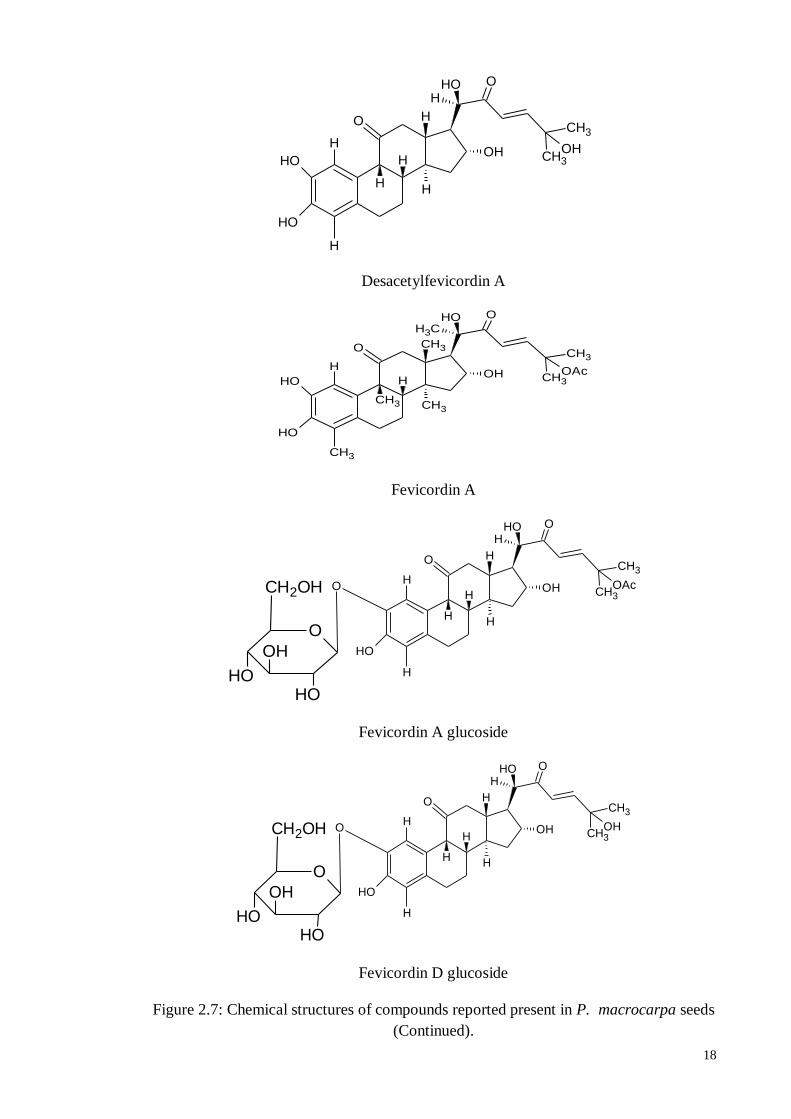
Prior studies have reported that mahkoside A and kaempferol 3-O-β-D-glucoside
have been isolated from the seeds of P. macrocarpa (Zhang et al., 2006). Other studies
have shown that a new 29-norcucurbitacin, desacetylfevicordin A have been isolated from
the ethyl acetate fraction of the P. macrocarpa seeds, together with three known 29-
norcucurbitacin derivatives, namely fevicordin A, fevicordin A glucoside and fevicordin
D glucoside. (Kurnia et al., 2008). Chemical structures of compounds isolated form P.
macrocarpa seeds are shown in Figure 2.7.
17
CH3 CH3
Heptadecane
CH3CH3
Octadecane
Eicosane
Triclosan
Vinyl laurate
CH3 OO
O
O
CH3
Hexanedioic acid, diocthyl ester
Quercetin
Figure 2.7: Chemical structures of compounds reported present in P. macrocarpa seeds
CH3
CH3
O
OHCl
Cl Cl
CH3
O CH2
O
O
OH
OOH
OH
OH
OH
18
Desacetylfevicordin A
Fevicordin A
Fevicordin A glucoside
Fevicordin D glucoside
Figure 2.7: Chemical structures of compounds reported present in P. macrocarpa seeds
(Continued).
CH3
CH3OH
O
H
OH
OH
O
OH
H
H
H
H
H
HOH
CH3
CH3OAc
O
H
OH
OH
O
OH
CH3
CH3
CH3
CH3
H
CH3
OH
CH3
CH3OAc
O
H
OH
O
OH
H
H
H
H
H
HOH
O
O
CH2OH
OH
OHOH
CH3
CH3OH
O
H
OH
O
OH
H
H
H
H
H
HOH
O
O
CH2OH
OH
OHOH
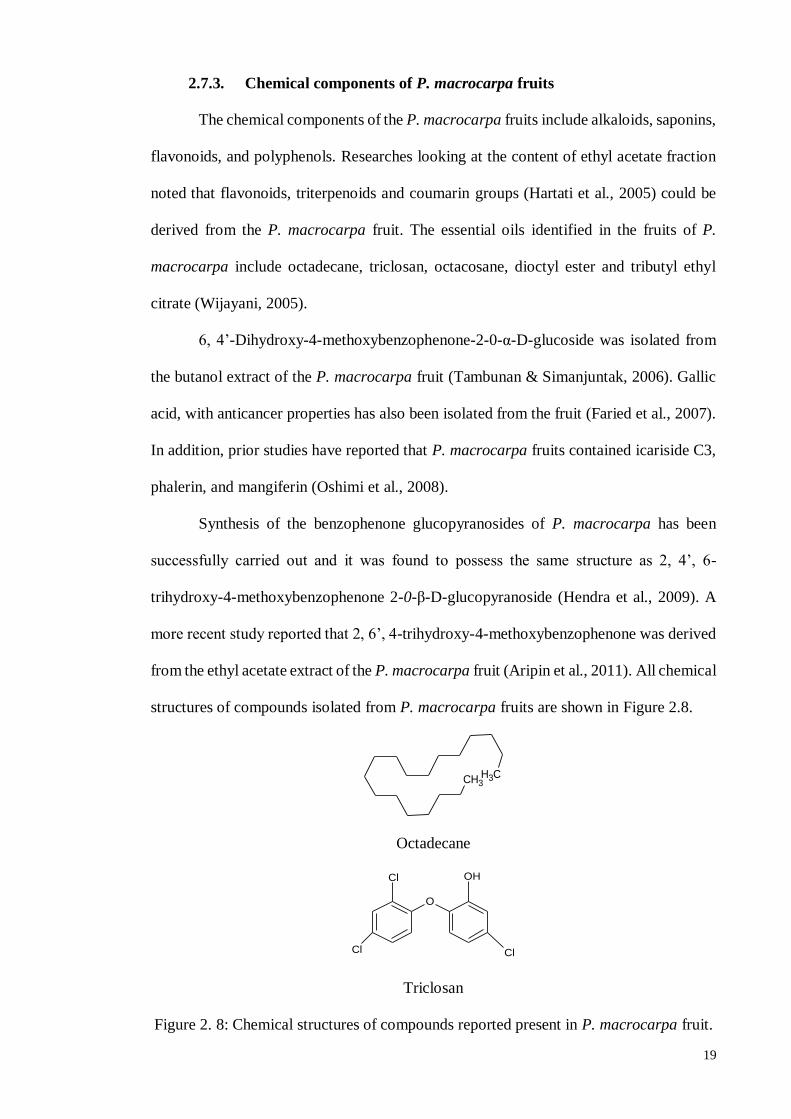
19
2.7.3. Chemical components of P. macrocarpa fruits
The chemical components of the P. macrocarpa fruits include alkaloids, saponins,
flavonoids, and polyphenols. Researches looking at the content of ethyl acetate fraction
noted that flavonoids, triterpenoids and coumarin groups (Hartati et al., 2005) could be
derived from the P. macrocarpa fruit. The essential oils identified in the fruits of P.
macrocarpa include octadecane, triclosan, octacosane, dioctyl ester and tributyl ethyl
citrate (Wijayani, 2005).
6, 4’-Dihydroxy-4-methoxybenzophenone-2-0-α-D-glucoside was isolated from
the butanol extract of the P. macrocarpa fruit (Tambunan & Simanjuntak, 2006). Gallic
acid, with anticancer properties has also been isolated from the fruit (Faried et al., 2007).
In addition, prior studies have reported that P. macrocarpa fruits contained icariside C3,
phalerin, and mangiferin (Oshimi et al., 2008).
Synthesis of the benzophenone glucopyranosides of P. macrocarpa has been
successfully carried out and it was found to possess the same structure as 2, 4’, 6-
trihydroxy-4-methoxybenzophenone 2-0-β-D-glucopyranoside (Hendra et al., 2009). A
more recent study reported that 2, 6’, 4-trihydroxy-4-methoxybenzophenone was derived
from the ethyl acetate extract of the P. macrocarpa fruit (Aripin et al., 2011). All chemical
structures of compounds isolated from P. macrocarpa fruits are shown in Figure 2.8.
CH3CH3
Octadecane
Triclosan
Figure 2. 8: Chemical structures of compounds reported present in P. macrocarpa fruit.
O
OHCl
Cl Cl
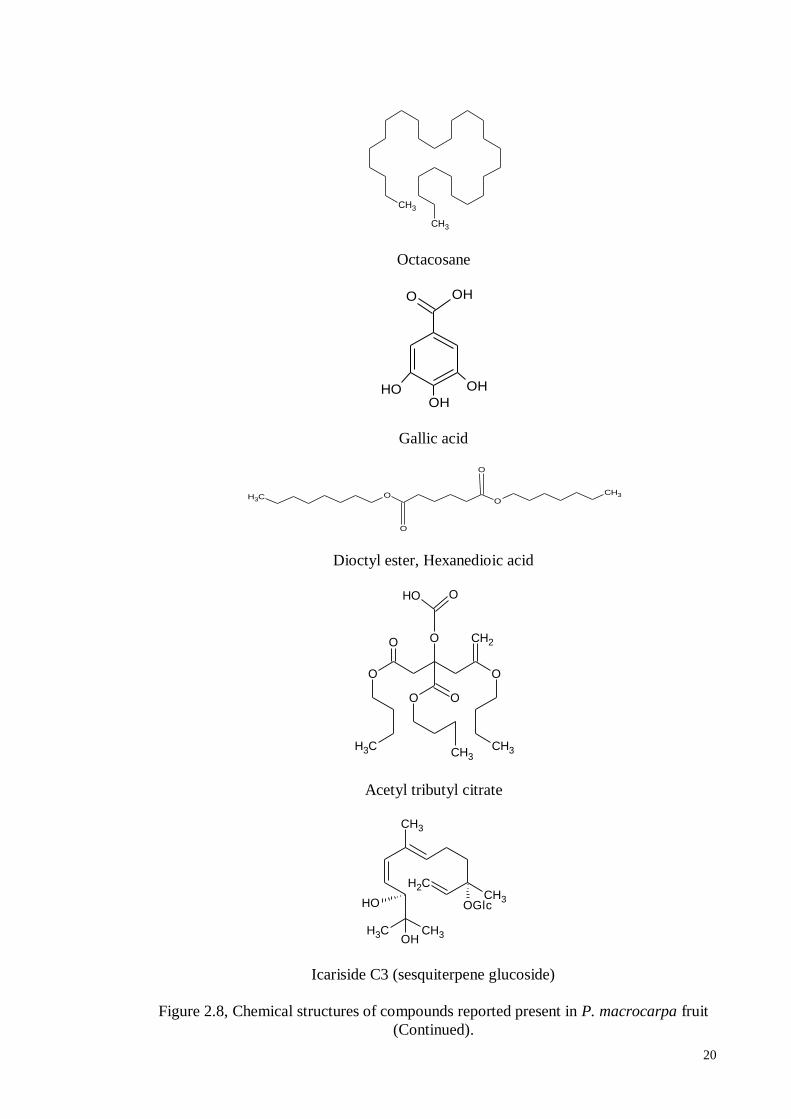
20
Octacosane
Gallic acid
Dioctyl ester, Hexanedioic acid
Acetyl tributyl citrate
Icariside C3 (sesquiterpene glucoside)
Figure 2.8, Chemical structures of compounds reported present in P. macrocarpa fruit
(Continued).
CH3
CH3
OH
OHOH
OHO
CH3O
O
CH3
O
O
O O
CH2O
CH3 CH3
O
OH O
OO
CH3
CH2CH3
CH3 CH3
CH3
OH
OH OGlc
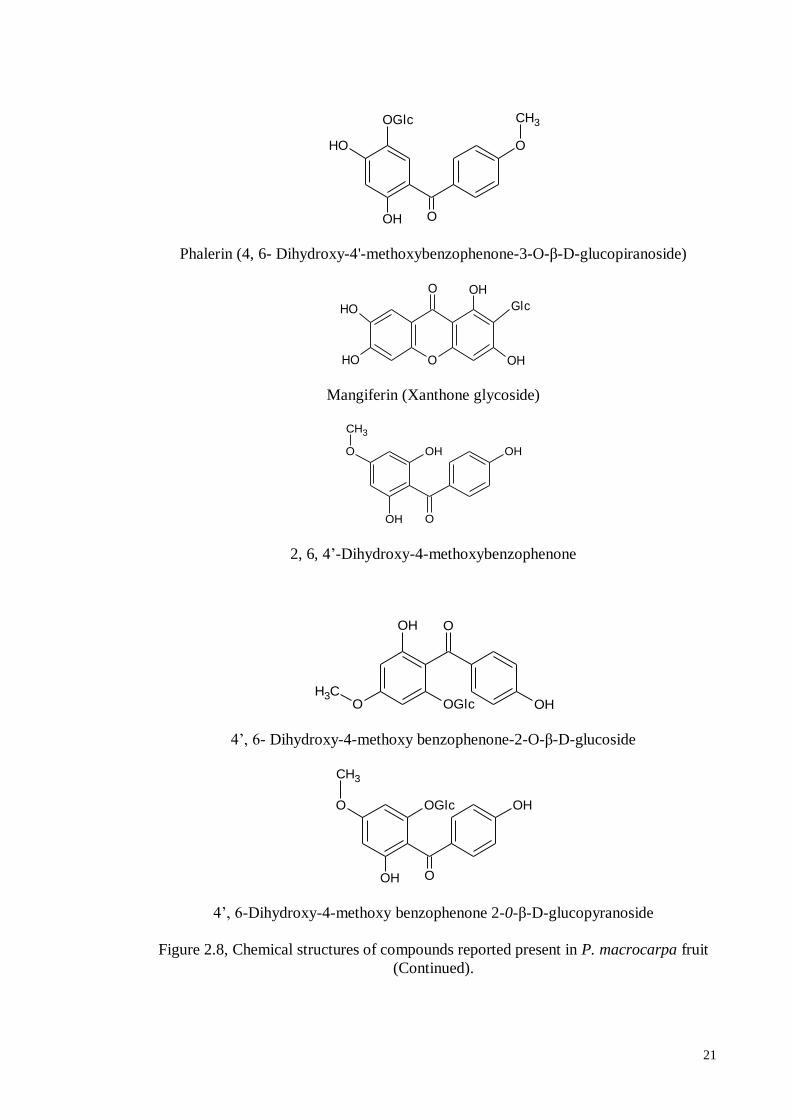
21
Phalerin (4, 6- Dihydroxy-4'-methoxybenzophenone-3-O-β-D-glucopiranoside)
Mangiferin (Xanthone glycoside)
2, 6, 4’-Dihydroxy-4-methoxybenzophenone
4’, 6- Dihydroxy-4-methoxy benzophenone-2-O-β-D-glucoside
4’, 6-Dihydroxy-4-methoxy benzophenone 2-0-β-D-glucopyranoside
Figure 2.8, Chemical structures of compounds reported present in P. macrocarpa fruit
(Continued).
OOH
OH O
CH3OGlc
O
O
OH
OH OH
OH
Glc
OH
OH
O
CH3
O
OH
OGlc
OH O
OCH3
OH
OGlc OHO
CH3
OH O
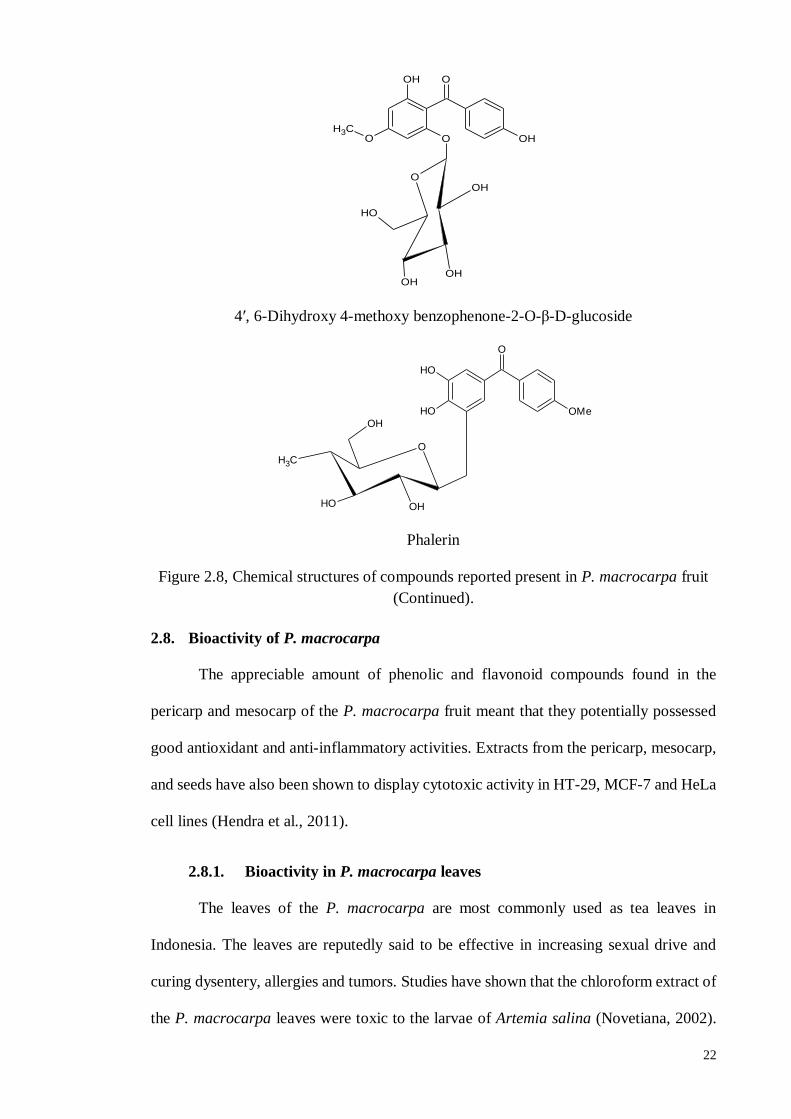
22
4′, 6-Dihydroxy 4-methoxy benzophenone-2-O-β-D-glucoside
Phalerin
Figure 2.8, Chemical structures of compounds reported present in P. macrocarpa fruit
(Continued).
2.8. Bioactivity of P. macrocarpa
The appreciable amount of phenolic and flavonoid compounds found in the
pericarp and mesocarp of the P. macrocarpa fruit meant that they potentially possessed
good antioxidant and anti-inflammatory activities. Extracts from the pericarp, mesocarp,
and seeds have also been shown to display cytotoxic activity in HT-29, MCF-7 and HeLa
cell lines (Hendra et al., 2011).
2.8.1. Bioactivity in P. macrocarpa leaves
The leaves of the P. macrocarpa are most commonly used as tea leaves in
Indonesia. The leaves are reputedly said to be effective in increasing sexual drive and
curing dysentery, allergies and tumors. Studies have shown that the chloroform extract of
the P. macrocarpa leaves were toxic to the larvae of Artemia salina (Novetiana, 2002).
O
OOH
O OHCH3
O
OH
OH
OHOH
O
OHOH
CH3
O
OH
OH
OHOMe
23
The methanol extract of the P. macrocarpa leaves displayed cytotoxic effect in Brine
Shrimp Lethality assay and isolated phalerin is cytotxic to the NS-1 myeloma cell line
(Kurnia et al., 2008)
The crude methanolic extract of the P. macrocarpa leaf showed good activity
against Pseudomonas aeroginosa, Bacillus cereus and Streptococcus aureus, and the
ethyl acetate extract of the P. macrocarpa leaf showed strong activity against
Pseudomonas aeroginosa, Bacillus cereus and Streptococcus aureus when using the
Mueller Hinton agar well diffusion method (Andriani et al., 2011). The radical
scavenging activity of four crude extracts obtained from the P. macrocarpa leaves and
the active crude cytotoxic properties present in the HepG2 cells have also been
investigated (Andriani et al., 2011).
2.8.2. Bioactivity in P. macrocarpa seeds
The seeds of P. macrocarpa are very toxic and they have an unpleasant taste but
are nevertheless, used in Indonesia. It has been shown that the chloroform extract of P.
macrocarpa seeds has an LC50
5.113.10-4
± 3.213.10-5
μg/mL (Sumarningsih, 2002). In
addition, the ethanol extract of the P. macrocarpa seeds has higher cytotoxicity than
extracts from the flesh of the fruit (Astuti et al., 2007).
Ethanol extracts of the P. macrocarpa seed and fruit have been found to be non-
toxic to normal human peripheral blood mononuclear cells, but slightly toxic to the vero
cell line (Astuti et al., 2007). The ethanol extract from the P. macrocarpa seeds and fruits
have also been shown to be toxic towards the T47D breast cancer cell line through the
inhibition of COX-2 expression with an LC50
15.12 ± 3.21 μg/mL (Bakhriansyah, 2004).
The ethanol extract of the P. macrocarpa seeds and flesh of the fruit increased p53 gene
expression but had no effect on Bcl-2 gene expression. The n-hexane extract from P.
macrocarpa seeds was more effective in increasing p53 gene expression than the flesh of
the fruit, but it had no effect on Bcl-2 gene expression (Wardani, 2005).
24
2.8.3. Bioactivity of P. macrocarpa fruits
The edible fruits of P. macrocarpa are most commonly consumed in traditional
medicine when mixed with other medicinal plants. The fruits of this plant are used as
alternative medicine in curing cancer, diabetes, nerve pain, kidney failure and disorder,
liver dysfunction and skin diseases. It is also said to help lower cholesterol level, increase
stamina and is used as an anti-narcotic. The flavonoids contained in the P. macrocarpa
fruits are useful for blood circulation throughout the body, for preventing blockages in
blood vessels, lowering cholesterol levels, reducing the gathering of fat in blood vessel
walls, and also reducing the risk of coronary heart disease. It contains anti-inflammatory
agents and antioxidants, which helps alleviate pain when there is bleeding or swelling. It
is believed that the flesh of the P. macrocarpa fruit contains antioxidant compounds that
can fight cancer.
It has been shown that n-butanol, ethyl acetate, and methanol extracts from the
ripe fruit of P. macrocarpa contained inhibitory activities against the in vitro α-
glucosidase enzyme (Sugiwati et al., 2009). A related study by the same researchers
indicated that, the ethyl acetate extract derived from old P. macrocarpa leaves displayed
higher inhibition activity as compared to young leaves. This is based on the α-glucosidase
inhibition test,
Gallic acid which was isolated from the fruits of P. macrocarpa exhibited
cytotoxic activity against human esophageal cancer cells (TE-2) but showed no cytotoxic
effect on non-cancerous cells (CHEK-1) (Faried et al., 2007). Isolated icariside C3 of P.
macrocarpa displayed a vasorelaxant effect on rat aorta (Oshimi et al., 2008). P.
macrocarpa also increased antioxidant enzyme activities and SOD, GPx and CAT
activities while decreasing lipid peroxidation (Triastuti & Choi, 2008).
It has been shown that oral treatments using P. macrocarpa lowered blood glucose
levels, decreased kidney hypertrophy and diminished blood urea nitrogen in diabetic rats.
25
Therefore, the anti-hyperglycaemic and anti-nephropathic properties of P. macrocarpa
may be correlated to increased renal antioxidative enzyme activity in the kidney (Triastuti
et al., 2009).
The butanol fraction of P. macrocarpa fruits have been shown to significantly
prevent an alloxan-induced diabetic state by enhancing hepatic antioxidant activity in
animals which were treated with the fraction (Triastuti et al., 2009). A study by the same
researchers indicated that the methanol extract of P. macrocarpa displayed anti-
nephropathic effects, which may have a correlation with the increase of renal antioxidant
enzyme activity in alloxan-induced diabetic rats.
The major compound - phalerin - displayed inhibitory effects on the propagative,
migrative, and insidious tendencies of human breast adenocarcinoma cells (MDA-
MB231) in a dose-dependent manner and it was found to reduce phosphoinositide-3
(PI3)-kinase/protein kinase B (AKT) thus signalling a significant decrease of the PI3K
transcript level. This consequently lowered AKT phosphorylation (Tandrasasmita et al.,
2010).
Previous research has shown that the ethanol extract derived from the fruit of P.
macrocarpa has high toxicity against the HeLa cell line. The major compound present in
this extract- phalerin - possessed potent biological activity as an anticancer agent via the
down-regulation of the PI3-KI/AKT signalling pathway. Phalerin caused the down-
regulation of the NFkB transcript followed by the reduction of eicosanoid-related genes,
which in turn caused the increase of cell arrest (Tandrasasmita et al., 2010). P.
macrocarpa has also been shown to reduce weight gain, overall cholesterol levels,
triglycerides, HDL and LDL levels. It also up-regulated the hepatic LDL receptor and
contains PCSK9 proteins found in hyper-cholesterolemic rats (Chong et al., 2011).
2, 6’, 4-Trihydroxy-4-methoxybenzophenone and 4’, 6-dihydroxy-4-
methoxybenzophenone 2-0-β-D-glucopyranoside extracted from the P. macrocarpa fruit
26
showed anti proliferation activity against the breast cancer cell line MDA-MB231. It also
been shown to possess apoptosis-inducing activity (Aripin et al., 2011). Another
researcher reported that P. macrocarpa extracts showed good hypoglycaemic and anti-
hyperglycemic effects in normal and diabetic rates (Rabyah et al., 2012).
2.9. Apoptosis and Cancer
Apoptosis is central to cancer treatment as its mechanism may be manipulated to
promote the cell death of tumors. This section will detail the genes that suppress tumor
formation and the oncogenes that promote the propagation of cancer cells. It also looks
at how these two factors are connected to the apoptotic pathway.
(http://www.biooncology.com).
2.10. Apoptosis
Apoptosis is a form of programmed cell death, used by multi-cellular organisms
to rid themselves of extraneous cells. It differs from necrosis in that the former tends to
last a lifetime and is beneficial to the body, while the latter is a form of cell death caused
by severe cellular damage (Potten, 2004).
Plasma membrane blebbing, chromatin condensation, and DNA shrinkage are
among the more remarkable morphological features of apoptosis. These are preceded by
caspase proteases induced from a complex group of cysteine protease activating multi
sub-units called apoptosomes. Apoptosis can occur, for instance, when irreversible cell
damage takes place (Kumar Sharad, 1998).The decision to perform apoptosis comes from
the cell itself, the surrounding tissue, or cells produced from the immune system (Kumar
& Sharad, 1998).
It is estimated that apoptosis causes up to 50 to 70 billion cells to die every day in
human adults. The morphological changes undergone during apoptosis include cell
shrinkage, alterations in cell shape, condensation of cytoplasm, changes to the nuclear,
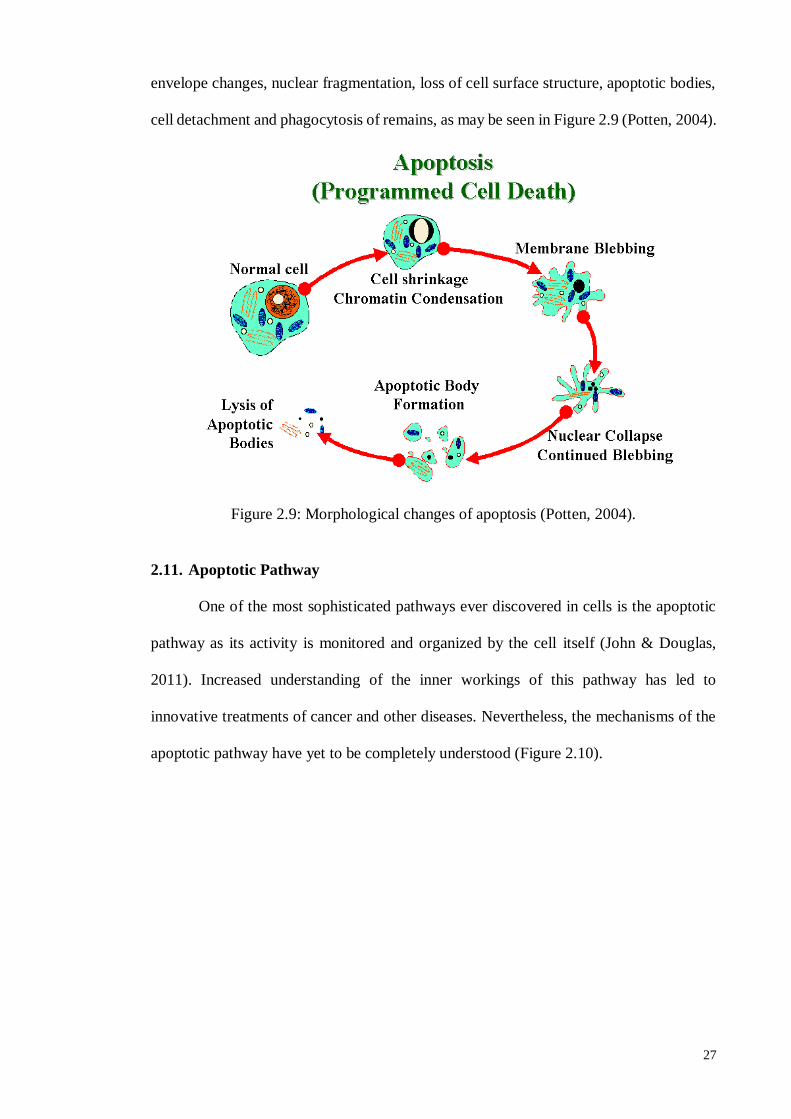
27
envelope changes, nuclear fragmentation, loss of cell surface structure, apoptotic bodies,
cell detachment and phagocytosis of remains, as may be seen in Figure 2.9 (Potten, 2004).
Figure 2.9: Morphological changes of apoptosis (Potten, 2004).
2.11. Apoptotic Pathway
One of the most sophisticated pathways ever discovered in cells is the apoptotic
pathway as its activity is monitored and organized by the cell itself (John & Douglas,
2011). Increased understanding of the inner workings of this pathway has led to
innovative treatments of cancer and other diseases. Nevertheless, the mechanisms of the
apoptotic pathway have yet to be completely understood (Figure 2.10).
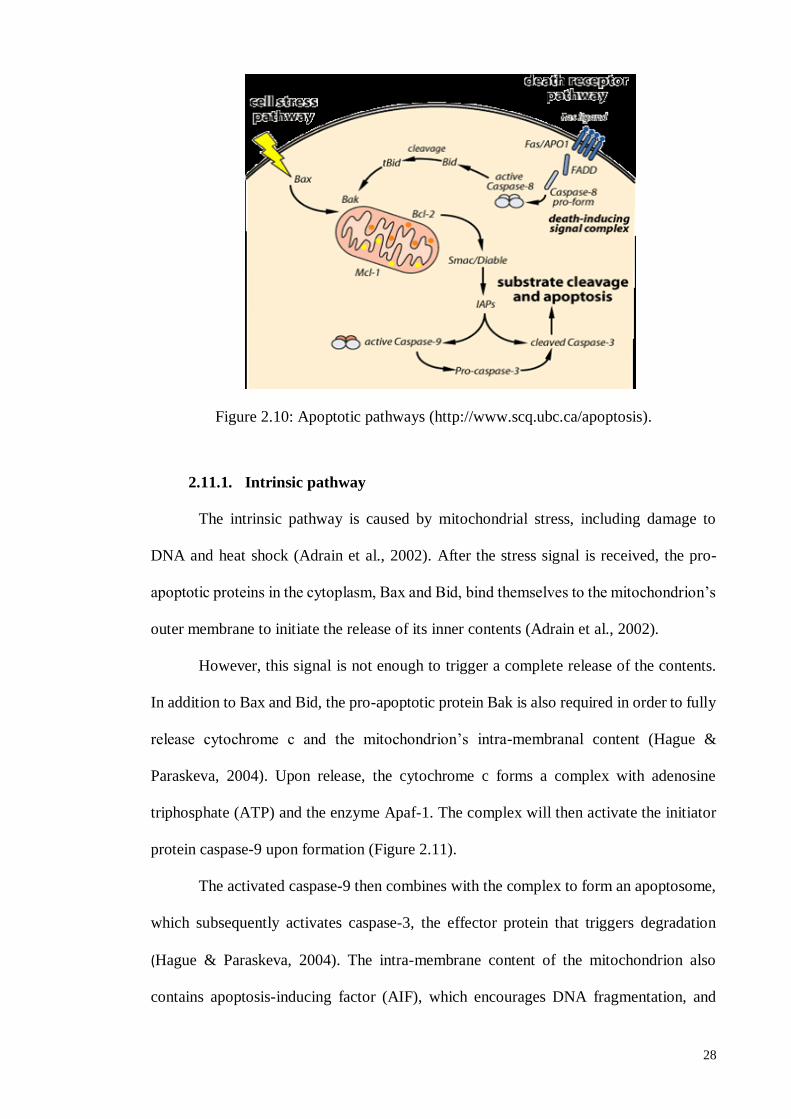
28
Figure 2.10: Apoptotic pathways (http://www.scq.ubc.ca/apoptosis).
2.11.1. Intrinsic pathway
The intrinsic pathway is caused by mitochondrial stress, including damage to
DNA and heat shock (Adrain et al., 2002). After the stress signal is received, the pro-
apoptotic proteins in the cytoplasm, Bax and Bid, bind themselves to the mitochondrion’s
outer membrane to initiate the release of its inner contents (Adrain et al., 2002).
However, this signal is not enough to trigger a complete release of the contents.
In addition to Bax and Bid, the pro-apoptotic protein Bak is also required in order to fully
release cytochrome c and the mitochondrion’s intra-membranal content (Hague &
Paraskeva, 2004). Upon release, the cytochrome c forms a complex with adenosine
triphosphate (ATP) and the enzyme Apaf-1. The complex will then activate the initiator
protein caspase-9 upon formation (Figure 2.11).
The activated caspase-9 then combines with the complex to form an apoptosome,
which subsequently activates caspase-3, the effector protein that triggers degradation
(Hague & Paraskeva, 2004). The intra-membrane content of the mitochondrion also
contains apoptosis-inducing factor (AIF), which encourages DNA fragmentation, and
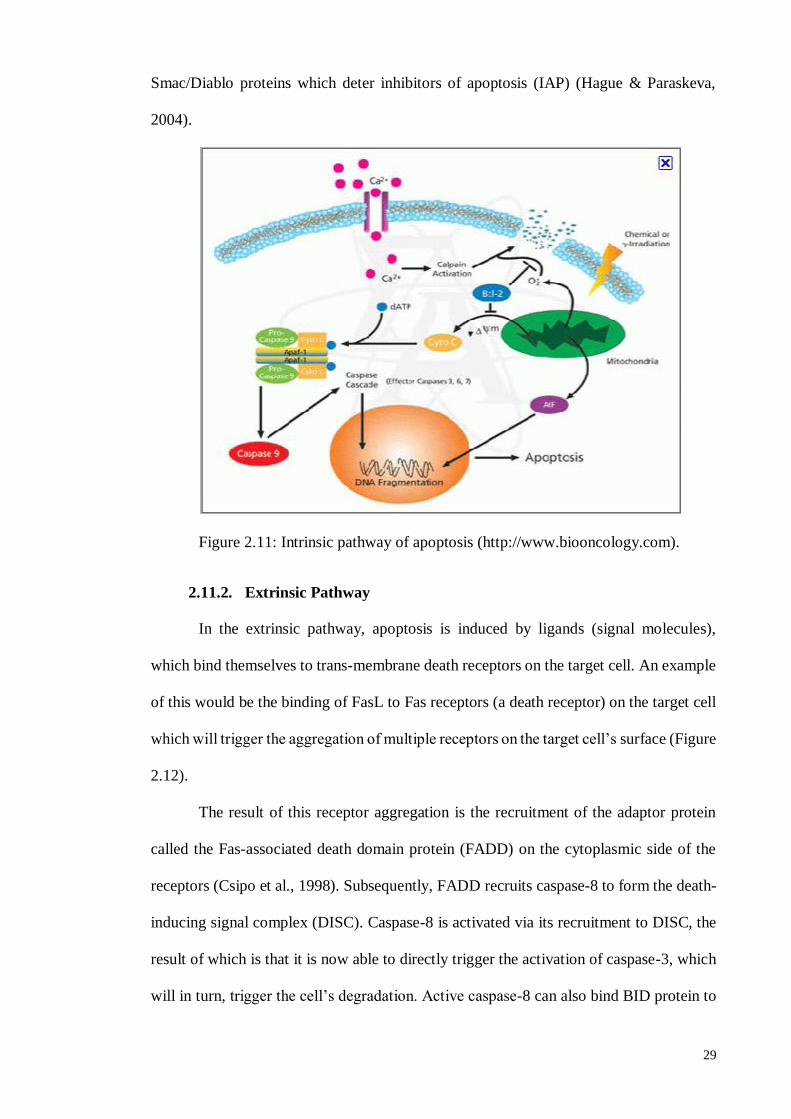
29
Smac/Diablo proteins which deter inhibitors of apoptosis (IAP) (Hague & Paraskeva,
2004).
Figure 2.11: Intrinsic pathway of apoptosis (http://www.biooncology.com).
2.11.2. Extrinsic Pathway
In the extrinsic pathway, apoptosis is induced by ligands (signal molecules),
which bind themselves to trans-membrane death receptors on the target cell. An example
of this would be the binding of FasL to Fas receptors (a death receptor) on the target cell
which will trigger the aggregation of multiple receptors on the target cell’s surface (Figure
2.12).
The result of this receptor aggregation is the recruitment of the adaptor protein
called the Fas-associated death domain protein (FADD) on the cytoplasmic side of the
receptors (Csipo et al., 1998). Subsequently, FADD recruits caspase-8 to form the death-
inducing signal complex (DISC). Caspase-8 is activated via its recruitment to DISC, the
result of which is that it is now able to directly trigger the activation of caspase-3, which
will in turn, trigger the cell’s degradation. Active caspase-8 can also bind BID protein to
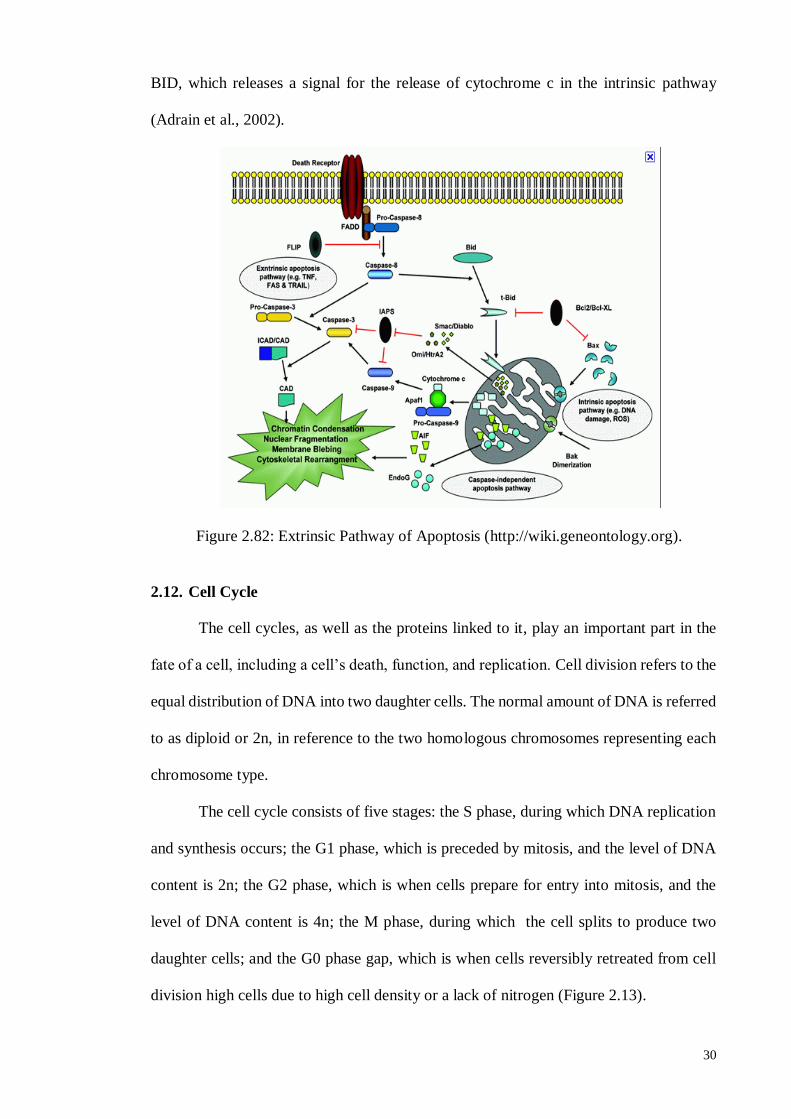
30
BID, which releases a signal for the release of cytochrome c in the intrinsic pathway
(Adrain et al., 2002).
Figure 2.82: Extrinsic Pathway of Apoptosis (http://wiki.geneontology.org).
2.12. Cell Cycle
The cell cycles, as well as the proteins linked to it, play an important part in the
fate of a cell, including a cell’s death, function, and replication. Cell division refers to the
equal distribution of DNA into two daughter cells. The normal amount of DNA is referred
to as diploid or 2n, in reference to the two homologous chromosomes representing each
chromosome type.
The cell cycle consists of five stages: the S phase, during which DNA replication
and synthesis occurs; the G1 phase, which is preceded by mitosis, and the level of DNA
content is 2n; the G2 phase, which is when cells prepare for entry into mitosis, and the
level of DNA content is 4n; the M phase, during which the cell splits to produce two
daughter cells; and the G0 phase gap, which is when cells reversibly retreated from cell
division high cells due to high cell density or a lack of nitrogen (Figure 2.13).
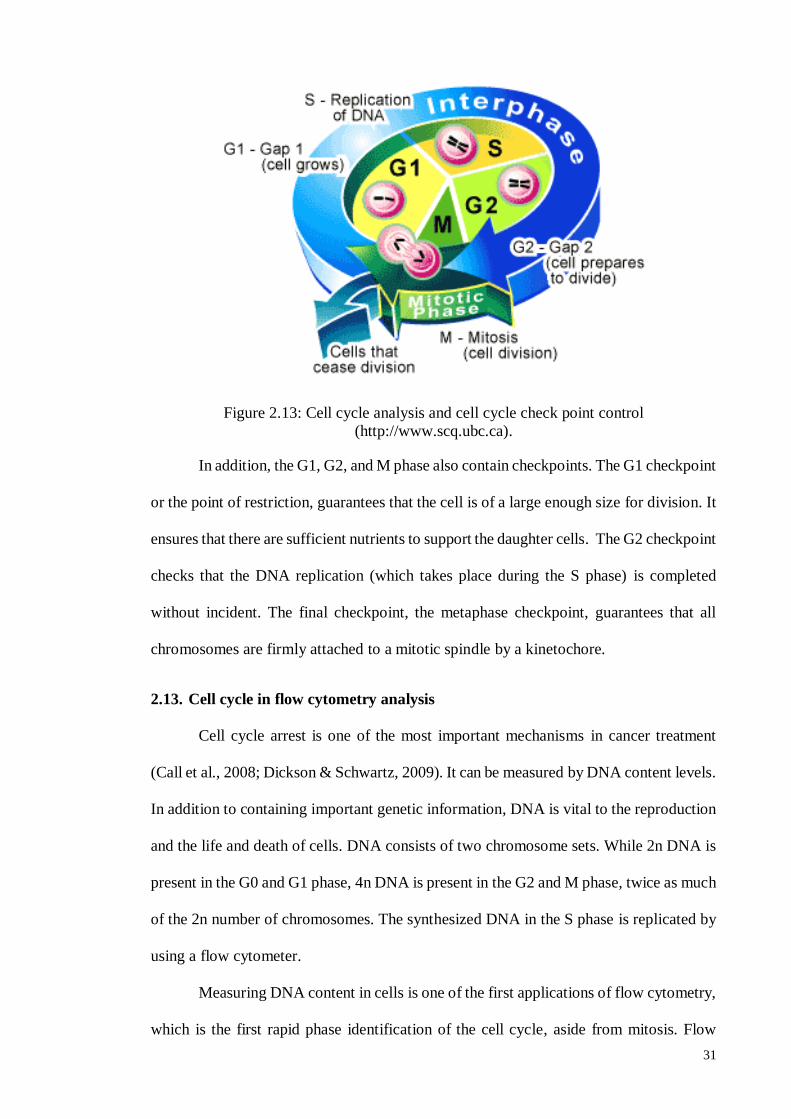
31
Figure 2.13: Cell cycle analysis and cell cycle check point control
(http://www.scq.ubc.ca).
In addition, the G1, G2, and M phase also contain checkpoints. The G1 checkpoint
or the point of restriction, guarantees that the cell is of a large enough size for division. It
ensures that there are sufficient nutrients to support the daughter cells. The G2 checkpoint
checks that the DNA replication (which takes place during the S phase) is completed
without incident. The final checkpoint, the metaphase checkpoint, guarantees that all
chromosomes are firmly attached to a mitotic spindle by a kinetochore.
2.13. Cell cycle in flow cytometry analysis
Cell cycle arrest is one of the most important mechanisms in cancer treatment
(Call et al., 2008; Dickson & Schwartz, 2009). It can be measured by DNA content levels.
In addition to containing important genetic information, DNA is vital to the reproduction
and the life and death of cells. DNA consists of two chromosome sets. While 2n DNA is
present in the G0 and G1 phase, 4n DNA is present in the G2 and M phase, twice as much
of the 2n number of chromosomes. The synthesized DNA in the S phase is replicated by
using a flow cytometer.
Measuring DNA content in cells is one of the first applications of flow cytometry,
which is the first rapid phase identification of the cell cycle, aside from mitosis. Flow
32
cytometry analysis is reliant on the stoichiometric ability to stain DNA at the cellular
level (as is indicated by the amount of DNA within the cell being directly proportionate
to the amount of stain used) (www.phoenixflow.com).
A variety of dyes with high binding tendencies to DNA are available for this very
purpose. The type of dye determines where the dyes will bind on the DNA molecule. The
blue-excited propidium iodide (PI), or ethidium bromide, and the UV-excited dyes
diamidino-phenylindole (DAPI) and Hoescht 33342 and 33258 are most commonly used
to stain DNA. Propidium iodide is an intercalating dye which binds itself to DNA and
double-stranded RNA; this is why it is usually used together with RNase to eradicate
RNA. DAPI and the Hoescht dyes bind themselves to the grooves of the DNA helix and
have no binding affinity to RNA (www.phoenixflow.com).
33
CHAPTER 3
MATERIAL AND METHODS
3.1. Plant Material
The seeds and fruits of the Phaleria macrocarpa (Scheff.) Boerl were collected
from Yogyakarta, Indonesia between July 2009 and 2011.
3.2. Extraction and Fractionation of P. macrocarpa
Dried samples (fruits without seeds: 1000g and seeds: 1660g) were ground into
powder using an electric blender. The dried, ground samples were weighed and then
soaked in 80% methanol for three days at room temperature. The resulting methanol
extract was filtered with filter paper. The filtrate obtained was then poured into a beaker
and anhydrous sodium sulphate was added to remove traces of water in the filtrate. The
filtrate was then re-filtered and poured into a round bottomed flask to be evaporated at
low pressure at 60 rpm to remove excess methanol. The result was a dark-brown,
concentrated crude methanol extract. This extract was removed by using a spatula and
placed into a vial and then kept in the refrigerator.
The crude methanol extract was initially fractionated with hexane in a round
bottomed flask. The hexane-containing extract was then poured into a beaker and
anhydrous sodium sulphate was added. The mixture was filtered with filter paper. The
filtrate was poured into another round bottomed flask and the solvent was evaporated by
using a rotary evaporator to produce the hexane fraction. The sticky dark hexane fraction
was taken out with a spatula and placed in a vial and then placed in the refrigerator. The
hexane-insoluble residue was then extracted with chloroform to produce a chloroform-
soluble fraction and a chloroform-insoluble residue. It was then filtered with filter paper
and subjected to evaporation under pressure to remove excess solvent. The chloroform
extract was taken out, placed in a vial and kept in the refrigerator.
34
The chloroform-insoluble fraction was partitioned between ethyl acetate and
water. A mixture of ethyl acetate and water (1:1) was prepared and poured into the round
bottomed flask containing the hexane-insoluble extract. The flask was shaken vigorously
and separation was carried out in a separating funnel. The funnel was slightly shaken and
the mixture was allowed to settle into the two layers. The top layer consisted of ethyl
acetate whereas the bottom layer consisted of water. The water layer was separated by
opening the tap of the funnel. The water layer was then collected in a beaker.
The ethyl acetate layer was poured into an Erlenmeyer flask. The water layer was
returned to the separating funnel and the extraction of the components in the water layer
was repeated using fresh ethyl acetate until the ethyl acetate part became colourless. It
was then filtered using filter paper and subjected to evaporation under pressure to remove
excess solvent. The ethyl acetate extract was taken out, placed in a vial and then kept in
the refrigerator. The water fraction was dried through rotary evaporation and the hard
sticky extract was put in a vial and then kept in the refrigerator for further bioactivity
assay.
3.3. In vitro cytotoxicity assay
3.3.1. Cell lines and culture medium
MCF-7 (hormone-dependent breast carcinoma cell line), HT-29 (colon carcinoma
cell line), Ca Ski (cervical carcinoma cell line), A549 (human lung carcinoma cell line),
SKOV-3 (human ovarian carcinoma cell line) and MRC-5 (non-cancerous human
fibroblast lung cell line) were purchased from the American Tissue Culture Collection
(ATCC, USA).
MCF-7, HT-29, Ca Ski and A549 cells were maintained in RPMI 1640 medium
(Sigma), SKOV-3 cells in Dulbecco’s Modified Eagle’s Medium (DMEM; Sigma) and
MRC-5 cells in Eagle Minimum Essential Medium (EMEM; Sigma), supplemented with
35
10% Fetal bovine serum (FBS), 100μg/ml penicillin or streptomycin (P/S) and 50μg/ml
of kanamycin/amphotecerin B.
3.3.2. Trypan blue exclusion test
Trypan blue is a stain that only enters across the membrane of non-viable/dead
cells. After detaching cells from the tissue culture flask by trypsinization, the cell
suspension was mixed with trypan blue solution. Three to five minutes later, the colored
(non-viable) and dye-excluding (viable) cells were counted and the percentage of viable
cells determined.
3.3.3. Selectivity Index
The selectivity index (SI) value was determined according to Mahavorasirikul et
al., 2010. “The selectivity index (SI) value indicates cytotoxic selectivity of the sample
to the cell lines tested. The methanol extract and all fractions with a selectivity index of
more than three were considered to have high selectivity” (Mahavorasirikul et al., 2010).
The selectivity index (SI) was calculated according to the following formula:
Selectivity Index (SI) =IC50 value of normal fibroblast cell line
IC50 value of cancerous cells
3.3.4. In vitro neutral red cytotoxicity assay
The cell’s sensitivity to the P. macrocarpa seed extracts was determined by the
neutral red assay by using the Borenfreund and Puerner method with some modifications
as previously described (Borenfreund, 1984; Malek et al., 2011). In brief, “the cells were
detached from the tissue culture flask (Nunc.Wiesbaden, Germany) with 0.25% of
trypsin-EDTA solution and phosphate buffered saline (PBS) solution and then washed in
culture medium. The cell pellet was obtained by centrifugation for 5min at 1000rpm.
After trypsinization, the total cell count from the culture flask was estimated by
using a haemocytometer. The individual wells of a 96-well plate (Nunc. Wiesbaden,
36
Germany) were inoculated with 200µl medium containing 3 x 10³ cells. The plate was
incubated in a CO2 incubator at 37●C for 24h to allow the cells to adhere and achieve 60-
70% confluence. After 24h of incubation, the cells were treated with different
concentrations (1 µg/mL, 10 µg/mL, 50 µg/mL and 100 µg/mL) of the test extracts in
three replicate tests. The plate was incubated for 72h at 37●C in a 5%CO2 incubator.
After 72h, the media were replaced with a medium containing 50 µg/mL of neutral
red. The plate was then incubated for another 3h to allow for uptake of vital dye into the
lysosomes of viable and injured cells. The media was removed after incubation (3h) and
the cells were washed with 200 µL of the neutral red washing solution and the dye was
eluted from the cells by adding 200 µL of neutral red resorb solution. The plate was
incubated for 30 minutes at room temperature with rapid agitation on a microtiter plate
shaker (LT BioMax 500). Dye absorbance was measured at 540 nm by using an ELISA
Microplate Reader (E-max Microplate Reader of Molecular Devices, USA). The
cytotoxic effect of each test as determined from the three replicates was then evaluated
based on the percentage of inhibition values.
The percentage of inhibition (%) was calculated according to the following formula:
Percentage of inhibition (%) =OD control − OD sample
OD controlx100%
The cytotoxicity of each sample was expressed as ±IC50 value. The IC50 value is
the concentration of test compounds that causes 50% inhibition or cell death, the average
for three experiments was obtained by plotting the percentage of inhibition versus the
concentration of test compounds. The extract that gave IC50 of 20 µg/mL or less was
considered active (Swanson & Pezzuto, 1990).
37
3.3.5. In vitro MTT assay
The MTT (3, 4, 5-dimethylthiazol-2-yl)-2-5-diphenyltetrazolium bromide) cell
proliferation assay was performed as described by Mosmann (Mosmann, 1983). In brief,
the cells from a confluent tissue culture flask was spun at 1,000 rpm for 5 minutes and re-
suspended with 1.0 ml of growth medium. The density of the viable cells was counted
using 0.4% of trypan blue exclusion dye in a haemocytometer with a microscope. The
cells were seeded into each well on the microtiter plate and incubated in a CO2 incubator
at 37C for 24h to allow the cells to adhere and achieve 70-80% confluence. After 24h,
the media was removed and each extract, at varying concentrations of 1, 10, 25, 50 and
100g/mL with 200l of 10% media, were added into the respective wells containing the
cells. The assay was carried out in triplicates. Wells containing untreated cells were used
as a negative control. After 24h, 48h, and 72h, each well was added with 10L MTT stock
solution via the mitochondrial dehydrogenase of intact cells into a purple formazan. The
amount of formazon was determined by measuring the absorbance at 540nm by using an
ELISA plate reader. The cytotoxicity of each sample is expressed as ±IC50 value.
The percentage of inhibition (%) was calculated according to the following formula:
Percentage of inhibition (%) =OD control − OD sample
OD controlx 100%
3.4. Instrumentation
3.4.1. Column chromatography
All solvents except those used for the seed and fruit extractions are of AR grade.
Silica gel 60 (70-230 mesh) was used for column chromatography. The ratio of silica gel
to the sample was approximately 30:1. The gel was made into a slurry with a suitable
solvent before being packed into glass columns. The glass columns used were of various
dimensions; a 7cm x 60cm dimension column was utilized for the fractionation of the
38
crude extract, and a 3cm x 60cm and 2cm x 60 cm dimension columns were used for the
separation of compounds from partially purified fractions.
3.4.2. Thin layer chromatography (TLC)
Glass-supported silica gel 60 F254 plates were used for thin layer chromatography
(TLC). TLC spots or bands were visualized or examined under ultraviolet light (254nm
and 365nm).
3.4.3. Preparative Thin Layer Chromatography (Prep-TLC)
Silica gel 60 F254 was used in preparative thin layer chromatography on 20cm x
20cm plates, with a layer thickness ranging from 0.25mm to 1mm, depending on the
amount of sample to be worked upon.
3.4.4. Gas Chromatography-Mass Spectrophotometry (GC-MS)
GC-MS was performed as described by Malek et al., (2011). Briefly, GC-MS was
used to determine the molecular weight of the components collected and the purity of the
collected compounds. The oven temperature was programmed with an initial temperature
of 100 ̊C, which was then increased at a ramp rate of 5 ̊C/min; culminating in a final
temperature of 300 ̊C. The carrier gas or mobile phase being used was helium which was
programmed at a flow rate of 1 mL/min. The mass spectrometry mode used was the
electron ionization (EI) mode with a current of 70eV. The injection mode was
programmed with the sample injection volume of 1μL via a split mode with a ratio of
1:20. The injection port temperature was set to 230 ̊C and the detector/interface
temperature was set to 250 ̊C.
3.4.5. Nuclear Magnetic Resonance (NMR)
NMR was used in the study to obtain the 1D NMR 1H and NMR 13C with a
frequency of 270MHz and 67MHz, respectively. The spectrum obtained was compared
39
with the literature. The structure of the compounds was then determined. The physical
data of the isolated compounds were obtained from the following instruments:
NMR analysis was carried out on the JEOL JNM-LA FT-NMR system with
deuterated chloroform (CDCl3) or deuterated methanol as solvents. Chemical shifts were
reported in ppm on scales and coupling constants were given in Hz.
3.5. Extraction, isolation and identification of chemical constituents from
bioactive extracts of P. macrocarpa
3.5.1. Separation of Compounds using Column Chromatography
A glass column with a height of 60cm and an internal diameter of 6.5cm was
cleaned and prepared. The silica gel was soaked in hexane. Bubbles were removed and
the silica gel was allowed to soak overnight, after which it will be referred to henceforth
as slurry. The packing of the column was done when the slurry was ready for use. A small
piece of cotton was inserted into the tubing area. Next, a layer of sea sand was added to
create a smooth straight layer so that when silica gel slurry is added to the column, it
would not be affected by the impact of the added silica gel, and would have a straight and
stable level. Some solvent was added into the column with a quantity of around 20% of
the column length.
The slurry was poured into the column little by little until it reached about 65-70%
of the column height. The slurry was left to settle and the column was packed until a
stable elution rate was obtained. Samples were prepared by diluting them in a polar
solvent and the silica gel was then mixed with the sample to facilitate application to the
column. The ratio of silica gel to sample was 1:50g. Another layer of sand was poured on
top of the sample to avoid any contamination of the sample. The eluent was slowly passed
through the column. The silica gel should always be submerged in solvent. This is because
if the column lacks solvent, the silica gel would affect the separation of the compounds.
40
The flow rate of column can accelerated by adding more solvent on top of the
column and it could be decreased by adjusting the tap at the base of the column. A conical
flask is placed at the bottom of the column to collect the eluent in the form of fractions
and the eluent is then transferred into a round bottomed flask to be evaporated before
obtaining the eluted component.
After evaporation, the eluted component/components was dissolved with a small
volume of chloroform and transferred into a small vial and covered with aluminium foil
which has a few holes in it. It was then left overnight so that any remaining solvent would
evaporate. The elution of components from the column was monitored by TLC. Polarity
is added by adding an ethyl acetate solvent. Hence, from this investigation, the solvent
that was used for pouring into the column was prepared accordingly with increasing
polarity.
3.5.2. Combining eluent fractions obtained from column chromatography
Fractions were collected concurrently from the column. Thin layer
chromatography (TLC) was performed. Spots that appear in each fraction were compared.
The fraction which showed approximately the same spots between the neighbouring
fractions were identified and grouped together. The fractions with a similar pattern of
spots in the TLC plates were combined.
3.5.3. Isolation of bioactive compound(s)
Active fractions from the column were tested for bioactivity using cytotoxicity
assay. If the extracts produced positive results, the chemical components present in the
active fraction/fractions were identified by using spectroscopic and spectrometric
methods.
41
3.6. Morphological changes associated with apoptosis
3.6.1. Inverted and phase-contrast microscopy
The induction of apoptotic death of selected cell lines by P. macrocarpa can be
investigated for morphological features typical to apoptotic cells. This was performed
using an inverted and a phase contrast microscope. HT-29 cells were placed in a petri dish
(30mm) at a density of 1 x 10⁵ cells/well plate and grown for 24h. A test compound was
then added at the IC50 value and the cells were further incubated for 24h, 48h and 72h,
respectively. After the various incubation periods, morphological changes in the apoptotic
bodies of the HT-29 cells were examined by an inverted and phase-contrast microscopy
(Leica, Germany) and photographed.
3.6.2. Fluorescence microscopy
HT-29 cells at a density of 1 x 10⁵ cells/mL were cultured in the petri dishes
(30mm) for 24h. The next day, the cells were treated with compound and incubated for
72h. After the incubation, the cells were detached with 0.25% accutase and phosphate
buffered saline (PBS). The supernatant was then discarded and the cells were re-
suspended in 1mL of PBS. 100µLof the cells were incubated with 5µl of acridine orange
(AO) and 5µl of propidium iodide (PI) for 10 min at room temperature in a dark place. A
total of 10µl of stained cells were placed into three wells of coated glass slides with 20µL
of mounting media. They were stored at -20°C before analysis. These double stained cells
were photographed under a fluorescent microscope (Leica, Germany). All experiments
were performed in triplicates.
3.7. Annexin V staining assay
The quantification of cell death was determined by flow cytometry analysis using
the Annexin V-FITC Apoptosis Detection Kit according to the manufacturer’s
instructions (BD PharmingenTM, BD Bioscience, USA). In brief, 1x 10⁶ of the HT-29
42
cells were seeded into each petri dish (30mm) and after 24h incubation, various
concentrations of the test compound were added to different petri dishes and then
incubated for 24h, 48h, and 72h, respectively. The cells were then washed with PBS,
suspended in Annexin V binding buffer and then added to the Annexin V-FITC solution
and propidium iodide (PI) for 10 minutes at room temperature. The samples were then
analyzed by FACScalibur (BD Bioscience, USA) by using the CellQuest Pro Analysis
software (Becton Dickinson, USA).
3.8. Cell cycle analysis
The cells were detached from the tissue culture flask with 0.25% of trypsin-EDTA
solution and PBS solution and washed in a culture medium. The cell pellets were obtained
by centrifugation at 1000rpm for 5 min. The density of the viable cells was counted with
0.4% of trypan blue exclusion in a haemocytometer. A total of 5 × 10⁵ of the cells were
then seeded into 1ml of 10% medium per petri dish in a 60cm3 petri dish (SPL). The dish
was incubated in a CO2 incubator at 37°C for 24h to allow the cells to adhere and to
achieve 60-70% confluence. After 24h, the cells were treated with an IC50 value of each
test agent and the dishes were then incubated for 24h, 48h, and 78h respectively at 37°C
in a 5% CO2 incubator.
After the incubation period, each dish was washed with PBS and the cells were
then centrifuged at 2000rpm for five minutes. The cells were then re-suspended, mixed
with PBS and the cell concentration was adjusted to 1×10⁶ per mL and centrifuged at
2000rpm for five minutes. The supernatant was then discarded. After centrifugation, the
cells were fixed into each falcon tube by using 70% ethanol heated at 4°C for two hours
or overnight.
The cells were then washed with PBS in order to remove the fixing solution.
Where necessary, the cell suspension was filtered once by using a 200 mesh sieve. Next,
100uL of RNase was added to the cell suspension and the cells were incubated at 37°C
43
for 30 minutes. Then 400 µL of propidium iodide was added for staining and the cells
were incubated at 4°C for 30min and protected from the light. Finally, the results were
observed at 488nm of excitation wavelength by flow cytometry according to the Cycle
TESTTM PLUS DNA Reagent Kit (Becton Dickinson, USA) protocol.
The cells were sorted in a FACScalibur flow cytometer (BD, USA) by using the
CellQuest Pro software (Becton Dickinson, USA) and a quantitative analysis of the cell
cycle distribution was then conducted by using a trial version of the ModFit LT software
(version 4.0). The significance of the differences was analyzed by Student's t-test and the
p value stated to be less than 0.5 was applied by using version 16.0 of the SPSS program.
3.9. Data analysis
The numbers of viable cells were counted by using a haemocytometer with trypan
blue exclusion. The MTT tests were carried out in triplicates and were repeated at least
three times. The data of the cytotoxicity assay were expressed as the mean ± standard
derivations (SD) by using Microsoft Excel software. The mean ± standard derivations
(SD) in each cell cycle phase as well as the Annexin V assay were also calculated. The
results from the treated and untreated control cells were analysed by Student’s t-test. The
statistical significance was considered when the p value is 0.05 by using version 16.0 of
the SPSS program.
3.10. Statistical analaysis
Data from cytotoxicity assay, Annexin V assay and cells cycle analysis were
analysed using Microsoft excel software to determine standard deviation. Statistical
analysis was then performed on data from Annexin V assay and cell cycle analysis using
SPSS 16.0 software.
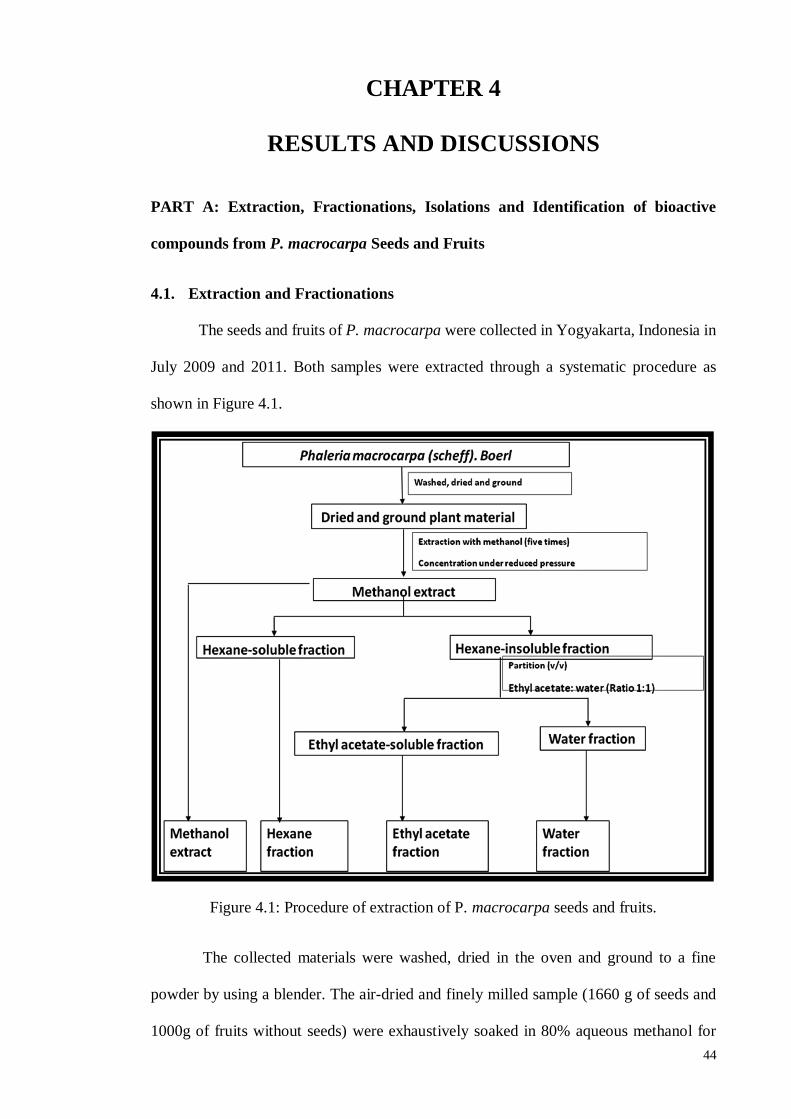
44
CHAPTER 4
RESULTS AND DISCUSSIONS
PART A: Extraction, Fractionations, Isolations and Identification of bioactive
compounds from P. macrocarpa Seeds and Fruits
4.1. Extraction and Fractionations
The seeds and fruits of P. macrocarpa were collected in Yogyakarta, Indonesia in
July 2009 and 2011. Both samples were extracted through a systematic procedure as
shown in Figure 4.1.
Figure 4.1: Procedure of extraction of P. macrocarpa seeds and fruits.
The collected materials were washed, dried in the oven and ground to a fine
powder by using a blender. The air-dried and finely milled sample (1660 g of seeds and
1000g of fruits without seeds) were exhaustively soaked in 80% aqueous methanol for
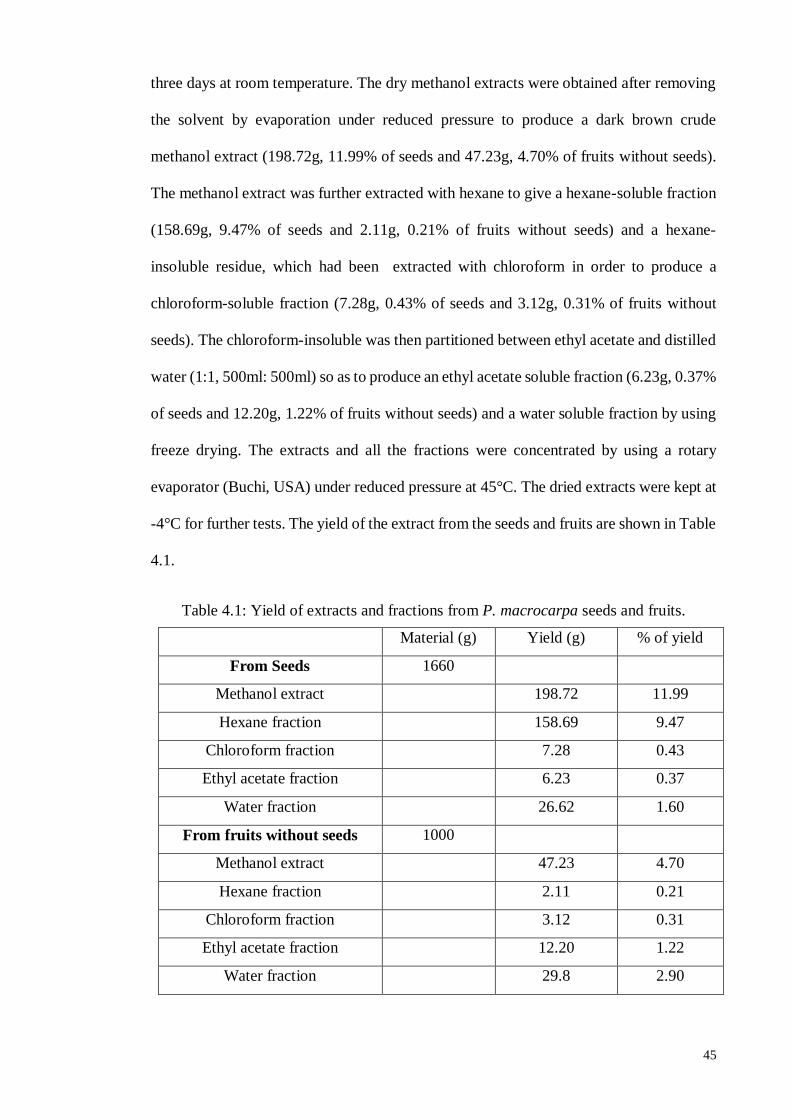
45
three days at room temperature. The dry methanol extracts were obtained after removing
the solvent by evaporation under reduced pressure to produce a dark brown crude
methanol extract (198.72g, 11.99% of seeds and 47.23g, 4.70% of fruits without seeds).
The methanol extract was further extracted with hexane to give a hexane-soluble fraction
(158.69g, 9.47% of seeds and 2.11g, 0.21% of fruits without seeds) and a hexane-
insoluble residue, which had been extracted with chloroform in order to produce a
chloroform-soluble fraction (7.28g, 0.43% of seeds and 3.12g, 0.31% of fruits without
seeds). The chloroform-insoluble was then partitioned between ethyl acetate and distilled
water (1:1, 500ml: 500ml) so as to produce an ethyl acetate soluble fraction (6.23g, 0.37%
of seeds and 12.20g, 1.22% of fruits without seeds) and a water soluble fraction by using
freeze drying. The extracts and all the fractions were concentrated by using a rotary
evaporator (Buchi, USA) under reduced pressure at 45°C. The dried extracts were kept at
-4°C for further tests. The yield of the extract from the seeds and fruits are shown in Table
4.1.
Table 4.1: Yield of extracts and fractions from P. macrocarpa seeds and fruits.
Material (g) Yield (g) % of yield
From Seeds 1660
Methanol extract 198.72 11.99
Hexane fraction 158.69 9.47
Chloroform fraction 7.28 0.43
Ethyl acetate fraction 6.23 0.37
Water fraction 26.62 1.60
From fruits without seeds 1000
Methanol extract 47.23 4.70
Hexane fraction 2.11 0.21
Chloroform fraction 3.12 0.31
Ethyl acetate fraction 12.20 1.22
Water fraction 29.8 2.90
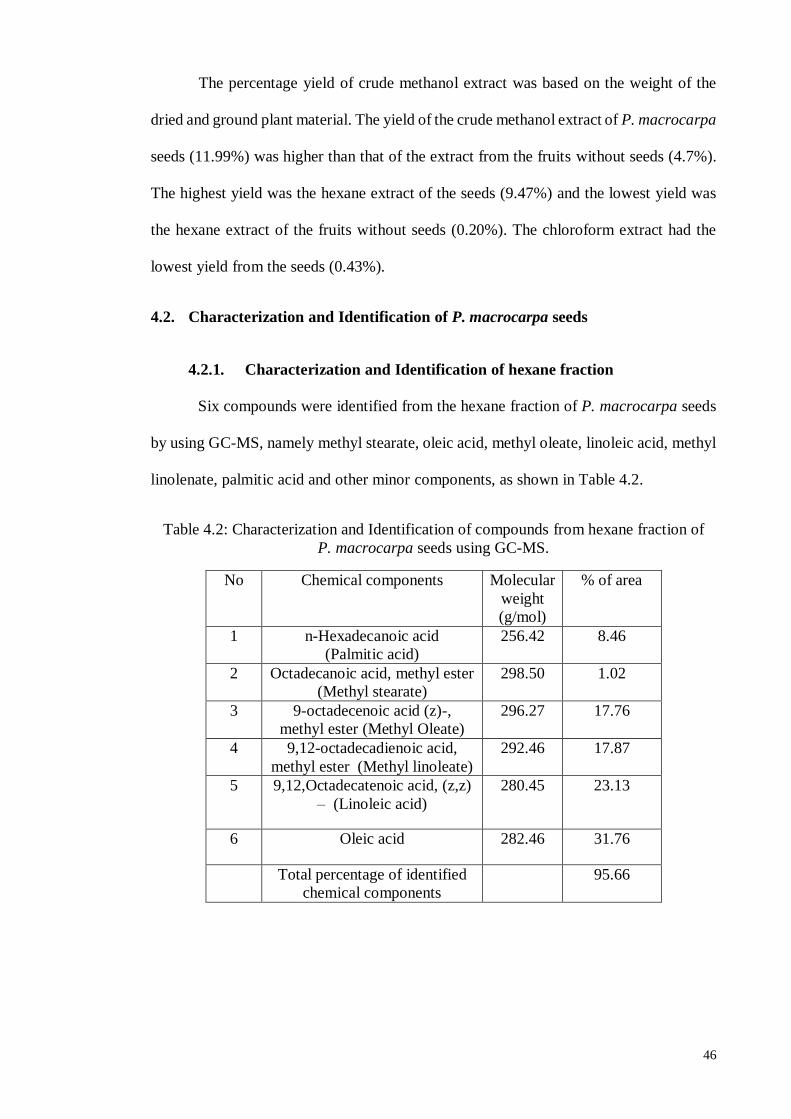
46
The percentage yield of crude methanol extract was based on the weight of the
dried and ground plant material. The yield of the crude methanol extract of P. macrocarpa
seeds (11.99%) was higher than that of the extract from the fruits without seeds (4.7%).
The highest yield was the hexane extract of the seeds (9.47%) and the lowest yield was
the hexane extract of the fruits without seeds (0.20%). The chloroform extract had the
lowest yield from the seeds (0.43%).
4.2. Characterization and Identification of P. macrocarpa seeds
4.2.1. Characterization and Identification of hexane fraction
Six compounds were identified from the hexane fraction of P. macrocarpa seeds
by using GC-MS, namely methyl stearate, oleic acid, methyl oleate, linoleic acid, methyl
linolenate, palmitic acid and other minor components, as shown in Table 4.2.
Table 4.2: Characterization and Identification of compounds from hexane fraction of
P. macrocarpa seeds using GC-MS.
No Chemical components Molecular
weight
(g/mol)
% of area
1 n-Hexadecanoic acid
(Palmitic acid)
256.42 8.46
2 Octadecanoic acid, methyl ester
(Methyl stearate)
298.50 1.02
3 9-octadecenoic acid (z)-,
methyl ester (Methyl Oleate)
296.27 17.76
4 9,12-octadecadienoic acid,
methyl ester (Methyl linoleate)
292.46 17.87
5 9,12,Octadecatenoic acid, (z,z)
– (Linoleic acid)
280.45 23.13
6 Oleic acid 282.46 31.76
Total percentage of identified
chemical components
95.66
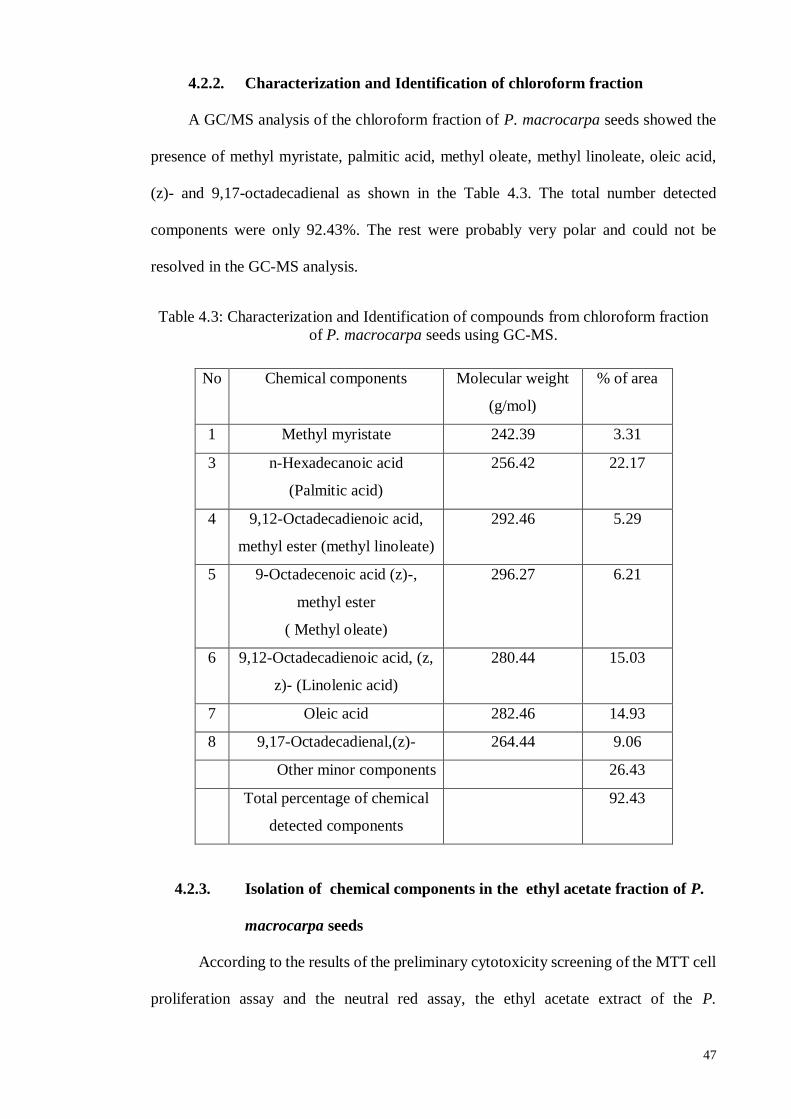
47
4.2.2. Characterization and Identification of chloroform fraction
A GC/MS analysis of the chloroform fraction of P. macrocarpa seeds showed the
presence of methyl myristate, palmitic acid, methyl oleate, methyl linoleate, oleic acid,
(z)- and 9,17-octadecadienal as shown in the Table 4.3. The total number detected
components were only 92.43%. The rest were probably very polar and could not be
resolved in the GC-MS analysis.
Table 4.3: Characterization and Identification of compounds from chloroform fraction
of P. macrocarpa seeds using GC-MS.
4.2.3. Isolation of chemical components in the ethyl acetate fraction of P.
macrocarpa seeds
According to the results of the preliminary cytotoxicity screening of the MTT cell
proliferation assay and the neutral red assay, the ethyl acetate extract of the P.
No Chemical components
Molecular weight
(g/mol)
% of area
1 Methyl myristate 242.39 3.31
3 n-Hexadecanoic acid
(Palmitic acid)
256.42 22.17
4 9,12-Octadecadienoic acid,
methyl ester (methyl linoleate)
292.46 5.29
5 9-Octadecenoic acid (z)-,
methyl ester
( Methyl oleate)
296.27 6.21
6 9,12-Octadecadienoic acid, (z,
z)- (Linolenic acid)
280.44 15.03
7 Oleic acid 282.46 14.93
8 9,17-Octadecadienal,(z)- 264.44 9.06
Other minor components 26.43
Total percentage of chemical
detected components
92.43
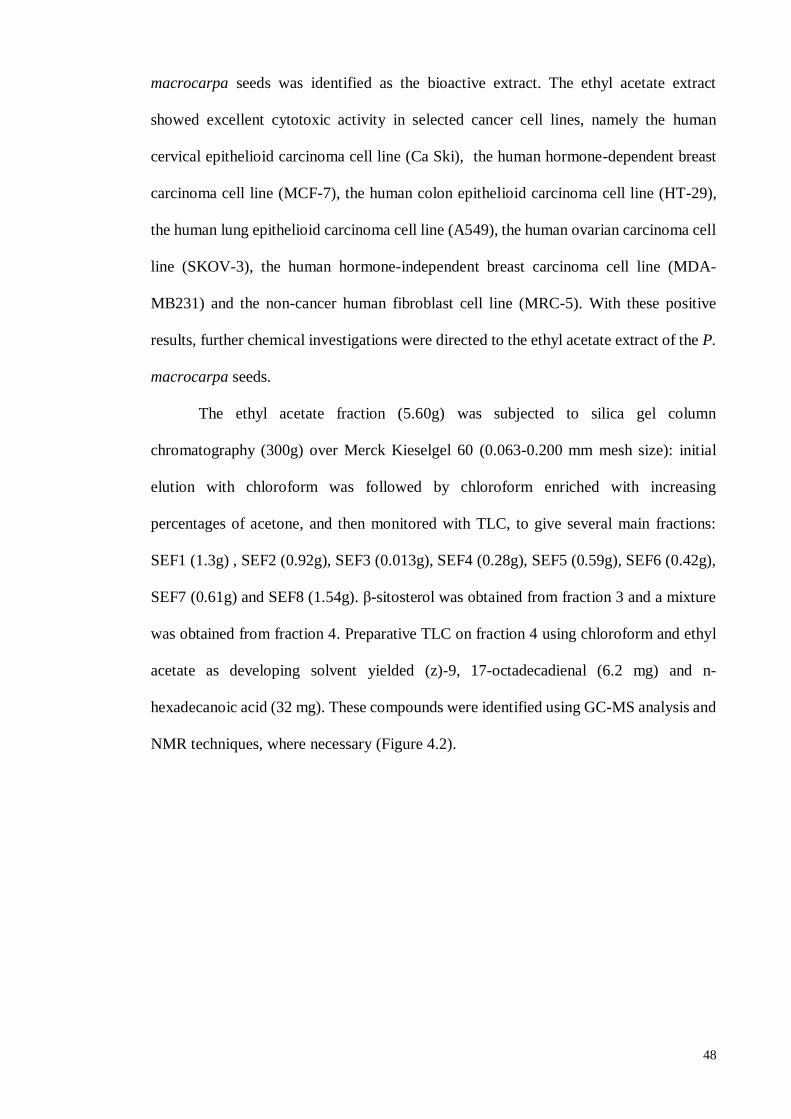
48
macrocarpa seeds was identified as the bioactive extract. The ethyl acetate extract
showed excellent cytotoxic activity in selected cancer cell lines, namely the human
cervical epithelioid carcinoma cell line (Ca Ski), the human hormone-dependent breast
carcinoma cell line (MCF-7), the human colon epithelioid carcinoma cell line (HT-29),
the human lung epithelioid carcinoma cell line (A549), the human ovarian carcinoma cell
line (SKOV-3), the human hormone-independent breast carcinoma cell line (MDA-
MB231) and the non-cancer human fibroblast cell line (MRC-5). With these positive
results, further chemical investigations were directed to the ethyl acetate extract of the P.
macrocarpa seeds.
The ethyl acetate fraction (5.60g) was subjected to silica gel column
chromatography (300g) over Merck Kieselgel 60 (0.063-0.200 mm mesh size): initial
elution with chloroform was followed by chloroform enriched with increasing
percentages of acetone, and then monitored with TLC, to give several main fractions:
SEF1 (1.3g) , SEF2 (0.92g), SEF3 (0.013g), SEF4 (0.28g), SEF5 (0.59g), SEF6 (0.42g),
SEF7 (0.61g) and SEF8 (1.54g). β-sitosterol was obtained from fraction 3 and a mixture
was obtained from fraction 4. Preparative TLC on fraction 4 using chloroform and ethyl
acetate as developing solvent yielded (z)-9, 17-octadecadienal (6.2 mg) and n-
hexadecanoic acid (32 mg). These compounds were identified using GC-MS analysis and
NMR techniques, where necessary (Figure 4.2).
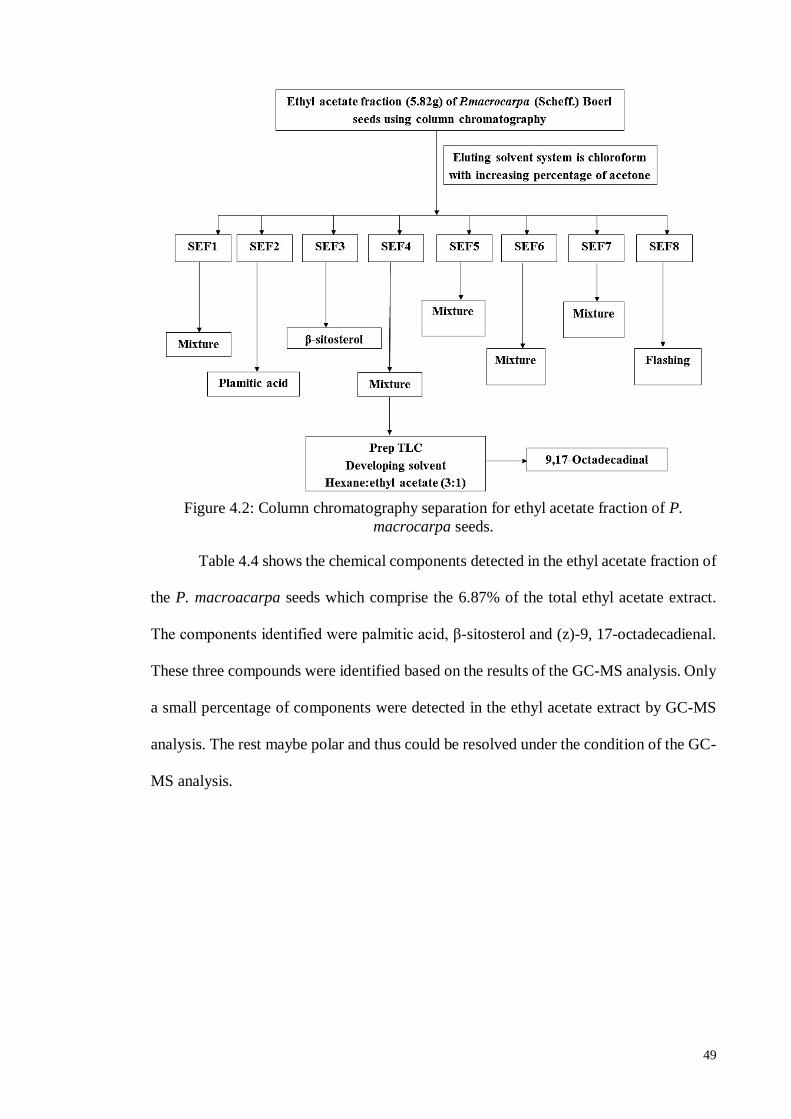
49
Figure 4.2: Column chromatography separation for ethyl acetate fraction of P.
macrocarpa seeds.
Table 4.4 shows the chemical components detected in the ethyl acetate fraction of
the P. macroacarpa seeds which comprise the 6.87% of the total ethyl acetate extract.
The components identified were palmitic acid, β-sitosterol and (z)-9, 17-octadecadienal.
These three compounds were identified based on the results of the GC-MS analysis. Only
a small percentage of components were detected in the ethyl acetate extract by GC-MS
analysis. The rest maybe polar and thus could be resolved under the condition of the GC-
MS analysis.
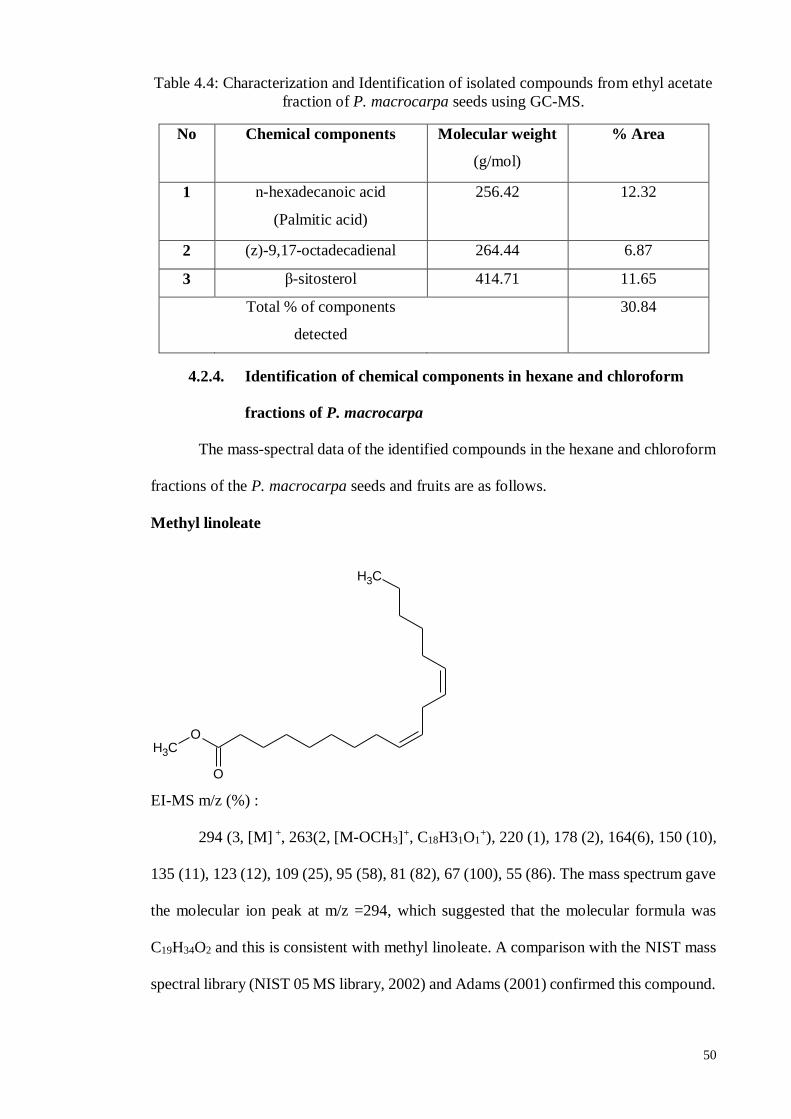
50
Table 4.4: Characterization and Identification of isolated compounds from ethyl acetate
fraction of P. macrocarpa seeds using GC-MS.
No Chemical components Molecular weight
(g/mol)
% Area
1 n-hexadecanoic acid
(Palmitic acid)
256.42 12.32
2 (z)-9,17-octadecadienal 264.44 6.87
3 β-sitosterol 414.71 11.65
Total % of components
detected
30.84
4.2.4. Identification of chemical components in hexane and chloroform
fractions of P. macrocarpa
The mass-spectral data of the identified compounds in the hexane and chloroform
fractions of the P. macrocarpa seeds and fruits are as follows.
Methyl linoleate
EI-MS m/z (%) :
294 (3, [M] +, 263(2, [M-OCH3]+, C18H31O1
+), 220 (1), 178 (2), 164(6), 150 (10),
135 (11), 123 (12), 109 (25), 95 (58), 81 (82), 67 (100), 55 (86). The mass spectrum gave
the molecular ion peak at m/z =294, which suggested that the molecular formula was
C19H34O2 and this is consistent with methyl linoleate. A comparison with the NIST mass
spectral library (NIST 05 MS library, 2002) and Adams (2001) confirmed this compound.
CH3
OCH3
O
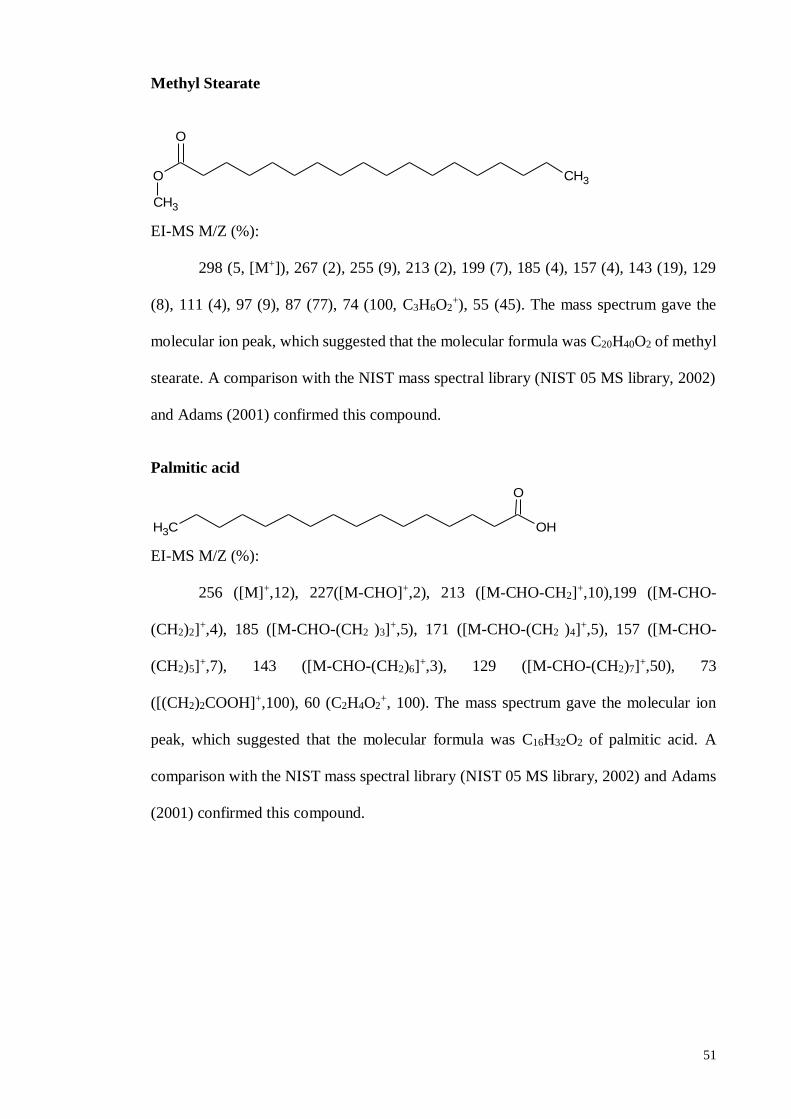
51
Methyl Stearate
EI-MS M/Z (%):
298 (5, [M+]), 267 (2), 255 (9), 213 (2), 199 (7), 185 (4), 157 (4), 143 (19), 129
(8), 111 (4), 97 (9), 87 (77), 74 (100, C3H6O2+), 55 (45). The mass spectrum gave the
molecular ion peak, which suggested that the molecular formula was C20H40O2 of methyl
stearate. A comparison with the NIST mass spectral library (NIST 05 MS library, 2002)
and Adams (2001) confirmed this compound.
Palmitic acid
EI-MS M/Z (%):
256 ([M]+,12), 227([M-CHO]+,2), 213 ([M-CHO-CH2]+,10),199 ([M-CHO-
(CH2)2]+,4), 185 ([M-CHO-(CH2 )3]
+,5), 171 ([M-CHO-(CH2 )4]+,5), 157 ([M-CHO-
(CH2)5]+,7), 143 ([M-CHO-(CH2)6]
+,3), 129 ([M-CHO-(CH2)7]+,50), 73
([(CH2)2COOH]+,100), 60 (C2H4O2+, 100). The mass spectrum gave the molecular ion
peak, which suggested that the molecular formula was C16H32O2 of palmitic acid. A
comparison with the NIST mass spectral library (NIST 05 MS library, 2002) and Adams
(2001) confirmed this compound.
O
CH3
CH3
O
CH3 OH
O
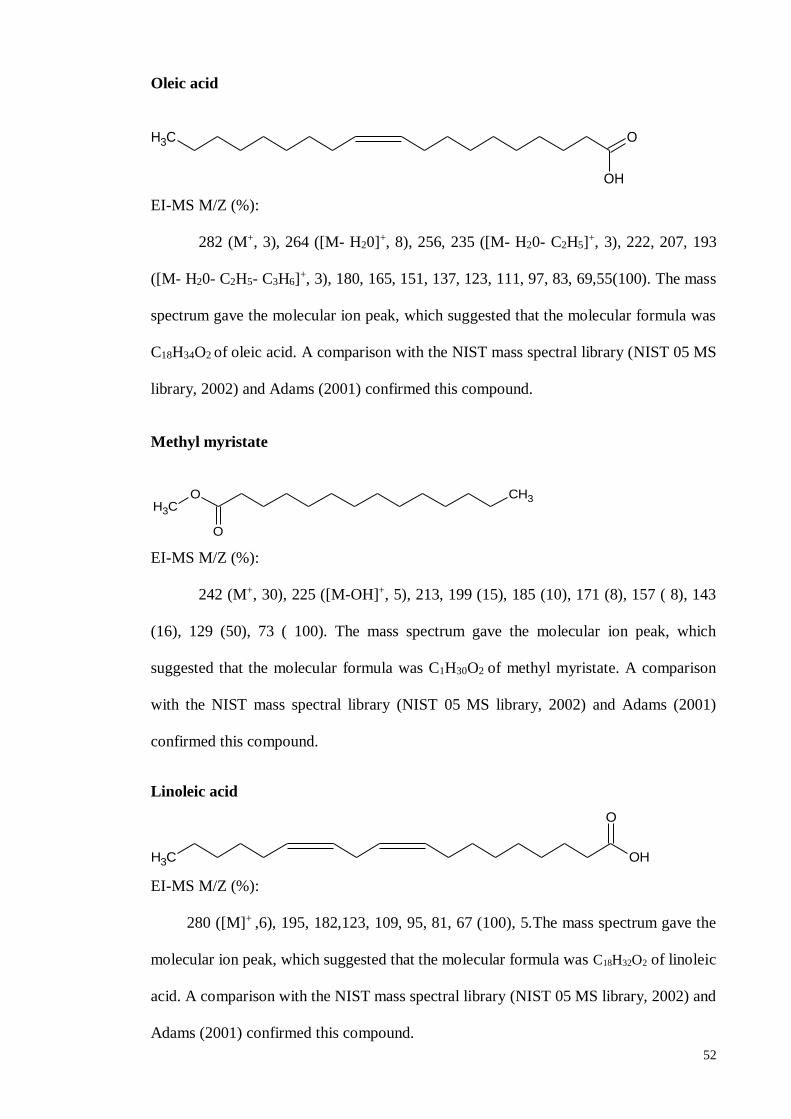
52
Oleic acid
CH3 O
OH
EI-MS M/Z (%):
282 (M+, 3), 264 ([M- H20]+, 8), 256, 235 ([M- H20- C2H5]+, 3), 222, 207, 193
([M- H20- C2H5- C3H6]+, 3), 180, 165, 151, 137, 123, 111, 97, 83, 69,55(100). The mass
spectrum gave the molecular ion peak, which suggested that the molecular formula was
C18H34O2 of oleic acid. A comparison with the NIST mass spectral library (NIST 05 MS
library, 2002) and Adams (2001) confirmed this compound.
Methyl myristate
EI-MS M/Z (%):
242 (M+, 30), 225 ([M-OH]+, 5), 213, 199 (15), 185 (10), 171 (8), 157 ( 8), 143
(16), 129 (50), 73 ( 100). The mass spectrum gave the molecular ion peak, which
suggested that the molecular formula was C1H30O2 of methyl myristate. A comparison
with the NIST mass spectral library (NIST 05 MS library, 2002) and Adams (2001)
confirmed this compound.
Linoleic acid
CH3 OH
O
EI-MS M/Z (%):
280 ([M]+ ,6), 195, 182,123, 109, 95, 81, 67 (100), 5.The mass spectrum gave the
molecular ion peak, which suggested that the molecular formula was C18H32O2 of linoleic
acid. A comparison with the NIST mass spectral library (NIST 05 MS library, 2002) and
Adams (2001) confirmed this compound.
O
OCH3
CH3
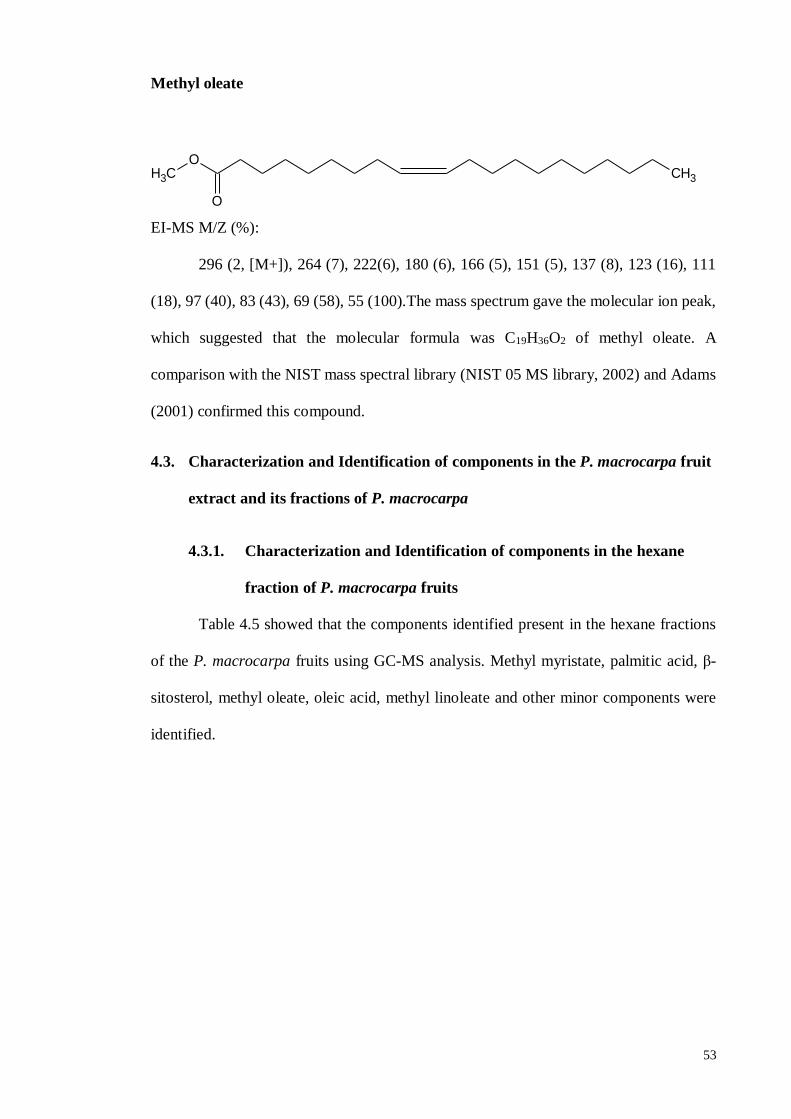
53
Methyl oleate
OCH3
O
CH3
EI-MS M/Z (%):
296 (2, [M+]), 264 (7), 222(6), 180 (6), 166 (5), 151 (5), 137 (8), 123 (16), 111
(18), 97 (40), 83 (43), 69 (58), 55 (100).The mass spectrum gave the molecular ion peak,
which suggested that the molecular formula was C19H36O2 of methyl oleate. A
comparison with the NIST mass spectral library (NIST 05 MS library, 2002) and Adams
(2001) confirmed this compound.
4.3. Characterization and Identification of components in the P. macrocarpa fruit
extract and its fractions of P. macrocarpa
4.3.1. Characterization and Identification of components in the hexane
fraction of P. macrocarpa fruits
Table 4.5 showed that the components identified present in the hexane fractions
of the P. macrocarpa fruits using GC-MS analysis. Methyl myristate, palmitic acid, β-
sitosterol, methyl oleate, oleic acid, methyl linoleate and other minor components were
identified.
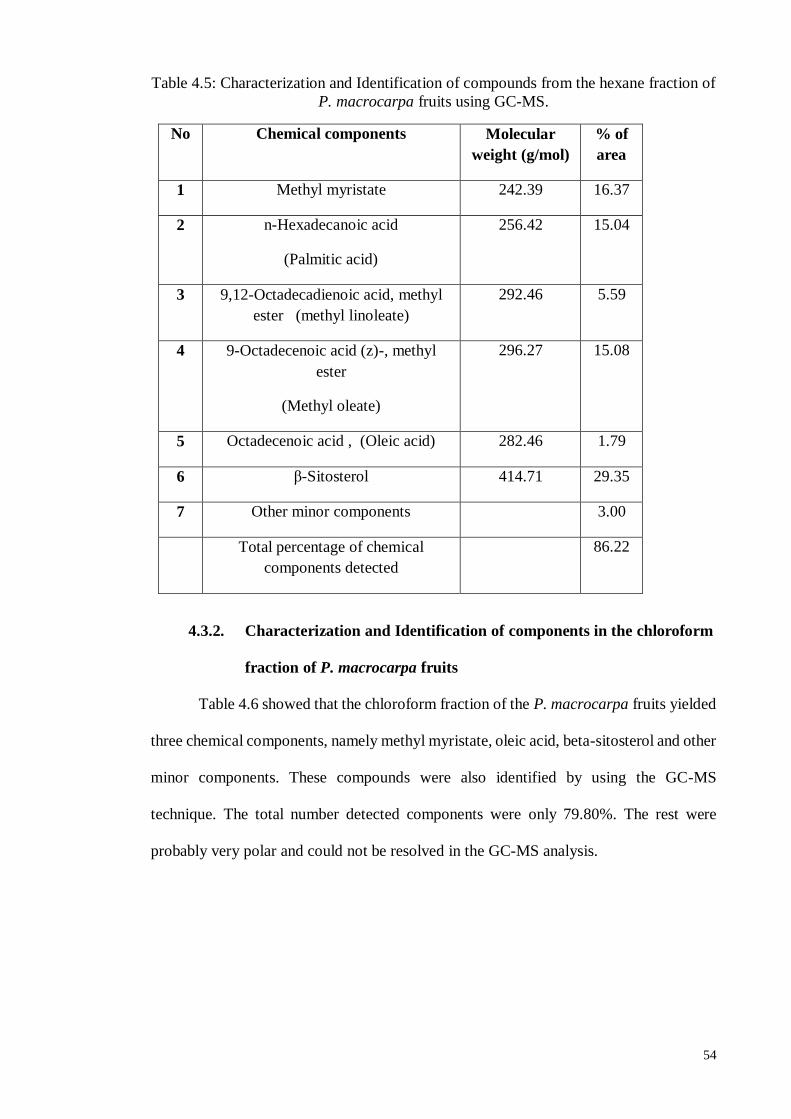
54
Table 4.5: Characterization and Identification of compounds from the hexane fraction of
P. macrocarpa fruits using GC-MS.
No Chemical components Molecular
weight (g/mol)
% of
area
1 Methyl myristate 242.39 16.37
2 n-Hexadecanoic acid
(Palmitic acid)
256.42 15.04
3 9,12-Octadecadienoic acid, methyl
ester (methyl linoleate)
292.46 5.59
4 9-Octadecenoic acid (z)-, methyl
ester
(Methyl oleate)
296.27 15.08
5 Octadecenoic acid , (Oleic acid) 282.46 1.79
6 β-Sitosterol 414.71 29.35
7 Other minor components 3.00
Total percentage of chemical
components detected
86.22
4.3.2. Characterization and Identification of components in the chloroform
fraction of P. macrocarpa fruits
Table 4.6 showed that the chloroform fraction of the P. macrocarpa fruits yielded
three chemical components, namely methyl myristate, oleic acid, beta-sitosterol and other
minor components. These compounds were also identified by using the GC-MS
technique. The total number detected components were only 79.80%. The rest were
probably very polar and could not be resolved in the GC-MS analysis.
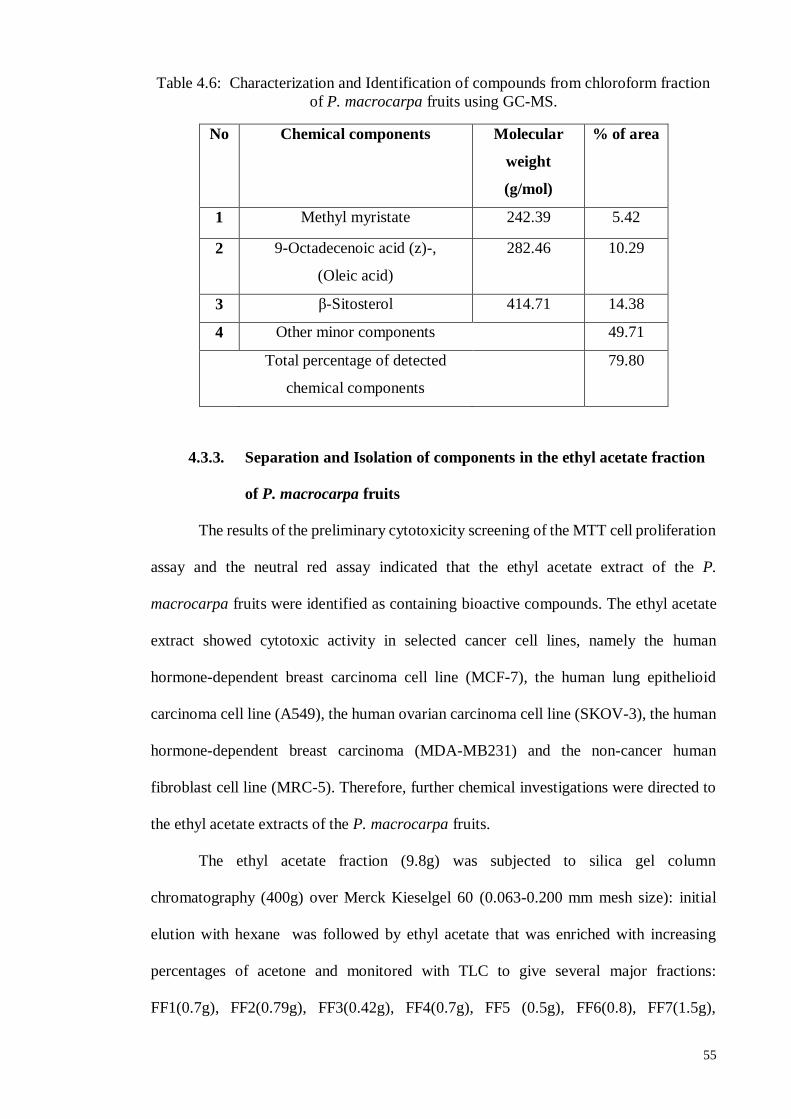
55
Table 4.6: Characterization and Identification of compounds from chloroform fraction
of P. macrocarpa fruits using GC-MS.
No Chemical components Molecular
weight
(g/mol)
% of area
1 Methyl myristate 242.39 5.42
2 9-Octadecenoic acid (z)-,
(Oleic acid)
282.46 10.29
3 β-Sitosterol 414.71 14.38
4 Other minor components 49.71
Total percentage of detected
chemical components
79.80
4.3.3. Separation and Isolation of components in the ethyl acetate fraction
of P. macrocarpa fruits
The results of the preliminary cytotoxicity screening of the MTT cell proliferation
assay and the neutral red assay indicated that the ethyl acetate extract of the P.
macrocarpa fruits were identified as containing bioactive compounds. The ethyl acetate
extract showed cytotoxic activity in selected cancer cell lines, namely the human
hormone-dependent breast carcinoma cell line (MCF-7), the human lung epithelioid
carcinoma cell line (A549), the human ovarian carcinoma cell line (SKOV-3), the human
hormone-dependent breast carcinoma (MDA-MB231) and the non-cancer human
fibroblast cell line (MRC-5). Therefore, further chemical investigations were directed to
the ethyl acetate extracts of the P. macrocarpa fruits.
The ethyl acetate fraction (9.8g) was subjected to silica gel column
chromatography (400g) over Merck Kieselgel 60 (0.063-0.200 mm mesh size): initial
elution with hexane was followed by ethyl acetate that was enriched with increasing
percentages of acetone and monitored with TLC to give several major fractions:
FF1(0.7g), FF2(0.79g), FF3(0.42g), FF4(0.7g), FF5 (0.5g), FF6(0.8), FF7(1.5g),
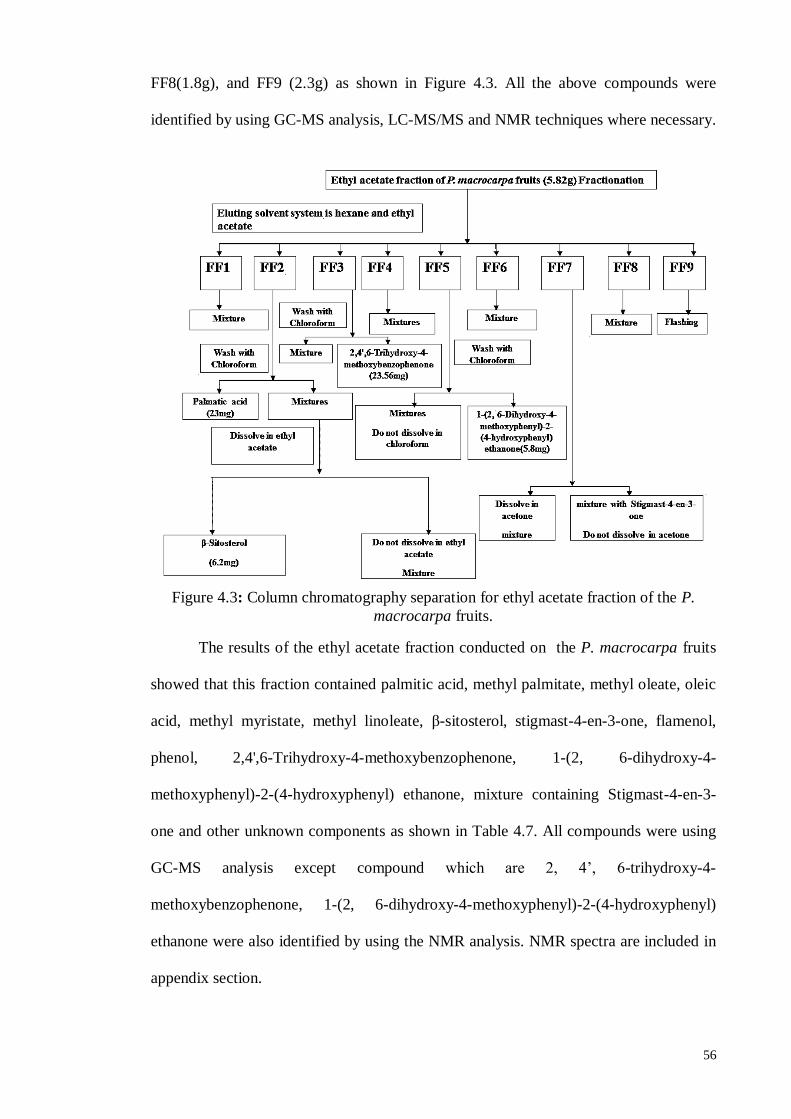
56
FF8(1.8g), and FF9 (2.3g) as shown in Figure 4.3. All the above compounds were
identified by using GC-MS analysis, LC-MS/MS and NMR techniques where necessary.
Figure 4.3: Column chromatography separation for ethyl acetate fraction of the P.
macrocarpa fruits.
The results of the ethyl acetate fraction conducted on the P. macrocarpa fruits
showed that this fraction contained palmitic acid, methyl palmitate, methyl oleate, oleic
acid, methyl myristate, methyl linoleate, β-sitosterol, stigmast-4-en-3-one, flamenol,
phenol, 2,4',6-Trihydroxy-4-methoxybenzophenone, 1-(2, 6-dihydroxy-4-
methoxyphenyl)-2-(4-hydroxyphenyl) ethanone, mixture containing Stigmast-4-en-3-
one and other unknown components as shown in Table 4.7. All compounds were using
GC-MS analysis except compound which are 2, 4’, 6-trihydroxy-4-
methoxybenzophenone, 1-(2, 6-dihydroxy-4-methoxyphenyl)-2-(4-hydroxyphenyl)
ethanone were also identified by using the NMR analysis. NMR spectra are included in
appendix section.
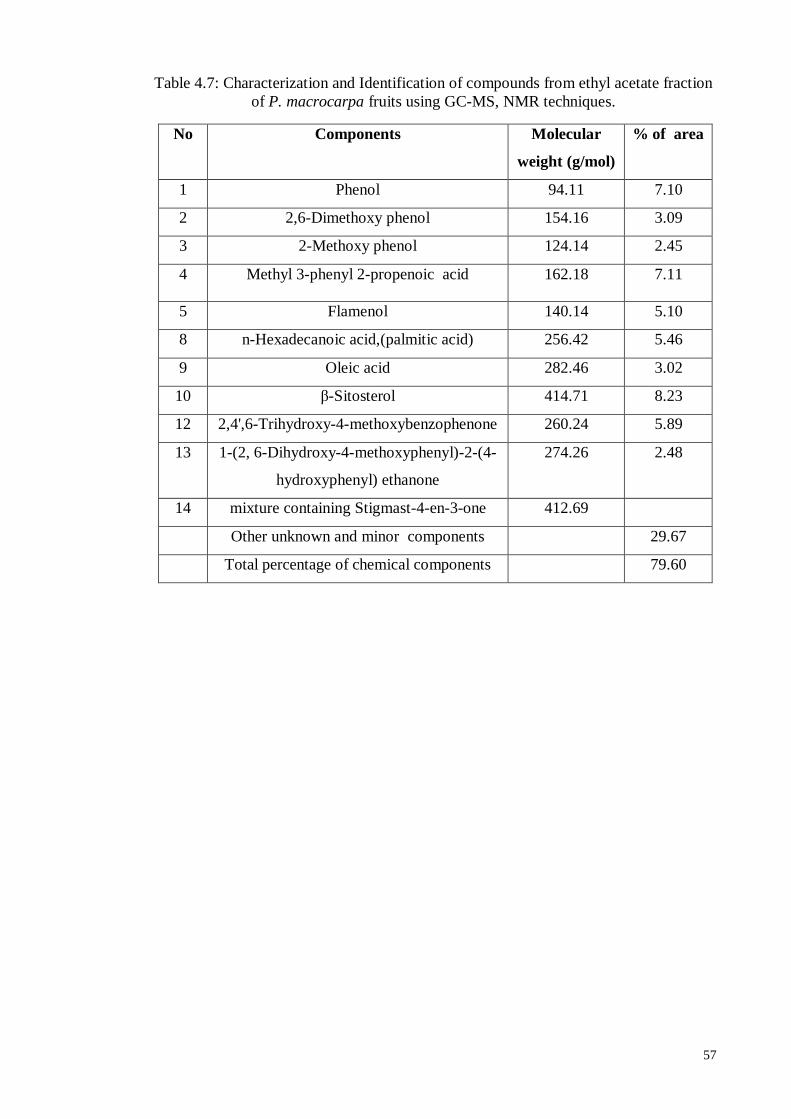
57
Table 4.7: Characterization and Identification of compounds from ethyl acetate fraction
of P. macrocarpa fruits using GC-MS, NMR techniques.
No Components Molecular
weight (g/mol)
% of area
1 Phenol 94.11 7.10
2 2,6-Dimethoxy phenol 154.16 3.09
3 2-Methoxy phenol 124.14 2.45
4 Methyl 3-phenyl 2-propenoic acid 162.18 7.11
5 Flamenol 140.14 5.10
8 n-Hexadecanoic acid,(palmitic acid) 256.42 5.46
9 Oleic acid 282.46 3.02
10 β-Sitosterol 414.71 8.23
12 2,4',6-Trihydroxy-4-methoxybenzophenone 260.24 5.89
13 1-(2, 6-Dihydroxy-4-methoxyphenyl)-2-(4-
hydroxyphenyl) ethanone
274.26 2.48
14 mixture containing Stigmast-4-en-3-one 412.69
Other unknown and minor components 29.67
Total percentage of chemical components 79.60
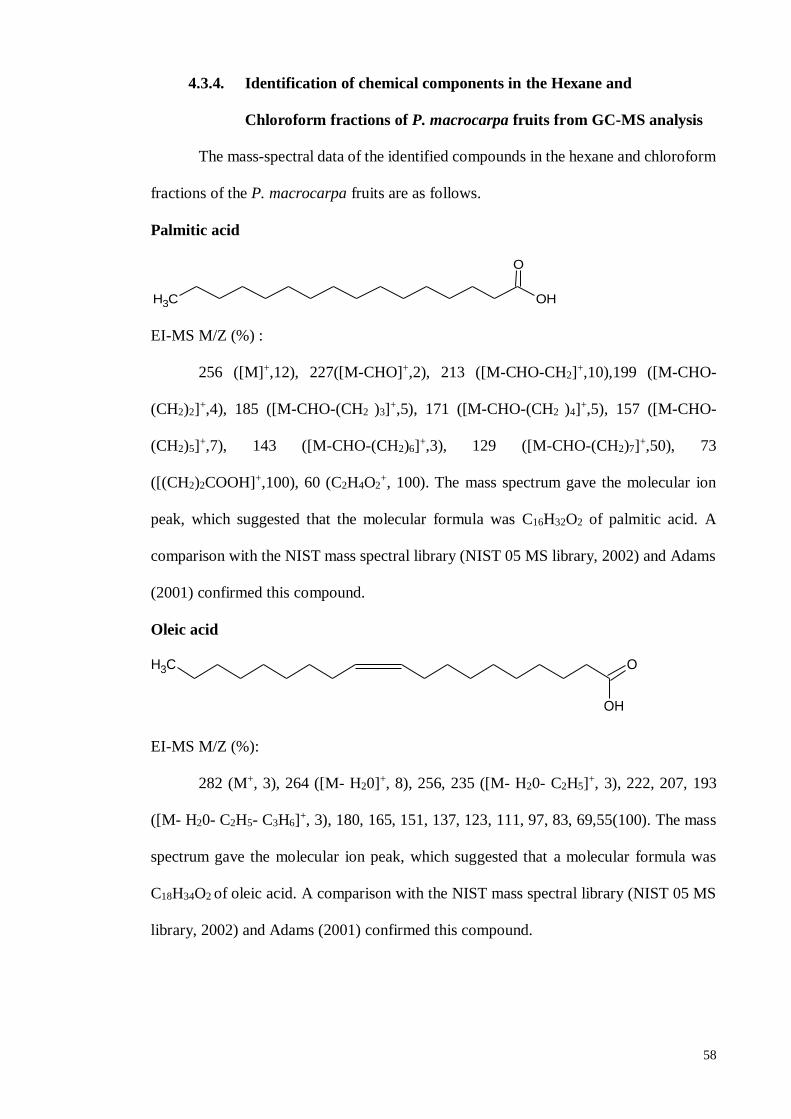
58
4.3.4. Identification of chemical components in the Hexane and
Chloroform fractions of P. macrocarpa fruits from GC-MS analysis
The mass-spectral data of the identified compounds in the hexane and chloroform
fractions of the P. macrocarpa fruits are as follows.
Palmitic acid
EI-MS M/Z (%) :
256 ([M]+,12), 227([M-CHO]+,2), 213 ([M-CHO-CH2]+,10),199 ([M-CHO-
(CH2)2]+,4), 185 ([M-CHO-(CH2 )3]
+,5), 171 ([M-CHO-(CH2 )4]+,5), 157 ([M-CHO-
(CH2)5]+,7), 143 ([M-CHO-(CH2)6]
+,3), 129 ([M-CHO-(CH2)7]+,50), 73
([(CH2)2COOH]+,100), 60 (C2H4O2+, 100). The mass spectrum gave the molecular ion
peak, which suggested that the molecular formula was C16H32O2 of palmitic acid. A
comparison with the NIST mass spectral library (NIST 05 MS library, 2002) and Adams
(2001) confirmed this compound.
Oleic acid
CH3 O
OH
EI-MS M/Z (%):
282 (M+, 3), 264 ([M- H20]+, 8), 256, 235 ([M- H20- C2H5]+, 3), 222, 207, 193
([M- H20- C2H5- C3H6]+, 3), 180, 165, 151, 137, 123, 111, 97, 83, 69,55(100). The mass
spectrum gave the molecular ion peak, which suggested that a molecular formula was
C18H34O2 of oleic acid. A comparison with the NIST mass spectral library (NIST 05 MS
library, 2002) and Adams (2001) confirmed this compound.
CH3 OH
O
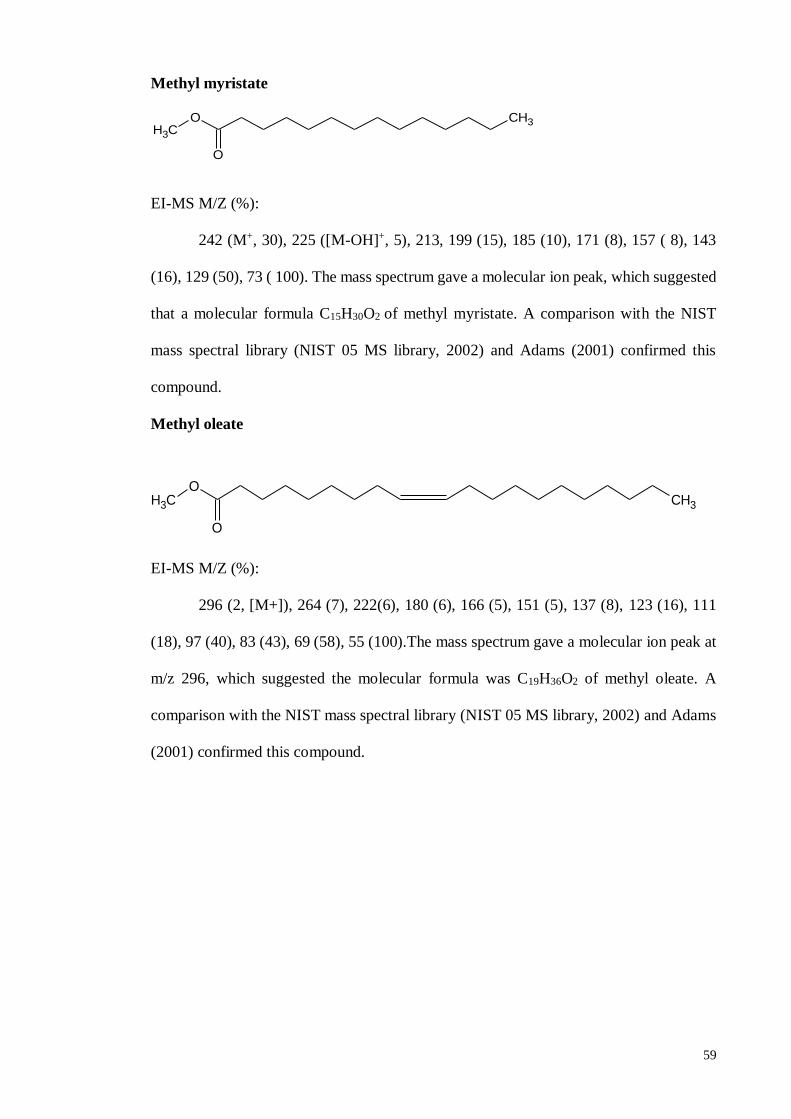
59
Methyl myristate
EI-MS M/Z (%):
242 (M+, 30), 225 ([M-OH]+, 5), 213, 199 (15), 185 (10), 171 (8), 157 ( 8), 143
(16), 129 (50), 73 ( 100). The mass spectrum gave a molecular ion peak, which suggested
that a molecular formula C15H30O2 of methyl myristate. A comparison with the NIST
mass spectral library (NIST 05 MS library, 2002) and Adams (2001) confirmed this
compound.
Methyl oleate
OCH3
O
CH3
EI-MS M/Z (%):
296 (2, [M+]), 264 (7), 222(6), 180 (6), 166 (5), 151 (5), 137 (8), 123 (16), 111
(18), 97 (40), 83 (43), 69 (58), 55 (100).The mass spectrum gave a molecular ion peak at
m/z 296, which suggested the molecular formula was C19H36O2 of methyl oleate. A
comparison with the NIST mass spectral library (NIST 05 MS library, 2002) and Adams
(2001) confirmed this compound.
O
OCH3
CH3
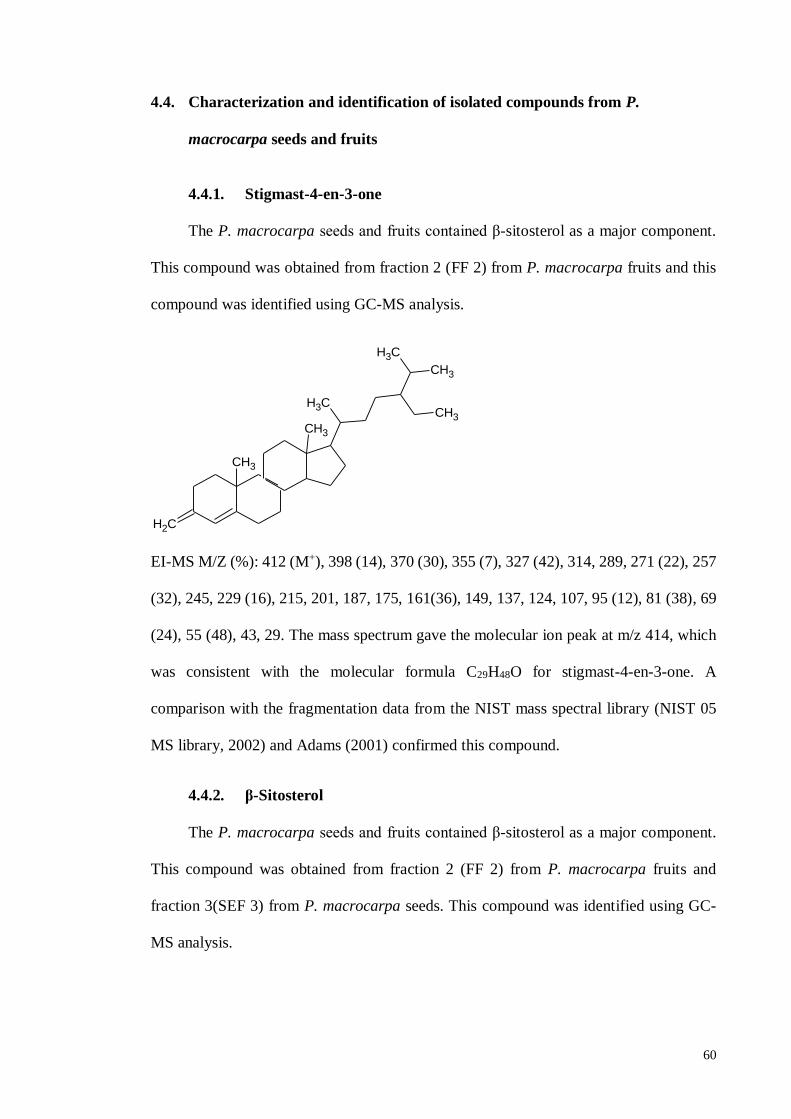
60
4.4. Characterization and identification of isolated compounds from P.
macrocarpa seeds and fruits
4.4.1. Stigmast-4-en-3-one
The P. macrocarpa seeds and fruits contained β-sitosterol as a major component.
This compound was obtained from fraction 2 (FF 2) from P. macrocarpa fruits and this
compound was identified using GC-MS analysis.
EI-MS M/Z (%): 412 (M+), 398 (14), 370 (30), 355 (7), 327 (42), 314, 289, 271 (22), 257
(32), 245, 229 (16), 215, 201, 187, 175, 161(36), 149, 137, 124, 107, 95 (12), 81 (38), 69
(24), 55 (48), 43, 29. The mass spectrum gave the molecular ion peak at m/z 414, which
was consistent with the molecular formula C29H48O for stigmast-4-en-3-one. A
comparison with the fragmentation data from the NIST mass spectral library (NIST 05
MS library, 2002) and Adams (2001) confirmed this compound.
4.4.2. β-Sitosterol
The P. macrocarpa seeds and fruits contained β-sitosterol as a major component.
This compound was obtained from fraction 2 (FF 2) from P. macrocarpa fruits and
fraction 3(SEF 3) from P. macrocarpa seeds. This compound was identified using GC-
MS analysis.
CH3
CH2
CH3
CH3
CH3
CH3
CH3
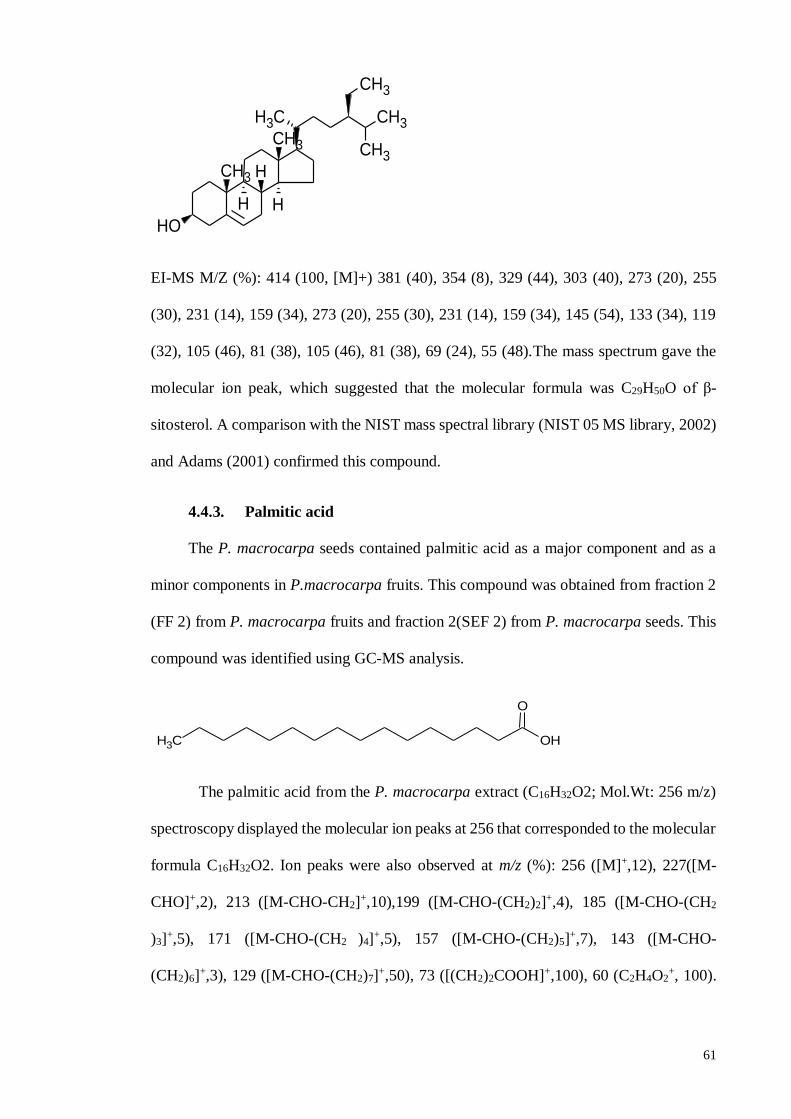
61
EI-MS M/Z (%): 414 (100, [M]+) 381 (40), 354 (8), 329 (44), 303 (40), 273 (20), 255
(30), 231 (14), 159 (34), 273 (20), 255 (30), 231 (14), 159 (34), 145 (54), 133 (34), 119
(32), 105 (46), 81 (38), 105 (46), 81 (38), 69 (24), 55 (48).The mass spectrum gave the
molecular ion peak, which suggested that the molecular formula was C29H50O of β-
sitosterol. A comparison with the NIST mass spectral library (NIST 05 MS library, 2002)
and Adams (2001) confirmed this compound.
4.4.3. Palmitic acid
The P. macrocarpa seeds contained palmitic acid as a major component and as a
minor components in P.macrocarpa fruits. This compound was obtained from fraction 2
(FF 2) from P. macrocarpa fruits and fraction 2(SEF 2) from P. macrocarpa seeds. This
compound was identified using GC-MS analysis.
The palmitic acid from the P. macrocarpa extract (C16H32O2; Mol.Wt: 256 m/z)
spectroscopy displayed the molecular ion peaks at 256 that corresponded to the molecular
formula C16H32O2. Ion peaks were also observed at m/z (%): 256 ([M]+,12), 227([M-
CHO]+,2), 213 ([M-CHO-CH2]+,10),199 ([M-CHO-(CH2)2]
+,4), 185 ([M-CHO-(CH2
)3]+,5), 171 ([M-CHO-(CH2 )4]
+,5), 157 ([M-CHO-(CH2)5]+,7), 143 ([M-CHO-
(CH2)6]+,3), 129 ([M-CHO-(CH2)7]
+,50), 73 ([(CH2)2COOH]+,100), 60 (C2H4O2+, 100).
CH3CH3
HH
OH
CH3 H
CH3
CH3
CH3
CH3 OH
O
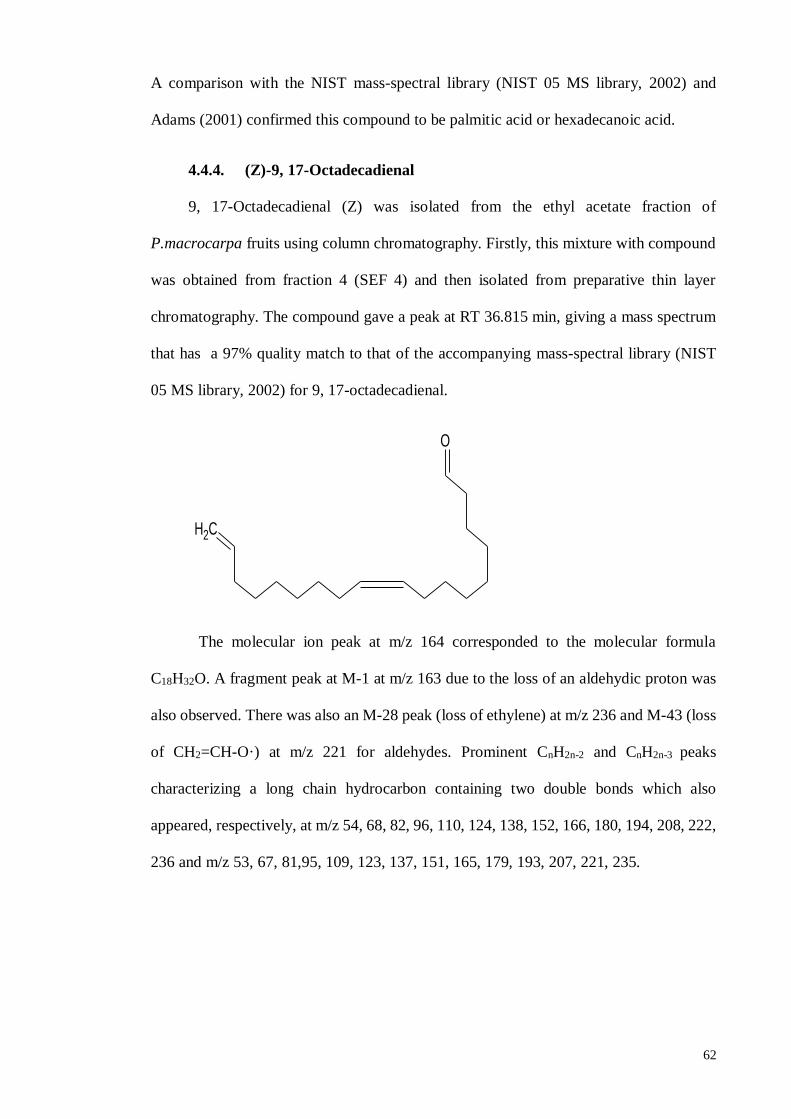
62
A comparison with the NIST mass-spectral library (NIST 05 MS library, 2002) and
Adams (2001) confirmed this compound to be palmitic acid or hexadecanoic acid.
4.4.4. (Z)-9, 17-Octadecadienal
9, 17-Octadecadienal (Z) was isolated from the ethyl acetate fraction of
P.macrocarpa fruits using column chromatography. Firstly, this mixture with compound
was obtained from fraction 4 (SEF 4) and then isolated from preparative thin layer
chromatography. The compound gave a peak at RT 36.815 min, giving a mass spectrum
that has a 97% quality match to that of the accompanying mass-spectral library (NIST
05 MS library, 2002) for 9, 17-octadecadienal.
The molecular ion peak at m/z 164 corresponded to the molecular formula
C18H32O. A fragment peak at M-1 at m/z 163 due to the loss of an aldehydic proton was
also observed. There was also an M-28 peak (loss of ethylene) at m/z 236 and M-43 (loss
of CH2=CH-O·) at m/z 221 for aldehydes. Prominent CnH2n-2 and CnH2n-3 peaks
characterizing a long chain hydrocarbon containing two double bonds which also
appeared, respectively, at m/z 54, 68, 82, 96, 110, 124, 138, 152, 166, 180, 194, 208, 222,
236 and m/z 53, 67, 81,95, 109, 123, 137, 151, 165, 179, 193, 207, 221, 235.
CH2
O
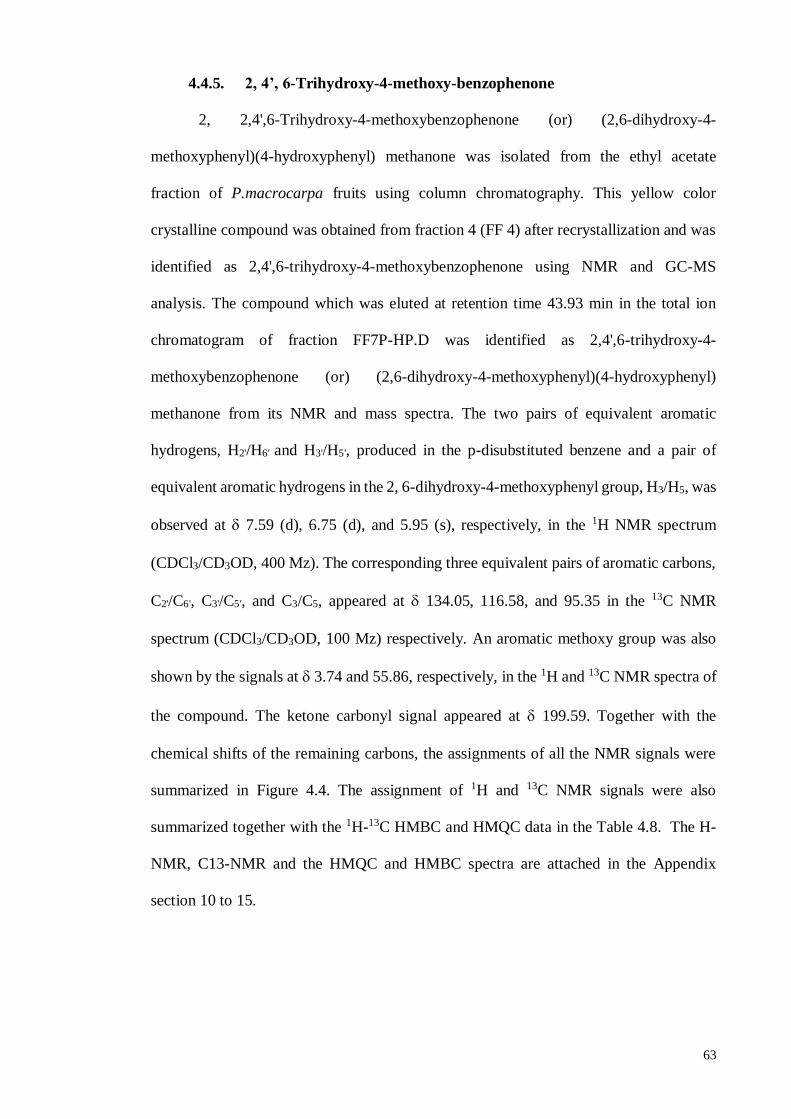
63
4.4.5. 2, 4’, 6-Trihydroxy-4-methoxy-benzophenone
2, 2,4',6-Trihydroxy-4-methoxybenzophenone (or) (2,6-dihydroxy-4-
methoxyphenyl)(4-hydroxyphenyl) methanone was isolated from the ethyl acetate
fraction of P.macrocarpa fruits using column chromatography. This yellow color
crystalline compound was obtained from fraction 4 (FF 4) after recrystallization and was
identified as 2,4',6-trihydroxy-4-methoxybenzophenone using NMR and GC-MS
analysis. The compound which was eluted at retention time 43.93 min in the total ion
chromatogram of fraction FF7P-HP.D was identified as 2,4',6-trihydroxy-4-
methoxybenzophenone (or) (2,6-dihydroxy-4-methoxyphenyl)(4-hydroxyphenyl)
methanone from its NMR and mass spectra. The two pairs of equivalent aromatic
hydrogens, H2'/H6' and H3'/H5', produced in the p-disubstituted benzene and a pair of
equivalent aromatic hydrogens in the 2, 6-dihydroxy-4-methoxyphenyl group, H3/H5, was
observed at 7.59 (d), 6.75 (d), and 5.95 (s), respectively, in the 1H NMR spectrum
(CDCl3/CD3OD, 400 Mz). The corresponding three equivalent pairs of aromatic carbons,
C2'/C6', C3'/C5', and C3/C5, appeared at 134.05, 116.58, and 95.35 in the 13C NMR
spectrum (CDCl3/CD3OD, 100 Mz) respectively. An aromatic methoxy group was also
shown by the signals at 3.74 and 55.86, respectively, in the 1H and 13C NMR spectra of
the compound. The ketone carbonyl signal appeared at 199.59. Together with the
chemical shifts of the remaining carbons, the assignments of all the NMR signals were
summarized in Figure 4.4. The assignment of 1H and 13C NMR signals were also
summarized together with the 1H-13C HMBC and HMQC data in the Table 4.8. The H-
NMR, C13-NMR and the HMQC and HMBC spectra are attached in the Appendix
section 10 to 15.
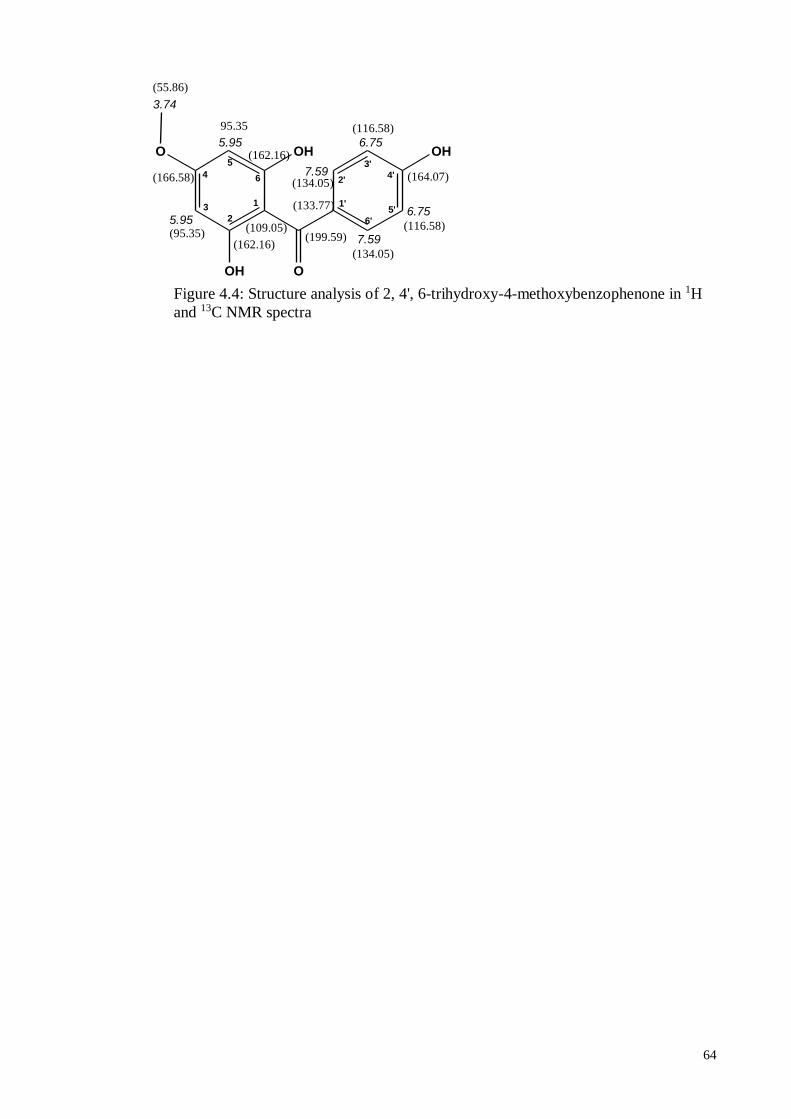
64
O OH
OH O
5.95
95.35
5.95(95.35)
3.74
(166.58)
(162.16)
(162.16)(199.59)
(55.86)
OH
(109.05)
(133.77)
(134.05)
7.59
7.59(134.05)
6.75
6.75
(116.58)
(116.58)
(164.07)
1
2
3
4
5
6
1'
2'
3'
4'
5'
6'
Figure 4.4: Structure analysis of 2, 4', 6-trihydroxy-4-methoxybenzophenone in 1H
and 13C NMR spectra
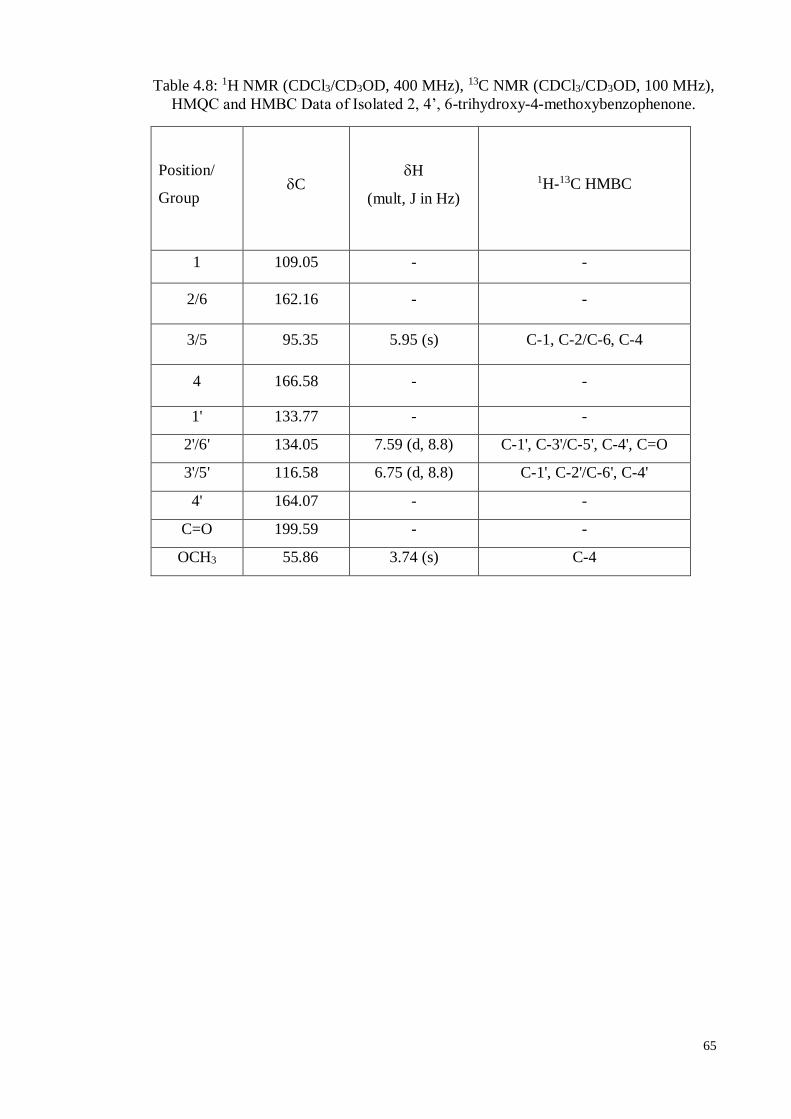
65
Table 4.8: 1H NMR (CDCl3/CD3OD, 400 MHz), 13C NMR (CDCl3/CD3OD, 100 MHz),
HMQC and HMBC Data of Isolated 2, 4’, 6-trihydroxy-4-methoxybenzophenone.
Position/
Group C
H
(mult, J in Hz)
1H-13C HMBC
1 109.05 - -
2/6 162.16 - -
3/5 95.35 5.95 (s) C-1, C-2/C-6, C-4
4 166.58 - -
1' 133.77 - -
2'/6' 134.05 7.59 (d, 8.8) C-1', C-3'/C-5', C-4', C=O
3'/5' 116.58 6.75 (d, 8.8) C-1', C-2'/C-6', C-4'
4' 164.07 - -
C=O 199.59 - -
OCH3 55.86 3.74 (s) C-4
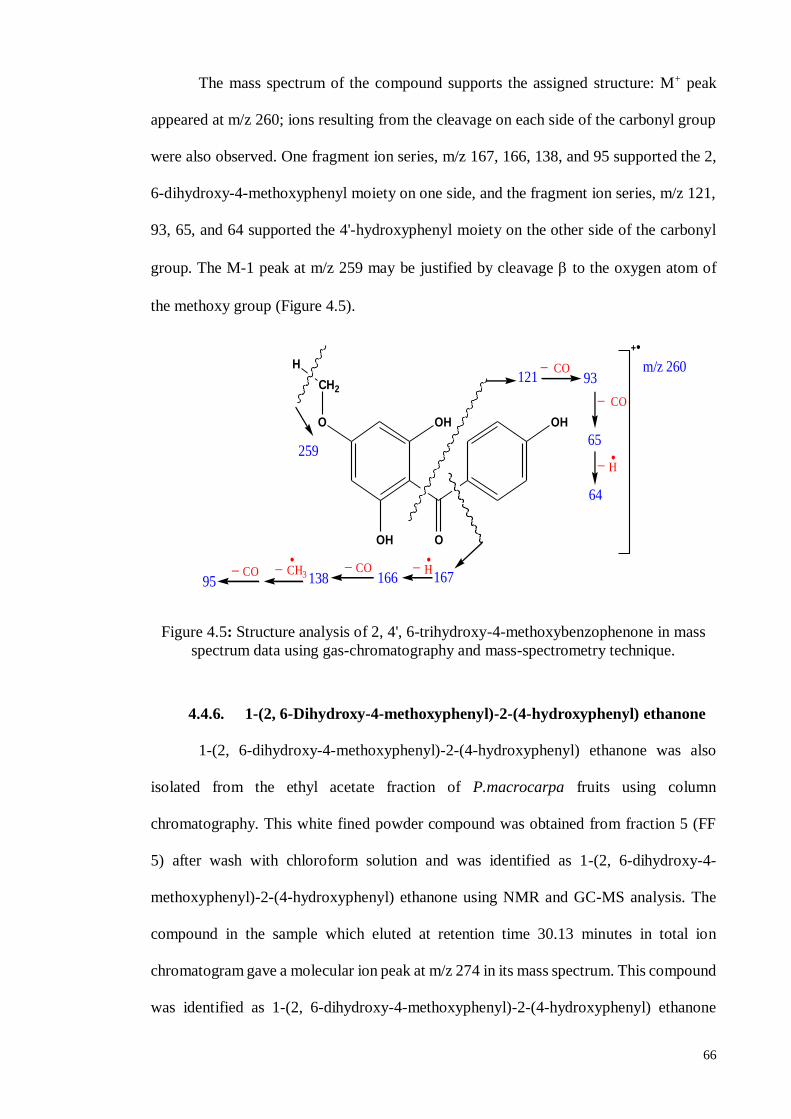
66
The mass spectrum of the compound supports the assigned structure: M+ peak
appeared at m/z 260; ions resulting from the cleavage on each side of the carbonyl group
were also observed. One fragment ion series, m/z 167, 166, 138, and 95 supported the 2,
6-dihydroxy-4-methoxyphenyl moiety on one side, and the fragment ion series, m/z 121,
93, 65, and 64 supported the 4'-hydroxyphenyl moiety on the other side of the carbonyl
group. The M-1 peak at m/z 259 may be justified by cleavage to the oxygen atom of
the methoxy group (Figure 4.5).
Figure 4.5: Structure analysis of 2, 4', 6-trihydroxy-4-methoxybenzophenone in mass
spectrum data using gas-chromatography and mass-spectrometry technique.
4.4.6. 1-(2, 6-Dihydroxy-4-methoxyphenyl)-2-(4-hydroxyphenyl) ethanone
1-(2, 6-dihydroxy-4-methoxyphenyl)-2-(4-hydroxyphenyl) ethanone was also
isolated from the ethyl acetate fraction of P.macrocarpa fruits using column
chromatography. This white fined powder compound was obtained from fraction 5 (FF
5) after wash with chloroform solution and was identified as 1-(2, 6-dihydroxy-4-
methoxyphenyl)-2-(4-hydroxyphenyl) ethanone using NMR and GC-MS analysis. The
compound in the sample which eluted at retention time 30.13 minutes in total ion
chromatogram gave a molecular ion peak at m/z 274 in its mass spectrum. This compound
was identified as 1-(2, 6-dihydroxy-4-methoxyphenyl)-2-(4-hydroxyphenyl) ethanone
O OH
OH O
CH2
OH
H
259
121 93CO
_
CO_
65
64
167166H
_CO_
138CH3
H_
_CO
_95
m/z 260
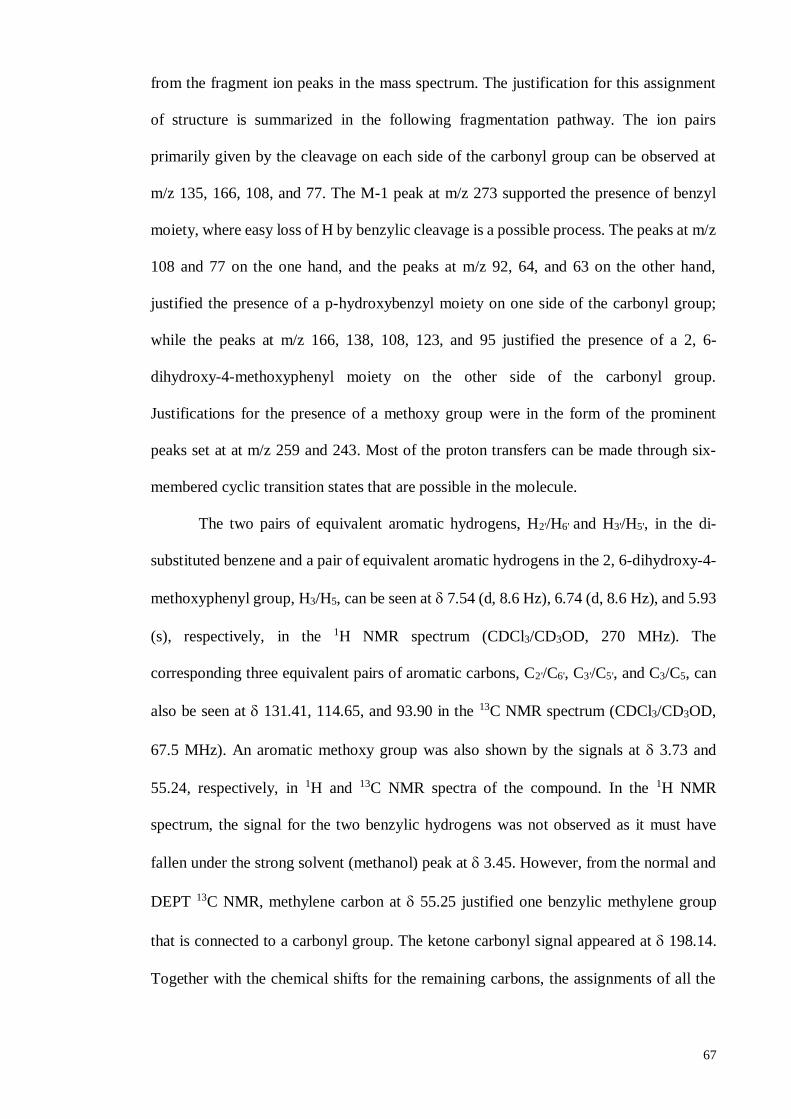
67
from the fragment ion peaks in the mass spectrum. The justification for this assignment
of structure is summarized in the following fragmentation pathway. The ion pairs
primarily given by the cleavage on each side of the carbonyl group can be observed at
m/z 135, 166, 108, and 77. The M-1 peak at m/z 273 supported the presence of benzyl
moiety, where easy loss of H by benzylic cleavage is a possible process. The peaks at m/z
108 and 77 on the one hand, and the peaks at m/z 92, 64, and 63 on the other hand,
justified the presence of a p-hydroxybenzyl moiety on one side of the carbonyl group;
while the peaks at m/z 166, 138, 108, 123, and 95 justified the presence of a 2, 6-
dihydroxy-4-methoxyphenyl moiety on the other side of the carbonyl group.
Justifications for the presence of a methoxy group were in the form of the prominent
peaks set at at m/z 259 and 243. Most of the proton transfers can be made through six-
membered cyclic transition states that are possible in the molecule.
The two pairs of equivalent aromatic hydrogens, H2'/H6' and H3'/H5', in the di-
substituted benzene and a pair of equivalent aromatic hydrogens in the 2, 6-dihydroxy-4-
methoxyphenyl group, H3/H5, can be seen at 7.54 (d, 8.6 Hz), 6.74 (d, 8.6 Hz), and 5.93
(s), respectively, in the 1H NMR spectrum (CDCl3/CD3OD, 270 MHz). The
corresponding three equivalent pairs of aromatic carbons, C2'/C6', C3'/C5', and C3/C5, can
also be seen at 131.41, 114.65, and 93.90 in the 13C NMR spectrum (CDCl3/CD3OD,
67.5 MHz). An aromatic methoxy group was also shown by the signals at 3.73 and
55.24, respectively, in 1H and 13C NMR spectra of the compound. In the 1H NMR
spectrum, the signal for the two benzylic hydrogens was not observed as it must have
fallen under the strong solvent (methanol) peak at 3.45. However, from the normal and
DEPT 13C NMR, methylene carbon at 55.25 justified one benzylic methylene group
that is connected to a carbonyl group. The ketone carbonyl signal appeared at 198.14.
Together with the chemical shifts for the remaining carbons, the assignments of all the
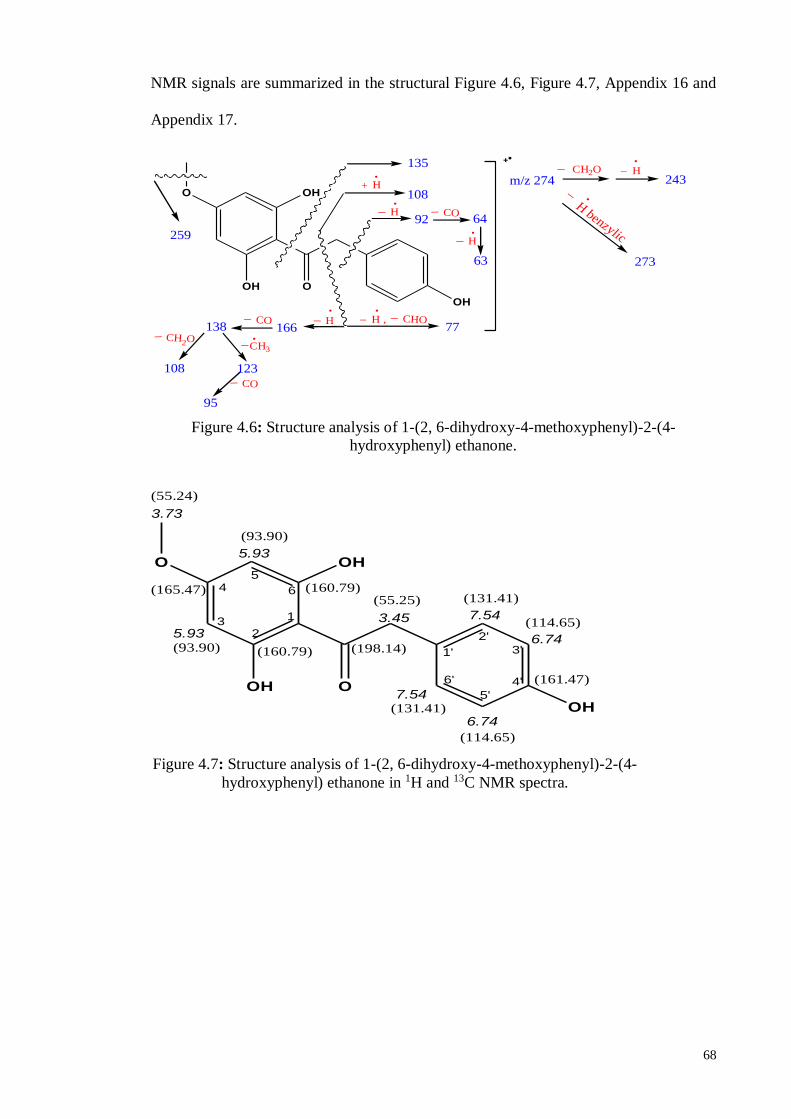
68
NMR signals are summarized in the structural Figure 4.6, Figure 4.7, Appendix 16 and
Appendix 17.
Figure 4.6: Structure analysis of 1-(2, 6-dihydroxy-4-methoxyphenyl)-2-(4-
hydroxyphenyl) ethanone.
H+
H
O OH
OH O
OH
CH2O Hm/z 274
166138
108
135
123108
_
H benzylic
273
259
_
243_
_
CO_
95
92 64CO
_
H_
63
H_CO_ H ,_ CHO
_77
CH2O
_CH3
_
O OH
OH O
OH
5.93
(93.90)
5.93(93.90)
7.54
7.54
6.74
6.74
3.73
(131.41)
(131.41)
(114.65)
(114.65)
(161.47)
(165.47) (160.79)
(160.79) (198.14)
(55.25)
(55.24)
3.451
23
45
6
1'
2'
3'
4'
5'
6'
Figure 4.7: Structure analysis of 1-(2, 6-dihydroxy-4-methoxyphenyl)-2-(4-
hydroxyphenyl) ethanone in 1H and 13C NMR spectra.
69
PART B: SCREENING OF CYTOTOXIC ACTIVITY OF P. MACROCARPA
4.5. In vitro Neutral Assay
In this study, the cytotoxicity activities of the methanolic extract and fractionated
extracts of hexane and ethyl acetate from the P. macrocarpa seeds and fruits were
screened using the neutral red cytotoxicity assay on the following selected cell lines:
1. human cervical epithelioid carcinoma cell (Cas Ki),
2. human hormone-dependent breast carcinoma (MCF-7),
3. human epithelioid colon carcinoma cell (HT-29),
4. human epithelioid lung carcinoma cell(A549),
5. human ovarian carcinoma cell (SKOV-3),
6. Non-cancer human fibroblast cell line (MRC-5).
The cytotoxicity study was performed on MRC-5, Ca Ski, MCF-7, HT-29, A549
and SKOV-3 cells according to describe protocols (Borenfreund, 1984). The stock
materials of the test extracts were dissolved in 100% DMSO. The maximum amount of
DMSO present in the wells (0.5%) was found to have no effect on the cells. To determine
the effectiveness of the inhibition concentration of cell proliferation, the cell lines were
incubated with various concentrations of the extract. The amount of neutral red dye
accumulated may be extracted from the lysosomes of viable cells. The cytotoxic activities
of the methanolic and fractionated extracts were determined by reading the spectrometric
absorbance at 540 nm using an ELISA Reader. The results were expressed as IC50 values
which correspond to the mean of three replicate experiment.
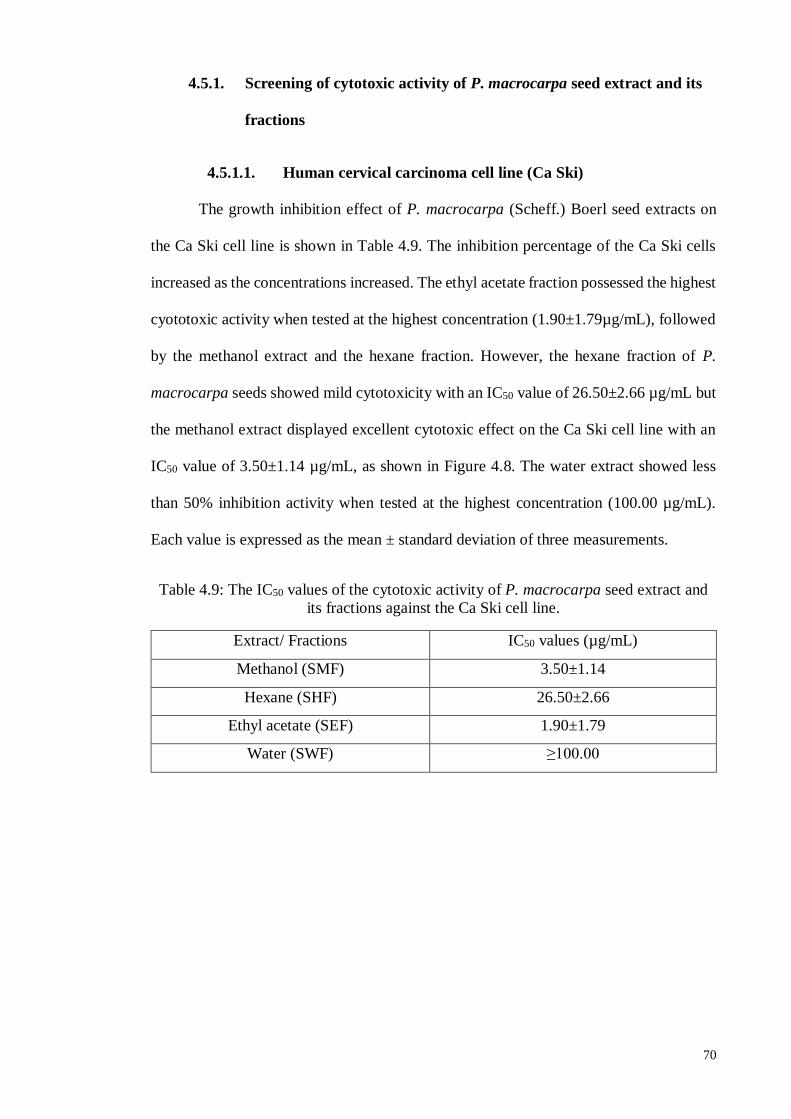
70
4.5.1. Screening of cytotoxic activity of P. macrocarpa seed extract and its
fractions
4.5.1.1. Human cervical carcinoma cell line (Ca Ski)
The growth inhibition effect of P. macrocarpa (Scheff.) Boerl seed extracts on
the Ca Ski cell line is shown in Table 4.9. The inhibition percentage of the Ca Ski cells
increased as the concentrations increased. The ethyl acetate fraction possessed the highest
cyototoxic activity when tested at the highest concentration (1.90±1.79µg/mL), followed
by the methanol extract and the hexane fraction. However, the hexane fraction of P.
macrocarpa seeds showed mild cytotoxicity with an IC50 value of 26.50±2.66 µg/mL but
the methanol extract displayed excellent cytotoxic effect on the Ca Ski cell line with an
IC50 value of 3.50±1.14 µg/mL, as shown in Figure 4.8. The water extract showed less
than 50% inhibition activity when tested at the highest concentration (100.00 µg/mL).
Each value is expressed as the mean ± standard deviation of three measurements.
Table 4.9: The IC50 values of the cytotoxic activity of P. macrocarpa seed extract and
its fractions against the Ca Ski cell line.
Extract/ Fractions IC50 values (µg/mL)
Methanol (SMF) 3.50±1.14
Hexane (SHF) 26.50±2.66
Ethyl acetate (SEF) 1.90±1.79
Water (SWF) ≥100.00
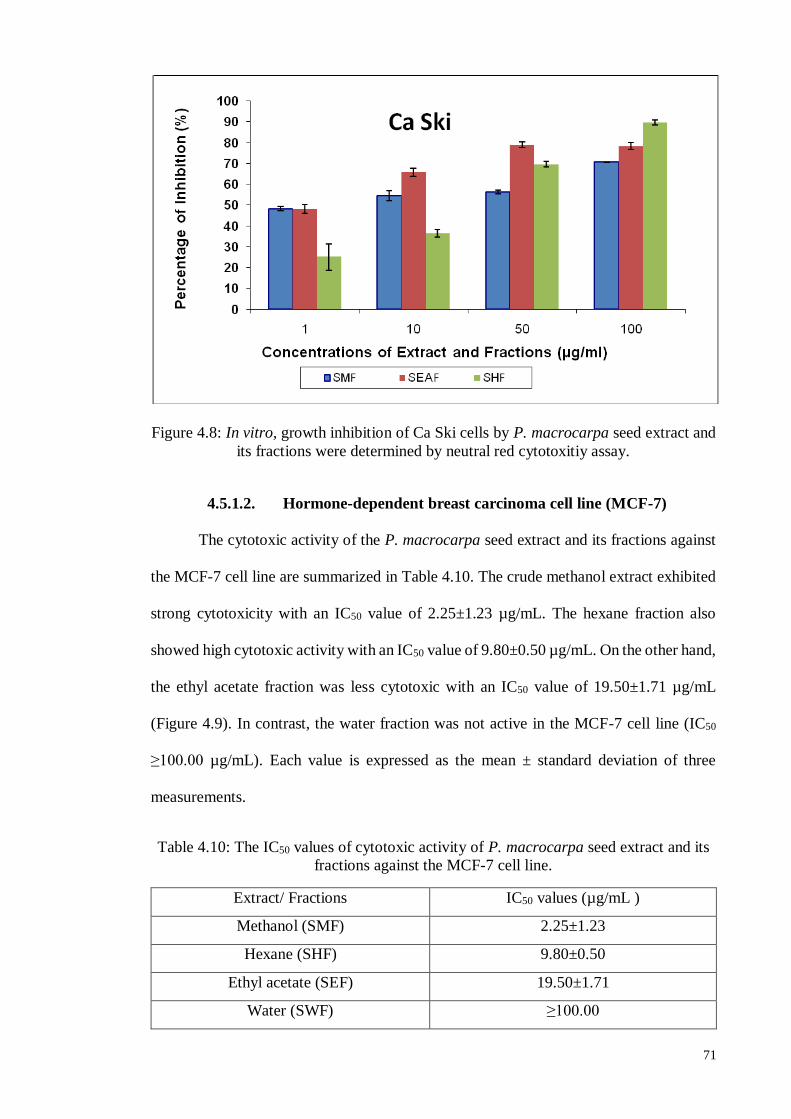
71
Figure 4.8: In vitro, growth inhibition of Ca Ski cells by P. macrocarpa seed extract and
its fractions were determined by neutral red cytotoxitiy assay.
4.5.1.2. Hormone-dependent breast carcinoma cell line (MCF-7)
The cytotoxic activity of the P. macrocarpa seed extract and its fractions against
the MCF-7 cell line are summarized in Table 4.10. The crude methanol extract exhibited
strong cytotoxicity with an IC50 value of 2.25±1.23 µg/mL. The hexane fraction also
showed high cytotoxic activity with an IC50 value of 9.80±0.50 µg/mL. On the other hand,
the ethyl acetate fraction was less cytotoxic with an IC50 value of 19.50±1.71 µg/mL
(Figure 4.9). In contrast, the water fraction was not active in the MCF-7 cell line (IC50
≥100.00 µg/mL). Each value is expressed as the mean ± standard deviation of three
measurements.
Table 4.10: The IC50 values of cytotoxic activity of P. macrocarpa seed extract and its
fractions against the MCF-7 cell line.
Extract/ Fractions IC50 values (µg/mL )
Methanol (SMF) 2.25±1.23
Hexane (SHF) 9.80±0.50
Ethyl acetate (SEF) 19.50±1.71
Water (SWF) ≥100.00
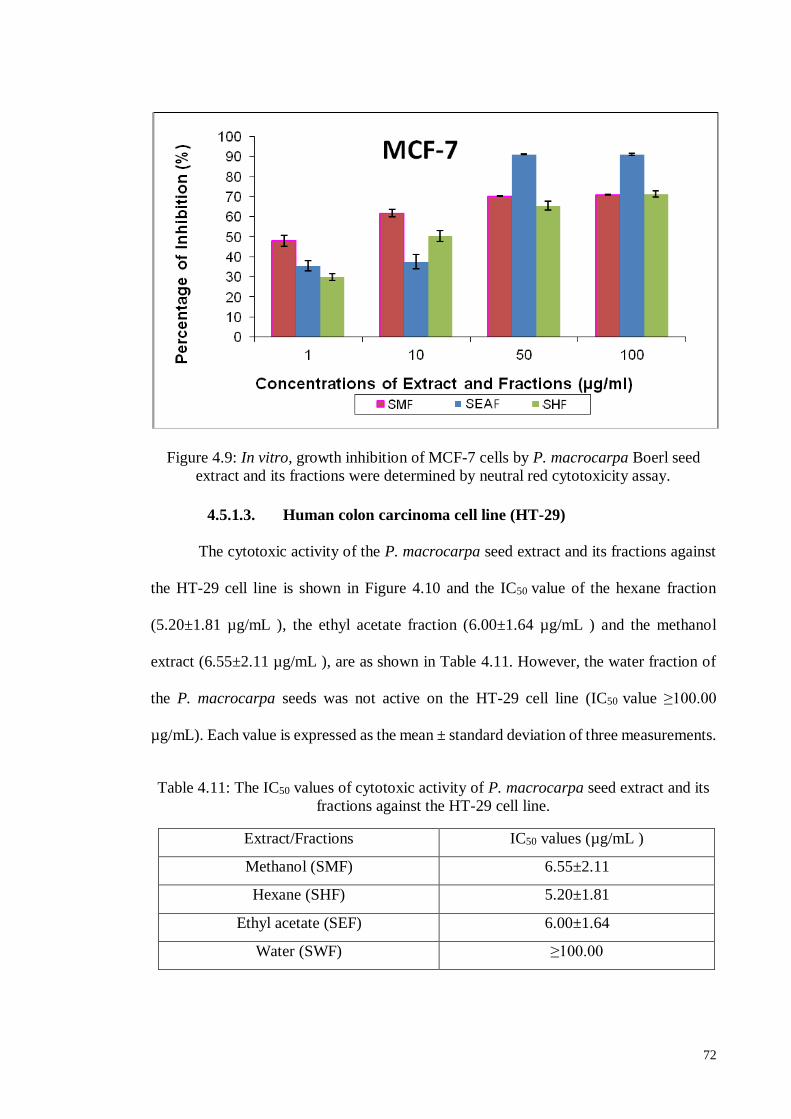
72
Figure 4.9: In vitro, growth inhibition of MCF-7 cells by P. macrocarpa Boerl seed
extract and its fractions were determined by neutral red cytotoxicity assay.
4.5.1.3. Human colon carcinoma cell line (HT-29)
The cytotoxic activity of the P. macrocarpa seed extract and its fractions against
the HT-29 cell line is shown in Figure 4.10 and the IC50 value of the hexane fraction
(5.20±1.81 µg/mL ), the ethyl acetate fraction (6.00±1.64 µg/mL ) and the methanol
extract (6.55±2.11 µg/mL ), are as shown in Table 4.11. However, the water fraction of
the P. macrocarpa seeds was not active on the HT-29 cell line (IC50 value ≥100.00
µg/mL). Each value is expressed as the mean ± standard deviation of three measurements.
Table 4.11: The IC50 values of cytotoxic activity of P. macrocarpa seed extract and its
fractions against the HT-29 cell line.
Extract/Fractions IC50 values (µg/mL )
Methanol (SMF) 6.55±2.11
Hexane (SHF) 5.20±1.81
Ethyl acetate (SEF) 6.00±1.64
Water (SWF) ≥100.00
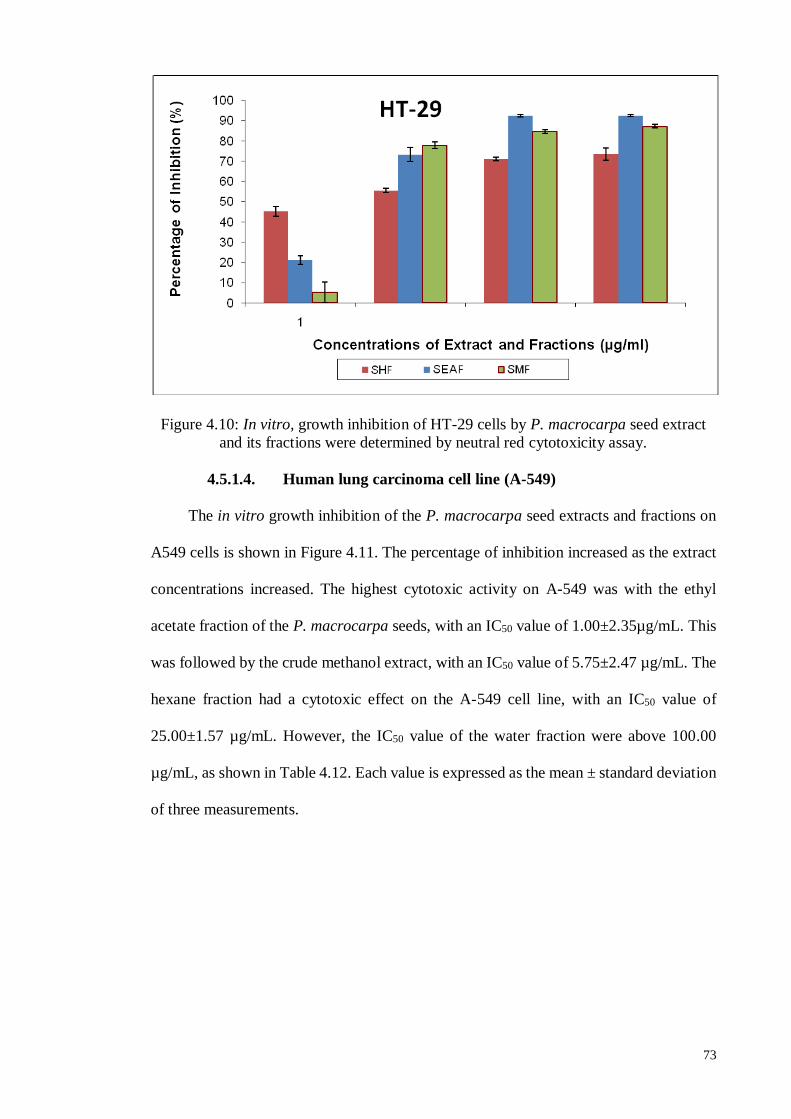
73
Figure 4.10: In vitro, growth inhibition of HT-29 cells by P. macrocarpa seed extract
and its fractions were determined by neutral red cytotoxicity assay.
4.5.1.4. Human lung carcinoma cell line (A-549)
The in vitro growth inhibition of the P. macrocarpa seed extracts and fractions on
A549 cells is shown in Figure 4.11. The percentage of inhibition increased as the extract
concentrations increased. The highest cytotoxic activity on A-549 was with the ethyl
acetate fraction of the P. macrocarpa seeds, with an IC50 value of 1.00±2.35µg/mL. This
was followed by the crude methanol extract, with an IC50 value of 5.75±2.47 µg/mL. The
hexane fraction had a cytotoxic effect on the A-549 cell line, with an IC50 value of
25.00±1.57 µg/mL. However, the IC50 value of the water fraction were above 100.00
µg/mL, as shown in Table 4.12. Each value is expressed as the mean ± standard deviation
of three measurements.
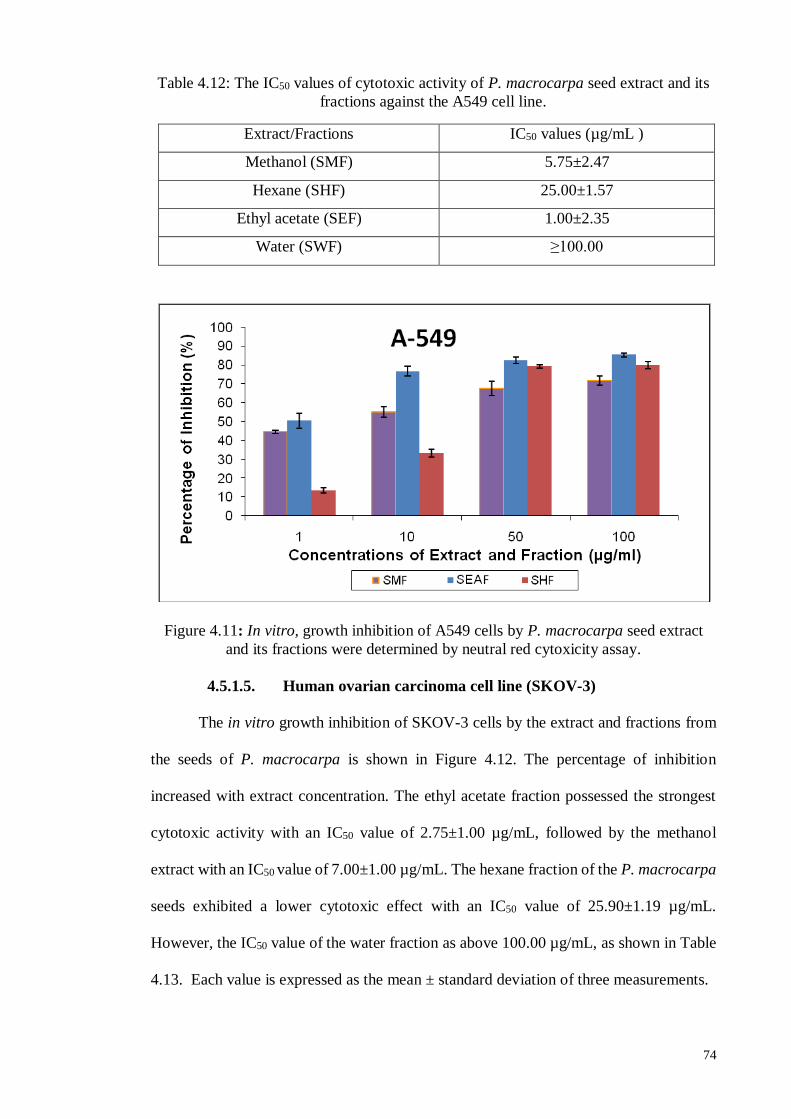
74
Table 4.12: The IC50 values of cytotoxic activity of P. macrocarpa seed extract and its
fractions against the A549 cell line.
Extract/Fractions IC50 values (µg/mL )
Methanol (SMF) 5.75±2.47
Hexane (SHF) 25.00±1.57
Ethyl acetate (SEF) 1.00±2.35
Water (SWF) ≥100.00
Figure 4.11: In vitro, growth inhibition of A549 cells by P. macrocarpa seed extract
and its fractions were determined by neutral red cytoxicity assay.
4.5.1.5. Human ovarian carcinoma cell line (SKOV-3)
The in vitro growth inhibition of SKOV-3 cells by the extract and fractions from
the seeds of P. macrocarpa is shown in Figure 4.12. The percentage of inhibition
increased with extract concentration. The ethyl acetate fraction possessed the strongest
cytotoxic activity with an IC50 value of 2.75±1.00 µg/mL, followed by the methanol
extract with an IC50 value of 7.00±1.00 µg/mL. The hexane fraction of the P. macrocarpa
seeds exhibited a lower cytotoxic effect with an IC50 value of 25.90±1.19 µg/mL.
However, the IC50 value of the water fraction as above 100.00 µg/mL, as shown in Table
4.13. Each value is expressed as the mean ± standard deviation of three measurements.
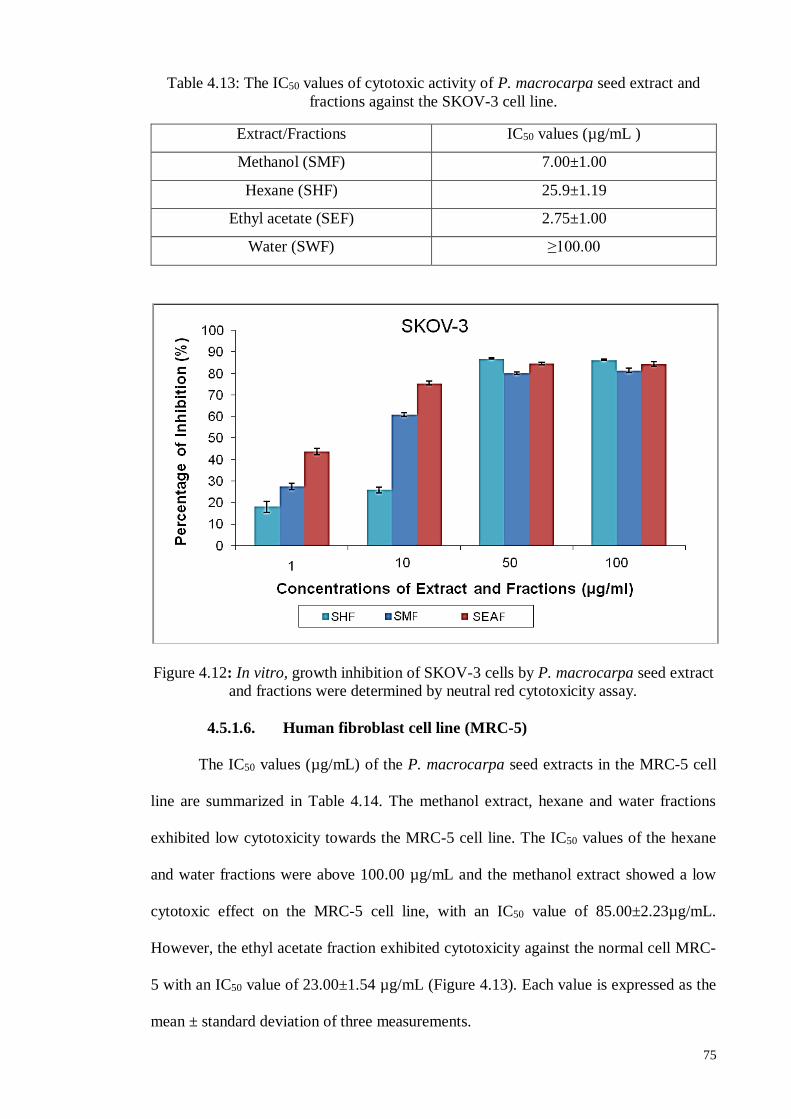
75
Table 4.13: The IC50 values of cytotoxic activity of P. macrocarpa seed extract and
fractions against the SKOV-3 cell line.
Extract/Fractions IC50 values (µg/mL )
Methanol (SMF) 7.00±1.00
Hexane (SHF) 25.9±1.19
Ethyl acetate (SEF) 2.75±1.00
Water (SWF) ≥100.00
Figure 4.12: In vitro, growth inhibition of SKOV-3 cells by P. macrocarpa seed extract
and fractions were determined by neutral red cytotoxicity assay.
4.5.1.6. Human fibroblast cell line (MRC-5)
The IC50 values (µg/mL) of the P. macrocarpa seed extracts in the MRC-5 cell
line are summarized in Table 4.14. The methanol extract, hexane and water fractions
exhibited low cytotoxicity towards the MRC-5 cell line. The IC50 values of the hexane
and water fractions were above 100.00 µg/mL and the methanol extract showed a low
cytotoxic effect on the MRC-5 cell line, with an IC50 value of 85.00±2.23µg/mL.
However, the ethyl acetate fraction exhibited cytotoxicity against the normal cell MRC-
5 with an IC50 value of 23.00±1.54 µg/mL (Figure 4.13). Each value is expressed as the
mean ± standard deviation of three measurements.
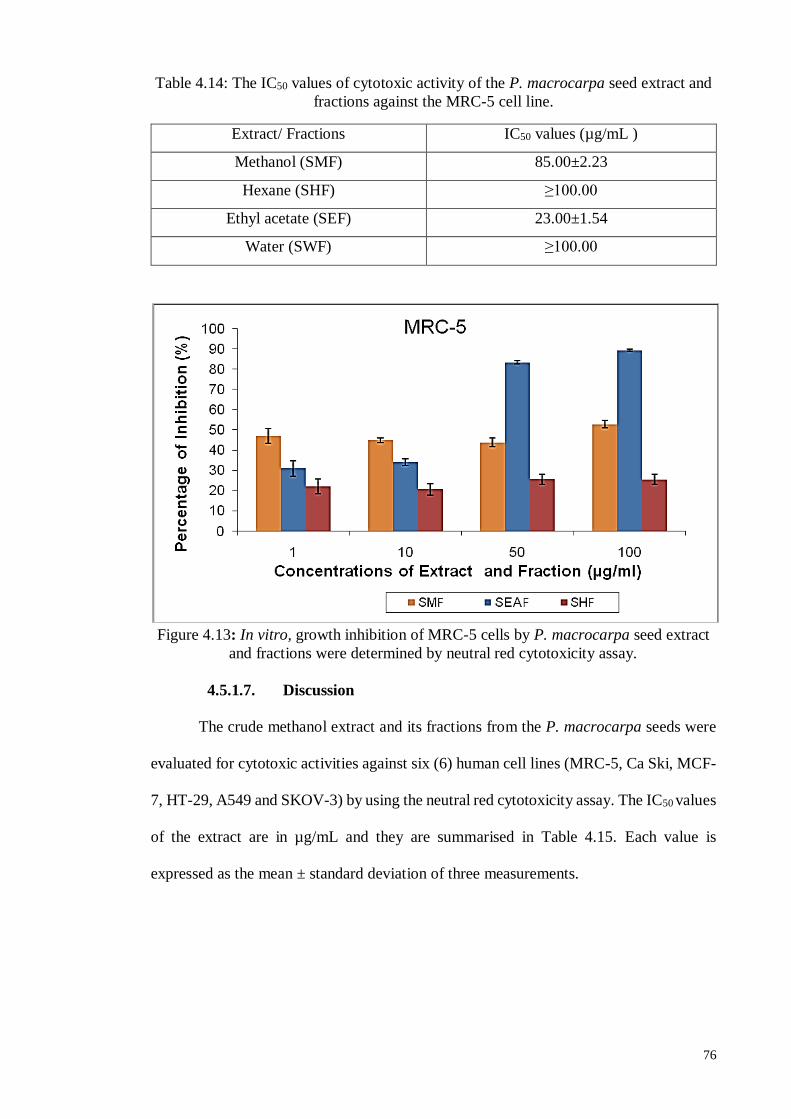
76
Table 4.14: The IC50 values of cytotoxic activity of the P. macrocarpa seed extract and
fractions against the MRC-5 cell line.
Extract/ Fractions IC50 values (µg/mL )
Methanol (SMF) 85.00±2.23
Hexane (SHF) ≥100.00
Ethyl acetate (SEF) 23.00±1.54
Water (SWF) ≥100.00
Figure 4.13: In vitro, growth inhibition of MRC-5 cells by P. macrocarpa seed extract
and fractions were determined by neutral red cytotoxicity assay.
4.5.1.7. Discussion
The crude methanol extract and its fractions from the P. macrocarpa seeds were
evaluated for cytotoxic activities against six (6) human cell lines (MRC-5, Ca Ski, MCF-
7, HT-29, A549 and SKOV-3) by using the neutral red cytotoxicity assay. The IC50 values
of the extract are in µg/mL and they are summarised in Table 4.15. Each value is
expressed as the mean ± standard deviation of three measurements.
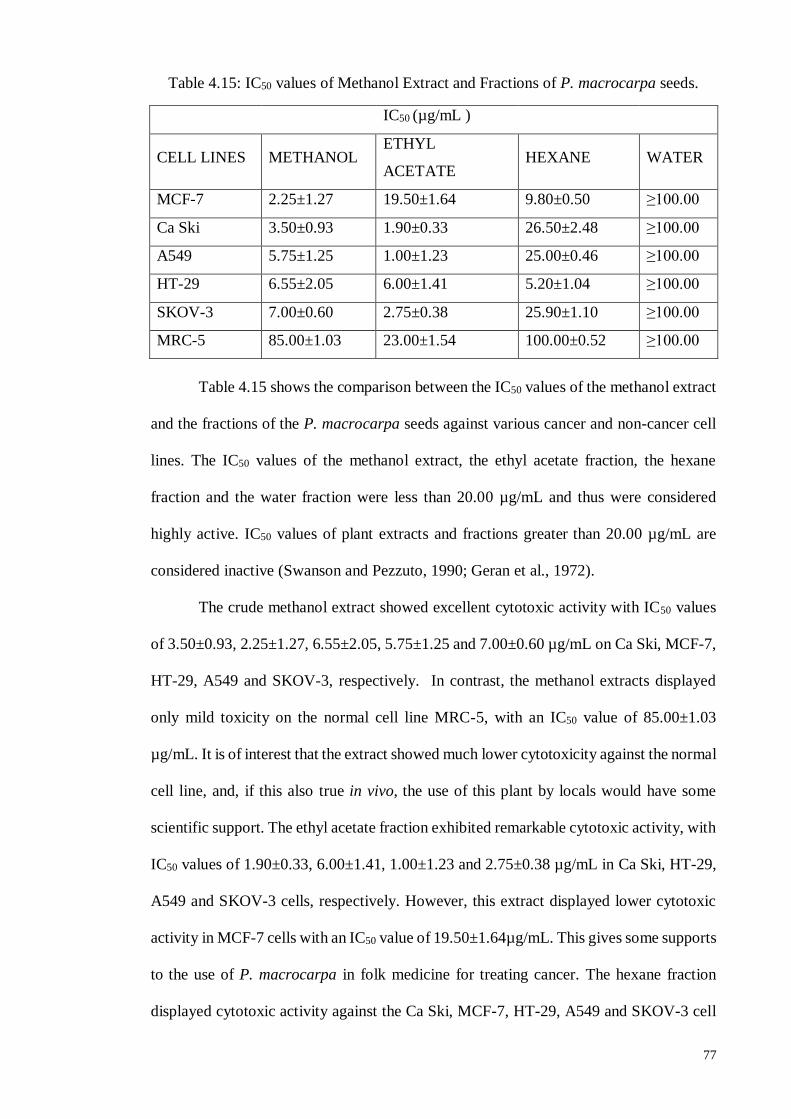
77
Table 4.15: IC50 values of Methanol Extract and Fractions of P. macrocarpa seeds.
IC50 (µg/mL )
CELL LINES METHANOL ETHYL
ACETATE HEXANE WATER
MCF-7 2.25±1.27 19.50±1.64 9.80±0.50 ≥100.00
Ca Ski 3.50±0.93 1.90±0.33 26.50±2.48 ≥100.00
A549 5.75±1.25 1.00±1.23 25.00±0.46 ≥100.00
HT-29 6.55±2.05 6.00±1.41 5.20±1.04 ≥100.00
SKOV-3 7.00±0.60 2.75±0.38 25.90±1.10 ≥100.00
MRC-5 85.00±1.03 23.00±1.54 100.00±0.52 ≥100.00
Table 4.15 shows the comparison between the IC50 values of the methanol extract
and the fractions of the P. macrocarpa seeds against various cancer and non-cancer cell
lines. The IC50 values of the methanol extract, the ethyl acetate fraction, the hexane
fraction and the water fraction were less than 20.00 µg/mL and thus were considered
highly active. IC50 values of plant extracts and fractions greater than 20.00 µg/mL are
considered inactive (Swanson and Pezzuto, 1990; Geran et al., 1972).
The crude methanol extract showed excellent cytotoxic activity with IC50 values
of 3.50±0.93, 2.25±1.27, 6.55±2.05, 5.75±1.25 and 7.00±0.60 µg/mL on Ca Ski, MCF-7,
HT-29, A549 and SKOV-3, respectively. In contrast, the methanol extracts displayed
only mild toxicity on the normal cell line MRC-5, with an IC50 value of 85.00±1.03
µg/mL. It is of interest that the extract showed much lower cytotoxicity against the normal
cell line, and, if this also true in vivo, the use of this plant by locals would have some
scientific support. The ethyl acetate fraction exhibited remarkable cytotoxic activity, with
IC50 values of 1.90±0.33, 6.00±1.41, 1.00±1.23 and 2.75±0.38 µg/mL in Ca Ski, HT-29,
A549 and SKOV-3 cells, respectively. However, this extract displayed lower cytotoxic
activity in MCF-7 cells with an IC50 value of 19.50±1.64µg/mL. This gives some supports
to the use of P. macrocarpa in folk medicine for treating cancer. The hexane fraction
displayed cytotoxic activity against the Ca Ski, MCF-7, HT-29, A549 and SKOV-3 cell
78
lines, with IC50 values of 26.50±2.48, 9.80±0.50, 5.20±1.04, 25.00±0.46 and 25.90±1.10
µg/mL, respectively. This hexane extract has no apparent cytotoxic effect against MRC-
5 cells with and IC50 100.00 µg/mL.
In summary, the results of the present work indicated that the methanol extract
and ethyl acetate fraction of the P. macrocarpa seeds possessed remarkable cytotoxicity
against selected cancer cells and mild toxicity against normal cells (based on the neutral
red cytotoxicity assay). The methanol extract and the ethyl acetate fraction had a
selectivity index (SI) value of less than three and were thus considered to have high
selectivity. Moreover, the hexane fraction of the P. macrocarpa seeds showed high
cytotoxicity against MCF-7 and HT-29 cells and also was not toxic to normal cells (MRC-
5). Bioassay guided fractionation was then performed to identify the bioactive
compound(s).
4.5.2. Screening of cytotoxic activity of P. macrocarpa fruits extract and its
fractions
The cytotoxicity (IC50 value in µg/mL) of the P. macrocarpa fruit extract towards
selected cell lines is summarized in Table 4.16. The percentage of inhibition of selected
cell lines increased as the extract concentrations increased. The cytotoxic effect of the
crude extracts and fractionated extracts of the P. macrocarpa fruits was evaluated using
the neutral red cytotoxicity assay against five human carcinoma cell lines (MCF-7, Ca
Ski, A 549, HT-29 and SKOV-3) and the non-cancer human fibroblast cell line (MRC-
5). The crude methanol extract, and the hexane and water fraction had no cytotoxic effect
on all cancer cell lines and normal cells MRC-5, with IC50100.00 µg/mL. However,
ethyl acetate fraction showed mild toxicity on the normal cell line MRC-5 and the human
carcinoma cell line SKOV-3, with IC50 values of 62.50±3.25 µg/mL. Each value is
expressed as the mean ± standard deviation of three measurements.
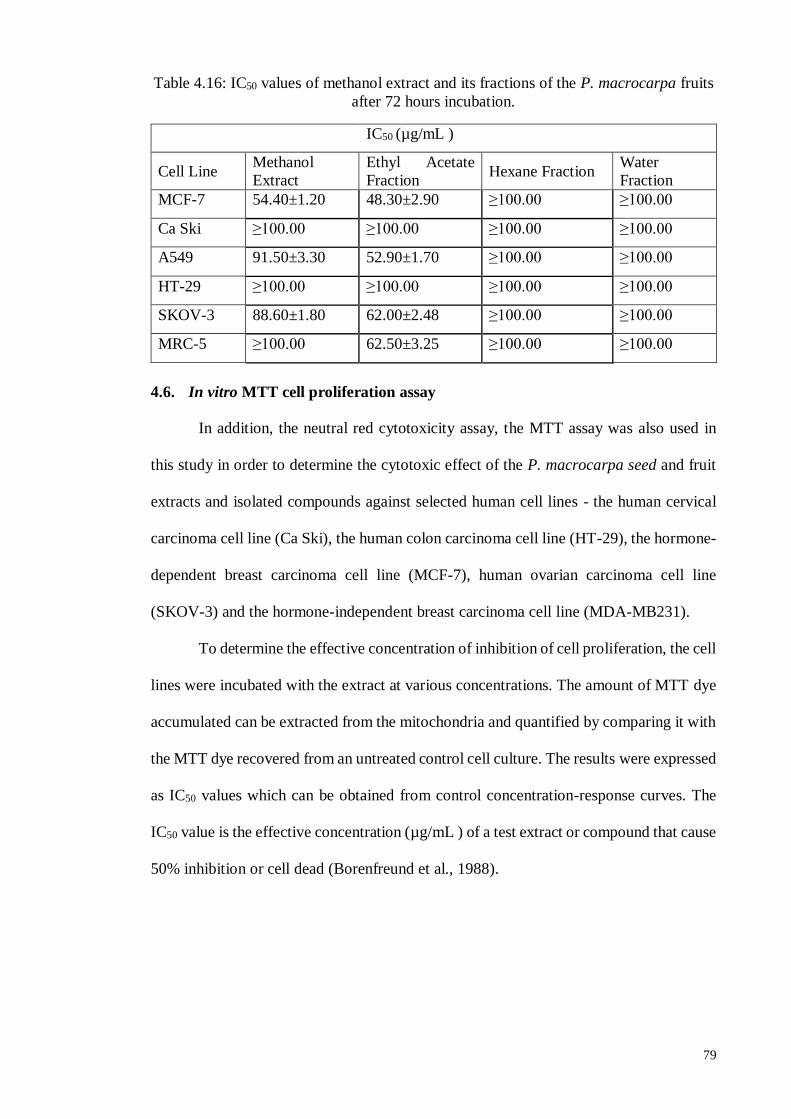
79
Table 4.16: IC50 values of methanol extract and its fractions of the P. macrocarpa fruits
after 72 hours incubation.
IC50 (µg/mL )
Cell Line Methanol
Extract
Ethyl Acetate
Fraction Hexane Fraction
Water
Fraction
MCF-7 54.40±1.20 48.30±2.90 ≥100.00 ≥100.00
Ca Ski ≥100.00 ≥100.00 ≥100.00 ≥100.00
A549 91.50±3.30 52.90±1.70 ≥100.00 ≥100.00
HT-29 ≥100.00 ≥100.00 ≥100.00 ≥100.00
SKOV-3 88.60±1.80 62.00±2.48 ≥100.00 ≥100.00
MRC-5 ≥100.00 62.50±3.25 ≥100.00 ≥100.00
4.6. In vitro MTT cell proliferation assay
In addition, the neutral red cytotoxicity assay, the MTT assay was also used in
this study in order to determine the cytotoxic effect of the P. macrocarpa seed and fruit
extracts and isolated compounds against selected human cell lines - the human cervical
carcinoma cell line (Ca Ski), the human colon carcinoma cell line (HT-29), the hormone-
dependent breast carcinoma cell line (MCF-7), human ovarian carcinoma cell line
(SKOV-3) and the hormone-independent breast carcinoma cell line (MDA-MB231).
To determine the effective concentration of inhibition of cell proliferation, the cell
lines were incubated with the extract at various concentrations. The amount of MTT dye
accumulated can be extracted from the mitochondria and quantified by comparing it with
the MTT dye recovered from an untreated control cell culture. The results were expressed
as IC50 values which can be obtained from control concentration-response curves. The
IC50 value is the effective concentration (µg/mL ) of a test extract or compound that cause
50% inhibition or cell dead (Borenfreund et al., 1988).
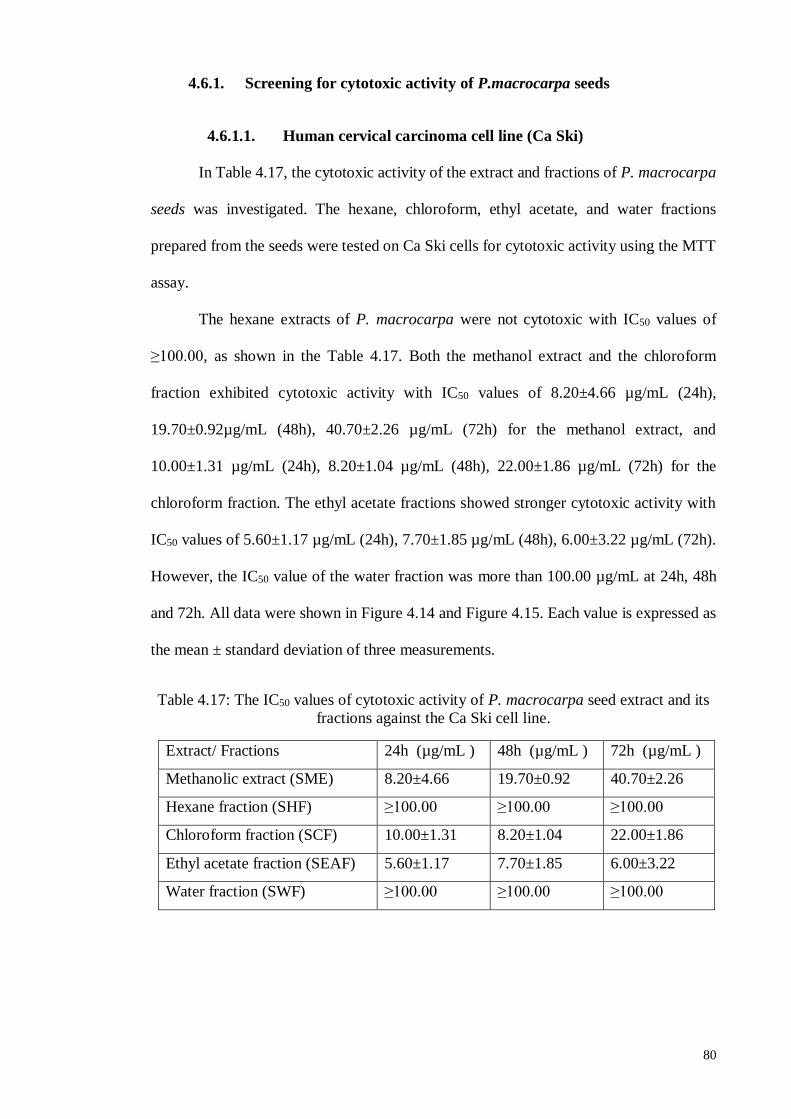
80
4.6.1. Screening for cytotoxic activity of P.macrocarpa seeds
4.6.1.1. Human cervical carcinoma cell line (Ca Ski)
In Table 4.17, the cytotoxic activity of the extract and fractions of P. macrocarpa
seeds was investigated. The hexane, chloroform, ethyl acetate, and water fractions
prepared from the seeds were tested on Ca Ski cells for cytotoxic activity using the MTT
assay.
The hexane extracts of P. macrocarpa were not cytotoxic with IC50 values of
≥100.00, as shown in the Table 4.17. Both the methanol extract and the chloroform
fraction exhibited cytotoxic activity with IC50 values of 8.20±4.66 µg/mL (24h),
19.70±0.92µg/mL (48h), 40.70±2.26 µg/mL (72h) for the methanol extract, and
10.00±1.31 µg/mL (24h), 8.20±1.04 µg/mL (48h), 22.00±1.86 µg/mL (72h) for the
chloroform fraction. The ethyl acetate fractions showed stronger cytotoxic activity with
IC50 values of 5.60±1.17 µg/mL (24h), 7.70±1.85 µg/mL (48h), 6.00±3.22 µg/mL (72h).
However, the IC50 value of the water fraction was more than 100.00 µg/mL at 24h, 48h
and 72h. All data were shown in Figure 4.14 and Figure 4.15. Each value is expressed as
the mean ± standard deviation of three measurements.
Table 4.17: The IC50 values of cytotoxic activity of P. macrocarpa seed extract and its
fractions against the Ca Ski cell line.
Extract/ Fractions 24h (µg/mL ) 48h (µg/mL ) 72h (µg/mL )
Methanolic extract (SME) 8.20±4.66 19.70±0.92 40.70±2.26
Hexane fraction (SHF) ≥100.00 ≥100.00 ≥100.00
Chloroform fraction (SCF) 10.00±1.31 8.20±1.04 22.00±1.86
Ethyl acetate fraction (SEAF) 5.60±1.17 7.70±1.85 6.00±3.22
Water fraction (SWF) ≥100.00 ≥100.00 ≥100.00
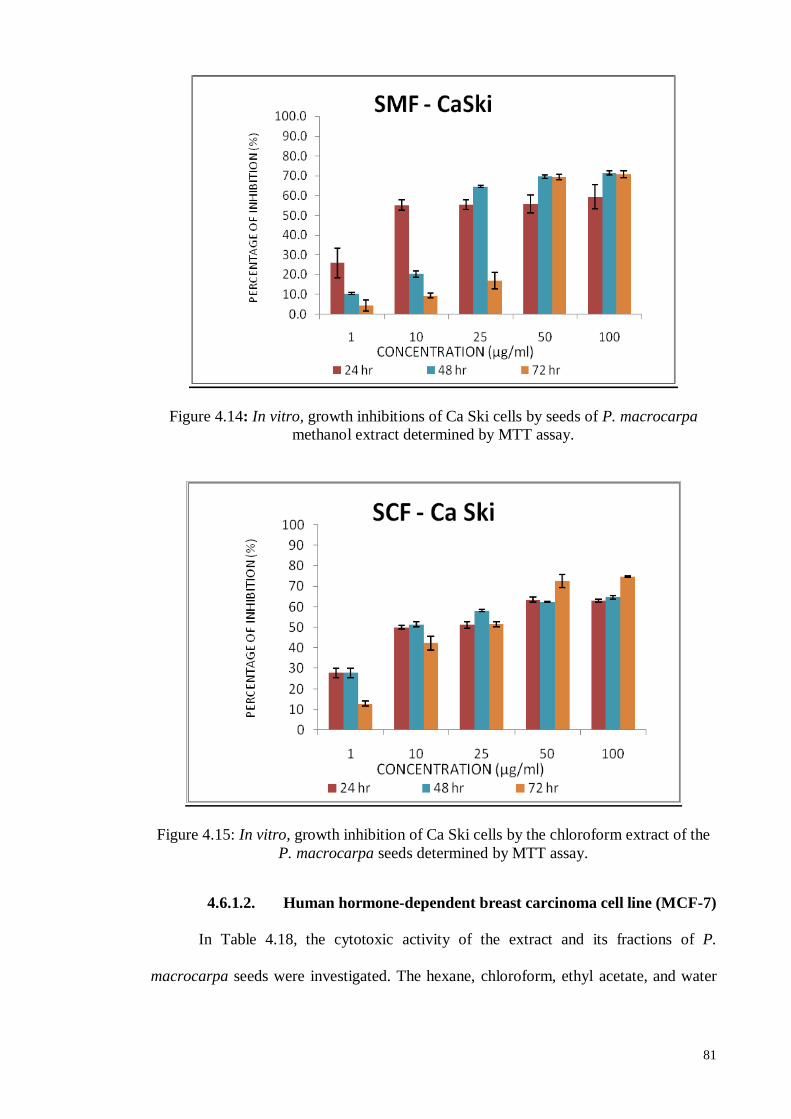
81
Figure 4.14: In vitro, growth inhibitions of Ca Ski cells by seeds of P. macrocarpa
methanol extract determined by MTT assay.
Figure 4.15: In vitro, growth inhibition of Ca Ski cells by the chloroform extract of the
P. macrocarpa seeds determined by MTT assay.
4.6.1.2. Human hormone-dependent breast carcinoma cell line (MCF-7)
In Table 4.18, the cytotoxic activity of the extract and its fractions of P.
macrocarpa seeds were investigated. The hexane, chloroform, ethyl acetate, and water
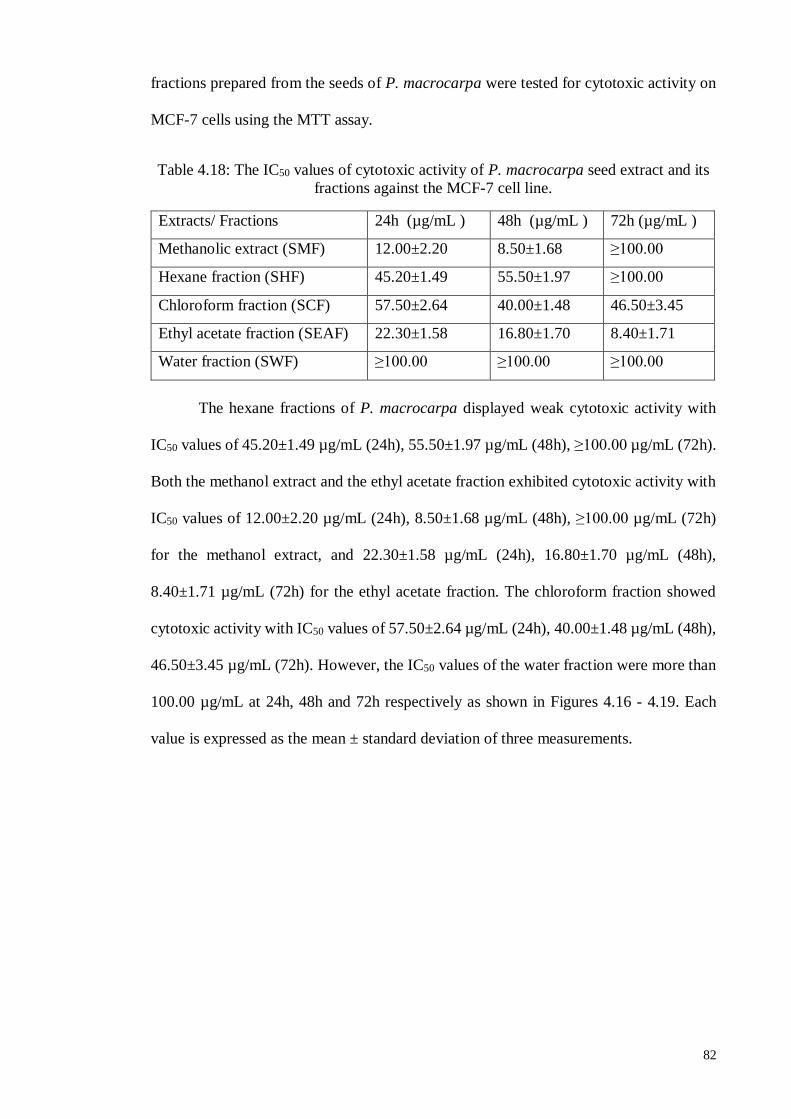
82
fractions prepared from the seeds of P. macrocarpa were tested for cytotoxic activity on
MCF-7 cells using the MTT assay.
Table 4.18: The IC50 values of cytotoxic activity of P. macrocarpa seed extract and its
fractions against the MCF-7 cell line.
Extracts/ Fractions 24h (µg/mL ) 48h (µg/mL ) 72h (µg/mL )
Methanolic extract (SMF) 12.00±2.20 8.50±1.68 ≥100.00
Hexane fraction (SHF) 45.20±1.49 55.50±1.97 ≥100.00
Chloroform fraction (SCF) 57.50±2.64 40.00±1.48 46.50±3.45
Ethyl acetate fraction (SEAF) 22.30±1.58 16.80±1.70 8.40±1.71
Water fraction (SWF) ≥100.00 ≥100.00 ≥100.00
The hexane fractions of P. macrocarpa displayed weak cytotoxic activity with
IC50 values of 45.20±1.49 µg/mL (24h), 55.50±1.97 µg/mL (48h), ≥100.00 µg/mL (72h).
Both the methanol extract and the ethyl acetate fraction exhibited cytotoxic activity with
IC50 values of 12.00±2.20 µg/mL (24h), 8.50±1.68 µg/mL (48h), ≥100.00 µg/mL (72h)
for the methanol extract, and 22.30±1.58 µg/mL (24h), 16.80±1.70 µg/mL (48h),
8.40±1.71 µg/mL (72h) for the ethyl acetate fraction. The chloroform fraction showed
cytotoxic activity with IC50 values of 57.50±2.64 µg/mL (24h), 40.00±1.48 µg/mL (48h),
46.50±3.45 µg/mL (72h). However, the IC50 values of the water fraction were more than
100.00 µg/mL at 24h, 48h and 72h respectively as shown in Figures 4.16 - 4.19. Each
value is expressed as the mean ± standard deviation of three measurements.
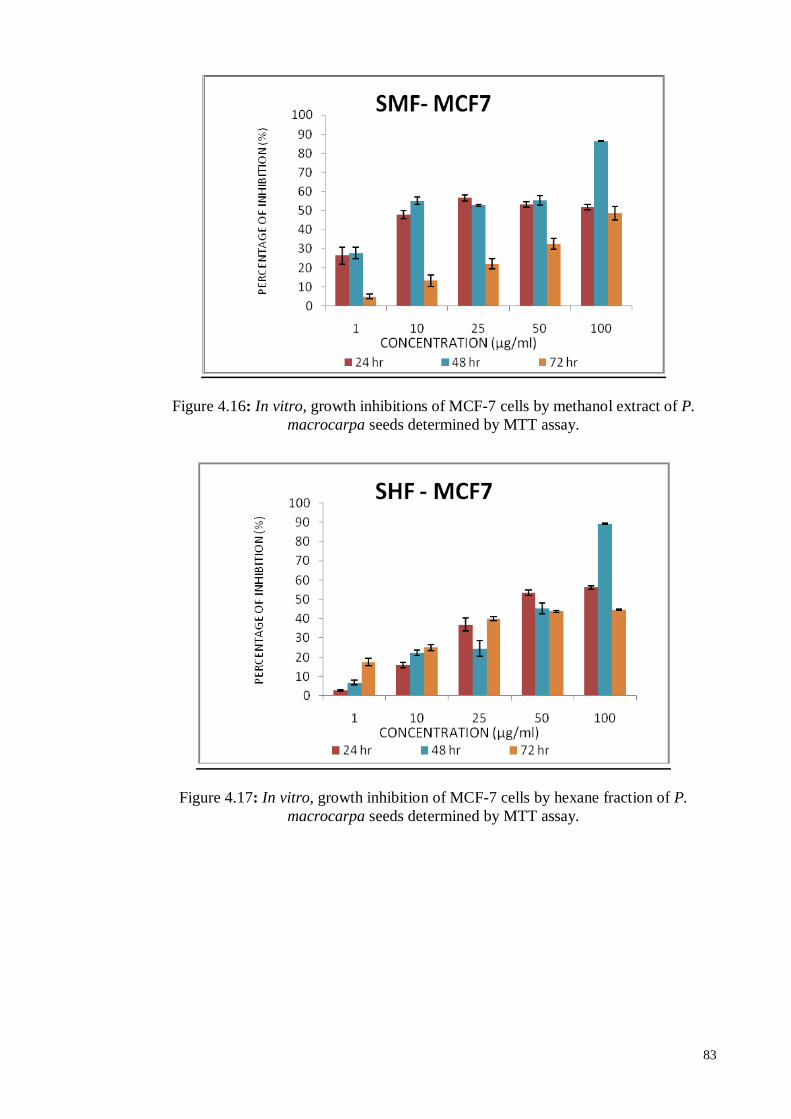
83
Figure 4.16: In vitro, growth inhibitions of MCF-7 cells by methanol extract of P.
macrocarpa seeds determined by MTT assay.
Figure 4.17: In vitro, growth inhibition of MCF-7 cells by hexane fraction of P.
macrocarpa seeds determined by MTT assay.
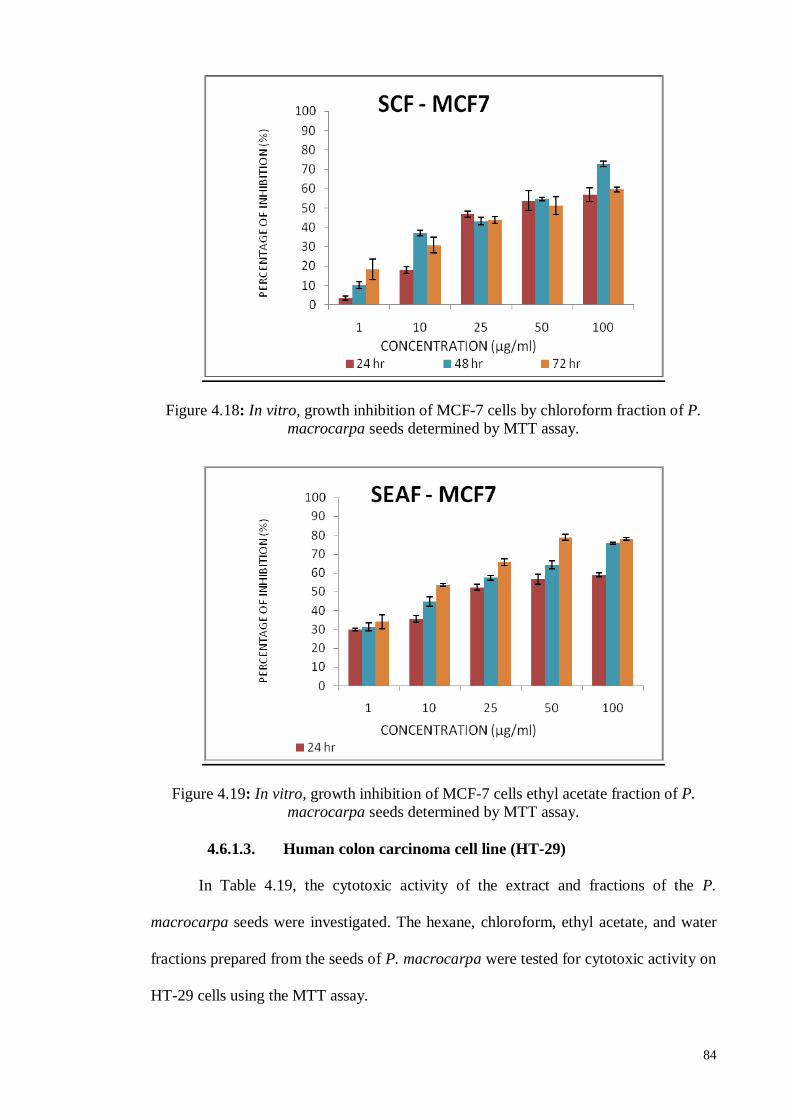
84
Figure 4.18: In vitro, growth inhibition of MCF-7 cells by chloroform fraction of P.
macrocarpa seeds determined by MTT assay.
Figure 4.19: In vitro, growth inhibition of MCF-7 cells ethyl acetate fraction of P.
macrocarpa seeds determined by MTT assay.
4.6.1.3. Human colon carcinoma cell line (HT-29)
In Table 4.19, the cytotoxic activity of the extract and fractions of the P.
macrocarpa seeds were investigated. The hexane, chloroform, ethyl acetate, and water
fractions prepared from the seeds of P. macrocarpa were tested for cytotoxic activity on
HT-29 cells using the MTT assay.
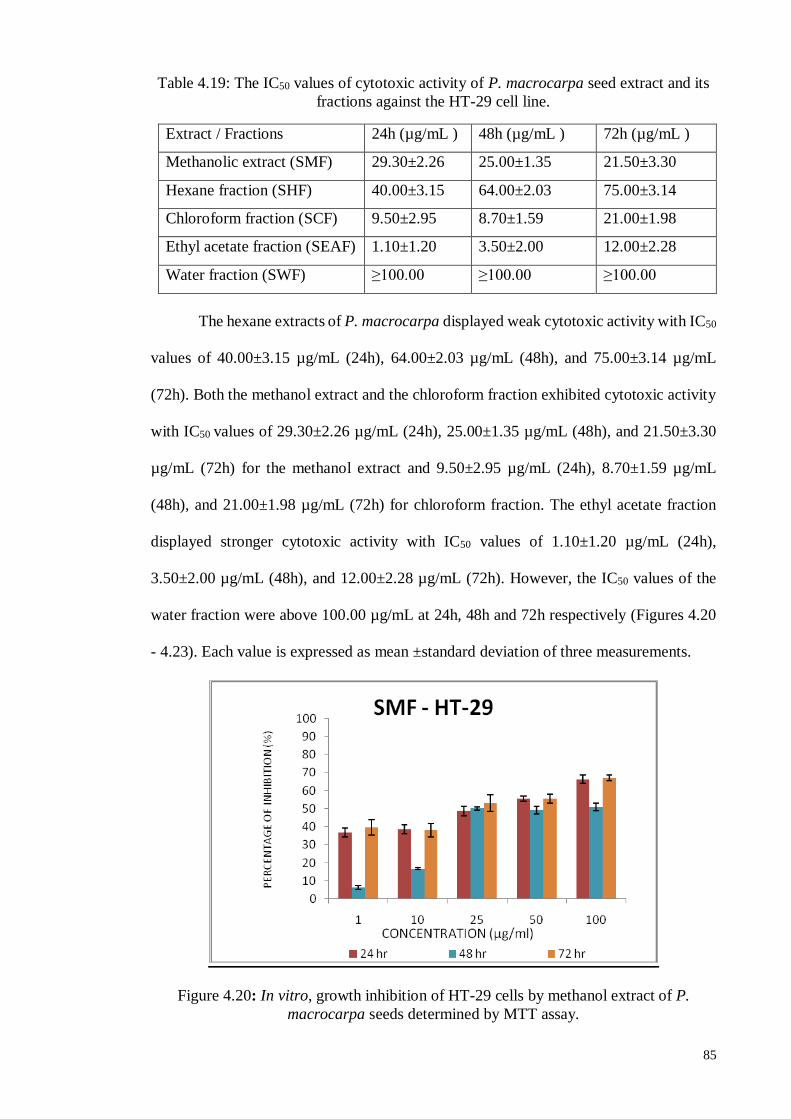
85
Table 4.19: The IC50 values of cytotoxic activity of P. macrocarpa seed extract and its
fractions against the HT-29 cell line.
Extract / Fractions 24h (µg/mL ) 48h (µg/mL ) 72h (µg/mL )
Methanolic extract (SMF) 29.30±2.26 25.00±1.35 21.50±3.30
Hexane fraction (SHF) 40.00±3.15 64.00±2.03 75.00±3.14
Chloroform fraction (SCF) 9.50±2.95 8.70±1.59 21.00±1.98
Ethyl acetate fraction (SEAF) 1.10±1.20 3.50±2.00 12.00±2.28
Water fraction (SWF) ≥100.00 ≥100.00 ≥100.00
The hexane extracts of P. macrocarpa displayed weak cytotoxic activity with IC50
values of 40.00±3.15 µg/mL (24h), 64.00±2.03 µg/mL (48h), and 75.00±3.14 µg/mL
(72h). Both the methanol extract and the chloroform fraction exhibited cytotoxic activity
with IC50 values of 29.30±2.26 µg/mL (24h), 25.00±1.35 µg/mL (48h), and 21.50±3.30
µg/mL (72h) for the methanol extract and 9.50±2.95 µg/mL (24h), 8.70±1.59 µg/mL
(48h), and 21.00±1.98 µg/mL (72h) for chloroform fraction. The ethyl acetate fraction
displayed stronger cytotoxic activity with IC50 values of 1.10±1.20 µg/mL (24h),
3.50±2.00 µg/mL (48h), and 12.00±2.28 µg/mL (72h). However, the IC50 values of the
water fraction were above 100.00 µg/mL at 24h, 48h and 72h respectively (Figures 4.20
- 4.23). Each value is expressed as mean ±standard deviation of three measurements.
Figure 4.20: In vitro, growth inhibition of HT-29 cells by methanol extract of P.
macrocarpa seeds determined by MTT assay.
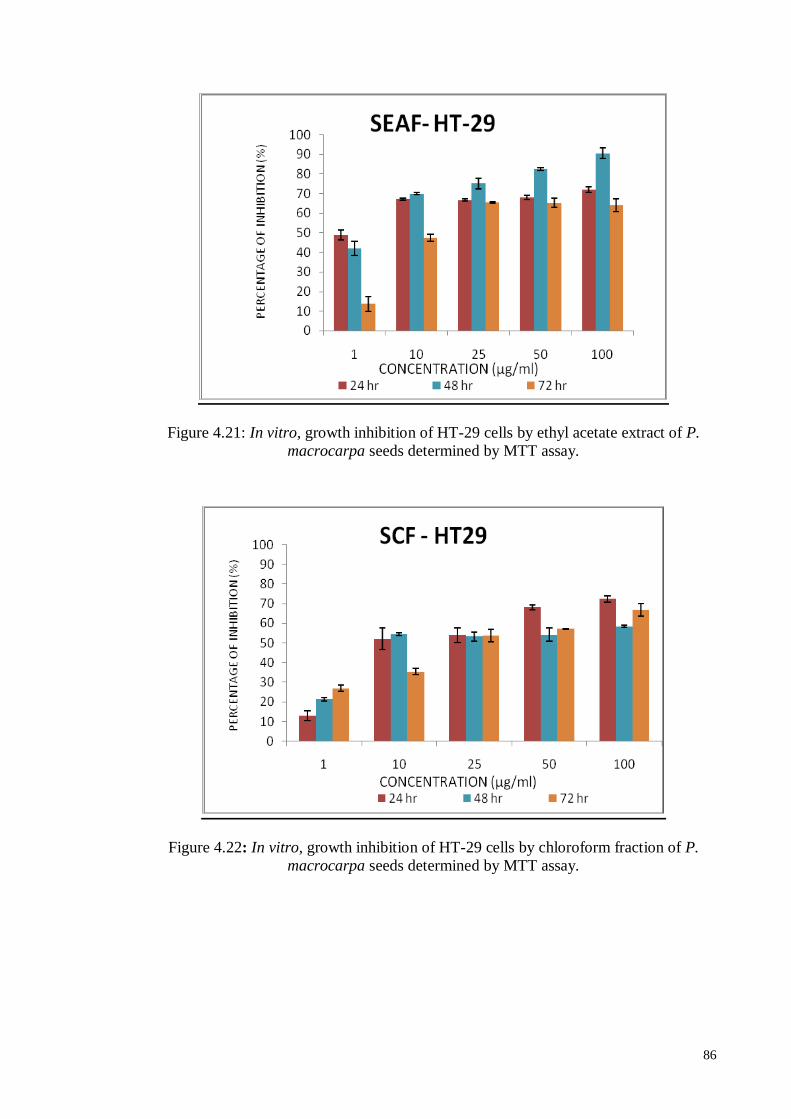
86
Figure 4.21: In vitro, growth inhibition of HT-29 cells by ethyl acetate extract of P.
macrocarpa seeds determined by MTT assay.
Figure 4.22: In vitro, growth inhibition of HT-29 cells by chloroform fraction of P.
macrocarpa seeds determined by MTT assay.
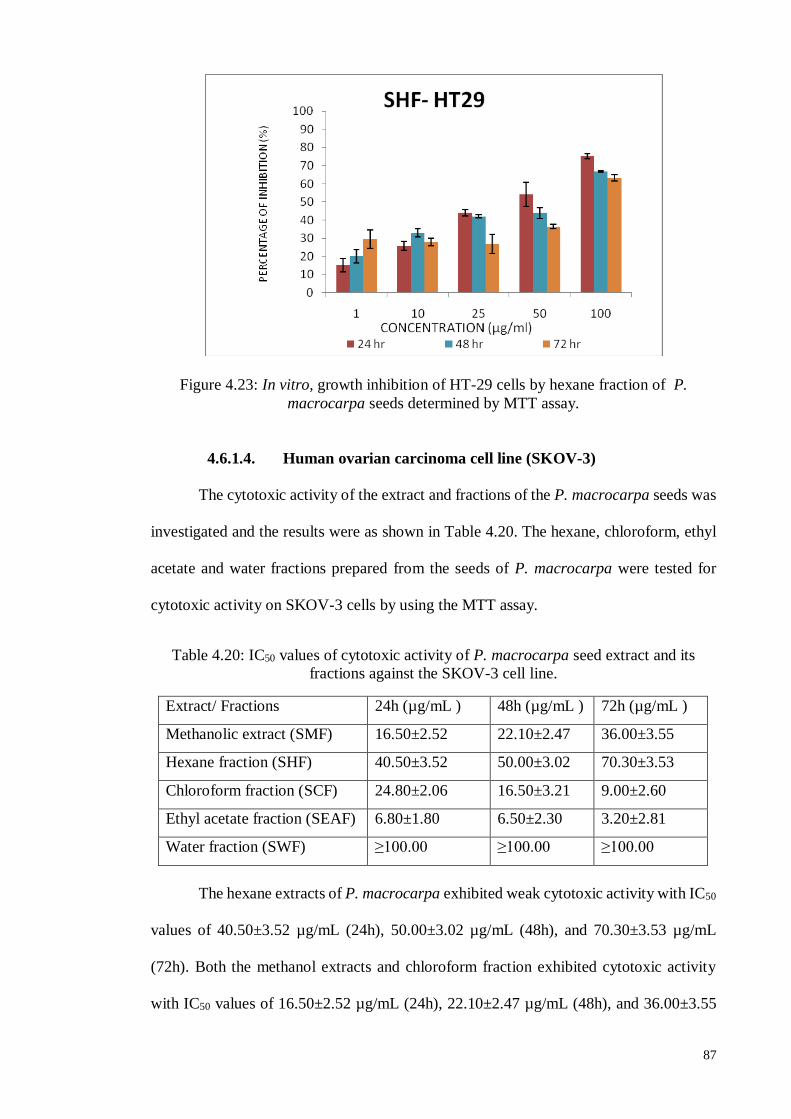
87
Figure 4.23: In vitro, growth inhibition of HT-29 cells by hexane fraction of P.
macrocarpa seeds determined by MTT assay.
4.6.1.4. Human ovarian carcinoma cell line (SKOV-3)
The cytotoxic activity of the extract and fractions of the P. macrocarpa seeds was
investigated and the results were as shown in Table 4.20. The hexane, chloroform, ethyl
acetate and water fractions prepared from the seeds of P. macrocarpa were tested for
cytotoxic activity on SKOV-3 cells by using the MTT assay.
Table 4.20: IC50 values of cytotoxic activity of P. macrocarpa seed extract and its
fractions against the SKOV-3 cell line.
Extract/ Fractions 24h (µg/mL ) 48h (µg/mL ) 72h (µg/mL )
Methanolic extract (SMF) 16.50±2.52 22.10±2.47 36.00±3.55
Hexane fraction (SHF) 40.50±3.52 50.00±3.02 70.30±3.53
Chloroform fraction (SCF) 24.80±2.06 16.50±3.21 9.00±2.60
Ethyl acetate fraction (SEAF) 6.80±1.80 6.50±2.30 3.20±2.81
Water fraction (SWF) ≥100.00 ≥100.00 ≥100.00
The hexane extracts of P. macrocarpa exhibited weak cytotoxic activity with IC50
values of 40.50±3.52 µg/mL (24h), 50.00±3.02 µg/mL (48h), and 70.30±3.53 µg/mL
(72h). Both the methanol extracts and chloroform fraction exhibited cytotoxic activity
with IC50 values of 16.50±2.52 µg/mL (24h), 22.10±2.47 µg/mL (48h), and 36.00±3.55
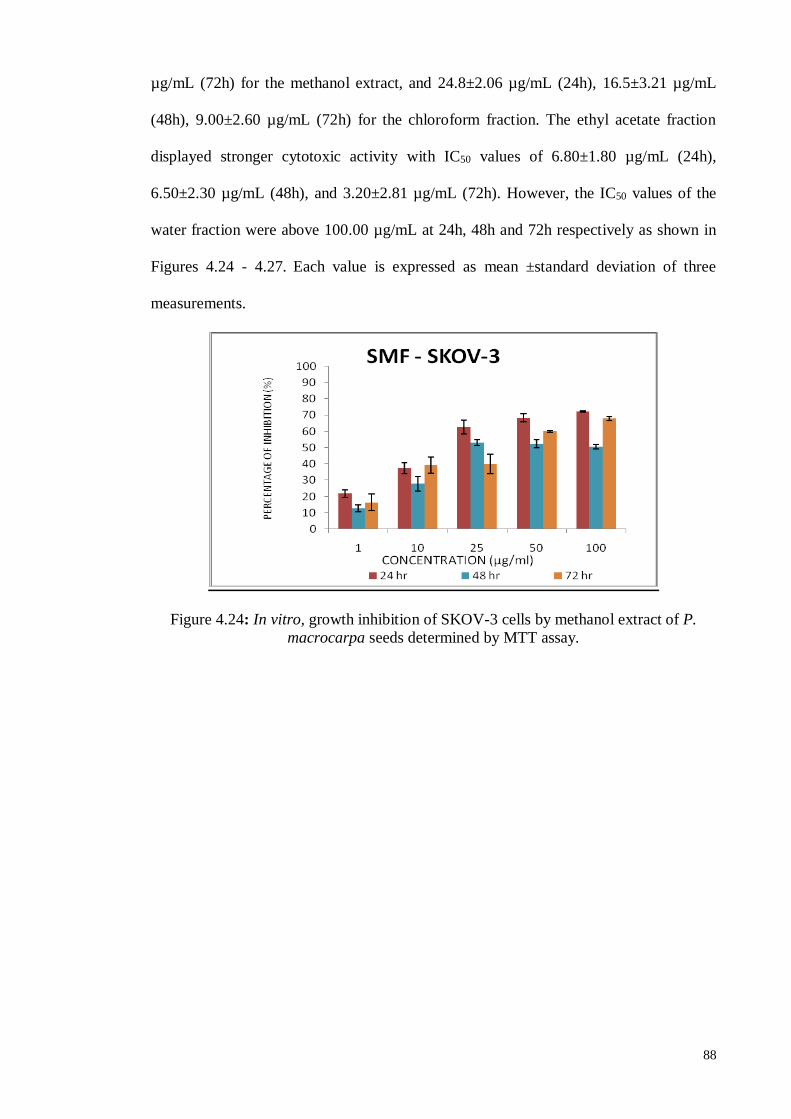
88
µg/mL (72h) for the methanol extract, and 24.8±2.06 µg/mL (24h), 16.5±3.21 µg/mL
(48h), 9.00±2.60 µg/mL (72h) for the chloroform fraction. The ethyl acetate fraction
displayed stronger cytotoxic activity with IC50 values of 6.80±1.80 µg/mL (24h),
6.50±2.30 µg/mL (48h), and 3.20±2.81 µg/mL (72h). However, the IC50 values of the
water fraction were above 100.00 µg/mL at 24h, 48h and 72h respectively as shown in
Figures 4.24 - 4.27. Each value is expressed as mean ±standard deviation of three
measurements.
Figure 4.24: In vitro, growth inhibition of SKOV-3 cells by methanol extract of P.
macrocarpa seeds determined by MTT assay.
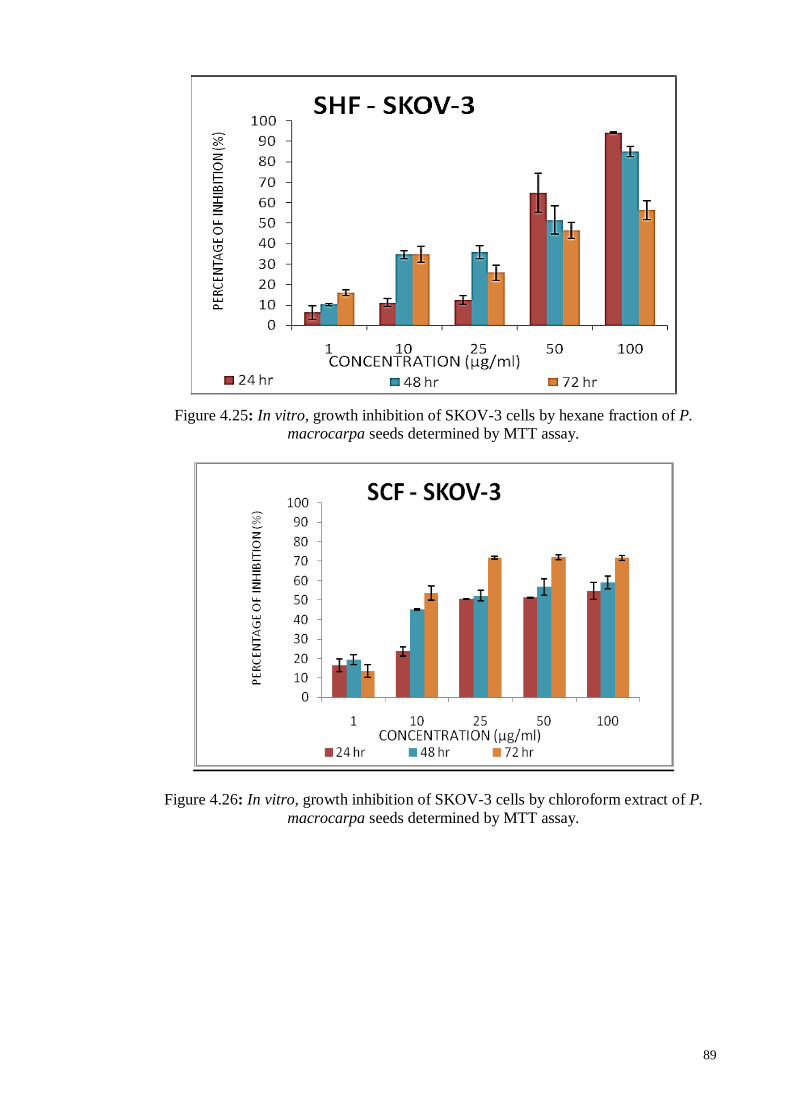
89
Figure 4.25: In vitro, growth inhibition of SKOV-3 cells by hexane fraction of P.
macrocarpa seeds determined by MTT assay.
Figure 4.26: In vitro, growth inhibition of SKOV-3 cells by chloroform extract of P.
macrocarpa seeds determined by MTT assay.
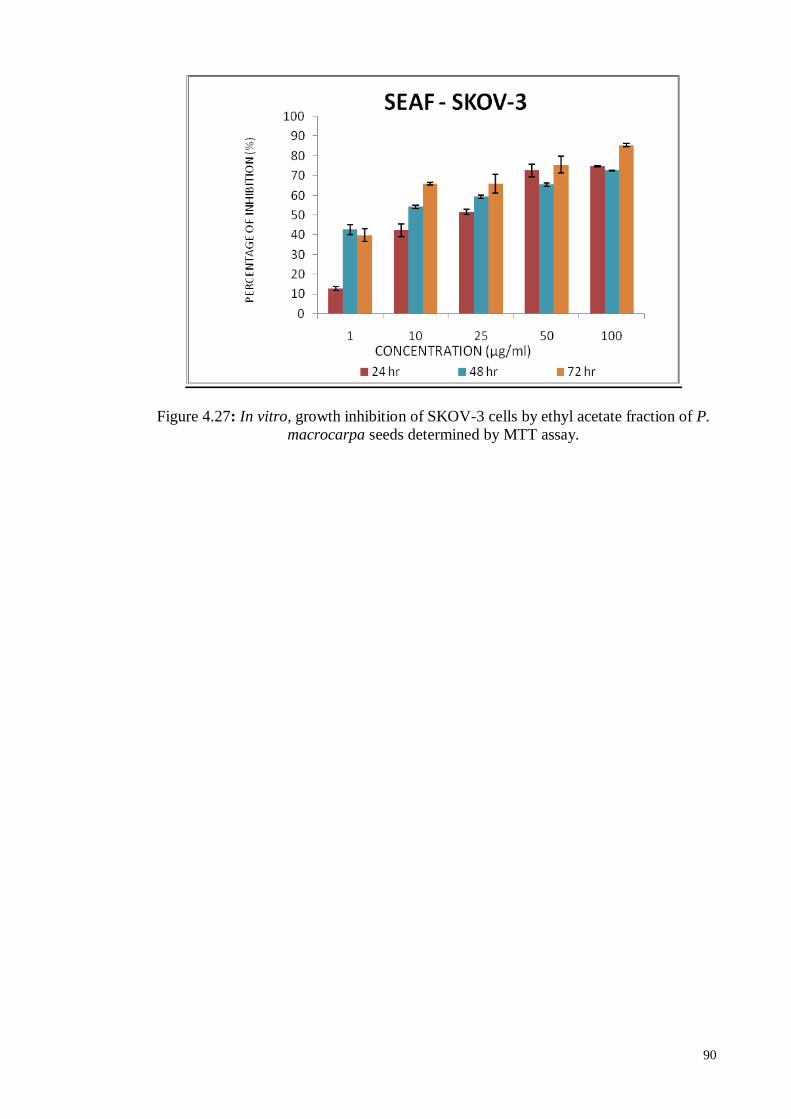
90
Figure 4.27: In vitro, growth inhibition of SKOV-3 cells by ethyl acetate fraction of P.
macrocarpa seeds determined by MTT assay.
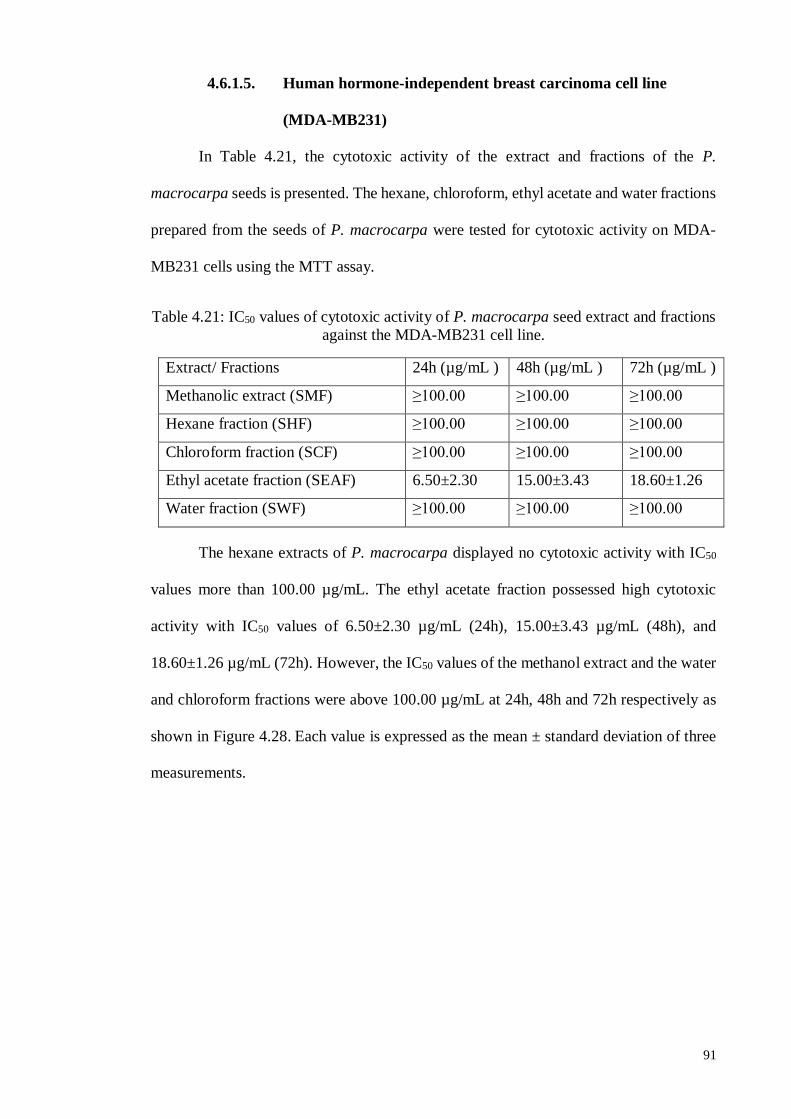
91
4.6.1.5. Human hormone-independent breast carcinoma cell line
(MDA-MB231)
In Table 4.21, the cytotoxic activity of the extract and fractions of the P.
macrocarpa seeds is presented. The hexane, chloroform, ethyl acetate and water fractions
prepared from the seeds of P. macrocarpa were tested for cytotoxic activity on MDA-
MB231 cells using the MTT assay.
Table 4.21: IC50 values of cytotoxic activity of P. macrocarpa seed extract and fractions
against the MDA-MB231 cell line.
Extract/ Fractions 24h (µg/mL ) 48h (µg/mL ) 72h (µg/mL )
Methanolic extract (SMF) ≥100.00 ≥100.00 ≥100.00
Hexane fraction (SHF) ≥100.00 ≥100.00 ≥100.00
Chloroform fraction (SCF) ≥100.00 ≥100.00 ≥100.00
Ethyl acetate fraction (SEAF) 6.50±2.30 15.00±3.43 18.60±1.26
Water fraction (SWF) ≥100.00 ≥100.00 ≥100.00
The hexane extracts of P. macrocarpa displayed no cytotoxic activity with IC50
values more than 100.00 µg/mL. The ethyl acetate fraction possessed high cytotoxic
activity with IC50 values of 6.50±2.30 µg/mL (24h), 15.00±3.43 µg/mL (48h), and
18.60±1.26 µg/mL (72h). However, the IC50 values of the methanol extract and the water
and chloroform fractions were above 100.00 µg/mL at 24h, 48h and 72h respectively as
shown in Figure 4.28. Each value is expressed as the mean ± standard deviation of three
measurements.
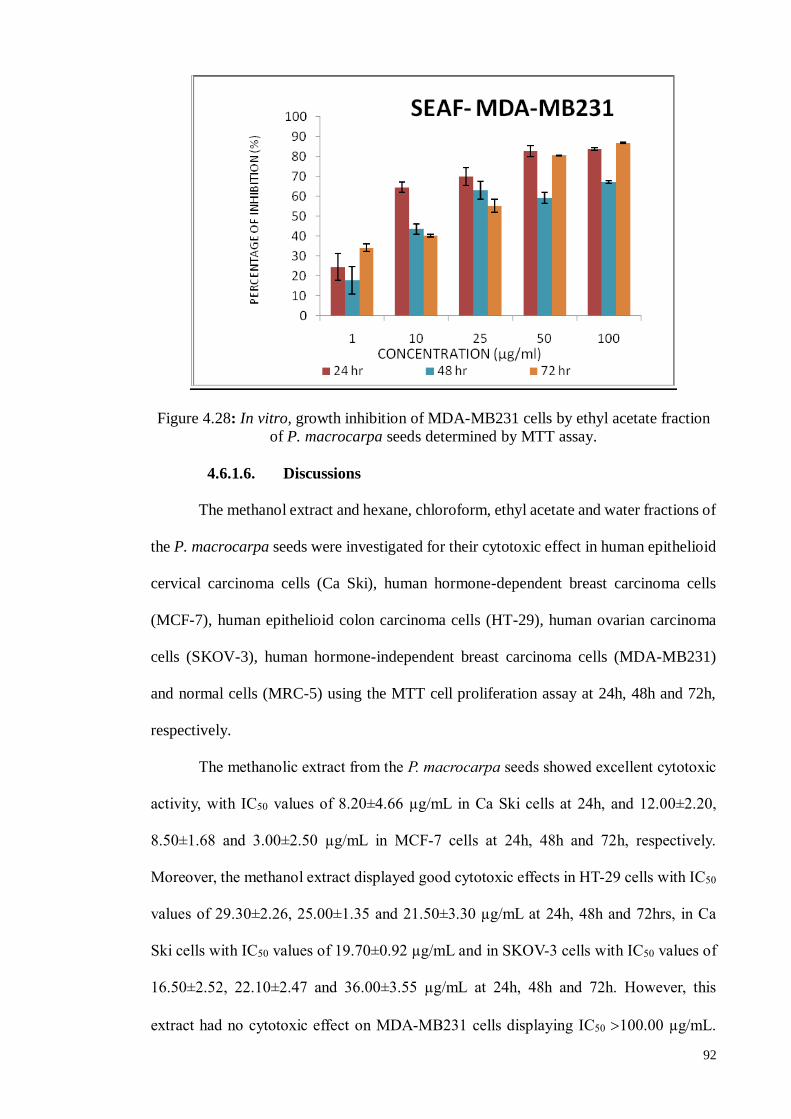
92
Figure 4.28: In vitro, growth inhibition of MDA-MB231 cells by ethyl acetate fraction
of P. macrocarpa seeds determined by MTT assay.
4.6.1.6. Discussions
The methanol extract and hexane, chloroform, ethyl acetate and water fractions of
the P. macrocarpa seeds were investigated for their cytotoxic effect in human epithelioid
cervical carcinoma cells (Ca Ski), human hormone-dependent breast carcinoma cells
(MCF-7), human epithelioid colon carcinoma cells (HT-29), human ovarian carcinoma
cells (SKOV-3), human hormone-independent breast carcinoma cells (MDA-MB231)
and normal cells (MRC-5) using the MTT cell proliferation assay at 24h, 48h and 72h,
respectively.
The methanolic extract from the P. macrocarpa seeds showed excellent cytotoxic
activity, with IC50 values of 8.20±4.66 µg/mL in Ca Ski cells at 24h, and 12.00±2.20,
8.50±1.68 and 3.00±2.50 µg/mL in MCF-7 cells at 24h, 48h and 72h, respectively.
Moreover, the methanol extract displayed good cytotoxic effects in HT-29 cells with IC50
values of 29.30±2.26, 25.00±1.35 and 21.50±3.30 µg/mL at 24h, 48h and 72hrs, in Ca
Ski cells with IC50 values of 19.70±0.92 µg/mL and in SKOV-3 cells with IC50 values of
16.50±2.52, 22.10±2.47 and 36.00±3.55 µg/mL at 24h, 48h and 72h. However, this
extract had no cytotoxic effect on MDA-MB231 cells displaying IC50 100.00 µg/mL.
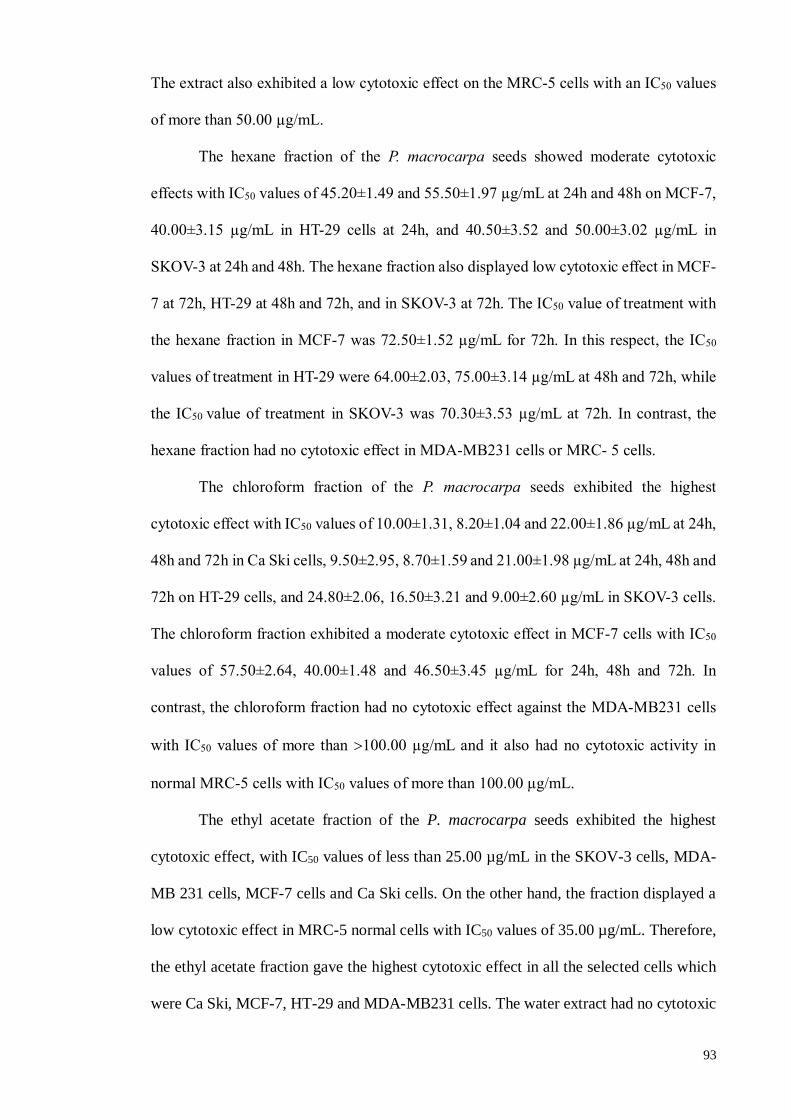
93
The extract also exhibited a low cytotoxic effect on the MRC-5 cells with an IC50 values
of more than 50.00 µg/mL.
The hexane fraction of the P. macrocarpa seeds showed moderate cytotoxic
effects with IC50 values of 45.20±1.49 and 55.50±1.97 µg/mL at 24h and 48h on MCF-7,
40.00±3.15 µg/mL in HT-29 cells at 24h, and 40.50±3.52 and 50.00±3.02 µg/mL in
SKOV-3 at 24h and 48h. The hexane fraction also displayed low cytotoxic effect in MCF-
7 at 72h, HT-29 at 48h and 72h, and in SKOV-3 at 72h. The IC50 value of treatment with
the hexane fraction in MCF-7 was 72.50±1.52 µg/mL for 72h. In this respect, the IC50
values of treatment in HT-29 were 64.00±2.03, 75.00±3.14 µg/mL at 48h and 72h, while
the IC50 value of treatment in SKOV-3 was 70.30±3.53 µg/mL at 72h. In contrast, the
hexane fraction had no cytotoxic effect in MDA-MB231 cells or MRC- 5 cells.
The chloroform fraction of the P. macrocarpa seeds exhibited the highest
cytotoxic effect with IC50 values of 10.00±1.31, 8.20±1.04 and 22.00±1.86 µg/mL at 24h,
48h and 72h in Ca Ski cells, 9.50±2.95, 8.70±1.59 and 21.00±1.98 µg/mL at 24h, 48h and
72h on HT-29 cells, and 24.80±2.06, 16.50±3.21 and 9.00±2.60 µg/mL in SKOV-3 cells.
The chloroform fraction exhibited a moderate cytotoxic effect in MCF-7 cells with IC50
values of 57.50±2.64, 40.00±1.48 and 46.50±3.45 µg/mL for 24h, 48h and 72h. In
contrast, the chloroform fraction had no cytotoxic effect against the MDA-MB231 cells
with IC50 values of more than 100.00 µg/mL and it also had no cytotoxic activity in
normal MRC-5 cells with IC50 values of more than 100.00 µg/mL.
The ethyl acetate fraction of the P. macrocarpa seeds exhibited the highest
cytotoxic effect, with IC50 values of less than 25.00 µg/mL in the SKOV-3 cells, MDA-
MB 231 cells, MCF-7 cells and Ca Ski cells. On the other hand, the fraction displayed a
low cytotoxic effect in MRC-5 normal cells with IC50 values of 35.00 µg/mL. Therefore,
the ethyl acetate fraction gave the highest cytotoxic effect in all the selected cells which
were Ca Ski, MCF-7, HT-29 and MDA-MB231 cells. The water extract had no cytotoxic
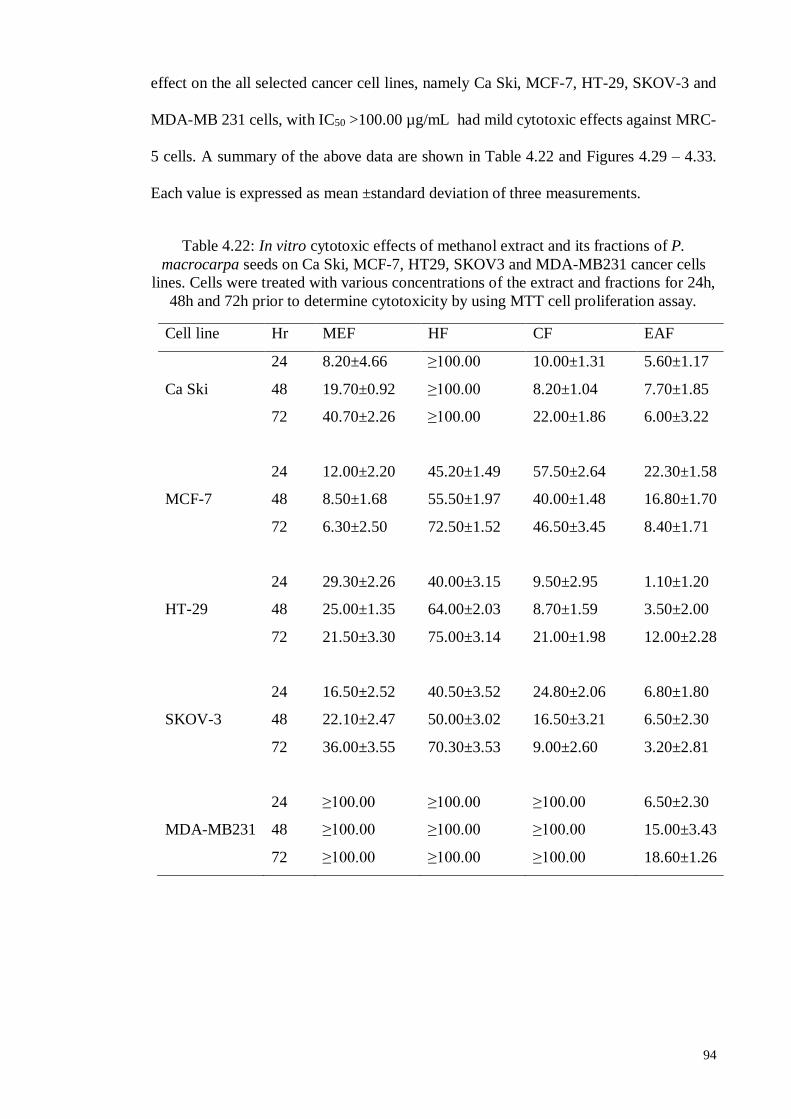
94
effect on the all selected cancer cell lines, namely Ca Ski, MCF-7, HT-29, SKOV-3 and
MDA-MB 231 cells, with IC50 >100.00 µg/mL had mild cytotoxic effects against MRC-
5 cells. A summary of the above data are shown in Table 4.22 and Figures 4.29 – 4.33.
Each value is expressed as mean ±standard deviation of three measurements.
Table 4.22: In vitro cytotoxic effects of methanol extract and its fractions of P.
macrocarpa seeds on Ca Ski, MCF-7, HT29, SKOV3 and MDA-MB231 cancer cells
lines. Cells were treated with various concentrations of the extract and fractions for 24h,
48h and 72h prior to determine cytotoxicity by using MTT cell proliferation assay.
Cell line Hr MEF HF CF EAF
24 8.20±4.66 ≥100.00 10.00±1.31 5.60±1.17
Ca Ski 48 19.70±0.92 ≥100.00 8.20±1.04 7.70±1.85
72 40.70±2.26 ≥100.00 22.00±1.86 6.00±3.22
24 12.00±2.20 45.20±1.49 57.50±2.64 22.30±1.58
MCF-7 48 8.50±1.68 55.50±1.97 40.00±1.48 16.80±1.70
72 6.30±2.50 72.50±1.52 46.50±3.45 8.40±1.71
24 29.30±2.26 40.00±3.15 9.50±2.95 1.10±1.20
HT-29 48 25.00±1.35 64.00±2.03 8.70±1.59 3.50±2.00
72 21.50±3.30 75.00±3.14 21.00±1.98 12.00±2.28
24 16.50±2.52 40.50±3.52 24.80±2.06 6.80±1.80
SKOV-3 48 22.10±2.47 50.00±3.02 16.50±3.21 6.50±2.30
72 36.00±3.55 70.30±3.53 9.00±2.60 3.20±2.81
24 ≥100.00 ≥100.00 ≥100.00 6.50±2.30
MDA-MB231 48 ≥100.00 ≥100.00 ≥100.00 15.00±3.43
72 ≥100.00 ≥100.00 ≥100.00 18.60±1.26
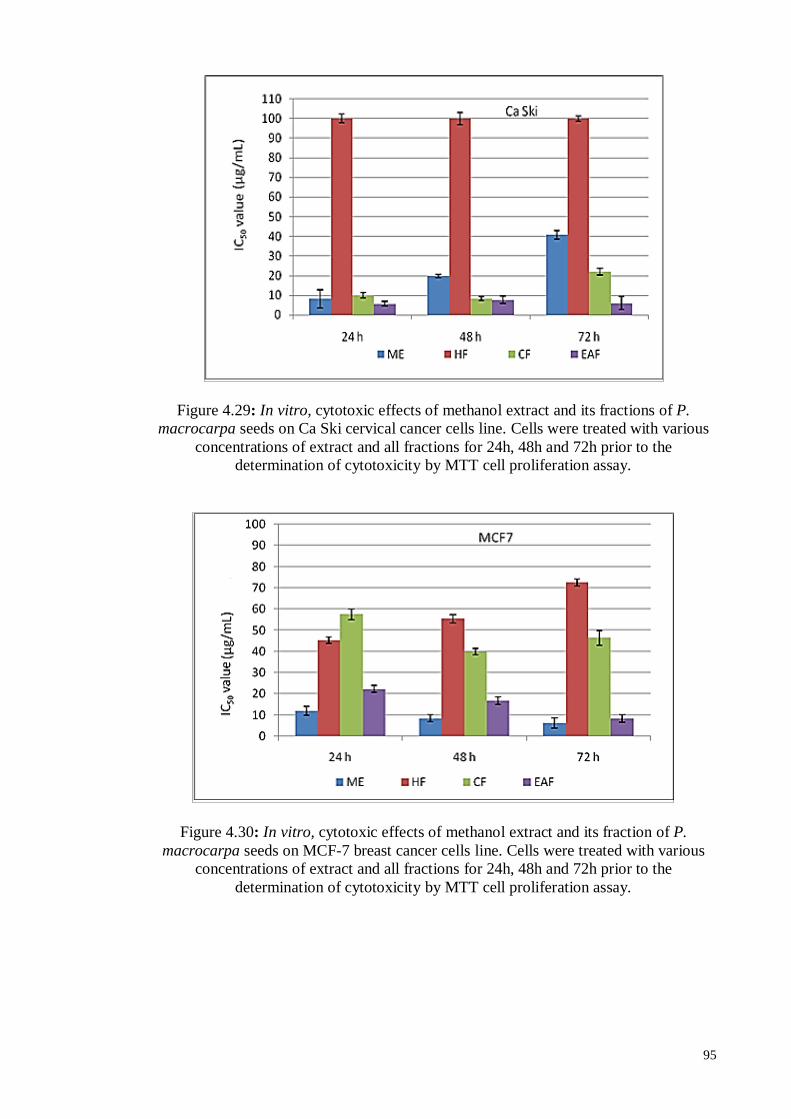
95
Figure 4.29: In vitro, cytotoxic effects of methanol extract and its fractions of P.
macrocarpa seeds on Ca Ski cervical cancer cells line. Cells were treated with various
concentrations of extract and all fractions for 24h, 48h and 72h prior to the
determination of cytotoxicity by MTT cell proliferation assay.
Figure 4.30: In vitro, cytotoxic effects of methanol extract and its fraction of P.
macrocarpa seeds on MCF-7 breast cancer cells line. Cells were treated with various
concentrations of extract and all fractions for 24h, 48h and 72h prior to the
determination of cytotoxicity by MTT cell proliferation assay.
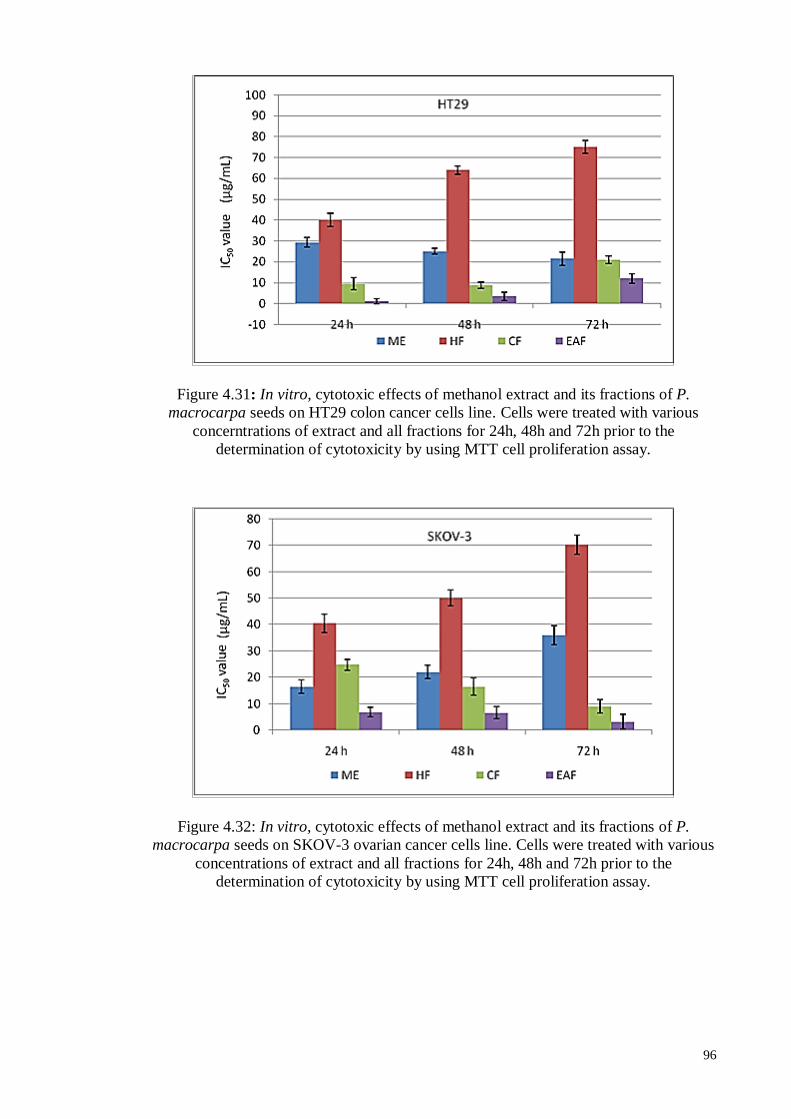
96
Figure 4.31: In vitro, cytotoxic effects of methanol extract and its fractions of P.
macrocarpa seeds on HT29 colon cancer cells line. Cells were treated with various
concerntrations of extract and all fractions for 24h, 48h and 72h prior to the
determination of cytotoxicity by using MTT cell proliferation assay.
Figure 4.32: In vitro, cytotoxic effects of methanol extract and its fractions of P.
macrocarpa seeds on SKOV-3 ovarian cancer cells line. Cells were treated with various
concentrations of extract and all fractions for 24h, 48h and 72h prior to the
determination of cytotoxicity by using MTT cell proliferation assay.
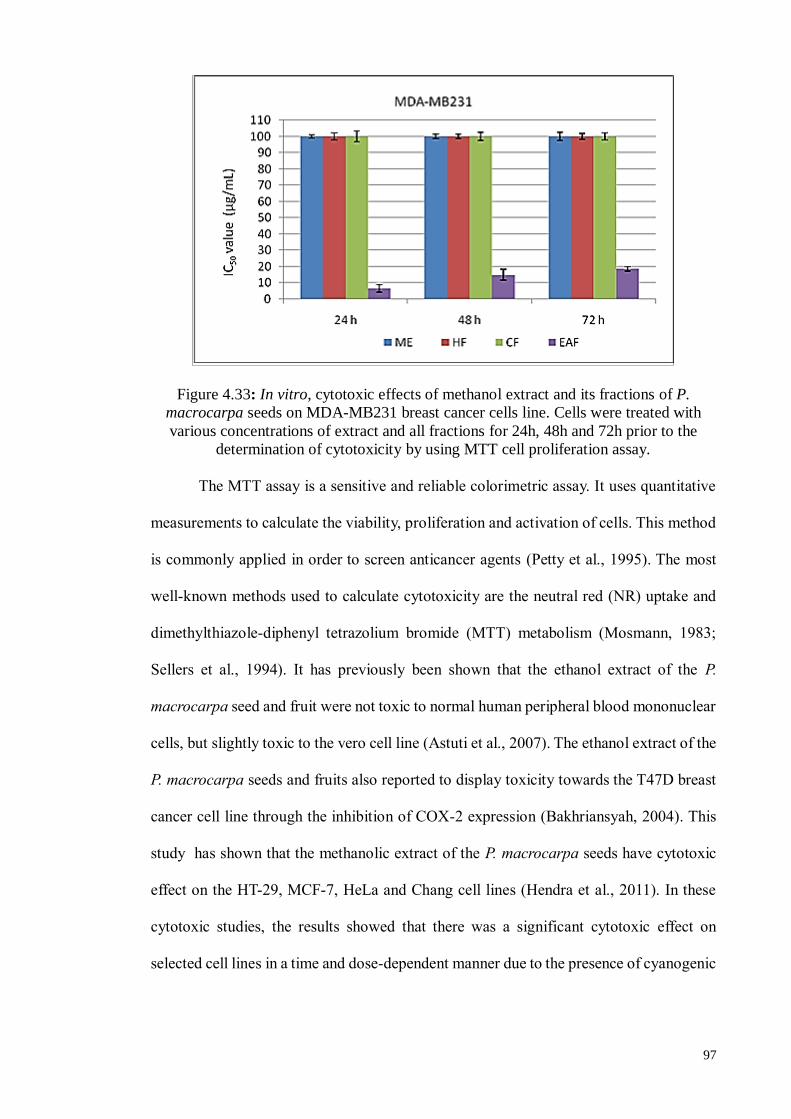
97
Figure 4.33: In vitro, cytotoxic effects of methanol extract and its fractions of P.
macrocarpa seeds on MDA-MB231 breast cancer cells line. Cells were treated with
various concentrations of extract and all fractions for 24h, 48h and 72h prior to the
determination of cytotoxicity by using MTT cell proliferation assay.
The MTT assay is a sensitive and reliable colorimetric assay. It uses quantitative
measurements to calculate the viability, proliferation and activation of cells. This method
is commonly applied in order to screen anticancer agents (Petty et al., 1995). The most
well-known methods used to calculate cytotoxicity are the neutral red (NR) uptake and
dimethylthiazole-diphenyl tetrazolium bromide (MTT) metabolism (Mosmann, 1983;
Sellers et al., 1994). It has previously been shown that the ethanol extract of the P.
macrocarpa seed and fruit were not toxic to normal human peripheral blood mononuclear
cells, but slightly toxic to the vero cell line (Astuti et al., 2007). The ethanol extract of the
P. macrocarpa seeds and fruits also reported to display toxicity towards the T47D breast
cancer cell line through the inhibition of COX-2 expression (Bakhriansyah, 2004). This
study has shown that the methanolic extract of the P. macrocarpa seeds have cytotoxic
effect on the HT-29, MCF-7, HeLa and Chang cell lines (Hendra et al., 2011). In these
cytotoxic studies, the results showed that there was a significant cytotoxic effect on
selected cell lines in a time and dose-dependent manner due to the presence of cyanogenic
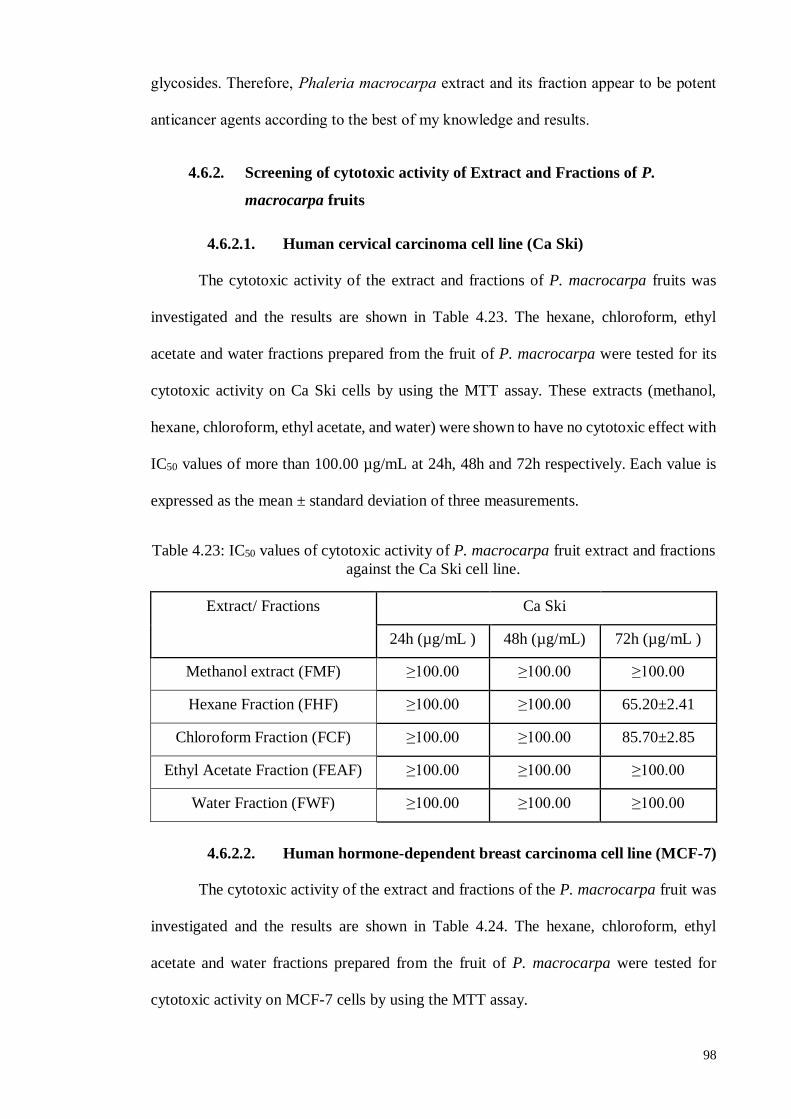
98
glycosides. Therefore, Phaleria macrocarpa extract and its fraction appear to be potent
anticancer agents according to the best of my knowledge and results.
4.6.2. Screening of cytotoxic activity of Extract and Fractions of P.
macrocarpa fruits
4.6.2.1. Human cervical carcinoma cell line (Ca Ski)
The cytotoxic activity of the extract and fractions of P. macrocarpa fruits was
investigated and the results are shown in Table 4.23. The hexane, chloroform, ethyl
acetate and water fractions prepared from the fruit of P. macrocarpa were tested for its
cytotoxic activity on Ca Ski cells by using the MTT assay. These extracts (methanol,
hexane, chloroform, ethyl acetate, and water) were shown to have no cytotoxic effect with
IC50 values of more than 100.00 µg/mL at 24h, 48h and 72h respectively. Each value is
expressed as the mean ± standard deviation of three measurements.
Table 4.23: IC50 values of cytotoxic activity of P. macrocarpa fruit extract and fractions
against the Ca Ski cell line.
Extract/ Fractions Ca Ski
24h (µg/mL ) 48h (µg/mL) 72h (µg/mL )
Methanol extract (FMF) ≥100.00 ≥100.00 ≥100.00
Hexane Fraction (FHF) ≥100.00 ≥100.00 65.20±2.41
Chloroform Fraction (FCF) ≥100.00 ≥100.00 85.70±2.85
Ethyl Acetate Fraction (FEAF) ≥100.00 ≥100.00 ≥100.00
Water Fraction (FWF) ≥100.00 ≥100.00 ≥100.00
4.6.2.2. Human hormone-dependent breast carcinoma cell line (MCF-7)
The cytotoxic activity of the extract and fractions of the P. macrocarpa fruit was
investigated and the results are shown in Table 4.24. The hexane, chloroform, ethyl
acetate and water fractions prepared from the fruit of P. macrocarpa were tested for
cytotoxic activity on MCF-7 cells by using the MTT assay.
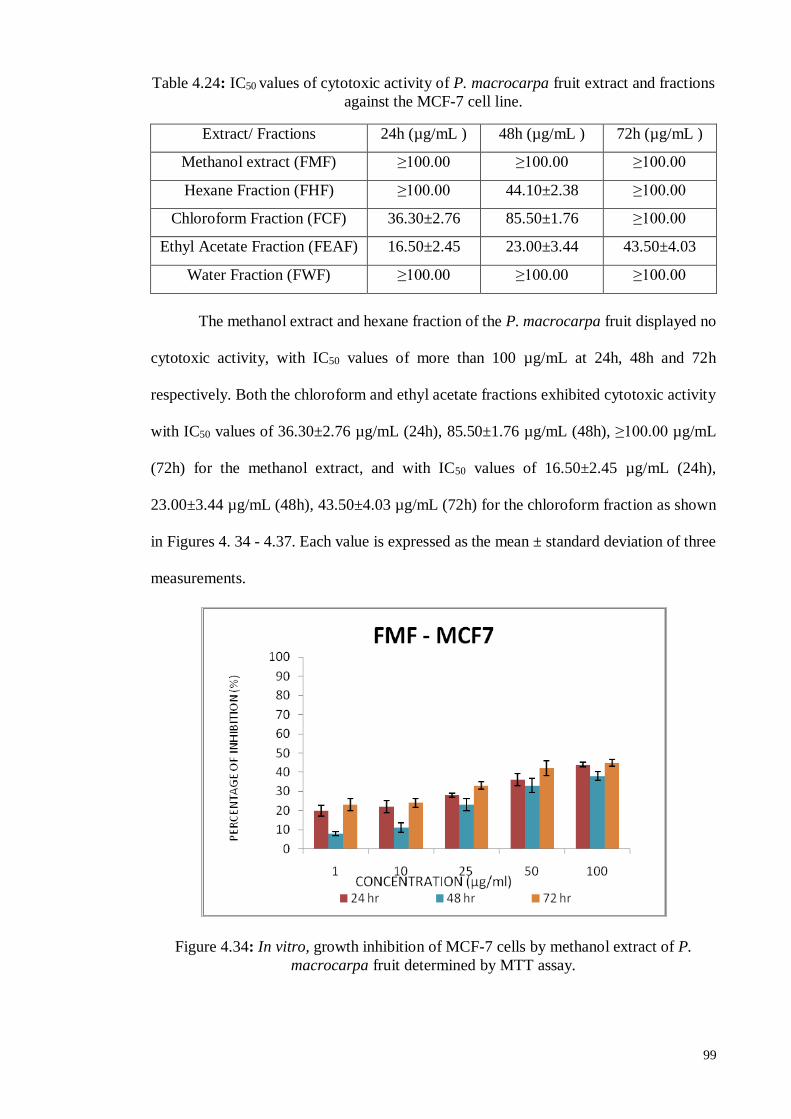
99
Table 4.24: IC50 values of cytotoxic activity of P. macrocarpa fruit extract and fractions
against the MCF-7 cell line.
Extract/ Fractions 24h (µg/mL ) 48h (µg/mL ) 72h (µg/mL )
Methanol extract (FMF) ≥100.00 ≥100.00 ≥100.00
Hexane Fraction (FHF) ≥100.00 44.10±2.38 ≥100.00
Chloroform Fraction (FCF) 36.30±2.76 85.50±1.76 ≥100.00
Ethyl Acetate Fraction (FEAF) 16.50±2.45 23.00±3.44 43.50±4.03
Water Fraction (FWF) ≥100.00 ≥100.00 ≥100.00
The methanol extract and hexane fraction of the P. macrocarpa fruit displayed no
cytotoxic activity, with IC50 values of more than 100 µg/mL at 24h, 48h and 72h
respectively. Both the chloroform and ethyl acetate fractions exhibited cytotoxic activity
with IC50 values of 36.30±2.76 µg/mL (24h), 85.50±1.76 µg/mL (48h), ≥100.00 µg/mL
(72h) for the methanol extract, and with IC50 values of 16.50±2.45 µg/mL (24h),
23.00±3.44 µg/mL (48h), 43.50±4.03 µg/mL (72h) for the chloroform fraction as shown
in Figures 4. 34 - 4.37. Each value is expressed as the mean ± standard deviation of three
measurements.
Figure 4.34: In vitro, growth inhibition of MCF-7 cells by methanol extract of P.
macrocarpa fruit determined by MTT assay.
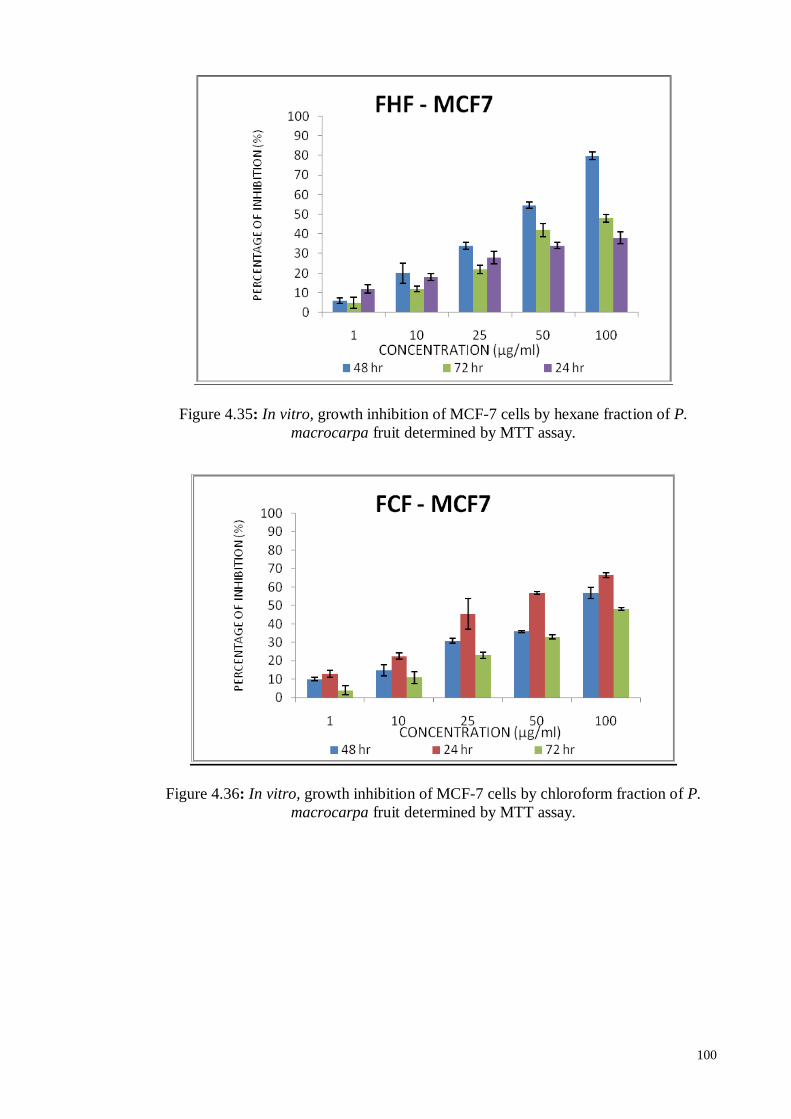
100
Figure 4.35: In vitro, growth inhibition of MCF-7 cells by hexane fraction of P.
macrocarpa fruit determined by MTT assay.
Figure 4.36: In vitro, growth inhibition of MCF-7 cells by chloroform fraction of P.
macrocarpa fruit determined by MTT assay.
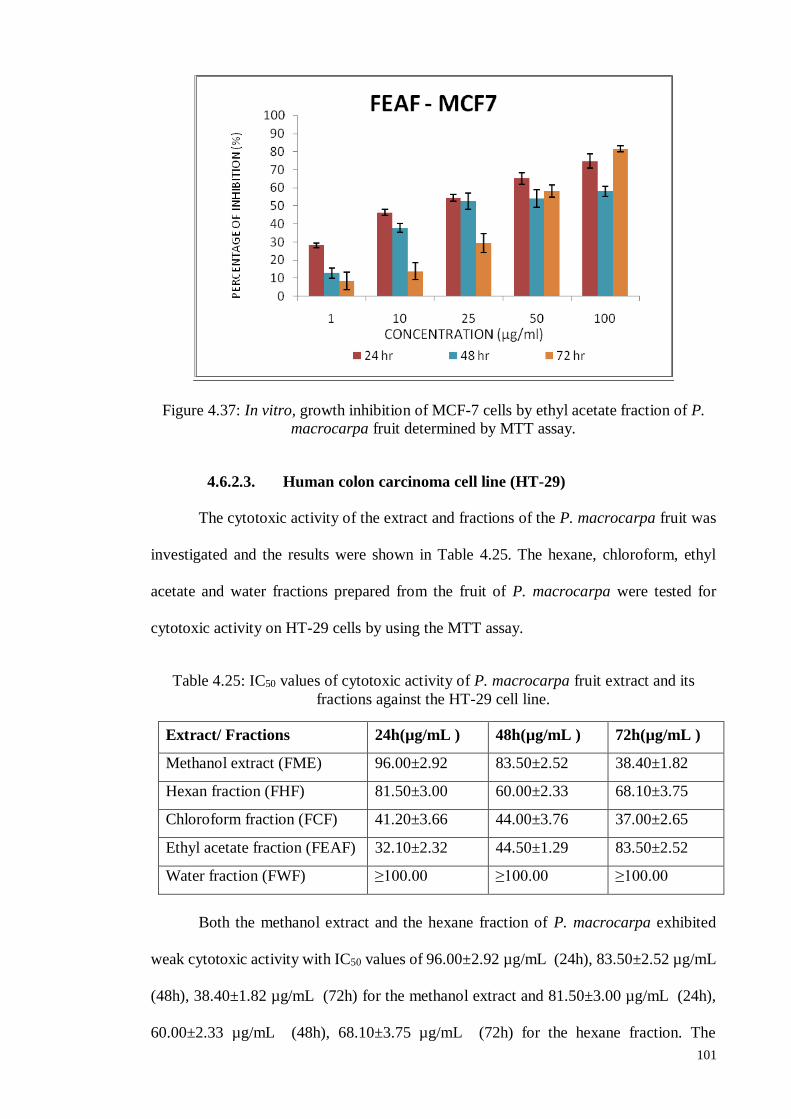
101
Figure 4.37: In vitro, growth inhibition of MCF-7 cells by ethyl acetate fraction of P.
macrocarpa fruit determined by MTT assay.
4.6.2.3. Human colon carcinoma cell line (HT-29)
The cytotoxic activity of the extract and fractions of the P. macrocarpa fruit was
investigated and the results were shown in Table 4.25. The hexane, chloroform, ethyl
acetate and water fractions prepared from the fruit of P. macrocarpa were tested for
cytotoxic activity on HT-29 cells by using the MTT assay.
Table 4.25: IC50 values of cytotoxic activity of P. macrocarpa fruit extract and its
fractions against the HT-29 cell line.
Extract/ Fractions 24h(µg/mL ) 48h(µg/mL ) 72h(µg/mL )
Methanol extract (FME) 96.00±2.92 83.50±2.52 38.40±1.82
Hexan fraction (FHF) 81.50±3.00 60.00±2.33 68.10±3.75
Chloroform fraction (FCF) 41.20±3.66 44.00±3.76 37.00±2.65
Ethyl acetate fraction (FEAF) 32.10±2.32 44.50±1.29 83.50±2.52
Water fraction (FWF) ≥100.00 ≥100.00 ≥100.00
Both the methanol extract and the hexane fraction of P. macrocarpa exhibited
weak cytotoxic activity with IC50 values of 96.00±2.92 µg/mL (24h), 83.50±2.52 µg/mL
(48h), 38.40±1.82 µg/mL (72h) for the methanol extract and 81.50±3.00 µg/mL (24h),
60.00±2.33 µg/mL (48h), 68.10±3.75 µg/mL (72h) for the hexane fraction. The
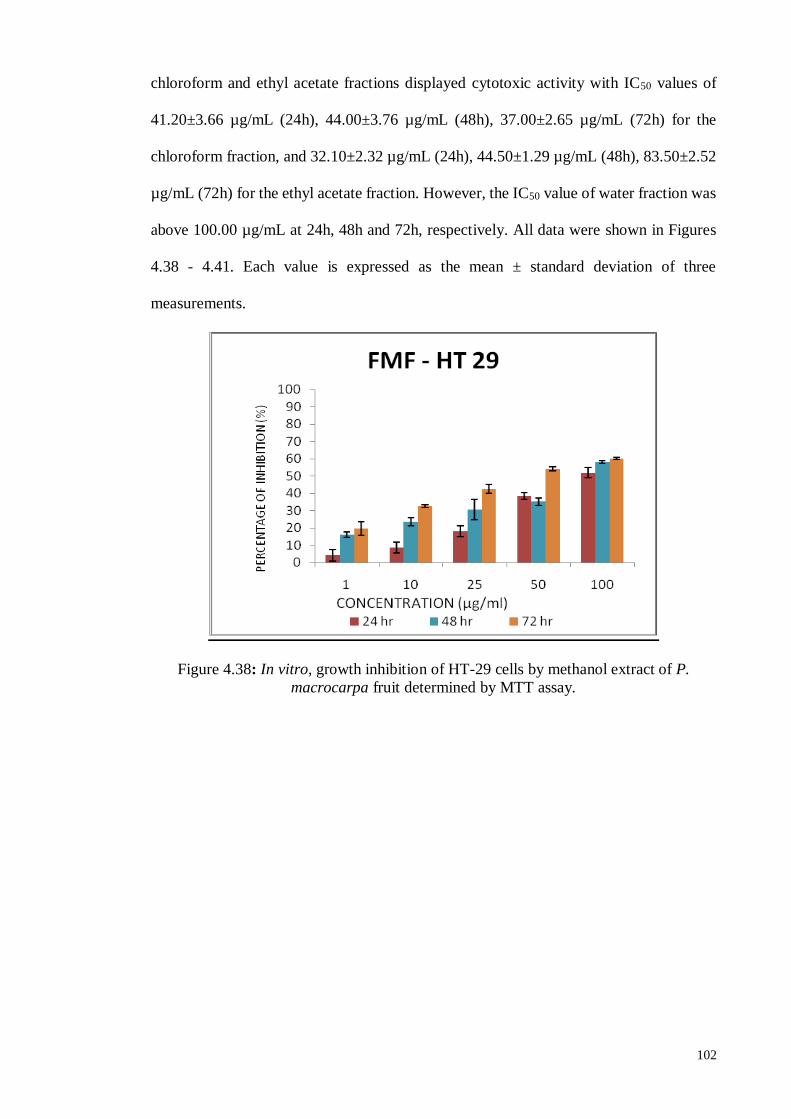
102
chloroform and ethyl acetate fractions displayed cytotoxic activity with IC50 values of
41.20±3.66 µg/mL (24h), 44.00±3.76 µg/mL (48h), 37.00±2.65 µg/mL (72h) for the
chloroform fraction, and 32.10±2.32 µg/mL (24h), 44.50±1.29 µg/mL (48h), 83.50±2.52
µg/mL (72h) for the ethyl acetate fraction. However, the IC50 value of water fraction was
above 100.00 µg/mL at 24h, 48h and 72h, respectively. All data were shown in Figures
4.38 - 4.41. Each value is expressed as the mean ± standard deviation of three
measurements.
Figure 4.38: In vitro, growth inhibition of HT-29 cells by methanol extract of P.
macrocarpa fruit determined by MTT assay.
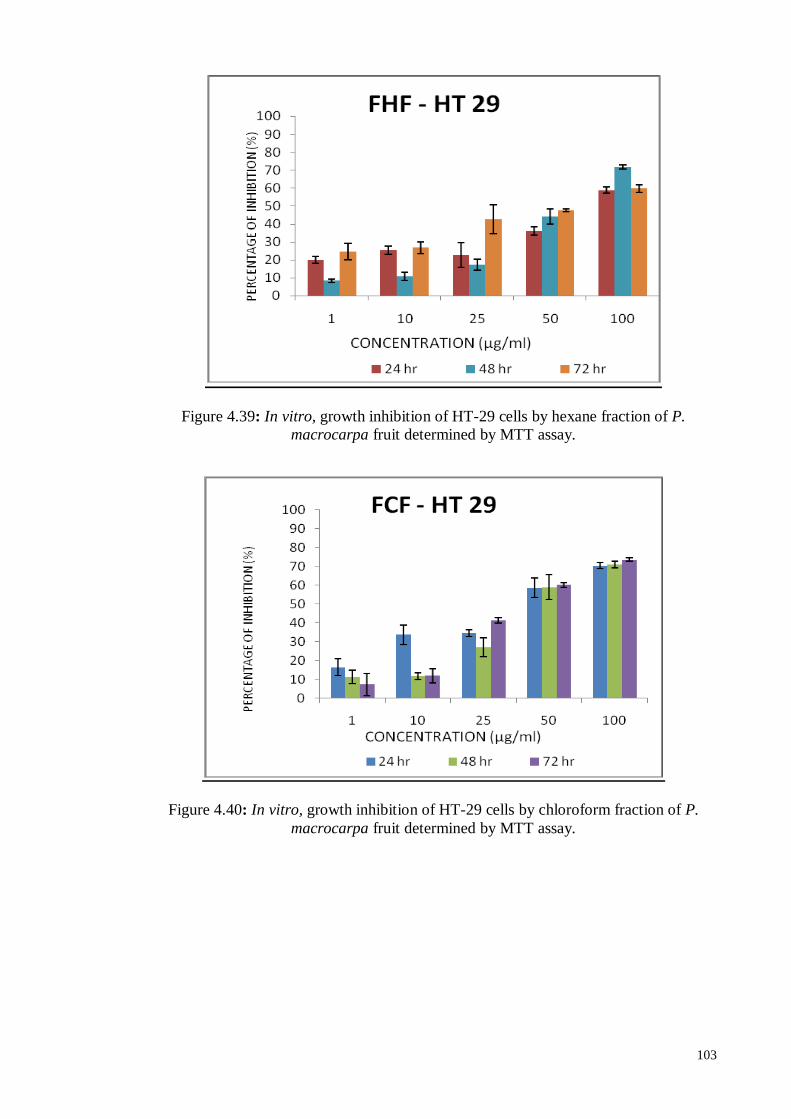
103
Figure 4.39: In vitro, growth inhibition of HT-29 cells by hexane fraction of P.
macrocarpa fruit determined by MTT assay.
Figure 4.40: In vitro, growth inhibition of HT-29 cells by chloroform fraction of P.
macrocarpa fruit determined by MTT assay.
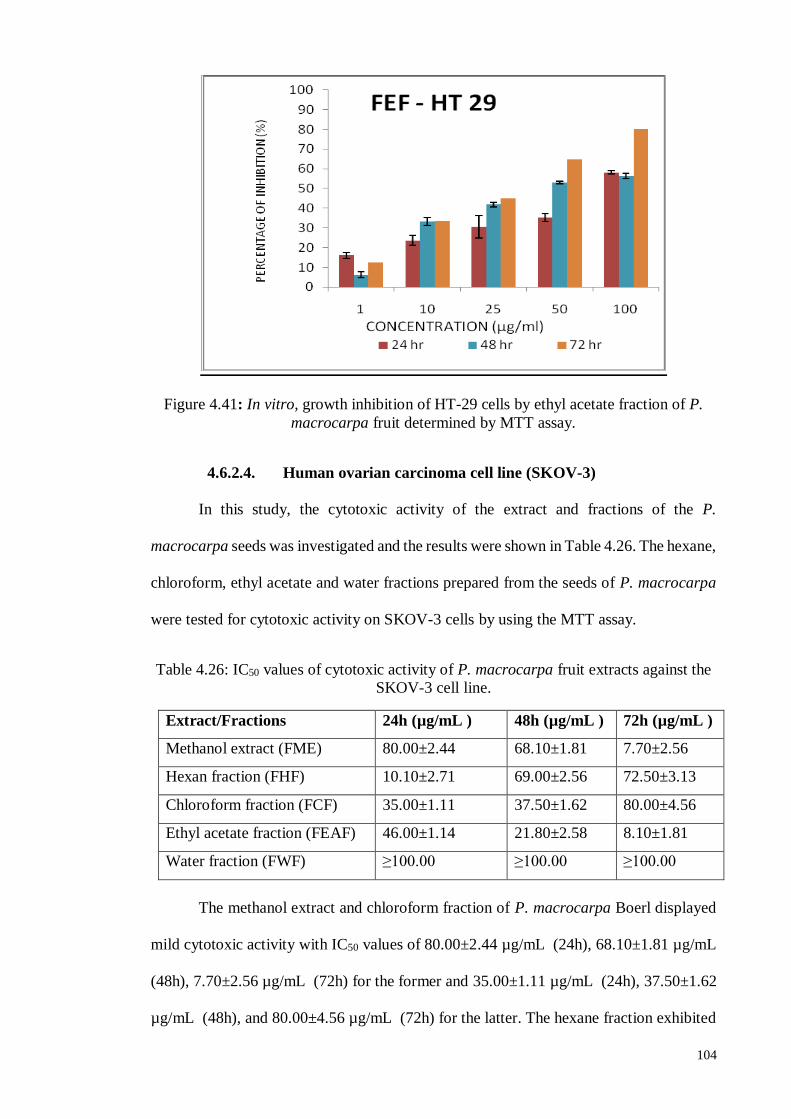
104
Figure 4.41: In vitro, growth inhibition of HT-29 cells by ethyl acetate fraction of P.
macrocarpa fruit determined by MTT assay.
4.6.2.4. Human ovarian carcinoma cell line (SKOV-3)
In this study, the cytotoxic activity of the extract and fractions of the P.
macrocarpa seeds was investigated and the results were shown in Table 4.26. The hexane,
chloroform, ethyl acetate and water fractions prepared from the seeds of P. macrocarpa
were tested for cytotoxic activity on SKOV-3 cells by using the MTT assay.
Table 4.26: IC50 values of cytotoxic activity of P. macrocarpa fruit extracts against the
SKOV-3 cell line.
Extract/Fractions 24h (µg/mL ) 48h (µg/mL ) 72h (µg/mL )
Methanol extract (FME) 80.00±2.44 68.10±1.81 7.70±2.56
Hexan fraction (FHF) 10.10±2.71 69.00±2.56 72.50±3.13
Chloroform fraction (FCF) 35.00±1.11 37.50±1.62 80.00±4.56
Ethyl acetate fraction (FEAF) 46.00±1.14 21.80±2.58 8.10±1.81
Water fraction (FWF) ≥100.00 ≥100.00 ≥100.00
The methanol extract and chloroform fraction of P. macrocarpa Boerl displayed
mild cytotoxic activity with IC50 values of 80.00±2.44 µg/mL (24h), 68.10±1.81 µg/mL
(48h), 7.70±2.56 µg/mL (72h) for the former and 35.00±1.11 µg/mL (24h), 37.50±1.62
µg/mL (48h), and 80.00±4.56 µg/mL (72h) for the latter. The hexane fraction exhibited
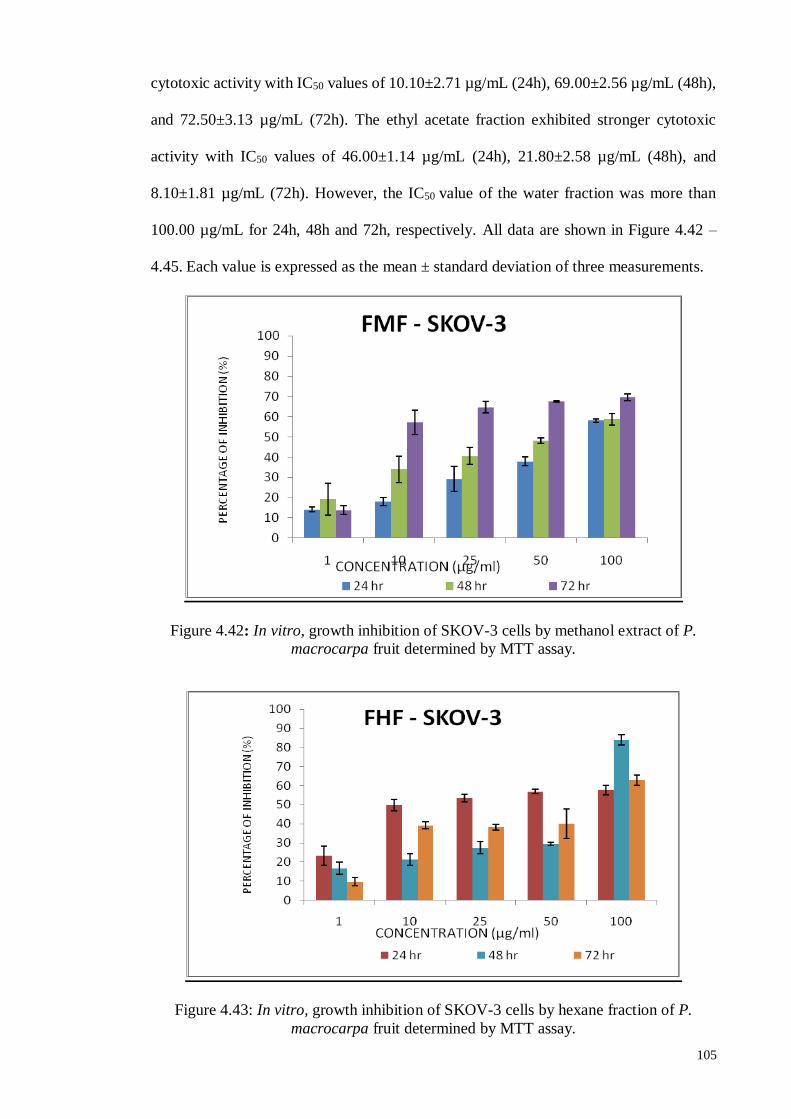
105
cytotoxic activity with IC50 values of 10.10±2.71 µg/mL (24h), 69.00±2.56 µg/mL (48h),
and 72.50±3.13 µg/mL (72h). The ethyl acetate fraction exhibited stronger cytotoxic
activity with IC50 values of 46.00±1.14 µg/mL (24h), 21.80±2.58 µg/mL (48h), and
8.10±1.81 µg/mL (72h). However, the IC50 value of the water fraction was more than
100.00 µg/mL for 24h, 48h and 72h, respectively. All data are shown in Figure 4.42 –
4.45. Each value is expressed as the mean ± standard deviation of three measurements.
Figure 4.42: In vitro, growth inhibition of SKOV-3 cells by methanol extract of P.
macrocarpa fruit determined by MTT assay.
Figure 4.43: In vitro, growth inhibition of SKOV-3 cells by hexane fraction of P.
macrocarpa fruit determined by MTT assay.
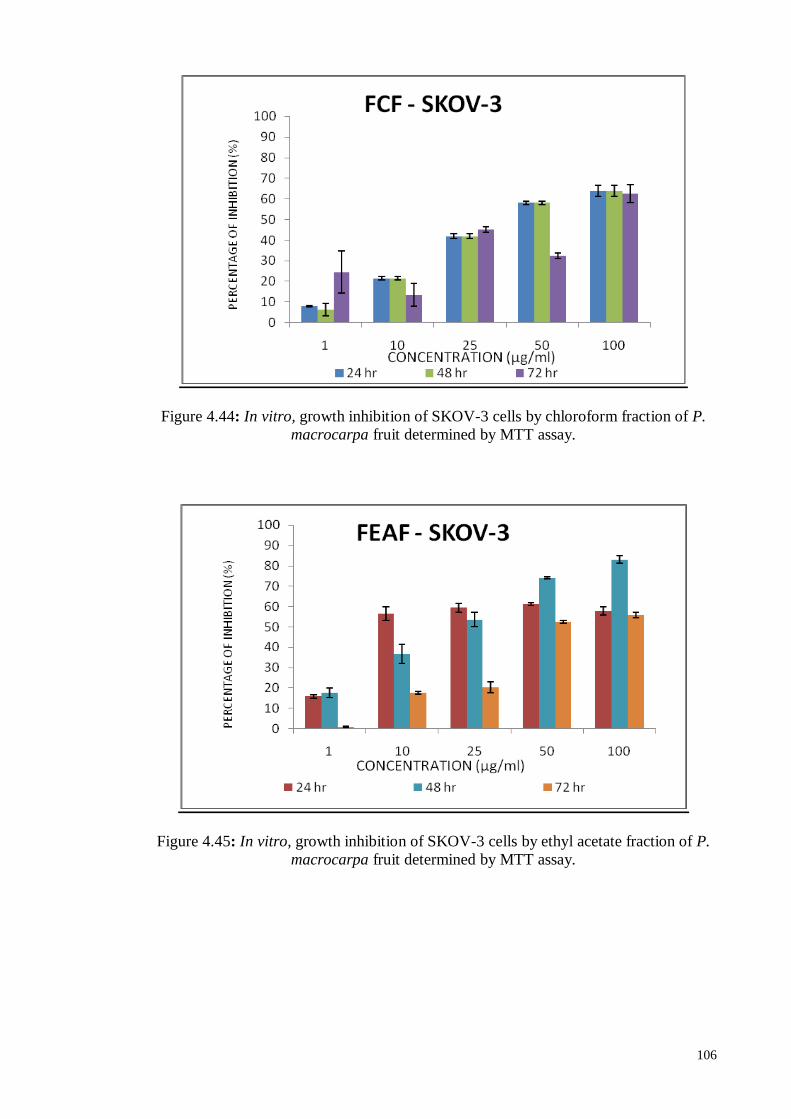
106
Figure 4.44: In vitro, growth inhibition of SKOV-3 cells by chloroform fraction of P.
macrocarpa fruit determined by MTT assay.
Figure 4.45: In vitro, growth inhibition of SKOV-3 cells by ethyl acetate fraction of P.
macrocarpa fruit determined by MTT assay.
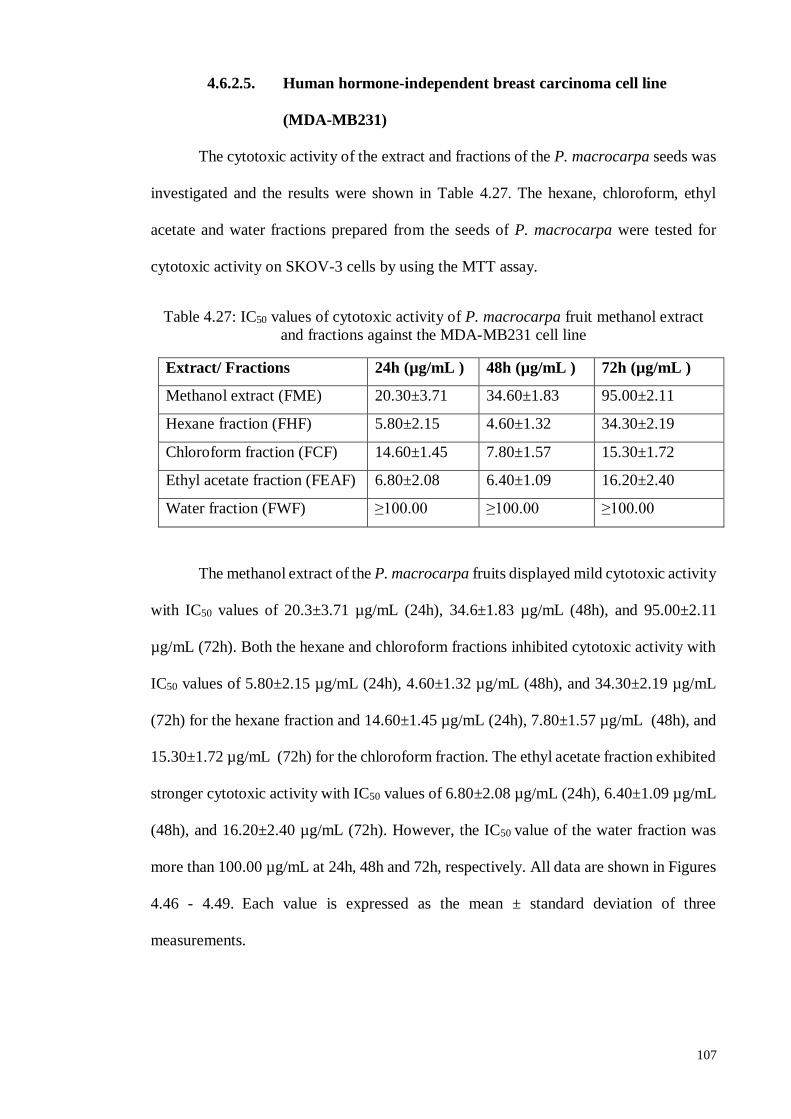
107
4.6.2.5. Human hormone-independent breast carcinoma cell line
(MDA-MB231)
The cytotoxic activity of the extract and fractions of the P. macrocarpa seeds was
investigated and the results were shown in Table 4.27. The hexane, chloroform, ethyl
acetate and water fractions prepared from the seeds of P. macrocarpa were tested for
cytotoxic activity on SKOV-3 cells by using the MTT assay.
Table 4.27: IC50 values of cytotoxic activity of P. macrocarpa fruit methanol extract
and fractions against the MDA-MB231 cell line
Extract/ Fractions 24h (µg/mL ) 48h (µg/mL ) 72h (µg/mL )
Methanol extract (FME) 20.30±3.71 34.60±1.83 95.00±2.11
Hexane fraction (FHF) 5.80±2.15 4.60±1.32 34.30±2.19
Chloroform fraction (FCF) 14.60±1.45 7.80±1.57 15.30±1.72
Ethyl acetate fraction (FEAF) 6.80±2.08 6.40±1.09 16.20±2.40
Water fraction (FWF) ≥100.00 ≥100.00 ≥100.00
The methanol extract of the P. macrocarpa fruits displayed mild cytotoxic activity
with IC50 values of 20.3±3.71 µg/mL (24h), 34.6±1.83 µg/mL (48h), and 95.00±2.11
µg/mL (72h). Both the hexane and chloroform fractions inhibited cytotoxic activity with
IC50 values of 5.80±2.15 µg/mL (24h), 4.60±1.32 µg/mL (48h), and 34.30±2.19 µg/mL
(72h) for the hexane fraction and 14.60±1.45 µg/mL (24h), 7.80±1.57 µg/mL (48h), and
15.30±1.72 µg/mL (72h) for the chloroform fraction. The ethyl acetate fraction exhibited
stronger cytotoxic activity with IC50 values of 6.80±2.08 µg/mL (24h), 6.40±1.09 µg/mL
(48h), and 16.20±2.40 µg/mL (72h). However, the IC50 value of the water fraction was
more than 100.00 µg/mL at 24h, 48h and 72h, respectively. All data are shown in Figures
4.46 - 4.49. Each value is expressed as the mean ± standard deviation of three
measurements.
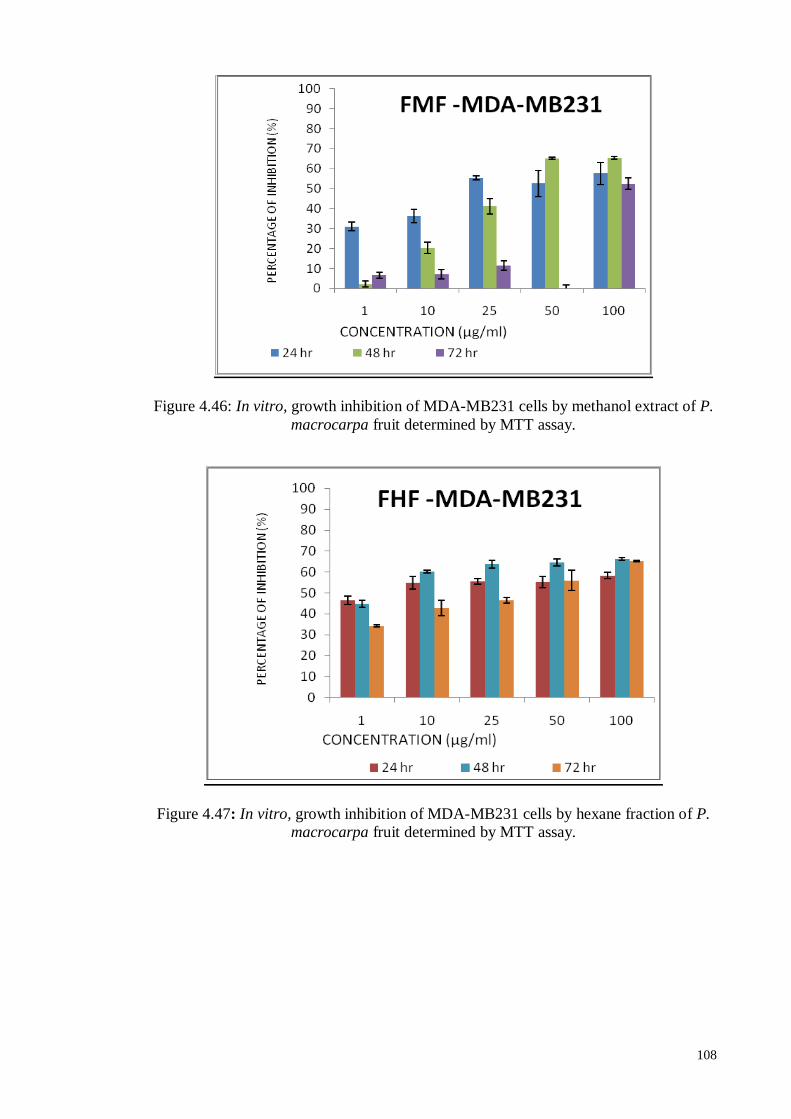
108
Figure 4.46: In vitro, growth inhibition of MDA-MB231 cells by methanol extract of P.
macrocarpa fruit determined by MTT assay.
Figure 4.47: In vitro, growth inhibition of MDA-MB231 cells by hexane fraction of P.
macrocarpa fruit determined by MTT assay.
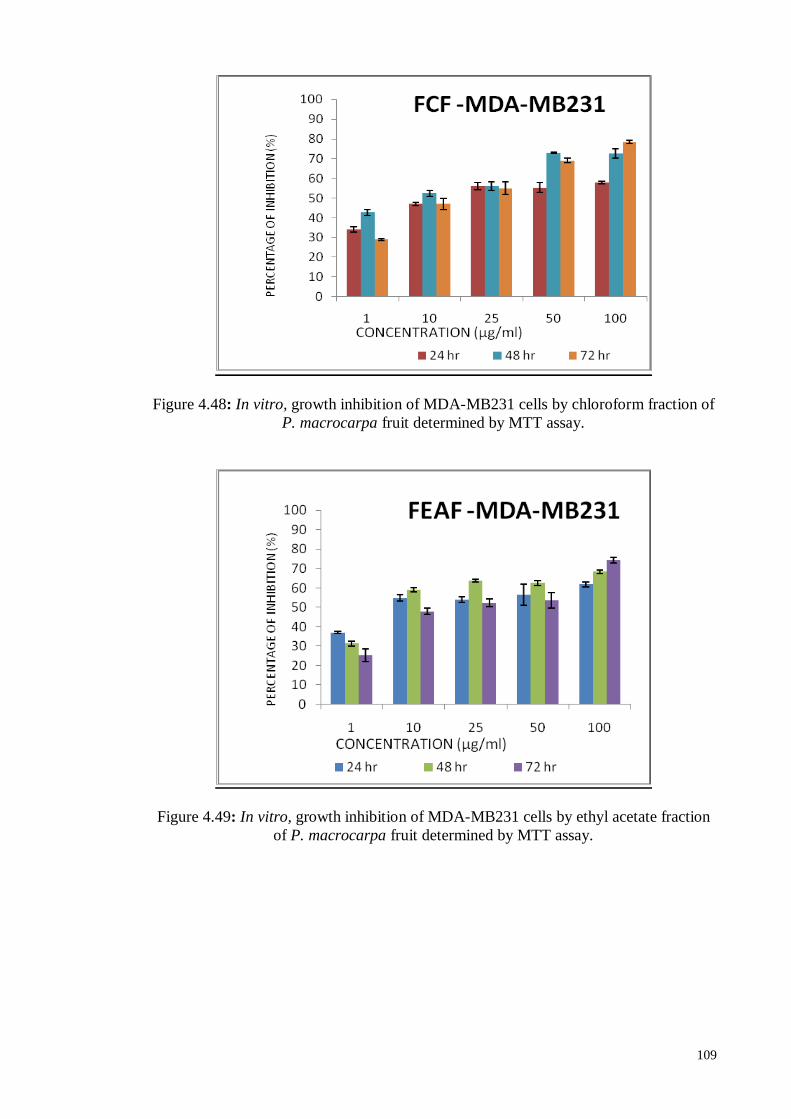
109
Figure 4.48: In vitro, growth inhibition of MDA-MB231 cells by chloroform fraction of
P. macrocarpa fruit determined by MTT assay.
Figure 4.49: In vitro, growth inhibition of MDA-MB231 cells by ethyl acetate fraction
of P. macrocarpa fruit determined by MTT assay.
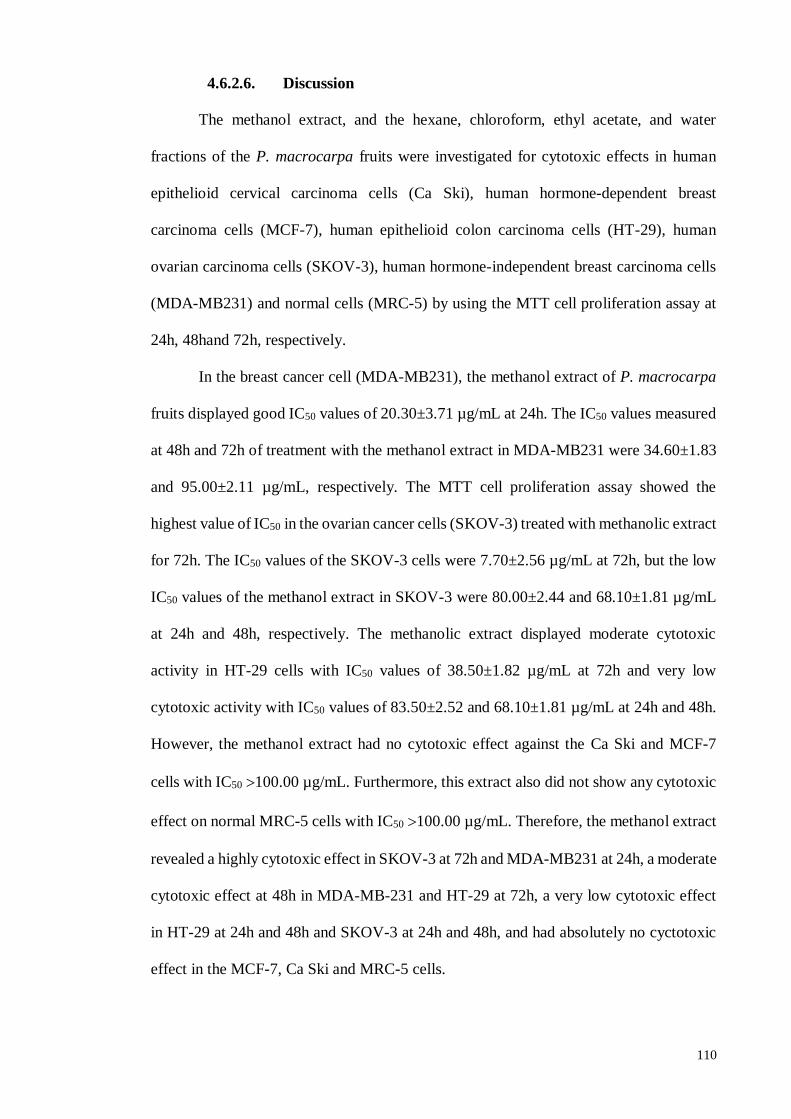
110
4.6.2.6. Discussion
The methanol extract, and the hexane, chloroform, ethyl acetate, and water
fractions of the P. macrocarpa fruits were investigated for cytotoxic effects in human
epithelioid cervical carcinoma cells (Ca Ski), human hormone-dependent breast
carcinoma cells (MCF-7), human epithelioid colon carcinoma cells (HT-29), human
ovarian carcinoma cells (SKOV-3), human hormone-independent breast carcinoma cells
(MDA-MB231) and normal cells (MRC-5) by using the MTT cell proliferation assay at
24h, 48hand 72h, respectively.
In the breast cancer cell (MDA-MB231), the methanol extract of P. macrocarpa
fruits displayed good IC50 values of 20.30±3.71 µg/mL at 24h. The IC50 values measured
at 48h and 72h of treatment with the methanol extract in MDA-MB231 were 34.60±1.83
and 95.00±2.11 µg/mL, respectively. The MTT cell proliferation assay showed the
highest value of IC50 in the ovarian cancer cells (SKOV-3) treated with methanolic extract
for 72h. The IC50 values of the SKOV-3 cells were 7.70±2.56 µg/mL at 72h, but the low
IC50 values of the methanol extract in SKOV-3 were 80.00±2.44 and 68.10±1.81 µg/mL
at 24h and 48h, respectively. The methanolic extract displayed moderate cytotoxic
activity in HT-29 cells with IC50 values of 38.50±1.82 µg/mL at 72h and very low
cytotoxic activity with IC50 values of 83.50±2.52 and 68.10±1.81 µg/mL at 24h and 48h.
However, the methanol extract had no cytotoxic effect against the Ca Ski and MCF-7
cells with IC50 100.00 µg/mL. Furthermore, this extract also did not show any cytotoxic
effect on normal MRC-5 cells with IC50 100.00 µg/mL. Therefore, the methanol extract
revealed a highly cytotoxic effect in SKOV-3 at 72h and MDA-MB231 at 24h, a moderate
cytotoxic effect at 48h in MDA-MB-231 and HT-29 at 72h, a very low cytotoxic effect
in HT-29 at 24h and 48h and SKOV-3 at 24h and 48h, and had absolutely no cyctotoxic
effect in the MCF-7, Ca Ski and MRC-5 cells.
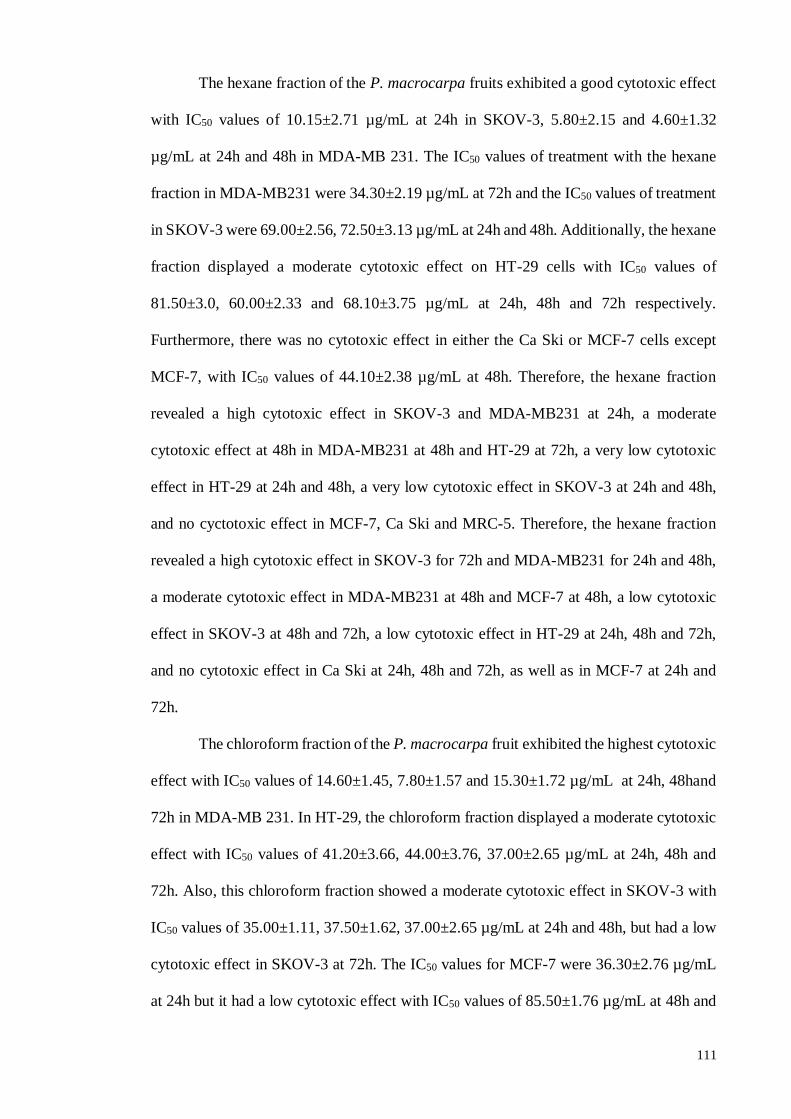
111
The hexane fraction of the P. macrocarpa fruits exhibited a good cytotoxic effect
with IC50 values of 10.15±2.71 µg/mL at 24h in SKOV-3, 5.80±2.15 and 4.60±1.32
µg/mL at 24h and 48h in MDA-MB 231. The IC50 values of treatment with the hexane
fraction in MDA-MB231 were 34.30±2.19 µg/mL at 72h and the IC50 values of treatment
in SKOV-3 were 69.00±2.56, 72.50±3.13 µg/mL at 24h and 48h. Additionally, the hexane
fraction displayed a moderate cytotoxic effect on HT-29 cells with IC50 values of
81.50±3.0, 60.00±2.33 and 68.10±3.75 µg/mL at 24h, 48h and 72h respectively.
Furthermore, there was no cytotoxic effect in either the Ca Ski or MCF-7 cells except
MCF-7, with IC50 values of 44.10±2.38 µg/mL at 48h. Therefore, the hexane fraction
revealed a high cytotoxic effect in SKOV-3 and MDA-MB231 at 24h, a moderate
cytotoxic effect at 48h in MDA-MB231 at 48h and HT-29 at 72h, a very low cytotoxic
effect in HT-29 at 24h and 48h, a very low cytotoxic effect in SKOV-3 at 24h and 48h,
and no cyctotoxic effect in MCF-7, Ca Ski and MRC-5. Therefore, the hexane fraction
revealed a high cytotoxic effect in SKOV-3 for 72h and MDA-MB231 for 24h and 48h,
a moderate cytotoxic effect in MDA-MB231 at 48h and MCF-7 at 48h, a low cytotoxic
effect in SKOV-3 at 48h and 72h, a low cytotoxic effect in HT-29 at 24h, 48h and 72h,
and no cytotoxic effect in Ca Ski at 24h, 48h and 72h, as well as in MCF-7 at 24h and
72h.
The chloroform fraction of the P. macrocarpa fruit exhibited the highest cytotoxic
effect with IC50 values of 14.60±1.45, 7.80±1.57 and 15.30±1.72 µg/mL at 24h, 48hand
72h in MDA-MB 231. In HT-29, the chloroform fraction displayed a moderate cytotoxic
effect with IC50 values of 41.20±3.66, 44.00±3.76, 37.00±2.65 µg/mL at 24h, 48h and
72h. Also, this chloroform fraction showed a moderate cytotoxic effect in SKOV-3 with
IC50 values of 35.00±1.11, 37.50±1.62, 37.00±2.65 µg/mL at 24h and 48h, but had a low
cytotoxic effect in SKOV-3 at 72h. The IC50 values for MCF-7 were 36.30±2.76 µg/mL
at 24h but it had a low cytotoxic effect with IC50 values of 85.50±1.76 µg/mL at 48h and
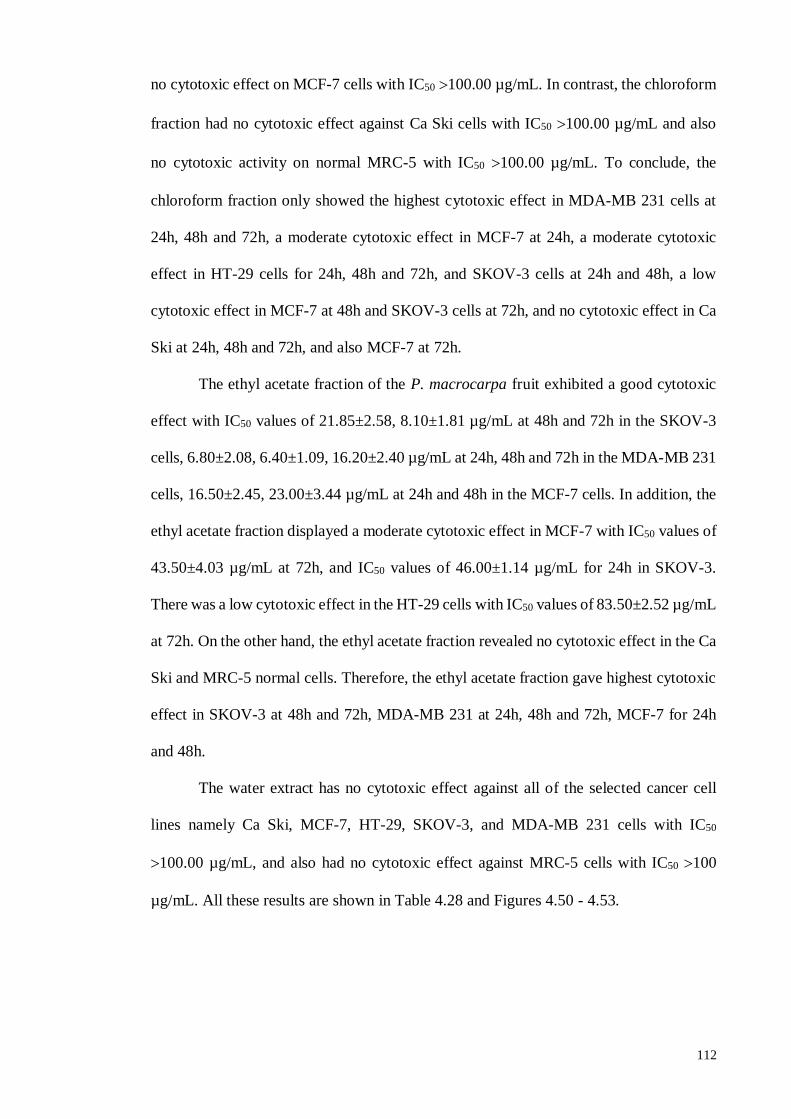
112
no cytotoxic effect on MCF-7 cells with IC50 100.00 µg/mL. In contrast, the chloroform
fraction had no cytotoxic effect against Ca Ski cells with IC50 100.00 µg/mL and also
no cytotoxic activity on normal MRC-5 with IC50 100.00 µg/mL. To conclude, the
chloroform fraction only showed the highest cytotoxic effect in MDA-MB 231 cells at
24h, 48h and 72h, a moderate cytotoxic effect in MCF-7 at 24h, a moderate cytotoxic
effect in HT-29 cells for 24h, 48h and 72h, and SKOV-3 cells at 24h and 48h, a low
cytotoxic effect in MCF-7 at 48h and SKOV-3 cells at 72h, and no cytotoxic effect in Ca
Ski at 24h, 48h and 72h, and also MCF-7 at 72h.
The ethyl acetate fraction of the P. macrocarpa fruit exhibited a good cytotoxic
effect with IC50 values of 21.85±2.58, 8.10±1.81 µg/mL at 48h and 72h in the SKOV-3
cells, 6.80±2.08, 6.40±1.09, 16.20±2.40 µg/mL at 24h, 48h and 72h in the MDA-MB 231
cells, 16.50±2.45, 23.00±3.44 µg/mL at 24h and 48h in the MCF-7 cells. In addition, the
ethyl acetate fraction displayed a moderate cytotoxic effect in MCF-7 with IC50 values of
43.50±4.03 µg/mL at 72h, and IC50 values of 46.00±1.14 µg/mL for 24h in SKOV-3.
There was a low cytotoxic effect in the HT-29 cells with IC50 values of 83.50±2.52 µg/mL
at 72h. On the other hand, the ethyl acetate fraction revealed no cytotoxic effect in the Ca
Ski and MRC-5 normal cells. Therefore, the ethyl acetate fraction gave highest cytotoxic
effect in SKOV-3 at 48h and 72h, MDA-MB 231 at 24h, 48h and 72h, MCF-7 for 24h
and 48h.
The water extract has no cytotoxic effect against all of the selected cancer cell
lines namely Ca Ski, MCF-7, HT-29, SKOV-3, and MDA-MB 231 cells with IC50
100.00 µg/mL, and also had no cytotoxic effect against MRC-5 cells with IC50 100
µg/mL. All these results are shown in Table 4.28 and Figures 4.50 - 4.53.
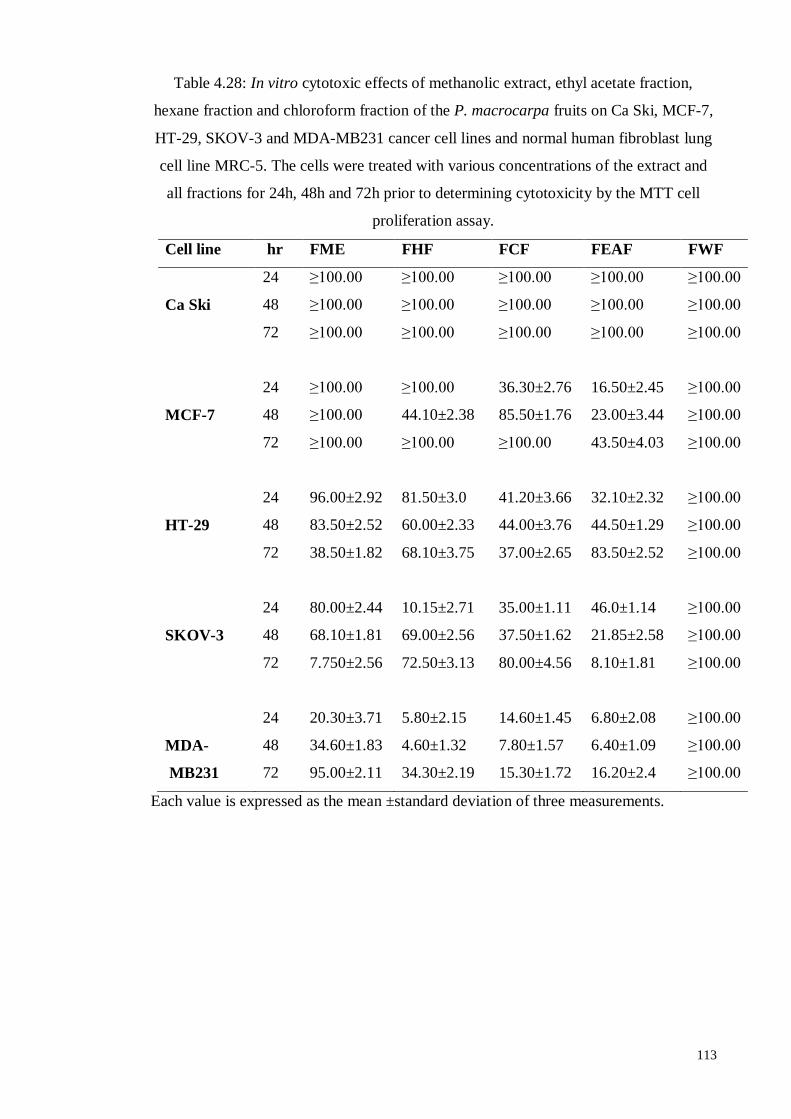
113
Table 4.28: In vitro cytotoxic effects of methanolic extract, ethyl acetate fraction,
hexane fraction and chloroform fraction of the P. macrocarpa fruits on Ca Ski, MCF-7,
HT-29, SKOV-3 and MDA-MB231 cancer cell lines and normal human fibroblast lung
cell line MRC-5. The cells were treated with various concentrations of the extract and
all fractions for 24h, 48h and 72h prior to determining cytotoxicity by the MTT cell
proliferation assay.
Cell line hr FME FHF FCF FEAF FWF
24 ≥100.00 ≥100.00 ≥100.00 ≥100.00 ≥100.00
Ca Ski 48 ≥100.00 ≥100.00 ≥100.00 ≥100.00 ≥100.00
72 ≥100.00 ≥100.00 ≥100.00 ≥100.00 ≥100.00
24 ≥100.00 ≥100.00 36.30±2.76 16.50±2.45 ≥100.00
MCF-7 48 ≥100.00 44.10±2.38 85.50±1.76 23.00±3.44 ≥100.00
72 ≥100.00 ≥100.00 ≥100.00 43.50±4.03 ≥100.00
24 96.00±2.92 81.50±3.0 41.20±3.66 32.10±2.32 ≥100.00
HT-29 48 83.50±2.52 60.00±2.33 44.00±3.76 44.50±1.29 ≥100.00
72 38.50±1.82 68.10±3.75 37.00±2.65 83.50±2.52 ≥100.00
24 80.00±2.44 10.15±2.71 35.00±1.11 46.0±1.14 ≥100.00
SKOV-3 48 68.10±1.81 69.00±2.56 37.50±1.62 21.85±2.58 ≥100.00
72 7.750±2.56 72.50±3.13 80.00±4.56 8.10±1.81 ≥100.00
24 20.30±3.71 5.80±2.15 14.60±1.45 6.80±2.08 ≥100.00
MDA- 48 34.60±1.83 4.60±1.32 7.80±1.57 6.40±1.09 ≥100.00
MB231 72 95.00±2.11 34.30±2.19 15.30±1.72 16.20±2.4 ≥100.00
Each value is expressed as the mean ±standard deviation of three measurements.
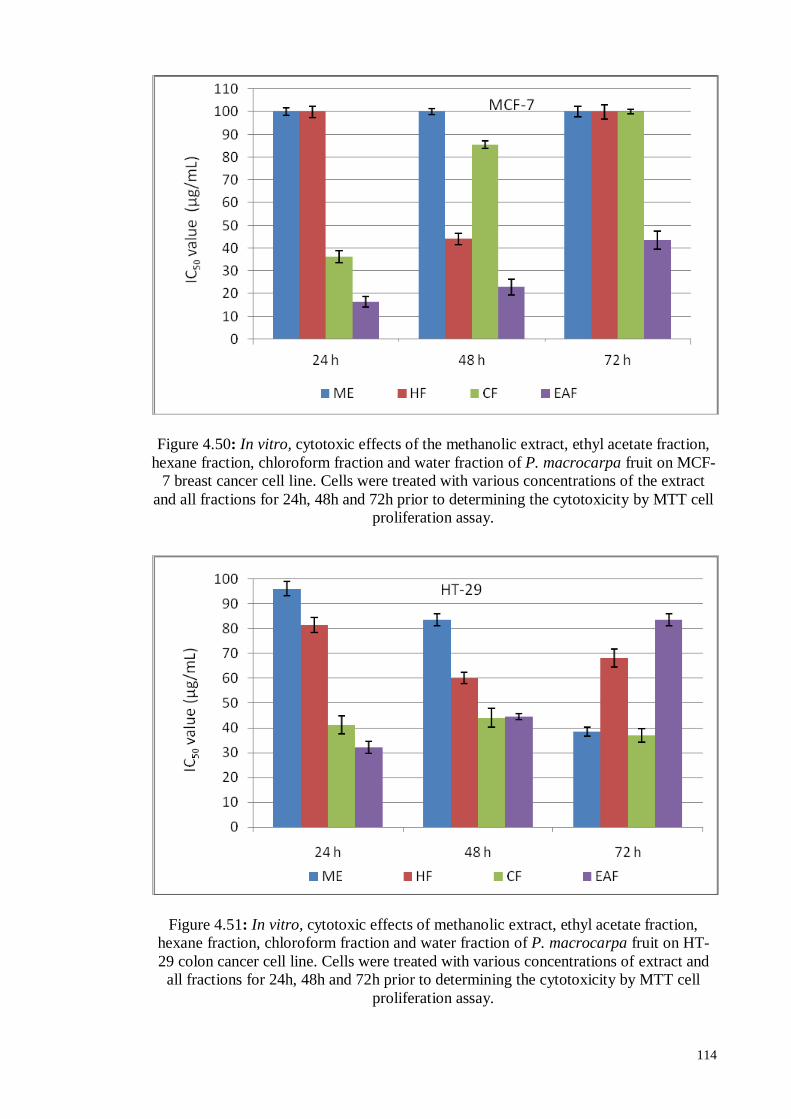
114
Figure 4.50: In vitro, cytotoxic effects of the methanolic extract, ethyl acetate fraction,
hexane fraction, chloroform fraction and water fraction of P. macrocarpa fruit on MCF-
7 breast cancer cell line. Cells were treated with various concentrations of the extract
and all fractions for 24h, 48h and 72h prior to determining the cytotoxicity by MTT cell
proliferation assay.
Figure 4.51: In vitro, cytotoxic effects of methanolic extract, ethyl acetate fraction,
hexane fraction, chloroform fraction and water fraction of P. macrocarpa fruit on HT-
29 colon cancer cell line. Cells were treated with various concentrations of extract and
all fractions for 24h, 48h and 72h prior to determining the cytotoxicity by MTT cell
proliferation assay.
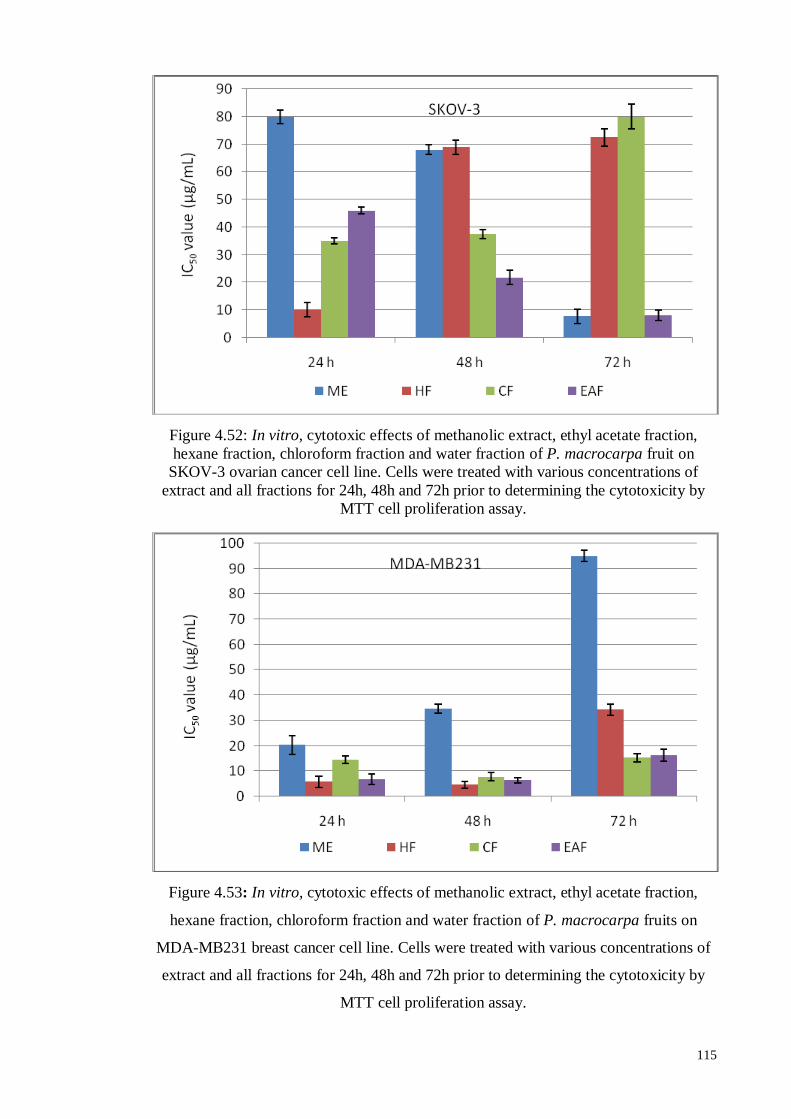
115
Figure 4.52: In vitro, cytotoxic effects of methanolic extract, ethyl acetate fraction,
hexane fraction, chloroform fraction and water fraction of P. macrocarpa fruit on
SKOV-3 ovarian cancer cell line. Cells were treated with various concentrations of
extract and all fractions for 24h, 48h and 72h prior to determining the cytotoxicity by
MTT cell proliferation assay.
Figure 4.53: In vitro, cytotoxic effects of methanolic extract, ethyl acetate fraction,
hexane fraction, chloroform fraction and water fraction of P. macrocarpa fruits on
MDA-MB231 breast cancer cell line. Cells were treated with various concentrations of
extract and all fractions for 24h, 48h and 72h prior to determining the cytotoxicity by
MTT cell proliferation assay.
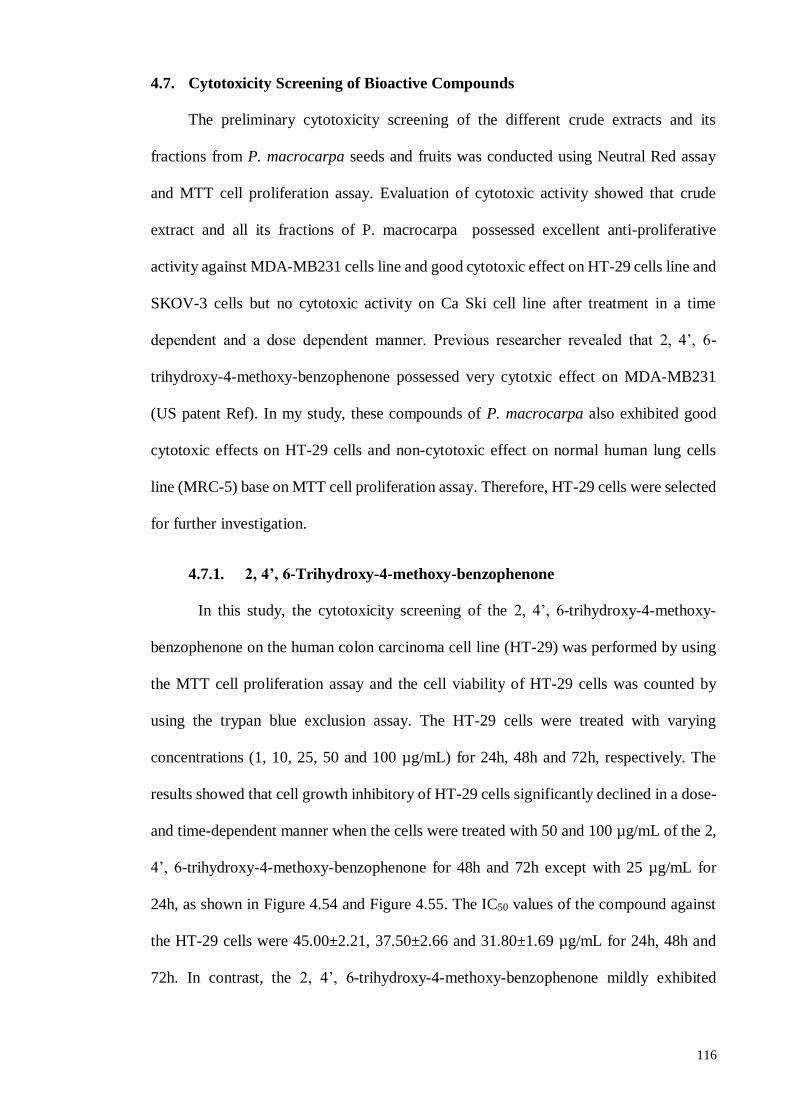
116
4.7. Cytotoxicity Screening of Bioactive Compounds
The preliminary cytotoxicity screening of the different crude extracts and its
fractions from P. macrocarpa seeds and fruits was conducted using Neutral Red assay
and MTT cell proliferation assay. Evaluation of cytotoxic activity showed that crude
extract and all its fractions of P. macrocarpa possessed excellent anti-proliferative
activity against MDA-MB231 cells line and good cytotoxic effect on HT-29 cells line and
SKOV-3 cells but no cytotoxic activity on Ca Ski cell line after treatment in a time
dependent and a dose dependent manner. Previous researcher revealed that 2, 4’, 6-
trihydroxy-4-methoxy-benzophenone possessed very cytotxic effect on MDA-MB231
(US patent Ref). In my study, these compounds of P. macrocarpa also exhibited good
cytotoxic effects on HT-29 cells and non-cytotoxic effect on normal human lung cells
line (MRC-5) base on MTT cell proliferation assay. Therefore, HT-29 cells were selected
for further investigation.
4.7.1. 2, 4’, 6-Trihydroxy-4-methoxy-benzophenone
In this study, the cytotoxicity screening of the 2, 4’, 6-trihydroxy-4-methoxy-
benzophenone on the human colon carcinoma cell line (HT-29) was performed by using
the MTT cell proliferation assay and the cell viability of HT-29 cells was counted by
using the trypan blue exclusion assay. The HT-29 cells were treated with varying
concentrations (1, 10, 25, 50 and 100 µg/mL) for 24h, 48h and 72h, respectively. The
results showed that cell growth inhibitory of HT-29 cells significantly declined in a dose-
and time-dependent manner when the cells were treated with 50 and 100 µg/mL of the 2,
4’, 6-trihydroxy-4-methoxy-benzophenone for 48h and 72h except with 25 µg/mL for
24h, as shown in Figure 4.54 and Figure 4.55. The IC50 values of the compound against
the HT-29 cells were 45.00±2.21, 37.50±2.66 and 31.80±1.69 µg/mL for 24h, 48h and
72h. In contrast, the 2, 4’, 6-trihydroxy-4-methoxy-benzophenone mildly exhibited
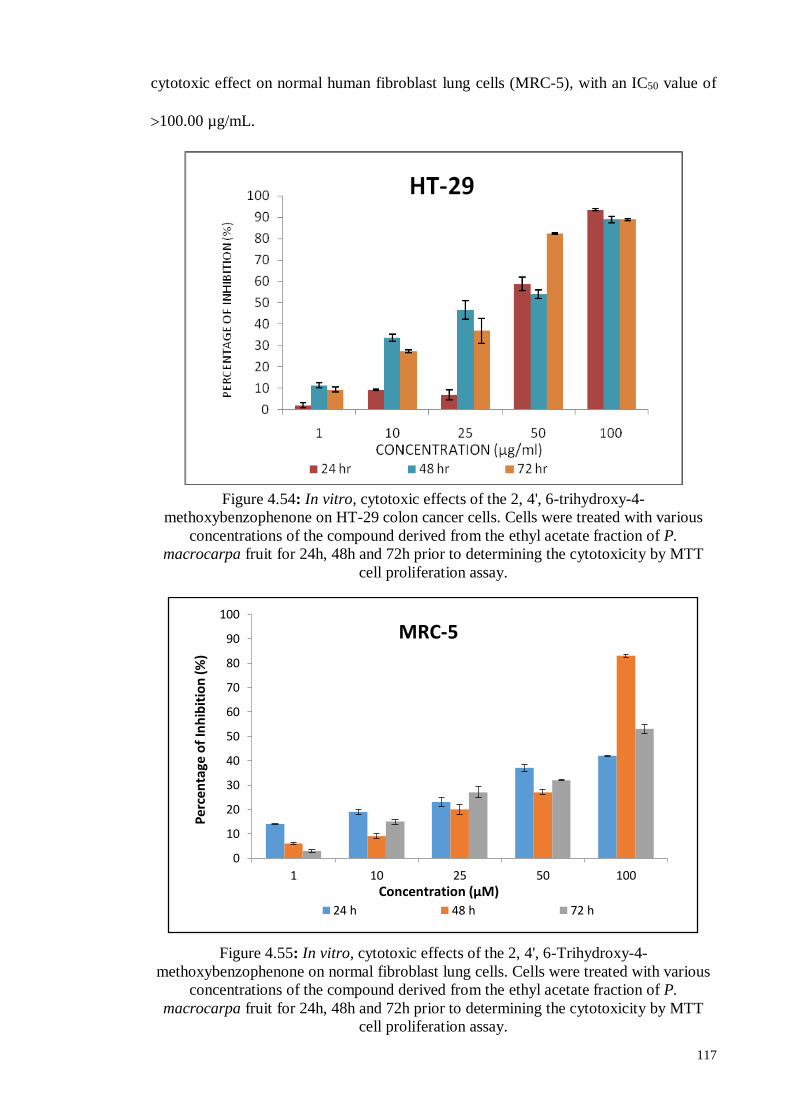
117
cytotoxic effect on normal human fibroblast lung cells (MRC-5), with an IC50 value of
100.00 µg/mL.
Figure 4.54: In vitro, cytotoxic effects of the 2, 4', 6-trihydroxy-4-
methoxybenzophenone on HT-29 colon cancer cells. Cells were treated with various
concentrations of the compound derived from the ethyl acetate fraction of P.
macrocarpa fruit for 24h, 48h and 72h prior to determining the cytotoxicity by MTT
cell proliferation assay.
Figure 4.55: In vitro, cytotoxic effects of the 2, 4', 6-Trihydroxy-4-
methoxybenzophenone on normal fibroblast lung cells. Cells were treated with various
concentrations of the compound derived from the ethyl acetate fraction of P.
macrocarpa fruit for 24h, 48h and 72h prior to determining the cytotoxicity by MTT
cell proliferation assay.
0
10
20
30
40
50
60
70
80
90
100
1 10 25 50 100
24 h 48 h 72 h
MRC-5
Per
cen
tage
of
Inh
ibit
ion
(%)
Concentration (µM)
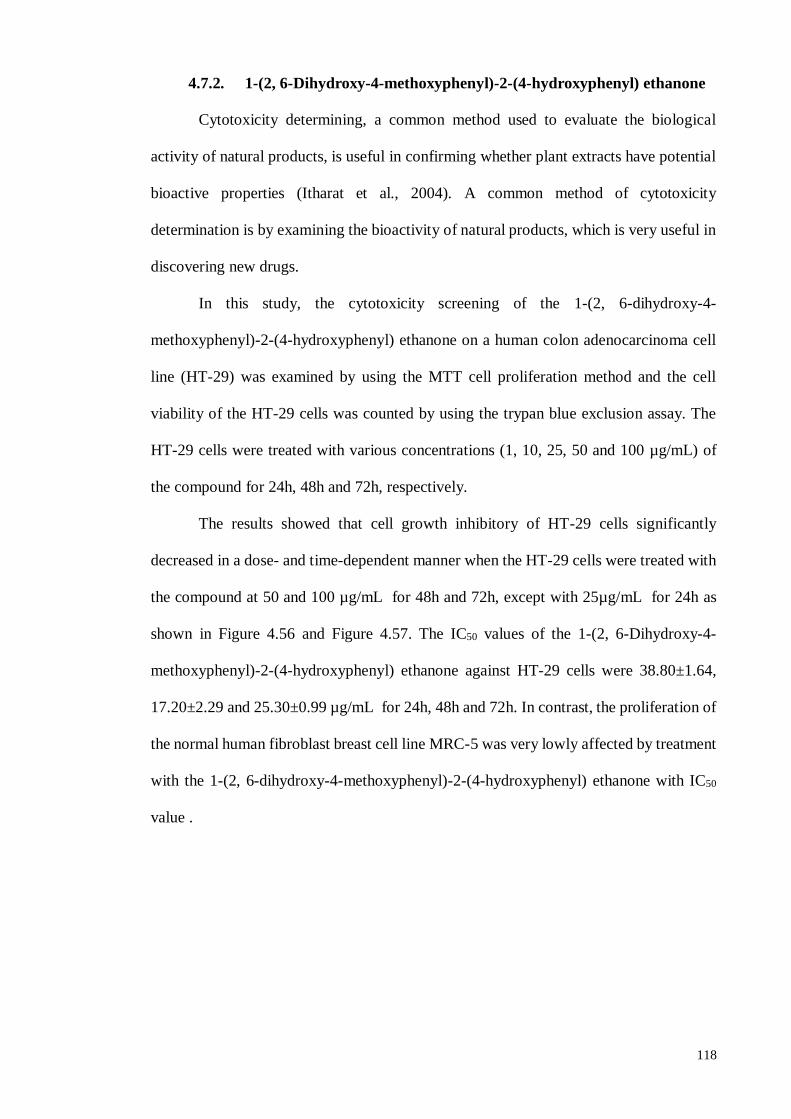
118
4.7.2. 1-(2, 6-Dihydroxy-4-methoxyphenyl)-2-(4-hydroxyphenyl) ethanone
Cytotoxicity determining, a common method used to evaluate the biological
activity of natural products, is useful in confirming whether plant extracts have potential
bioactive properties (Itharat et al., 2004). A common method of cytotoxicity
determination is by examining the bioactivity of natural products, which is very useful in
discovering new drugs.
In this study, the cytotoxicity screening of the 1-(2, 6-dihydroxy-4-
methoxyphenyl)-2-(4-hydroxyphenyl) ethanone on a human colon adenocarcinoma cell
line (HT-29) was examined by using the MTT cell proliferation method and the cell
viability of the HT-29 cells was counted by using the trypan blue exclusion assay. The
HT-29 cells were treated with various concentrations (1, 10, 25, 50 and 100 µg/mL) of
the compound for 24h, 48h and 72h, respectively.
The results showed that cell growth inhibitory of HT-29 cells significantly
decreased in a dose- and time-dependent manner when the HT-29 cells were treated with
the compound at 50 and 100 µg/mL for 48h and 72h, except with 25µg/mL for 24h as
shown in Figure 4.56 and Figure 4.57. The IC50 values of the 1-(2, 6-Dihydroxy-4-
methoxyphenyl)-2-(4-hydroxyphenyl) ethanone against HT-29 cells were 38.80±1.64,
17.20±2.29 and 25.30±0.99 µg/mL for 24h, 48h and 72h. In contrast, the proliferation of
the normal human fibroblast breast cell line MRC-5 was very lowly affected by treatment
with the 1-(2, 6-dihydroxy-4-methoxyphenyl)-2-(4-hydroxyphenyl) ethanone with IC50
value .
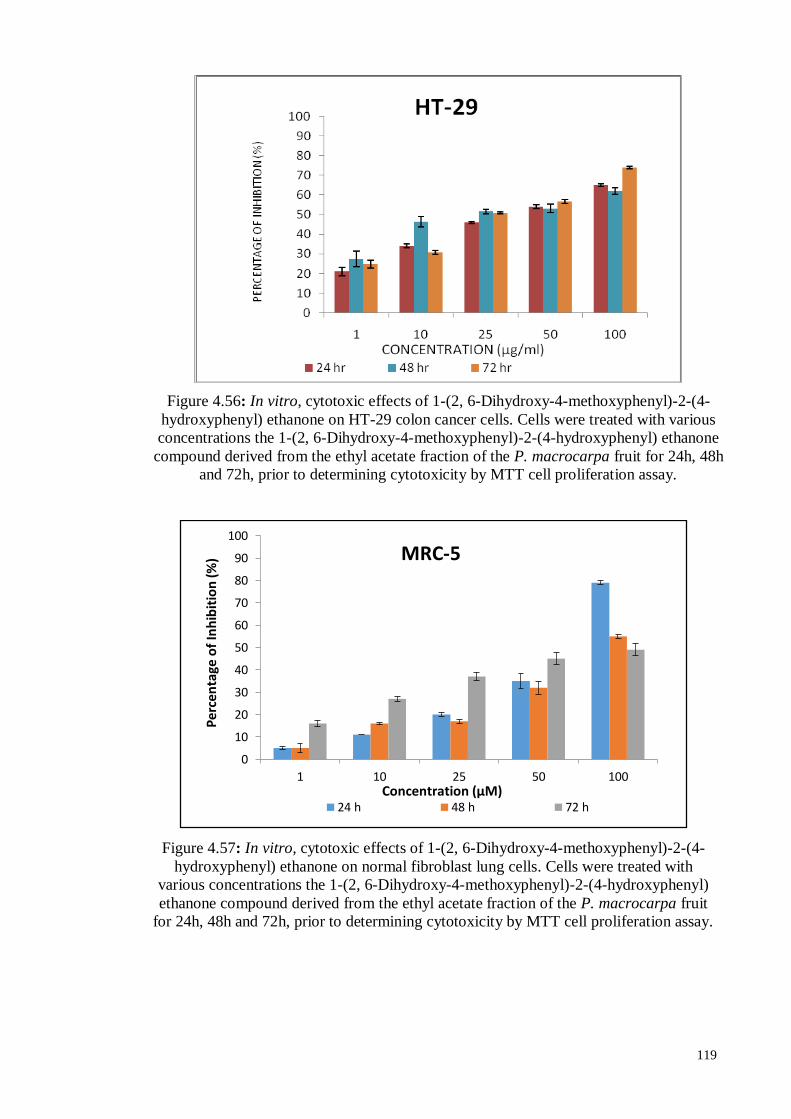
119
Figure 4.57: In vitro, cytotoxic effects of 1-(2, 6-Dihydroxy-4-methoxyphenyl)-2-(4-
hydroxyphenyl) ethanone on normal fibroblast lung cells. Cells were treated with
various concentrations the 1-(2, 6-Dihydroxy-4-methoxyphenyl)-2-(4-hydroxyphenyl)
ethanone compound derived from the ethyl acetate fraction of the P. macrocarpa fruit
for 24h, 48h and 72h, prior to determining cytotoxicity by MTT cell proliferation assay.
0
10
20
30
40
50
60
70
80
90
100
1 10 25 50 100
24 h 48 h 72 h
MRC-5
Per
cen
tage
of
Inh
ibit
ion
(%)
Concentration (µM)
Figure 4.56: In vitro, cytotoxic effects of 1-(2, 6-Dihydroxy-4-methoxyphenyl)-2-(4-
hydroxyphenyl) ethanone on HT-29 colon cancer cells. Cells were treated with various
concentrations the 1-(2, 6-Dihydroxy-4-methoxyphenyl)-2-(4-hydroxyphenyl) ethanone
compound derived from the ethyl acetate fraction of the P. macrocarpa fruit for 24h, 48h
and 72h, prior to determining cytotoxicity by MTT cell proliferation assay.
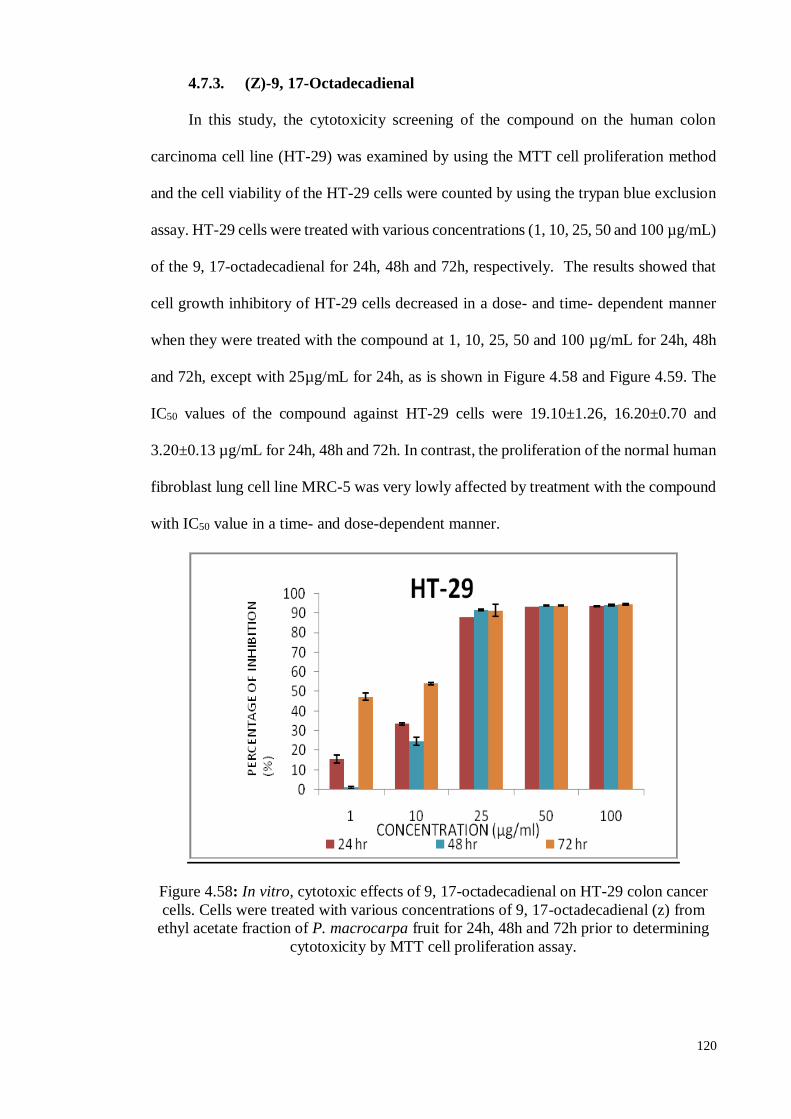
120
4.7.3. (Z)-9, 17-Octadecadienal
In this study, the cytotoxicity screening of the compound on the human colon
carcinoma cell line (HT-29) was examined by using the MTT cell proliferation method
and the cell viability of the HT-29 cells were counted by using the trypan blue exclusion
assay. HT-29 cells were treated with various concentrations (1, 10, 25, 50 and 100 µg/mL)
of the 9, 17-octadecadienal for 24h, 48h and 72h, respectively. The results showed that
cell growth inhibitory of HT-29 cells decreased in a dose- and time- dependent manner
when they were treated with the compound at 1, 10, 25, 50 and 100 µg/mL for 24h, 48h
and 72h, except with 25µg/mL for 24h, as is shown in Figure 4.58 and Figure 4.59. The
IC50 values of the compound against HT-29 cells were 19.10±1.26, 16.20±0.70 and
3.20±0.13 µg/mL for 24h, 48h and 72h. In contrast, the proliferation of the normal human
fibroblast lung cell line MRC-5 was very lowly affected by treatment with the compound
with IC50 value in a time- and dose-dependent manner.
Figure 4.58: In vitro, cytotoxic effects of 9, 17-octadecadienal on HT-29 colon cancer
cells. Cells were treated with various concentrations of 9, 17-octadecadienal (z) from
ethyl acetate fraction of P. macrocarpa fruit for 24h, 48h and 72h prior to determining
cytotoxicity by MTT cell proliferation assay.
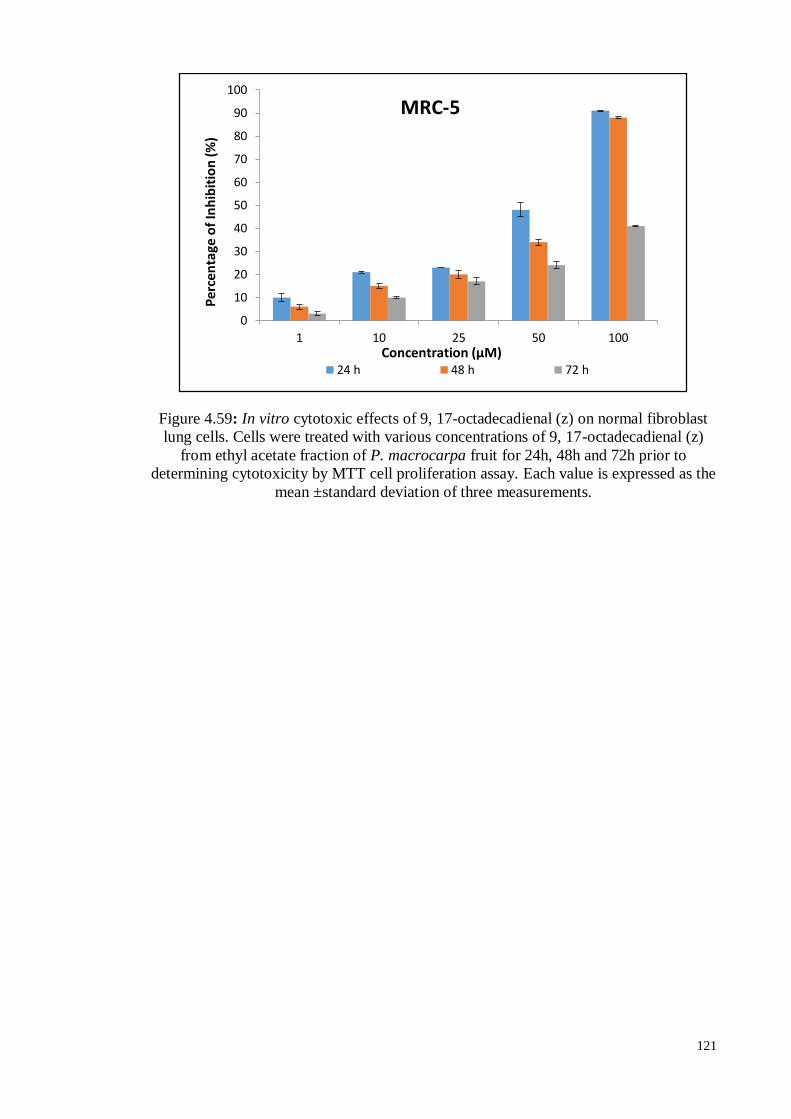
121
Figure 4.59: In vitro cytotoxic effects of 9, 17-octadecadienal (z) on normal fibroblast
lung cells. Cells were treated with various concentrations of 9, 17-octadecadienal (z)
from ethyl acetate fraction of P. macrocarpa fruit for 24h, 48h and 72h prior to
determining cytotoxicity by MTT cell proliferation assay. Each value is expressed as the
mean ±standard deviation of three measurements.
0
10
20
30
40
50
60
70
80
90
100
1 10 25 50 100
24 h 48 h 72 h
MRC-5
Per
cen
tage
of
Inh
ibit
ion
(%
)
Concentration (µM)
122
PART C: APOPTOSIS STUDIES ON ISOLATED BIOACTIVE COMPOUNDS
FROM PHALERIA MACROCARPA (SCHEFF.) BOERL
4.8. Apoptosis Studies
Apoptosis plays an important role in cancer prevention, and therapeutics can
manipulate apoptosis to promote tumour cell death. Apoptosis is a form of programmed
cell death, used by multi-cellular organisms to rid themselves of extraneous cells (Potten,
2004).
4.8.1. 2, 4', 6-Trihydroxy-4-methoxybenzophenone
4.8.1.1. Inverted and Phase contrast microscopic examination
HT-29 cells were treated with 2, 4', 6-trihydroxy-4-methoxybenzophenone at IC50
value of concentrations (30.00 µg/mL) with the isolated bioactive compound for an
incubation period of 24h, 48h and 72h respectively. After these incubation periods, the
morphological changes in the cells were examined by using inverted and phase-contrast
microscopy. The cells displayed changes that were known to be associated with apoptosis
including membrane blebbings, cell shrinkage, chromatin condensation, apoptotic nuclei
and DNA fragmentation, based on the respective time increase. As such, the compound
has been shown to trigger morphological changes in the apoptotic bodies in HT-29 cells
(Figure 4.60 and 4.61).
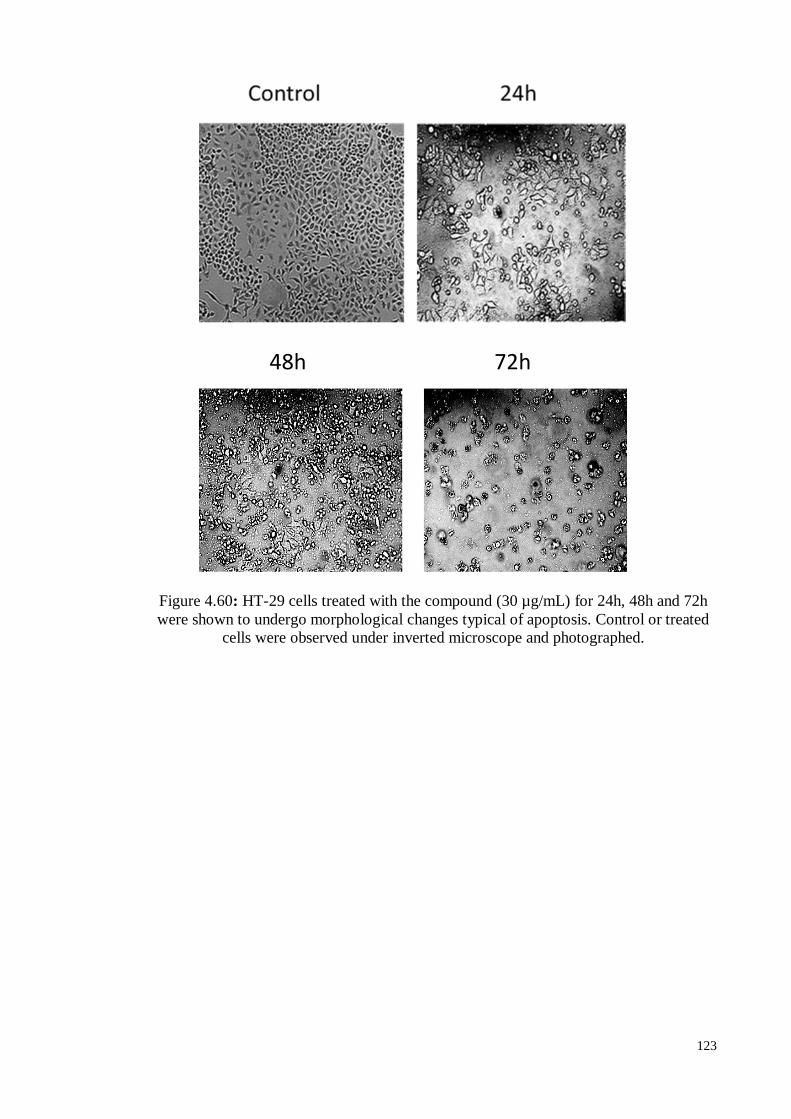
123
Figure 4.60: HT-29 cells treated with the compound (30 µg/mL) for 24h, 48h and 72h
were shown to undergo morphological changes typical of apoptosis. Control or treated
cells were observed under inverted microscope and photographed.
48h 72h
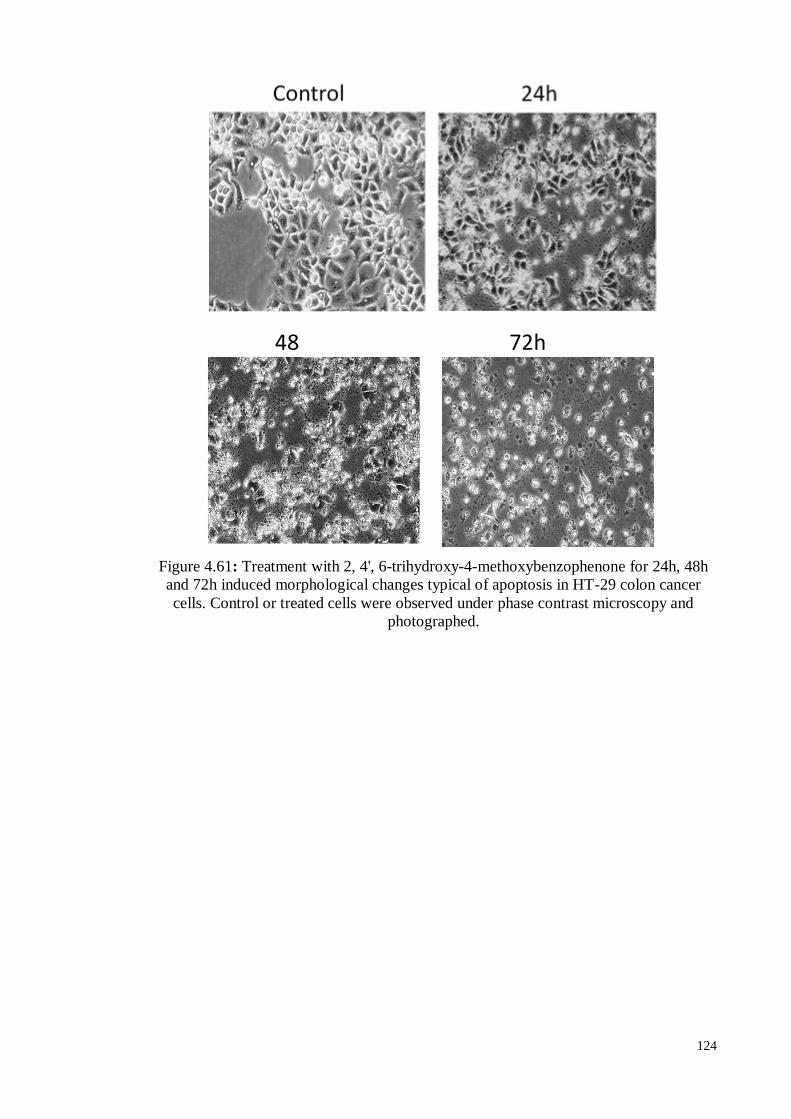
124
Figure 4.61: Treatment with 2, 4', 6-trihydroxy-4-methoxybenzophenone for 24h, 48h
and 72h induced morphological changes typical of apoptosis in HT-29 colon cancer
cells. Control or treated cells were observed under phase contrast microscopy and
photographed.
48h
72h
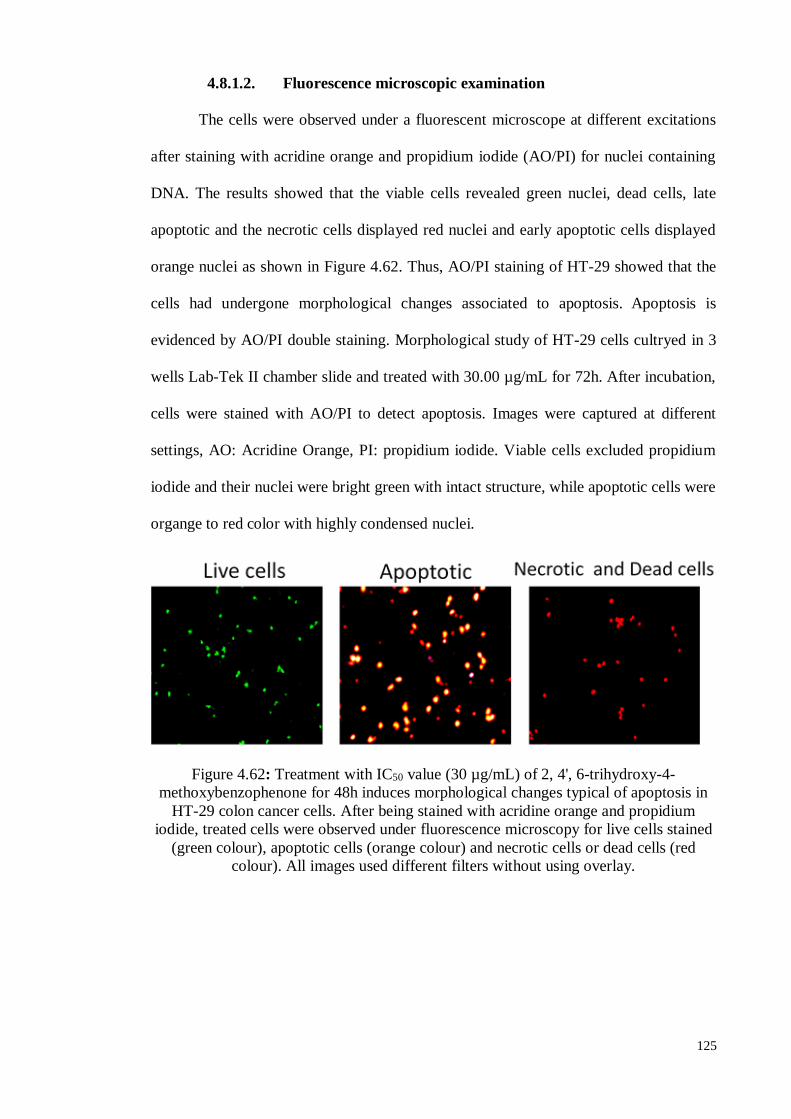
125
4.8.1.2. Fluorescence microscopic examination
The cells were observed under a fluorescent microscope at different excitations
after staining with acridine orange and propidium iodide (AO/PI) for nuclei containing
DNA. The results showed that the viable cells revealed green nuclei, dead cells, late
apoptotic and the necrotic cells displayed red nuclei and early apoptotic cells displayed
orange nuclei as shown in Figure 4.62. Thus, AO/PI staining of HT-29 showed that the
cells had undergone morphological changes associated to apoptosis. Apoptosis is
evidenced by AO/PI double staining. Morphological study of HT-29 cells cultryed in 3
wells Lab-Tek II chamber slide and treated with 30.00 µg/mL for 72h. After incubation,
cells were stained with AO/PI to detect apoptosis. Images were captured at different
settings, AO: Acridine Orange, PI: propidium iodide. Viable cells excluded propidium
iodide and their nuclei were bright green with intact structure, while apoptotic cells were
organge to red color with highly condensed nuclei.
Figure 4.62: Treatment with IC50 value (30 µg/mL) of 2, 4', 6-trihydroxy-4-
methoxybenzophenone for 48h induces morphological changes typical of apoptosis in
HT-29 colon cancer cells. After being stained with acridine orange and propidium
iodide, treated cells were observed under fluorescence microscopy for live cells stained
(green colour), apoptotic cells (orange colour) and necrotic cells or dead cells (red
colour). All images used different filters without using overlay.
126
4.8.1.3. Annexin V staining assay
The most often exploited important molecular mechanism used in the treatment
of anti-cancer drugs is programmed cell death or apoptosis as seen in chemotherapeutic
approach (Call et al., 2008; Dickson & Schwartz, 2009). In this report, staining with
Annexin V-FITC and propidium iodide (PI) will allow the distinction between intact cells
or early apoptosis cells from late apoptosis or dead cells (Cheng et al., 2004). Single
staining was also used with only Annexin V-FITC or PI was used to distinguish between
live cells and dead cells. However, single staining could not distinguish between early
apoptotic cells, late apoptotic cells or dead cells, or necrotic and live cells.
Cells were treated with various concentrations (25 µg/mL, 50 µg/mL and 75
µg/mL) of the compound for 24h, 48h and 72h. They were then harvested with accutase
and phosphate buffer saline solution and centrifuged, after which they were stained with
Annexin V-FITC and propidium iodide and analysed in FACScalibur with CellQuest Pro
software. The number of early apoptotic cells, late apoptotic cells, live cells and necrotic
cells were counted in every 10,000 cells for each treatment (Yuan et al., 2012). All data
were expressed as the mean ± SD (standard deviation). The standard deviation was
calculated for the treated and untreated cells. The SPSS program (version 16.0) found a
significant difference between the treated and untreated cells (p <0.05).
During the flow cytometry analysis in Annexin V/PI double staining, late or
secondary necrotic apoptotic cells were visible in the upper right (UR) and early apoptotic
cells were visible in the lower right (LR) quadrants while primary necrotic cells were
visible in the upper left (UL) and live cells were visible in the lower left (LL) quadrants
respectively. In untreated HT-29 cells, 92.28% of the cells were viable, 1.85% was in
early apoptosis and 3.21% cells were in late apoptosis or secondary necrotic stage.
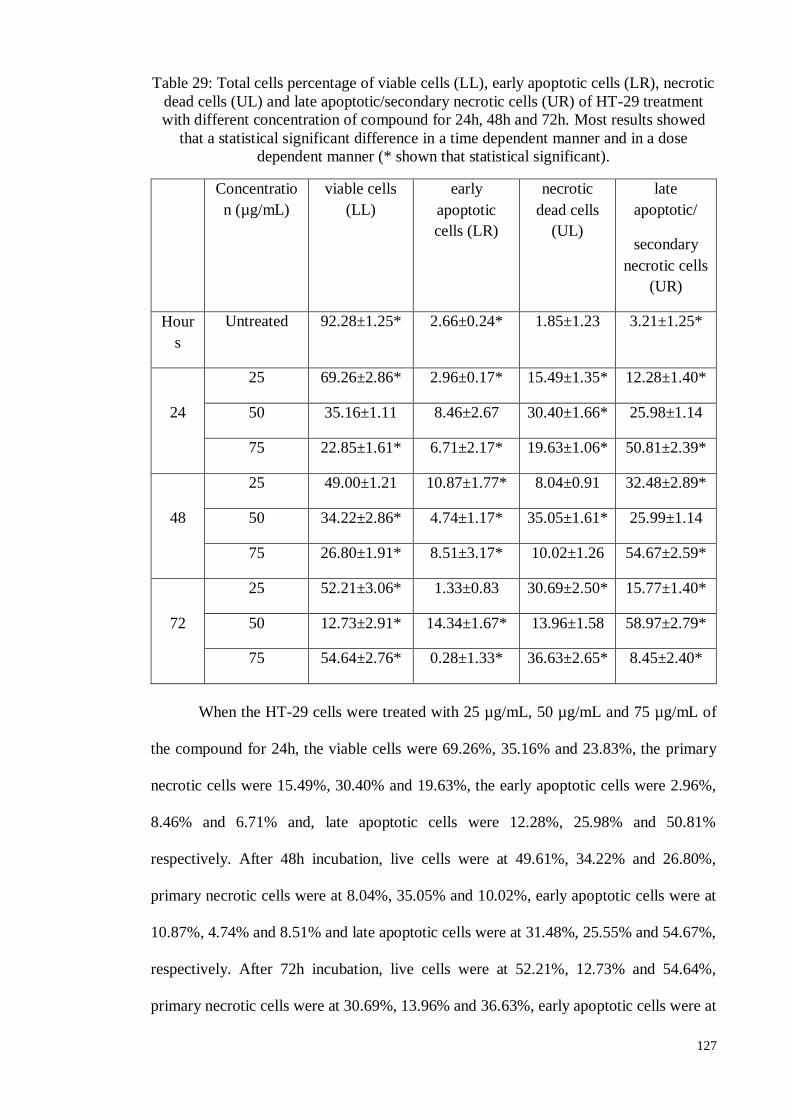
127
Table 29: Total cells percentage of viable cells (LL), early apoptotic cells (LR), necrotic
dead cells (UL) and late apoptotic/secondary necrotic cells (UR) of HT-29 treatment
with different concentration of compound for 24h, 48h and 72h. Most results showed
that a statistical significant difference in a time dependent manner and in a dose
dependent manner (* shown that statistical significant).
Concentratio
n (µg/mL)
viable cells
(LL)
early
apoptotic
cells (LR)
necrotic
dead cells
(UL)
late
apoptotic/
secondary
necrotic cells
(UR)
Hour
s
Untreated 92.28±1.25* 2.66±0.24* 1.85±1.23 3.21±1.25*
25 69.26±2.86* 2.96±0.17* 15.49±1.35* 12.28±1.40*
24 50 35.16±1.11 8.46±2.67 30.40±1.66* 25.98±1.14
75 22.85±1.61* 6.71±2.17* 19.63±1.06* 50.81±2.39*
25 49.00±1.21 10.87±1.77* 8.04±0.91 32.48±2.89*
48 50 34.22±2.86* 4.74±1.17* 35.05±1.61* 25.99±1.14
75 26.80±1.91* 8.51±3.17* 10.02±1.26 54.67±2.59*
25 52.21±3.06* 1.33±0.83 30.69±2.50* 15.77±1.40*
72 50 12.73±2.91* 14.34±1.67* 13.96±1.58 58.97±2.79*
75 54.64±2.76* 0.28±1.33* 36.63±2.65* 8.45±2.40*
When the HT-29 cells were treated with 25 µg/mL, 50 µg/mL and 75 µg/mL of
the compound for 24h, the viable cells were 69.26%, 35.16% and 23.83%, the primary
necrotic cells were 15.49%, 30.40% and 19.63%, the early apoptotic cells were 2.96%,
8.46% and 6.71% and, late apoptotic cells were 12.28%, 25.98% and 50.81%
respectively. After 48h incubation, live cells were at 49.61%, 34.22% and 26.80%,
primary necrotic cells were at 8.04%, 35.05% and 10.02%, early apoptotic cells were at
10.87%, 4.74% and 8.51% and late apoptotic cells were at 31.48%, 25.55% and 54.67%,
respectively. After 72h incubation, live cells were at 52.21%, 12.73% and 54.64%,
primary necrotic cells were at 30.69%, 13.96% and 36.63%, early apoptotic cells were at
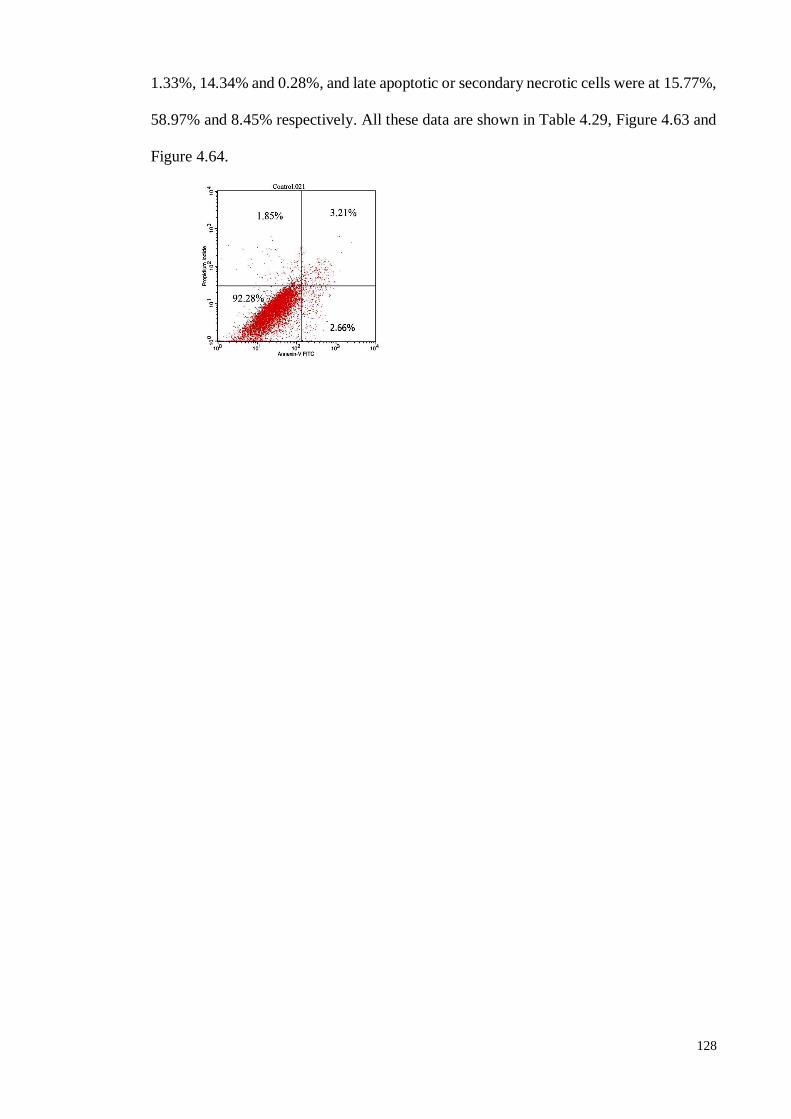
128
1.33%, 14.34% and 0.28%, and late apoptotic or secondary necrotic cells were at 15.77%,
58.97% and 8.45% respectively. All these data are shown in Table 4.29, Figure 4.63 and
Figure 4.64.
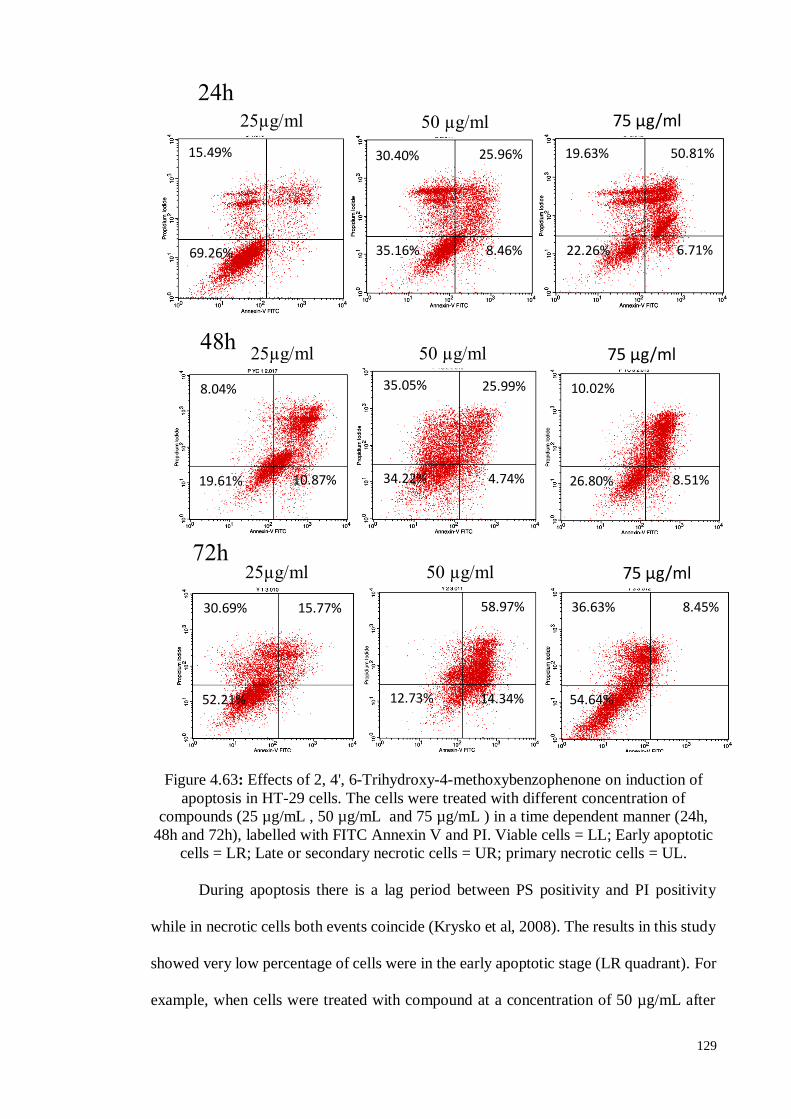
129
Figure 4.63: Effects of 2, 4', 6-Trihydroxy-4-methoxybenzophenone on induction of
apoptosis in HT-29 cells. The cells were treated with different concentration of
compounds (25 µg/mL , 50 µg/mL and 75 µg/mL ) in a time dependent manner (24h,
48h and 72h), labelled with FITC Annexin V and PI. Viable cells = LL; Early apoptotic
cells = LR; Late or secondary necrotic cells = UR; primary necrotic cells = UL.
During apoptosis there is a lag period between PS positivity and PI positivity
while in necrotic cells both events coincide (Krysko et al, 2008). The results in this study
showed very low percentage of cells were in the early apoptotic stage (LR quadrant). For
example, when cells were treated with compound at a concentration of 50 µg/mL after
25µg/ml
15.49%
69.26%
30.40%
8.46% 35.16%
25.96%
6.71%
50.81% 19.63%
22.26%
8.04%
19.61%
10.87%
35.05% 25.99%
34.22% 4.74%
10.02%
26.80% 8.51%
52.21%
15.77% 30.69%
14.34% 12.73%
58.97%
54.64%
8.45% 36.63%
24h
25µg/ml 50 µg/ml 75 µg/ml
48h
72h 25µg/ml
50 µg/ml
50 µg/ml 75 µg/ml
75 µg/ml
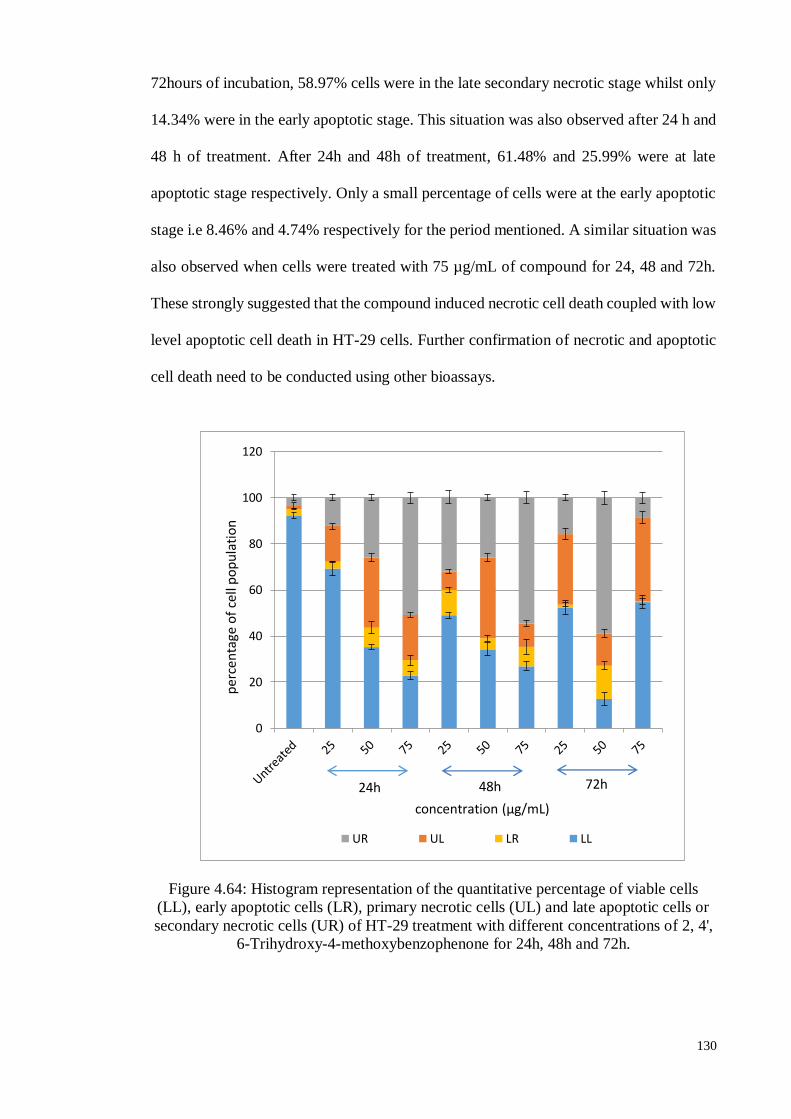
130
72hours of incubation, 58.97% cells were in the late secondary necrotic stage whilst only
14.34% were in the early apoptotic stage. This situation was also observed after 24 h and
48 h of treatment. After 24h and 48h of treatment, 61.48% and 25.99% were at late
apoptotic stage respectively. Only a small percentage of cells were at the early apoptotic
stage i.e 8.46% and 4.74% respectively for the period mentioned. A similar situation was
also observed when cells were treated with 75 µg/mL of compound for 24, 48 and 72h.
These strongly suggested that the compound induced necrotic cell death coupled with low
level apoptotic cell death in HT-29 cells. Further confirmation of necrotic and apoptotic
cell death need to be conducted using other bioassays.
Figure 4.64: Histogram representation of the quantitative percentage of viable cells
(LL), early apoptotic cells (LR), primary necrotic cells (UL) and late apoptotic cells or
secondary necrotic cells (UR) of HT-29 treatment with different concentrations of 2, 4',
6-Trihydroxy-4-methoxybenzophenone for 24h, 48h and 72h.
0
20
40
60
80
100
120
UR UL LR LL
per
cen
tage
of
cell
po
pu
lati
on
24h 72h 48h
concentration (µg/mL)
131
Therefore, the results indicate that apparent low levels of apoptosis on HT-
29 colon adenocarcinoma cells were induced by 2, 4', 6-trihydroxy-4-
methoxybenzophenone in a time- and dose-dependent manner.
4.8.1.4. Cell cycle analysis
One of the most important mechanisms in anti-cancer drug treatment is cell cycle
arrest, which is measured by DNA content levels. DNA (deoxyribonucleic acid) plays an
essential role in cell reproduction, cell life and cell death. It also carries genetic
information for all living organisms and consists of two sets of chromosomes (Call et al.,
2008; Dickson & Schwartz, 2009).When 2N DNA is present in the G0 and G1 phase of
each cell cycle, the G2 and M phase in the cell cycles are presented by 4N DNA which
has a double 2N number of chromosomes, while the S-phase synthesizes DNA replication
by using flow cytometry analysis.
The HT-29 cells were treated with 2, 4', 6-trihydroxy-4-methoxybenzophenone
for 24h, 48h and 72h. Treated and untreated cells were harvested with accutase and
phosphate buffer saline, centrifuged and stained with propidium iodide. The HT-29 cells
were then analysed by flow cytometry using CellQuest Pro software and their distribution
in different phases of the cell cycle is shown in Figure 4.65. The resulting data were
tabulated using the trial version of the ModFit L.V 4.0 software in order to represent a
percentage of each cell cycle phase (G0/G1, S and G2/M), as shown in Figure 4.66.
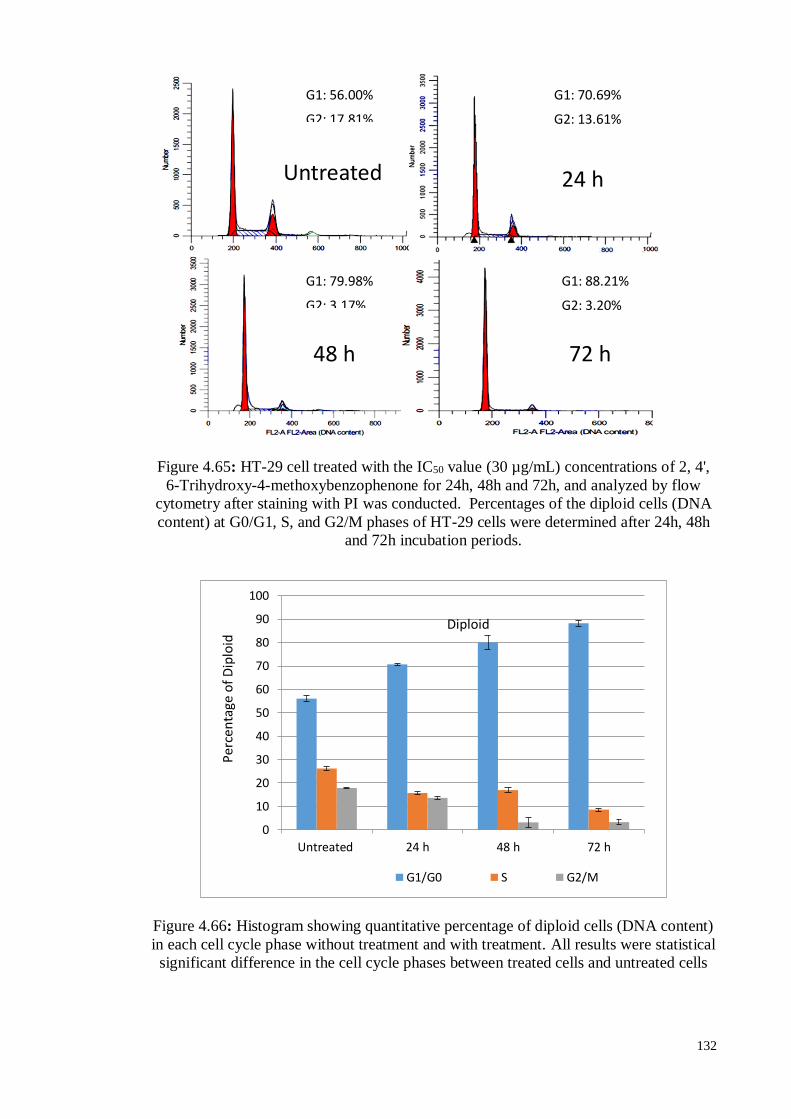
132
Figure 4.65: HT-29 cell treated with the IC50 value (30 µg/mL) concentrations of 2, 4',
6-Trihydroxy-4-methoxybenzophenone for 24h, 48h and 72h, and analyzed by flow
cytometry after staining with PI was conducted. Percentages of the diploid cells (DNA
content) at G0/G1, S, and G2/M phases of HT-29 cells were determined after 24h, 48h
and 72h incubation periods.
Figure 4.66: Histogram showing quantitative percentage of diploid cells (DNA content)
in each cell cycle phase without treatment and with treatment. All results were statistical
significant difference in the cell cycle phases between treated cells and untreated cells
0
10
20
30
40
50
60
70
80
90
100
Untreated 24 h 48 h 72 h
G1/G0 S G2/M
Diploid
Per
cen
tage
of
Dip
loid
G1: 56.00%
G2: 17.81%
G1: 70.69%
G2: 13.61%
G1: 79.98%
G2: 3.17%
G1: 88.21%
G2: 3.20%
Untreated 24 h
48 h 72 h
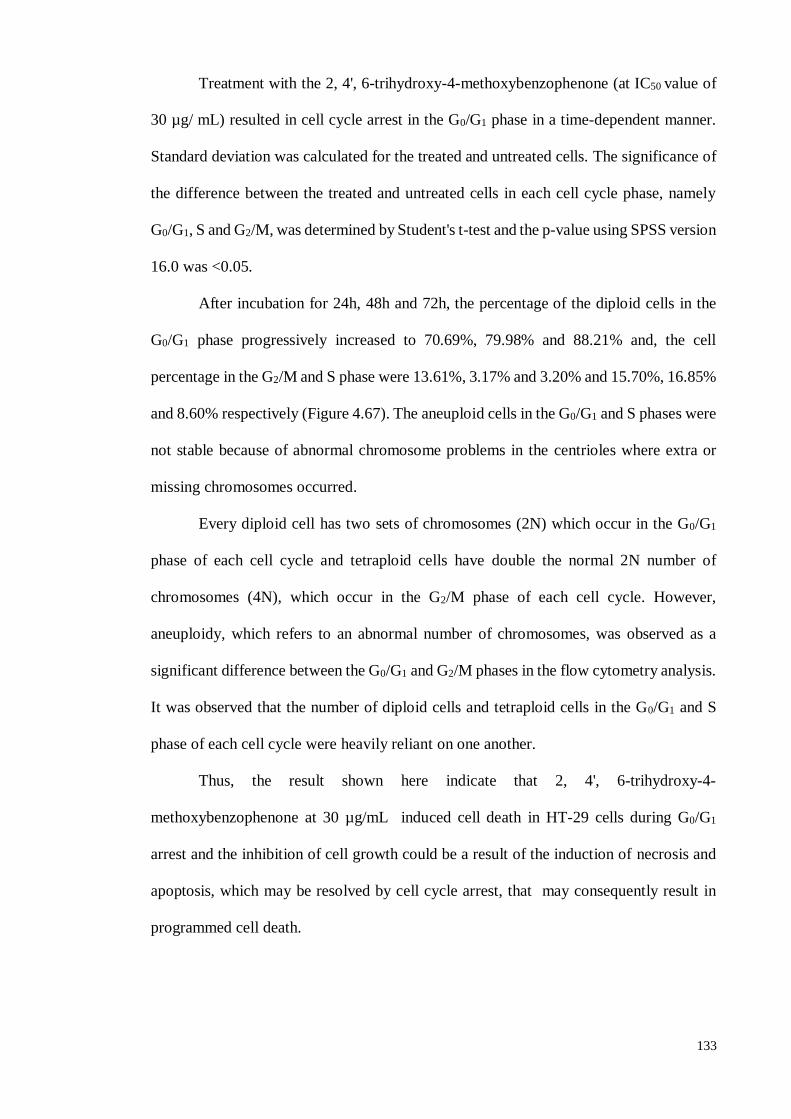
133
Treatment with the 2, 4', 6-trihydroxy-4-methoxybenzophenone (at IC50 value of
30 µg/ mL) resulted in cell cycle arrest in the G0/G1 phase in a time-dependent manner.
Standard deviation was calculated for the treated and untreated cells. The significance of
the difference between the treated and untreated cells in each cell cycle phase, namely
G0/G1, S and G2/M, was determined by Student's t-test and the p-value using SPSS version
16.0 was <0.05.
After incubation for 24h, 48h and 72h, the percentage of the diploid cells in the
G0/G1 phase progressively increased to 70.69%, 79.98% and 88.21% and, the cell
percentage in the G2/M and S phase were 13.61%, 3.17% and 3.20% and 15.70%, 16.85%
and 8.60% respectively (Figure 4.67). The aneuploid cells in the G0/G1 and S phases were
not stable because of abnormal chromosome problems in the centrioles where extra or
missing chromosomes occurred.
Every diploid cell has two sets of chromosomes (2N) which occur in the G0/G1
phase of each cell cycle and tetraploid cells have double the normal 2N number of
chromosomes (4N), which occur in the G2/M phase of each cell cycle. However,
aneuploidy, which refers to an abnormal number of chromosomes, was observed as a
significant difference between the G0/G1 and G2/M phases in the flow cytometry analysis.
It was observed that the number of diploid cells and tetraploid cells in the G0/G1 and S
phase of each cell cycle were heavily reliant on one another.
Thus, the result shown here indicate that 2, 4', 6-trihydroxy-4-
methoxybenzophenone at 30 µg/mL induced cell death in HT-29 cells during G0/G1
arrest and the inhibition of cell growth could be a result of the induction of necrosis and
apoptosis, which may be resolved by cell cycle arrest, that may consequently result in
programmed cell death.
134
4.8.2. 1-(2, 6-Dihydroxy-4-methoxyphenyl)-2-(4-hydroxyphenyl) ethanone
4.8.2.1. Inverted and phase contrast microscopic examination
Morphological changes in the HT-29 cell line that is treated with the 1-(2, 6-
dihydroxy-4-methoxyphenyl)-2-(4-hydroxyphenyl) ethanone were observed under an
inverted and phase contrast microscope (Leica, Germany). The cells indicated the highest
effects after treatment with DMHE for 48h. Microscopic observations revealed that more
than 50% of the cells showed membrane blebbing, ballooning, chromatin condensation,
and the formation of apoptotic bodies as shown in Figure 4.67 and Figure 4.68. Therefore,
we have proven that HT-29 cells that are treated with the compound displayed significant
morphological changes of apoptotic bodies during direct observation in inverted and
phase-contrast microscopic examinations.
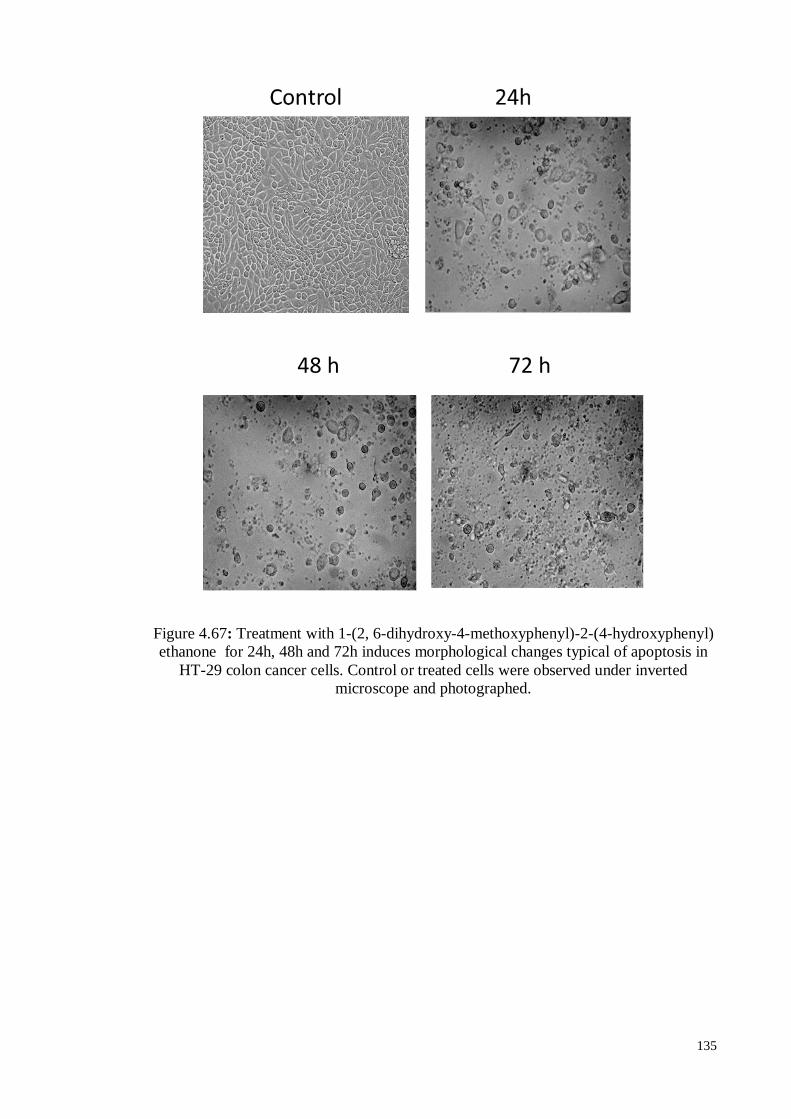
135
Figure 4.67: Treatment with 1-(2, 6-dihydroxy-4-methoxyphenyl)-2-(4-hydroxyphenyl)
ethanone for 24h, 48h and 72h induces morphological changes typical of apoptosis in
HT-29 colon cancer cells. Control or treated cells were observed under inverted
microscope and photographed.
48 h 72 h
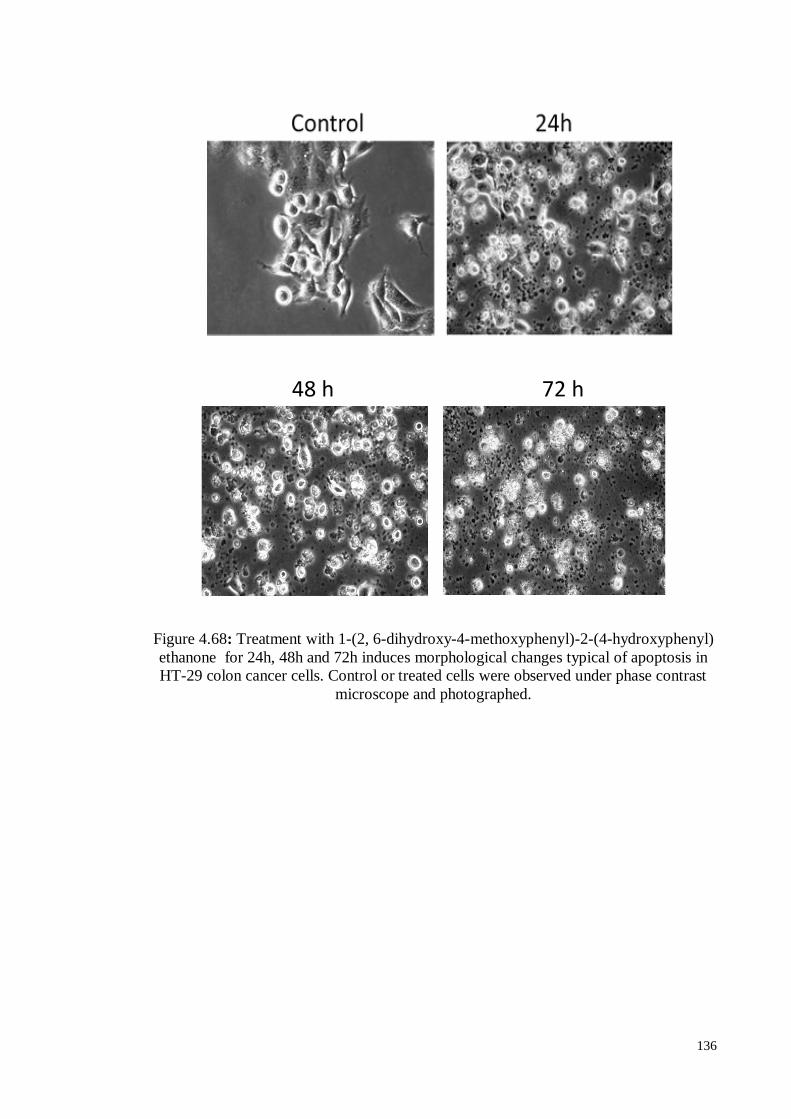
136
Figure 4.68: Treatment with 1-(2, 6-dihydroxy-4-methoxyphenyl)-2-(4-hydroxyphenyl)
ethanone for 24h, 48h and 72h induces morphological changes typical of apoptosis in
HT-29 colon cancer cells. Control or treated cells were observed under phase contrast
microscope and photographed.
48 h 72 h
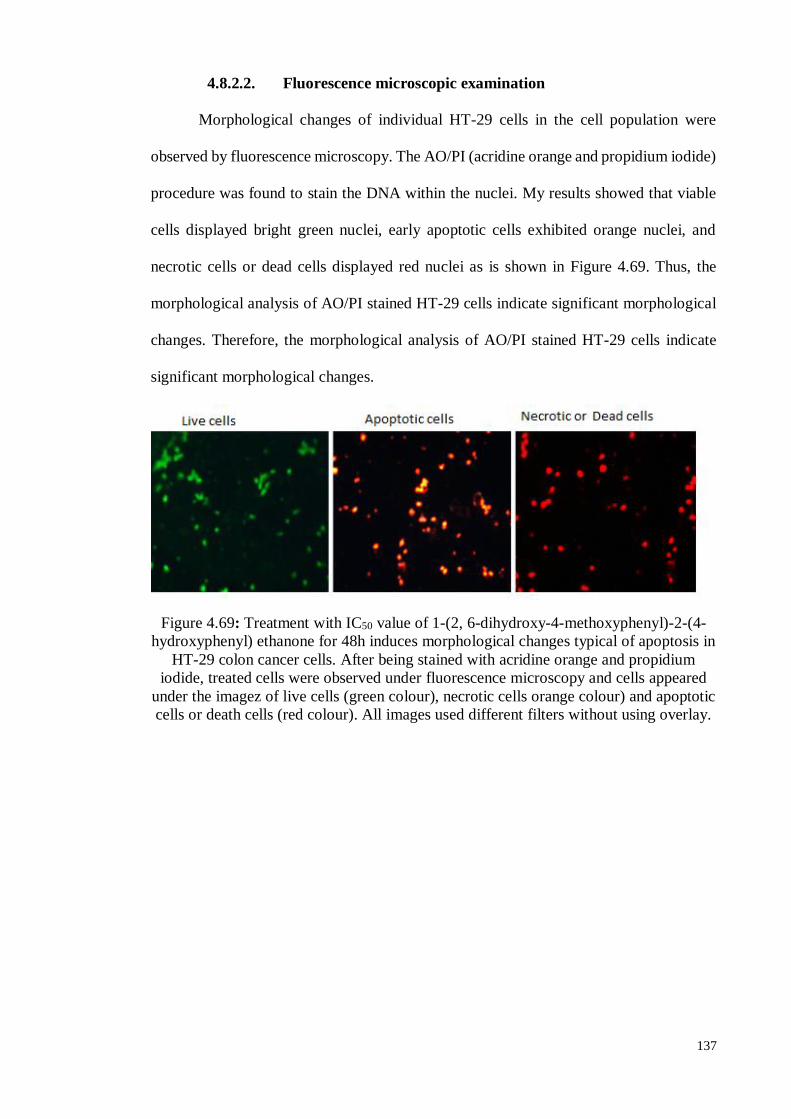
137
4.8.2.2. Fluorescence microscopic examination
Morphological changes of individual HT-29 cells in the cell population were
observed by fluorescence microscopy. The AO/PI (acridine orange and propidium iodide)
procedure was found to stain the DNA within the nuclei. My results showed that viable
cells displayed bright green nuclei, early apoptotic cells exhibited orange nuclei, and
necrotic cells or dead cells displayed red nuclei as is shown in Figure 4.69. Thus, the
morphological analysis of AO/PI stained HT-29 cells indicate significant morphological
changes. Therefore, the morphological analysis of AO/PI stained HT-29 cells indicate
significant morphological changes.
Figure 4.69: Treatment with IC50 value of 1-(2, 6-dihydroxy-4-methoxyphenyl)-2-(4-
hydroxyphenyl) ethanone for 48h induces morphological changes typical of apoptosis in
HT-29 colon cancer cells. After being stained with acridine orange and propidium
iodide, treated cells were observed under fluorescence microscopy and cells appeared
under the imagez of live cells (green colour), necrotic cells orange colour) and apoptotic
cells or death cells (red colour). All images used different filters without using overlay.
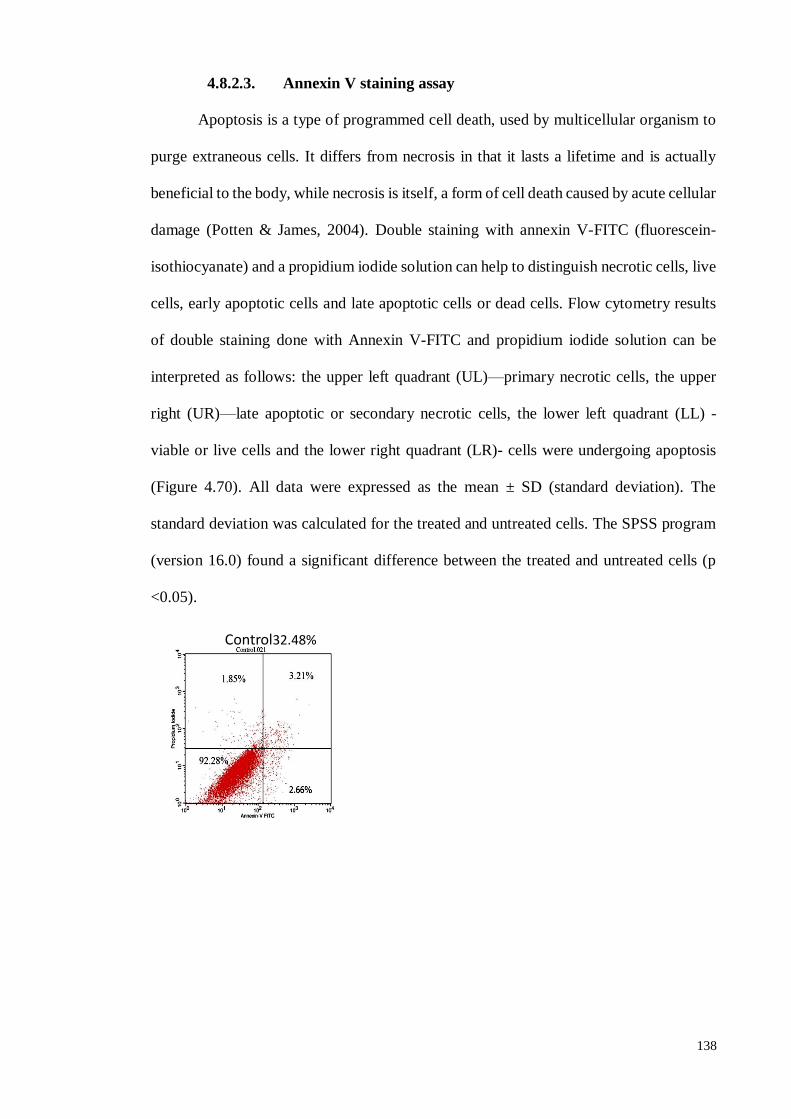
138
4.8.2.3. Annexin V staining assay
Apoptosis is a type of programmed cell death, used by multicellular organism to
purge extraneous cells. It differs from necrosis in that it lasts a lifetime and is actually
beneficial to the body, while necrosis is itself, a form of cell death caused by acute cellular
damage (Potten & James, 2004). Double staining with annexin V-FITC (fluorescein-
isothiocyanate) and a propidium iodide solution can help to distinguish necrotic cells, live
cells, early apoptotic cells and late apoptotic cells or dead cells. Flow cytometry results
of double staining done with Annexin V-FITC and propidium iodide solution can be
interpreted as follows: the upper left quadrant (UL)—primary necrotic cells, the upper
right (UR)—late apoptotic or secondary necrotic cells, the lower left quadrant (LL) -
viable or live cells and the lower right quadrant (LR)- cells were undergoing apoptosis
(Figure 4.70). All data were expressed as the mean ± SD (standard deviation). The
standard deviation was calculated for the treated and untreated cells. The SPSS program
(version 16.0) found a significant difference between the treated and untreated cells (p
<0.05).
Control32.48%
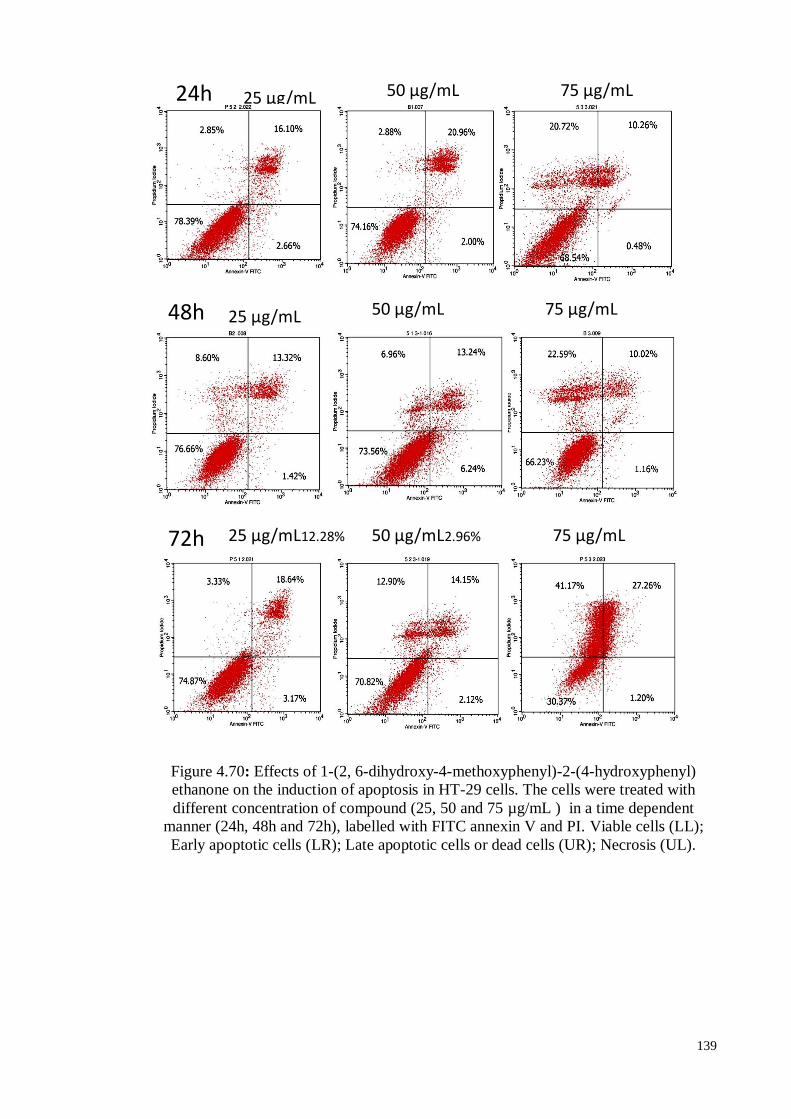
139
Figure 4.70: Effects of 1-(2, 6-dihydroxy-4-methoxyphenyl)-2-(4-hydroxyphenyl)
ethanone on the induction of apoptosis in HT-29 cells. The cells were treated with
different concentration of compound (25, 50 and 75 µg/mL ) in a time dependent
manner (24h, 48h and 72h), labelled with FITC annexin V and PI. Viable cells (LL);
Early apoptotic cells (LR); Late apoptotic cells or dead cells (UR); Necrosis (UL).
24h 25 µg/mL 50 µg/mL 75 µg/mL
25 µg/mL 50 µg/mL 75 µg/mL 48h
25 µg/mL12.28% 50 µg/mL2.96% 75 µg/mL 72h
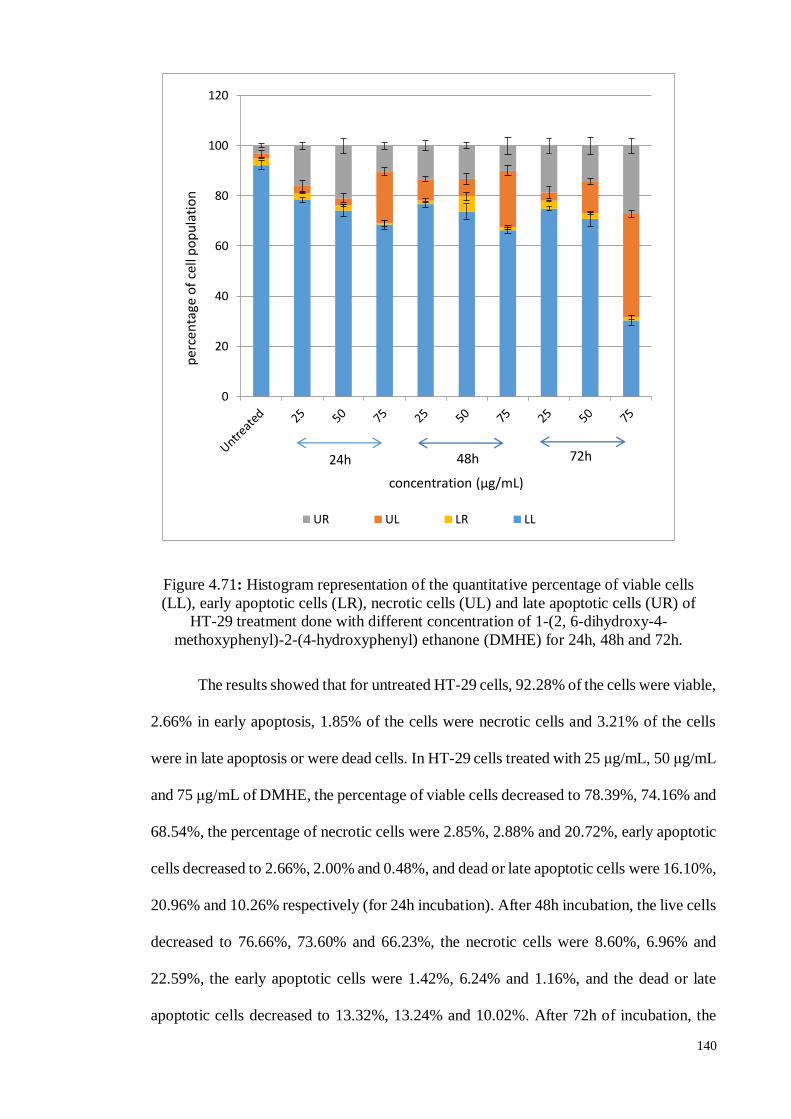
140
Figure 4.71: Histogram representation of the quantitative percentage of viable cells
(LL), early apoptotic cells (LR), necrotic cells (UL) and late apoptotic cells (UR) of
HT-29 treatment done with different concentration of 1-(2, 6-dihydroxy-4-
methoxyphenyl)-2-(4-hydroxyphenyl) ethanone (DMHE) for 24h, 48h and 72h.
The results showed that for untreated HT-29 cells, 92.28% of the cells were viable,
2.66% in early apoptosis, 1.85% of the cells were necrotic cells and 3.21% of the cells
were in late apoptosis or were dead cells. In HT-29 cells treated with 25 μg/mL, 50 μg/mL
and 75 μg/mL of DMHE, the percentage of viable cells decreased to 78.39%, 74.16% and
68.54%, the percentage of necrotic cells were 2.85%, 2.88% and 20.72%, early apoptotic
cells decreased to 2.66%, 2.00% and 0.48%, and dead or late apoptotic cells were 16.10%,
20.96% and 10.26% respectively (for 24h incubation). After 48h incubation, the live cells
decreased to 76.66%, 73.60% and 66.23%, the necrotic cells were 8.60%, 6.96% and
22.59%, the early apoptotic cells were 1.42%, 6.24% and 1.16%, and the dead or late
apoptotic cells decreased to 13.32%, 13.24% and 10.02%. After 72h of incubation, the
0
20
40
60
80
100
120
UR UL LR LL
per
cen
tage
of
cell
po
pu
lati
on
24h 72h 48h
concentration (µg/mL)
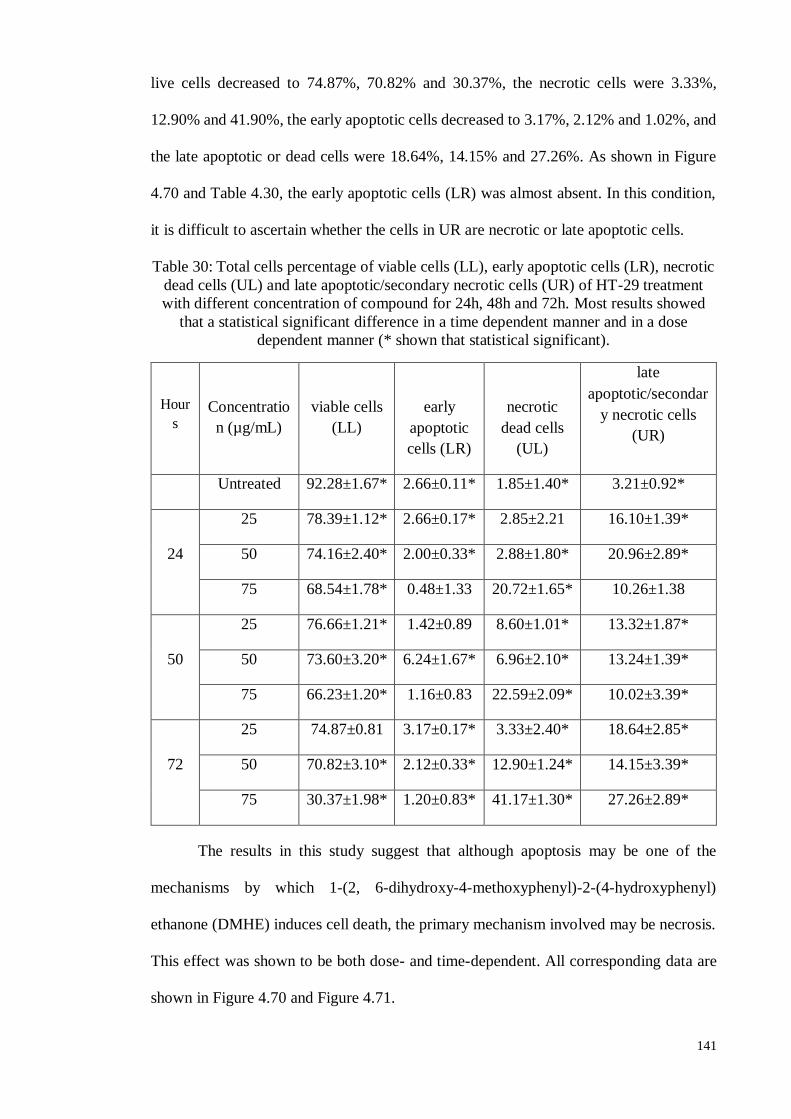
141
live cells decreased to 74.87%, 70.82% and 30.37%, the necrotic cells were 3.33%,
12.90% and 41.90%, the early apoptotic cells decreased to 3.17%, 2.12% and 1.02%, and
the late apoptotic or dead cells were 18.64%, 14.15% and 27.26%. As shown in Figure
4.70 and Table 4.30, the early apoptotic cells (LR) was almost absent. In this condition,
it is difficult to ascertain whether the cells in UR are necrotic or late apoptotic cells.
Table 30: Total cells percentage of viable cells (LL), early apoptotic cells (LR), necrotic
dead cells (UL) and late apoptotic/secondary necrotic cells (UR) of HT-29 treatment
with different concentration of compound for 24h, 48h and 72h. Most results showed
that a statistical significant difference in a time dependent manner and in a dose
dependent manner (* shown that statistical significant).
Hour
s
Concentratio
n (µg/mL)
viable cells
(LL)
early
apoptotic
cells (LR)
necrotic
dead cells
(UL)
late
apoptotic/secondar
y necrotic cells
(UR)
Untreated 92.28±1.67* 2.66±0.11* 1.85±1.40* 3.21±0.92*
25 78.39±1.12* 2.66±0.17* 2.85±2.21 16.10±1.39*
24 50 74.16±2.40* 2.00±0.33* 2.88±1.80* 20.96±2.89*
75 68.54±1.78* 0.48±1.33 20.72±1.65* 10.26±1.38
25 76.66±1.21* 1.42±0.89 8.60±1.01* 13.32±1.87*
50 50 73.60±3.20* 6.24±1.67* 6.96±2.10* 13.24±1.39*
75 66.23±1.20* 1.16±0.83 22.59±2.09* 10.02±3.39*
25 74.87±0.81 3.17±0.17* 3.33±2.40* 18.64±2.85*
72 50 70.82±3.10* 2.12±0.33* 12.90±1.24* 14.15±3.39*
75 30.37±1.98* 1.20±0.83* 41.17±1.30* 27.26±2.89*
The results in this study suggest that although apoptosis may be one of the
mechanisms by which 1-(2, 6-dihydroxy-4-methoxyphenyl)-2-(4-hydroxyphenyl)
ethanone (DMHE) induces cell death, the primary mechanism involved may be necrosis.
This effect was shown to be both dose- and time-dependent. All corresponding data are
shown in Figure 4.70 and Figure 4.71.
142
4.8.2.4. Cell cycle analysis
Cell cycle arrest and apoptosis are two important mechanisms involved in anti-
cancer drug treatment (Call et al., 2008; Dickson & Schwartz, 2009). The cell cycle plays
an important role in cell fate, including cell replication, cell death, and cell function. The
cell cycle consists of five stages: the first is the S phase, during which DNA replication
occurs; the second is the G1 phase, which follows mitosis and during which the cell is
sensitive to positive and negative cues from growth signaling networks; the third stage is
the G2 phase, which is preceded by the S phase when the cell prepares for entry into
mitosis; the next stage is mitosis or M phase, during which the cell divides into two
daughter cells which have genetic material identical to each other and to the mother cell;
and the final stage is the G0 phase, which is when cells have reversibly withdrawn from
the cell division cycle in response to high cell density.
Terminal differentiation or senescent out-of-cycle states are also possible,
resulting in cells that are irreversibly withdrawn from the cell cycle. The synthesis of
DNA and DNA staining increases during the S phase. The G2 phase is when 4n DNA is
present just before mitosis and the M phase is when 4n DNA is present during mitosis
itself. These phases are indistinguishable from one another by using just a DNA probe
and a flow cytometer.
All results showed that a statistical significant difference in the cell cycle phases
between treated cells and untreated cells (negative control) in the G0/G1, S, and G2/S
phases. Compared to the negative control, DMHE treatment for 24h, 48h and 72h induced
an acceptable arrest of HT-29 cells in the G0/G1 phase of the cell cycle. Following
treatment with DMHE for various time periods (24h, 48h and 72h), the HT29 cells were
stained with PI (propidium iodide). The distribution of the cells in the various phases of
the cell cycle was then analyzed with a flow cytometer and the percentage of cells in the
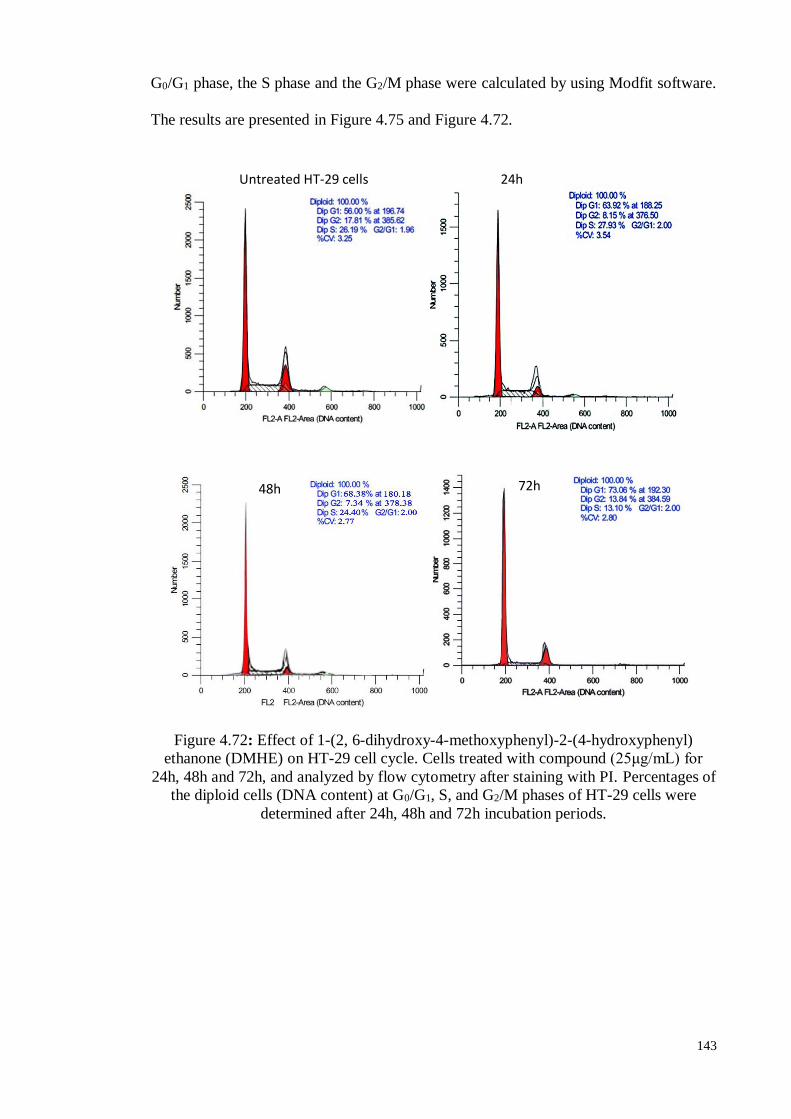
143
G0/G1 phase, the S phase and the G2/M phase were calculated by using Modfit software.
The results are presented in Figure 4.75 and Figure 4.72.
Figure 4.72: Effect of 1-(2, 6-dihydroxy-4-methoxyphenyl)-2-(4-hydroxyphenyl)
ethanone (DMHE) on HT-29 cell cycle. Cells treated with compound (25μg/mL) for
24h, 48h and 72h, and analyzed by flow cytometry after staining with PI. Percentages of
the diploid cells (DNA content) at G0/G1, S, and G2/M phases of HT-29 cells were
determined after 24h, 48h and 72h incubation periods.
Untreated HT-29 cells 24h
48h 72h
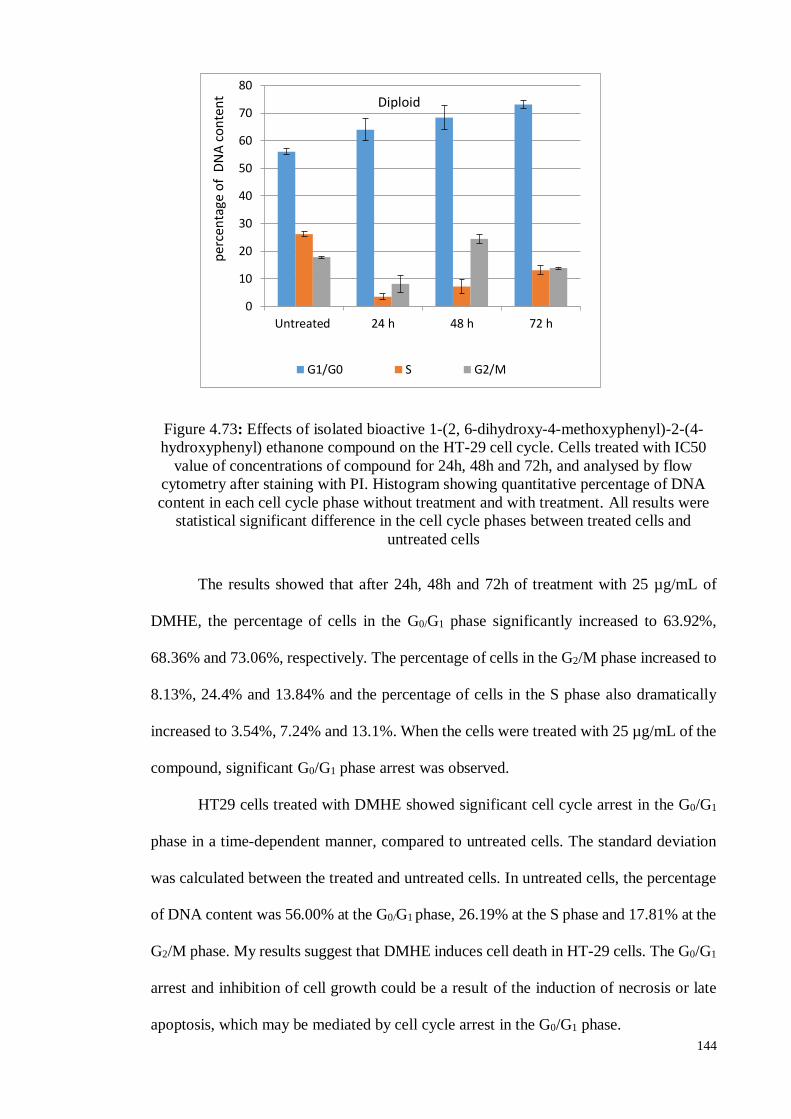
144
Figure 4.73: Effects of isolated bioactive 1-(2, 6-dihydroxy-4-methoxyphenyl)-2-(4-
hydroxyphenyl) ethanone compound on the HT-29 cell cycle. Cells treated with IC50
value of concentrations of compound for 24h, 48h and 72h, and analysed by flow
cytometry after staining with PI. Histogram showing quantitative percentage of DNA
content in each cell cycle phase without treatment and with treatment. All results were
statistical significant difference in the cell cycle phases between treated cells and
untreated cells
The results showed that after 24h, 48h and 72h of treatment with 25 µg/mL of
DMHE, the percentage of cells in the G0/G1 phase significantly increased to 63.92%,
68.36% and 73.06%, respectively. The percentage of cells in the G2/M phase increased to
8.13%, 24.4% and 13.84% and the percentage of cells in the S phase also dramatically
increased to 3.54%, 7.24% and 13.1%. When the cells were treated with 25 µg/mL of the
compound, significant G0/G1 phase arrest was observed.
HT29 cells treated with DMHE showed significant cell cycle arrest in the G0/G1
phase in a time-dependent manner, compared to untreated cells. The standard deviation
was calculated between the treated and untreated cells. In untreated cells, the percentage
of DNA content was 56.00% at the G0/G1 phase, 26.19% at the S phase and 17.81% at the
G2/M phase. My results suggest that DMHE induces cell death in HT-29 cells. The G0/G1
arrest and inhibition of cell growth could be a result of the induction of necrosis or late
apoptosis, which may be mediated by cell cycle arrest in the G0/G1 phase.
0
10
20
30
40
50
60
70
80
Untreated 24 h 48 h 72 h
G1/G0 S G2/M
Diploid
per
cen
tage
of
DN
A c
on
ten
t
145
4.8.3. (Z)-9, 17-Octadecadienal
4.8.3.1. Inverted and phase contrast microscopic examination
Apoptosis plays an important role in cancer prevention, and therapeutics can
manipulate apoptosis to promote tumour cell death. All cell types are capable of
undergoing apoptosis, a mechanism that eliminates excessive, damaged or unwanted cells
from an organism without damaging surrounding cells. The human body is composed
of nearly 1014 cells. Everyday billions of cells are produced by mitosis and a similar
number die by apoptosis to maintain tissue homeostasis. Cell death appears to be
developmentally fixed and programmed, which is why it is also called programmed
cell death (PCD).
The HT-29 cells were treated with 10 µg/mL of the compound for 48h and the
morphological changes were examined using inverted and phase-contrast microscopy. In
Figure 4.74, direct observation by inverted microscopy revealed numerous morphological
changes such as membrane blebbing, cell shrinkage, chromatin condensation, and
apoptotic nuclei and many cells were detached from the culture dish. Furthermore, treated
cells were observed by phase contrast microscopy and then we found the presence of
apoptotic bodies more clearly as shown in Figure 4.75. Therefore, these morphological
studies proved that there are obvious apoptotic morphological changes of treated HT-29
cells when examined under microscopic examination.
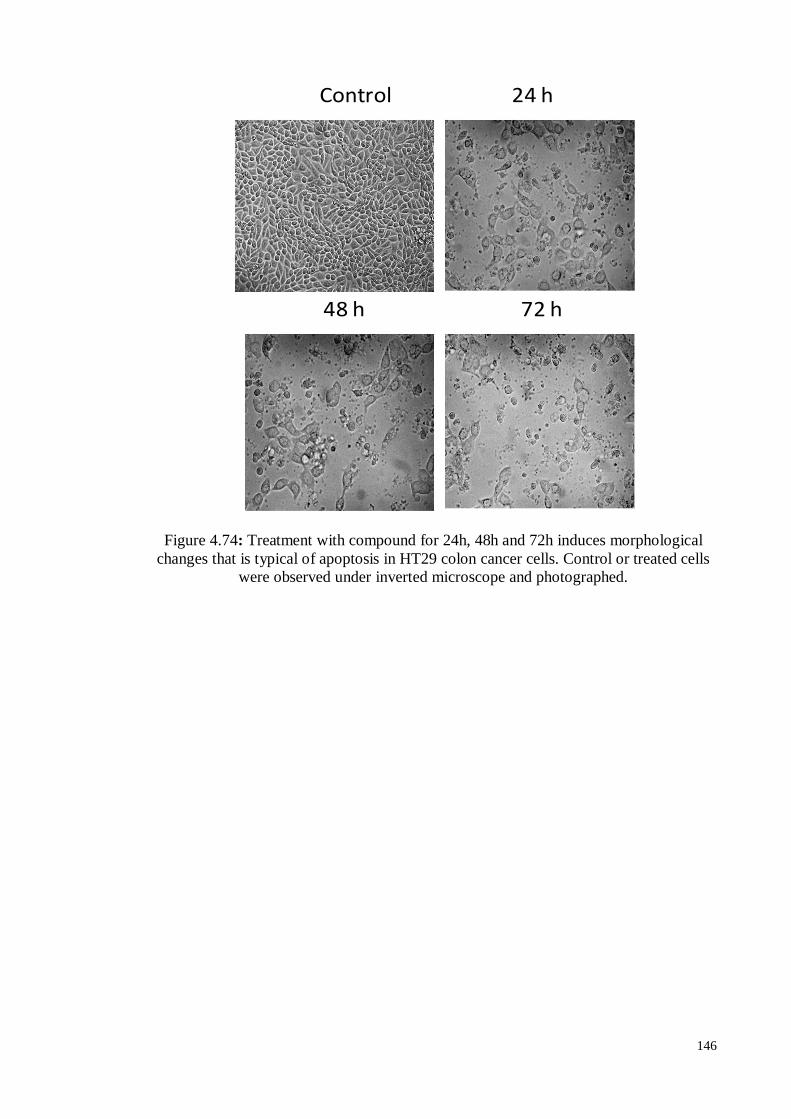
146
Figure 4.74: Treatment with compound for 24h, 48h and 72h induces morphological
changes that is typical of apoptosis in HT29 colon cancer cells. Control or treated cells
were observed under inverted microscope and photographed.
Control 24 h
48 h 72 h
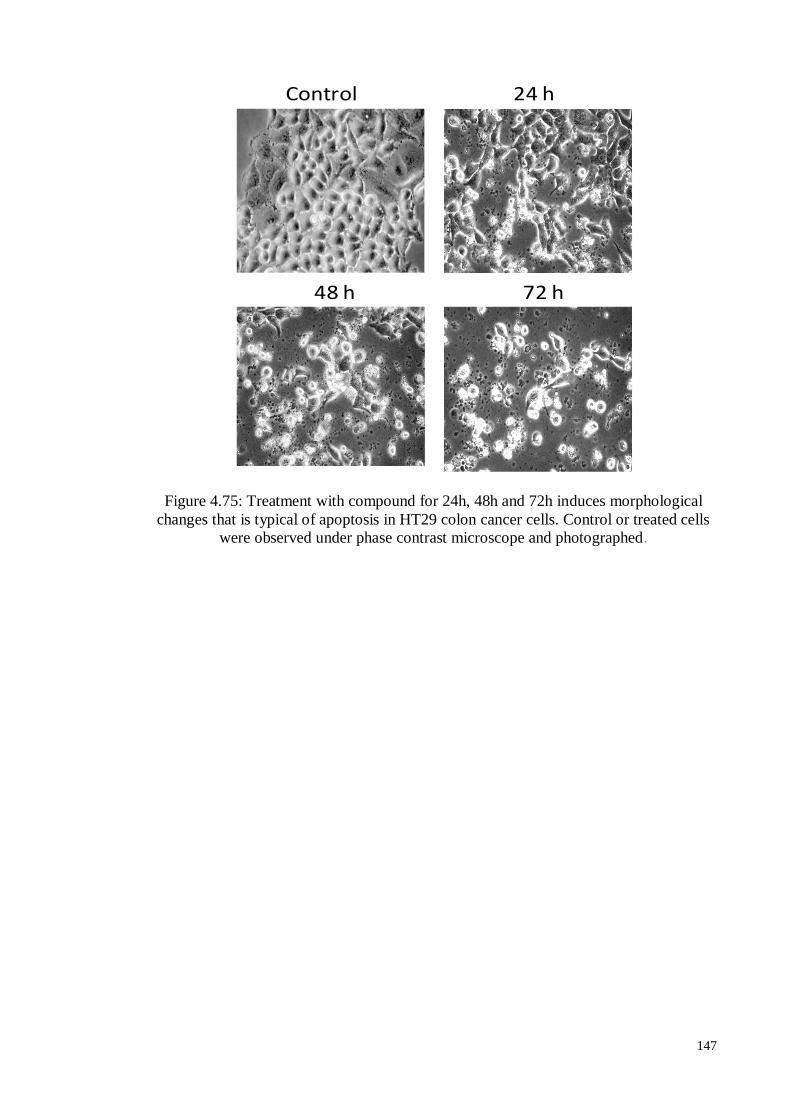
147
Figure 4.75: Treatment with compound for 24h, 48h and 72h induces morphological
changes that is typical of apoptosis in HT29 colon cancer cells. Control or treated cells
were observed under phase contrast microscope and photographed.
Control 24 h
48 h 72 h
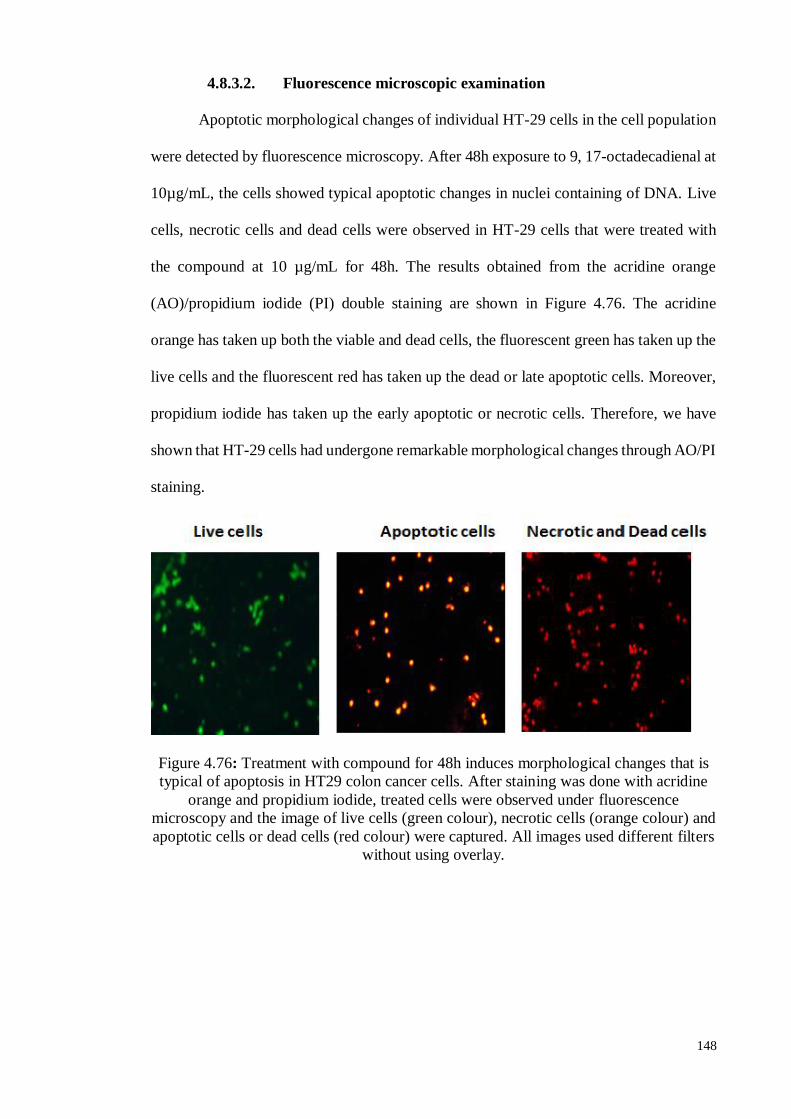
148
4.8.3.2. Fluorescence microscopic examination
Apoptotic morphological changes of individual HT-29 cells in the cell population
were detected by fluorescence microscopy. After 48h exposure to 9, 17-octadecadienal at
10µg/mL, the cells showed typical apoptotic changes in nuclei containing of DNA. Live
cells, necrotic cells and dead cells were observed in HT-29 cells that were treated with
the compound at 10 µg/mL for 48h. The results obtained from the acridine orange
(AO)/propidium iodide (PI) double staining are shown in Figure 4.76. The acridine
orange has taken up both the viable and dead cells, the fluorescent green has taken up the
live cells and the fluorescent red has taken up the dead or late apoptotic cells. Moreover,
propidium iodide has taken up the early apoptotic or necrotic cells. Therefore, we have
shown that HT-29 cells had undergone remarkable morphological changes through AO/PI
staining.
Figure 4.76: Treatment with compound for 48h induces morphological changes that is
typical of apoptosis in HT29 colon cancer cells. After staining was done with acridine
orange and propidium iodide, treated cells were observed under fluorescence
microscopy and the image of live cells (green colour), necrotic cells (orange colour) and
apoptotic cells or dead cells (red colour) were captured. All images used different filters
without using overlay.
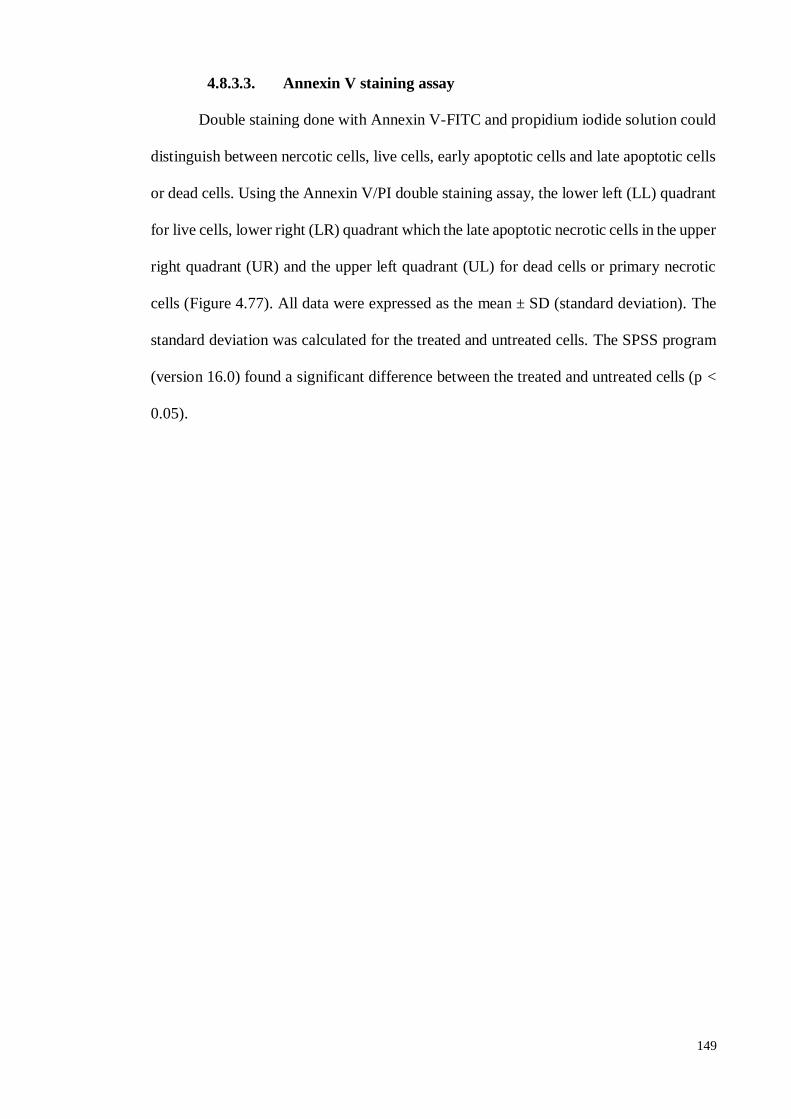
149
4.8.3.3. Annexin V staining assay
Double staining done with Annexin V-FITC and propidium iodide solution could
distinguish between nercotic cells, live cells, early apoptotic cells and late apoptotic cells
or dead cells. Using the Annexin V/PI double staining assay, the lower left (LL) quadrant
for live cells, lower right (LR) quadrant which the late apoptotic necrotic cells in the upper
right quadrant (UR) and the upper left quadrant (UL) for dead cells or primary necrotic
cells (Figure 4.77). All data were expressed as the mean ± SD (standard deviation). The
standard deviation was calculated for the treated and untreated cells. The SPSS program
(version 16.0) found a significant difference between the treated and untreated cells (p <
0.05).
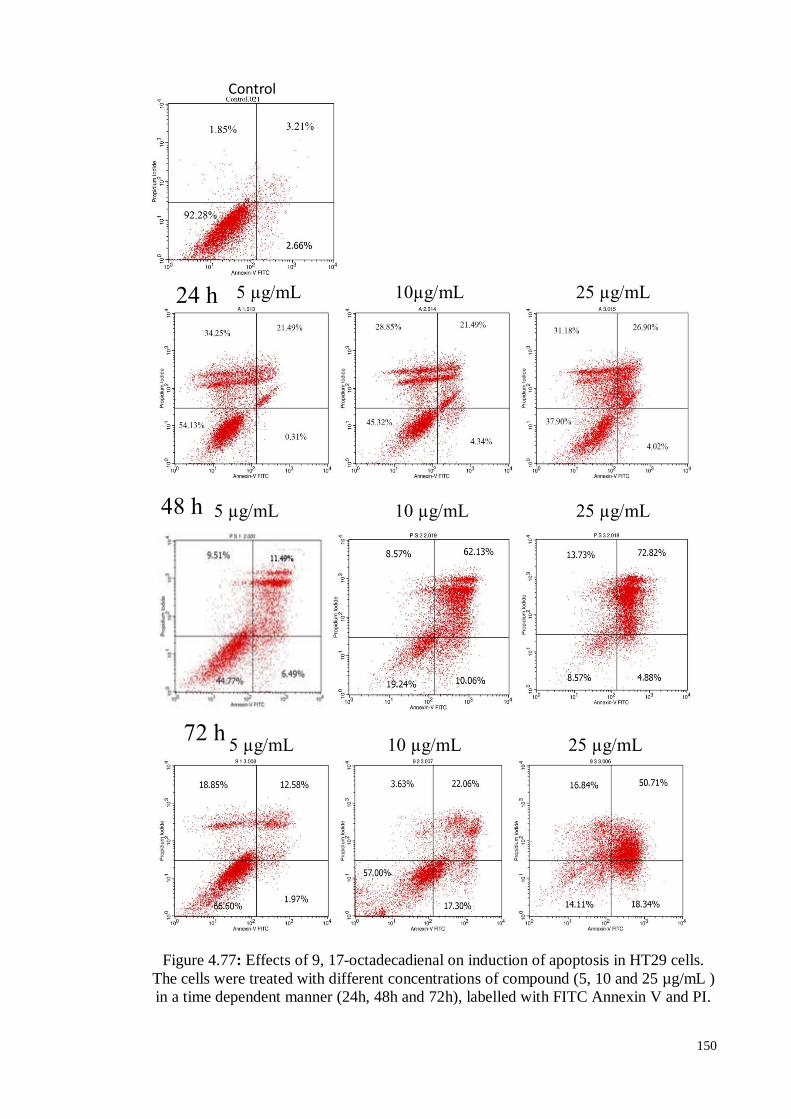
150
Figure 4.77: Effects of 9, 17-octadecadienal on induction of apoptosis in HT29 cells.
The cells were treated with different concentrations of compound (5, 10 and 25 µg/mL )
in a time dependent manner (24h, 48h and 72h), labelled with FITC Annexin V and PI.
24 h 5 µg/mL 10µg/mL 25 µg/mL
48 h 5 µg/mL 10 µg/mL 25 µg/mL
72 h 5 µg/mL 10 µg/mL 25 µg/mL
Control
151
Viable cells = LL; Early apoptotic cells = LR; Late apoptotic cells or dead cells = UR;
Necrotic cells = UL.
Figure 4.78: Histogram representation of the quantitative percentage of viable cells
(LL), early apoptotic cells (LR), necrotic dead cells (UL) and late apoptotic/secondary
necrotic cells (UR) of HT-29 treatment with different concentration of compound for
24h, 48h and 72h.
According to our data of the untreated cells, 92.28% of the cells were viable,
1.85% of the cells were in early apoptosis and 3.21% of cells were in late apoptosis
/secondary necrosis. In the HT-29 cells that were treated with 5µg/mL, 10µg/mL and
25µg/mL of compound for 24h, the percentages of viable cells were 54.13%, 45.32% and
37.90%, the percentages for primary necrotic cells were 34.25%, 28.85% and 31.18%,
for the early apoptotic cells the percentages were 0.31%, 4.34% and 4.02% and the
percentages for late apoptotic cells/ secondary necrotic cells were 21.49%, 21.49% and
26.90%, respectively. For the 48h incubation period, the live cells were 44.77%, 19.24%
and 8.57%, the primary necrotic cells were 9.51%, 8.57% and 13.73%, the early apoptotic
0
20
40
60
80
100
120
UR UL LR LL
per
cen
tage
of
cell
po
pu
lati
on
`
72h24h 48h
concentration (µg/mL)
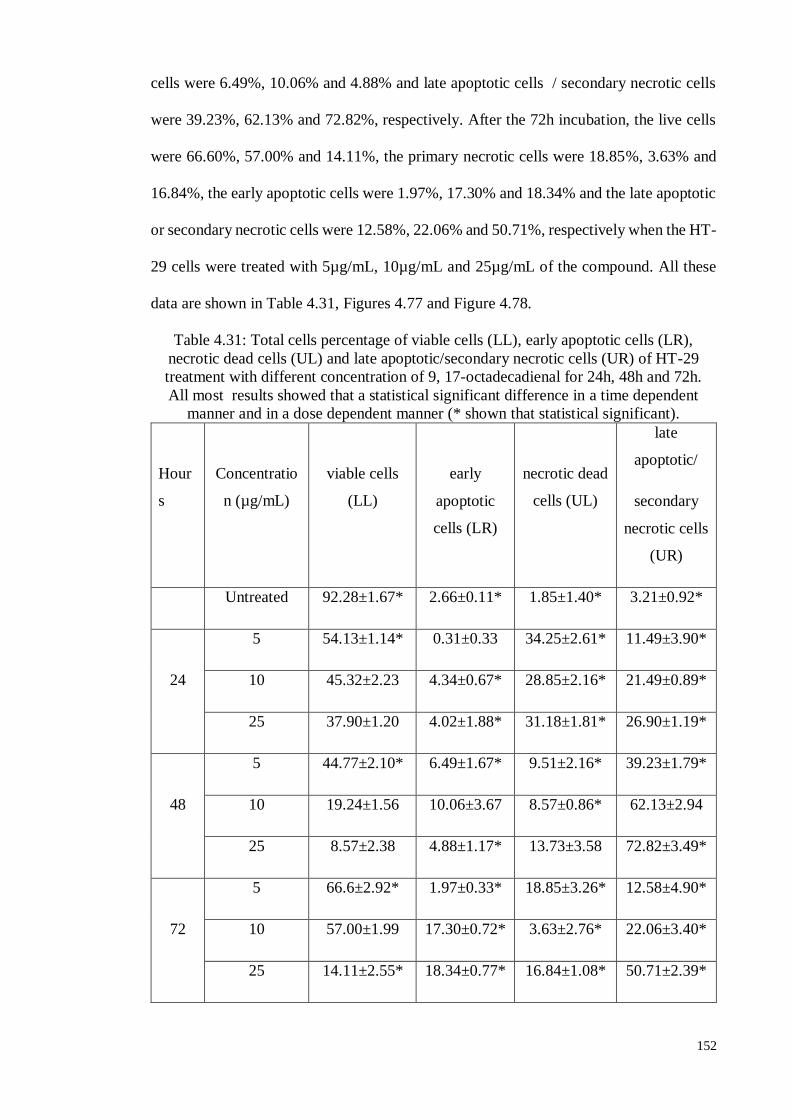
152
cells were 6.49%, 10.06% and 4.88% and late apoptotic cells / secondary necrotic cells
were 39.23%, 62.13% and 72.82%, respectively. After the 72h incubation, the live cells
were 66.60%, 57.00% and 14.11%, the primary necrotic cells were 18.85%, 3.63% and
16.84%, the early apoptotic cells were 1.97%, 17.30% and 18.34% and the late apoptotic
or secondary necrotic cells were 12.58%, 22.06% and 50.71%, respectively when the HT-
29 cells were treated with 5µg/mL, 10µg/mL and 25µg/mL of the compound. All these
data are shown in Table 4.31, Figures 4.77 and Figure 4.78.
Table 4.31: Total cells percentage of viable cells (LL), early apoptotic cells (LR),
necrotic dead cells (UL) and late apoptotic/secondary necrotic cells (UR) of HT-29
treatment with different concentration of 9, 17-octadecadienal for 24h, 48h and 72h.
All most results showed that a statistical significant difference in a time dependent
manner and in a dose dependent manner (* shown that statistical significant).
Hour
s
Concentratio
n (µg/mL)
viable cells
(LL)
early
apoptotic
cells (LR)
necrotic dead
cells (UL)
late
apoptotic/
secondary
necrotic cells
(UR)
Untreated 92.28±1.67* 2.66±0.11* 1.85±1.40* 3.21±0.92*
5 54.13±1.14* 0.31±0.33 34.25±2.61* 11.49±3.90*
24 10 45.32±2.23 4.34±0.67* 28.85±2.16* 21.49±0.89*
25 37.90±1.20 4.02±1.88* 31.18±1.81* 26.90±1.19*
5 44.77±2.10* 6.49±1.67* 9.51±2.16* 39.23±1.79*
48 10 19.24±1.56 10.06±3.67 8.57±0.86* 62.13±2.94
25 8.57±2.38 4.88±1.17* 13.73±3.58 72.82±3.49*
5 66.6±2.92* 1.97±0.33* 18.85±3.26* 12.58±4.90*
72 10 57.00±1.99 17.30±0.72* 3.63±2.76* 22.06±3.40*
25 14.11±2.55* 18.34±0.77* 16.84±1.08* 50.71±2.39*
153
Therefore, the results show that cell death of the HT-29 colon adenocarcinoma
cells upon treatment by 9, 17-octadecadienal occurred in a dose-dependent manner. It was
also observed that the highest percentage of apoptotic cells (early and late) occurred 48hrs
after treatment with 25 µg/mL of compound.
154
4.8.3.4. Cell cycle analysis
It is estimated that 50 to 70 billion cells die each day due to apoptosis in human
adults. In one year, the number of cell divisions and deaths that occur in a person's body
is approximately equal to the person’s weight (Potten & James, 2004). DNA or
deoxyribonucleic acid is vital to the reproduction of cells, live cells and dead cell. DNA,
made up of two sets of chromosomes is the molecule which carried genetic information
of living organisms. Cells regenerate in order to replace dead or damaged cells or to grow.
The cell cycle plays an essential role in the cell including cell replication, cell death, and
cell function.
During the flow cytometry analysis of the cell cycle, the most common categories
of DNA binding dyes are the blue-excited dye propidium iodide, the UV-excited dyes
4’,6-diamidino-2-phenylindole (DAPI) and Hoechst 33342 and 33258 dye. Each cell
cycle consists of five stages: the G1 phase is preceded by mitosis and the level of DNA
content is 2N; cells in the G0 phase are quiescent and do not participate in cell division;
the S phase is where DNA replication and synthesis occurs; the G2 phase is when cells
prepare for entry into mitosis, and the level of DNA content is 4N; the M phase or mitosis
is when cell division involves the distribution of identical genetic material, DNA, into
two daughter cells. Both G1 and G0 have 2N DNA and are indistinguishable from one
another. To determine whether the inhibition of the compound on HT-29 cell proliferation
involves cell cycle changes, we examined the cell cycle phase distribution of the treated
cells by flow cytometry. The percentage of cells in the G0/G1, S and G2/M phase were
calculated by using ModFit software and all data are represented in Figure 4.83.
It was observed that the compound resulted in cell cycle arrest in the G0/G1 phase
after treatment of 10 µg/mL of compound in a time-dependent manner, compared to the
untreated cells. Standard deviation was calculated for the treated and untreated cells using
Microsoft excel software. All significance of the difference between the treated and
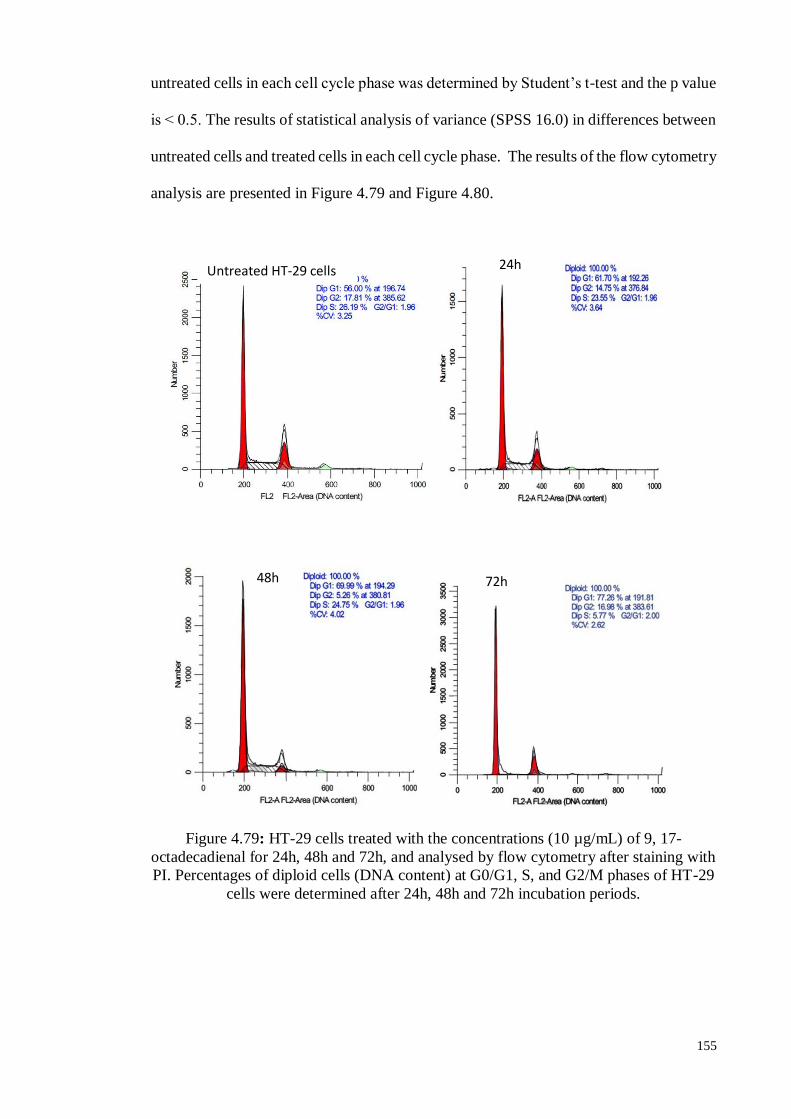
155
untreated cells in each cell cycle phase was determined by Student’s t-test and the p value
is ˂ 0.5. The results of statistical analysis of variance (SPSS 16.0) in differences between
untreated cells and treated cells in each cell cycle phase. The results of the flow cytometry
analysis are presented in Figure 4.79 and Figure 4.80.
Figure 4.79: HT-29 cells treated with the concentrations (10 µg/mL) of 9, 17-
octadecadienal for 24h, 48h and 72h, and analysed by flow cytometry after staining with
PI. Percentages of diploid cells (DNA content) at G0/G1, S, and G2/M phases of HT-29
cells were determined after 24h, 48h and 72h incubation periods.
Untreated HT-29 cells 24h
48h 72h
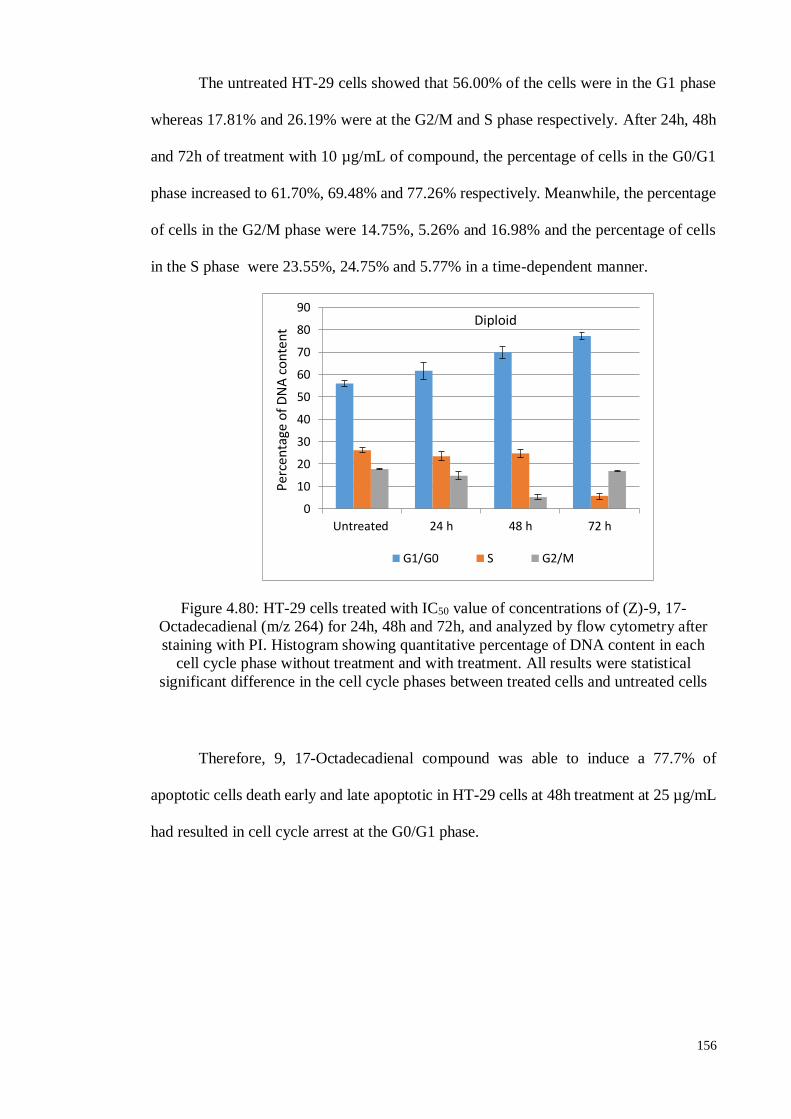
156
The untreated HT-29 cells showed that 56.00% of the cells were in the G1 phase
whereas 17.81% and 26.19% were at the G2/M and S phase respectively. After 24h, 48h
and 72h of treatment with 10 µg/mL of compound, the percentage of cells in the G0/G1
phase increased to 61.70%, 69.48% and 77.26% respectively. Meanwhile, the percentage
of cells in the G2/M phase were 14.75%, 5.26% and 16.98% and the percentage of cells
in the S phase were 23.55%, 24.75% and 5.77% in a time-dependent manner.
Figure 4.80: HT-29 cells treated with IC50 value of concentrations of (Z)-9, 17-
Octadecadienal (m/z 264) for 24h, 48h and 72h, and analyzed by flow cytometry after
staining with PI. Histogram showing quantitative percentage of DNA content in each
cell cycle phase without treatment and with treatment. All results were statistical
significant difference in the cell cycle phases between treated cells and untreated cells
Therefore, 9, 17-Octadecadienal compound was able to induce a 77.7% of
apoptotic cells death early and late apoptotic in HT-29 cells at 48h treatment at 25 µg/mL
had resulted in cell cycle arrest at the G0/G1 phase.
0
10
20
30
40
50
60
70
80
90
Untreated 24 h 48 h 72 h
G1/G0 S G2/M
Diploid
Per
cen
tage
of
DN
A c
on
ten
t
157
4.9. General Discussion
One of Indonesia’s famous herbal medicine plant is P. macrocarpa (Scheff.)
Boerl which belongs to the Thymelaeceae family and it is especially well-known in
Southeast Asia as an herbal medicine. P. macrocarpa is used to address a variety of
ailments such as cancer, diabetes mellitus, allergies, liver and heart diseases, kidney
failure, blood diseases, high blood pressure, and stroke. It has also been used to treat
various skin diseases including acne (Harmanto, 2002; Jemal et al., 2007).
In this study, P. macrocarpa seeds and fruits were exhaustively soaked in 70%
aqueous methanol and then fractionated with hexane, chloroform, ethyl acetate and water.
After this, the methanol extracts and fractions were evaluated for cytotoxic activity in
selected human cancer cell lines, namely the cervical epithelial carcinoma cell (Ca Ski),
the hormone-dependent breast carcinoma cell (MCF-7), the epithelial colon carcinoma
cell (HT-29), the epithelial lung carcinoma cell (A549), the ovarian carcinoma cell
(SKOV-3), the hormone-independent breast carcinoma cell (MDA-MB231) as well as
non-cancer human cells, namely the normal fibroblast cell line (MRC-5) using the MTT
cell proliferation assay. The MTT assay is a sensitive and reliable colorimetric assay and
it uses quantitative measurements to calculate the viability, proliferation and activation of
cells and this method is commonly applied to screen anticancer agents (Petty et al., 1995).
The methanol extract and its fractions (hexane, chloroform, ethyl acetate and
water) in P. macrocarpa fruits were found to have cytotoxic effects on some cancer cell
lines (MCF-7, HT-29, MDA-MB 231 and SKOV-3) but no cytotoxic effect on the cervical
carcinoma cell line (Ca Ski) and the non-cancer human fibroblast cell line (MRC-5)
according to dose- and time-dependent manner. Some researchers have also noted that
the edible fruits of P. macrocarpa are very useful in treating individuals with
hypertension, diabetes, cancer and/or diuretic problems because of their high antioxidant,
158
antimicrobial, anti-inflammatory, and cytotoxic properties, as well as other bioactivities
present in their compounds.
In studying the P. macrocarpa seeds, results also revealed that their methanol
extract and its fractions had highly cytotoxic effects on all selected cancer cell lines
(MCF-7, HT-29, MDA-MB231, Ca Ski, and SKOV-3) and mild cytotoxicity effects on
the normal human fibroblast breast cell line (MRC-5). The seed of P. macrocarpa is the
most poisonous part of the plant, with significantly higher toxicity levels than the stem,
roots or leaves but researchers have also reported that the seeds have cytotoxic activity,
antimicrobial and other bioactivities.
After investigating the seeds of the P. macrocarpa for cytotoxic activity, it was of
interest to identify the bioactive and chemical compounds of the ethyl acetate fraction of
the P. macrocarpa seeds and fruits. The hexane and ethyl acetate fraction were the refines
subjected to column chromatography which led to the isolation and identification of some
compounds done by nuclear magnetic resource (NMR), thin layer chromatography (TLC)
and gas chromatography-mass spectrometry (GC-MS) analyses.
Six compounds were identified from the hexane extract of the P. macrocarpa
seeds by using GC-MS and they are namely methyl myristate, methyl stearate, oleic acid,
linoleic acid, methyl linoleate, palmitic acid and other minor components. The chloroform
fraction of the P. macrocarpa seeds showed presence of methyl myristate, palmitic acid,
methyl oleate, 6-octadecenoic acid, (z) - and 9, 17-octadecadienal, (z)-. The bioactive
fraction of the ethyl acetate fraction was subjected to column chromatography separation
and this fraction yielded palmitic acid, methyl palmitate, β-sitosterol and (z) 9, 17-
octadecadienal using gas choromatography-mass spectrometery (GC-MS) analysis.
In the hexane fraction of the P. macrocarpa fruit, the chemical compounds methyl
myristate, palmitic acid, β-sitosterol, methyl oleate, oleic acid, methyl linoleate and other
minor components were identified. Of the chloroform fraction of the P. macrocarpa fruit,
159
three chemical components were identified namely methyl myristate, metyl oleate, β-
sitosterol and other minor components by using GC-MS analysis. The bioactive ethyl
acetate fraction of the P. macrocarpa fruit was subjected to the column chromatography
and this fraction produced palmitic acid, methyl palmitate, methyl oleate, oleic acid,
methyl myristate, methyl linoleate, β-sitosterol, stigmast-4-en-3-one, flamenol, phenol
2,4',6-trihydroxy-4-methoxybenzophenone (or) (2,6-dihydroxy-4-methoxyphenyl)(4-
hydroxyphenyl) methanone and 1-(2, 6-dihydroxy-4-methoxyphenyl)-2-(4-
hydroxyphenyl) ethanone and other unidentified compounds. These two compounds,
identified by using GC-MS and NMR analyses, from fruits of P. macrocarpa and 9, 17-
octadienal (z) from seeds of P. macrocarpa were investigated for cytotoxic effects on
the human colon carcinoma cell lines (HT-29) and the normal human fibroblast cell line
(MRC-5) in a time- and dose-dependent manner.
HT-29 and MRC-5 cell lines were treated with various concentrations of the first
compound, 2, 4', 6-trihydroxy-4-methoxybenzophenone for 24h, 48h and 72h
respectively to inhibit cell proliferation by using the MTT assay. 2, 4', 6-trihydroxy-4-
methoxybenzophenone has mild cytotoxic activity on normal cells but has anticancer
effects in cancer cells (HT-29). The compound was found to induce apoptosis in HT-29
cells and we observed the morphological changes under microscopic examination such
as cell shrinkage, membrane blebbing, DNA fragmentation and apoptotic nuclei by using
an inverted, phase contrast and fluorescence microscope with acridine orange and
propidium iodide double staining.
The percentage of pro-apoptotic HT-29 cells were determined by flow cytometry
analysis by using Annexin V-FITC staining. During the cell cycle analysis, the percentage
of HT-29 cells treated with the 2, 4', 6-trihydroxy-4-methoxybenzophenone was found to
be arrested at the G0/G1 phase in a time-dependent manner and S phase accumulations
were found to have sharply declined. All these data indicate that the mechanism of cell
160
cycle arrest in the S phase was related to apoptosis protein, which plays a vital role in
regulating the mitochondria-dependent pathway of apoptosis.
For the second compound, 1-(2, 6-dihydroxy-4-methoxyphenyl)-2-(4-
hydroxyphenyl) ethanone was also tested on the human colon adenocarcinoma cell line
(HT-29) and the normal human fibroblast cell line (MRC-5) by using the MTT cell
proliferation assay. In this study, we found that the MTT assay significantly decreased
cell proliferation in the HT-29 cell line in a dose- and time-dependent manner. We also
observed morphological features of the apoptotic bodies such as cell death, cell shrinkage,
membrane blebbing, nuclear condensation and DNA fragmentation under inverted, phase
and fluorescence microscopy.
To the best of my knowledge, the bioactive 1-(2, 6-dihydroxy-4-methoxyphenyl)-
2-(4-hydroxyphenyl) ethanone induced in HT-29 cells, which were analyzed with the
Annexin V-FITC/propidium iodide staining assay by using the flow cytometry technique
and the percentage of early apoptotic, late apoptotic cells, necrotic cells and live cells
were observed in a time-dependent and dose-dependent manner. During the cell cycle
analysis, the IC50 values of concentration of the 1-(2, 6-dihydroxy-4-methoxyphenyl)-2-
(4-hydroxyphenyl) ethanone induced an apparent low level of apoptosis and G0/G1 arrest
in HT-29 cells in a time-dependent manner.
The third compound, the bioactive 9, 17-octadecadienal was tested on the human
colon carcinoma cell line (HT-29) and the normal human fibroblast cell line (MRC-5) by
using the MTT cell proliferation assay. The result of the MTT assay showed that 9, 17-
octadecadienal exhibited cytotoxic effect of the HT-29 cells but had no cytotoxic effect
on MRC-5 cells line in a dose- and time- dependent manner.
Next, the morphological features of the apoptotic bodies such as cell shrinkage,
cell death, membrane blebbing, nuclear condensation and DNA fragmentation were
observed under an inverted, phase and fluorescence microscope. It is also confirmed that
161
various concentrations of the 9, 17-octadecadienal induced HT-29 cells that were stained
with Annexin V-FITC/propidium iodide when using the flow cytometry analysis. The
results revealed low percentage of early apoptotic, late apoptotic or dead cells, necrotic
cells and live cells. Furthermore, the cell cycle analysis showed that 9, 17-ctadecadienal
at a concentration of 10 µg/mL was able to induce G0/G1 arrest in HT-29 cells in a time
dependent-manner.Therefore, it can be concluded that that 9, 17-octadecadienal induced
apoptotic cell death of HT-29 cells.
In sum, the results showed that these three compounds and 2,4',6-trihydroxy-4-
methoxybenzophenone and 1-(2, 6-dihydroxy-4-methoxyphenyl)-2-(4-
hydroxyphenyl)ethanone, were found to have a cytotoxic effect on the human colon
carcinoma cell lines (HT-29) in a time- and dose-dependent manner but mild cytotoxic
effect on normal fibroblast cells (MRC-5). More studies on the mechanism of cell death
induced by the above compounds need to be conducted before a conclusion can be derived
regarding its potential use as anti-cancer agents.
162
CHAPTER 5
CONCLUSION
5.1. Conclusion
Results demonstrate that 9, 17-octadecadienal (Z)-, 2, 4’, 6-trihydroxy-4-
methoxybenzophenone and 1-(2, 6-dihydroxy-4-methoxyphenyl)-2-(4-hydroxyphenyl)
ethanone induce cytotoxic effect on HT-29 cells by using MTT cells proliferation assay
in vitro experiment. In the treatment with compounds in HT-29 cells for time dependent
manner, morphological studies of apoptotic bodies were observed under microscopic
examinations (phase contrast microscopy, inverted microscopy and fluorescence
microscopy). It can be clearly seen that apoptotic bodies such as cell death, cell shrinkage,
membrane blebbing, and nuclear condensation and DNA fragmentation were present. In
the annexin V-FITC/PI staining assay, HT-29 cells treated with different concentration
of compounds provide results which demonstrate clear percentages of late apoptotic cells,
early apoptotic cells, necrotic cells and live cells.
Apoptosis depends on cell growth and cell proliferation which are mainly
regulated by cell cycle events. Investigation on the effect of these compounds on cell
cycle arrest prove that treatment with compounds help to examine the cells cycle
checkpoints which were arrested in the G0/G1 phase in HT-29 cells when using flow
cytometry analysis. These data provide further investigation of the protein regulatory for
good understanding of the anti-cancer mechanism action of these may compounds.
Therefore, this study revealed that these three compounds have the potential to be used
as a therapeutic drug in treating patients with colon cancer in the future.
163
5.2. Future work
These finding suggest that these three compounds possess cytotoxic effect and
low level of apoptotic ability on HT-29 cells but mild cytotoxic activity on normal human
cells. These results provide the basis knowledge of targeted chemotherapeutic drugs in
cancer research. However, these three compounds still need to be further investigated in
target apoptotic studies in vivo experiment with animals and also to be further tested on
patients with human colon cancer cells for clinical trials in further chemotherapeutic
approaches.
164
REFERENCES
Adrain, C., Creagh, E. M., & Martin, S. J. (2002). Caspase cascades in apoptosis.
Caspases: their role in cell death and cell survival. Kluwer Academic/Plenum
Publishers, New York, NY, 41-51.
Ali, R. B., Atangwho, I. J., Kaur, N., Abraika, O. S., Ahmad, M., Mahmud, R., & Asmawi,
M. Z. (2012). Bioassay-guided antidiabetic study of Phaleria macrocarpa fruit
extract. Molecules, 17(5), 4986-5002.
Aripin, A., Arifin, P. F., & Thandrawinata, R. R. (2011). USA Patent No.: P. A.
Publication.
Arriola, E. L., Rodriguez-Lopez, A. M., Hickman, J. A., & Chresta, C. M. (1999). Bcl-2
overexpression results in reciprocal down regulation of Bcl-X (L) and sensitizes
human testicular germ cell tumours to chemotherapy-induced apoptosis.
Oncogene, 18(7), 1457-1464.
Astuti, E., Raharjo, T. J., & Eviane, D. (2007). Cytotoxicity of Phaleria macrocarpa
(Scheff) boerl fruit flesh and seed extract of ethanol and its effect against p53 and
Bcl-2 genes expression of normal cell. LIFE, 29, 28P
Bakhriansyah, M. (2004). Pengaruh Ekstrak Etanol Biji Mahkota Dewa (Phaleria
macrocarpa [Scheff.] Boerl.) Pada Sel Kanker Payudara T47D: Kajian Aktivitas
Sitotoksik Dan Penghambatan Ekspresi Siklooksigenase-2.
Borenfreund, E., & Puerner, J. A. (1985). A simple quantitative procedure using
monolayer cultures for cytotoxicity assays (HTD/NR-90). Journal of tissue culture
methods, 9(1), 7-9.
Borenfreund, E., Babich, H., & Martin-Alguacil, N. (1988). Comparisons of two in vitro
cytotoxicity assays: The neutral red (NR) and tetrazolium MTT tests. Toxicology
in vitro, 2(1), 1-6.
Call, J. A., Eckhardt, S. G., & Camidge, D. R. (2008). Targeted manipulation of apoptosis
in cancer treatment. The lancet oncology, 9(10), 1002-1011.
Cheng, Y. L., Chang, W. L., Lee, S. C., Liu, Y. G., Chen, C. J., Lin, S. Z., & Harn, H. J.
(2004). Acetone extract of Angelica sinensis inhibits proliferation of human
cancer cells via inducing cell cycle arrest and apoptosis. Life sciences, 75(13),
1579-1594.
Chong, S. C., Dollah, M. A., Chong, P. P., & Maha, A. (2011). Phaleria macrocarpa
(Scheff.) Boerl fruit aqueous extract enhances LDL receptor and PCSK9
expression in vivo and in vitro. Journal of Ethnopharmacology, 137(1), 817-827.
Cooper, G. M. (Ed.). (1993). The Cancer Book (Vol. 7): Jones and Barlett Publishers,
Boston, MA.
165
Csipo, I., Montel, A. H., Hobbs, J. A., Morse, P. A., & Brahmi, Z. (1998). Effect of Fas+
and Fas− target cells on the ability of NK cells to repeatedly fragment DNA and
trigger lysis via the Fas lytic pathway. Apoptosis, 3(2), 105-114.
Deorukhkar, A., Krishnan, S., Sethi, G., & Aggarwal, B. B. (2007). Back to basics: how
natural products can provide the basis for new therapeutics.
Dickson, M. A., & Schwartz, G. K. (2009). Development of cell-cycle inhibitors for
cancer therapy. Current Oncology, 16(2), 36.
Faried, A., Kurnia, D., Faried, L. S., Usman, N., Miyazaki, T., Kato, H., & Kuwano, H.
(2007). Anticancer effects of gallic acid isolated from Indonesian herbal medicine,
Phaleria macrocarpa (Scheff.) Boerl, on human cancer cell lines. International
journal of oncology, 30(3), 605-613.
Farnsworth, N. R., Akerele, O., Bingel, A. S., Soejarto, D. D., & Guo, Z. (1985). WHO,
Bull, pp. 965-972.
Georg F, W. (2007). Cell Division and Survival Molecular Mechanisms of Cancer.
Green, D. R. (2011). Apoptosis: physiology and pathology. Cambridge University Press
Hague, A., & Paraskeva, C. (2004). Apoptosis and disease: a matter of cell fate. Nature
Cell Death and Differentiation. (1-7).
Hanahan, D., & Weinberg, R. A. (2000). The hallmarks of cancer cell, 100(1), 57-70.
Harmanto, N. (2001). Mahkota dewa: obat pusaka para dewa. AgroMedia, Jakarta, 4-11.
Harmanto, N. (2002). Mahkota Dewa Obat Pusaka Para Dewa Cetakan keempat,
Agromedia Pustaka, Jakarta, 4-11.
Harmanto, N. (2003). Conquering Disease in Unison with Mahkota Dewa. Phaleria
macrocarpa. 1st Edn. PT Mahkotadewa, Iakarta, Indonesia, 14.
Hartati, M. S. W., Mubarika, S., Gandjar, I. G., Hamann, M. T., Rao, K. V., & Wahyuono,
S. (2005). Phalerin, A New Benzophenoic Glucoside Isolated from the Methanolic
Extract of Mahkota Dewa [Phaleria macrocarpa (Scheff.) Boerl] Leaves. Majalah
Farmasi Indonesia, 16(1), 51-57.
Hendra, P., Fukushi, Y., & Hashidoko, Y. (2009). Synthesis of benzophenone
glucopyranosides from Phaleria macrocarpa and related benzophenone
glucopyranosides. Bioscience, biotechnology, and biochemistry, 73(10), 2172-
2182.
Hendra, R., Ahmad, S., Sukari, A., Shukor, M. Y., & Oskoueian, E. (2011). Flavonoid
analyses and antimicrobial activity of various parts of Phaleria macrocarpa
(Scheff.) boerl fruit. International journal of molecular sciences, 12(6), 3422-
3431.
Hetz, C. A., Torres, V., & Quest, A. F. (2005). Beyond apoptosis: nonapoptotic cell death
in physiology and disease. Biochemistry and cell biology, 83(5), 579-588.
166
Itharat, A., Houghton, P. J., Eno-Amooquaye, E., Burke, P. J., Sampson, J. H., & Raman,
A. (2004). In vitro cytotoxic activity of Thai medicinal plants used traditionally to
treat cancer. Journal of ethnopharmacology, 90(1), 33-38.
Jemal, A., Siegel, R., Ward, E., Murray, T., Xu, J., & Thun, M. J. (2007). Cancer statistics,
2007. CA: a cancer journal for clinicians, 57(1), 43-66.
John, C. R., & Douglas, R. G. (2011). Apoptosis: Physiology and Pathology.
Kim, W. J., Veriansyah, B., Lee, Y. W., Kim, J., & Kim, J. D. (2010). Extraction of
mangiferin from Mahkota Dewa (Phaleria macrocarpa) using subcritical water.
.Journal of Industrial and Engineering Chemistry, 16(3), 425-430.
Kinghorn, A. D., & Balandrin, M. F. (1993). Human medicinal agents from plants.
American Chemical Society (ACS).
Kintzios, & Barberaki. (2004). a theory expressed in cancer.
Kleinsmith, L. J. (2006). Principles of cancer biology. Benjamin-Cummings Pub Co.
Krysko, D. V., Vanden Berghe, T., D’Herde, K., & Vandenabeele, P. (2008). Apoptosis
and necrosis: detection, discrimination and phagocytosis. Methods,44(3), 205-
221.
Kumar, S. (Ed.). (1998). Apoptosis: Mechanisms and Role in Disease: Mechanisms and
Role in Disease (Vol. 2). Springer.
Kurnia, D., Akiyama, K., & Hayashi, H. (2008). 29-Norcucurbitacin derivatives isolated
from the Indonesian medicinal plant, Phaleria macrocarpa (Scheff.) Boerl.
Bioscience, biotechnology, and biochemistry, 72(2), 618-620.
Lewis, K. J. (Ed.). (2003). Principles of Cancer Biology.
Mahavorasirikul, W., Viyanant, V., Chaijaroenkul, W., Itharat, A., & Na-Bangchang, K.
(2010). Cytotoxic activity of Thai medicinal plants against human
cholangiocarcinoma, laryngeal and hepatocarcinoma cells in vitro. BMC
complementary and alternative medicine, 10(1), 55.
Malek, S. N. A., Phang, C. W., Ibrahim, H., Abdul Wahab, N., & Sim, K. S. (2011).
Phytochemical and cytotoxic investigations of Alpinia mutica rhizomes.
Molecules, 16(1), 583-589.
Masud, M. A. (2009). Effect of Bioflavonoids Acacetin and Luteolin on HO-1 Human
Melanoma Cancer Cells (Doctoral dissertation, LONG ISLAND UNIVERSITY,
THE BROOKLYN CENTER).
Mosmann, T. (1983). Rapid colorimetric assay for cellular growth and survival:
application to proliferation and cytotoxicity assays. Journal of immunological
methods, 65(1), 55-63.
Nahleh, Z., & Tabbara, I. A. (2003). Complementary and alternative medicine in breast
cancer patients. Palliative & supportive care, 1(03), 267-273.
167
Novetiana, M., (2002). Uji Toksisitas Buah Phaleria macrocarpa (Scheff.) Boerl.
Terhadap Artemia salina Leach. serta Profil Kromatografi Lapis Tipis Ekstrak
Aktif. Paper presented at the Skripsi Farmasi UGM, Yogyakarta.
Oshimi, S., Zaima, K., Matsuno, Y., Hirasawa, Y., Iizuka, T., Studiawan, H., & Morita,
H. (2008). Studies on the constituents from the fruits of Phaleria macrocarpa.
Journal of natural medicines, 62(2), 207-210.
Potten, C. (2004). Apoptosis: the life and death of cells. Cambridge University Press.
Petty, R. D., Sutherland, L. A., Hunter, E. M., & Cree, I. A. (1995). Comparison of MTT
and ATP‐based assays for the measurement of viable cell number. Journal of
bioluminescence and chemiluminescence, 10(1), 29-34.
Petty, R. D., Sutherland, L. A., Hunter, E. M., & Cree, I. A. (1995). Comparison of MTT
and ATP‐based assays for the measurement of viable cell number. Journal of
bioluminescence and chemiluminescence, 10(1), 29-34.
Potten, C. (2004). Apoptosis: the life and death of cells. Cambridge University Press.
Qiang, X. (2010). Investigation of programmed cell death mechanisms in Arabidopsis
roots during colonization with Piriformospora indica.
Riwanto, I., Budijitno, S., Dharmana, E., Handojo, D., Prasetyo, S. A., Eko, A., ... &
Prasetyo, B. (2011). Effect of phaleria macrocarpa supplementation on apoptosis
and tumor growth of C3H mice with breast cancer under treatment with
adriamycin-cyclophosphamide. International surgery, 96(2), 164-170.
Reed, J. C. (1998). Bcl-2 family proteins. Oncogene, 17(25), 3225-3236.
Reed, J. C., & Pellecchia, M. (2005). Apoptosis-based therapies for hematologic
malignancies. Blood, 106(2), 408-418.
Saufi, A., von Heimendahl, C. B., Alfermann, A. W., & Fuss, E. (2008). Stereochemistry
of Lignans in Phaleria macrocarpa (Scheff.) Boerl. Zeitschrift für
Naturforschung. C, A journal of biosciences, 63(11), 13.
Scorrano, L., Oakes, S. A., Opferman, J. T., Cheng, E. H., Sorcinelli, M. D., Pozzan, T.,
& Korsmeyer, S. J. (2003). BAX and BAK regulation of endoplasmic reticulum
Ca2+: a control point for apoptosis. Science, 300(5616), 135-139.
Sellers, J. R., Cook, S., & Goldmacher, V. S. (1994). A cytotoxicity assay utilizing a
fluorescent dye that determines accurate surviving fractions of cells. Journal of
immunological methods, 172(2), 255-264.
Sugiwati, S., Setiasih, S., & Afifah, E. (2009). Antihyperglycemic activity of the mahkota
dewa leaf. Extracts as an alpha-glucosidase inhibitor. J Logika, 13(2), 74-78.
Sumarningsih, P. (2002). Uji Toksisitas Biji Phaleria macrocarpa (Scheff.) Boerl.
Terhadap Artemia salina Leach. serta Profil Kromatografi Lapis Tipis. Paper
presented at the Skripsi Farmasi UGM, Yogyakarta.
168
Susanthy, E. (2005). N-Hexane Extract Cytotoxicity Beans and Meat Mahkota Dewa
Fruit (Phaleria macrocarpa [Scheff.] Boerl.) Against HeLa and Myeloma Cell
Line. Jurusan Kimia FMIPA UGM, 47-50.
Susilawati, S., Matsjeh, S., Pranowo, H. D., & Anwar, C. (2011). Antioxidant Activity of
2, 6, 4’-trihydroxy4-methoxy benzophenone form Ethyl Acetate Extract of Leaves
of Makhota Dewa (Phaleria macrocarpa (Scheff.) Boerl.). Indonesian Journal of
Chemistry, 11(2), 180-185.
Swanson, S. M., & Pezzuto, J. M. (1990). Bioscreening technique for cytotoxicity
potential and ability to inhibit macromolecule biosynthesis. Drug bioscreening:
drug evaluation techniques in pharmacology, 273-297.
Tambunan, R. M., & Simanjuntak, P. (2006). Determination of chemical structure of
antioxidant compound benzophenon glycoside from n-butanol extract of the fruits
of Mahkota Dewa [Phaleria macrocarpa (Scheff) Boerl.]. Majalah Farmasi
Indones, 17(4), 184-189.
Tandrasasmita, O. M., Lee, J. S., Baek, S. H., & Tjandrawinata, R. R. (2010). Induction
of cellular apoptosis in human breast cancer by DLBS1425, a Phaleria
macrocarpa compound extract, via down-regulation of PI3-kinase/AKT pathway.
Cancer biology & therapy, 10(8), 814-823.
Tang, S. (2005). Bioactive Natural Products (Doctoral dissertation, Virginia Polytechnic
Institute and State University).
Tjandrawinata, R. R., Arifin, P. F., Tandrasasmita, O. M., Rahmi, D., & Aripin, A. (2010).
DLBS1425, a Phaleria macrocarpa (Scheff.) Boerl. Extract confers anti
proliferative and pro-apoptosis effects via eicosanoid pathway. J Exp Ther Oncol,
8(3), 187-201.
Triastuti, A., & Choi, J. W. (2008). Protective effects of ethyl acetate fraction of Phaleria
macrocarpa (Scheff) Boerl. on oxidative stress asssociated with alloxan-induced
diabetic rats. Jurnal Ilmiah Farmasi 5(1).
Wardani, L. (2005). The Effect of Phaleria macrocarpa [Scheff.] Boerl.) Seed and Flesh
Fruit Extract to P53 and Bcl-2 Gene Expression in HeLa cell Line.
Wei, M. C., Zong, W. X., Cheng, E. H. Y., Lindsten, T., Panoutsakopoulou, V., Ross, A.
J., & Korsmeyer, S. J. (2001). Proapoptotic BAX and BAK: a requisite gateway
to mitochondrial dysfunction and death. Science, 292(5517), 727-730.
Wijayani, W. (2005). Sitotoksisitas Minyak Atsiri Biji dan Daging Buah Mahkota Dewa
(Phaleria macrocarpa [Scheff.] Boerl.) Terhadap Myeloma Cell Line dan HeLa
Cell Line Serta Identifikasi Senyawa Minyak Atsiri dengan Kromatografi Gas-
Spektrometri Massa (GC-MS). Indonesia: Skripsi FMIPA UGM.
Winarno, H. (2010). Benzophenone glucoside isolated from the ethyl acetate extract of
the bark of mahkota dewa [Phaleria macrocarpa (Scheff.) Boerl.] and its
inhibitory activity on leukemia L1210 cell line. Indonesian Journal of Chemistry,
9(1), 142-145.
169
Wong, C. K., Bao, Y. X., Wong, E. L. Y., Leung, P. C., Fung, K. P., & Lam, C. W. K.
(2005). Immunomodulatory activities of Yunzhi and Danshen in post-treatment
breast cancer patients. The American journal of Chinese medicine, 33(03), 381-
395.
Yosie, A., Effendy, M. A. W., Sifzizul, T. M. T., & Habsah, M. (2011). Antibacterial,
radical-scavenging activities and cytotoxicity properties of Phaleria macrocarpa
(Scheff.) Boerl leaves in HEPG2 cell lines. Journal of Pharmaceutical Sciences
and Research, 2, 1700-1706.
Yuan, J., & Kroemer, G. (2010). Alternative cell death mechanisms in development and
beyond. Genes & development, 24(23), 2592-2602.
Yuan, Z., Long, C., Junming, T., Qihuan, L., Youshun, Z., & Chan, Z. (2012). Quercetin-
induced apoptosis of HL-60 cells by reducing PI3K/Akt. Molecular biology
reports, 39(7), 7785-7793.
Zangemeister-Wittke, U., Leech, S. H., Olie, R. A., Simões-Wüst, A. P., Gautschi, O.,
Luedke, G. H., ... & Stahel, R. A. (2000). A novel bispecific antisense
oligonucleotide inhibiting both bcl-2 and bcl-xL expression efficiently induces
apoptosis in tumor cells. Clinical cancer research, 6(6), 2547-2555.
Zhang, Y. B., Xu, X. J., & Liu, H. M. (2006). Chemical constituents from Mahkota dewa.
Journal of Asian natural products research, 8(1-2), 119-123.
170
LIST OF PUBLICATION
Lay, M. M., Karsani, S. A., & Abd Malek, S. N. (2014). Induction of Apoptosis of 2, 4′,
6-Trihydroxybenzophenone in HT-29 Colon Carcinoma Cell Line. BioMed
research international, 2014.
Lay, M. M., Karsani, S. A., & Malek, S. N. A. (2014). 1-(2, 6-Dihydroxy-4-
methoxyphenyl)-2-(4-hydroxyphenyl) Ethanone-Induced Cell Cycle Arrest in
G1/G0 in HT-29 Cells Human Colon Adenocarcinoma Cells. International
journal of molecular sciences, 15(1), 468-483.
Lay, M. M., Karsani, S. A., Banisalam, B., Mohajer, S., & Abd Malek, S. N. (2014).
Antioxidants, Phytochemicals, and Cytotoxicity Studies on Phaleria macrocarpa
(Scheff.) Boerl Seeds. BioMed research international, 2014.
Lay, M. M., Karsani, S. A., Mohajer, S., & Malek, S. N. A. (2014). Phytochemical
constituents, nutritional values, phenolics, flavonols, flavonoids, antioxidant and
cytotoxicity studies on Phaleria macrocarpa (Scheff.) Boerl fruits. BMC
Complementary and Alternative Medicine, 14(1), 152.
Mohajer, S., Taha, R. M., Elias, H., Kumari, A., & Lay, M. M. (2013). Early detection
of superior varieties of sainfoin (Onobrychis sativa) through in vivo and in vitro
studies. SABRAO Journal of Breeding and Genetics, 45(3), 391-399.
Mohajer, S., Taha, R. M, Lay, M. M., Esmaeili, A. K., & Khalili, M. (2014). Stimulatory
Effects of Gamma Irradiation on Phytochemical Properties, Mitotic Behaviour
and Nutritional Composition of Sainfoin (Onobrychis viciifoli Scop.). The
Scientific world journal. (Accepted).
171
LIST OF CONFERENCES AND SEMINARS
1. 5th Global Summit on Medicinal & Aromatic Plants, “Phytochemical
constituents, phenolics, flavonols, flavonoids, antioxidant and cytotoxicity studies
on Phaleria macrocarpa (Scheff.) Boerl”, Sarawak, Malaysia, 8-12 December
2013 (Oral presenter)
2. International conference on frontiers in Biological Sciences (InCoFIBS-2010),
“Cytotoxic activity of Phaleria macrocarpa (Sheff.) Boerl”, Rmykela, India, 01-
03 October 2010 (poster presenter)
3. One-Day scientific & Motivation Seminar 2010, crystal crown hotel, Petaling
Jaya, Malaysia, 22nd December 2010 (Poster presenter)
4. IDB scholars, International Islamic University Malaysia (IIUM), 2011 (16 July
2011) (participant)
172
LIST OF COURSE AND WORKSHOP
PARTICIPATIONS
1. 2DGE Introductory Workshop, Institute of Biological Science, University of
Malaya 20-21st September 2011
2. Academic writing for postgraduate students, Faculty of Language and Linguistic,
University of Malaya, (7January 2010-1 April 2010)
3. Managing Candidature Workshop, IPS, University of Malaya, 22 June 2010
4. Basic principle and application of Real-Time PCR-CFX96 Real-Time PCR
System, Bio- RAD and Chemoscience 3rd and 4th January 2011
5. Endnote Training Cmyse, University of Malaya, Malaysia, 2011
6. SPSS software analysis Training Cmyse, University of Malaya, Malaysia, 2010

173
LIST OF APPENDICES
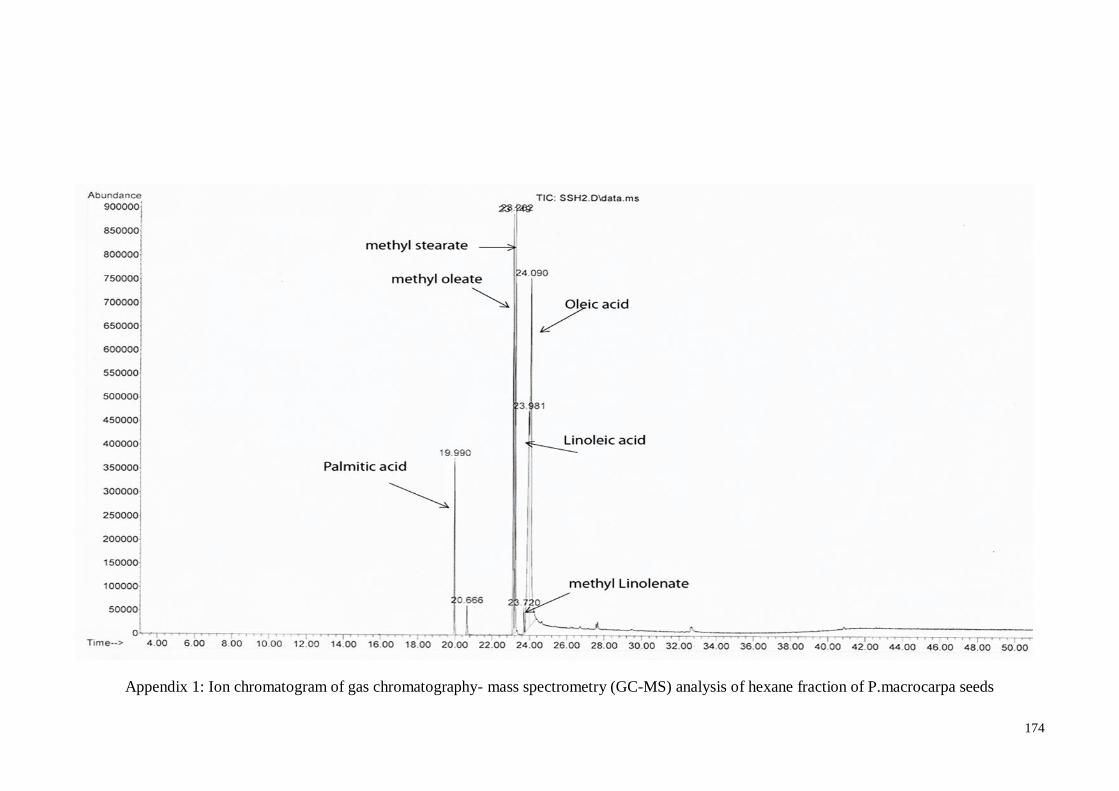
174
Appendix 1: Ion chromatogram of gas chromatography- mass spectrometry (GC-MS) analysis of hexane fraction of P.macrocarpa seeds
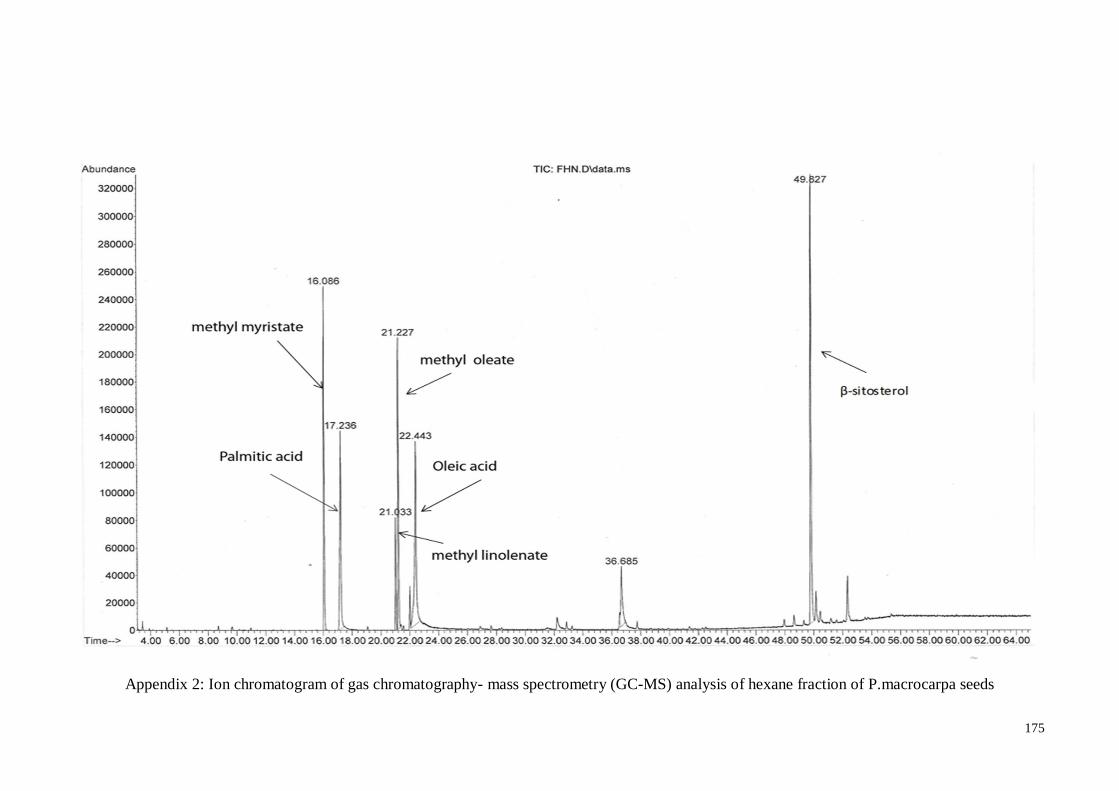
175
Appendix 2: Ion chromatogram of gas chromatography- mass spectrometry (GC-MS) analysis of hexane fraction of P.macrocarpa seeds
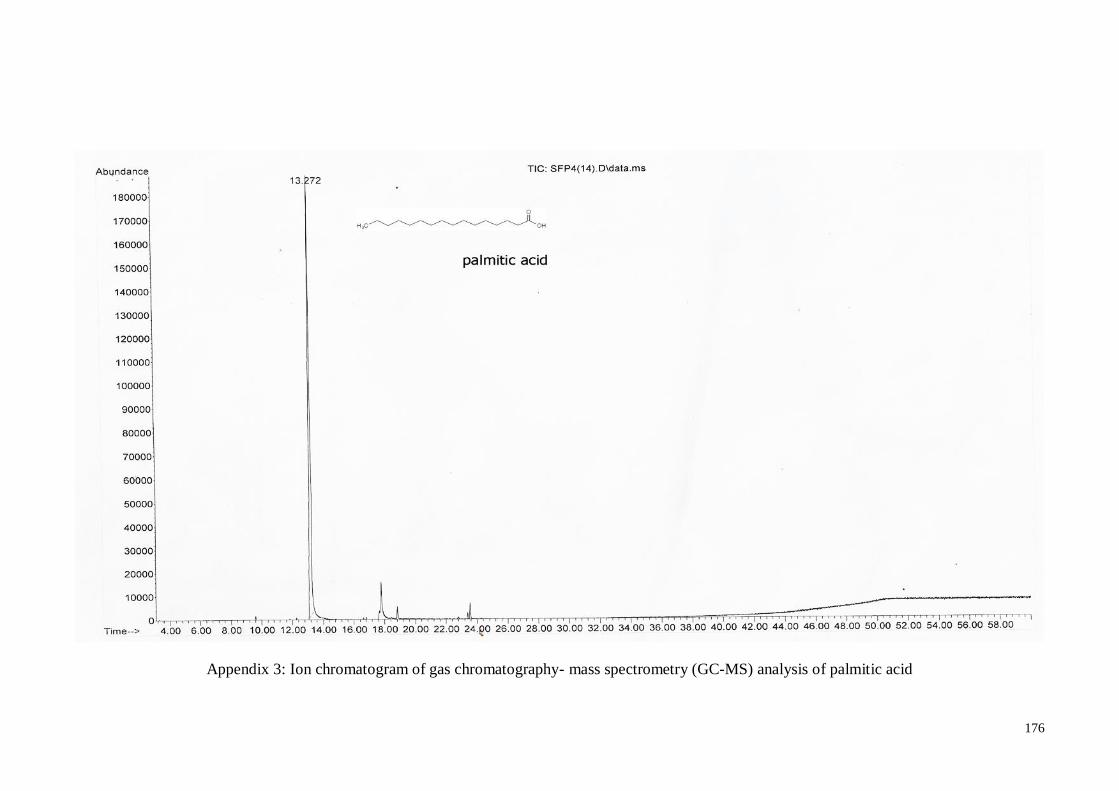
176
Appendix 3: Ion chromatogram of gas chromatography- mass spectrometry (GC-MS) analysis of palmitic acid
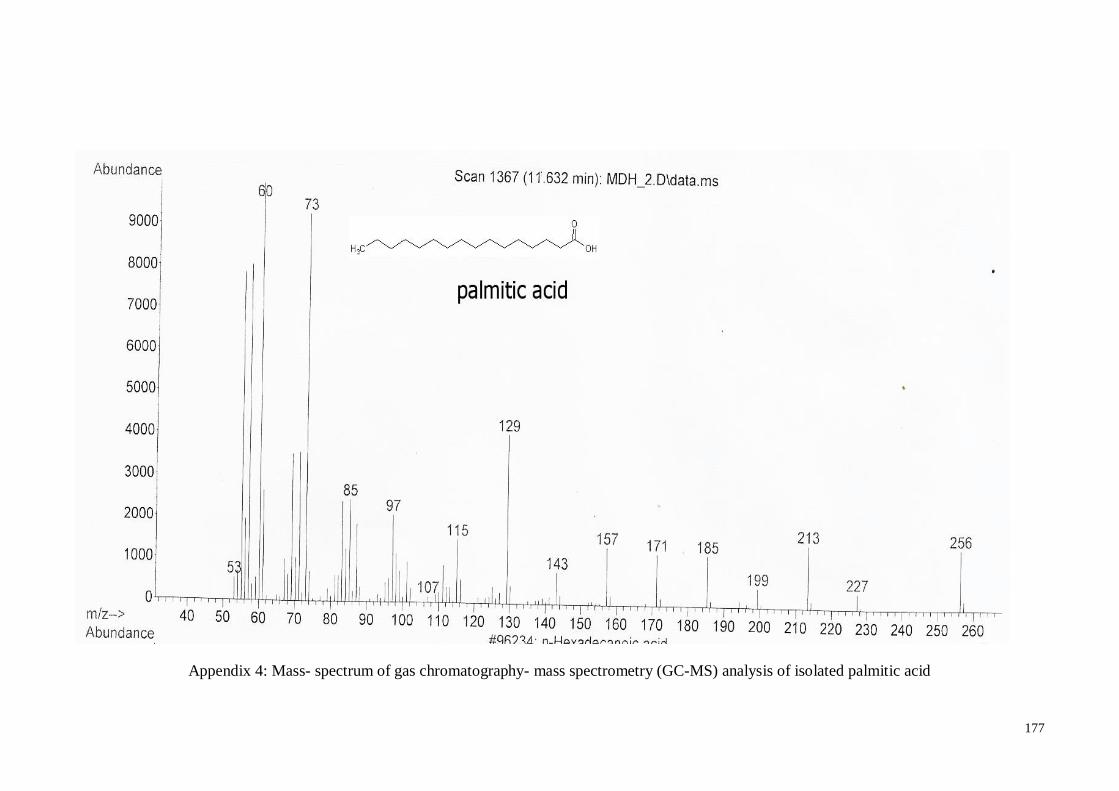
177
Appendix 4: Mass- spectrum of gas chromatography- mass spectrometry (GC-MS) analysis of isolated palmitic acid
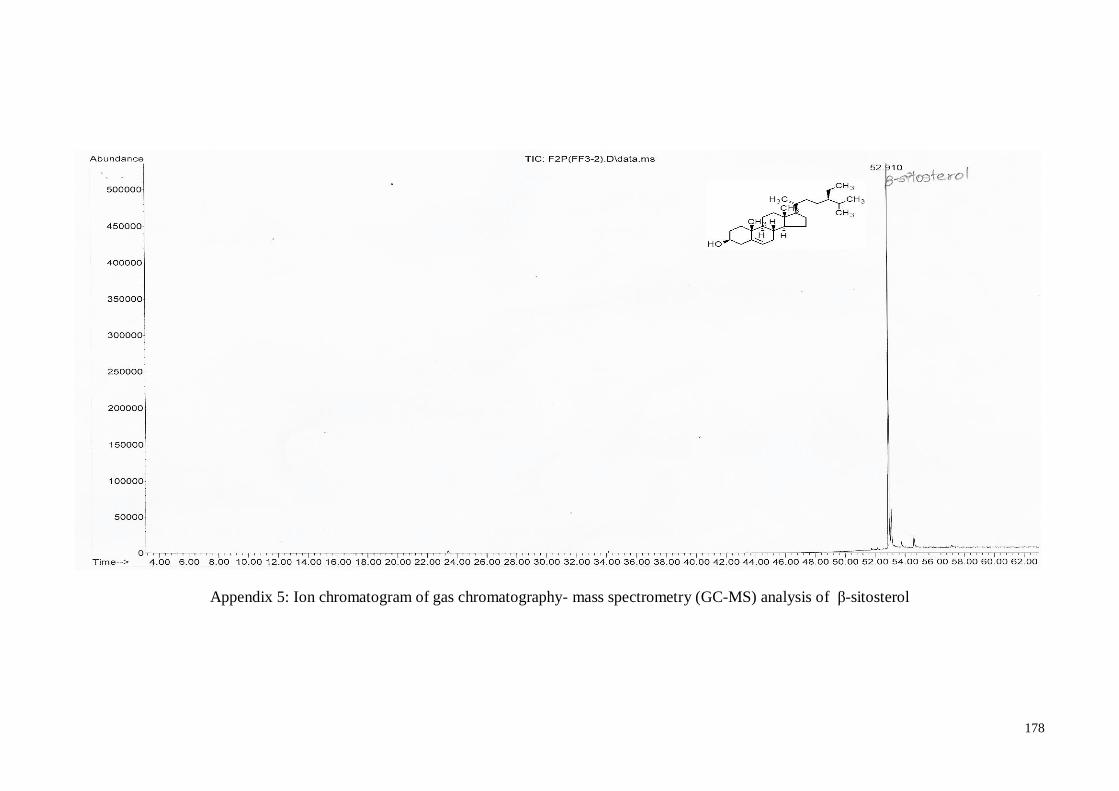
178
Appendix 5: Ion chromatogram of gas chromatography- mass spectrometry (GC-MS) analysis of β-sitosterol
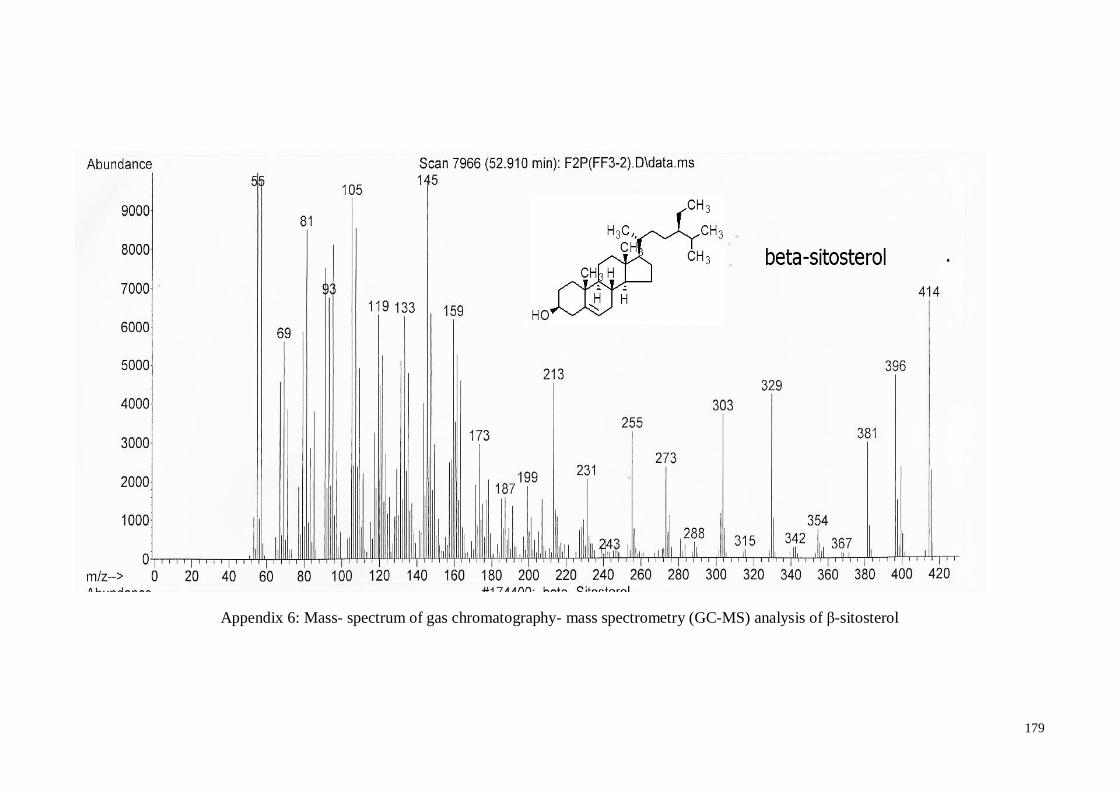
179
Appendix 6: Mass- spectrum of gas chromatography- mass spectrometry (GC-MS) analysis of β-sitosterol
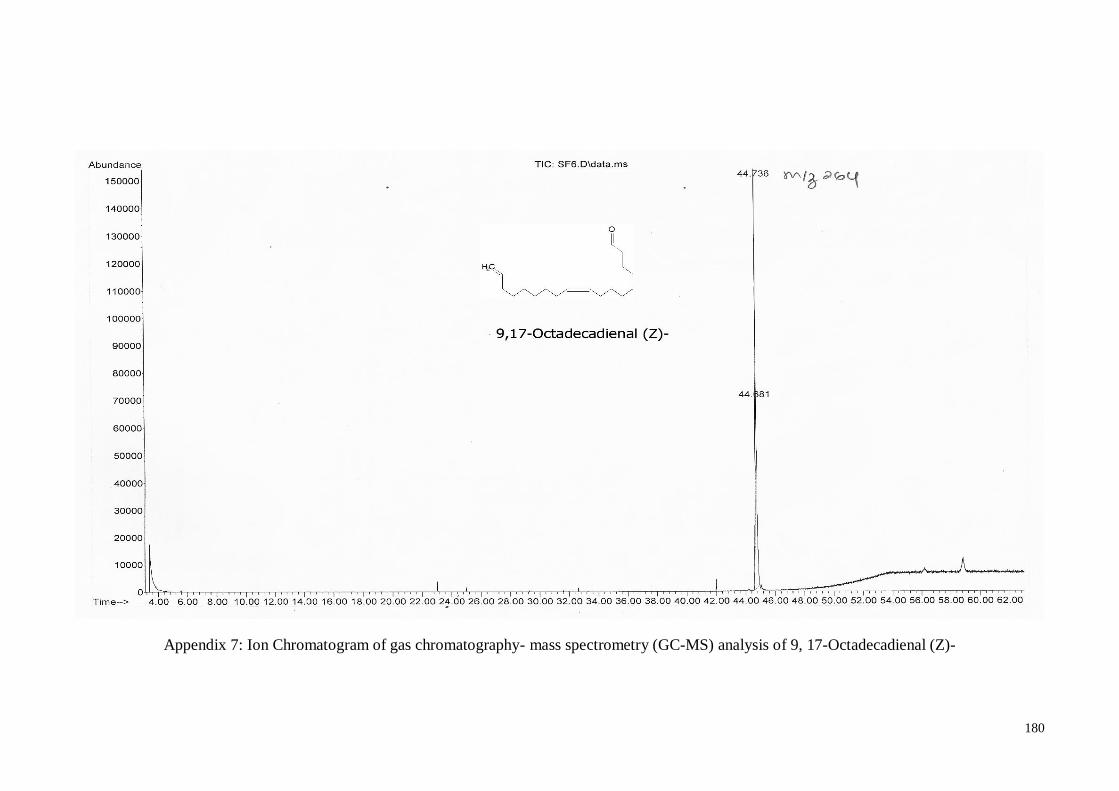
180
Appendix 7: Ion Chromatogram of gas chromatography- mass spectrometry (GC-MS) analysis of 9, 17-Octadecadienal (Z)-
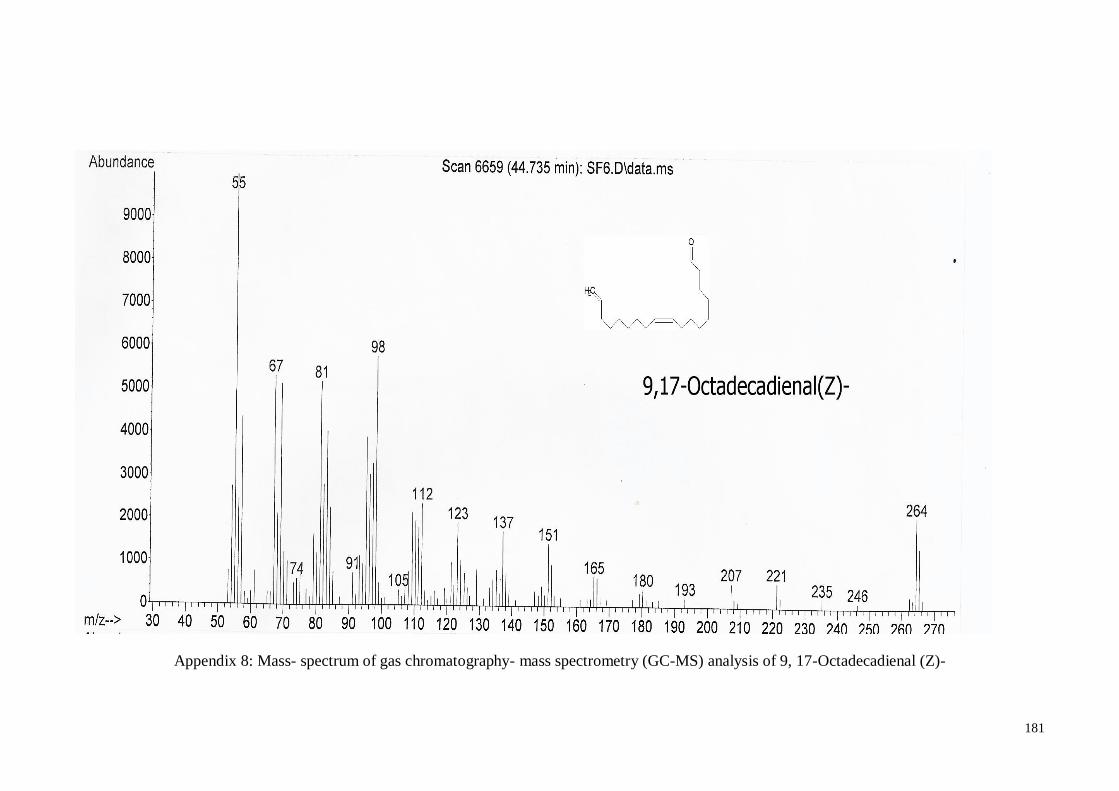
181
Appendix 8: Mass- spectrum of gas chromatography- mass spectrometry (GC-MS) analysis of 9, 17-Octadecadienal (Z)-
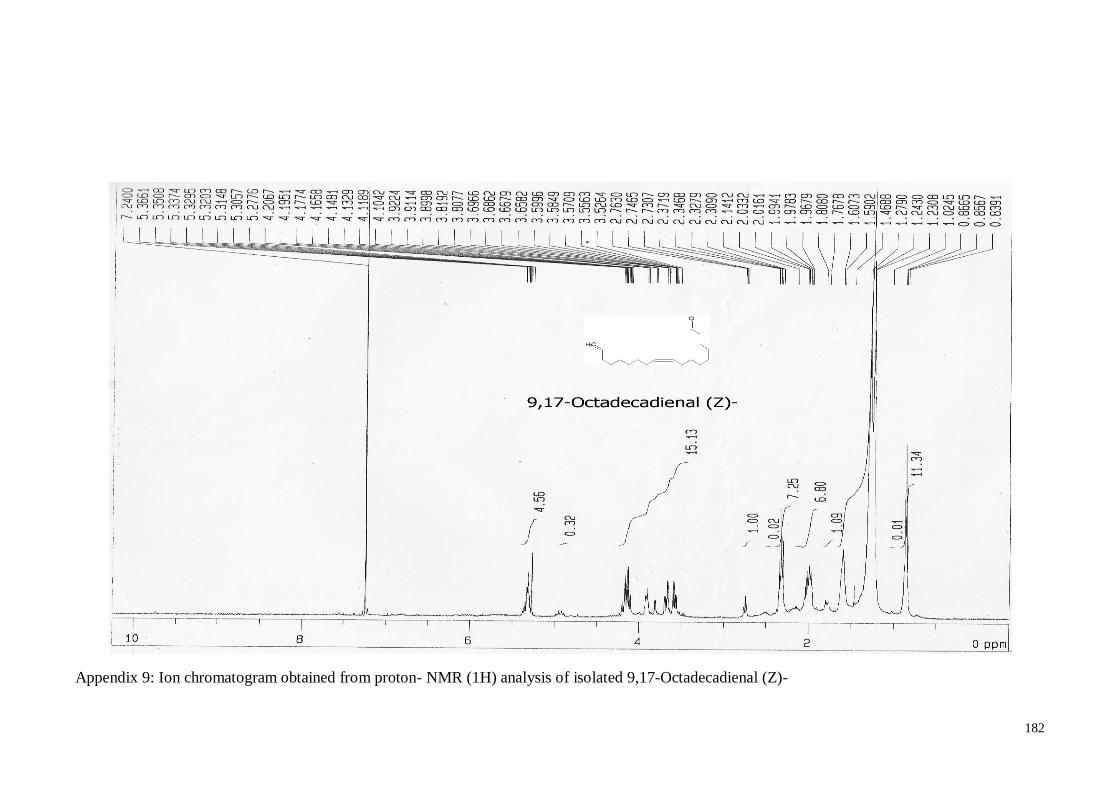
182
Appendix 9: Ion chromatogram obtained from proton- NMR (1H) analysis of isolated 9,17-Octadecadienal (Z)-
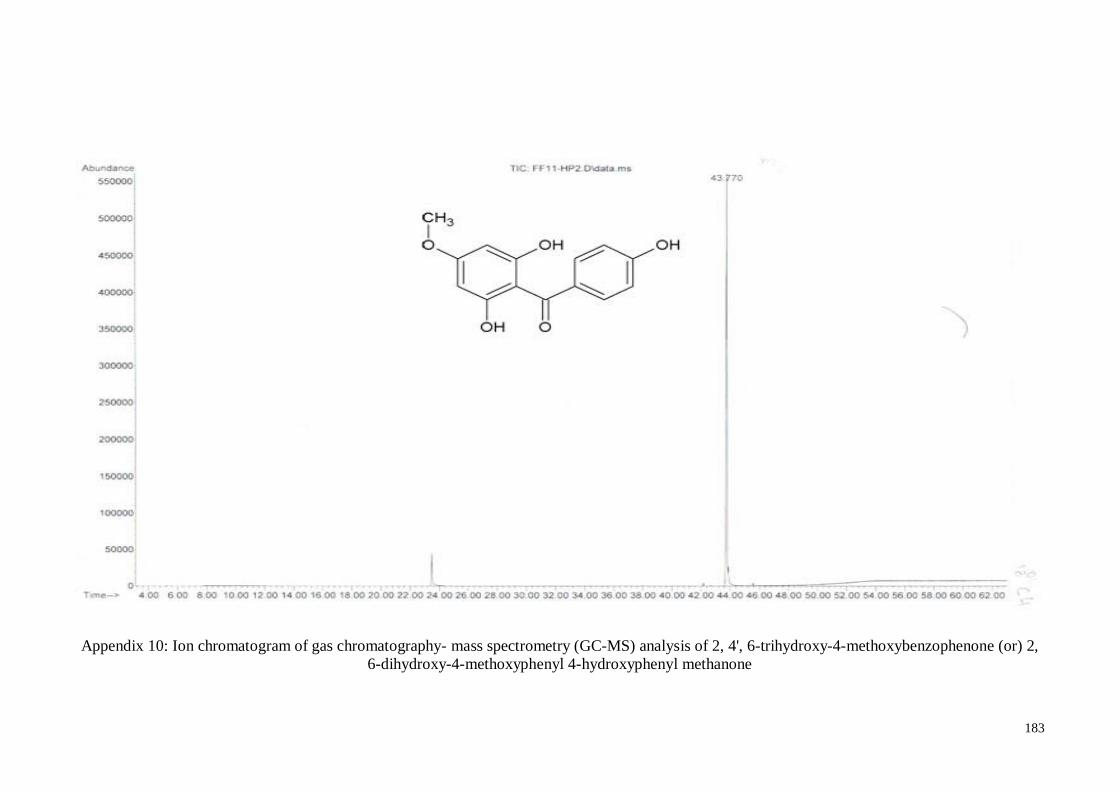
183
Appendix 10: Ion chromatogram of gas chromatography- mass spectrometry (GC-MS) analysis of 2, 4', 6-trihydroxy-4-methoxybenzophenone (or) 2,
6-dihydroxy-4-methoxyphenyl 4-hydroxyphenyl methanone
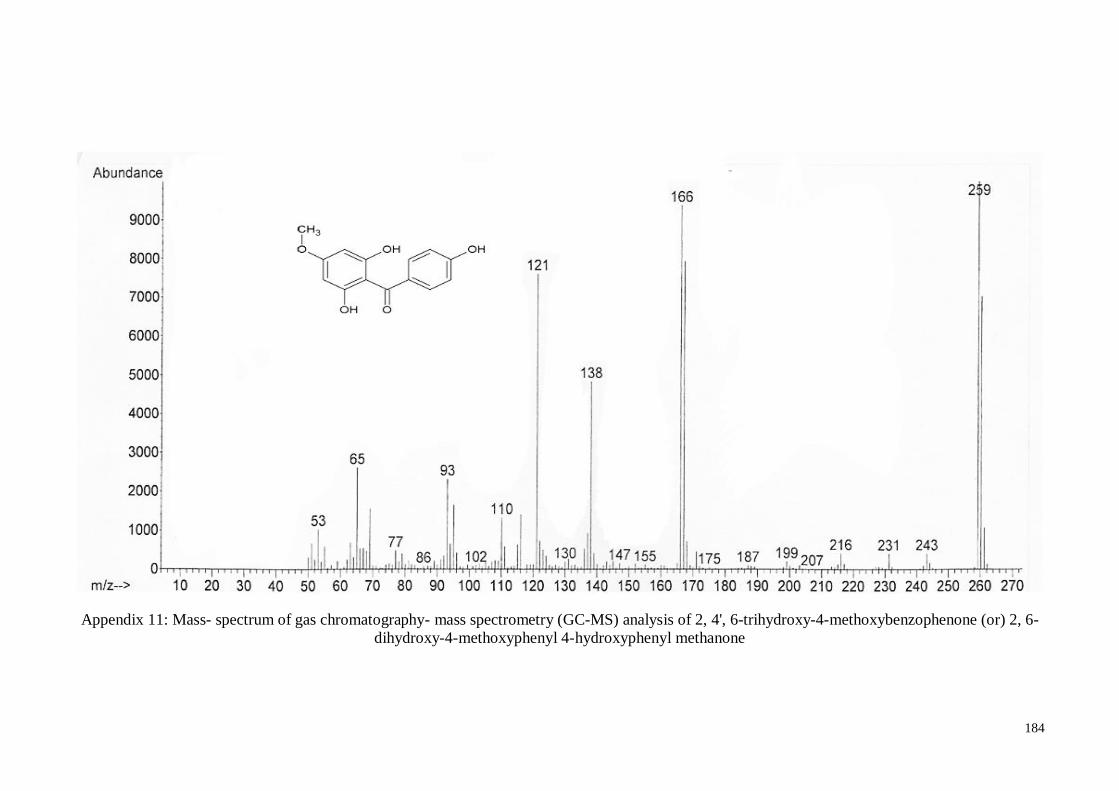
184
Appendix 11: Mass- spectrum of gas chromatography- mass spectrometry (GC-MS) analysis of 2, 4', 6-trihydroxy-4-methoxybenzophenone (or) 2, 6-
dihydroxy-4-methoxyphenyl 4-hydroxyphenyl methanone

185
Appendix 12: Ion chromatogram obtained from proton- NMR (1H) analysis of 2, 4', 6-trihydroxy-4-methoxybenzophenone (or) 2, 6-dihydroxy-4-
methoxyphenyl 4-hydroxyphenyl methanone
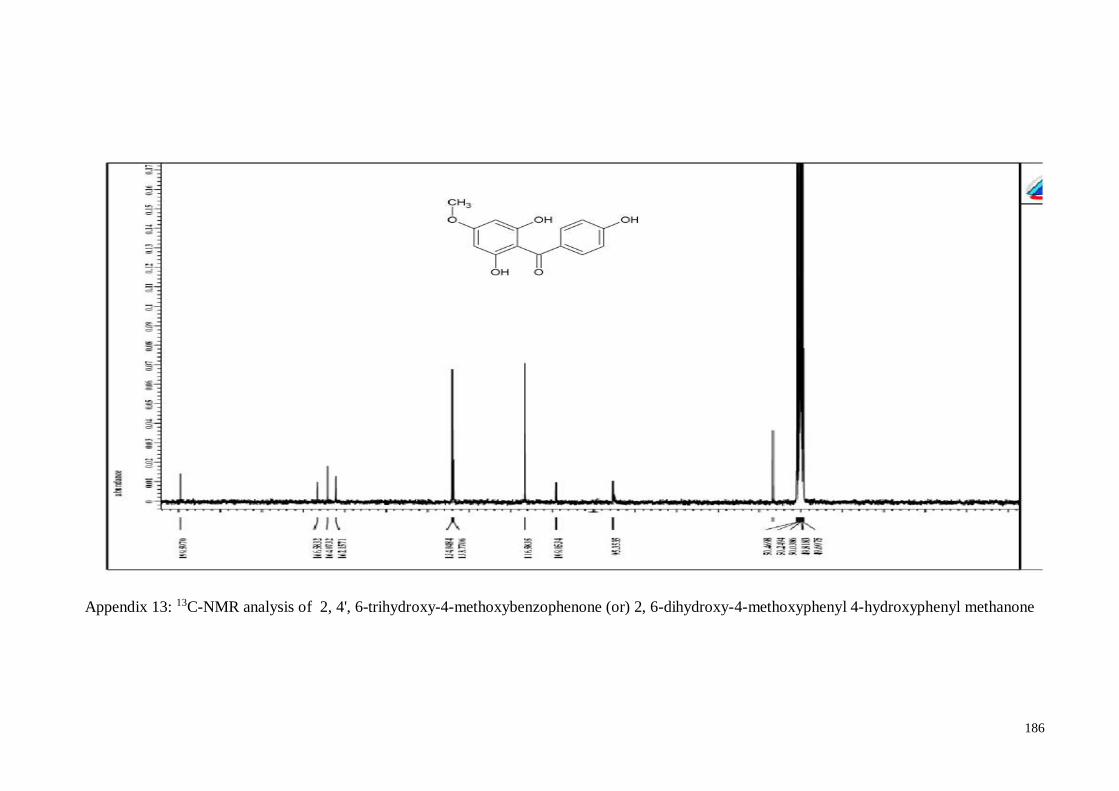
186
Appendix 13: 13C-NMR analysis of 2, 4', 6-trihydroxy-4-methoxybenzophenone (or) 2, 6-dihydroxy-4-methoxyphenyl 4-hydroxyphenyl methanone
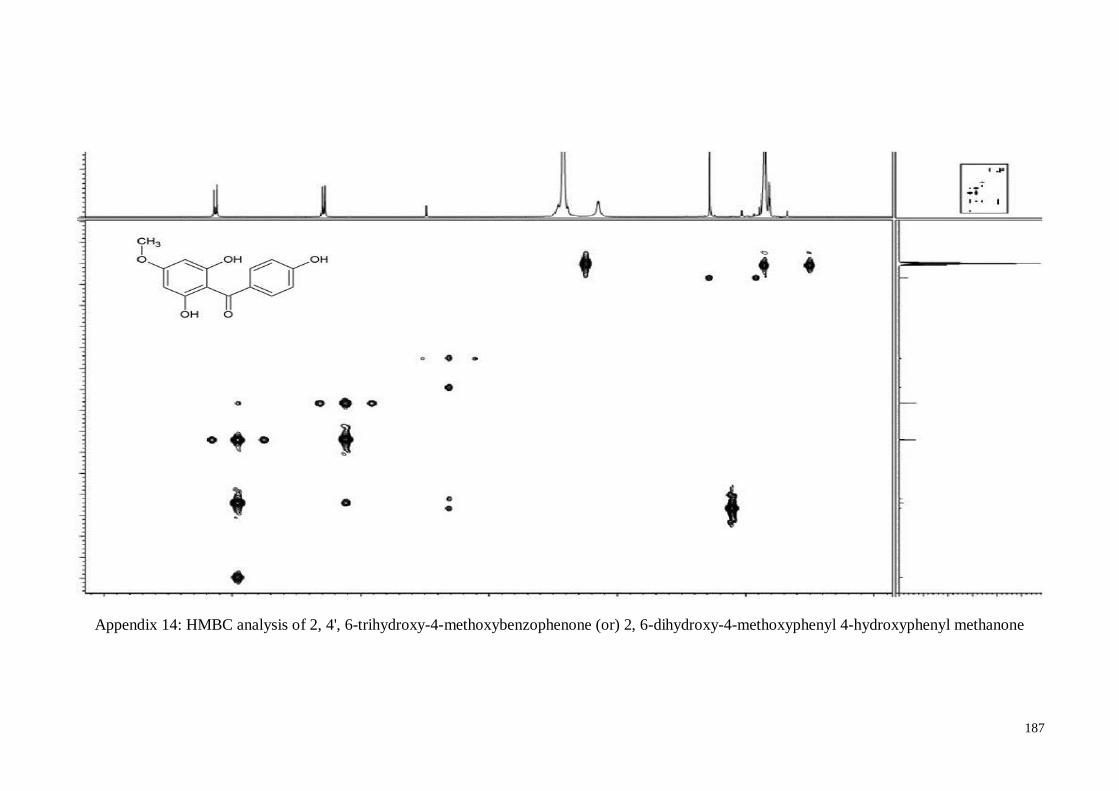
187
Appendix 14: HMBC analysis of 2, 4', 6-trihydroxy-4-methoxybenzophenone (or) 2, 6-dihydroxy-4-methoxyphenyl 4-hydroxyphenyl methanone
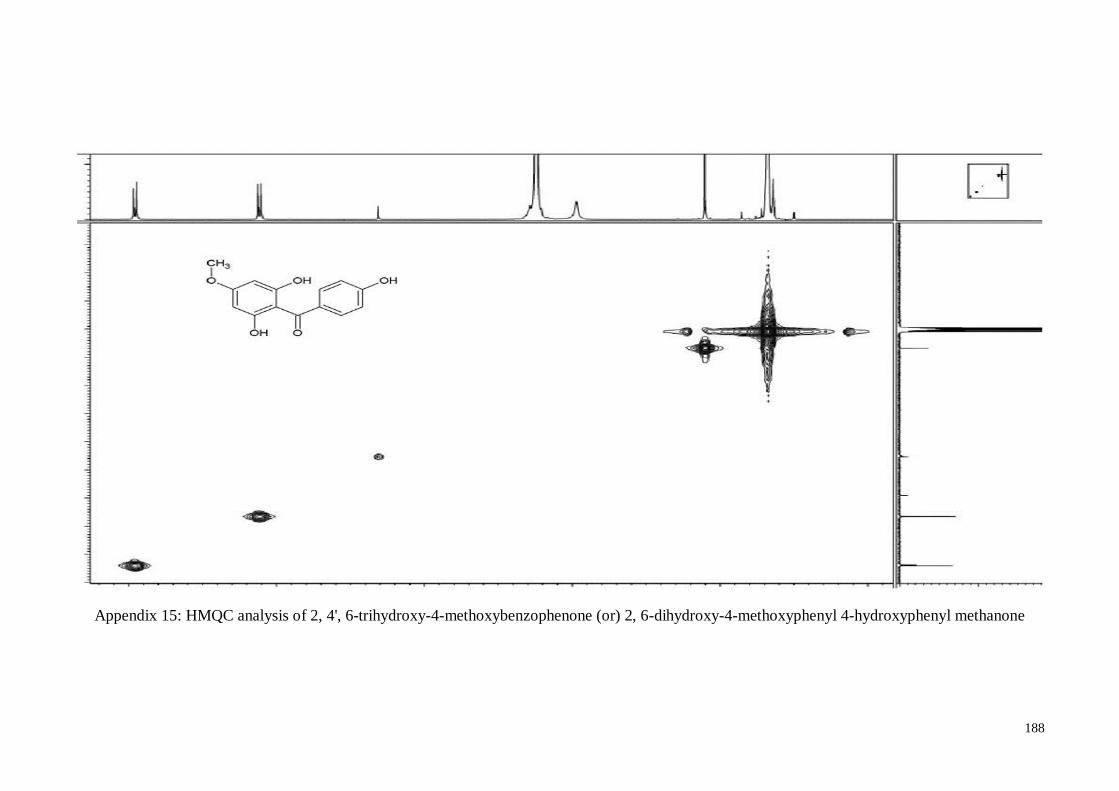
188
Appendix 15: HMQC analysis of 2, 4', 6-trihydroxy-4-methoxybenzophenone (or) 2, 6-dihydroxy-4-methoxyphenyl 4-hydroxyphenyl methanone
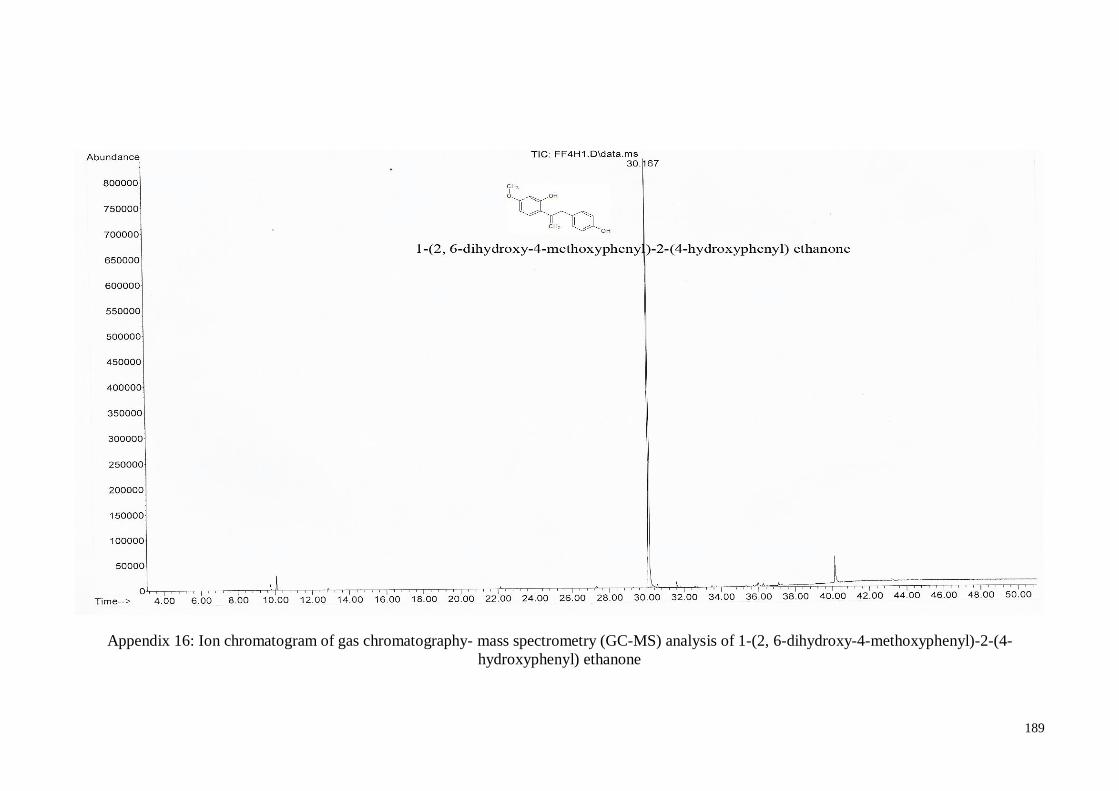
189
Appendix 16: Ion chromatogram of gas chromatography- mass spectrometry (GC-MS) analysis of 1-(2, 6-dihydroxy-4-methoxyphenyl)-2-(4-
hydroxyphenyl) ethanone
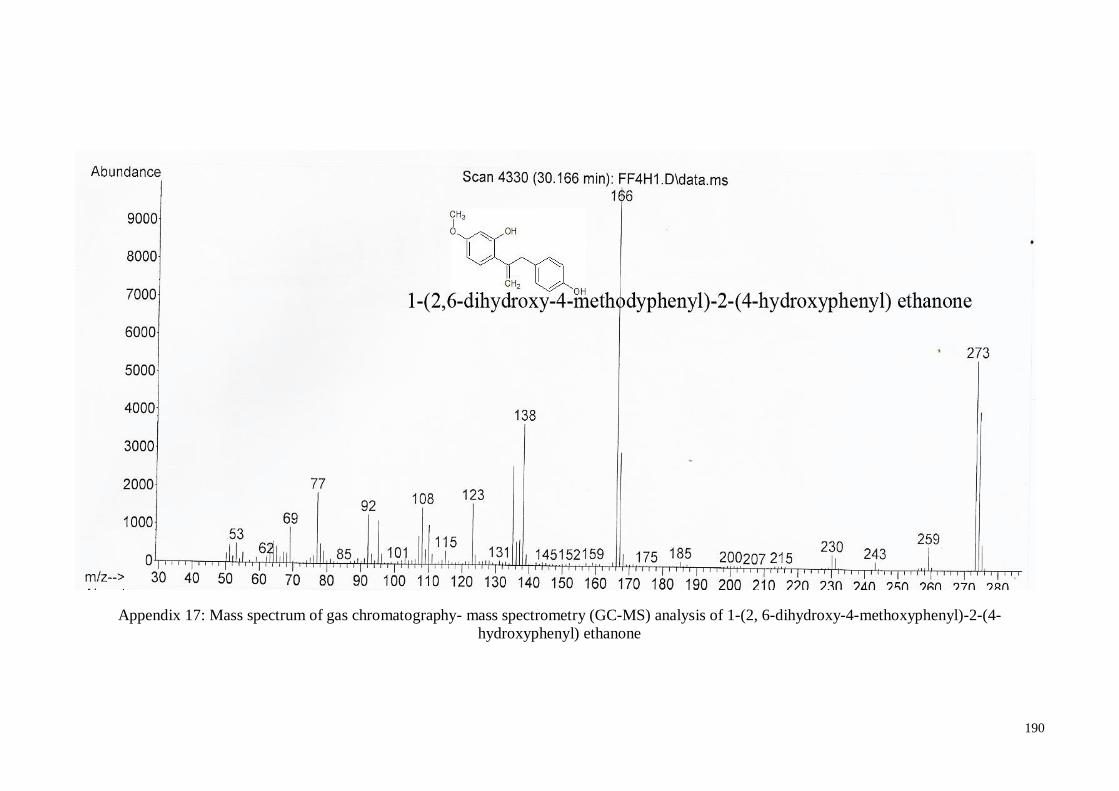
190
Appendix 17: Mass spectrum of gas chromatography- mass spectrometry (GC-MS) analysis of 1-(2, 6-dihydroxy-4-methoxyphenyl)-2-(4-
hydroxyphenyl) ethanone