Embed Size (px)
Citation preview

Channel Movement of
Meandering Indiana Streams
GEOLOGICAL SURVEY PROFESSIONAL PAPER 732-A
Prepared in cooperation with the
State of Indiana Department of
Natural Resources

Channel Movement of
Meandering Indiana StreamsBy JAMES F. DANIEL
PHYSIOGRAPHIC AND HYDRAULIC STUDIES OF RIVERS
GEOLOGICAL SURVEY PROFESSIONAL PAPER 732-A
Prepared in cooperation with the
State of Indiana Department of J J- tj
Natural Resources
UNITED STATES GOVERNMENT PRINTING OFFICE, WASHINGTON : 1971

UNITED STATES DEPARTMENT OF THE INTERIOR
ROGERS C. B. MORTON, Secretary
GEOLOGICAL SURVEY
W. A. Radlinski, Acting Director
Library of Congress catalog-card No. 74-175750
For sale by the Superintendent of Documents, U.S. Government Printing OfficeWashington, D.C. 20402 - Price 35 cents (paper cover)
Stock Number 2401-1221

CONTENTS
Abstract .........................................................Introduction .................................................Concepts .........................................................
Movement defined ...............................The sine-generated curve ...........Moving reference axis ...............Observed modes of movement
Theoretical mechanics of movement .Impulse momentum ........_...._..Channel-forming discharge .......
Page.Al
122223556
Concepts ContinuedTheoretical mechanics of movement Continued
Channel-forming discharge redefined .........Field investigation ..........................................................
Study sites .................................................................Data analysis .............................................................
Interpretive discussion ...................................................Individual sites .........................................................General conclusions ...................................................
Summary ............................................................................Selected references ...........................................................
Page
A6779
1414151717
ILLUSTRATIONS
PageFIGURE 1. Graph showing sine curve of the best fit to data for the White River near Worthington site ................... A2
2. Diagram showing general mechanism of meander loop movement ................................................................ 33. Diagrams showing effects of stationary and (or) translating end points on general mechanisms of
meander loop movement .............................................................................................................................. ..... 44. Sketch identifying elements of the momentum concept .................................................................................... 55. Graph showing traveltime for the East Fork White River between U.S. Geological Survey gages at
Columbus and Seymour ...................................................................................................................................... 76. Map of Indiana showing location of investigated meander sites and gaging stations ............................ 8
7-12. Plan-view channel patterns for:7. Paw Paw Creek near Urbana ...................................................................................................................... 98. Carpenter Creek near Egypt ...................................................................................................................... 99. White River near Martinsville .................................................................................................................... 10
10. White River near Worthington .................................................................................................................... 1111. East Fork White River near Vallonia...................................................................................................... 1212. Muscatatuck River near Austin ................................................................................................................. 13
13. Map showing definition of actual end points from theoretical loop, plotted on 1937 loop, for the WhiteRiver near Worthington site ............................................................................................................................ 13
14-20. Graphs:14. Path-length increase versus flow volume for the White River near Worthington site .............. 1315. Path-length increase versus flow volume for the White River near Martinsville site .............. 1316. Path-length increase versus flow volume for the East Fork White River near Vallonia site..... 1317. Accumulated flow volume versus water year for the White River near Worthington site .......... 1518. Probable relation of path-length increase to silt-clay percentage .................................................... 1519. Dimensionless relation of path-length increase and flow data to silt-clay percentage ................ 1620. Dimensionless relation of path-length increase and flow data to width-depth ratio .................... 16
TABLES
TABLE 1. Selected site characteristics ......................................................................2. Suspended-sediment loads for East Fork White River at Seymour
PageA7 14
in


PHYSIOGRAPHIC AND HYDRAULIC STUDIES OF RIVERS
CHANNEL MOVEMENT OF MEANDERING INDIANA STREAMS
By JAMES F. DANIEL
ABSTRACT
The process of channel movement in a meander system involves rotation and translation of meander loops and an increasing path length. The amount of path-length increase is directly proportional to the impulse supplied by discharge and is inversely proportional to the silt-clay percentage of the material composing the channel perimeter.
Comparable paths have been obtained by standardizing measurements with a sine-generated curve and a moving reference axis. Analysis of previous investigations and time- of-travel data indicates that the discharge effective in chan nel formation consists of the range beginning just higher than the average and continuing throughout all higher dis charges. Of six field sites investigated, three meander sys tems had path-length increases of sufficient magnitude to correlate with above-average discharge volume, one had no discernible change over a 30-year period, and two had changes which were too small for correlation owing to the short period of time covered by the available data.
Because of the consistency of yearly above-average dis charge volumes, it was possible to develop a general relation between path-length increase per thousand cubic-feet-per- second-days per square mile of drainage area above average discharge and the width-depth ratio of the channel. Little progress was made toward defining relationships for rota tion and translation.
INTRODUCTION
For many years the planimetric meander form has both intrigued and perplexed geomorphologists. Each investigation has added some facet to the knowledge of meanders. Today, while no one will claim that all the answers are known, the state of knowledge is such that the physical characteristics of meanders can be described in mathematical models with a reasonable degree of accuracy. Laboratory and field investigations, such as the one by Toebes and Sooky
(1966), have provided information about the me chanics of flow within a meander, while theoretical investigations, such as those by Langbein and Leo pold (1966) and Scheidegger and Langbein (1966), have delved into statistical concepts related to the development of meanders.
Much information is available about why meanders begin and about meanders in a static situation. How ever, a meander is not a static entity. It is dynamic in every respect. Valuable farmland in the flood plains of meandering streams is lost or changes ownership, and powerplants next to eroding banks require expensive bank stabilization, as do highway bridges and other structures which are in the path of moving, meandering channels. Investigations are needed regarding how, how much, and at what rate meanders move. Relationships need to be developed with which movement of meanders can be predicted. It is to these factors, which are of practical impor tance after the initiation of meandering, that this report is addressed.
Many persons have provided assistance to the author during this project, especially Richard F. Hadley, U.S. Geological Survey, Denver, Colo., who performed the field reconnaissance and made many suggestions about data collection. This investigation was conducted with financial cooperation by the Indiana Department of Natural Resources, Division of Water, whose personnel also contributed by sup plying the field surveys for two of the sites investi gated. Most of the personnel of the Indiana District at one time or another aided in the field surveys, often under adverse climatic conditions.
Al

A2 PHYSIOGRAPHIC AND HYDRAULIC STUDIES OF RIVERS
CONCEPTS
It is the thesis of this report that the process of channel movement in a system already in a state of meandering involves rotation and translation of the loops and an increasing path length. Any one or any combination of these forms of movement may occur, depending on the boundary conditions of the loop. Each of the components of movement must be known in order to predict movement. Direction of move ment is related to the impulse required to change flow direction, and rate of movement is related to discharge and grain size of the bed and bank material.
MOVEMENT DEFINED
The Sine-Generated Curve
Historically, the meander pattern has been de scribed as either a sine curve defined by amplitude and wavelength or a series of semicircles defined by radius and wavelength. Many authors have corre lated these parameters with discharge in an attempt to discover regional or universal relationships be tween them. Upon cursory examination of a topo graphic map showing meanders, it is apparent that measurements of their amplitudes, wavelengths, and radii would be very subjective. Each investigator would undoubtedly have a slightly different inter pretation of each of these parameters. The result is that there are many slightly different but similar equations relating these parameters in existing literature. The work of Carlston (1965) did much to rectify some of the discrepancies between equa tions.
Langbein and Leopold (1966) provided a method to remove at least some of the subjectivity from the description of meanders. They showed the best de scription of a meander loop to be a sine-generated curve described by the equation:
o
<t>=<>> sin p 2* (1)
where tf>=the angle of deviation of a tangent at the end of s from the mean downstream direction.
<"=the maximum angle of deviation of path from the mean downstream direction (usually in degrees).
s=a segment of P (in feet).and P=the path distance through one wave
length (usually in feet).By inspection of the example (fig. 1) for the
White River near Worthington, it can be readily seen that a sine curve is the best fit for the data of this meander loop. Although a complete wavelength does
120
-1205 10 15 20 25 30 35
ASSUMED STATIONING OF BANK, IN HUNDREDS OF FEET
FIGURE 1. Sine curve of the best fit to data for the White River near Worthington site, July 5, 1937.
not exist, the meander is uniquely defined by the parameters » and P. This method has been used to describe the path length of the concave bank for movement comparison of the meanders under in vestigation in this report.
Moving Reference Axis
This study was begun using the procedure that cross sections would be surveyed at each site, steel pins would be set within the cross sections, and measurements of erosion and deposition at these pins would be made. After obtaining these movement data, correlations would be made with discharge. This procedure was in fact followed. However, after some insight was gained about the mode of move ment, it was found that this type of data had little applicability to the problem under investigation.
For example, figure 2 shows a theoretical meander for two instants in time. At time t l} the loop is defined by w, and PI, while at at time t2 , it is defined by "2 (w2 ^: Wl ) and P2 (P2 ^ Pi). If, between *i and t2 , measurements of erosion were periodically made at section A, the data obtained from each measure ment would represent the end point of different fractions of the total path length. Therefore, any correlation of these data would not represent the movement of a point on the meander loop but would represent the time at which different points on the dynamic loop would reach a fixed reference. The data obtained would have little application to pre diction of future movement of this meander or com parison to movement of another meander.
Let us consider, however, the result of using the concepts of a sine-generated curve and a dynamic

CHANNEL MOVEMENT OF MEANDERING INDIANA STREAMS A3
FIGURE 2. General mechanism of meander loop movement.
system. At time t { the meander loop is denned by «i and PL Therefore, we can determine the stationing of the maximum deviations of the channel from the mean downstream direction, ^ SP^ and 3/4Pi. The mean downstream direction is the line connecting1 those points. We can then set our reference axes along this line (labeled d±) and perpendicular to it (labeled Z t ) with the origin at y^Pi. At time t z the same operations are performed, resulting in co ordinate axes d2 and 12 and points y&Pz and %P2 . We can then define the movement of the meander by measurements of the length and direction of the line from y^Pi to ^P2, the rotation of the axes, and the change of « and P. These measurements of equivalent points and parameters of a developing loop would have value in prediction of future move ment and comparison with different loops.
We have, in effect, made our measurements with reference axes which translate and rotate with time. This concept leads to a number of methods by which meander development could be described, and the method used in this report will be described in a subsequent section.
Observed Modes of Movement
Implied in the construction of figure 2 is the idea that the meander is evolving by two mechanisms. At time tz , P2 ^ Pi, W2 ^ «i, and dz =£ d^. This is one mode of change which has been observed for the meanders under study for this investigation. Ob
served movements constitute five general classes of expansion (increasing P) and rotation (d2 =£di), de pending on the boundary conditions of the loop. One class of movement is shown in figure 2 and the other four general classes are illustrated in figure 3. These five modes are applicable to vertically stable (little or no aggradation or degradation), alluvial chan nels investigated in this study. Channels incised in bedrock would have the meander pattern imposed by the stream when degradation began. Because of the abrasive effect of bedload, their mode of move ment is basically vertical rather than lateral.
The concept of increasing path length (AP), a contributing factor to the movements shown in fig ure 3, was inferred by Langbein and Leopold (1966, p. H2) :
In the context of the whole river system, a meandering segment, often but not always concentrated in downstream rather than upstream portions of the system, tends to pro vide greater concavity by lengthening the downstream por tion of the profile. By increasing the concavity of the profile, the product of discharge and slope, or power per unit length becomes more uniform along a stream that increases in flow downstream. Thus the meander decreases the variance of power per unit length * * *.
The conclusion is reached that meanders provide a greater path length which makes energy dissipa tion more uniform. It is reasonable to extend this conclusion to say that, unrestricted, the path length would continue to increase until energy dissipation is uniform. In the field, natural cutoffs or chuting (Friedkin, 1945) would occur before uniform energy dissipation was achieved. Therefore, in the dynamic system, increasing path length is a requirement.
Figure 3 illustrates an extension of this concept. In figure 3A, points a± and a/, are essentially fixed. Such a condition exists when dense vegetation or "clay plugs" restrict movement of the banks at these points. In this situation, erosion results simply in a path-length increase. In figure 3B, point % is fixed while ai is not, and in figure 3C the reverse is true. In either situation, the two mechanisms, change of downstream direction (rotation) and increasing path length, are more equal in effect. Figure 3D shows a loop whose condition is very near dynamic equilibrium in a uniformly erodible medium. Such a condition is approached in laboratory experiments (Friedkin, 1945) in which the whole meander sys tem tends to translate downstream.
Not shown are conditions which might result if the less erodible parts of the loop constituted other segments of the loop. Many possible combinations are obvious. The significant point is that a meander system works toward equal energy dissipation by

A4 PHYSIOGRAPHIC AND HYDRAULIC STUDIES OF RIVERS
a,i has stationing lAPj a'i has stationing %Pi
D. Translation (dynamic equilibrium)
FIGURE 3. Effects of stationary and (or) translating end points on meander loop movement.

CHANNEL MOVEMENT OF MEANDERING INDIANA STREAMS A5
increasing the path length, and where erosion rates within a loop differ greatly, rotation also occurs.
These mechanisms of movement should have ap plication to all forms of free meanders when they are viewed throughout a period of time. Boundary conditions at the end points of and within each loop can result in the dominance of any single mechanism of increasing path length, rotation, or translation, but the usual condition would be some combination of the three.
THEORETICAL MECHANICS OF MOVEMENT
That meandering is a stochastic process has been established by previous studies. One can reasonably expect, however, that cause-effect relationships gov ern the movement of an individual meander.
Impulse Momentum
Friedkin (1945, p. 11) wrote, "The rate of bank erosion depends upon the force of the water against the banks as well as the toughness of the banks." It is a small step from this idea to the concept of impulse-momentum change, which seems to offer the most reasonable basis for an explanation of movement.
Assume a segment of channel with constant cur vature as shown in figure 4. The mean velocity vector of the fluid, which has a discharge of q and
FIGURE 4. Identification of elements of the momentumconcept. -
flows in the channel between points A and B, can be represented by the unit vector v which is parallel to a tangent to AB at any point.
At point A, q has momentum pqvA and at point B, q has momentum pqvB where p is the density of the fluid. The difference in the two values is the change of momentum in the intervening reach and ideally is equal to the force applied by the bank to
the water. Of prime interest, however, is the force applied by the water to the bank that is, the im pulse of the water on the bank.
The mechanism of bank movement can be ex plained in terms of the applied impulse on the bank and the resulting momentum of dislodged bank material. The following equation expresses this mechanism :
Fqdt= (mvB ) b- (mvA ) (2)
where Fq is the force supplied by the water, tA and tB are the times at which q pases points A and B, (mvA )i> is the product of mass and velocity of the bank at tA , and (mvB ) b is the same product at tB . The bank material between A and B has no momen tum at tA . However, in an credible material the im pulse dislodges individual grains of bank material which are moved by the flow and do have momentum at tB . Equation 2 can then be rewritten for the grains affected by q as:
rtB/ Fqdt=(mgvB ) b (3)
J tAAs AB -» 0, equation 3 represents the impulse at a point where the left side of the equation is the force of the fluid on the bank, the time interval of force application has end points tA and tB, and the direc tion of the force is always tangent to the channel. In the real situation this direction of force tends to increase the path length.
The foregoing expression does not take into ac count the process occurring on the opposite bank where material is being deposited and hence losing momentum. For the streams investigated and for most streams with similar climatic and physical conditions, the channel characteristics are relatively stable; that is, even though meanders move with some rapidity, widths, depths, and width-depth ratios remain fairly constant so that the amount of material deposited very nearly equals the amount of material removed. Therefore, equation 3 is an adequate, albeit gross, means of representing move ment of the concave bank if it can be assumed that the force effective in removing bank material is directly proportional to the total flow in the stream, Q. This assumption has been made, and it is the movement of the concave bank which has been ana lyzed.
The next steps are to put equation 3 in a form more easily analyzed with available data and make the necessary real-world substitutions. For a con stant force, equation 3 can be rewritten as :

A6 PHYSIOGRAPHIC AND HYDRAULIC STUDIES OF RIVERS
(4)Movement is another way of expressing material
removed, (mgvB )b- Because the direction of force is always toward increasing path length (AP), the right side of equation 4 is proportional to AP. Force is proportional to Q. Different materials erode at different rates, depending on the cohesiveness of the material. The more cohesive the material the slower it erodes, so AP is inversely proportional to cohesive- ness. A convenient measure of cohesiveness is the percentage of silt and clay in a material, M, as defined by Schumm (1960). Substituting in equa tion 4 results in the relation:
Q(tB -tA )M
ocAP (5)
This expression lends itself to the use of flow-dura tion data.
Duration data are compiled in tables listing the number of days for narrow discharge ranges. The product of the number of days for each range (N) and the average discharge of that range can be used as a constant discharge for a definite period of time with little error being introduced by using the average discharge of the range. All such prod ucts can then be accumulated so that relation 5becomes:
^/n \r\(6)M
which is the basis for the analysis of data obtained in this investigation.
The development of relation 6 gives a macroscopic view of the mechanics of meander expansion. This explanation does not take into account the many microscopic processes which take place in a meander, such as bed or bank shear, superelevation, eddy currents, or transverse flow. The contribution of these factors is unquestionable, but they do not always have to be considered in determining direc tion or magnitude of channel movement. The im portant consideration is the net effect, and the im pulse-momentum concept applied to the concave bank supplies just that. It is a measure of the net effect of flow on an erodible material. The work done (or energy expended) in changing momentum from one value to another is the same no matter what process effects that change.
Channel-Forming Discharge
All discharge within an alluvial channel has some effect on the channel-shape parameters. Because of this it is impossible to relate these parameters to only one discharge. Several investigators have al luded to this premise.
Carlston (1965) found the most significant rela tionships for meander wavelength to involve aver age discharge and the mean discharge for the month of maximum discharge. Schumm (1968, 1969) found that when average, bankfull, and mean annual flood discharge are each correlated with the percentage of silt and clay in the channel perimeter and channel properties, the results are, to nearly equal degrees, very significant explanations of meander wave length and channel cross-sectional properties. Stall and Fok (1968) found that hydraulic geometry was best explained using the discharge at 10-percent flow duration. These relationships show that there is a range of discharge from at least the average to the mean annual flood which controls the dimen sions of meanders.
The position of the main-velocity thread in a meander loop at varying discharge has been shown by Friedkin (1945, pi. 9). He indicated that low flow attacks the upstream part of the concave bank, half-bankfull flow attacks the mid-part, and bank- full flow attacks the downstream part. At discharge greater than bankfull, the meandering velocity pat tern is not destroyed, and the turbulence effective in erosion may be increased (Toebes and Sooky, 1966).
Channel-Forming Discharge Redefined
Consideration of all the relationships developed indicates not only that all discharge affects channel dimensions, but that there is a threshold discharge at and above which the major part of channel forma tion occurs. Channel dimensions should depend upon those flows for which the channel acts as a unit. At low flows (less than average), the pool and riffle sequence within channel limits is effective, resulting in a low-water channel which often meanders within the confines of the bankfull channel. At some dis charge the pool and riffle sequence is drowned out, and the channel acts as a unit at all higher dis charges. The point is probably reached near average discharge as the relationships discussed have indi cated.
Some further evidence can be gained from study of traveltime data. Figure 5 presents the results of several traveltime determinations for the East Fork White River. The break in slope occurs near average discharge and is characteristic of unpub lished traveltime curves for most of the streams in Indiana which exhibit a pool and riffle condition at low flows.
Channel formation can be considered, then, to begin at just above average discharge and continue

CHANNEL MOVEMENT OF MEANDERING INDIANA STREAMS A7
10,000
Q LlJ
W*
o: O
m D o "
^2
§°LjJ O
O ^
Q<
1,000
100
15-11-67
BREAK ABOUT 2400 CFS AVERAGE 0 =2346 CFS
^ (40 YEARS, 1928-67)>r
)4-19-68
7-27-6
10 100
TRAVELTIME, IN HOURS
FIGURE 5. Traveltime for the East Fork White River be tween U.S. Geological Survey gages at Columbus and Seymour.
for all higher discharges. This range can also be considered to be directly related to the expansion of a meander loop.
The remainder of this paper is an attempt to test the conclusions reached up to this point namely, that path-length expansion is directly proportional to the volume of flow for above-average discharge days and inversely proportional to the percentage of silt and clay in the bed and bank material.
FIELD INVESTIGATION
STUDY SITES
The sites investigated for this project are shown in figure 6, and some pertinent physical character istics are listed in table 1. All sites were within a reasonable distance from a U.S. Geological Survey stream-gaging station (fig. 6) except for Paw Paw Creek which is ungaged. As shown in table 1, a wide range of characteristics is represented.
The surficial geologic characteristics were formed during the Wisconsin Glaciation in the Pleistocene Epoch. At the maximum glacial advance, the north ern two-thirds of Indiana was covered by Wisconsin ice. The two sites on the White River and the site on the East Fork White River are south of the maximum Wisconsin glacial advance, but the mate rial filling the present river valleys is outwash from the melting of this last continental glaciation. The Muscatatuck River site is also south of the Wiscon sin boundary, but the predominately clay material at the site was deposited in a lake whose basin was formed during the previous Illinoian Glaciation. The lake sediments of the Carpenter Creek site and the morainal features of the Paw Paw Creek site were deposited during glacial retreats of the Wis consin Glaciation.
The weighted silt-clay percentage (fine fraction) was computed by a method described by Schumm (1960), but a diameter of 0.062 mm (millimeter), instead of 0.074 mm, was used as the dividing point
TABLE 1. Selected site characteristics
[Depositional environment: After Wayne (1958)]
Drainage
Name and location (
Paw Paw Creek near Urbana........Carpenter Creek near Egypt ......
White River near Martinsville....
White River near Worthington....East Fork White River
near Vallonia ................................Muscatatuck River near Austin.....
areasq mi)
8.6048.0
2,520
4,390
2,530.. 367
Period ofrecord(wateryears)
1949, 1951,1953-67
1930-31,1946-671929-67
1928-671933-35,1937-43
Averagedischargeat gaging
station(cfs)
33.7
2,258
4,459
2,346387
Channelslope
(ft perft)
0.0018.00064
.00035
.00023
.00024
.00025
Width-depthratio
7.28.0
27
20
145.8
Weightedsilt-clay
percentage
7.929
2.2
2.6
6.987
Depositionalenvironment
Ground moraine.Lake sediments.
Valley-train sediments.
Do.
Do.Lake sediments.

A8 PHYSIOGRAPHIC AND HYDRAULIC STUDIES OF RIVERS
87°
38°-
FIGURE 6. Location of investigated meander sites and gaging stations.

CHANNEL MOVEMENT OF MEANDERING INDIANA STREAMS A9
EXPLANATION FOR FIGURE 6
Meander sites
Map No. Name and location
1 Paw Paw Creek near Urbana, Wabash County, sec. 12, T. 28 N., R. 6 E.
2 Carpenter Creek near Egypt, Jasper County, sec. 22, T. 28 N., R. 7 W.
3 White River near Martinsville, Morgan County, sec. 7, T. 11 N., R. 1 E.
4 White River near Worthington, Greene County, sec. 28, T. 8 N., R. 5 W.
5 East Fork White River near Vallonia, Jackson County, sees. 19, 30, T. 5 N., R. 4 E.
Meander sites Continued
Map No. Name and location
6 Muscatatuck River near Austin, Scott County, sees. 33, 34, T. 4 N., R. 6 E., and sec. 3, T. 3 N., R. 6 E.
Gaging stations
National No. Name
5-5240 Carpenter Creek at Egypt.3-3540 White River near Centerton.3-3605 White River at Newberry.3-3655 East Fork White River at Seymour.3-3670 Muscatatuck River near Austin.
for fine and coarse fractions. A dividing-point diam eter of 0.062 mm conforms to the Wentworth grade scale and results in only a slightly smaller per centage. The difference is not enough to destroy comparability. Material for these analyses was col lected at several locations on both banks within each study reach, and the results were averaged for each reach. The variability within each reach was considered sufficiently small that a reach could be treated as having fairly homogeneous lithology throughout.
The field investigations were carried out from the spring of 1966 to the spring of 1969. Channel loca tions were identified from aerial photographs and, except for those from 1939 and 1958 for the Mar tinsville site, were obtained from the files of the Indiana Department of Natural Resources. The two exceptions were obtained from the files of the Soil Conservation Service, U.S. Department of Agricul ture. Plan-view channel patterns for all sites are shown in figures 7 through 12. The method of analysis will be illustrated with the White River near Worthington site (fig. 10).
100 200 FEETI_____|
No trees on either bank
FIGURE 7. Meander system at the Paw Paw Creek near Urbana site. Surveyed by J. F. Daniel and J. W. Tucker, April 3, 1969.
DATA ANALYSIS
Field surveys at the White River near Worthing ton site were made June 7, 1966, and July 23, 1968, by Indiana Department of Natural Resources per sonnel. The results of those surveys and the bank locations based on aerial photographs taken July 5, 1937, and April 16, 1962, are shown in figure 10. Any further usefulness of this site was destroyed when a natural cutoff formed in late June 1968.
50 FEET
EXPLANATION
Concave-bank locations
June 20, 1966
May 26, 1969
FIGURE 8. Meander development at the Carpenter Creek near Egypt site. Surveys by J. F. Daniel and others.

A10 PHYSIOGRAPHIC AND HYDRAULIC STUDIES OF RIVERS
Each path location was analyzed independently as follows:1. The direction angles with an assumed mean
downstream direction were measured for equal, short tangents of the cut-bank path length.
2. The direction angles and the stationings were plotted, and a sine curve was fitted to the points. (See fig. 1.)
3. The path length, corrected mean downstream direction (obtained by adjusting the vertical coordinate scale), and amplitude of the sine wave were determined from the graph.
4. The theoretical loop was then compared with the actual loop by plotting the positions of both, beginning at the midpoint stationing of the actual loop.
EXPLANATION
Concave-bank locationsJuly 17, 1939 (aerial photograph)
June 29, 1958 (aerial photograph)March 21, 1964 (aerial photograph)June 2, 1966 (survey)April 17, 1967 (survey)July 18, 1968 (survey)End point
Barren 01
FIGURE 9. Meander development at the White River near Martinsville site. Surveys by State of Indiana Departmentof Natural Resources.

CHANNEL MOVEMENT OF MEANDERING INDIANA STREAMS All
5. A line joining the *4- and %-wavelength points on the theoretical loop was extended to the actual loop, as in figure 13. This method ob jectively defines y^P and %P on the actual loop, and the path distance between these two points was measured.
Using duration data which were computer-com piled by class interval, the total flow volume of all
days having discharge greater than the effective dis charge was accumulated. It has already been shown that this effective discharge occurs at a discharge slightly greater than the average. Therefore, ac cumulation was begun with the first class interval greater than the average. Volume for each class interval was computed by taking the product of the
-Continuous trees
EXPLANATION
Concave-bank locations
June 7, 1966 (survey) July 23, 1968 (survey) End point
July 5,1937 (aerial photograph) April 16, 1962 (aerial photograph)
FIGURE 10. Meander development at the White River near Worthington site. Surveys by State of Indiana Departmentof Natural Resources.

A12 PHYSIOGRAPHIC AND HYDRAULIC STUDIES OF RIVERS
average of the class and the number of days in the class. While this is not an exact measure, the class intervals are small enough that very little er ror is introduced.
The effective-discharge volume was then plotted versus the accumulated path-length increase as in
figure 14. It appears that the few points available define a straight line, which was fitted by eye. Using the same technique, the same relations were devel oped for the White River near Martinsville and the East Fork White River near Vallonia sites (figs. 15,16).
Continuous trees
EXPLANATION
Concave-bank locations
August 4, 1937 (aerial photograph) September 1, 1949 (aerial photograph)
April 19, 1966 (survey) April 5, 1967 (survey) April 24, 1968 (survey)
April 8, 1969 (survey) End point
FIGURE 11. Meander development at the East Fork White River near Vallonia site. Surveys by J. F. Daniel and others.

CHANNEL MOVEMENT OF MEANDERING INDIANA STREAMS A13
Flow
0 100 200 FEETI i I______I
\ Trees are continuous on both banks
FIGURE 12. Meander system at the Muscatatuck River near Austin site. Surveys by J. F. Daniel and R. J. Southwood, April 28, 1966.
EXPLANATION
o Computed point
® End point
- Theoretical loop
Actual loop
FIGURE 13. Definition of actual end points from theoretical loop, plotted on 1937 loop, for the White River near Worthington site.
2000
FLOW VOLUME FOR DAYS ABOVE AVERAGE DISCHARGE, IN MILLIONS OF CFS-DAYS
FIGURE 14. Path-length increase versus flow volume for the White River near Worthington site.
r 800
600-
oLJI- _ILJ
I £400
July 17, 1939,and March 21, 1964
200-
FLOW VOLUME FOR DAYS ABOVE AVERAGE DISCHARGE, IN MILLIONS OF CFS-DAYS
FIGURE 15. Path-length increase versus flow volume for the White River near Martinsville site.
600
April 8, 1969_ April 24, 1968
April 5, 1967-
April 19, 1966
400 -
300
200
100
FLOW VOLUME FOR DAYS ABOVE AVERAGE DISCHARGE, IN MILLIONS OF CFS-DAYS
FIGURE 16. Path-length increase versus flow volume for the East Fork White River near Vallonia site.
A14 PHYSIOGRAPHIC AND HYDRAULIC STUDIES OF RIVERS
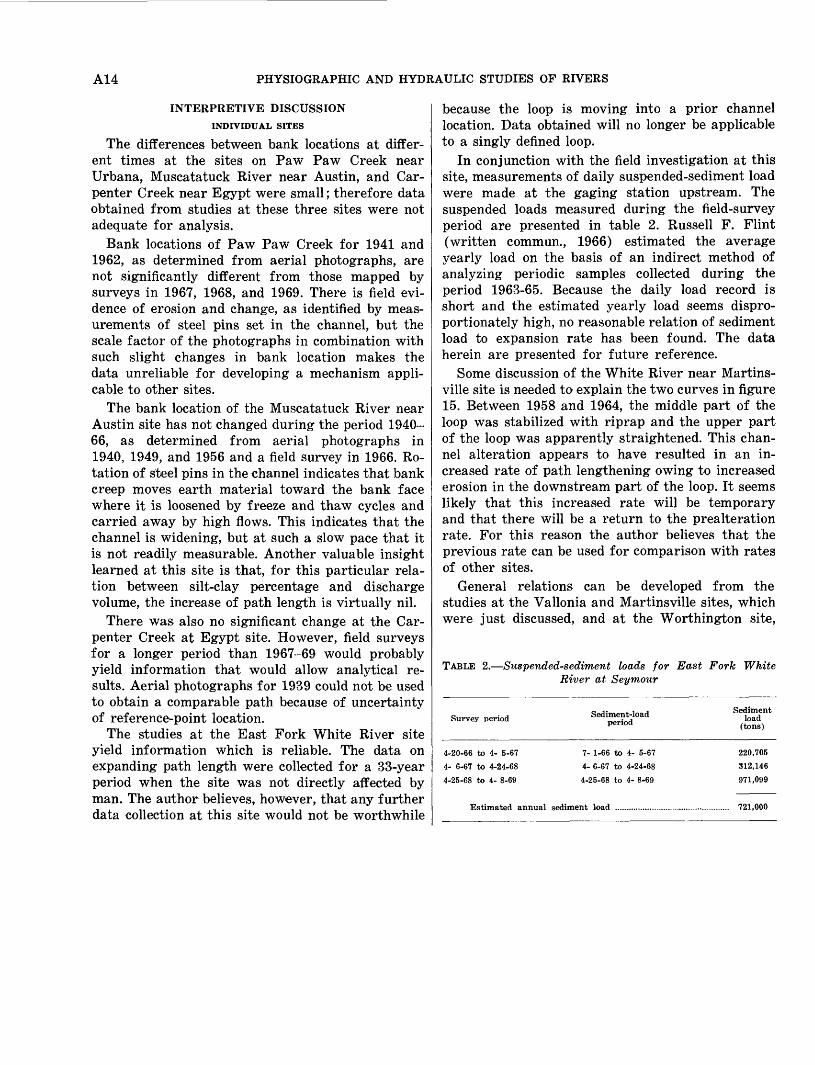
INTERPRETIVE DISCUSSIONINDIVIDUAL SITES
The differences between bank locations at differ ent times at the sites on Paw Paw Creek near Urbana, Muscatatuck River near Austin, and Car penter Creek near Egypt were small; therefore data obtained from studies at these three sites were not adequate for analysis.
Bank locations of Paw Paw Creek for 1941 and 1962, as determined from aerial photographs, are not significantly different from those mapped by surveys in 1967, 1968, and 1969. There is field evi dence of erosion and change, as identified by meas urements of steel pins set in the channel, but the scale factor of the photographs in combination with such slight changes in bank location makes the data unreliable for developing a mechanism appli cable to other sites.
The bank location of the Muscatatuck River near Austin site has not changed during the period 1940- 66, as determined from aerial photographs in 1940, 1949, and 1956 and a field survey in 1966. Ro tation of steel pins in the channel indicates that bank creep moves earth material toward the bank face where it is loosened by freeze and thaw cycles and carried away by high flows. This indicates that the channel is widening, but at such a slow pace that it is not readily measurable. Another valuable insight learned at this site is that, for this particular rela tion between silt-clay percentage and discharge volume, the increase of path length is virtually nil.
There was also no significant change at the Car penter Creek at Egypt site. However, field surveys for a longer period than 1967-69 would probably yield information that would allow analytical re sults. Aerial photographs for 1939 could not be used to obtain a comparable path because of uncertainty of reference-point location.
The studies at the East Fork White River site yield information which is reliable. The data on expanding path length were collected for a 33-year period when the site was not directly affected by man. The author believes, however, that any further data collection at this site would not be worthwhile
because the loop is moving into a prior channel location. Data obtained will no longer be applicable to a singly defined loop.
In conjunction with the field investigation at this site, measurements of daily suspended-sediment load were made at the gaging station upstream. The suspended loads measured during the field-survey period are presented in table 2. Russell F. Flint (written commun., 1966) estimated the average yearly load on the basis of an indirect method of analyzing periodic samples collected during the period 1963-65. Because the daily load record is short and the estimated yearly load seems dispro portionately high, no reasonable relation of sediment load to expansion rate has been found. The data herein are presented for future reference.
Some discussion of the White River near Martins- ville site is needed to explain the two curves in figure 15. Between 1958 and 1964, the middle part of the loop was stabilized with riprap and the upper part of the loop was apparently straightened. This chan nel alteration appears to have resulted in an in creased rate of path lengthening owing to increased erosion in the downstream part of the loop. It seems likely that this increased rate will be temporary and that there will be a return to the prealteration rate. For this reason the author believes that the previous rate can be used for comparison with rates of other sites.
General relations can be developed from the studies at the Vallonia and Martinsville sites, which were just discussed, and at the Worthington site,
TABLE 2. Suspended-sediment loads for East Fork White River at Seymour
Survey period Sediment-load period
Sediment load
(tons)
4-20-66 to 4- 5-67
4- 6-67 to 4-24-68
4-25-68 to 4- 8-69
7- 1-66 to 4- 5-67
4- 6-67 to 4-24-68
4-25-68 to 4- 8-69
220,705
312,146
971,099
Estimated annual sediment load .................................................. 721,000

CHANNEL MOVEMENT OF MEANDERING INDIANA STREAMS A15
which was used to illustrate methods in the section on data analysis.
GENERAL CONCLUSIONS
Data indicate that for each of the three sites for which analysis was possible a well-defined relation ship could be developed between time and path length as well as between discharge and path length. The relation between time and path length is not as sharply defined as that between discharge and path length, but for all practical purposes they are equivalent. The explanation for this is indicated in figure 17 where there is a lack of large deviations between the mass curve and the dashed line. This indicates that annual discharge volumes for days above average discharge are relatively constant. Therefore, an increase in path length would be relatively constant from year to year. This condi tion is more likely to occur in a subhumid climate, such as that in Indiana, than in a semiarid climate, such as that in the Great Plains, where yearly changes in discharge volume for days above average discharge are relatively much greater. Therefore, while a yearly path-increase rate for the sites in Indiana is sufficient for use, the same method prob ably could not be used for meander loops developing from different climatological conditions. For streams in different climates, the path-length versus dis charge-volume relation should yield better results.
Through the study of the annual path-length in crease, some insight can be gained into the effect of grain size. In figure 18 the rate of path-length increase has been transformed to a per-square-mile basis and plotted versus the silt-clay percentage. Not shown is the point defined by the Muscatatuck site (no expansion; 87 percent silt and clay), but it was considered in shaping the curve. Again, while not enough data are available for "proof" of a hy pothesis, the points do indicate that the expansion rate would have a nonlinear relation to the silt-clay percentage. It seems reasonable that this relation would be asymptotic to the silt-clay axis, indicating that no bank would completely resist erosion. The extension of the curve toward zero silt and clay may be asymptotic to the rate axis also, but it probably
30
15
10 -
/
y
7
A
/1937 1942 1947 1952 1957
WATER YEAR
1962 1967
FIGURE 17. Accumulated flow volume versus water year for White River near Worthington site.
0.020
LJ o:LL <
Z. >
-a: 0.015
tr j
la: i- <
0.010
0.005 -
-Martinsville
-Worthington
Vallonia
2468
WEIGHTED SILT-CLAY PERCENTAGE
10
FIGURE 18. Probable relation of path-length increase and silt-clay percentage.
would be discontinuous at some point close to that axis. This would indicate that as the path length increased at an extremely rapid rate the radius of curvature of the channel would become infinite, thereby resulting in a straight reach with little or no

A16 PHYSIOGRAPHIC AND HYDRAULIC STUDIES OF RIVERS
change in path length. In other words, at some extremely small silt-clay percentage, the path length would not increase. The channel could still move, but the path length would not change except for short periods of time.
In order that comparison with meander migra tion in other regions can be made in the future, the data have been put into dimensionless form as shown in figure 19. The scatter of the points with regard to silt-clay percentage indicates a lack of
250
oi 200
150
100
- Worthington
Martinsville
Vallonia
246
WEIGHTED SILT-CLAY PERCENTAGE
10
FIGURE 19. Dimensionless relation of path-length increases and flow data to silt-clay percentage.
orderly progression. However, when width-depth ratio is used as the dimensionless parameter for the abscissa, as in figure 20, a logical sequence of points is obtained.
The apparent discrepancy between these two treatments can best be explained by sampling error. Schumm (1960) related width-depth ratio to silt- clay percentage of the bed and banks. His data were derived from cross sections and indicate a definite correlation between the two parameters. For this investigation several points within each reach were sampled for silt-clay percentage, and the results were averaged for the reach. The scatter of data in figure 19 indicates that enough samples to establish a statistically significant average may not have been obtained. Apparently, then, the aver age width-depth ratio is a more integrated, and hence better, measure of the average silt-clay per centage than the bed and bank samples themselves.
tg 25°
200
150
100
LLJ
^0 M
SS5 50 2<2j
oil o
O an O u- n5-° °oce
Worthington -
Martinsville
Austin^
Vallonia
10 20
WIDTH-DEPTH RATIO
30
FIGURE 20. Dimensionless relation of path-length increase and flow data to width-depth ratio.
The interpretation of figure 20 is similar to that of figure 18. The higher the width-depth ratio, the lower is the silt-clay percentage and the faster is the path-length increase. Conversely, the lower the width-depth ratio, the higher is the silt-clay per centage and the slower is the path-length increase. Again, as in the interpretation of figure 18, one would expect that no channel would completely re sist erosion so that any curve should pass through the origin. However, because of the few points available, an extension of the curve to the origin has not been shown.
The inclusion of the drainage area in the ordinate may or may not tend to restrict the validity of figure 20 to climatic or geologic conditions similar to those for which it was developed. If it does and if the concept is correct, one would expect to find a family of curves, each representing a particular environment. To test this relation by studying meanders in other areas would seem to be a logical "next step" to this investigation.
The foregoing interpretation of figure 20 tends to invalidate the relation shown in figure 18. Be cause of this and because of its more usable dimen sionless form, the author feels that figure 20 repre sents the best treatment of the available data. It could be used to estimate path-length increase of alluvial streams in Indiana having width-depth ratios within the approximate range of 8 to 28 and for most flow volumes. Time intervals for path- length increases can be related to flow volume by doing flood-volume frequency analyses for short
CHANNEL MOVEMENT OF MEANDERING INDIANA STREAMS A17
time intervals or by considering only long intervals (several years) and using average discharge. It must be remembered, however, that path-length in crease is only part of the movement mechanism.
The mechanisms of translation and rotation have been described earlier in this paper (figs. 2 and 3) but not enough data are available for a quantitative analysis of the total process. If the end points of a loop are likely to be stable, such as at the Vallonia site, then rotation and translation cease to have an appreciable effect. A useful estimate of movement might then be made with figure 20. Because this condition seldom exists, further investigation of rotation and translation is also a next step to this investigation.
It has also been impossible to evaluate the effects of vegetation on loop expansion. Qualitative descrip tions of vegetative cover proposed by Dansereau (1957) and listed by Strahler (1965) have been given on the site illustrations. The percentage of path length supporting dense vegetation is nearly equal for each of the three sites used to develop the relation shown in figure 18. It seems logical that vegetation would slow down expansion. How ever, unless vegetation covers 100 percent of the path, the experience at the Martinsville site indi cates that the effect may be overcome by expansion in that part of the loop which is not protected. The effect of dense vegetation can be likened to the effect of very different material composition; for example, abandoned clay-filled meanders are often the inhibit ing factors that control channel movement on the lower Mississippi River (C. R. Kolb, written com- mun., 1969). Because similar problems in analyzing movement result from either cause, much more data are needed before any quantitative effect of vegeta tion or very different material zones can be assigned.
SUMMARY
The attempt has been made in this report to review some established principles of channel geo- morphology and to use those principles to give some insight to the process and prediction of meander movement.
Meander loop movement has been investigated by using a sine-generated curve to determine the end points of a loop from which the actual path length can be measured. Using the simple physical model of impulse momentum, a relationship of discharge to loop expansion has been deduced and related to grain size of the bank material.
Consideration of traveltime data and the regres sion analyses of many other investigators has led
to the conclusion that channel-forming discharge begins very near, but just higher than, average discharge and continues throughout all higher dis charges. Channel movement is then a function of the time distribution of the higher discharges.
A division of the channel material into fine and coarse fractions has been used in order to relate the rate of expansion to the cohesiveness of the banks. Suspended-sediment discharge records were collected for one site but are not of sufficient length for rigorous analysis.
Several simple models of channel movement by rotation, translation, and expansion have been il lustrated on the basis of the experience gained from this investigation. No general relation has been found with which the first two processes could be analyzed. Therefore, the goal of movement pre diction has not been achieved. However, if reason able relationships can be found to relate rotation and translation to common factors, those relation ships, along with the expansion relation which has been defined, will give scientists a tool with which it may be possible to predict the movement of meanders.
SELECTED REFERENCES
Bagnold, R. A., 1960, Some aspects of the shape of river meanders: U.S. Geol. Survey Prof. Paper 282-E, p. 135-144.
Carlston, C. W., 1965, The relation of free meander geom etry to stream discharge and its geomorphic implica tions: Am. Jour. Sci., v. 263, p. 864-885.
Dansereau, Pierre, 1957, Biogeography, an ecological per spective: New York, The Ronald Press Co., 394 p.
Friedkin, J. F., 1945, A laboratory study of the meandering of alluvial rivers: Vicksburg, Miss., U.S. Waterways Expt. Sta., 40 p.
Guy, H. P., Rathburn, R. E., and Richardson, E. V., 1967, Recirculation and sand-feed type flume experiments: Am. Soc. Civil Eng. Trans., v. 93, p. 97-114.
Langbein, W. B., and Leopold, L. B., 1966, River meanders theory of minimum variance: U.S. Geol. Survey Prof. Paper 422-H, 15 p.
Leopold, L. B., Bagnold, R. A., Wolman, M. G., and Brush, L. M., 1960, Flow resistance in sinuous or irregular channels: U.S. Geol. Survey Prof. Paper 282-D, p. HI- 134.
Leopold, L. B., and Langbein, W. B., 1962, The concept of entropy in landscape evolution: U.S. Geol. Survey Prof. Paper 500-A, 20 p.
Leopold, L. B., and Haddock, Thomas, Jr., 1953, The hy draulic geometry of stream channels and some physio graphic implications: U.S. Geol. Survey Prof. Paper 252, 27 p.
Leopold, L. B., Wolman, M. G., and Miller, J. P., 1964, Fluvial processes in geomorphology: San Francisco, W. H. Freeman & Co., 522 p.

A18 PHYSIOGRAPHIC AND HYDRAULIC STUDIES OF RIVERS
Popov, I. V., 1965, The use of hydrologic-morphological anal ysis in water intake planning: Soviet Hydrology, Se lected Papers, no. 5, 1965, p. 437-450 (1966).
Scheidegger, A. E., and Langbein, W. B., 1966, Probability concepts in geomorphology: U.S. Geol. Survey Prof. Paper 500-C, 14 p.
Schumm, S. A., 1960, The shape of alluvial channels in re lation to sediment type: U.S. Geol. Survey Prof. Paper 352-B, p. 17-31.
1968, River adjustment to altered hydrolcgic regi men Murrumbidgee River and paleochannels, Aus tralia: U.S. Geol. Survey Prof. Paper 598, 65 p.
1969, River metamorphosis: Am. Soc. Civil Eng.Trans., v. 95, p. 255-273.
Stall, J. B., and Fok, Yu-si, 1968, Hydraulic geometry ofIllinois streams: Illinois Univ. Water Resources CenterResearch Rept. 15, 47 p.
Strahler, A. N., 1965, Introduction to physical geography:New York, John Wiley & Sons, Inc., 455 p.
Thornbury, W. D., 1950, Glacial sluiceways and lacustrine plains of southern Indiana: Indiana Dept. Conserv., Div. Geol. Bull. 4, 21 p.
Toebes, G. H., and Sooky, A. A., 1966, Hydraulics of mean dering rivers with flood plains: Am. Soc. Civil Engi neers Water Resources Eng. Conf., Denver 1966, Pre print 351, 38 p.
Twidale, C. R., 1964, Erosion of an alluvial bank at Bird- wood, South Australia: Zeitschr. Geomorphologie, New Ser. v. 8, no. 2, p. 189-209.
Wayne, W. J., 1958, Glacial geology of Indiana: Indiana Dept. Conserv., Geol. Survey Atlas Min. Resources Map 10.
Wolman, M. G., and Leopold, L. B., 1957, River flood plains: some observations on their formation: U.S. Geol. Survey Prof. Paper 282-C, p. 87-109.
Woodyer, K. D., 1968, Bankfull frequency in rivers: Jour. Hydrology, v. 6, p. 114-142.
U. S. GOVERNMENT PRINTING OFFICE : 1971 O - 443-512