Embed Size (px)
Citation preview

ROUGHNESS CHARACTERISTICS IN TWO STAGEMEANDERING AND STRAIGHT COMPOUND CHANNELS
Mr. Kishanjit Kumar Khatua1 Prof. Kanhu Charan Patra2 Mr B. Tripathi and S. Harish3
ABSTRACTDuring uniform flow in open channels the resistance to the flow is dependant on a number offlow and channel parameters. The usual practice in one dimensional analysis is to select avalue of n depending on the channel surface roughness and take it as uniform for the entiresurface for all depths of flow. The influences of all the parameters are assumed to be lumpedinto a single value of n. Patra (1999), Patra and Kar (2000), and Pang (1998) have shown thatManning’s coefficient n not only denotes the roughness characteristics of a channel but alsothe energy loss in the flow. The larger the value of n, the higher is the loss of energy within theflow. Although much research has been done on Manning's n, for straight channels, very littlehas been done concerning the roughness values for simple meandering channels and also formeandering channels with floodplains. An investigation concerning the loss of energy of flowswith depths ranging from in bank to the over bank flow, spreading the water to floodplains formeandering and straight compound channels are presented. The loss of energy in terms ofManning’s n, Chezy’s C, and Darcy-Weisbatch coefficient f are evaluated.
INTRODUCTIONExperimental results are presented concerning stage-discharge relationships and resistance forcompound channels with a rigid main channel bed and rigid smooth floodplains. The variation ofresistance with depth, and the abrupt reduction in resistance at the bankfull stage, are all linked tothe stage-discharge relationships. Distribution of roughness coefficients in a compound channelsection is an important aspect that needs to be addressed properly. Water that flows in a naturalchannel is a real fluid for which the action of viscosity and other forces cannot be ignoredcompletely. Owing to the viscosity, the flow in a channel consumes more energy. UsuallyChezy’s, Manning’s or Darcy-Weisbach equation is used to calculate the velocity of flow in anopen channel. The roughness coefficient in these cases is represented as c, n and f respectively.Due to its popularity, the field engineers mostly use Manning’s equation to estimate the velocityand discharge in an open channel. While using Manning’s equation, the selection of a suitablevalue of n is the single most important parameter for the proper estimation of velocity in an openchannel. Major factors affecting Manning’s roughness coefficient are the (i) surface roughness,(ii) vegetation, (iii) channel irregularity, (iv) channel alignment, (v) silting and scouring, (vi)shape and the size of a channel, and (vii) stage-discharge relationship. However, in onedimensional analysis, it is difficult to model the influence of all these parameters individually toformulate a simple equation for the estimation of velocity and discharge rate in an open channelunder uniform flow conditions. Pang (1998) and Patra (1999) have shown that Manning’scoefficient n not only denotes the roughness characteristics of a channel but also the energy lossof the flow. The influences of all the forces that resist the flow in an open channel are assumed tohave been lumped to a single coefficient n. Due to flow interaction between the main channel and floodplain, the flow in a compoundsection consumes more energy than a channel with simple section carrying the same flow andhaving the same type of channel surface. The energy loss is manifested in the form of variation ofresistance coefficients of the channel with depth of flow. The variation of Manning’s roughnesscoefficient n, Chezy’s C and Darcy - Weisbach friction factor f with depths of flow ranging fromin-bank channel to the over-bank flow are discussed. Flood plains of river basins are denselyvegetated. The values of n are determined from the factors that influence the roughness of achannel and flood plain. In densely vegetated flood plains, the major roughness is caused by trees,vines, and brush. The n value for this type of flood plain can be determined by measuring thevegetation density of the flood plain.1,2 Senior Lecturer and Professor in Civil Engineering Department, National Institute ofTechnology, Rourkela, India Email: [email protected], [email protected]

Photographs of flood-plain segments where n values have been verified can be used as acomparison standard to aid in assigning n values to similar floodplains. The results of Manning'sformula, an indirect computation of stream flow, have applications in floodplain management, inflood insurance studies, and in the design of bridges and highways across flood plains. Manning'sformula is written as
2/13/21eSR
nV = (1)
where V = mean velocity of flow, in meters per second, R = hydraulic radius, in meters, Se =slope of energy grade line, in meters per meter. n = Manning's roughness coefficient. It would be impractical in this guide to record all that is known about the selection of theManning's roughness coefficient, but many textbooks and technique manuals contain discussionsof the factors involved in the selection. Three publications that augment this guide are Barnes(1967), Chow (1959), and Ree (1954). Although much research has been done to determineroughness coefficients for open-channel flow (Carter and others, 1963), less has been done tostudy the variation of n with flow depth for the same channel, more so when the channel flowsovertop the banks. The roughness coefficients for these channels are typically very different fromthose for in bank flows. There is a tendency to regard the selection of roughness coefficients aseither an arbitrary or an intuitive process. Specific procedures can be used to determine the valuesfor roughness coefficients in channels and flood plains. The n values for channels are determinedby evaluating the effects of certain roughness factors in the channels. Values of the roughnesscoefficient, n may be assigned for conditions that exist at the time of a specific flow event, foraverage conditions over a range in stage, or for anticipated conditions at the time of a futureevent. The discussion made in this paper is limited to show the variation of the channel roughnesscoefficient for application to one-dimensional open-channel flow problems. Meandering is a degree of adjustment of water and sediment laden river with its size, shape, andslope such that a flatter channel can exists in a steeper valley. During floods, part of the dischargeof a river is carried by the main channel and the rest are carried by the floodplains located to itssides. Once a river stage overtops its banks, the cross sectional geometry of flow undergoes asteep change. The channel section becomes compound and the flow structure for such section ischaracterized by large shear layers generated by the difference of velocity between the mainchannel and the floodplain flow. Due to different hydraulic conditions prevailing in the river andfloodplain, mean velocity in the main channel and in the floodplain are different. Therefore floodestimation of natural channels cannot be correct unless we incorporate a procedure to obtain thecorrect values of n or c for the main channel and floodplains. The usual procedure in such acompound channel using one dimensional flow analysis is to separate the compound channel intosections using a vertical, horizontal or a diagonal interface plane. Since the hydraulic parametersaffecting the main channel and floodplains of a compound section are different, there is a markeddifference in the values of coefficient n from in bank to over bank flow. Moreover, when thecompound channel is used as single section, the value of n again becomes different. This paperalso discusses the variation of n using a section as single channel and also using it as sum of morethan one subsection.
EXPERIMENTAL SETUPExperimental data from three types of channels from IIT Kharagpur With the channel of NITRourkela are presented in this paper. Plan forms of the three types of meandering experimentalchannels with floodplains are shown in Fig.1. The summery of experiments conducted are givenin Table 1. The experimental results concerning the Manning’s n, Chezy’s C and Darcy -Weisbach friction factor f for simple meander channels (in-bank flow) for all the three types aregiven in Table.2, where as for meander channels with floodplains (over-bank flow) thecorresponding results are given in Table. 3. In Type-I, series-I channel, the flow is confined to in-bank only, whereas data for the over-bank flow for the same channel is given in series-II of Table3. Type I channel is asymmetrical with two unequal floodplains attached to both sides of the mainchannel. Similarly Type-II and IIR channels are asymmetrical with only floodplain attached toone side of the main channel. All surfaces of the channel IIR are roughened with rubber beads of4 mm diameter at 12 mm centre to centre. The in bank flow data of Type-II and IIR are given in

series-III and V of Tables 2 and 3, while the over bank flow data are given in series IV and VIrespectively in these tables. Type-III channel is symmetrical with two equal floodplains attachedto both sides of the main channel. Like wise the details of in bank flow are given in series VII ofTable 2 and the over bank flow are given in series VII of Table 3. Details of the experimental setup and procedure concerning the flow and velocity observationsin meandering channels with floodplains of Type-I, Type-II and IIR are reported earlier (Patra1999; Patra and Kar, 2000; and Patra and Kar, 2004). These experiments are conducted at theWater Resources and Hydraulic Engineering Laboratory of the Civil Engineering Department ofthe Indian Institute of Technology, Kharagpur, India. For Type–IV, The experiments concerningthe flow in simple meander channels and meander channel - floodplain geometry have beenconducted at the Fluid Mechanics and Water Resources Engineering Laboratory of theDepartment Civil Engineering, National Institute of Technology, Rourkela, India. The centerlineof the meandering channel is taken as sinusoidal. Inside a tilting flume a compound channelconsisting of a meandering main channel with floodplain(s) is fabricated. The channel surfacesformed out of Perspex sheets represents smooth boundary. The channels are placed inside arectangular tilting flume made out of metal frame and glass walls. The tilting flume has theoverall dimension of 12 m long and 0.60 m wide for To facilitate fabrication, the whole channellength has been made in blocks of 1.20 m length. The flume is adequately supported on suitablemasonry at its bottom. The geometrical parameters of the experimental channels are given inTable I
Water is supplied to the experimental channel from an overhead tank. An glass tube indicator with ascale arrangement in the overhead tank enables to draw water with constant flow head. The stillingtank located at the upstream of the channel has a baffle wall to reduce turbulence of the incomingwater. An arrangement for the smooth transition of water from the stilling tank to the experimentalchannel is made. At the end of the experimental channel, water is allowed to flow over a tailgateand into a sump. From the sump water is pumped back to the overhead tank, thus setting a completere-circulating system of water supply for the experimental channel. The tailgate helps to establishuniform flow in the channel.
The discharge is measured in two ways. The water flowing out of the exit end of the experimentalchannel is diverted to a rectangular measuring tank and the change in the depth of water with timeis measured by a glass tube indicator system with a scale of accuracy 0.01cm
The ratio α between overall width B and main channel width b of the meandering compoundchannels could be varied from 2.13 to 5.25 for the three types of channels. The channel sectionsare made from Perspex sheets for which the roughness of floodplain and main channel wereidentical. The observations are made at the section of maximum curvatures (bend apex) of themeandering channel geometries
Fig. 1 Plan Forms of Meandering Experimental Channels with Floodplains
Table 1 Summary of Experimental Runs for Meandering Channel with Floodplains at Bend Apex
B
b B
B Bb
b
h
h
h
H
H
H(a)
(b)
(c)
b
b
bB
B

Experi-ment Type
Channelsurface
Bedslope
TopwidthB(cm)
Mainchannelwidthb(cm)
Depthof lowermain
channel
=B/b
Sinuo-sity Sr
Shape of the compoundchannel section
(1) (2) (3) (4) (5) (6) (7) (8) (9)
Type -I smoothsmoothsmooth
0.00610.00610.0061
52.552.552.5
101010
101010
5.255.255.25
1.221.221.22
Type –II smoothsmoothsmooth
0.0040.0040.004
21.321.321.3
101010
101010
2.132.132.13
1.211.211.21
Type -I I smoothsmooth
0.0040.004
41.841.8
1010
1010
4.184.18
1.211.21
Type -I IRroughroughrough
0.0040.0040.004
21.321.321.3
101010
101010
2.132.132.13
1.211.211.21
Type -I IR roughroughrough
0.0040.0040.004
41.841.841.8
101010
101010
4.184.184.18
1.211.211.21
Type -I II smoothsmoothsmooth
0.002780.002780.00278
138138138
444444
252525
3.1363.1363.136
1.0431.0431.043
Type -IV smoothsmoothsmooth
0.00780.00780.0078
57.757.757.7
121212
121212
4.8084.8084.808
1.441.441.44
MANNING’S RESISTANCE FACTORS FOR VARIOUS CHANNEL SURFACESDistribution of energy in a compound channel section is an important aspect that needs to be addressedproperly. Water that flows in a natural channel is a real fluid for which the action of viscosity and otherforces cannot be ignored completely. Owing to the viscosity, the flow in a channel consumes more energy.While using Manning’s equation, the selection of a suitable value of n is the single most importantparameter for the proper estimation of velocity in an open channel. Major factors affecting Manning’sroughness coefficient are the (i) surface roughness, (ii) vegetation, (iii) channel irregularity, (iv) channelalignment, (v) silting and scouring, (vi) shape and the size of a channel, and (vii) stage-dischargerelationship. Patra (1999), Patra and Kar (2000), Pang (1998), and Willets & Hardwick (1993) have shownthat Manning’s n not only denotes the roughness characteristics of a channel but also the energy loss in theflow. The influences of all the forces that resist the flow in an open channel are assumed to have beenlumped to a single coefficient n. Due to flow interaction between the main channel and floodplain, the flow in a compound sectionconsumes more energy than a channel with simple section carrying the same flow and having the same typeof channel surface. The energy loss is manifested in the form of variation of resistance coefficients of thechannel with depth of flow. The variation of Manning’s roughness coefficient n, Chezy’s C and Darcy -Weisbach friction factor f with depths of flow ranging from in-bank channel to the over-bank flow arediscussed. Floodplains of river basins are densely vegetated. The values of n are determined from thefactors that influence the roughness of a channel and floodplain. In densely vegetated flood plains, themajor roughness is caused by trees, vines, and brush. The n value for this type of floodplain can bedetermined by measuring the vegetation density of the floodplain. Suggested values for Manning's n are tabulated in Chow (1959), and Henderson (1966). Roughnesscharacteristics of natural channels are given by Barnes (1967).Though there are large numbers offormulae/procedures available to calculate Manning’s n for a river reach, the following four methods arefound to be more usefull.
B
b
H
B
h
b
H
B
bh
H
B
bh
H
B
h
b
H
BH
bh
B
b
Hh
1. Jarrett’s (1984) equation for high gradient channels16.0
38.032.0R
Sn = (5)
where S is the channel gradient, R the hydraulic radius in meters. The equation was developed for naturalmain channels having stable bed and bank materials (boulders) without bed rock. It is intended for channelgradients from 0.002 – 0.04 and hydraulic radii from 0.15 – 2.1m, although Jarrett noted that extrapolationto large flows should not be too much in error as long as the channel substrate remains fairly stable.
2. Limerions’s (1970) equation for natural alluvial channels)/log(216.1
0926.0
84
17.0
dRRn
+= (6)
where R is the hydraulic radius and d84 the size of the intermediate particles of diameter that equals orexceeds that of 84% of the streambed particles, with both variables in feet. This equation was developed fordischarges from 6 – 430 m3/s, and n/R0.17 ratios up to 300 although it is reported that little change occursover R > 30.
3. Visual estimation of n values can be performed at each site using Barne’s (1967) as a guideline.
4. The Cowan (1956) method for estimation of n, as modified by Arcement and Schneider (1989) isdesigned specifically to account for floodplain resistance given as
n = (nb + n1 + n2 + n3 + n4) m (7)
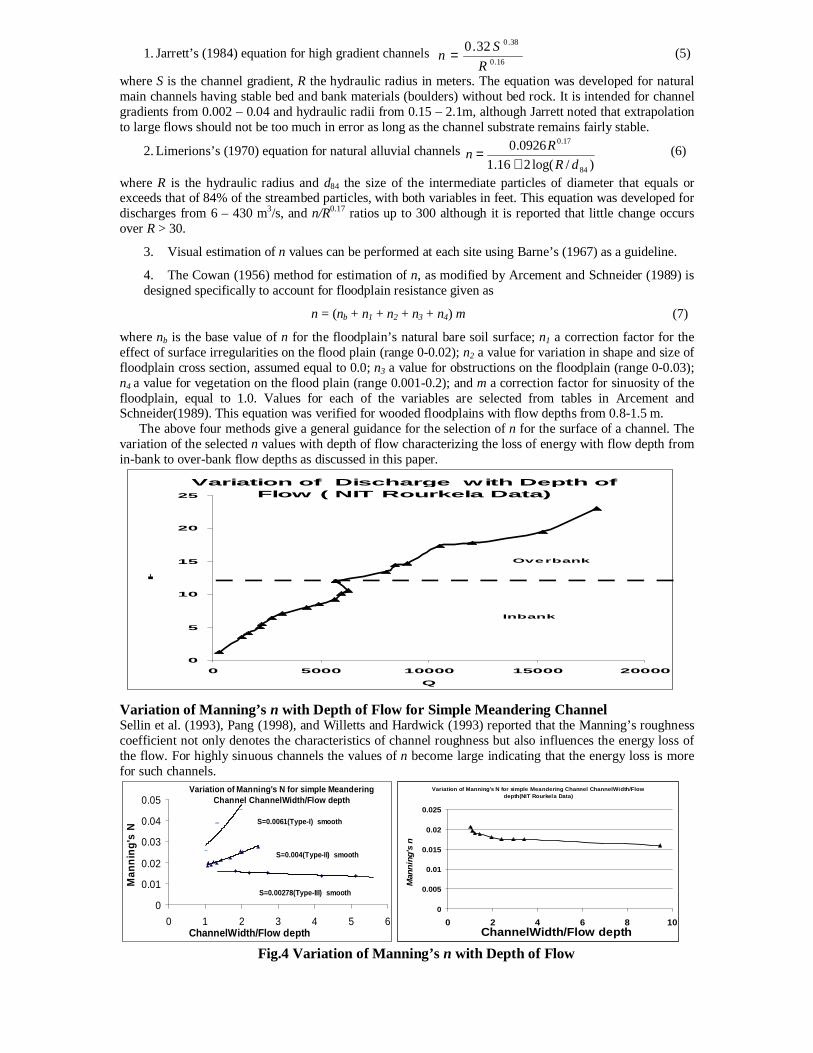
where nb is the base value of n for the floodplain’s natural bare soil surface; n1 a correction factor for theeffect of surface irregularities on the flood plain (range 0-0.02); n2 a value for variation in shape and size offloodplain cross section, assumed equal to 0.0; n3 a value for obstructions on the floodplain (range 0-0.03);n4 a value for vegetation on the flood plain (range 0.001-0.2); and m a correction factor for sinuosity of thefloodplain, equal to 1.0. Values for each of the variables are selected from tables in Arcement andSchneider(1989). This equation was verified for wooded floodplains with flow depths from 0.8-1.5 m. The above four methods give a general guidance for the selection of n for the surface of a channel. Thevariation of the selected n values with depth of flow characterizing the loss of energy with flow depth fromin-bank to over-bank flow depths as discussed in this paper.
Variation of Discharge with Depth ofFlow ( NIT Rourkela Data)
0
5
10
15
20
25
0 5000 10000 15000 20000
Q
H
Inbank
Overbank
Variation of Manning’s n with Depth of Flow for Simple Meandering ChannelSellin et al. (1993), Pang (1998), and Willetts and Hardwick (1993) reported that the Manning’s roughnesscoefficient not only denotes the characteristics of channel roughness but also influences the energy loss ofthe flow. For highly sinuous channels the values of n become large indicating that the energy loss is morefor such channels.
Variation of Manning's N for simple MeanderingChannel ChannelWidth/Flow depth
0
0.01
0.02
0.03
0.04
0.05
0 1 2 3 4 5 6ChannelWidth/Flow depth
Man
ning
's N
S=0.0061(Type-I) smooth
S=0.004(Type-II) smooth
S=0.00278(Type-III) smooth
Variation of Manning's N for simple Meandering Channel ChannelWidth/Flowdepth(NIT Rourkela Data)
0
0.005
0.01
0.015
0.02
0.025
0 2 4 6 8 10ChannelWidth/Flow depth
Man
ning
's n
Fig.4 Variation of Manning’s n with Depth of Flow

The experimental results for Manning’s n with depth of flow for simple meander channels are plotted inFig. 4. The plot indicates that the value of n increases as the flow depth increases. An increase in the valueof n can be mainly due to the increase in resistance to flow for wider channel with shallow depthconsuming more energy than narrower and deep channel. It can also be seen from Fig. 4 is that steeperchannels consume more energy than the flatter channels.
Variation of Manning’s n with Depth of Flow from Simple to Compound MeanderingChannels The variation of Manning’s n with depth of flow for the types of channels investigated show a divergenttrend (Fig. 5). For the type-I, series-I channel there is a decrease in the value of n from run No. 1 to run No.3 (Fig. 5a). This indicates that the simple meander channel of series - I consume less energy as the depth offlow increases. When the channel overtops and spreads its water to the adjoining floodplain (series-II), asudden increase in the value of n can be noticed. This is mainly due to the increased resistance to flow inthe compound section resulting from the interaction of flow between main channel and floodplain. Thevalues of n decrease from run No. 1 to run No.2 (Fig. 5a). This is mainly due to the gradual completion ofthe process of flow interaction between the two depths of flow in the over bank flow situation. At furtherincrease in depth of flow in the floodplain, the results show an increase in the value of n. The increase inthe value of n from run No.2 to run No.3 is due to the reversal of flow interaction. At this depth thefloodplain supplies momentum to the main channel.
For simple meander channel of type-II, series-III (Fig. 5b), there is a gradual decrease in the value of nwith increase in depth of flow from run No.1 to run No. 3. As the flow overtops the main channel andspreads to the floodplain, there is further decrease in the value of n from run No. 3, series III to run No.1,series IV. There after the value of Manning’s n gradually increases to attain a steady state. The variation ofManning's n for channel type-II and IIR (Fig. 5c) are nearly similar.
The value of Manning's n for the type III channel exhibit an increasing trend (Fig. 5d). For the simplemeander channel flow, the increase in Manning’s n is mainly due to the increase in strength of secondaryflow induced by curvature resulting in higher loss of energy. Unlike the previous channels, the geometryand slope of this channel causes an additional loss of energy which continues for the depths of flowsinvestigated. The increase in the value of Manning's n from run No. 1 to run No. 3 in the over-bank flow ismainly due to a greater energy loss resulting from the flow interaction between the channel and thefloodplain flows for the ranges of depths investigated.
The value of Manning's n for the type IV channel exhibit an increasing trend (Fig. 5e). For the simplemeander channel flow, the increase in Manning’s n is mainly due to the increase in strength of secondaryflow induced by curvature resulting in higher loss of energy. Unlike the previous channels, the geometryand slope of this channel causes an additional loss of energy which continues for the depths of flowsinvestigated. The increase in the value of Manning's n from run No. 1 to run No. 3 in the over-bank flow ismainly due to a greater energy loss resulting from the flow interaction between the channel and thefloodplain flows for the ranges of depths investigated.
Variation of Manning's n with depth of flow
0
5
10
15
20
25
30
35
0 0.005 0.01 0.015 0.02 0.025 0.03 0.035 0.04 0.045 0.05
V AL UE S O FM AN NIN G 'S R O UG HN E S S CO E FF IC IE NT
S=0.040(Rough)
N(compound)
S=
S=0.0278
N(compound)
S=0.061
N(compound)
S=0.04
Variation of Manning's n (NITRourkela Data)
0
5
10
15
20
25
0 0.02 0.04 0.06Manning's n
Dept
h of
Flo
w
Inbank Flow
Over bank Flow
Fig.2 Variation of Manning’s n with depth of flow from in bank to over bank conditions
For simple meander channel of type-II, series-III (Fig.2b), there is a gradual decrease in thevalue of n with increase in depth of flow from run No.1 to run No. 3. As the flow overtops themain channel and spreads to the floodplain, there is further decrease in the value of n from runNo. 3, series III to run No.1, series IV. There after the value of Manning’s n gradually increasesto attain a steady state. The variation of Manning's n for channel type-II and IIR are nearlysimilar. The value of Manning's n for the type III channel exhibit an increasing trend (Fig. 2c). For thesimple meander channel flow, the increase in Manning’s n is mainly due to the increase instrength of secondary flow induced by curvature resulting in higher loss of energy. Unlike theprevious channels, the geometry and slope of this channel causes an additional loss of energywhich continues for the depths of flows investigated. The increase in the value of Manning's nfrom run No. 1 to run No. 3 in the over-bank flow is mainly due to a greater energy loss resultingfrom the flow interaction between the channel and the floodplain flows for the ranges of depthsinvestigated. The above discussion indicates that the assumption of an average value of flow resistancecoefficient in terms of Manning’s n for all depths of flow may result in significant errors indischarge estimation.
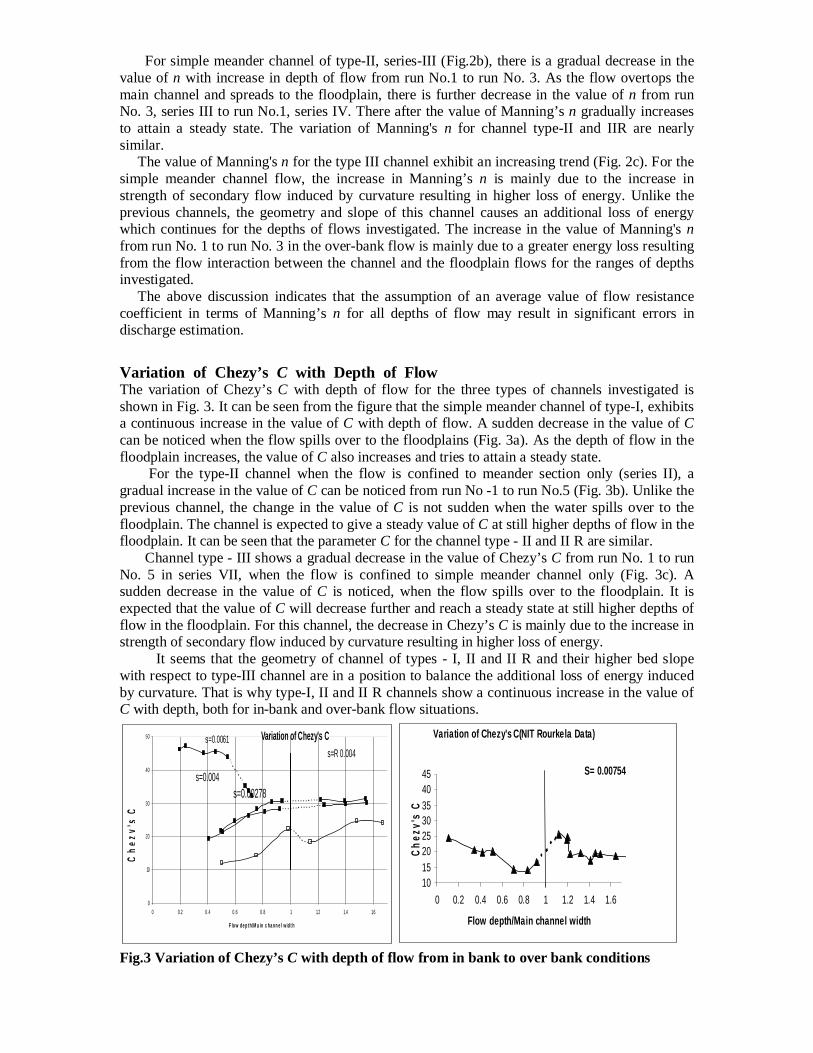
Variation of Chezy’s C with Depth of FlowThe variation of Chezy’s C with depth of flow for the three types of channels investigated isshown in Fig. 3. It can be seen from the figure that the simple meander channel of type-I, exhibitsa continuous increase in the value of C with depth of flow. A sudden decrease in the value of Ccan be noticed when the flow spills over to the floodplains (Fig. 3a). As the depth of flow in thefloodplain increases, the value of C also increases and tries to attain a steady state. For the type-II channel when the flow is confined to meander section only (series II), agradual increase in the value of C can be noticed from run No -1 to run No.5 (Fig. 3b). Unlike theprevious channel, the change in the value of C is not sudden when the water spills over to thefloodplain. The channel is expected to give a steady value of C at still higher depths of flow in thefloodplain. It can be seen that the parameter C for the channel type - II and II R are similar. Channel type - III shows a gradual decrease in the value of Chezy’s C from run No. 1 to runNo. 5 in series VII, when the flow is confined to simple meander channel only (Fig. 3c). Asudden decrease in the value of C is noticed, when the flow spills over to the floodplain. It isexpected that the value of C will decrease further and reach a steady state at still higher depths offlow in the floodplain. For this channel, the decrease in Chezy’s C is mainly due to the increase instrength of secondary flow induced by curvature resulting in higher loss of energy. It seems that the geometry of channel of types - I, II and II R and their higher bed slopewith respect to type-III channel are in a position to balance the additional loss of energy inducedby curvature. That is why type-I, II and II R channels show a continuous increase in the value ofC with depth, both for in-bank and over-bank flow situations.
Variation of Chezy's C
0
10
20
30
40
50
0 0.2 0.4 0.6 0.8 1 1.2 1.4 1.6
F lo w de p th/M a in c ha nn e l w id t h
Che
zy's
C
s=0.0061
s=0.00278
s=R 0.004
s=0.004
Variation of Chezy's C(NIT Rourkela Data)
1015202530354045
0 0.2 0.4 0.6 0.8 1 1.2 1.4 1.6
Flow depth/Main channel width
Chez
y's
C
S= 0.00754
Fig.3 Variation of Chezy’s C with depth of flow from in bank to over bank conditions

Variation of Darcy-Weisbach Friction Factor f with Depth of FlowThe variation of friction term f with depth of flow for the channel types I, II, IIR and III is shownin Fig.4. The behavioral trend of friction factor f is nearly similar to that of the variation ofManning’s n.
Variation ofFriction Factor 'f'
00.050.1
0.150.2
0.250.3
0.350.4
0.45
0 0.2 0.4 0.6 0.8 1 1.2 1.4 1.6
Flow depth/Main channel width
Fric
tion
Fact
or
'f'
Slope=0.0061
Fig.5(d)
Type-III(Smooth)s=R 0.004
s=0.00278s=0.00278s=0.004
Variation of Friction Factor 'f'(NIT Rourkela Data)
00.050.1
0.150.2
0.250.3
0.350.4
0.45
0 0.2 0.4 0.6 0.8 1 1.2 1.4 1.6Flow depth/Main channel width
Fric
tion
Fact
or '
f'
S=0.00754
Fig.4 Variation of Darcy-Weisbach Factor f with depth of flow from in bank to over bankflow
1. The flow resistance changes abruptly at the bankfull stage, and varies significantlywith depth. For overbank flow, it generally increases as the flow depth increases,
2. Manning’s or Chezy’s coefficient n not only denotes the roughness characteristics of achannel but also the energy loss of the flow. It is an established fact that the influences of allthe forces that resist the flow in an open channel are assumed to have been lumped to a singlecoefficient n.
3. Even for simple meandering channels carrying in bank flows, these coefficients are found tovary with depth of flow in the channel. Manning’s n is found to decrease with depth fornarrow channels while for wide channels it is found to increase with depth of flow in thechannel. The behaviour of Manning’s n is also found to be erratic in the over bank flowconditions for the three types of channels investigated.
4. The coefficients for Chezy’s c and Darcy-Weisbach f friction factors from in bankflow to over bank flow are found to be in line with the behaviour of Manning’s n.
5. The assumption of an average value of flow resistance coefficient in terms ofManning’s n for all depths of flow may result in significant errors in dischargeestimation.
6. No trend in the energy loss parameter nS f / could be established for the five types ofchannels investigated when plotted for their values ranging from in bank to over bank flows.
7. The interaction of flow between the main channel and floodplain, the channel size, shape, andslope are found to influence the coefficients n, c, and f more than the other forces.
8. The main reason for discharge decrease in the main channel and increase in the floodplain isbecause of the change in energy distribution in the flow field. The river flow consumes moreenergy in the main channel and less energy in the floodplain. When the river flow consumesmore energy, it also passes less discharge. On the contrary, when the flow consumes lessenergy, it passes more discharge.
REFERENCESAcrement,G.J ., Jr; and Schneider,V.R.(1989) .‘‘Guide for selecting Manning’s roughness coefficients for
natural channels and flood plains.’’ U.S.Geological survey Water-Supply paper 2339, FederalCenter,Colo.

Barnes, H.H., Jr.(1967)Roughness characteristics of natural channels: U.S. Geological Survey Water-Supply Paper 1849, 213
Bhattacharya, A. K. (1995). ‘‘Mathematical model of flow in meandering channel.’’ PhD thesis, IIT,Kharagpur, India.
Carter, R.W., Einstein, H.A., Hinds, Julian, Powell, R.W., and Silberman, E., 1963,Chow, V.T.( 1959) “Open-channel hydraulics” New York, McGraw- Hill Book Co., 680 pCowan,W.L.. (1956). ‘‘Estimating Hydraulic roughness Coefficients.’’ Agric. Engrg, 37 ,473-475.Jarrett,R.D. (1984). ‘‘Hydraulics of high gradient streams.’’ J. Hydr. Engrg., ASCE, 110, 1519–1539.Knight, D.W., and Shino, K. (1996).‘‘River Channel and Floodplain Hydraulics.Floodplain
Processes.,Edited by M.G.Anderson,Des E.Walling and Paul D.Limerinos,J.T..(1970) .‘‘Determination of Manning’s coefficients from measured bed roughness in natural
channels.’’ U.S.Geological survey Water-Supply paper 1898 -B,Federal Center, Colo.Pang, B. (1998). ‘‘River flood flow and its energy loss.’’ J. Hydr. Engrg., ASCE, 124(2), 228–231.Patra, K.C (1999), Flow Interaction of Meandering River With Floodplains,” Ph.D thesis submitted at IIT
KharagpurPatra, K.C, and Kar, S. K., (2000), Flow Interaction of Meandering River With Floodplains,” . Hydr.
Engrg., ASCE, 126(8), 593–604Ree, W.O., (1954) “Handbook of channel design for soil and water conservation” Soil Conservation
Service, U.S. Department of Agriculture, SCS-TP-61, 40 p.Sellin, R. H. J., Ervine, D. A., and Willetts, B. B. (1993). ‘‘Behavior of meandering two stage channels.’’
Proc., Instn. Civ. Engrs., Water, Marit. and Energy, 101(June), 99–111.Sellin, R. H. J. (1964). ‘‘A laboratory investigation into the interaction between flow in the channel of a
river and that of its flood plain.’’ La Houille Blanche, Grenoble, France, 7, 793–801.Willetts, B. B., and Hardwick, R. I. (1993). ‘‘Stage dependency for overbank flow in meandering
channels.’’ Proc., Instn. Civ. Engrs., Water, Marit. and Energy, 101(March), 45–54.

Variation of N with H (NIT DATA)
0
5
10
15
20
25
0 0.01 0.02 0.03 0.04 0.05 0.06N
H
0
5
10
15
20
25
30
35
0 200000 400000 600000 800000 1000000 1200000
Inbank
Over bank
Fig. 5 Variation of Manning’s n with depth of flow from in bank to over bank conditions
0
5
10
15
20
25
30
35
0 0.005 0.01 0.015 0.02
h(cm)H

Variation of S/n
-2-1.5
-1-0.5
00.5
1
0 2 4 6S/n
b
sinusity=1.21
sinusity=1.043
sinusity=1.21
sinusity=1.22
Variation of Q with H (NIT DATA)
0
5
10
15
20
25
0 5000 10000 15000 20000 25000 30000
Q
H
Inbank
Overbank
EXPERIMENTAL STUDY OF STAGE-DISCHARGE -RESISTANCE RELATIONSHIPS IN A COMPOUND
CHANNELAbstract:
Keywords: overbank flow, compound channel, sediment transport, flow resistance
1 INTRODUCTION
Our understanding of alluvial hydraulics is still not very good, even for uniform and inbankflows. Our understanding of flood flows and morphological response is inevitably weaker,mainly due to the complexity of two-phase flow and the difficulty of measurement underextreme conditions. However, in the last few decades, a considerable amount of research hasbeen undertaken on over bank flows, especially concerning the main channel/floodplaininteraction effect on the conveyance capacity of the channel, the flow resistance, and theproportional distribution of discharge between the main channel and any associatedfloodplains. Knight & Shiono (1996) and Knight (1999). Of the several methods forpredicting the stage-discharge relationship in compound channels, the 1-D model developedby Ackers (1993) and the analytically based solution to the depth-averaged Navier-Stokesequation, developed by Shiono & Knight (1991), are perhaps among the most promisingmethods currently available.
flow with the main channel flow and its impact on the flow resistance, and channelgeomorphology, most studies have been carried out with smooth floodplains. In order torectify this, a systemic series of laboratory experiments have recently been conducted in acompound channel with different floodplain roughnesses, and are the subject of paper.Particular attention is paid to the stage-discharge relationships, the variation of resistancewith depth.
Experimental setup:
The experiment concerning the flow in simple meander channel and
compound meander channel have been conducted at the Hydraulic
Engineering Laboratory of the Civil Engineering Department, National
Institute of Technology, Rourkela, Orissa. Inside a tilting flume a compound
channel consisting of meandering main channel with flood plains is
fabricated. The channel surfaces made of Perspex sheet, which is taken as
smooth boundary. The tilting flume is made up of metal sheet but the wall are
of glass. The tilting set-up is 12 m long, 0.6 m wide and 0.6 m deep.
Water is supplied to the experimental channel from an overhead tank. An
overflow arrangement in the overhead tank enables to draw water with
constant flow head. The stilling tank located at the upstream of the channel
has two baffle walls to reduce the turbulence of the incoming water. An
arrangement of tail gate is there for making the flow uniform . From the
sump water is pumped back to the overhead tank, thus setting complete re-
circulating system of
water supply for the experimental channel. The discharge is measured by
volumetric method. The water is collected in a rectangular tank, for different
time space depth rise in that tank is measured. Minimum time space taken is
from 30 sec to 2 mins. Then by that velocity of flow is calculated. flow depth is
measured by sliding point gauge. Discharge for each flow depth is taken.
In case of simple meander channel Manning’s roughness co-efficient is mainly
dependent on slope, sinuosity and aspect ratio. Aspect ratio is the ratio of
width of channel to depth of flow.
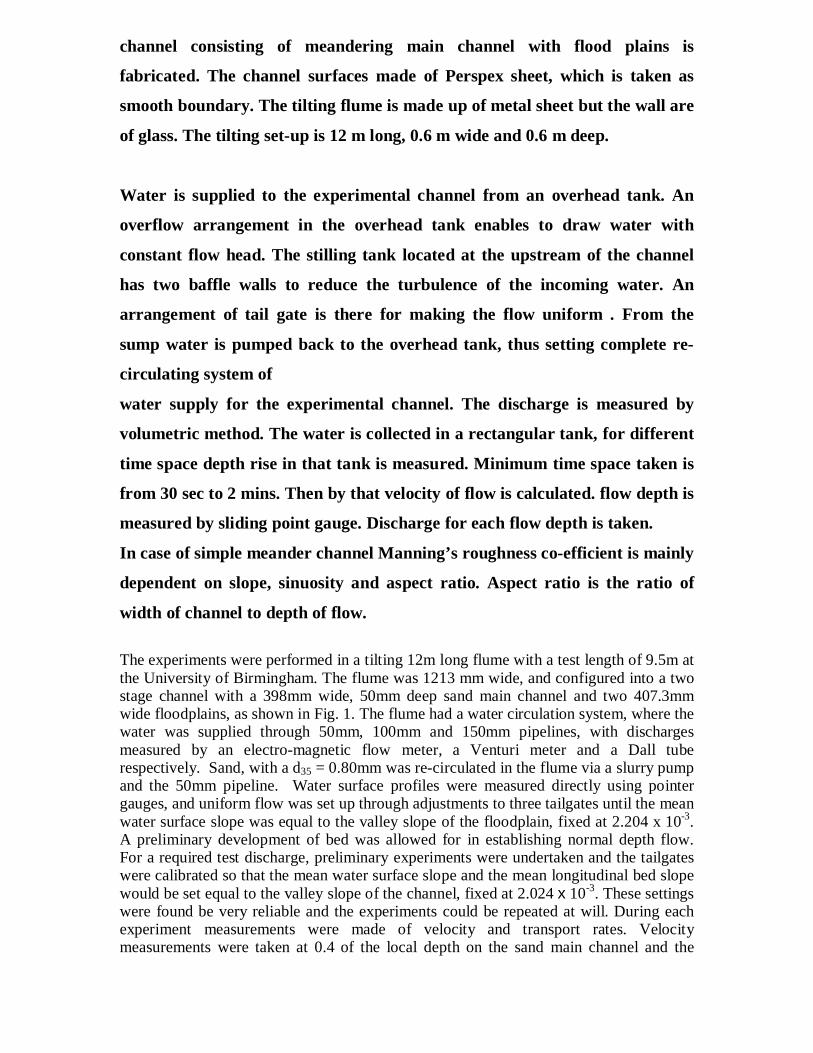
The experiments were performed in a tilting 12m long flume with a test length of 9.5m atthe University of Birmingham. The flume was 1213 mm wide, and configured into a twostage channel with a 398mm wide, 50mm deep sand main channel and two 407.3mmwide floodplains, as shown in Fig. 1. The flume had a water circulation system, where thewater was supplied through 50mm, 100mm and 150mm pipelines, with dischargesmeasured by an electro-magnetic flow meter, a Venturi meter and a Dall tuberespectively. Sand, with a d35 = 0.80mm was re-circulated in the flume via a slurry pumpand the 50mm pipeline. Water surface profiles were measured directly using pointergauges, and uniform flow was set up through adjustments to three tailgates until the meanwater surface slope was equal to the valley slope of the floodplain, fixed at 2.204 x 10-3.A preliminary development of bed was allowed for in establishing normal depth flow.For a required test discharge, preliminary experiments were undertaken and the tailgateswere calibrated so that the mean water surface slope and the mean longitudinal bed slopewould be set equal to the valley slope of the channel, fixed at 2.024 x 10⁻³. These settingswere found be very reliable and the experiments could be repeated at will. During eachexperiment measurements were made of velocity and transport rates. Velocitymeasurements were taken at 0.4 of the local depth on the sand main channel and the

floodplains. Sediment samples were collected manually over 5 ~ 6 minute intervals for atleast 5 times for each experiment whilst the dune migrations movements are recordedmanually over at least 1 hour. For large discharges, bed profiles were also measured atthe conclusion of each experiment with an automatic touch-sensitive bed profiler.


3 EXPERIMENTAL RESULTS
STAGE-DISCHARGE RELATIONSHIPS
It is of interest to compare the differences between the stage-discharge relationships foralluvial channels with inbank and overbank flows with different floodplain roughness. Themeasured H~Q relationships are shown in Fig. 3, with the experimental data for rigidcompound channels (Khatua&Patra, 2006) included as well. In each case, the data are bestfitted by a power function, in a form of H = αQβ, where α and β are constants, given inTable 1, in which H is the flow depth (m) and Q is the discharge (m3/s). As can be seenfrom Fig. 3, there is not a
Table 1 Values of α and β of H~Q relationships
Flow Mainchannel
Floodplain α β Correlationcoefficient
Inbank (isolated)
Overbank
''
''
''
''
''
Mobile
''
''
''
''
''
Rigid
-
smooth
λ = 3 m
λ = 1 m
λ = 0.5 m
λ = 0.25 m
smooth
2.7399
0.3617
0.5781
1.1665
1.8011
2.2496
0.2670
0.8273
0.4092
0.5072
0.6634
0.7601
0.8022
0.3672
0.9979
0.9985
0.9942
0.9972
0.9960
0.9963
0.9973
discontinuity in the H~Q relationship at the bankfull depth of 0.05m for compoundchannels with mobile beds, whereas comparable data for rigid compound channels doshow sharp discontinuities, as reported by Knight & Demetriou (1983), Knight, Shiono &Pirt (1989), Atabay & Knight (1999) and Myers et al. (1999). As would be expected, thedischarges are reduced for mobile bed channels compared with the rigid channels, forboth inbank and overbank flows. Furthermore, for the mobile bed compound channels,the discharge decreases as the roughness on the floodplains increases for the same flowdepth.
4 RESISTANCE RELATIONSHIPS
Standard hydraulic laws were used to represent the resistance to flow, as used by mostpractising engineers, given by the following equivalent forms:
U = R2/3 S1/2 / n or U = [(8g/f) RS ]1/2 (1)
where U is the channel mean velocity, R is the hydraulic radius, S is the friction slope(equal to the valley slope So for uniform flow), g is the gravitational acceleration, and n &f are the Manning and the Darcy-Weisbach resistance coefficients respectively.

The experimental results for n are shown in Fig. 4, together with some data for the rigidchannels for the purpose of comparison. Figs. 4 shows that the resistance coefficient hasan abrupt transition at the bankfull stage, whether the channel is rigid or mobile. Theoverall values of n (and f) are much larger for the mobile channels than for the rigidchannels at the same flow depth. In the mobile bed cases, n increase as the roughness ofthe floodplain increases, i.e. λ from infinity (smooth) to 0.25 m (roughest).
5 VELOCITY DISTRIBUTION AND ZONAL DISCHARGE RELATIONSHIPS
The lateral distribution of mean streamwise velocity was measured over the cross-section,including the sand-bed main channel and the rigid floodplains. A typical transversevelocity distribution is shown in Fig. 5, which shows that the velocity distribution issymmetric, and that there is a minimum value around the centre of the main channel.
The zonal discharges can be calculated by integrating the velocity data over the cross-section. The proportions of the total flow within the main channel and on the floodplainswere thus determined and are shown in Fig. 6 for both smooth and rough cases. Despitesome scatter in the data, largely due to the effect of dune movement, certain trends areapparent. The best-fit equations through the data for the proportion of flow occurring onthe floodplain are:
Smooth:
Qfp% = -435.03 Dr3 +352.63 Dr2 + 40.167 Dr – 0.3645 R2 = 0.9851 (2)
Rough:
Qfp% = a Dr2 + b Dr +c (3)
Where
λ a b c R2
3 m 3.0117 90.355 -0.5585 0.98021 m 14.099 66.092 0.1160 0.9796
0.5m 36.177 44.553 0.1224 0.99740.25m -40.46 66.19 -0.8939 0.9217
and Dr = (H-h)/H, Qfp% = Qfp/Qt x 100, Qfp = the discharge on the floodplain, and Qt =the total flow. Thus the proportion of main channel discharge, Qmc%, can be obtainedfrom
Qmc% = 100 - Qfp% (4)
As might be expected, Fig. 6 clearly indicates that the proportion of discharge in the mainchannel increases as the roughness of the floodplain increases.

Sediment Transport Rates and Bed Forms
An important objective of these experiments was to investigate how the flow structureaffects the sediment transport rate. The determination of the sediment transport rate isimportant in river engineering because it governs the behaviour of the river bed. It alsohelps in understanding the non-equilibrium state, and in specifying the sediment capacityof a channel once an equilibrium state is reached.
The measured sediment transport rates, expressed either in term of weight per second, Gs(g/s) or ppm, X, are shown in Fig. 7 and Fig. 8 respectively, where the sediment transportrates are shown plotted against the total discharge, Qt. As can be seen from theseFigures, Gs increases as the flow rate increases, but X (ppm) only increases up to aroundthe bankfull stage, after which it gradually decreases with increasing overbank flow. Aswould be expected, Gs decreases as the roughness of the floodplain increases. Apreliminary analysis on the measured data gives the following function:
ln Gs = k1 + k2 ln Q + k3 /Q (5)
where Gs is in g/s, Q is in m3/s and the coefficients are as follows:
λ k1 k2 k3 R2
Inbank 3.5455 0.3355 -0.0082 0.9892smooth 1.0765 -0.2529 -0.0113 0.97863 m 0.9442 -0.2577 -0.0106 0.99471 m 1.4836 -0.0679 -0.0080 0.98950.5m 1.3102 -0.0919 -0.0077 0.97700.25m 0.2744 -0.3460 -0.0093 0.9802
For an alluvial river various bed forms, such as ripples, dune, bars and riffles, occur onthe channel bed, depending on the intensity of the flow. Ripples are small bed forms andoccur during very low flows. Dunes are more common, and are much larger than ripplesbut smaller than bars and riffles. The dimensions of a typical dune were found for all theexperiments, as indicated in Fig. 9. This Figure shows that for a comparable discharge,the dune size for the compound channel with a roughened floodplain is much bigger thanthat for the channel with a smooth floodplain. The data also shows that the dune heightincreases as the floodplain roughness increases, for the more or less same discharge.
Fig. 1 Schematic cross section of the flume at University of Birmingham
Fig. 2 Schematic of metal mesh for the roughness on the floodplain
Fig. 3 Comparison of H~Q relationship for mobile compound channels with smooth &rough floodplains
Fig. 4 Relationship of manning's coefficient (n) versus flow depths
Fig. 5 Laterial variation of depth-averaged velocity (Ud) with a roughenedloodplain (λ=0.25m)
Fig. 6 Zonal discharge percentage (%Q) for mobile compound channels with roughfloodplains

Fig. 7 Comparison of sediment transport rate Gs for smooth & rough floodplains
Fig. 8 Sediment concentration vs discharge for smooth & rough floodplain compoundchannel
Fig. 9 Standarised bed level variance for the smooth (Q=27.15l/s) and rough (λ=3m,Q=27.20l/s) floodplains
Analysis of experimental dataSimple Channel:
Slope: 0.000966Aspect ratio (δ) Manning’s roughness co-efficient (n)
0.85 0.0038 0.78 0.0037 0.74 0.0036 0.66 0.0035
0.49 0.0035Slope: 0.00537
Aspect ratio (δ) Manning’s roughness co-efficient (n) 3.19 0.0194 2.91 0.0181 1.41 0.0162 1.29 0.0156 1.18 0.0166Slope: 0.0061
Aspect ratio (δ) Manning’s roughness co-efficient (n) 1.015 0.0256 1.329 0.0386 1.476 0.0401 1.631 0.0427
1.988 0.0452

Variation of Manning's 'n' with aspect ratio fordifferent slopes
Slope:0.000966
Slope:0.0061
Slope:0.00537
0
0.01
0.02
0.03
0.04
0.05
0 0.5 1 1.5 2 2.5 3 3.5
Aspect ratio
Man
ning
's 'n
'
In case of simple channel Manning’s roughness co-efficient varies withdifferent parameters that has discussed earlier in procedure part. Withaspect ratio Manning’s ‘n’ also varies. Aspect ratio and Manning’s ‘n’ aredirectly related to each other. Increase in aspect ratio means decrease indepth of flow for constant width of the channel. In a fixed set-up width ofchannel cannot be varied. Less depth means resistance offered by channel bedis more per unit of flow. Similarly when depth of flow increases thenresistance offered by the channel bed per unit of flow decreases due to thatwith increase of aspect ratio Manning’s roughness co-efficient increases fordifferent slopes. For mild slope increment is less. As slope increases thenincrement of roughness is also more. From the trends of all the curves it isclear that after a large value of aspect ratio roughness value becomes parallelto x axis means roughness value does not increase with aspect ratio.
Compound Channel:
Slope: 0.000966Relative depth (β) Manning’s roughness co-efficient (n)
0.107 0.0033 0.195 0.0035 0.242 0.0036 0.322 0.0038 0.334 0.0040 0.505 0.0041Slope: 0.004
Relative depth (β) Manning’s roughness co-efficient (n) 0.18 0.0179 0.23 0.0184

0.275 0.0188 0.307 0.01885 0.343 0.0189Slope: 0.00537
Relative depth (β) Manning’s roughness co-efficient (n) 0.107 0.0187 0.167 0.0211 0.244 0.0261 0.293 0.027 0.315 0.028 0.334 0.029
Variation of Manning's 'n' with relative depth fordifferent slopes
Slope:0.00537
Slope:0.004
Slope:0.000966
00.005
0.010.015
0.020.025
0.030.035
0 0.1 0.2 0.3 0.4 0.5 0.6
Relative depth
Man
ning
's 'n
'
Analysis of experimental data sets
Sinuosity:1.438Relative depth (β) Manning’s roughness co-efficient (n)
0.107 0.0187 0.167 0.0211 0.244 0.0261 0.293 0.027 0.315 0.028 0.334 0.029
Sinuosity:1.21Relative depth (β) Manning’s roughness co-efficient (n)

0.181 0.0191 0.27 0.0195 0.343 0.0197
Variation of Manning's 'n' with relative depth fordifferent sinuosity
Sinuosity:1.438
Sinuosity:1.21
00.0050.01
0.0150.02
0.0250.03
0.035
0 0.05 0.1 0.15 0.2 0.25 0.3 0.35 0.4
Relative depth
Man
ning
's 'n
'
As the value of sinuosity (Sr) increases Manning’s roughness co-efficient (n)also increases with relative depth (b). Sinuosity more means more bend ispresent in channel length. As bend in a channel is more then more resistanceto flow is there that is offered by that bend. Manning’s roughness co-efficientis nothing but the resistance offered by the bed of a channel. Due to the abovementioned reason Manning’s roughness co-efficient increases.
Co-relation of R and sinuosity (Sr) with Manning’s roughness co-efficient
Manning’s ‘n’ R Sinuosity (Sr)
0.015 0.0725 1.043 0.0179 0.2452 1.21 0.018 0.1781 1.22

0.019 0.2790 1.438 0.036 0.825 3.000
Value of co-relation between R and sinuosity (Sr) is 99.03Value of co-relation between Manning’s ‘n’ and sinuosity (Sr) is 99.74Value of co-relation between Manning’s ‘n’ and R is 99.29
As both R and sinuosity (Sr) are very good co-related with Manning’sroughness co-efficient (n). So we can take any one of them as a dependent forthe determination of Manning’s roughness co-efficient but as sinuosity ismore related than R so here sinuosity (Sr) is taken as dependent one.
Simple channel:
n = 728.45 X nb X Sr X S1.2444 X (-0.0036δ5 + 0.073δ4 - 0.5077δ3 + 1.4559δ2 -1.5679δ + 1.4931)1.3< Sr <1.5
n = 524.83 X nb X nb X Sr X S1.2444 X (-0.0144δ5 + 0.292δ4 – 2.03δ3 + 5.82δ2 –6.27δ + 5.97)1.0< Sr <1.3
Calibration in case of simple channel for sinuosity 1.438
Observed ‘n’ Predicted ‘n’
0.015644 0.0155990.016254 0.016030.016691 0.0152160.01817 0.0193150.019401 0.018750.01693 0.0172870.01809 0.019110.0191 0.018199
Statistical analysis of predicted and observed Manning’s roughness co-efficient
Modeling efficiency = 0.6795
Index of agreement = 0.9281
RMSE = 7.48 X 10⁻⁴

MAE = 5.88 X 10⁻⁴
Co-efficient of determination = 0.797
Compound channel:
n = 21.6591 X nb X Sr X e0.1097α X S0.3471 X (69.13β4 - 50.454β3 + 7.555β2 +0.9761β - 0.0009)For Slope<= 0.001
n = 48.03 X nb X Sr X e0.1097α X S0.3471 X (69.13β4 - 50.454β3 + 7.555β2 +0.9761β - 0.0009)From slope 0.001 to 0.0061
Calibration in case of straight compound channel for slope less than 0.001
observed n predicted n0.00339 0.003350.00399 0.003960.00366 0.003640.00395 0.003970.0037 0.003670.00375 0.003670.00391 0.003990.0038 0.003910.00369 0.003630.00394 0.00387

Statistical analysis of predicted and observed Manning’s roughness co-efficient
Modeling efficiency = 0.873
Index of agreement = 0.971
RMSE = 6.13 X 10⁻⁵
MAE = 5.4 X 10⁻⁵
Co-efficient of determination = 0.9998
Calibration in case of meander compound channel for slope greater than0.001
observedn predicted n
0.02819 0.030440.02997 0.028230.01873 0.019630.018 0.017990.0283 0.027670.03 0.029270.0151 0.014890.02987 0.03001


![STUDY OF IN] CHARACTERISTI TALUATE THE 2D ON THERMAL](https://img.dokumen.tips/doc/110x75/5888dce71a28abb5788ba0f2/study-of-in-characteristi-taluate-the-2d-on-thermal-.jpg)