Embed Size (px)
Citation preview

CBA METHODOLOGIES FOR ELECTRICITY
TRANSMISSION INFRASTRUCTURE AND SCENARIOS
FOR ENERGY AND POWER SYSTEM PLANNING
Final Report V1.2.1
FWC ACER/OP/DIR/08/2013/LOT 3
Req. no. ACER/OP/DIR/08/2013/LOT 3/RFS 02
May 2016

CBA and scenario development for energy and power system planning Final Report
EXERGIA S.A. 1
CONTENTS
ACRONYMS ............................................................................................................. 3
1 INTRODUCTION ................................................................................................ 4
2 ENTSO-E SCENARIO PLANNING for TYNDP ................................................. 6
2.1 SCENARIOS AND CBA: A SOLE BASIS FOR THE TYNDP PROCESS ................................. 6
2.2 SCENARIO OVERALL BUILD-UP PROCESS ........................................................................ 9
2.3 STORY-LINE DEFINITION AND RELEVANT INPUTS ........................................................... 14
2.4 STUDY HORIZON AND VISIONS IN TYNDP 2016 ........................................................... 17
2.5 DATA REFERENCES .................................................................................................... 18
2.6 REPORTING ............................................................................................................... 18
2.7 BOTTOM-UP AND TOP-DOWN APPROACHES .................................................................. 19
2.8 CONSISTENCY OF VISIONS WITH NATIONAL VIEWS AND EC EXPECTATIONS .................... 21
2.9 ENGAGEMENT OF STAKEHOLDERS ............................................................................... 21
2.10 TECHNO-ECONOMIC FEASIBILITY AND RELIABILITY OF VISIONS ....................................... 22
2.11 EVOLUTION OF TECHNOLOGIES ................................................................................... 23
3 Review of THE ENTSO-E CBA METHODOLOGY .......................................... 25
3.1 BACKGROUND ............................................................................................................ 25
3.2 THE CBA IMPLEMENTATION PROCESS ......................................................................... 26
3.2.1 Overall assessment methodology: TOOT vs PINT approach ............................. 27
3.2.2 Clustering of individual investments .................................................................... 29
3.2.3 Impact of future connectees ................................................................................ 30
3.3 TIME-HORIZONS ......................................................................................................... 31
3.4 THE CBA AND MULTI-CRITERIA APPROACH ................................................................. 32
3.5 CBA INDICATORS ....................................................................................................... 33
3.5.1 Overview of CBA indicators ................................................................................. 33
3.5.2 Monetization and other issues of indicators ........................................................ 37
3.5.3 Transmission capacity (GTC) .............................................................................. 41
3.5.4 Issues for consideration of additional impacts of transmission projects .............. 42
3.5.5 Assessment of storage projects .......................................................................... 42
3.6 MARKET AND NETWORK STUDIES ............................................................................... 43
3.6.1 Network study ...................................................................................................... 44
3.6.2 Market study issues ............................................................................................. 44
3.7 AVAILABILITY AND TRANSPARENCY OF CBA BACKGROUND DATA ................................... 46
3.8 CLARIFICATIONS RELATED TO THIRD PARTY PROJECTS ................................................. 47
3.9 TREATING OF UNCERTAINTIES ..................................................................................... 48
4 International (non-EU) experience – the Case of USA ................................. 49
5 Scenario-based and CBA methodologies Review for Selected EU Member
States ..................................................................................................................... 58
5.1 SPAIN ........................................................................................................................ 58
5.1.1 Power system planning........................................................................................ 58
5.1.2 Cost Benefit Analysis ........................................................................................... 59
5.2 ITALY ......................................................................................................................... 59
5.2.1 Power system planning........................................................................................ 59
5.2.2 Cost Benefit Analysis ........................................................................................... 60
5.3 AUSTRIA .................................................................................................................... 61
5.3.1 Power system planning........................................................................................ 61

CBA and scenario development for energy and power system planning Final Report
EXERGIA S.A. 2
5.3.2 Cost Benefit Analysis ........................................................................................... 61
5.4 BELGIUM ................................................................................................................... 62
5.4.1 Power system planning........................................................................................ 62
5.4.2 Cost Benefit Analysis ........................................................................................... 63
5.5 LATVIA ....................................................................................................................... 64
5.5.1 Power system planning........................................................................................ 64
5.5.2 Cost Benefit Analysis ........................................................................................... 64
5.6 UNITED KINGDOM....................................................................................................... 64
5.6.1 Power System Planning....................................................................................... 64
5.6.2 Cost Benefit Analysis ........................................................................................... 66
5.7 FRANCE ..................................................................................................................... 67
5.7.1 Cost Benefit Analysis ........................................................................................... 68
5.8 GERMANY .................................................................................................................. 68
5.8.1 Power System Planning....................................................................................... 68
5.8.2 Cost Benefit Analysis ........................................................................................... 69
5.9 POLAND ..................................................................................................................... 69
5.9.1 Cost Benefit Analysis ........................................................................................... 70
5.10 SLOVAKIA .................................................................................................................. 70
5.11 OVERALL FINDINGS FROM MS REVIEW......................................................................... 71
5.11.1 General remarks on Transmission Development Plans .................................. 71
5.11.2 Scenario building process................................................................................ 72
5.11.3 Generation adequacy ...................................................................................... 73
5.11.4 CBA issues ...................................................................................................... 73
5.12 RECOMMENDATIONS FOR FURTHER HARMONISATION ................................................... 74
6 Concluding overview ..................................................................................... 76
6.1 SCENARIO BUILDING .................................................................................................. 77
6.2 COST BENEFIT ANALYSIS ........................................................................................... 79
6.3 REVIEW OF SELECTED MEMBER STATES ..................................................................... 81
6.4 OVERVIEW OF PROPOSED RECOMMENDATIONS ON SCENARIO DEVELOPMENT AND CBA
METHODOLOGY ...................................................................................................................... 82

CBA and scenario development for energy and power system planning Final Report
EXERGIA S.A. 3
ACRONYMS
ACER Agency for the Co-operation of Energy Regulators
CBA Cost Benefit Analysis
CBCA Cross-Border Cost Allocation
CEER Council of European Energy Regulators
EC European Commission
EENS Expected Energy Not Supplied
ENTSOE European Network of Transmission System Operators for Electricity
ENTSOG European Network of Transmission System Operators for Gas
GTC Grid Transmission Capacity
KPI Key Performance Indicator
MS Member State
NDP National Development Plan
LOLE Loss of Load Expectation
PCI Project of Common Interest
RES Renewable Energy Sources
RG Regional Group
RgIP Regional Investment Plan
SoS Security of Supply
ToR Terms of Reference
TSO Transmission System Operator
TYNDP Ten Year Network Development Plan
VOLL Value of Lost Load

CBA and scenario development for energy and power system planning Final Report
EXERGIA S.A. 4
1 INTRODUCTION
The current document comprises the Final Report of the project “CBA Methodologies for
Electricity Transmission Infrastructure and Scenarios for Energy and Power System Planning”
and presents the findings of the Consultant’s work. The project was procured by the Agency
for the Cooperation of the Energy Regulators (ACER), as a specific assignment under the
Framework Contract – Lot 3 – “Assistance on Technical Issues”.
In accordance with the ToR, the project aimed at:
Describing, assessing and comparing the methodologies used by ENTSO-E and in EU Member States for CBA of investments in electricity transmission networks;
Describing, assessing and comparing the methodologies using scenarios used by ENTSO-E and in EU Member States for energy and power system planning;
Providing recommendations for improvements and consistency
(i) between the national methodologies for CBA and the ENTSO-E CBA methodology,
(ii) between the national methodologies using scenarios for energy and power system
planning and the respective methodology developed and used by ENTSO-E;
The purpose of the study was to contribute to the Agency’s activities in relation to the
scenarios for energy and power system planning and the CBA for electricity transmission
Infrastructure.
In particular, the Study required:
A detailed assessment of the ENTSO-E CBA methodology and provision of
recommendations for potential improvements
A detailed assessment of the ENTSO-E scenario development methodology and
provision of recommendations for potential improvements
A description, assessment and comparison of methodologies used in EU Member States
for CBA for investments in electricity transmission networks
Regulation (EU) No 347/2013 requests ENTSO-E (the European Network of Transmission
System Operators for Electricity) to establish a “methodology, including on network and
market modelling, for a harmonised energy system-wide cost-benefit analysis at Union-wide
level for projects of common interest”. Furthermore, the Regulation requires that the CBA
methodology shall be based on a common input data set representing the European Union’s
electricity and gas systems and assigns to ENTSO-E the responsibility to prepare a CBA
methodology for the assessment of transmission infrastructure projects in electricity. The
methodology should be used to assesses all Ten-Year Network Development Plan (TYNDP)
candidate projects against their value for society and aims to ensure that the selected projects
are those that add the most value.

CBA and scenario development for energy and power system planning Final Report
EXERGIA S.A. 5
On February 2015 and after extensive consultation rounds, ENTSO-E published the CBA
methodology which has been approved by the European Commission. Although this
methodology marked a significant progress since 2012, when ENTSO-E started the preparatory
work for the CBA methodology, further challenges and possible improvements have been
identified by the Agency and were described in the Agency’s Opinion on the ENTSO-E Guideline
for CBA of Grid Development Projects and the Agency’s position of 30/1/2013 on CBA.
Against this overall background and taking into account the Project ToR, the Consultant
proceeded with a detailed review and assessment of the CBA methodology as published in
February 2015 and of the TYNDP 2014 and 2014 and 2016 Scenario Development Reports for
formulating recommendations for improvements.
In parallel, the Consultant proceeded with the collection of information from TSO and NRAs of
10 representative Member States with regard to national practices regarding potential
performance of CBA on national transmission development plans, as well as on preparation
and assessment of national transmission system development scenarios, with the purpose to
identify potential consistencies and form relevant recommendations for harmonization of
national practices with TYNDP development / CBA methodologies.
Accordingly, this Report is organized in three main sections, the first one dealing with the
critical review of the scenario development methodology, the second with the assessment of
the CBA methodology and the third with the review of the situation with scenario development
and CBA assessments in selected MS countries. The Report is concluded with an overview of
the proposed recommendation on all three of the above issues, as well as with a critical
overview of the provided recommendations in terms of implementation priority, difficulty,
effort, associated risks, etc.

CBA and scenario development for energy and power system planning Final Report
EXERGIA S.A. 6
2 ENTSO-E SCENARIO PLANNING FOR TYNDP
2.1 Scenarios and CBA: A Sole Basis for the TYNDP Process
The CBA methodology and scenario planning methodologies have been developed in the
framework of the TYNDP process and comprise the basis on which the main results of the
TYNDP are being grounded on. Due to the intrinsic relationships between TYNDP, scenario
planning and CBA it is important to consider the TYNDP development framework in order to
put in context the purpose and scope of the scenario planning and CBA processes. This will
allow the more targeted and purposeful assessment of the two processes and formulation of
relevant recommendations. It will also illustrate the importance of other supporting processes,
i.e. the market and network studies which are also intrinsically linked to the CBA.
The TYNDP includes the transmission projects necessary to tackle with the future transmission
needs of the electricity sector in Europe and therefore comprises a comprehensive overview
of transmission projects that have a pan-European significance. The major objective of TYNDP
is to demonstrate the future needs for new transmission grid infrastructure and inform
properly the decision makers and the stakeholders.
The TYNDP is published every two years and is developed for the entire ENTSO-E area that
includes the EU MS, as well as several non-EU countries. Despite the fact that non-EU ENTSO-E
countries are in a process of aligning with the EU energy acquis, their legislative and regulatory
incompatibilities (e.g. absence of NREAPs, non-binding targets etc.) increase the effort and
complexity for obtaining ENTSO-E wide harmonised scenarios and perspective for the future.
The TYNDP 2014 was prepared assessing the period up to 2030, and the analysis was based on
the system outlook in the year 2030. The forthcoming TYNDP for 2016, shall cover again the
period up to 2030, and is expected to base the corresponding analysis and results on two time
points, i.e. 2020 and 2030.
The TYNDP process, which is illustrated schematically in Figure 2.1, is carried out through the
following steps:

CBA and scenario development for energy and power system planning Final Report
EXERGIA S.A. 7
Figure 2.1: TYNDP network planning phases
The TSOs and third parties submit to ENTSO-E the cross-border transmission project
investments which they are developing and/or consider for development. Third parties
include non-ENTSO-E TSOs and other potential investors that are interested in electricity
transmission business.
The submitted transmission investments are validated / filtered by ENTSO-E against
certain pre-conditions they need to fulfil, which however do not relate to any sort of
evaluation or assessment of the investment. Subject to the fulfilment of these pre-
conditions, the investments are registered for the next TYNDP.
ENTSO-E proceeds with the development of a number of scenarios which describe
possible future evolutions in load demand and generation mix, considering alternative
developments of major factors affecting the European power system, e.g. RES
development, decarbonisation, energy efficiency, etc.
Each registered candidate investment (alone or clustered with other investments) is
assessed against each of the alternative scenarios. Each such assessment comprises
effectively the carrying out of a corresponding CBA in accordance with the approved
relevant methodology. The CBA comprises the assessment of a series of impact and
benefit indicators. It incorporates procedures for the detection of weak transmission
corridors and definition of relevant transmission needs (referred as “boundaries”) and
grouping the transmission investments into “clusters” (called “projects”) on the basis of
certain criteria.
The Scenarios and the resulting TYNDP are subject to a wide consultation process, which is
carried out during every TYNDP development cycle. The CBA methodology has been subject to
Scenario building
Scenario 1 Scenario 2 Scenario n
CBA
. . .
TYNDP
Network studies Market studies

CBA and scenario development for energy and power system planning Final Report
EXERGIA S.A. 8
a wide consultation process as well, which concluded with its approval by the European
Commission in February 2015. It is noted that the application of the CBA methodology to TYNDP
projects is based to a great extent on data which are derived through the so called Regional
“Market Studies” and “Network Studies”, which are also carried out during the TYNDP
development process. These studies are therefore important supporting components of the
CBA methodology, and in this context they are reviewed and assessed in a corresponding
relevant section of this Report.
The whole TYNDP development process is carried out under the responsibility of ENTSO-E.
However, as ENTSO-E relies heavily on the work of its member TSOs, it is understood that
certain tasks are carried out in a decentralised manner by member TSOs, or the relevant
Regional Groups. It is also understood that, depending on the case, the work may be carried
out on different subsets of data. Thus, the scenarios are developed on the basis of a pan-
European global view at the ENTSO-E level, i.e. taking into account the power system of all
ENTSO-E members, while the CBA of each project is performed by the ENTSO-E Regional
Groups, principally on the basis of the corresponding regional part of the power system.
The TYNDP development process is concluded with the publication of the TYNDP package
which provides a global description of the foreseen main attributes of the future electric
system in Europe and relevant figures at the pan-European and national level. Such attributes
include for example the load evolution, electric energy balances and RES capacity and
generation levels, CO2 emissions levels, estimations on electricity prices, new transmission
costs, transfer capacities, estimated power flows, etc. for the years(s) that the power system
has been analysed for. Thus, in the case of TYNDP 2014, these figures are presented for 2030
alone.
There is also specific information on each transmission project that is part of the TYNDP. This
information comprises:
A description of the main parameters of the project (length, voltage level, etc.)
An approximate geographical representation
The CBA indicators assessment results for each scenario, for the year of analysis (2030 in
the case of TYNDP 2014)
The TYNDP package includes, as well, 6 Regional Investment Plans (RgIPs) providing similar
information as above on projects of regional significance and a System Outlook and Adequacy
Report (SOAF).
Beyond TYNDP, the CBA is further used in the context of the PCI selection process. During this
process, it is understood that CBA results are among the criteria for ranking candidate PCIs and
therefore for the selection of those that will be eventually introduced in the PCI list and receive
EU co-funding.
Given the aforementioned context, the Consultant considers reasonable to assess first the
scenario planning process and then the CBA methodology taking into account the overall
framework these are carried in and the associated objectives, as well as to include in this
assessment the supporting tools used, e.g. the network and market studies for which the CBA

CBA and scenario development for energy and power system planning Final Report
EXERGIA S.A. 9
methodology makes a high level reference to the context of their use in the CBA process. The
following sections discuss the respective findings.
2.2 Scenario overall build-up process
The scenario building methodology for the TYNDP 2014 was rather short, lacking explanations
and justification on several scenario development aspects, and as such it received several
remarks from the Agency and other stakeholders. In November 2015 and after a public
consultation process, ENTSO-E published the “TYNDP 2016 Scenario Development Report”
(onwards also called the “Report”), which was admittedly a significant step forward and
addressed the major part of the comments and criticism that had been received with regard to
TYNDP 2014.
Table 1 below summarises the comments made by ACER and the way that these comments
have (or have not for that matter) been addressed in the latest TYNDP 2016 Scenario
Development Report.

CBA and scenario development for energy and power system planning Final Report
EXERGIA S.A. 10
Table 1 The Agency’s comments on scenarios and study results as included in Opinion 1/2015
Agency Comment Assessment of comments with regard to 2016 scenarios
ENTSO-E to provide stakeholders with a comprehensive description of assumptions, documentation of data sources, data acquisition and processing methods;
Data sources, documentation and assumptions are presented to a considerably greater level of detail than in 2014 scenarios. Processing methods are presented in much more detail, but more elaboration is required at some points.
ENTSO-E to provide assumptions on hourly load, hourly generating available capacity, available interconnection capacities, fuel prices and CO2 prices in a transparent way in the future Scenario Development reports;
These assumptions have been provided
ENTSO-E to provide more information and clarity on the methodology used for the development of Visions 2 and 4, and on the reasons why these two Visions are characterised as ‘top-down’;
This information has been provided
ENTSO-E to more clearly identify the ‘distance’ between parameters used in the different Visions other than installed renewable energy sources (RES) capacity or load;
The distance between parameters used in scenarios is not clearly identified.
ENTSO-E to assess the TYNDP scenarios against their ‘feasibility’ related to factors such as system adequacy, economic viability of generation investments, flexibility embedded in the assumed system to cope with intermittent RES and dependence on gas-fired generation;
ENTSO-E should place more emphasis on assessing the feasibility of scenarios against these parameters.
ENTSO-E to explain the method used to deal with the recursive process of making assumptions on the level of generation capacities and of calculating the future interconnection capacities;
This issue has been addressed to a large extend, some more clarifications are needed though
ENTSO-E to consider a case of high energy prices and high RES development.
This issue has not been addressed by ENTSO-E
Finally, the Agency suggested that a stakeholder comment on using also a “best estimate” scenario deserves a broader discussion
ENTSO-E has elaborated a scenario reflecting the best estimates of TSOs on developments until 2020 but not until 2030.
ENTSO-E adopts a two-year period for issuing separately the reports relevant to scenario development and to adequacy assessment
ENTSO-E does not appear to have commented on this remark.
Overall, as derived by the above Table, the report on the TYNDP 2016 scenarios represents a
significant improvement on the major part of the comments received for the scenarios
developed for TYNDP 2014.
CBA and scenario development for energy and power system planning Final Report
EXERGIA S.A. 11
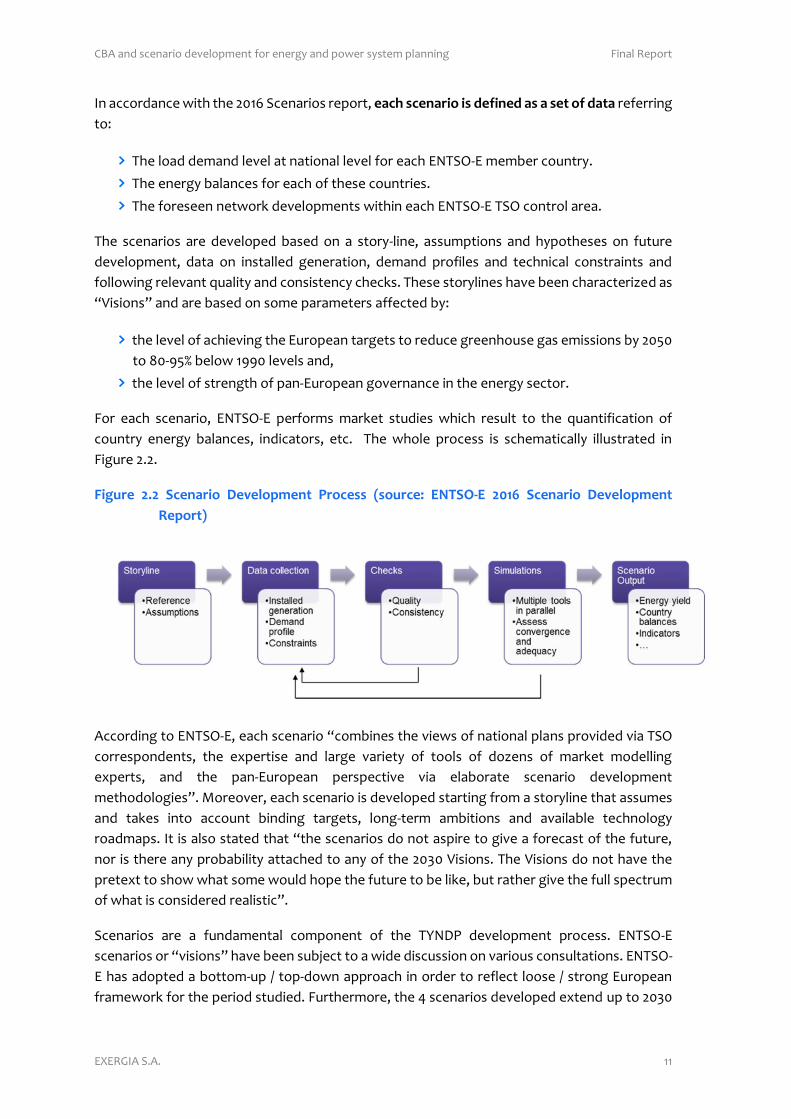
In accordance with the 2016 Scenarios report, each scenario is defined as a set of data referring
to:
The load demand level at national level for each ENTSO-E member country.
The energy balances for each of these countries.
The foreseen network developments within each ENTSO-E TSO control area.
The scenarios are developed based on a story-line, assumptions and hypotheses on future
development, data on installed generation, demand profiles and technical constraints and
following relevant quality and consistency checks. These storylines have been characterized as
“Visions” and are based on some parameters affected by:
the level of achieving the European targets to reduce greenhouse gas emissions by 2050
to 80-95% below 1990 levels and,
the level of strength of pan-European governance in the energy sector.
For each scenario, ENTSO-E performs market studies which result to the quantification of
country energy balances, indicators, etc. The whole process is schematically illustrated in
Figure 2.2.
Figure 2.2 Scenario Development Process (source: ENTSO-E 2016 Scenario Development
Report)
According to ENTSO-E, each scenario “combines the views of national plans provided via TSO
correspondents, the expertise and large variety of tools of dozens of market modelling
experts, and the pan-European perspective via elaborate scenario development
methodologies”. Moreover, each scenario is developed starting from a storyline that assumes
and takes into account binding targets, long-term ambitions and available technology
roadmaps. It is also stated that “the scenarios do not aspire to give a forecast of the future,
nor is there any probability attached to any of the 2030 Visions. The Visions do not have the
pretext to show what some would hope the future to be like, but rather give the full spectrum
of what is considered realistic”.
Scenarios are a fundamental component of the TYNDP development process. ENTSO-E
scenarios or “visions” have been subject to a wide discussion on various consultations. ENTSO-
E has adopted a bottom-up / top-down approach in order to reflect loose / strong European
framework for the period studied. Furthermore, the 4 scenarios developed extend up to 2030

CBA and scenario development for energy and power system planning Final Report
EXERGIA S.A. 12
and they all share a common path up to 2020. Due to the proximity to 2020, this common path
expresses the best estimate scenario up to that time point.
It is understood that this common path is based on the NREAPs of the Member States.
However, the TYNDP 2016 Scenario document does not clarify what are the assumptions
adopted by the TSOs for the development of the scenarios in the 2020-30 period, i.e. to what
extent they are harmonised with the national energy policy / goals, or what assumptions are
adopted for the projections to 2030. It is also not clear what guidelines are provided to the
TSOs for the construction of the bottom up scenarios.
The scenario document provides an overview of the key parameters adopted for each scenario.
However, several of these parameters are expressed in qualitative terms. Clarifications are
required whether the interpretation of these parameters into the specific numeric figures
which is necessary for scenario calculations is left with the TSOs or specific relevant guidelines
are provided by ENTSO-E.
The clarifications on the development of the bottom up scenarios become more important, as
due to the way that the top-down scenarios are developed, they are eventually based to a
significant extent on the structural characteristics of the bottom up scenarios. Subject to any
relevant clarifications, it can be argued that a more co-ordinated approach to bottom up
scenario building by the TSOs would enlarge the value of the scenarios. Such an approach
should consider consistency to other national energy planning documents (e.g. NREAPs,
Adequacy studies and provisions, energy efficiency programs, others, if any), regional
cooperation to assess realistic intra-area transfer capacities and cross-border regulation
possibilities, and common assessment of technical evolutions at the regional level. A
coordinated approach could lead to a “best estimate” scenario at regional level and
consequently at the pan-European level.
On the other hand, determining the detailed scenarios and parameters entails a strong policy
dimension as far as targets and interaction with other energy sectors is concerned. There is
quite a number of other studies developing future scenarios, some of them officially endorsed
by EC, performed by entities such as EC-DG Energy, IEA and other institutions and
organisations, which are more extensively involved with building of policy scenarios due to
their role. In this context, in the Consultant’s opinion, the development of scenarios should be
subject for a broader collaboration and not of consultation alone, especially for the longer term
time periods.
Such collaboration could refer to a range of alternative options, i.e. from the definition of
visions and key scenario parameters to the use of the modelling tools. The Consultant would
recommend that the EC and Member States are more actively involved in the process of
scenarios / visions development and potentially even undertake the overall exercise in broader
collaboration with stakeholders. This approach would allow for more consistency with policy
directions in one hand but it would also take into account the most up-to-date evolution of
technologies. Such a procedure would also increase significantly the transparency and
acceptability of the scenarios among stakeholders and facilitate the effective distribution and
communication of both the approaches and methodologies utilized and the results.
CBA and scenario development for energy and power system planning Final Report
EXERGIA S.A. 13
The Agency and NRAs should keep having a key consulting role by providing opinions and
assessments on the scenarios in the framework of this process. It is also considered that
ENTSO-E could focus in assessing the technical aspects of the scenarios implementation from
the transmission infrastructure point of view, an activity which is also closer to its fundamental
role. This approach would release as well ENTSO-E resources to be used in other activities
related to the CBA assessment.
Independently of the above, in the Consultant’s opinion, due consideration should be paid on
the overall approach of defining 4 visions, considered to ‘provide the envelope within which
the future is likely to occur’1, which raises reasonable question marks whether this ‘envelope’
contains all or the major part of the possible future system evolution states in the long term.
In the Consultant’s opinion, an approach based on the development of a ‘best estimate’ long
term scenario, accompanied by a sensitivity analysis could be potentially less effort intensive
compared to the current approach of the 4 visions, while providing clearer results. The best
estimate scenario assumptions could be adopted through the collaborative process mentioned
above. Through the same process, potential ‘extreme’ values of the key assumptions could be
also defined and used as the basis of the sensitivity analysis during the CBA process. In this way,
CBA indicators could be more illustrative, as they would provide a ‘main’ set of values, and a
range for each these values, instead of a set of 4 distinct values which is the case with the 4
visions approach.
Another general aspect of the scenario development/assessment methodology with power
based models used by ENTSO-E, is that they focus on the electricity sector, with limited, if any,
consideration of the energy sector as a whole, thus ignoring significant interactions and
substitution effects among energy sub-sectors and more specifically between electricity versus
coal and gas, as well of other more general aspects, e.g. elasticity of demand, etc. This is
acknowledged by ENTSO-E in the TYNDP 2016 Scenario Development Report which states that
“on one hand pure energy-models (such as the PRIMES model used in the EC trends) allow to look
forward based on an optimization of all energy components, not purely electricity but also gas
and oil which all interact. On the other hand, power-based models (such as the ones used by
ENTSO-E in this report) are based on electricity market simulations which take into account full-
year hourly based profiles of load and climate data, as well as grid constraints. Such power-based
model allows to assess price zone differentials, RES spillage, country balances, etc.” Although this
is a rational claim, in the Consultant’s opinion, an approach based on a combination of
modelling methodologies could provide more appropriate results. For example, the data (e.g.
electricity energy balances and power generation capacity data) used as input for the market
studies performed by ENTSO-E in the course of CBA assessments could be obtained by those
that have resulted through energy/economy models, which address the complete energy
sector (including gas) and, ideally, have been endorsed by the EC and the MS. In such a case,
ENTSO-E would then undertake to make the required further breakdown to the appropriate
level of detail in order to run the power models it uses and perform analyses at the level of
detail pursued by ENTSO-E. for the market studies. The above approach would have the
advantages of relieving ENTSO-E from a major part of the scenario planning process, and make
1 TYNDP 2016 Scenario Development Report

CBA and scenario development for energy and power system planning Final Report
EXERGIA S.A. 14
the detailed market studies within an already defined overall framework, which has taken into
account the interactions among energy sub-sectors in a more comprehensive manner.
Notwithstanding the above opinion of the Consultant, special care should be given to the gas
sector as being the one with the highest interaction with electricity in several aspects, such as
gas prices and availability, spatial distribution of future gas power plants, economic viability of
gas fired power plants vs RES exploitation, impact on greenhouse emissions by replacing coal
by gas, heat and power cogeneration, viability of future gas power plants under high RES
penetration, technical issues related to future thermal generation mix to achieve required
flexibility to accommodate intermittent RES, etc.
A high level review of the respective TYNDP for the gas sector issued by ENTSO-G on 2015
indicates deviations in many aspects, such as the date of issue (ENTSO-E releases TYNDP on
odd years - ENTSO-G releases TYNDP on even years), the planning horizon (until 2030 for
ENTSO-E, while until 2035 for ENTSO-G), the initial hypotheses, the number of scenarios
considered (two visions for ENTSO-G for 2030 versus four visions for ENTSO-E). It is also noted
that it is difficult to reconcile the gas demand for electricity generation between the gas and
electricity TYNDPs, as the figures in the respective reports are presented only as graphs. These
inconsistencies and non-harmonized practices impact the credibility of both TYNDPs, thus
reducing the acceptability of both documents among stakeholders. It is therefore evident that
there is a need for harmonization of views and consistency of assumptions across electricity
and gas TYNDPs. To the Consultant’s view, a process should be adopted so as to achieve
consistent methodologies and assumptions with respect to all the factors and parameters
affecting the electricity and gas sector interdependence, as well as similar study horizons
across electricity and gas TYNDPs. This harmonization process between the two sectors is a
crucial topic that should be discussed intensively among national electricity and gas TSOs,
ENTSO-E, ENTSO-G, NRAs and ACER.
2.3 Story-line Definition and relevant inputs
Each storyline is defined so as to construct contrasting Visions for 2030 in terms of various
factors that reflect possible evolutions. These factors can be classified to:
Economy and Market
▬ Economic and financial conditions
▬ New market designs
▬ National schemes regarding R&D expenses
▬ Dispatch merit order: primary fuel pricing – carbon pricing
Demand
▬ Energy efficiency developments
▬ New usages (heat pumps, Electric vehicles)
▬ Demand response potential
▬ Smart grid and impact on load & generation patterns
Generation

CBA and scenario development for energy and power system planning Final Report
EXERGIA S.A. 15
▬ RES (wind, solar, hydro (Run of River), biomass)
▬ Back up capacity, nuclear, etc.
▬ Decentralized and centralized storage
In order to build the 2030 visions a set of parameters has been used to reflect long-term future
conditions. These parameters constitute the basis for the quantification of future demand and
generation conditions within each TSO area. Relevant data are provided by TSOs for the
construction of the so called “bottom-up” scenarios and this issue has been discussed in the
previous section. The parameters are differentiated mainly with regard to the progress along
the Energy Road Map 2050 and the harmonization level across Europe (loose to strong
European framework). These parameters reflect a number of possible future evolutions. The
2016 TYNDP scenarios document includes the following Table 2 for presenting a “summary of
characteristic elements of 4 visions”.

CBA and scenario development for energy and power system planning Final Report
EXERGIA S.A. 16
Table 2 Summary of characteristic elements of 4 visions (source: 2016 TYNDP scenarios
report)
Slowest Progress Constrained green
progress National green
transition European Green
revolution
Vision 1 Vision 2 Vision 3 Vision 4
Economic and
financial conditions Least favourable Less favourable More favourable Most favourable
Focus of energy
policies National European National European
Focus of R&D National European National European
CO2 and primary fuel
prices
low CO2 price, high fuel
price
low CO2 price, high fuel
price
high CO2 price, low fuel
price
high CO2 price, low fuel price
RES Low national RES (>=
2020 target) Between V1 and V3 High national RES On track to 2050
Electricity demand
Increase (stagnation to
small growth)
Decrease compared to 2020 (small growth but higher energy efficiency)
stagnation compared to
2020 Increase (growth
demand)
Demand response (and smart grids)
As today Partially used Partially used Fully used
0% 5% 5% 20%
Electric vehicles
No commercial break
through of electric plug-
vehicles
Electric plug-in vehicles
(flexible charging)
Electric plug-in vehicles
(flexible charging)
Electric plug-in vehicles
(flexible charging and
generating)
0% 5% 5% 10%
Heat pumps Minimum level Intermediate level Intermediate level Maximum level
1% 5% 5% 9%
Adequacy
National - not autonomous limited back-
up capacity
European - less back-up capacity
than V1
National - autonomous
high back-up capacity
European - less back-up capacity
than V3
Merit order Coal before gas Coal before gas Gas before coal Gas before coal
Storage As planned today As planned today Decentralized Centralized
As a general comment it is noted that the full disclosure of the scenario building methodology
and assumptions would also allow stakeholders to fully understand the relative position of
scenarios thus increasing both the value of the scenarios and transparency. Additionally, the
detailed explanation of the methodology would allow to fully understand how the
inputs/parameters are related to the outputs, which is currently a “black box” to the reader.
Specific comments on the information provided in the above Table 2 are presented below:
Inputs and results. It is understood that most of the above characteristics are inputs to
the models, while certain refer to the scenario results (e.g. demand, etc.) The table
seems therefore to present a high level view on the scenarios trying to illustrate the
aspects considered as key by the authors. However, we consider that the table should
become clearer and eventually more detailed and informative on the scenario input
assumptions.
Choice of parameters. Under the aforementioned remark and in the absence of a clear
list of input assumptions, it is assumed that key input assumptions have been chosen as
a result of intensive consultation and consideration. Nonetheless, the rationale for
choosing these parameters and not others is not explained in detail by the authors of the
report, especially so, when eventually they reflect policy options. On the other hand, it

CBA and scenario development for energy and power system planning Final Report
EXERGIA S.A. 17
remains unclear if and to what extend other parameters, e.g. the flexibility and ability of
the power grid to integrate more renewables through the provision of the necessary
ancillary services are considered in the scenarios.
Quantification of parameters. A major issue that reduces the clarity and transparency of
the above table and eventually of the methodology is that most of the parameters are
not quantified, but presented in qualitative terms (e.g. electricity demand, RES, etc.). As
already discussed, this leaves unclear the mechanism for interpreting these terms in
numeric figures, the role and approach of each TSO on this and the potential relevant co-
ordination. On the other side, the impact of the interpretation of descriptive values by
each TSO cannot be justified. The Consultant recommends a more robust,
comprehensive and quantifiable description of the story line behind each scenario. This
would also allow for a better assessment of the relative distance among the scenarios
and will increase transparency in line with ACER’s request.
Distance between parameters. Due to the poor quantification the “distance” among the
parameters used to build the different Visions (other than installed thermal and RES
capacity or load) is not clearly defined. Practically, it is difficult to justify how feasible and
realistic or how extreme the visions are and what is the relative distance among them.
Therefore, a more concrete and quantified set of initial hypotheses is needed.
Uniform application of parameters. The values presented in the above table for some
quantified parameters (such as demand response and smart grids, electric vehicles and
heat pump) appear to be uniformly applied throughout the entire ENTSO-E area which
seems not realistic (just note the different level of developments across EU and the
participation of non-EU countries). This hypothesis should be further discussed and
justified.
2.4 Study horizon and Visions in TYNDP 2016
The TYNDP 2016 Visions represent 4 different scenarios to capture contrasting or “extreme”
evolutions in the electricity sector. Each vision reflects similar boundary conditions for every
country so as to capture a realistic range of possible future pathways. Visions differ from each
other on a series of parameters and policy choices as described above. The goal of the scenarios
is to eventually allow TYNDP projects to be assessed across the same range of possible
evolutions. The TYNDP focuses on the long term horizon for the year 2030. Targets set for
renewables, energy efficiency, de-carbonization and interconnections, frame the direction of
the studies and resulting recommendations for grid development up to 2030. Nonetheless, the
absence of a time series of ‘snapshots’ of the generation mix foreseen until the one of 2030
(e.g. annually, every two or five years) does not provide a clear picture of the evolution of the
EU power system.
ENTSO-E has acknowledged this need as a number of stakeholders have expressed the
requirement for shorter timeframes than the single 2030 view. To meet this requirement, for
the TYNDP 2016 a new scenario called “Expected Progress” provides an outlook for 2020 as a
bridge to 2030, and is common to all 4 visions / scenarios for the period 2020-30.
CBA and scenario development for energy and power system planning Final Report
EXERGIA S.A. 18
In Consultant’s view, even though the development of the 2020 scenario is towards a positive
direction, still the disclosure of the energy outlook for more time points time until 2030 remains
a prerequisite to allow for a more comprehensive CBA, as well as for allowing stakeholders and
NRAs to obtain a better insight of each view and relevant justification. Therefore, a full
specification of the location, commissioning date and evolution of new generation capacity
over time is recommended. A corresponding recommendation is also provided in the CBA part
with regard to the provision of a time series of CBA results.
Furthermore, according to Consultant’s assessment there is need for a different treatment of
the long term horizon (˃ 10 years) than the medium term. In this context,
the role of stakeholders could be much more useful in developing long term views as TSOs
typically utilise future data for no more than 10 years ahead and they have no data on very long
term developments. The example of the e-Highways project is a good basis for the involvement
of more participants, other than TSOs, such as universities, agencies, research centers,
technology companies, consultants etc. in the scenario building for long and very long term
horizons.
2.5 Data references
The data references have improved significantly compared to the TYNDP 2014 case and reach
a satisfactory level of transparency. The main source of data for the main cost parameters is
IEA (following a recommendation by stakeholders). Other general accepted sources of data
have been used as a reference.
A major issue related to the development of visions is the non-disclosure of data for a list of
parameters and assumptions. ENTSO-E acknowledges the fact that the important assumptions
at ENTSO-E level might differ from those at the national level, which in turn may lead to
different results from the TSO’s best estimates. Thus, the publication of key data is essential in
order to enhance transparency and accountability of the scenario building and planning
process.
There are some unclear points concerning the data sources (especially at the TSO level) though.
A full specification/description of inputs referring to future development of internal networks
is required as well as the distinction between data that are confidential and those that are or
could be publicly available.
2.6 Reporting
The TYNDP 2016 Scenario Development Report provides draft results per vision and country:
the estimated future demand (MWh), installed capacities per technology (MW) and relevant
energy balances (MWh). The reporting part could be significantly improved by adding more
information especially on:
Peak loads

CBA and scenario development for energy and power system planning Final Report
EXERGIA S.A. 19
Result of demand side measures
Impact of new technologies in electricity share (e.g. electric vehicles, heat pumps)
Equivalent operation hours of thermal units; the latter is of high importance to justify the
economic viability of thermal power plants and impacts severely on the credibility of
each scenario
Imports/exports between countries
Such enrichment of the report would increase transparency and eventually its value for the
stakeholders as they could have a clearer picture of the evolution of the power system. Apart
from public sector stakeholders (NRAs and TSOs) this type of information could also help
private sector stakeholders, particularly transmission project developers better plan their
future investments.
2.7 Bottom-up and top-down approaches
As stated in the TYNDP 2016 Scenario Development Report the set of scenarios (4 visions) for
year 2030 to be considered are classified into bottom-up and top-down scenarios. Bottom-up
scenarios (i.e. 2020 Expected Progress and Visions 1 and 3 for 2030) are created by a straight
forward process as already depicted in Figure 2.2.
The “bottom-up” scenarios have been constructed based on the collection of national figures
that are “combined” so as to produce a pan-European scenario. These data have been provided
by TSOs to the best of their estimations and expertise. The methodology is clear in general with
the exception of the following points:
Data collected by the corresponding TSOs and used for the elaboration of the bottom-
up scenario at the national level follow national methodologies. These data are crucial as
they refer to the most crucial parameters for vision construction (expected installed
generation, demand profiles, transmission constraints etc.). The adoption of a
harmonized procedure and concept would greatly increase the alignment between
ENTSO-E members with regards to the building of the top down scenario.
The extent at which the transmission capacities foreseen for 2030 fit to the individual
transmission National Development Plans (if any).
Some data concerning the level of demand side measures and relevant data on the
impact of electric vehicles and heat pumps per country are not reported at all.
Top-down scenarios (2030 Visions 2 and 4) are developed considering bottom-up scenarios as
a starting point: Vision 1 is used as the basis for Vision 2 and Vision 3 for Vision 4. Top down
scenarios aim to present a future case of the EU energy sector under strong European
governance. The scenario is adapted using a step-by-step procedure starting from capacities
and load profiles and network models so as to reach a pan-European scenario incorporating
European governance and MS coordination. More specifically, this procedure includes
algorithms for the amendment of load profiles, resizing and reallocation of hydro, RES and
thermal generation optimization as shown in Figure 2.3.

CBA and scenario development for energy and power system planning Final Report
EXERGIA S.A. 20
Figure 2.3 Establishment of top-down TYNDP scenarios
The concepts behind the individual methodologies to carry out the steps mentioned above
(shown in Figure 2.3) are well explained and justified. However, there are certain unclear points
on both the data and the specific methodologies used to implement the reported concepts,
e.g.:
There is a need to further clarify the assumptions regarding interconnection capacities
assumed in the top-down scenarios.
The re-sizing and re-allocation of hydros seems to be done in an arbitrary manner; How
reported percentages have been decided? Where is the excess hydro capacity located?
Which is the main source of data?
There is no information on the methodology used to calculate the future Locational
Marginal costs of Production (LMPs). Also the relevant results on LMPs evolution (crucial
for the re-allocation of RES) are not reported.
It is suggested to report more specifically and in more detail the methodologies used within
each process. It will increase the transparency of the entire process and the value of the
scenarios. More information is also needed on the practical details of the implementation
including data used and algorithms, the perimeter of application (e.g. ENTSO-E
wide/regional/National level, consideration of transmission constraints etc.).
Another unclear point is the temporal and spatial allocation of the new conventional and RES
generation within each country. The top-down scenario foresee, in general, more RES and less
thermal, but there is no description of how this new generation (or decommissioned thermal
generation) is allocated within the geographic territory of each TSO. More specifically, the
following questions arise:
Is there a concrete methodology or is this allocation based on each TSOs expertise?
Are there any specific criteria applied?
How is it related to the gas system?

CBA and scenario development for energy and power system planning Final Report
EXERGIA S.A. 21
The above issues should be described in the CBA methodology in order to increase credibility
of visions and a harmonized methodology on the geographical allocation of future generation
is recommended to be applied by all TSOs.
2.8 Consistency of visions with National views and EC expectations
The visions scenario planning methodology has been developed by utilizing data from various
sources including data provided by TSOs. Nevertheless, the methodology pays little attention
on the consistency of visions with national/regional planning scenarios and respective results.
These are by definition closer to reality for the short and medium horizon as they use more
reliable assumptions and data projections focusing exclusively on a country level.
ENTSO-E acknowledges the fact that the final values of these scenarios might not correspond
to the best estimates from the national TSOs, because the important assumptions at ENTSO-E
level might differ from those at the national level. Therefore, it is strongly suggested that the
consistency and alignment between the scenarios developed by ENTSO-E and those on
national level is more thoroughly assessed (especially for the top-down scenarios assuming
strong European governance). It is always possible that the national prospects and relevant
scenarios do not fall within the “Vision square”. Therefore, in order to better inform the
stakeholders, the ENTSO-E scenarios (especially the top-down) should be compared to the
national ones; differences - when they exist – among the national scenarios and the ENTSO-E
visions should be reported and explained, especially if the National scenarios are outside the
“Visions square”.
Independently of the above, we consider that there is a need for a comparison of the 2016
TYNDP scenarios with scenarios developed by other organisations in order to assess whether
there is convergence. Currently, the 2016 Scenario document includes a rough comparison to
IEA scenarios scaling the ENTSO-E scenarios to the EU-28 perimeter. This is a valuable overall
comparison, however, in the Consultant’s opinion, this should be complemented with a
comparison of planned scenarios with the EC approved scenarios. Such comparison should
address both the assumptions used, as well as the resulting energy outlooks, at least in terms
at least of high level energy balance figures. The need for the latter comparison becomes more
obvious when someone considers that PCIs are selected and potentially co-financed on the
basis, among others, of CBA results which in turn are linked TYNDP scenarios.
2.9 Engagement of stakeholders
ENTSO-E has established the “long term network development stakeholders’ group” aiming to
enhance communication between ENTSO-E and stakeholders in order to improve the quality
and robustness of the TYNDP. The specific group aims to contribute towards more productive
information exchanges and the creation of a shared understanding of different views on
relevant development/research/assessment topics. Furthermore, the stakeholder’s group

CBA and scenario development for energy and power system planning Final Report
EXERGIA S.A. 22
according to ENTSO shall “facilitate greater stakeholder involvement in the TYNDP process,
and enable the stakeholders to play an active role in the TYNDP deliverables, as well as increase
acceptability of ENTSO-E development plans”.
The role and impact of stakeholders in the development of the scenarios remains largely
unclear. The consultation with stakeholders includes a series of public workshops and
“Stakeholders group” meetings. The aim of the process is to build up the relevant storylines
and assumptions and to test the acceptance of the scenarios by the stakeholders.
In general, the level of consultations seems adequate, but it remains unclear which input from
the 2030 Visions questionnaire and from the 2030 Visions data consultation has been taken into
account by ENTSO-E. Therefore, it is proposed that ENTSO-E issues an explanatory document
at the beginning of the TYNDP building process dealing with the following issues:
ENTSO-E should address in a proactive manner the “inconsistencies” in forecasts among
the various stakeholders that are coming out as a result of conflicting interests and
explain how these are taken into consideration.
The decision-making process for each building step should be clearly defined, as well as
a methodology to consider stakeholders input in a productive manner.
An explanation of what data will be shared with stakeholders and what data will remain
confidential and why. The provision of a preliminary set of all public data referencing
their source and justifying their selection would greatly improve the consultation
process.
2.10 Techno-economic feasibility and reliability of visions
In order to increase the techno-economic feasibility and reliability of forecasts various aspects
need to be assessed:
Generation adequacy assessment. First of all, a more robust assessment of the
generation adequacy is required for all ENTSO-E countries that would allow for an ex
post validation of the reliability of results. A denser description of the scenarios for the
first 10 years (e.g. per 2 years) and less “snapshots” for the long-term (10 years – 20
years) could provide a more detailed forecast. In this process the TSOs could play a more
increased for the mid-term horizon (5 – 10 years), while the role of public institutions and
stakeholders (as proposed in 2.2.1) should increase for the long term horizon. For these
representative years, simulations could be performed for the assessment of indicators
(LOLP, LOLE, etc.) to justify generation adequacy and available reserves.
System flexibility for RES integration. As a continuation of the previous remark, a
technical assessment is required in order to ensure that there is sufficient flexibility of
conventional generators to meet the forecasted load. Furthermore, consistency is
required between ENTSO-E and ENTSO-G visions due to the high degree of replacing coal
by gas. In order to address these needs, the dependence on gas-fuelled generation needs

CBA and scenario development for energy and power system planning Final Report
EXERGIA S.A. 23
to be assessed, supported by a sensitivity analysis through a “shortage” in gas scenarios
and taking into account cross-border regulation issues.
RES spatial allocation and meteo/hydro assumptions. Another significant issue that
could largely improve the reliability of visions is the thorough allocation of future RES
plants in Europe and the better consideration of meteorological and hydrological data in
order to ensure compatibility with NREAPs and justification of to what extend the plan
is realistic. For instance, various stakeholders during the consultation process (of the
TYNDP 2014) have commented on solar, hydro and pumping assumptions as being too
pessimistic or optimistic. Therefore, RES scenarios should be coordinated with forecasts
of Member States so as to comply with NREAPs and be optimized across Europe based
on the RES potential.
Economic viability of results. The assessment of the economic viability of forecasted
generation (especially thermal) in the study period is essential, as well the assessment of
the resulting electricity cost for the consumers. In addition, the calculation of the
average values to estimate economics per type of thermal generation and RES (taking
into account any policy-driven incentives) seems essential. Furthermore, the assessment
of the cost of ancillary services (and capacity payments) is a key economic consideration
that should be better assessed as these will increase considerably over time.
As a general recommendation is it highly advised that ACER and/or ENTSO-E set techno-
economic criteria for “Vision acceptance”, which are consulted among the stakeholders and
being published. Such criteria should take into account all parameters concerning generation
adequacy, viability of thermal and RES power plants, RES potential across Europe, compatibility
with ENTSO-G TYNDP, etc.
2.11 Evolution of Technologies
Each scenario includes specific assumptions regarding the basic characteristics of certain
technologies such as Electric Vehicles, smart grids, renewables, heat pumps, storage solutions
etc. These assumptions regard specific capital and operational costs, technical efficiencies,
equivalent full load hours for intermittent (RES) of the various technologies which are assumed
by ENTSO-E but not explicitly provided. The involvement of stakeholders in the context of the
stakeholder group must be increased in order to provide more detailed data.
In order to systematize the TYNDP process and address this issue a common pan-European
database publicly available including key data for RES technologies, Electric vehicles, smart
grids, heat pumps, etc. could be created. These data could be provided by relevant
stakeholders (i.e. mainly associations) and also approved by ACER (average/acceptable values)
in order to increase the acceptability of the TYNDP.
Also, this would allow for a better understanding and assessment of the impact of certain
technological evolutions (demand response including “smart grid” impact, electric vehicles
and heat pumps) on scenario outlook that will transform the future electricity grids in the
future.

CBA and scenario development for energy and power system planning Final Report
EXERGIA S.A. 24

CBA and scenario development for energy and power system planning Final Report
EXERGIA S.A. 25
3 REVIEW OF THE ENTSO-E CBA METHODOLOGY
3.1 Background
As per Article 11 of the Regulation 347/20132 of the European Parliament and of the Council on
guidelines for trans-European energy infrastructure, ENTSO-E was requested to elaborate a
methodology aiming at defining the framework for (a) a harmonised energy system-wide cost-
benefit analysis at Union level and (b) the assessment of Candidate PCIs which contribute to
market integration, sustainability and security of supply. The methodology should comply with
the principles laid down in Article 11 and Annexes IV (“Rules and indicators concerning criteria
for projects of common interest”) and V (“Energy system wide cost-benefit analysis”).
The CBA methodology was designed by ENTSO-E with a view to fulfil the above objective and
describe the procedures proposed to be used in order to establish a harmonized methodology
at EU level for assessing transmission and storage projects included in the TYNDP. The ENTSO-
E CBA methodology has been developed following an extensive and long public stakeholder
consultation process.
The assessment presented in this report is based on the latest edition of the methodology that
was issued by ENTSO-E in February 2015 and has been approved by the European Commission.
It is understood that a new edition of the methodology is under preparation by ENTSO-E and is
expected to be released by mid 2016 (currently under Public Consultation).
Overall, the CBA methodology has gone at great lengths towards the fulfilling of the
challenging requirement of establishing a framework for the assessment of transmission
projects taking into account almost all the meaningful/significant cost and benefit indicators
considering both the economic impact but also externalities (social, environmental) and
technical impact. The assessment presented in the following aims at identifying potential for
future improvements.
As already discussed in Chapter 2, the CBA assessment is one fundamental step in the course
of the development of the TYNDP and the PCI selection processes. As depicted in Figure 2.1, its
main components comprise the CBA indicators and the Market and Network studies which are
the main sources for the data for the calculation of the CBA indicators. Therefore, the
assessment of the CBA methodology, which is presented in the following, is addressing all
these components.
2 http://eur-lex.europa.eu/legal-content/EN/TXT/PDF/?uri=CELEX:32013R0347&from=EN

CBA and scenario development for energy and power system planning Final Report
EXERGIA S.A. 26
3.2 The CBA implementation process
The process for CBA assessment of transmission projects in the framework of the TYNDP is
illustrated schematically in the following Figure 3.1.
Figure 3.1 CBA implementation process
The CBA implementation process includes the following steps:
Following filtering of the investments by ENTSO-E, procedures to detect transmission
boundaries and rules to group individual investments into clusters are applied.
The resulting clusters (referred as ‘projects’ in the ENTSO-E terminology) are assessed
using the CBA methodology. The most important sources of calculation of the CBA
indicators are the Regional Market Studies and Network Studies. These tools interact
with each other: the available future GTC through a boundary is calculated by performing
Network studies and is subsequently used as input in the Market study. On the other
hand, the hourly dispatch of available generators is determined using the Market studies
tool and is fed back as input in the Network studies.
The CBA methodology is applied for each TYNDP project and against each scenario (as
analysed in previous Chapter 2). The CBA process comprises the assessment of 9
indicators, two impact indicators (S1, S2) and seven benefit indicators B1 to B7). Some
indicators e.g. B1 to B5 are scenario dependent, while indicators S1, S2, B6 and B7 are not.
On the other hand, five indicators are quantified using physical units such as MW/MWh,
hours, km, tons (S1, S2, B1, B3, B5), two are monetised (B2, B4) and two are qualitatively
CBA and scenario development for energy and power system planning Final Report
EXERGIA S.A. 27
assessed (B6, B7). It is noted that B3 and B5 are internalised in B2. Further information
on the indicators and assessment process is provided in Chapter 3.5 .
The indicators, calculated per project and scenario, are ultimately presented in the
TYNDP.
The CBA assessment of TYNDP projects is a lengthy and resource-intensive process even only
taking into account the sheer number of analyses that need to be performed. As illustrated
above, each project is assessed again each scenario and therefore, market and network studies
that are used as sources for the calculation of indicators, are also carried out for each project /
scenario combination. In general, the methodology foresees that each project is assessed
against the reference network which is defined for each vision. It is possible that the reference
network may be different depending on the vision. It is estimated that the CBA methodology
was applied over 400 times in the framework of the last TYNDP 2014. This process results into
a heavy work load which is undertaken by ENTSO-E Regional Groups (RGs) every two years. It
is understood that sometimes the number of market studies carried out is greater as in many
RG more than one market study tools are applied by different TSOs (as analysed in Chapter
3.6.2). On the other hand, it is understood that network studies comprise a series of load flow
analyses for each project / scenario case, as explained in Chapter 3.6.1 on network studies, thus
increasing even further the work load.
3.2.1 Overall assessment methodology: TOOT vs PINT approach
The estimation of CBA indicators requires the calculation of the impacts resulting and benefits
achieved by the commissioning of each project under assessment. To assign impacts and
benefits to each project, the power system behaviour with and without the project is simulated
and relevant system operation and performance parameters (such as operational costs, CO2
emissions, RES generation, transmission losses etc.) are calculated and compared. These
parameters are calculated based on the results of the Market and Network studies. For each
project/scenario combination, two cases are simulated: with and without the project under
assessment starting from the “reference network”. ENTSO-E proposes two alternative
methodologies which are differentiated as far as the reference network is concerned, i.e.:
the TOOT (Take Out One at the Time) method. There is no explicit reference in the CBA
methodology regarding which is the reference network considered for the application
of the TOOT method, however it can be reasonably assumed that this is the whole
forecasted network (including all future investments which are foreseen to have been
commissioned by 2030 since the CBA analysis is performed for the system only at year
2030. Therefore, the project in question is assessed against the whole forecasted
network, as if it was the last investment to be commissioned. According to ENTSO-E, the
application of TOOT method is suggested for the CBA analysis of transmission
investments for the 2030 horizon in the TYNDP process.
the PINT (Put IN one at the Time) method. In this case, the project is evaluated against a
reference network which is the currently existing network without any of the future
TYNDP and internal projects i.e. the baseline network.

CBA and scenario development for energy and power system planning Final Report
EXERGIA S.A. 28
The assessment using TOOT approach implies the existence of a stronger reference network
(i.e. a network “closer” to a “copper plate”) as it includes all TYNDP projects and all the
forecasted network enhancements at TSO level. According to the TOOT approach, the project
under assessment is considered as the last one to be commissioned and is assessed against the
whole forecasted network. This consideration evidently tends to moderate the results as far as
benefits indicators are concerned, since each project is assessed against a network which is
already significantly reinforced.
In contrast, according to the PINT approach, the project under assessment is evaluated against
a reference network which is the existing network without any of the future TYNDP projects.
Evidently, this approach results to an estimation of larger benefits (in relation to those
estimated in the TOOT case) as each new project is added to a weaker reference network. The
PINT method is recommended for individual project’s assessment outside the TYNDP process.
In conclusion, the TOOT methodology tends to downsize the project’s benefits while PINT
approach tends to oversize them. Although the TOOT method tends to downsize the benefit
indicators it is more appropriate to be used for projects that are foreseen to be commissioned
in the long term timeframe (towards the end of the analysis period), as is the case of the opted
target year (2030). For projects commissioned in the short to medium term timeframe the PINT
approach gives more realistic results. In any case the methodology opted for the assessment
of the projects (either TOOT or PINT) should be the same to allow rational comparisons.
According to the ENTSO-E CBA methodology, the application of TOOT approach is suggested
for the CBA analysis for all transmission investment projects. As mentioned above, since, as
understood by the Consultant, the CBA analysis is performed only for 2030, the method the
TOOT method is applied for each transmission project regardless of its commissioning date.
This seems rational considering the selection of 2030 to assess CBA indicators (2030), as by that
year, it could be assumed that all projects are in place.
Nevertheless, the more forward in time from a project’s commissioning date the reference
network is considered, the higher the aforementioned underestimation effect of the TOOT
method shall be for the specific project. Several of the TYNDP projects commissioning dates
fall within the short and medium term horizon, i.e. they are far from 2030, (i.e. of which year’s
reference network they are assessed with). Thus, for such projects, the use of TOOT method
for their assessment may lead to severe underestimation of CBA indicators (as far as benefits
indicators are concerned).
Since the assessment of the CBA indicators for the TYNDP-2016 projects is referenced to year
2030 conditions, the Consultant would recommend that projects which are planned to be
commissioned in the short to medium term horizon are evaluated using not only the TOOT but
the PINT method as well. The reference network to be applied for the application of the PINT
method could be the existing network of today or the one considered in the “2020 Expected
Progress” scenario (if this is different from the former, depending on the project’s
commissioning date. Such additional results will allow relative comparisons of benefits under
the two extreme network conditions concerning the reference network. In the case of

CBA and scenario development for energy and power system planning Final Report
EXERGIA S.A. 29
candidate PCI projects which are planned to be commissioned in the short to medium term,
such a comparison could potentially allow more informed decisions for the final PCI selection.
3.2.2 Clustering of individual investments
The objective of the TYNDP is to define the needs in transmission infrastructure so as to
alleviate the existing bottlenecks in the transmission network and increase the transfer
capacities within the ENTSO-E system. Special care is given to increase the cross-border
transmission capacities (represented by the so called “Grid Transmission Capacity – GTC”)
among countries in order to increase the cross-border exchanges towards an integrated
European market. In many cases the alleviation of transmission constraints in specific
transmission corridors, requires the enhancement of several parts of the network i.e. the
materialization of more than one transmission investments located in different TSOs areas and
being implemented by different promoters. Thus a transmission infrastructure project can in
practice comprise more than one investment items. To avoid confusion, ENTSO-E uses the
following terminology:
Investment which refers to an individual transmission element, i.e. overhead line, cable,
substation, transformer, etc.
Project which refers to a set of transmission investments which comprise a “group” of
investments complementary to each other to achieve a common goal
Complementary investments / projects that are located in the same area or along the same
transmission corridor and contribute to achieve a common measurable goal, are further
clustered together in order to allow for an appraisal of their interactions and linked benefits
under a “common project” framework. Pursuant to the ENTSO-E CBA methodology, two
quantitative clustering rules exist for an investment to be considered as a part of the project:
Substantial influence of the investment on the project, i.e. the investment contributes by
more than 20% on the total GTC increase obtained by the main investment defined as the
investment that “is intended to bring a highest value of GTC increase across a certain
boundary”
Commissioning dates of the investments which are clustered together are within a
period of maximum 5 years long
According to ENTSO-E, the above clustering rules were deemed significant in order to avoid
excessive clustering. The thresholds were introduced by ENTSO-E experts during the
consultation procedure for the development of the ENTSO-E CBA methodology and are
currently subject to review.
Although clustering of investment is a rational simplification to reduce the work load and avoid
complexity (without jeopardizing the level of accuracy), we consider that it needs some more
clarification and justification. The rules applied (i.e. time gap and 20% of difference in load flows,
with and without the project) are not currently justified and seem to have been established

CBA and scenario development for energy and power system planning Final Report
EXERGIA S.A. 30
rather arbitrarily. A brief presentation of the concept that led to these rules would be needed
in order to understand the underlying rationale.
Further to the above, the Consultant understands that the clustering of investments is
performed, as well, in order to avoid underestimation of the potential net benefits as these
benefits are reached only if complementary investments are materialized as well, while it has
the side benefit to reduce the number of projects/ scenario combinations that need to be
assessed.
Notwithstanding the above, the Consultant would recommend that the clustering rules could
be used as a means to promote better time alignment of the commissioning dates of the cluster
components. To this end, a shorter time gap in commissioning dates could be adopted as
threshold for a ‘no-questions-asked’ clustering.
Independently of the value of the time gap threshold however, it is recommended that this
threshold is not applied “literally”. Instead, promoters wishing to have their projects clustered,
in case the time gap rule is violated by a short margin could be required to provide justified
arguments for the reasons not allowing their projects to be better aligned. Regarding the
aforementioned margin, the shorter the adopted time gap the broader this threshold should
be.
The CBA methodology introduces as well3 the term “competing projects” which are defined as
“projects delivering the same service to the grid”4 (pg. 32). ENTSO-E proposes an elaborate
methodology to assess the level of the transfer capacity needed in cases of competing projects.
However, the definition and determination of competing projects is not clear. For example, the
concept of ‘competition’ is well understood in case of parallel lines connecting two areas, but
it is not obvious if there are other such clear cases of ‘competition’. Generally, there are no
specific rules for identifying competing projects.
Therefore, is recommended that the term “competing projects” is more clearly defined in the
CBA Methodology. Further, it is suggested that the sensitivity of the change of commissioning
date of competing projects is investigated, as it could give useful information on the
“flexibility” of the project as defined by the B7 indicator.
3.2.3 Impact of future connectees
Future extensions of the EU transmission system (North Africa, UA/MD, Turkey, Cyprus etc.)
could have severe impact on the volume of the exchanges and electricity prices. They should
be therefore taken into account on a “realistic” way especially for the long-term horizon.
This impact could be assessed by considering the power system of the future connectee during
the reference network definition, if available information on this system allows such a
consideration, and therefore assessing the impact as part of the overall CBA process. If such
3 Page 23 of CBA Methodology document 4 Page 32 as above
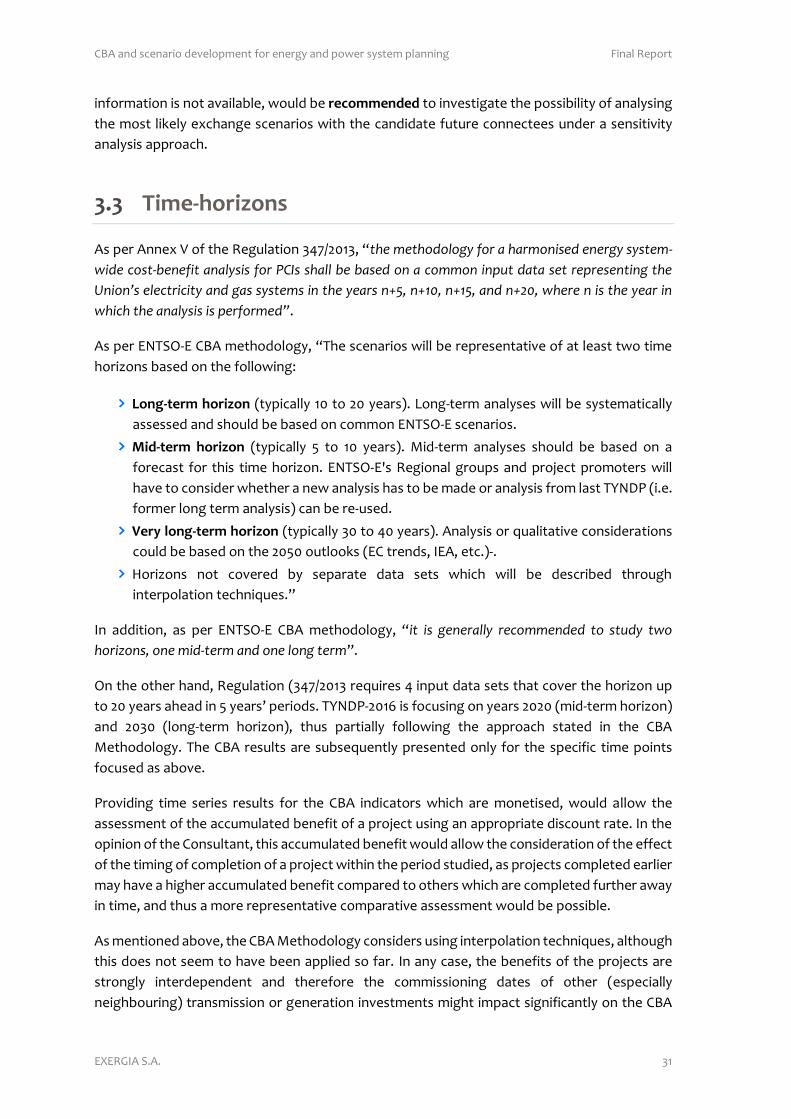
CBA and scenario development for energy and power system planning Final Report
EXERGIA S.A. 31
information is not available, would be recommended to investigate the possibility of analysing
the most likely exchange scenarios with the candidate future connectees under a sensitivity
analysis approach.
3.3 Time-horizons
As per Annex V of the Regulation 347/2013, “the methodology for a harmonised energy system-
wide cost-benefit analysis for PCIs shall be based on a common input data set representing the
Union’s electricity and gas systems in the years n+5, n+10, n+15, and n+20, where n is the year in
which the analysis is performed”.
As per ENTSO-E CBA methodology, “The scenarios will be representative of at least two time
horizons based on the following:
Long-term horizon (typically 10 to 20 years). Long-term analyses will be systematically
assessed and should be based on common ENTSO-E scenarios.
Mid-term horizon (typically 5 to 10 years). Mid-term analyses should be based on a
forecast for this time horizon. ENTSO-E's Regional groups and project promoters will
have to consider whether a new analysis has to be made or analysis from last TYNDP (i.e.
former long term analysis) can be re-used.
Very long-term horizon (typically 30 to 40 years). Analysis or qualitative considerations
could be based on the 2050 outlooks (EC trends, IEA, etc.)-.
Horizons not covered by separate data sets which will be described through
interpolation techniques.”
In addition, as per ENTSO-E CBA methodology, “it is generally recommended to study two
horizons, one mid-term and one long term”.
On the other hand, Regulation (347/2013 requires 4 input data sets that cover the horizon up
to 20 years ahead in 5 years’ periods. TYNDP-2016 is focusing on years 2020 (mid-term horizon)
and 2030 (long-term horizon), thus partially following the approach stated in the CBA
Methodology. The CBA results are subsequently presented only for the specific time points
focused as above.
Providing time series results for the CBA indicators which are monetised, would allow the
assessment of the accumulated benefit of a project using an appropriate discount rate. In the
opinion of the Consultant, this accumulated benefit would allow the consideration of the effect
of the timing of completion of a project within the period studied, as projects completed earlier
may have a higher accumulated benefit compared to others which are completed further away
in time, and thus a more representative comparative assessment would be possible.
As mentioned above, the CBA Methodology considers using interpolation techniques, although
this does not seem to have been applied so far. In any case, the benefits of the projects are
strongly interdependent and therefore the commissioning dates of other (especially
neighbouring) transmission or generation investments might impact significantly on the CBA

CBA and scenario development for energy and power system planning Final Report
EXERGIA S.A. 32
results. Another important aspect is that the electricity sector in Europe is under transition and
the sector may experience significant changes due to technological, regulatory and economic
evolutions. Such changes typically cannot be captured using interpolation techniques.
Therefore, interpolation techniques, if used, should be limited to the shortest possible time
periods.
It is fully understood that the assessment of time series of CBA results would entail a significant
additional workload for ENTSO-E, considering the effort required for a single year assessment
as discussed in the previous section. However, this should be in any case counterweighted
against the resulting increase in the credibility and transparency of results.
It is recommended therefore, that ENTSO-E provides input data sets and performs relevant
network and market analysis results for four time horizons. Such additional analyses would
enable higher compliance with the requirements of the Regulation (EU) No 347/2013 calls for
an analysis at (n+5, n+10, n+15 and n+20 time points. Evidently, it will be more practical selecting
discrete time points for the analyses e.g. 2020, 2025, etc. instead of strictly following the “n+”
rule.
3.4 The CBA and Multi-Criteria Approach
ENTSO-E has adopted a combined cost-benefit (Cost-Benefit Analysis-CBA) and multi-criteria
assessment framework for the analysis of electricity transmission projects within the TYNDP
process in order to comply with the requirements of Article 11 (“Energy system wide cost-
benefit analysis”) and Annexes IV (“Rules and indicators concerning criteria for projects of
common interest”) and V (“Energy system wide cost-benefit analysis”) of the EU Regulation
347/2013. The ENTSO-E CBA methodology is not intended to provide a fully monetized
approach that will rank projects at a European-wide scale; it rather aims to allow for informed
decision-making and improve transparency in displaying costs and benefits in a homogenous
way.
The CBA methodology states in particular that “The multi-criteria approach shows the
characteristics of a project and gives sufficient information to the decision makers. A fully
monetized approach would entail one single monetary value, but because all results of the CBA
are very dependent on the scenarios and horizons, this would lead to a perceived exactness that
does not exist.”
We consider the need for a combined CBA and multi-criteria approach is a valid point, especially
considering that certain of the CBA methodology indicators cannot be monetized and some
can be only expressed on a qualitative scale. Nevertheless, it is understood from the results
provided for the CBA of TYNDP 2014 and the available information on the scenarios for TYNDP
2016, that the relevant network and market studies are performed for one specific year which
is determined by the time horizon (e.g. 2020 and 2030 for the two time horizons of the TYNDP
2016) and not for the whole time-series of the period of analysis.

CBA and scenario development for energy and power system planning Final Report
EXERGIA S.A. 33
On the other hand, a CBA typically entails the assessment of a time series of benefits and costs
over the time period that the CBA is performed on, and the use of an appropriate discount
factor for calculating the Present Value of the overall net benefit. Independently of any multi-
criteria approach, the assessment of time series of impacts and benefits, despite being hinted
on in the CBA methodology (as already mentioned in the previous section) does not seem to
be applied, even for the CBA indicators which are monetized or quantified. Thus, for example
in TYNDP 2015, the CBA indicators are presented only for 2030 for each TYNDP project.
The assessment of such time series however, is necessary in order to have a more complete
assessment of the overall benefit of a project, as by assessing the net benefit only for a single
time point the cumulative net benefit of a project over time is ignored. Thus a project
commissioned on 2025 and one commissioned on 2030 and having the same net benefit on
2030, appear to be equivalent, while they are not. Furthermore, without using an appropriate
discount factor, it is not possible to compare the cost of a project with the net benefit, as these
occur in different points in time.
As per the CBA methodology, “The scenarios will be representative of at least two time
horizons based ……” and “…. Horizons not covered by separate data sets which will be
described through interpolation techniques”. However, interpolating data sets over a 10 or
even longer time period, would be of highly questionable accuracy. On the other hand, it is
understood that performing analyses for each year of the TYNDP period would result in an
unfeasible work load for the CBA of TYNDP. To this end, the assessment of data sets referring
to the number of data points as recommended in the previous section, would allow for shorter
interpolations and thus comparatively better approximation of the values for the in-between
years.
On the other hand, in relation to the indicators that would be considered only under a multi-
criteria point of view, the provision of indicator results which are representative of the whole
period of analysis of the projects rather than for a single time point, would be of much greater
value. Potential solutions in this direction, should be identified and used to the extent possible,
so that eventually, all indicators’ results refer to whole period of analysis. A specific suggestion
to this end is provided in Section 3.5.2 in relation to the CBA indicator (B7) on a project’s
flexibility with regard to different scenarios.
3.5 CBA Indicators
3.5.1 Overview of CBA indicators
The ENTSO-E CBA methodology aims to assess the potential investment costs and the impacts
of electricity transmission projects on the European electricity market, especially in regard with
market integration, competition, system flexibility, security of supply and sustainability. The
impact of each project is assessed through a number of indicators tracing the project’s impact
from different points of view: technical, economic, environmental and social.

CBA and scenario development for energy and power system planning Final Report
EXERGIA S.A. 34
The methodology employs in total the following nine indicators.
S1: Environmental impact
S2: Social impact
B1: Improved Security of Supply (SoS)
B2: Socio-Economic Welfare (SEW)
B3: RES integration
B4: Variation in losses
B5: Variation in CO2 emissions
B6: Technical resilience/system safety
B7: Flexibility
As depicted in Figure 3.2, two of the above indicators comprise ‘cost element’ indicators (S1
and S2) and seven comprise ‘benefit’ indicators (B1 to B7). Also, in addition to the nine
indicators, the total project expenditures (C1) are calculated. It is noted that the specific criteria
applied to the selection of PCIs, i.e. contribution to security of supply, market integration and
sustainability are addressed through indicators B1, B2 and B3-B5 respectively; B2 includes also
sustainability effects.

CBA and scenario development for energy and power system planning Final Report
EXERGIA S.A. 35
Figure 3.2 Cost and benefit indicators considered for the TYNDP project assessment by the
ENTSO-E CBA methodology
A brief description of the nine indicators and their attributes with regard to quantification and
monetisation is provided in Table 3.

CBA and scenario development for energy and power system planning Final Report
EXERGIA S.A. 36
Table 3.1: Overview of CBA indicators
Impact Indicators Brief description Monetization Quantification
1. S1: Environmental impact
Characterises the local impact of the project on nature and biodiversity.
No Kilometres
2. S2: Social impact Characterises the impact of the project on the (local) population, giving a measure of social sensitivity.
No Kilometres
Benefits Indicators Brief description Monetization Quantification
1. B1: Improved Security of Supply
Ability of a power system to provide an adequate and secure supply of electricity under ordinary conditions, in a specific area.
No Hours or MWh
2. B2: Socio-Economic Welfare
Ability of a power system to reduce congestion and thus provide an adequate Grid Transfer Capability (GTC) so that electricity markets can trade power in an economically efficient manner.
Yes EUR
3. B3: RES integration Ability of the system to allow the connection of new RES plants and unlock existing and future “green” generation, while minimising RES plants’ curtailments.
No MW or MWh
4. B4: Variation in losses
Characterisation of the evolution of thermal losses in the power system (energy efficiency).
Yes
5. B5: Variation in CO2 emissions
Characterisation of the evolution of CO2 emissions in the power system.
No tons
6. B6: Technical resilience/ system safety
Ability of the system to withstand increasingly extreme system conditions (exceptional contingencies).
No scored in ++/+/0
7. B7: Flexibility
Ability of the proposed reinforcement to be adequate in different possible future development paths or scenarios, including trade of balancing service.
No scored in ++/+/0
The two benefit indicators, i.e. B3: RES integration and B5: Variation in CO2 emissions
(highlighted in “grey” in Table 3), are internalised in the benefit indicator B2: Socio-Economic
Welfare (SEW). Thus, they are quantified and presented principally in order to provide more
complete information but they are not accounted twice. The rest of the benefit indicators, i.e.
B1, B4, B6 and B7 do not overlap with the exception of a certain overlapping between indicators
B1: Improved Security of Supply and B6: Technical resilience/system safety. This is due to the fact
that, in theory, failures and maintenance periods - although very short - have an effect on
security of supply. However, in the Consultant’s opinion, this overlap is practically negligible.
Concerning the impact indicator, S1: Environmental Impact, ENTSO-E states that it is also
partially internalised in the total project expenditures (C1) through the compensation for
environmental costs avoided/ mitigated. Thus, the impact indicators S1 and S2 consider only
the residual impact of the project, i.e. the portion of impact remaining after potential mitigation
measures and their associated costs have been considered under the total project

CBA and scenario development for energy and power system planning Final Report
EXERGIA S.A. 37
expenditures (C1). S1 and S2 cannot be expressed in monetary terms, otherwise they would be
considered under C1. They are presented separately and are quantified in terms of the number
of kilometers, an overhead line or underground/ submarine cable (may) run through,
environmentally “sensitive” areas.
ENTSO-E has placed great emphasis on defining transparent, objective and, to the extent
possible, quantifiable criteria, which in addition reflect the assessment aspects required by the
regulatory framework. Indeed, considerable progress has been made on the elaboration of the
CBA methodology. Nonetheless, there are certain issues requiring further clarification and
methodological issues that need to be further defined as it is discussed in the following Section.
It is noted that CBA indicators are of great importance not only for the development of the
TYNDP but, on the subsequent selection of TYNDP projects for being included in the PCI list
and associated issues as provided by the Regulation 347 such as CBCA assessment, incentives,
grants for works, information and publicity on PCIs costs and benefits. We consider that the
developed methodology quite rightly puts special attention on and actually avoids double
counting of costs and benefits indicators as discussed in the previous section.
3.5.2 Monetization and other issues of indicators
Benefit Indicator B1: Improved Security of Supply (So S)
The benefit indicator “B1: Improved Security of Supply (SoS)” is quantified through LOLE or
EENS and is expressed in MWh not served, but is not ultimately monetized.
According to ENTSO-E, the SoS will be monetised through the VOLL, when the methodology
suggested by CEER entitled “Guidelines of Good Practice on Estimation of Costs due to
Electricity Interruptions and Voltage Disturbances” is applied at national level throughout
Europe in a homogenous way.
As an intermediary solution, until the calculation of VOLL at national level based on the CEER
methodology, it is recommended that ENNS and/or LOLE are calculated at pan European level
treating the TYNDP as a whole and not for each individual TYNDP project. Similar indicators
could be calculated as well at a regional level considering an agreed, among all involved TSOs
in each region, VOLL per region. It is noted that “ENTSO-E Guideline for Cost Benefit Analysis
of Grid Development Projects” (Draft 12 June 2013), includes in Annex 4 the following table
with VOLL figures for certain MS. These figures were sourced from a variety of sources and
reports. As reported therein however, these figures were not assessed from the compatibility
of calculation methodologies point of view. Indeed, there seems to be room for extensive
questioning of the compatibility of these values which are not always referring to the same
economic sectors, some have been estimated with an almost 10 years’ time difference, and the
VOLL for the same sector appears to differ by more than one order of magnitude between 2
MS.

CBA and scenario development for energy and power system planning Final Report
EXERGIA S.A. 38
The quantification of SoS indicator at the project level is a difficult task. The relevant results are
usually negligible for new projects integrated into well meshed networks, as is the case for the
majority of the TYNDP projects. This is probably the reason of zero contribution to SoS
reported for a lot of projects in TYNDP-2014. However, it is not certain that their aggregated
impact on security of supply is also negligible. In any case, the Consultant considers that an
assessment of LOLE for the whole TYNDP could provide a useful indication of the overall impact
of TYNDP on SoS, while a comparative review of LOLE of successive TYNDPs could also provide
an index of the development of SoS over time, should the complete TYNDPs were
implemented SoS impact for the TYNDP as a whole can be estimated by comparing the LOLE

CBA and scenario development for energy and power system planning Final Report
EXERGIA S.A. 39
in the target network (i.e. the network with all future projects included) to the LOLE calculated
with regard to the network of today. This is a useful piece of information that could increase
the value of the TYNDP results.
On the other hand, the value of SoS indicator is considerable for projects affecting severely the
network structure and therefore the SoS, e.g. radial new connections of isolated systems or
areas weakly connected. Assessment of SoS indicator for individual projects is thus
recommended to be restricted to such selected cases that should de described and defined in
the ENTSO-E CBA methodology. This would reduce the relevant work load of ENTSO-E, without
practically reducing the accuracy of the estimation. In the opinion of the Consultant, this
recommendation does not result in compromising the evaluation of network reliability
targeted projects, as it does not imply elimination of SoS indicator, but rather to focus the
assessment of this indicator to those projects which are expected to have such effect and avoid
spending resources for assessing SoS indicators in cases where it will have practically
negligible, or even zero value, which seems that was the case in TYNDP 2014, where several
projects have zero value for the SoS indicator.
Benefit Indicator B2: Social Welfare
The benefit indicators B2: Socio-Economic Welfare and B4: Variation in losses are the two
indicators currently monetized. More importantly it is noted that B2 is the benefit indicator
with the highest significance as it internalises “B3: RES integration” and “B5: Variation in CO2
emissions”, and it usually represents the major portion of the benefits achieved by a project.
Benefit indicator B6: Technical resilience / system safety
The proposed assessment of benefit indicator B6: Technical resilience / system safety is
assessed through the key performance indicators (KPIs). In the opinion of the Consultant this
is reasonable in the sense that it provides a broad idea of a project’s contribution to future
system security. This type of analysis is within the main field of interest and expertise of the
TSOs and is justified in the framework of the TYNDP development. A better quantification of
the criteria set (steady-state, distance to voltage collapse, etc.), although possible, requires a
huge work load. However, the result of such improved quantification (and potential
subsequent monetization of B6), in the Consultant’s opinion would have negligible impact on
the CBA results and it is not proposed, even more so as the monetization of the indicator is
practically very difficult. It is also noted that indicator B6 has a certain contribution to B1 but
this is still very small and difficult to calculate.
Benefit Indicator B7: Flexibility
The CBA methodology (pg. 26) states that indicator B7 assesses the ability of a proposed
project to be adequate in different possible future development paths or scenarios, including
trade of balancing service, through 3 KPIs. However, in the opinion of the Consultant, the B7
indicator attempts to capture a diverse range of issues, which are quite complex while the
detailed methodology for the assessment of B7 as presented in the CBA methodology
document (pg. 45) is not clear. Specifically, the only guidance provided therein states that by
professional power engineering judgement based on the analysed new project's ability to

CBA and scenario development for energy and power system planning Final Report
EXERGIA S.A. 40
address the issue, the project should be evaluated with a KPI that varies between a score of 0,
a single or a double ‘+’ (i.e. 0/+/++). Given the complexity of the issues which are stated to be
addressed the above guidance does not seem adequate and therefore more methodological
details are needed, including at least the principles for assessing each KPI.
It is noted that the impact of a project on trading of balancing services and more generally on
the flexibility of the system to deal with the increased share of renewable generation is of high
importance, as recognized in the same section of the CBA methodology. In the opinion of the
Consultant, the assessment of this flexibility should become the subject of a more extensive
methodological investigation and subsequent provision of guidance, and potentially subject of
a new specific indicator, as also discussed in Section 3.5.4.
Notwithstanding the above, in the Consultant’s opinion the main purpose of B7 indicator is to
evaluate the adaptability of each project into different future system conditions, which to a
significant extend may be considered to be represented by the 4 alternative scenarios. On this
basis, we consider that the B7 indicator could be assessed in a more concrete manner, under
certain conditions. Specifically, it could be considered that the project which is flexible and fits
well with more scenarios, is the project presenting low variation of its calculated benefits
across the different scenarios.
Under this assumption, a single quantifiable indicator of the flexibility of a project could be the
relative variation of its benefits across the scenarios, which can be calculated as the root mean
square deviation from the mean value of these indicators. Projects with the lowest such
deviation are arguably the ones best fitting with most scenarios. In case that a probability is
assigned to each scenario, the same probability could be introduced as weight coefficient in
the aforementioned calculation, so that the overall index calculates internalizes the scenario
probability impact too.
Impact Indicator S1: Environmental impact
The indicators for assessing the two impact indicators, “S1: Environmental impact” and “S2:
Social impact” represent residual environmental and social costs, as already mentioned. We
consider that the approach adopted by ENTSO-E is reasonable, as currently stated.
Monetisation for these indicators is difficult as there are not yet reliable and widely accepted
studies assessing with reliability the external costs of electricity generation and construction
of transmission infrastructures
However, considering the definitions of indicators in CBA methodology, it is understood that
the environmental impact is assessed on the basis of:
Costs for environmental impact mitigation, which is included in the investment cost of
the project (this captures the major environmental impact of the transmission line itself)
Residual environmental impact (measured in S1) which is expressed as km of line length
for which it not possible to apply mitigation measures (this captures the environmental
impact of the transmission line itself as well), and the

CBA and scenario development for energy and power system planning Final Report
EXERGIA S.A. 41
Avoided CO2 cost, which is quantified as the amount of avoided tons of CO2 emissions
and monetized using the projected price per ton of CO2 (this is used to capture the
impact of avoided thermal electricity generation).
The external cost of thermal electricity generation comprises two main components: cost from
greenhouse gases, and cost from the impact on health population of other emissions. The
monetisation of the above costs (which are avoided in the case of avoided thermal generation)
is different and likely higher than the cost of CO2 as currently considered by the CBA
methodology.
In the opinion of the Consultant the above components of environmental cost are not captured
by the current methodology and therefore there is miscalculation and mismonetisation of the
environmental benefit of transmission projects. It is recommended therefore that the
complete external cost of thermal electricity generation is taken into account for assessing B2
3.5.3 Transmission capacity (GTC)
According to the ENTSO-E definition “the GTC reflects the ability of a grid to transport electricity
across a boundary”. A boundary is described as a bottleneck in the system that restricts power
transfers (i.e. the physical power flows) resulting by the engagement of generators according
to the market rules. Although the meaning of a boundary is in principle described and
comprehensible, it is not clear if a specific methodology is applied to detect the boundaries or
the selection is done on an “expert opinion” level.
GTC across every boundary is calculated in both directions and it is independent of the scenario,
depending mainly on the network topology. GTC increase within the European network is one
major objective for the EU policy and a very important finding/result of the TYNDP as it is
directly related to the interconnection targets, which in accordance to the recent European
Parliament resolution of 15 December 2015, “on Towards a European Energy Union” are
considered to be set to at least 10% of the installed generation capacity for 2020 and potentially
increased to 15% for 2030.
The methodology used for the calculation of GTCs is described very briefly and should be
further described and explained. For example, it is stated (textbox in page 28 of CBA
Methodology) that “the GTC value that is displayed and used as a basis for benefit calculation
must be valid for at least 30% of the time”, a criterion which seems obscure.
On the other hand, it seems that the GTCs used in the market studies do not take into
consideration realistic power flows, while it is also not clear if any transmission margins are
considered (i.e. margins allocated for regulation or other system security issues). These points
need further clarification.
It also noted that the nodal representation of control areas in Market studies is questionable
since it may ignore crucial internal congestions within each TSO area. Specifically, it is noted
that several MS are represented as single nodes in the market model, with a few more nodes

CBA and scenario development for energy and power system planning Final Report
EXERGIA S.A. 42
being used in the case of larger MS. It is therefore proposed the gradual application of flow-
based methodologies so as to take into account internal congestions within each TSO area.
In any case, due to the high uncertainties resulting due to the high RES penetration and the
markets’ volatility, special attention should be given to the realistic representation of the
power flows across the European network and the calculation of the relevant transfer
capacities.
Therefore, the consultant suggests that ENTSO-E provides more information on the above
mentioned implementation issues. In order to simulate the load flows across the European
network and therefore account for the impact of transmission constraints in a more realistic
manner, the utilization of “flow-based” methodologies is proposed. Such methodologies
should be applied at least for the calculation of the GTCs. Consideration of more realistic power
flows in the market studies would increase the accuracy of the results. The application of flow-
based methodologies, although not an easy task, will increase considerably the value of results.
3.5.4 Issues for consideration of additional impacts of transmission projects
The CBA Methodology (Annex 5) does not clearly state if ancillary services (regulation/load
following, generation flexibility, voltage regulation etc.) are taken into account and to what
extent. On the basis of the available documentation it is unclear whether such issues are taken
into account and in what way remains unclear.
It should be noted that the cost of ancillary services could be very high especially for scenarios
with high intermittent generation (mainly RES). Special attention should be given on the
flexibility of the future generation mix (affected highly by start-up and shut down times, ramp-
up and ramp-down rates, use of reservoirs and pump-storage hydro etc.). Both the
quantification and monetisation of ancillary services is indeed of high difficulty (due to the
complexity of power system operation and the differences among markets in Europe) but
some rough estimation on future ancillary costs should be given.
It is recommended that the implementation of such calculation be a future task for ENTSO-E. A
methodology for the calculation of ancillary services should be provided within the framework
of the “target model” as defined by Directive (3rd package) on an ENTSO-E-wide base. On the
basis of this methodology, an additional benefit indicator (B8) reflecting the benefits related
to ancillary services could potentially added in the current CBA methodology.
3.5.5 Assessment of storage projects
In its CBA methodology (Annex 6), ENTSO-E explains the reasons why he proposes to assess
electricity storage projects in the same way as transmission ones.
According to the Regulation (EU) No 347/2013 (Annex IV), “project with significant cross-border
impact is a project on the territory of a Member State, which fulfils the following

CBA and scenario development for energy and power system planning Final Report
EXERGIA S.A. 43
conditions:…… (b) for electricity storage, the project provides at least 225 MW installed
capacity and has a storage capacity that allows a net annual electricity generation of 250
Gigawatt-hours/year. In addition, as per the same Regulation, a storage project is an electricity
storage facility used for storing electricity on a permanent or temporary basis in aboveground or
underground infrastructure or geological sites, provided it is directly connected to high voltage
transmission lines designed for a voltage of 110 kV or more.
The same definition about the storage project and the minimum capacity criteria are applied in
the ENTSO-E CBA methodology resulting to the consideration of only large-scale storage
projects.
Storage projects will be of high and increasing importance as RES penetration increases.
According to the criteria described above and the currently available technologies, the vast
majority of the storage projects included in the PCI list refer to pump hydros. It is evident that
in the TYNDP 2014 ENTSO-E has used the same cost and benefit indicators for assessing both
transmission projects and storage projects. We consider this approach to be rational because
it allows the comparative assessment of transmission and storage projects.
However, the CBA methodology does not seem able to capture the capacity / ancillary /
flexibility benefits of storage or at least it does not provide any relevant information. More
information is thus needed on the modelling and simulation of storage projects. Storage
projects operation is affected by various factors such as operational practices followed, the
pumping/generation cycles, the size of the reservoirs, etc. The investment driver for each
specific project should be considered (i.e. market opportunities, system security, overall
system cost optimization, RES accommodation to mitigate spillage and curtailments or other
additional benefits such as contribution to ancillary services, increased flexibility etc.).
A concrete methodology on the modelling and simulation of storage projects and the relevant
incorporation in the market studies is recommended to be prepared by ENTSO-E and adopted
after consultation with the stakeholders. Some critical details (already commented by various
stakeholders) such as application of TOOT method on cascading pump hydros, optimization
objectives, etc. should be described.
3.6 Market and Network Studies
The main sources of calculation of the benefit indicators are the European Network studies and
the Market studies that are developed by the ENTSO-E RGs at regional level. The importance
of these studies is reflected by the dependence of the CBA indicators to the studies’ results, as
depicted in the Figure 3.3.
Figure 3.3 Dependence of CBA indicators to the results of the regional market and network
studies

CBA and scenario development for energy and power system planning Final Report
EXERGIA S.A. 44
3.6.1 Network study
Network studies are performed in order to calculate the GTCs across network boundaries and
assess the benefit indicator “B4: Variation in losses” as well as the scores of the KPIs for the
assessment of “B6: Technical resilience/ system safety”. Network studies are performed for
the same system snapshots with and without the project under assessment and the results are
compared. “B4 indicator is calculated in terms of annual energy losses by integrating
differences in losses over the yearly period (applying the TOOT approach). The relevant
methodology is described sufficiently and comprises steady state analysis through load flow
studies along with the consideration of technical criteria related to system safety.
On the other hand, it is understood that extensive steady-state network analyses are
performed and the respective work effort utilized, for assessing the Technical Resilience
Indicators (B6) of the future network. Although useful, the relevance of this analysis in the
framework of the CBA is recommended to be reassessed. Due to the distance in time of the
year of study (2030), such a detailed analysis seems to be of limited relevance to the purposes
of the TYNDP. More specifically, the proposed calculations (e.g. by distance to voltage
collapse) require very specific studies, more data and huge work load. Furthermore, any such
results would be highly debatable due to uncertainties with respect to hypotheses necessary
for making the respective calculations. In addition, voltage collapse phenomena are highly
network topology dependent and have a local character. Steady state analysis performed is
insufficient to consider such dynamic phenomena. In Consultant’s view, such an analysis is out
of the scope of planning purposes as the ones considered for TYNDP. Also, the impact of such
consideration will be definitely of low importance for the CBA.
3.6.2 Market study issues
Market studies provide the main results to support the calculation of the benefit indicators for
each project. The methodology used in the market studies is not discussed in the CBA
methodology; it has been shortly and poorly presented in TYNDP-2014. More information on

CBA and scenario development for energy and power system planning Final Report
EXERGIA S.A. 45
the methodologies applied to carry out market studies by the various RGs of ENTSO-E is found
in the Regional Investment Plans (RgIPs). Although the concepts followed by ENTSO-E RGs in
market studies methodologies are very similar, it seems that there are differences among the
methodologies used by the various RGs around Europe. Several different relevant tools are
reported, such as ANTARES, Powrsym, or even in-house S/W tools). This could lead to
inconsistencies of the results among ENTSO-E regions. Also, the utilization of different market
tools is likely to lead to internal (i.e. within the RG) inconsistencies that normally take time to
be resolved. The lack of uniformity of either the methodology or the tools utilized for market
studies among RGs is understood to impose a heavier work load and additional effort for
resolving any kind of inconsistencies. This is usually a difficult task as it requires the detection
of the root of inconsistencies and procedures for convergence of results and therefore it
consumes considerable resources.
The consultant recommends that ENTSO-E after consultation with the stakeholders proposes
a common methodology to be applied Europe wide, by all regional groups. Preferably, a
commercial widely used market studies S/W tool should be used. This could save a lot of the
effort currently undertaken to check and modify the consistency of the results provided by
different RGs. Furthermore, the adoption of a common market tool would allow the ENTSO-E
to perform all the market studies with reference to the whole ENTSO-E region and not just at
the regional level of the respective RGs. This step is expected to drastically decrease the overall
work load and enable much higher consistency level of the results. It will also increase the
transparency and consistency of the results.
Also, to our understanding, the utilization of GTCs in the market studies process is not clear.
For example, it is unclear if the transfer capacity assumed between two TSOs (representing the
secure maximum power transfer in MW between the TSOs) equals to the corresponding GTC
or it is reduced by some quantities to represent any transmission margins kept to guarantee
system security. It is recommended that market study methodology accounts for transmission
margins required (e.g. for security reasons, for cross border frequency regulation, etc.). Also,
rational assumptions for the allocation of cross-border reserves should be also proposed and
agreed among TSOs in a transparent manner.
As mentioned in Section 3.5.4, an additional issue that needs special attention is the
consideration of ancillary services cost and especially the required flexibility of conventional
generators to ensure adequate load following capability (and therefore system security) in
case of high penetration of intermittent RES. Although the relevant intertemporal
characteristic parameters of the generators (such as start-up and shut-down times, ramping
(up and down) rates) are mentioned in the document, it is not clear if they are taken into
account and in what manner. The flexibility of the generation system is crucial for both the
secure integration of RES and the future estimation of ancillary services costs.
The Consultant recommends that ENTSO-E puts effort in assessing the adequacy of
conventional generation flexibility to accommodate high intermittent RES penetration
(especially wind). Although premature, estimation of ancillary services cost and especially costs
associated to the required system flexibility to accommodate intermittent RES should be put
in the pipeline of the issues to be addressed soon.

CBA and scenario development for energy and power system planning Final Report
EXERGIA S.A. 46
Another important fact that should be taken into account in the market studies when
calculating the overall system cost is the possible need for additional remunerations (on top of
the market profit) to thermal generation in cases of high RES penetration (see relevant
discussion in Section 2.7 ). As the RES contribution increases, the operating hours of thermal
generation decrease. This puts in doubt the economic viability of thermal power plants since
the income they can get from the market may be not enough to remunerate these plants for
their fixed and variable costs. This is an emerging problem (already present in some countries
e.g. GB, GR, ES etc.) and the impacts of this phenomenon should be carefully analysed and
considered in the total system cost estimations.
3.7 Availability and transparency of CBA background data
As derived by the Regulation (EU) No 347/2013, the ENTSO-E CBA methodology is the main tool
for a Union wide comparative assessment of the TYNDP projects. Since TYNDP is the main
source of information available to stakeholders on the future grid in Europe, harmonised CBA
results on Pan-European level is a valuable source of information.
Furthermore, according to the PCIs selection process, the inclusion of a candidate PCI project
in the TYNDP list is a prerequisite for being considered for further assessment and evaluation.
The CBA assessment is performed by the relevant ENTSO-E Regional Groups and, subject to the
opinion of ACER and relevant results are provided to the EC to decide on the EU-wide PCI list.
It is therefore clear that CBA has a crucial role in this process, being the main source of
harmonised information on project’s economic, technical and social performance for further
use by the EC in the PCI selection process.
Having in mind that TYNDP includes not only projects planned and promoted by the ENTSO-E
members (European TSOs) but also projects promoted by 3rd parties (i.e. projects promoted by
TSOs that hold a transmission operating license but are not ENTSO-E members and entities that
do not hold a transmission license, e.g. merchant lines, promoters of storage projects, etc.),
the importance of CBA results in the PCI selection process is very high and therefore the results
must be easily consulted not only among ENTSO-E TSOs but the stakeholders as well. A lot of
3rd party projects have applied to be included in the PCI list as most of them have a cross-border
character and relevant impact.
Considering the importance of the CBA results, the transparency of the CBA methodology is of
high importance as well. The “re-production” and verification of the results of the CBA
performed by ENTSO-E should be potentially possible to be carried out by any stakeholder (e.g.
a PCI promoter). However, the necessary data for performing the CBA, e.g. estimated load
evolution, future generation mix, network topology evolution etc., are not presented in details
in the document. It would be very helpful to the readers and the stakeholders an ANNEXED
detailed description of the data required in the TYNDP building process. From a practical point
of view, the possibility that ENTSO-E provides those data to the public should be investigated.
Arguably, making public the necessary detailed data is a challenging task and it may also raise

CBA and scenario development for energy and power system planning Final Report
EXERGIA S.A. 47
issues of confidentiality. Nonetheless, a road map towards the public availability of all
necessary data for CBA should be established in order to promote conditions for increased
transparency.
For increasing the transparency towards stakeholders, it is therefore recommended that
ENTSO-E establishes a roadmap for making publically available all the necessary data for the
CBA. The data and background material (e.g. market and network studies results) used for
performing CBA, should eventually become publicly available, so that they can be used by
stakeholders, project promoters, etc. It is noted that the availability and transparency of CBA
data is an issue that reflects as well to the scenario data and the reference models which are
used as background of the CBA process.
3.8 Clarifications related to Third party projects
A fundamental provision of the Regulation (EU) No 347/2013 is that Third party projects should
be equally treated with the ENTSO-E TSOs’ projects to avoid any kind of discrimination. More
specifically, according to Annex III.2(5) “By 16 January 2014, the Commission shall issue Guidelines
on criteria to be applied by the ENTSO for electricity and the ENTSO for gas when developing their
respective 10-year network development plans referred to in points (3) and (4), in order to ensure
equal treatment and transparency of the process.”
The process followed by ENTSO-E to build the TYNDP-2016 is significantly improved compared
to the TYNDP-2014 case. A major improvement is the adoption of a common application
window for all candidate 2016 TYNDP projects submitted by both the ENTSO-E TSOs and third
parties. This increases transparency. It is noted that still nonetheless, the TYNDP / CBA
development cycle occupies approximately a whole year. Evidently, any new developments
with regard to interconnection project of EU-wide importance during this period, cannot be
taken into account, as changes in the reference model would require repetition of a potentially
large amount of work already carried out.
Further to the above, the ENTSO-E CBA methodology does not clarify to what extent and in
what manner third party projects are taken into consideration in the TYNDP development
process. More specifically, more clarity is required on:
The consideration of third party projects in the definition and construction of the
“Reference Network”?
The consideration of third party projects in the clustering process.
It is recommended that third party projects are taken into consideration in both the definition
of the Reference Network and the clustering process in a similar manner as the ENTSO-E TSOs’
projects and that the relevant process is documented.

CBA and scenario development for energy and power system planning Final Report
EXERGIA S.A. 48
3.9 Treating of uncertainties
The uncertainties in forecasts, assumptions and considerations for the future increase,
sometimes significantly, with time. This means that uncertainties in the assessment of costs
and benefits indicators increase as the time horizon of the project assessment increases.
It is recommended that a confidence interval of the CBA results should be provided to allow
decision makers to take into consideration the continuously increasing uncertainties as the
time horizon increases. Although not an easy task, the gradual incorporation of probabilistic
methodologies in the market studies seems necessary to tackle uncertainties and will increase
considerably the CBA results credibility and it is recommended to be considered in a later stage.

CBA and scenario development for energy and power system planning Final Report
EXERGIA S.A. 49
4 INTERNATIONAL (NON-EU) EXPERIENCE – THE
CASE OF USA
The Federal Energy Regulatory Commission (FERC) regulates interstate electricity commerce
over long-distance transmission lines. One of the roadblocks to more competitive wholesale
electricity markets is the difficulty in building new transmission lines. Policies to ensure
adequate development of new transmission, such as removing barriers to building new
interstate transmission lines, are increasingly relevant when integrating renewable energy
resources located in remote areas are needed to meet RE standards. US transmission
investments by FERC‐jurisdictional transmission providers increased from $2 billion/year in the
1990s to $10‐13 billion/year in last several years.
The Brattle Group projects $120‐160 billion of investments over the next decade (for system
reliability, to integrate new resources, upgrade / replace aging existing facilities built in 1950‐
70s)5 Electricity networks and markets in the US are fragmented, the networks not being tightly
meshed as in Europe nor interconnected across the Regions (see the map herein below), and
there is not a target to create an integrated electricity (or gas) market across the whole of the
US territory, as for the EU. It is worthy for example to note that the New York Independent
System Operator (NYISO), which began operating in 1999, is a not-for-profit corporation
primarily regulated by the FERC. The NYISO has signed with two other regional ISOs, i.e. the
ISO New England (ISO-NE), and PJM a planning protocol to enhance inter-regional planning
coordination and limit any seams issues that may arise between the three jurisdictions. The
NYISO strategic Plan 2015-2019 stresses the effort to assume a leadership role in working with
neighboring Regional Transmission Organizations (RTOs) / Independent System Operators
(ISOs) to establish a broader regional market, to enhance inter-regional coordinated planning
through the Eastern Interconnection Planning Collaborative (EIPC) structure which is seen as a
topic of increasing urgency and importance to include also gas pipeline contingency analysis
and evaluation of new EPA regulations Transmission Expansion, and Public Policy.
On the other side, Texas (ERCOT) Electric Regions, formed in 1970, (covers 85% of Texas load
and serves a growing population of 23 million consumers), is the not-for-profit ISO for the Texas
area and has been overseeing the region-wide planning since 2001. The Texas area is effectively
isolated from the rest of the US, with only two interconnectors to other systems. As a result,
ERCOT can be seen as an electrical island with some limited connection facilities to the
eastern/western US and Mexico. Therefore, the FERC has no jurisdiction over the Texas
electricity sector; regulation is exercised by the Public Utility Commission of Texas. However,
ERCOT is a constituent council of the North American Reliability Council and as such follows the
same reliability codes as most other US States.
5 Pfeifenberger Johannes et al, The Brattle group: “Competition in transmission planning and development, Current Status and international

CBA and scenario development for energy and power system planning Final Report
EXERGIA S.A. 50
Figure 4.1: Current transmission planning regions in US (source: FERC presentation on Order
10006)
The basic regulatory instrument has been FERC's "Order 1000," of 20117 , which enacts a series
of measures, that require large-scale regional planning of the nation's electric grid designed to
create more competitive wholesale electricity markets by removing barriers to building new
interstate transmission lines, and in part aimed also to enable investments necessary to provide
greater access to renewable energy, necessary for effective implementation of regional RES
policies, since most states have legislated Renewable Energy standards. It also requires fair
allocation to regional beneficiaries of the cost of interregional transmission solutions chosen
to meet regional transmission needs.
With respect to transmission planning, Order 1000:
requires that each public utility transmission provider participate in a regional
transmission planning process that produces a regional transmission plan;
requires that each public utility transmission provider amend its Open Access
Transmission Tariff (OATT) to describe procedures that provide for the consideration of
transmission needs driven by public policy requirements in the local and regional
transmission planning processes;
6 FERC18 CFR Part 35 [Docket No. RM10-23-000; Order No. 1000] Transmission Planning and Cost Allocation by Transmission Owning and Operating Public Utilities, (Issued July 21, 2011). / Competition in Transmission Planning and Development: Current Status and International Experience 7 https://www.ferc.gov/media/news-releases/2011/2011-3/07-21-11-E-6-presentation.pdf

CBA and scenario development for energy and power system planning Final Report
EXERGIA S.A. 51
removes from Commission-approved tariffs and agreements a federal right of first
refusal for certain new transmission facilities; and
improves coordination between neighbouring transmission planning regions (see Figure
4.1) for new interregional transmission facilities (i.e. Public utility transmission providers
in each pair of neighbouring transmission planning regions must coordinate to
determine if more efficient or cost-effective solutions are available).
The regional transmission planning process must have in place:
a regional cost allocation method for the cost of new transmission facilities selected in
a regional transmission plan for purposes of cost allocation; and
an interregional cost allocation method for the cost of certain new transmission facilities
that are located in two or more neighbouring transmission planning regions and are
jointly evaluated by the regions in the interregional transmission coordination
procedures required by this Final Rule.
Each region develops its own proposed cost allocation method(s) that must satisfy the
following six cost allocation principles:
Costs allocated “roughly commensurate” with estimated benefits,
Those who do not benefit from transmission do not have to pay for it,
Benefit-to-cost thresholds must not exclude projects with significant net benefits,
No allocation of costs outside a region unless other region agrees,
Transparency for Cost allocation methods and identification of beneficiaries,
Different allocation methods could apply to different types of transmission facilities
If a certain region cannot decide on a cost allocation method, then FERC would decide based
on the record. There is no interconnection-wide cost allocation method and principles agreed
and applied at interregional level.
An important aspect of US evolving electric power infrastructure, which the FERC refers to in
its Order No.1000 as “non-transmission alternatives (programs and technologies that
complement and improve operation of existing transmission systems that individually or in
combination defer or eliminate the need for upgrades to the transmission system)”, the
appropriate label being “Market Resource Alternatives” or “MRAs,” is how developments like
MRAs affect the need for, and planning of, high voltage electric transmission8, as MRAs refer
to both supply-side and demand-side solutions that include distributed generation (“DG”),
energy efficiency (“EE”), demand response (“DR”), utility-scale generation, and storage. An
MRA generally is able to provide only a partial suite of services that transmission provides.
Hence, MRAs may provide some of the services that transmission can provide, but they cannot
perfectly replace transmission. Furthermore, the services each MRA can provide vary.
Understanding the types of services and benefits transmission can provide is also necessary, as
the relative merits of transmission and MRAs will be evaluated in the transmission planning
8 London Economics, “MRA, An examination of new technologies in the electricity transmission planning process”, Oct 2014

CBA and scenario development for energy and power system planning Final Report
EXERGIA S.A. 52
processes in terms of the services and benefits they can provide when compared to
transmission, in order to ensure that investment in MRAs and/or transmission yield the optimal
benefits for the money invested in each case.
The FERC considered that the regional participation transmission planning principle under the
previous Order No. 8909 may not be sufficient, in and of itself, to ensure an open, transparent,
inclusive, and comprehensive regional transmission planning process. Order No.890 did not
require development of a transmission plan by each transmission planning region, nor did it
require compliance of regional transmission planning activities with the transmission planning
principles it established. In particular, while Order No. 890 intended the transmission planning
principle it required for the economic planning studies to be sufficiently broad, there was
confusion whether Public Policy Requirements may be considered in the transmission planning
process. As a result, the FERC comments, certain regions were struggling with how to
adequately address transmission expansion necessary to, for example, comply with renewable
portfolio standards. In contrast the new Order 1000, explicitly provides that both local and
regional transmission planning processes must consider Public Policy Requirements.
Furthermore, in certain transmission planning regions, as permitted by Order No. 890, public
utility transmission providers used the regional transmission planning process as a forum to
confirm the simultaneous feasibility of transmission facilities contained in their local
transmission plans, and do not develop, consider and evaluate alternatives that may meet the
needs of the region more efficiently or cost-effectively. While, in particular in each of the
existing RTO and ISO regions, which as the FERC notes serve over two-thirds of USA’s
consumers, the public utility transmission providers, analyse alternatives available for the
regional level, hence the respective regional transmission plan identifies those transmission
facilities that are needed to meet the needs of stakeholders in the region. The Order 1000
imposes an affirmative obligation for transmission planning regions to evaluate alternatives
that may meet the needs of the region more efficiently or cost-effectively.
As stated by FERC, “while transmission planning processes have improved since the issuance
of Order No. 890 we (i.e. FERC) are concerned that the existing Order No. 890 requirements
regarding transmission planning, as well as cost allocation, are insufficient to ensure that the
evolution of transmission planning processes will occur in a manner that ensures that the rate
and conditions of jurisdictional services are just and reasonable and not unduly discriminatory
or preferential”.
It is noted that there have been, mostly, positive but also negative comments / reactions by
stakeholders submitted in the relevant public consultations the FERC has been engaged prior
to its final decision, while the Order 1000 has been challenged also in the Courts. Those that
submitted negative comments argued that:
9 Order No. 888 of 1996, provided for open access to transmission facilities to address undue discrimination and to bring more efficient, lower cost power to the Nation's electricity consumers. Order No. 890 of 2007, provided for coordinated, open and transparent regional transmission planning processes to address undue discrimination

CBA and scenario development for energy and power system planning Final Report
EXERGIA S.A. 53
any problems with existing transmission planning are local in nature and that the
Commission should not undertake comprehensive, generic reform.
the Commission should allow existing regional transmission planning processes to
mature before acting,
transmission planning must be initiated at the local and regional levels subject to state-
level authority and based on the needs of customers who bear the burdens and benefits
of the decisions resulting from the planning process,
transmission developers who offer transmission projects as an alternative to locally
planned solutions must be required to participate in and have their proposals considered
as part of the relevant state planning process.
there would be potential confusion for a certain region and that the creation of a new
regional transmission planning authority would impede, not hasten, transmission
development.
The US Court of Appeals for the District of Columbia Circuit affirmed10 , by a 97-page unanimous
ruling, FERC's Order 1000. In particular dozens of state regulatory agencies, public and private
utilities, regional transmission organizations and electric industry trade associations have
challenged the Order arguing that states could not be forced to coordinate on transmission
planning, carbon standards and paying for actions to create new transmission capacity, as
Congress had "expressly" allowed such coordination among utilities to be voluntary. They also
opposed the costs involved, arguing that it would be a departure from the usual process of
passing costs onto consumers. The three-judge panel wrote that "The Commission reasonably
determined that regional planning must include consideration of transmission needs driven by
public policy requirements".
A great deal has already been said by the FERC and the courts about matching cost responsibility for transmission infrastructure and the receipt of identifiable benefits from such regulated investments. But, remarkably, there has been no common standard (in theory or practice) for the range of transmission benefits by which the merits of any proposed transmission project or a portfolio of projects should be judged11. There are serious shortfalls in the analytical processes by which planners assess the need for transmission which entail enormous potential costs and risks – to consumers, to the economy, and to society overall12. On the other hand, in evaluating the benefits of alternatives the risks and costs of inadequate infrastructure, that may be much greater than the costs of the necessary transmission investments, must be also assessed and documented to ensure that planners’ decisions also adequately protect stakeholders against these risks.
10 Reuters, ‘U.S. court upholds FERC rules on electric grid planning’, Fri Aug 15, 2014 11 The Brattle Group, “A WIRES Report, on The Benefits of Electric Transmission: Identifying and Analyzing the Value of Investments” June 2013. The study tried to inaugurate that kind of analysis, (“Catalogue all the potential benefits2 of transmission that can, and arguably should, be identified, considered, and estimated in planning the expansion or upgrade of the grid, based on the growing experience of transmission planners across the US, and document the evolving experience and practice of regional transmission organizations (RTOs) and non-RTO regions in determining the economic, reliability, operational, and public policy benefits of transmission investments based on their physical and operational characteristics, location, technology, surrounding markets, prevailing regulation, and environmental and economic impacts) but the planning practices it advocated have not materialized 12 The Brattle Group, “Toward More Effective Transmission Planning: Addressing the Costs and Risks of an Insufficiently Flexible Electricity Grid “ April 2015

CBA and scenario development for energy and power system planning Final Report
EXERGIA S.A. 54
In assessing the transport infrastructure projects, it is essential to clearly specify the goals they
are designed to achieve. Comparing the drivers for transmission development planning in
Europe and the US, we may consider that both have two common goals, (a) to improve
through grid development market efficiency and economics, and (b) to secure the electricity
supply by increasing the reliability of the grid. These two purposes often cannot be separated
clearly from each other; achieving one will frequently accomplish the other. However, in
Europe, it has become progressively more important and constitutes the top policy priority, to
create functioning and efficient integrated EU electricity, and gas, markets, comparable in size
to that of the US, considering economic efficiency improvement as the first purpose of a grid
development plan and its related analysis.
While the US priority of grid development, following the California Energy Crisis 2000-2001, as
well as the massive blackout of the Eastern US in the summer of 2003, is to increase grid
reliability and improve the SoS. Therefore, grid development planning and analysis process
primarily focuses on measures to observe the federal reliability standards. After these analyses
are done and the relevant measures are planned, economic improvement measures are
analyzed. As an example13, NYISO’s market-based planning framework is the Comprehensive
System Planning Process (CSPP) by which the NYISO evaluates resource adequacy and
transmission system security for the next 10 years and evaluates solutions to meet the
reliability standards. It takes place every two years and is comprised of three major
components carried out sequentially:
Local Transmission Planning
Comprehensive Reliability Planning
Economic Planning
In Europe the CBA for cross-border Interconnections focuses on increasing existing
interconnection capacity and at national corridors rather than at the addition of EHV overlay to
backbones. Reliability driven expansion projects in US are extremely difficult to quantify in a
cost-benefit analysis because it is not easy to enumerate in monetary terms changes in
frequency or duration of service interruptions. However, in both cases the key to achieve
optimal economic, reliability, and public policy outcomes is to provide a comprehensive analysis
of the full range of benefits that can be derived from a proposed transmission project as well
as the available alternatives, including evaluation of the so-called “non-transmission
alternatives” and means to more efficiently utilize existing infrastructure. It must be borne in
mind that transmission provides a variety of services and offers a broad range of potential
benefits. In addition to facilitating the delivery of energy and capacity, transmission can provide
other benefits14. As Deloitte also confirms in its research report on behalf of the Japanese
13 Strbac G. et al, Integrated Transmission Planning and Regulation Project: Review of System Planning and Delivery, Final Report , June 2013 14 For example, transmission system reinforcements can reduce system losses and improve overall system efficiency. Transmission can also provide support to the electric power grid through the provision of certain ancillary services, which are used to keep the grid operating smoothly. Transmission can provide insurance against uncertain future market events and the costs of such unforeseen events on customers. For example, if in the future a generator were to unexpectedly go off line, transmission lines

CBA and scenario development for energy and power system planning Final Report
EXERGIA S.A. 55
Government15 “all the countries and regions they studied, the principle of cost allocation is that
citizens and users of the grid pay for the costs incurred by grid development since such
infrastructure benefits all. However, there is also the clear principle that beneficiaries bear the
cost according to the amount of benefits they receive, which often differ from location to
location”.
In all jurisdictions considered by Deloitte, the EU, UK, Germany, California ISO (US), PJM (US),
ERCOT CREZ (US)16 the plan-making process largely follows four steps, described below:
Responsible TSO(s) or an ISO/RTO forecasts power generation and demand/load in a
certain time frame and creates several future energy scenarios;
TSO(s) or an ISO/RTO conducts a power flow calculation based on each scenario, and
identifies when and where bottlenecks due to congestion and/or difficulty of observing
reliability standards will occur;
Solution options through grid development against each bottleneck are provided; and,
A transmission development plan is created based on optimal solutions chosen through
a comprehensive assessment of all options, performed by utilizing various
socioeconomic, technological, and environmental methodologies, including cost–
benefit analysis.
The selection of the most-likely scenario usually occurs at a later stage of the process, and the
final plan is created based on the chosen scenario. Although detailed process and evaluation
criteria are different among the countries and regions, they all perform sensitivity analyses
according to their prioritized criteria and objectives, and engage in multiple consultations,
requirement provided by respective national or regional legislation/regulations, performed in
different phases with various stakeholders throughout the planning process to form a high-
level of social acceptance, of the planning process. These consultations are repeated and
efforts are made to create the final plan that reflects various opinions and concerns well.
The following Table 4.1 compares the main features of grid development planning and
regulatory/investment schemes among the studied regions and countries.
could allow other generators on the system to serve customers. Transmission can also reduce production costs of energy through expansion of a market (and increased competition from other existing resources) as well as provision of market access to new resources. As a consequence of expanding access to market for existing and new resources, transmission can also help to reduce the emissions footprint of the market as a whole and curb harmful pollutants such as carbon dioxide and other greenhouse gases. London Economics: Study on Market Resource Alternatives, 2015 15 Deloitte Tomachu, “Executive Summary Basic Research Project on Accelerating Deployment of New Energy”, METI Japan,2015 15 ERCOT CREZ identifies the Competitive Renewable Energy Zone (CREZ) process; an ad-hoc‘ transmission planning and delivery regime instituted in ERCOT to facilitate connection of large-scale renewables. As part of its long-term strategy Texas has adopted proactive transmission planning for selected Renewable Energy Zones, involving also a competitive bidding process for the construction of the selected transmission infrastructure (approach similar to that of the UK for Off shore wind connections).

CBA and scenario development for energy and power system planning Final Report
EXERGIA S.A. 56

CBA and scenario development for energy and power system planning Final Report
EXERGIA S.A. 57
Table 4.1: Comparison Table (source: Deloitte Tomachu, “Executive Summary Basic CBA and power system planning for selected countries Research
Project on Accelerating Deployment of New Energy”, METI Japan,2015
European Union
United Kingdom
Germany
United States Federal
Government PJM CAISO ERCOT CREZ
Grid Development Planning Resp
onsible Organization
ENTSO-E National Grid as an SO 4 TSOs and BNetzA N/A PJM CAISO PUCT and
ERCOT Legally Binding No No
Yes (legislated
every 3 years) N/A No No No
Update Every 2 years Every year Every year N/A Every year (5–yr plan) Every 2 years (15–yr plan)
Every 2 years N/A
Planning Horizon 10 years 10 years 10 years N/A 15 years 10 years Began in 2005 and completed in 2014
Cost
Allocation
Principles
Domestic lines Users pay more than
generators Reflect locational
differences Interconnectors Decided by those
countries that will be interconnected
Allocate among the states based on a rule that states the beneficiaries pay according to benefits by using CBA method used to choose PCI
Domestic lines Citizens/users pay for
grid developed under the regulated schemes
Interconnectors Cost allocated among
the countries based on the beneficiaries pay rule of the EU
Recover cost by congestion revenues
Domestic lines Citizens pay
equally for domestic grid developments
Interconnectors Cost allocated
among the countries based on the beneficiaries pay rule of the EU
Regional Interconnecting lines Beneficiaries pay
according to benefits received
Beneficiaries
pay according to benefits received
Hybrid methods of cost allocation, based on equipment features and sizes
Merchant lines recover cost through congestion revenues
Cost recovered
from all users through transmission access tariffs
Merchant lines recover cost through congestion revenues
All grid users equally pay in
the ERCOT area (Postage Stamp
method)
Transmission Investment
Public Assistance
Available for PCI (EU Grants EU-related financial institutions investment/
finance)
EU supports for OFTO
and PCI projects
EU supports for
PCI projects
No
No
No
No
Investme
nt/Cost Recovery Schemers
Member states decide
Categorize transmission assets into 3 groups and regulate each with separate schemes
Interconnectors can take either merchant scheme or regulated scheme
Incentive
regulation scheme for all asset classes
(Revenue Cap)
Obey FERC rules for regional interconnecting lines
Any developers can apply for FERC Order 679 incentives
Regulated scheme and merchant scheme co- exist
Regulated scheme and merchant scheme co-exist
N/A
Abbreviations: BNetzA: German Federal Network Agency, CAISO: California ISO, ERCOT: Electricity Reliability Council of Texas, FERC: Federal Energy Regulatory Comission, OFTO: Offshore Transmission Owner,
SO: System Operator, PUCT: Public Utility Commission of Texas

CBA and scenario development for energy and power system planning Final Report
EXERGIA S.A. 58
5 SCENARIO-BASED AND CBA METHODOLOGIES
REVIEW FOR SELECTED EU MEMBER STATES
The current section presents a short overview of the practices for scenario development and
CBA assessment of transmission projects in ten selected MS, i.e. Spain, Italy, Austria, Belgium,
Latvia, United Kingdom, France, Germany, Poland and Slovakia. The aforementioned MS have
been selected in accordance with the ToR of the project which required the review of the six
largest MS and one representative MS from the following regions (as per the ENTSO-E TYNDP
2014): North Sea, Baltic Sea, Continental Central East Europe and Continental Central South
Europe. The information presented in the following sections is based on a questionnaire that
was filled in by TSOs and NRAs of these MS.
5.1 Spain
5.1.1 Power system planning
The main transmission planning document in Spain is the National Electricity Transmission
System Development Plan17. It is required by national legislation and is prepared by the Ministry
of Industry (IDAE) every 4 years with a study horizon until 2020. Three scenarios are considered
in the Development Plan while, the scenario building concept is based on an econometric and
top down approach. The stakeholder’s involvement is active, while the main sources of data
used are Red Electrica de Espana’s (REE) and stakeholder’s data. The assumptions that are
used for the scenario building are officially approved. Finally, the computer models/tools that
are used are PSSE, UPLAN and EVIEW.
The Ministry of Industry prepares also the National Renewable Energy Action Plan (NREAP)18
and the National Energy Efficiency Action Plan (NEEAP)19. Both documents are legally required,
publicly available and have a time horizon until 2020.
Each of the above three scenarios used in the National Electricity Transmission System
Development Plan represents a possible evolution of the main variables i.e. demand growth,
generation mix, fuel prices, economic indicators, etc. In each scenario, different planning cases
are analyzed. The cases represent different situations including but not limited to:
summer/winter, peak/off-peak, weather conditions (wind, sun, water, and temperature),
generation dispatch, energy flow between countries, etc. These scenarios are evaluated by
17 http://www.minetur.gob.es/energia/planificacion/Planificacionelectricidadygas/desarrollo2015-2020/Documents/Planificaci%C3%B3n%202015_2020%20%202015_10_22%20VPublicaci%C3%B3n.pdf 18 http://www.idae.es/uploads/documentos/documentos_11227_PER_2011-2020_def_93c624ab.pdf 19 http://www.idae.es/uploads/documentos/documentos_11905_PAEE_2011_2020._A2011_A_a1e6383b.pdf

CBA and scenario development for energy and power system planning Final Report
EXERGIA S.A. 59
REE and approved officially by the Ministry of Industry. The scenarios developed in the context
of the National Transmission Development Plan are compatible with the energy planning
scenarios included in the NREAP and NEEAP. The major difference between the Transmission
Development Plan and the NREAP/NEEAP with respect to scenarios are the different
sensitivities of the modelling parameters.
5.1.2 Cost Benefit Analysis
The Transmission System Operator (REE) performs Cost Benefit Analyses for certain electricity
transmission projects and specifically for those related to structural reinforcement of the
transmission grid (400 kV and 220 kV). The outputs of the study are included in Annex III of the
National Transmission Development Plan. These infrastructures aim at ensuring security of
supply, economic and energy efficiency and environmental sustainability and are justified by
the compliance with the National Network Codes and their contribution to economic
efficiency. The CBA methodology implemented by REE follows in general the “ENTSO-E
Guideline for Cost Benefit Analysis of Grid Development Projects” approved by EC on 4.2.2015”
and it is not approved by the Regulator.
The scenarios used in the CBA are the same as those described in the National Development
Plan. The deterministic tool that is used for CBA is UPLAN. In order to conduct the Study both
market simulations and network studies are performed based on own data and stakeholders’
data which are compatible with data on common study horizons (e.g. 2020).
5.2 Italy
5.2.1 Power system planning
The power system planning document in Italy is the Ten Year Network Development Plan
which is published annually by TERNA. The Plan is required by pertinent legislation, is subject
to consultation and then an opinion by the NRA, is approved by the Ministry for Economic
Development and is publicly available20. The Plan also includes a generation adequacy study
with a horizon of 5-10 years. The generation adequacy is evaluated as part of the yearly demand
forecast report according to the Regulator’s (Autorità per l'energia elettrica il gas ed il sistema
idrico-AEEGSI order 48/2004. In addition, there is also the National Energy Strategy21 published
in March 2013. This is prepared by the Ministry of Development and the Ministry of
Environment, updated every 3-5 years. The time horizon of the study is 8 years but with some
considerations up to 2050.
Other relevant documents include the National Renewable Energy Action Plan (NREAP) and
the National Energy Efficiency Action Plan (NEEAP). Both documents are legally binding and
20 http://download.terna.it/terna/0000/0109/45.pdf 21 http://www.sviluppoeconomico.gov.it/images/stories/normativa/20130314_Strategia_Energetica_Nazionale.pdf

CBA and scenario development for energy and power system planning Final Report
EXERGIA S.A. 60
publically available. In parallel to the Electricity Transmission Development Plan, there is also
the Ten-Year development plan for Gas22 which is prepared by the Gas TSOs/ITOs (in particular
the plan of Snam Rete Gas), updated on an annual basis with a study horizon of 10 years.
The electricity scenario planning process is based on two scenarios that are built on various
assumptions and data sources and prepared with the contribution of stakeholders. The
assumptions are not officially approved. Relevant data are included as annex of the Plan, as
well as other studies (e.g. from the International Energy Agency). The scenarios are not
explicitly and separately subject to opinion or approval. In the framework of the plan, they are
subject to consultation and subsequent opinion of the NRA and then approval of the Ministry.
The TSO uses network modelling tools (load flow software), as well as market modelling tools
(PROMED). For the development of the national generation adequacy study there is not a
discrete scenario building activity, but the calculation of needed generation capacity is based
on probabilistic modeling.
For the development of the National Energy Strategy there are multiple scenarios that are
developed with the contribution of stakeholders and the utilization of domestic data sources.
The assumptions are not officially approved. For the development of the NREAP two bottom-
up scenarios are developed. The NREAP is officially approved. For the development of the
NEEAP 3 scenarios are developed (including 2 for comparison purposes).
5.2.2 Cost Benefit Analysis
The Italian TSO applies a CBA methodology for the projects of the National Electricity
Transmission Development Plan, which is described in the Plan itself. The methodology is
currently under update/consultation by the Regulator23. In the Plan of 2015, the CBA was
performed by the TSO for the projects with investment cost above 25 million Euros (47 out of
184 projects). The standardized methodology for CBA is presented in the Annex III of the Plan.
The requirements for the CBA methodology are expected to be defined by the Regulator, even
though the versions of the CBA methodology currently in use since - at least - 2006 built on
some provisions in the TSO license (given by the Ministry) and in the transmission grid code
(verified by the Regulator) and did not receive an official approval by the Regulator (or by the
Ministry).
The scenarios developed include assumptions on generation mix, demand, cross border
capacities, fuel and CO2 prices, while no sensitivity analysis is conducted. The market and
network studies (including e.g. probabilistic studies for calculation of expected energy not
supplied) lead to the monetization of eight benefit categories (electricity exchanges with
neighbouring countries, reduction of internal network congestion, reduction of local
constraints on RES generation, variation of losses, reduction of expected energy not supplied,
22 http://www.snamretegas.it/export/sites/snamretegas/repository/file/Anno_termico_2014x15/piano-
decennale/pubblicazione/Piano_decennale_2015-2024.pdf 23 http://www.autorita.energia.it/allegati/docs/15/464-15.pdf

CBA and scenario development for energy and power system planning Final Report
EXERGIA S.A. 61
avoided investments, reduction of costs of ancillary services and variation of CO2 emissions),
while a benefit/cost ratio is calculated for each project.
5.3 Austria
5.3.1 Power system planning
The Transmission Network Development Plan is a legal requirement (in accordance with § 37
ElWOG 2010). It is based on the long-term strategic planning in the Austria Power Grid (APG)
Master Plan 2030 as well as on the Network Development Plan 2014. By publishing the NDP,
APG informs all market participants about the main transmission grid infrastructures that need
to be upgraded or expanded within the next ten years (2016 – 2025). The National Electricity
Transmission System Development Plan is conducted on an annual basis and with a study
horizon of 10 years (n+10 years).
The Master Plan for 2030 is prepared by Austrian Power Grid AG24 as the basis for medium- and
long-term grid planning. The foreseeable developments in the energy market until 2030 were
analysed in detail and the necessary expansion steps in the APG transmission grid were
defined.
The Master Plan envisages three scenarios and its preparation is prepared through
consultation and workshops with public participation (NGOs, Universities and experts). Data
sources are APG’s internal data, as well as data from TU Wien and Graz. The model used for
the simulations is called ATLANTIS and has been developed by TU Graz.
The development of the National Electricity Transmission System Development Plan is based
on the APG–Masterplan scenarios.
The national report on Security of Supply is carried out by E-Control Austria (the NRA) on an
annual basis and with a 10-year horizon. Three main scenarios are built based on national data.
The MEDA model is used.
5.3.2 Cost Benefit Analysis
In Austria no CBA is performed for electricity transmission projects included in the National
Transmission Development Plan in addition to the one that is anyway performed for projects
included in the TYNDP.
24 https://www.apg.at/en/grid/grid%20expansion/masterplan

CBA and scenario development for energy and power system planning Final Report
EXERGIA S.A. 62
5.4 Belgium
5.4.1 Power system planning
The National Electricity Transmission System Development Plan is prepared by the Belgian TSO
(Elia) every four years with a study horizon of 10 years. It is a legally required and publicly
available25.
The study includes 1 scenario for 2020 and 4 scenarios for 2030 exactly like the TYNDP. The
scenario for 2020 is based on a bottom-up methodology using adequacy criteria, while the
2030 scenarios on top down and bottom up scenarios based similarly on adequacy criteria. The
study has been developed with the contribution of stakeholders and the main data sources
include ELIA’s internal data and ENTSO-E/TYNDP data. The assumptions made for the
development of scenarios are officially approved. The models that are used for simulations are
ANTARES, PROMOD and PSA.
The national generation adequacy study is legally required and a publicly available document26.
It is prepared by ELIA annually with a study horizon of 3 winters ahead. The study includes only
one baseline bottom-up scenario with sensitivities. The building of scenarios has been based
on ELIA’s own data, data from IHS and CERA, as well as data from studies of neighboring TSO’s
and ENTSO-E SO&AF. The simulations have been done with ANTARES.
Apart from these two documents there is also the National Renewable Energy Action Plan
(NREAP)27. It has been prepared by Federal Public Service and Regions in 2010 with a study
horizon until 2020. Respectively, the National Energy Efficiency Action Plan was prepared by
the same authority in 2014 with a study horizon until 2020. For both Action Plans only one
bottom up scenario has been developed based on own data and studies. For the NEEAP the
PRIMES model has been used.
The base for planning process are the scenarios built for the TYNDP (ENTSO-E). However, in
order to be in line with the scenarios developed by the Federal Public Service, described in the
report ‘prospective study electricity by 2030’, a check of important parameters is done
(renewables, demand, installed capacity thermal units, etc.). The scenarios resulting for the
national electricity transmission system development plan are a combination of both sources.
These scenarios are evaluated by the Federal Public Service and through public consultation
on the national electricity transmission system development (with a chapter on scenarios),
which is subject to approval by the Minister for Energy.
The scenarios are in line with the NREAP targets for 2020. However, since the NREAP dates
already from 2010, a shift between different technologies is taken into account based on
25http://www.elia.be/~/media/files/Elia/Grid-data/grid-development/Plan-de-Developpement-federal-du-reseau-de-transport_2015-2025.pdf 26http://economie.fgov.be/nl/ondernemingen/energie/Energiebevoorradingszekerheid/strategische_reserve_elektriciteit/ 27 http://economie.fgov.be/nl/binaries/NREAP-BE-v25-NL_tcm325-112992.pdf

CBA and scenario development for energy and power system planning Final Report
EXERGIA S.A. 63
already installed capacity and regional studies. The national electricity transmission system
development plan covers the horizon 2015-2025.
5.4.2 Cost Benefit Analysis
A CBA is performed for the projects embedded in the TYNDP process. These projects represent
the development of interconnectors as well as the development of transmission and
generation accommodation capacity throughout the whole internal Belgian backbone. In
terms of voltage levels this represents the entire 380kV grid, complemented with the
interconnected 220kV grid in the South East area. The ENTSO-E methodology is implemented.
The current scenario framework is developed around 2 time horizons, 2020 and 2030, taking
into account all the relevant hypotheses and assumptions on: electricity consumption,
integration of renewables, the planned nuclear phase out, integration of new central
production units and the merit order. A sensitivity analysis is conducted as well, for example
with respect to the availability of the nuclear capacity in Belgium.
This scenario framework forms the basis for:
Market studies: carried out with ANTARES (in the past PROMOD) to identify the
economic interest of developing additional interconnection capacity.
Adequacy studies: carried out with ANTARES to identify the risk of not covering the
demand by production or import. These adequacy studies are performed using a
probabilistic method, evaluating the probability of different events taking place via
Monte Carlo analysis.
Load flow studies: carried out with PSA (and in the future with Power Factory) to
evaluate grid security.
In the context of the CBA market simulations are performed. For surrounding countries, the
data used are from data ENTSO-E (TYNDP-SO&AF) or bilateral contacts, while for Belgium own
data, and data from consultants (HIS, CERA, Pöyry) are used.
The output of the market simulations is an input for the network studies. The network model
used for the network studies contains both a national dimension as well as an international
dimension. The national dimension is based upon own data (information on grid structure,
generation and load). The international dimension is based upon data exchange with the
neighboring TSOs in the context of ENTSO-E studies.
The scenarios developed by the Federal Public Service are a main source of information
(update about every 4 years). However, they cannot be used as such in order to fulfill the
storylines developed for the TYNDP. The scenarios resulting for the national electricity
transmission system development plan are a combination of both sources (storyline TYNDP
and scenarios Federal Public Service).

CBA and scenario development for energy and power system planning Final Report
EXERGIA S.A. 64
5.5 Latvia
5.5.1 Power system planning
The National Electricity Transmission System Development Plan28 is a legally required
document prepared by the TSO Augstsprieguma Tikls (AST) with annual frequency and a 10-
year horizon. The study considers two scenarios, one baseline (conservative) and one
optimistic. Stakeholders are involved in the scenario planning process. Scenarios are neither
evaluated nor officially approved. The main source of data is internal TSO sources. According
to the respondent of the questionnaire no computer models or other tools are used. The
National Electricity Transmission System Development Plan scenarios are not compatible with
other energy planning scenarios.
The National generation adequacy study29 is a legally required document prepared by the TSO
with an annual frequency and a 10-year horizon. Similar to the Transmission Development Plan,
two scenarios are developed one baseline (conservative) scenario and one optimistic.
Stakeholders are not involved in the generation adequacy study, only power system
participants. The assumptions are officially approved, while no computer tools or other
specialized software are used. Planning scenarios are neither evaluated nor officially
approved.
The National Energy Program is based on only one scenario, it is developed with stakeholder
involvement, while data are provided by power system participants. The NREAP and NEAAP
are currently under development by the Ministry of Economics.
5.5.2 Cost Benefit Analysis
In Latvia no CBA is performed for electricity transmission projects included in the National
Transmission Development Plan. Only for strategic transmission projects (PCI), a CBA is
conducted based on the Pan-European TYNDP results, after harmonized for internal network
based on energy field expert opinion.
5.6 United Kingdom
5.6.1 Power System Planning
The transmission needs of United Kingdom are served by several TSOs, most of whom own
and maintain the assets, and two who operate the networks. National Grid Electricity
Transmission PLC owns the network in England and Wales, Norther Ireland Electricity
28 http://www.ast.lv/eng/par_ast/public_reports/development_plan_of_transmission_power_system/ 29 http://www.ast.lv/eng/par_ast/public_reports/tso_annual_statement/

CBA and scenario development for energy and power system planning Final Report
EXERGIA S.A. 65
Networks owns the network in Northern Ireland, and Scottish Hydro Electric Transmission PLC
and Scottish Power Transmission PLc, owns the Scottish networks. Offshore wind-farm
connections and interconnectors are also owned by separate companies who have been
competitively developed or selected. National Grid is also the system operator responsible for
real time operation covering the whole system on the island of Britain, and for indicating where
the network will develop. System Operator for Northern Ireland Ltd (SONI) is the system
operator for the island of Ireland.
The National Transmission Development Plan is covered in the document “Electricity Ten Year
Statement” and covers a planning horizon of 20 years. It is developed by National Grid in
consultation with the other transmission owners. A detailed plan for the first ten years is
provided. It is published annually under a legal mandate. Stakeholders are deeply involved in
the process to perform the “Electricity Ten Year Statement” through an extended and well
established public debate. The main sources of data used are the TSOs (own data) and data
derived by the stakeholders during the public consultation; government targets and fuel
prices’ projections are also taken into consideration.
The National Generation Adequacy Study is also a legally required document performed by the
National Grid Electricity Transmission. It is executed and published every year covering the
next 5 years. A Winter Outlook Report and a Summer Outlook Report are also published every
year by the NGET. The capacity adequacy study and the “Electricity Ten Year Statement” are
performed based on the same data scenarios and data. A probabilistic methodology is applied
by the National Grid to assess future capacity adequacy using an in-house software. The
stakeholders are not involved in the process as there is no legal obligation for public
consultations.
Four future scenarios are considered to perform the studies mentioned above called Future
Energy Scenarios (FES)30 covering a long-term horizon up to 2050. These FES are produced by
the NGET and refer to Britain as a whole, but not Northern Ireland. The scenarios are intended
to provide a broad range of future states of the UK energy system: gone green, slow
progression, no progress and low carbon life. These parameters represent a matrix with
affordability and sustainability as key drivers. There are multiple parts in producing the
scenarios: e.g. policy drivers are considered to prepare the top down scenarios, assumptions
of specific generation and demand are based on customer submissions and econometric
elements are included.
These scenarios are published to support the stakeholders with longer term planning decisions
(up to 2050). The indicators of each of the scenarios are presented across the entire time
horizon. These scenarios are in general compatible with ENTSO-E approach: 2 top down and 2
bottom-up scenarios are constructed and considered. Also some sensitivity analysis is
performed to assess the impact of future contracted generators. The scenarios are widely
shared extensively debated through public consultations but the assumptions are not formally
approved outside the NGET.
30 http://fes.nationalgrid.com/

CBA and scenario development for energy and power system planning Final Report
EXERGIA S.A. 66
5.6.2 Cost Benefit Analysis
The FES scenarios are used in the CBA, together with local sensitivities and information on the
costs and transmission capacity improvements of transmission investments. Each scenario is
applied to assess costs and benefits and a “least regret” approach is used to determine
whether to progress or defer transmission investments.
The Electricity Ten Year Statement first identifies whether current border capacities (the
national network is split into a number of zones for the purpose of the analysis) are able to
fulfil security and economic criteria across the full lengths of the 4 FES scenarios. It then takes
potential transmission solutions where it is economical to invest at certain time-points, which
include a variety of offshore, conventional, operational and commercial solutions, as input to
perform a regional cost-benefit analysis. A standardized CBA methodology publicly available is
applied to evaluate future transmission projects. This methodology is proposed by the TSOs
and approved by the Regulator. More specifically, a CBA is performed for the following project
categories:
A. Onshore investments (Strategic Wider Works that are projects to provide additional
transmission boundary capability): financial threshold of £100m investment cost (for the
National Grid; thresholds for Scottish TSOs are lower). For onshore investments the National
Grid considers a range of possible scenarios for generation and demand in order to assess the
costs and benefits of large-scale network reinforcements. If the optimal reinforcement varies
with the scenario, a regression analysis to assess the outcome of each option in each scenario
in order to identify the one that has the least worst regret across all the scenarios.
B. Interconnectors (cap and floor regime). These are HVDC subsea interconnectors proposed
by competing developers, given regulatory support and price control. To date project sizes
have been in the range of 0.5GW – 1.4GW. For Interconnectors the CBA is undertaken by the
regulator, subject to multiple public consultations.
In general, larger projects are individually assessed (e.g. Strategic Wider Works projects >
£500m in cost for England and Wales). Practically, all “Wider Works” are reviewed.
Market and network studies are performed to support decisions; both are deterministic rather
than probabilistic. Market studies use the ELSI tool and are based on the FES scenarios.
Network studies are used to assess the transmission transfer capabilities that are used in in the
market simulations that are part of the CBA’s.
The scenarios and data used internally in NGET are aligned with information provided to
ENTSO-E for TYNTDP scenarios. There are 2 points to note here:
Firstly, there are timing differences given that the Future Energy Scenarios and
Electricity Ten Year Statement work is carried out each year whereas the TYNDP is
produced every 2 years. In practice, this means that by the time the TYNDP is published,
an updated set of Future Energy Scenarios will have been published.

CBA and scenario development for energy and power system planning Final Report
EXERGIA S.A. 67
Secondly, there may not be a one to one mapping of FES scenarios to TYNDP scenarios/
visions given the national context of the FES as opposed to the European context. In
practice FES scenarios are matched to TYNDP scenarios/ visions where reasonable.
The two ‘extreme’ FES scenarios ‘gone green’ and ‘slow progress’ are the basis for
National Grid’s submission to the ‘bottom-up’ ENTSO-e scenarios.
5.7 France
5.7.1 Power System Planning
The document referring to the regular planning activities in France is primarily the National
Ten-Year Development Plan (SDDR). It is a legally required document which is released every
year and includes all the transmission projects for the next decade (sometimes exceeding to
longer time horizon for projects with commissioning dates beyond the 10 years’ horizon). The
Plan is carried out by the French TSO (RTE) after consultations with the stakeholders and it is
publically available every year. The Plan is evaluated by the Regulator, who runs a public
consultation and assesses whether the plan adequately fulfills the needs of the market. The
SDDR is based on the assumptions and results by the generation adequacy study (see below);
extensive network analysis is performed for 4 different scenarios.
The National Generation Adequacy Study is also a legally required document performed by the
TSO. It comprises a Generation Adequacy Report on the electricity supply-demand balance in
France. The study is performed and published every year: the study released in odd years
covers the mid-term horizon (5 years), while the one released in even years covers both the
mid-term and long-term horizons (15 years), thus being the basis for all the long term planning
activities in electricity and relevant action plans. The study is subject to extensive consultation
with stakeholders.
The Generation Adequacy report is the basis for all planning activities in France. Four (4)
distinct scenarios are developed being used in all above mentioned activities. These scenarios
describe different, but possible futures for the long term. This long term exercise is conducted
once every two years and concludes on the possible energy mix at this horizon. The scenario
building methodology is based on an extensive data collection with external and internal
partners. To build those 4 scenarios, each one is built upon the following 8 axes: Demography,
Economic growth, CO2 and commodities prices, energy efficiency, electrical transport, nuclear
share, renewable growth and interconnectors’ level. Each of these axes can have 3 values:
High, Medium and Low. The combination choice is driven by national laws (as “Loi pour la
transition énergétique et la croissance verte”), RTE’s expertise and stakeholders’ feedbacks.
The study is performed at the European scale to better assess the interconnection contribution
so assumptions for 12 others countries are taken based on public and private information.
Probabilistic simulations are carried out to assess generation adequacy for each scenario.
Stakeholders are deeply involved in several stages of the process. The whole study

CBA and scenario development for energy and power system planning Final Report
EXERGIA S.A. 68
(assumptions and results) are an input for the national ten-year network development plan
(SDDR).
The elaboration of a National Energy Program is also a legal requirement. Furthermore, it is
prepared by the Direction Generale de l’ Energie et dy Climat (Ministry of Ecology, Sustainable
Development and Energy) every 5 years and covers a 10-year horizon ahead. A National
Renewable Energy Action Plan and a National Energy Efficiency Action Plan are also developed
by the Ministry of Ecology, Sustainable Development and Energy. These documents are also a
legal requirement and are publically available.
5.7.2 Cost Benefit Analysis
RTE performs CBA for all new transmission projects but only results from ENTSO-E TYNDP for
interconnectors are reported in the SDDR. The principles of the modelling methodology are
displayed in annex of the SDDR. There is only some information in the SSDR describing the
basic procedures. The CBA methodology itself is not subject to approval on a standalone basis,
but is analysed by the Regulator as part of the SDDR as a whole. The uncertainties are mainly
treated through the different scenarios, with certain projects being pointed as relevant only in
certain scenarios or assumptions.
The cost and benefit components are calculated through extensive Market simulations and
Network studies based on TSO data. A variety of tools is utilized to perform those studies. The
French data in ENTSOE bottom up scenarios (V1 and v3) are fully consistent with the
corresponding scenarios from French Generation Adequacy Report.
5.8 Germany
5.8.1 Power System Planning
The German electricity system has the specificity of having four TSOs. The network
development is a responsibility of the Federal Network Agency (BNetzA). Similar to France,
the long term planning documents for the electricity sector in Germany include:
The National Transmission System Development Plan (NTDP) is a legally required document. It
is carried out in collaboration with the German TSOs and it is published by the Federal Network
Agency every two years. It covers both the mid-term (10-15 years) and the long term horizon
(15-20 years). The Plan is officially approved by the Regulator after consultations with the
stakeholders. No information has been provided on the methodology for the construction of
scenarios (bottom-up or top-down) and the compatibility with ENTSO-E scenarios (data
provided to ENTSO-E by TSOs).
The National Generation Adequacy Study is also a legally required document performed by the
TSOs under the supervision of the Federal Government. It is executed and published every year

CBA and scenario development for energy and power system planning Final Report
EXERGIA S.A. 69
covering the short term horizon (1 to 4 years). The stakeholders are not involved as there is no
legal obligation for public consultations.
The Federal government is also responsible for the publication of National Energy Programs,
the National Renewable Energy Action Plan (under legal mandate) and National Energy
Efficiency Action Plan. Such reports cover various time horizons (up to 2050) for various
sectors) and are released not in a regular time basis. These documents are publically available;
stakeholders are not participating in the process.
Concerning the scenarios used, four scenarios (3 mid-term and 1 long-term) are used for the
NTDP. These scenarios are evaluated by the public in a 5-week consultation process. The
scenarios are officially approved by the Federal Network Agency. These scenarios are
compatible to the ones considered for the National energy programs.
5.8.2 Cost Benefit Analysis
There is no a standardized CBA methodology, as there is no legal provision to be approved by
the Regulator. Market simulations and network analyses are reported though. TSOs are the
main source of data.
5.9 Poland
5.9.1 Power System Planning
The main planning activities in Poland include the development of the National Transmission
System Development Plan31, which is a legally required document. The Plan is carried out by
the Polish TSO (PSE) every 3 years and is developed with a planning horizon of 10 years ahead.
The Plan is agreed with the Regulator, released after consultations with the stakeholders and
it is publically available.
A National Generation Adequacy Study - being also a legally required document - is performed
by the TSO. This study is performed every 3 years in the framework of the Plan but sometimes
more frequently. It covers a period of 15 years ahead. Also, an additional document is prepared
regarding the balancing of the system for a 15-year horizon. Although it is not subject to public
consultation, the answers by the generation stakeholders on specific questionnaires referring
to future power plants are taken into consideration. This study is not public.
The Ministry of Economy is also responsible (under legal mandate) for the execution of the
National Renewable Energy Action Plan, the National Energy Efficiency Action Plan and a
National Energy Program. The two Action Plans are updated every four years and refer to the
31 http://www.pse.pl/uploads/kontener/Plan_Rozwoju_2010_2025.pdf
http://www.pse.pl/uploads/kontener/Plan_Rozwoju_2010_2025_aktualizacja_2014-2018.pdf

CBA and scenario development for energy and power system planning Final Report
EXERGIA S.A. 70
long-term horizon (longer than 20 years), while the national Energy Program refers to the
energy policy goals of 2050. All the aforementioned documents are prepared after
consultations with the stakeholders and are publically available.
The same scenarios are considered for both the Transmission Development Plan and the
generation adequacy assessment. Two scenarios are elaborated under the objective of system
balancing using indigenous sources. These scenarios are constructed considering and
composing one demand scenario (the most likely) and two generation scenarios. The scenarios
for electricity demand are performed for a 25-year horizon. The scenarios for generation and
balancing are performed for a 15-year horizon. These scenarios are evaluated by the TSO, but
they are not officially approved. TSO tools and models are used in both the aforementioned
studies. The scenarios used are compatible with the Polish Energy Policy as far as development
of RES, maintenance and expansion of existing coal and lignite-fired power plants and the
construction of nuclear power plant after year 2025 are concerned. Thus, as a general remark,
the Plan takes into account the direction of development of generation sources as set in the
Polish Energy Policy.
5.9.2 Cost Benefit Analysis
There is no a CBA methodology used in general. Nonetheless, some form of CBA analysis is performed
for some NTDP projects even though no further information is provided.
5.10 Slovakia
The National Electricity Transmission System Development Plan in Slovakia is required by the
national legislation; it is prepared and published by the TSO (SEPS) in an annual basis for a
planning horizon of 10 years ahead.
A generation adequacy study is carried out every year in the framework of the NTDP using the
same data and hypotheses. The study applies the deterministic methodology developed by
ENTSO-E to carry out the System Outlook and Adequacy Forecast (SO&AF).
The stakeholders are involved in the process and the main sources of data used are the TSO
(SEPS) and the stakeholders. The assumptions that are used for the scenario building are not
officially approved.
The Ministry of Economy prepares also a National energy program (referring to a 20-year
period ahead), the National Renewable Energy Action Plan (every 5 years for a planning
horizon of 10 years) and the National Energy Efficiency Action Plan (every 3 years). Those
documents are legally required and publicly available.
For the development of the NTDP (and consequently the generation adequacy assessment), 3
scenarios are developed and considered by the TSO. These scenarios are constructed using a
bottom-up approach; low, medium and high load scenarios vs. multiple generation patterns
(considering generation development of major units and RES) are considered. Mid-term and
CBA and scenario development for energy and power system planning Final Report
EXERGIA S.A. 71
long-term perspectives of demand and generation given by stakeholders, the Ministry of
Economy and TSO experts are considered. The scenarios are not evaluated or approved by any
authority and they are not publicly available. Network studies are executed to develop the
NTDP.
The scenarios developed and used by the TSO respect the main policy lines of the strategic
documents (National energy program, National Renewable Energy Action Plan and National
Energy Efficiency Action Plan) prepared by the Ministry of Economy of Slovakia, but are not
the same as the scenarios used by the Ministry of economy are not communicated to the TSO.
The data delivered to ENTSO-E to develop TYNDP scenarios are the same as used for
development of National Development Plan. No CBA analysis is performed for the
transmission projects. No relevant methodology is reported.
5.11 Overall findings from MS review
5.11.1 General remarks on Transmission Development Plans
With respect to the Transmission Network Development Plans, the following general following
remarks can be made:
The Transmission Network Development Plans are prepared by the relevant TSOs in
most of the MS reviewed under a legal requirement, with the exception of Spain
(responsibility of the Ministry of Industry) and Germany (responsibility of the “Federal
Network Energy”).
The Network Development Plans are public documents released on an annual basis with
the exception of Belgium (every 4 years), Poland (every 3 years), Spain (every 4 years)
and Germany (every 2 years). The dates of release vary significantly among the various
MS.
The planning horizon of Transmission Network Development Plans is in most of the
cases 10 years (Spain reported a planning horizon up to 2020, United Kingdom reported
a planning horizon of 20 years while Germany’s NTDP covers both the mid-term (10-15
years) and the long term horizon (15-20 years)).
With respect to the provisions of the national legal frameworks, the Transmission
Network Development Plans are usually officially approved by the Regulator or the
relevant Ministry e.g. Spain (Regulator), Italy (Ministry). In some cases, e.g. in France,
the SDDR is evaluated by the Regulator, while in Poland, the National Transmission
System Development Plan is agreed with the Regulator.
The scenarios are subject to evaluation by relevant national authorities (Regulator
and/or Ministry) in UK, Belgium, Spain, Italy, Austria and Germany. Also the scenarios in
the aforementioned countries are evaluated by the stakeholders during public
consultation processes.
Usually TSOs organize the public consultations on the Network Development Plans
results. In Italy, the TYNDP is subject to consultation and then an opinion by the NRA

CBA and scenario development for energy and power system planning Final Report
EXERGIA S.A. 72
while in Germany the NTDP is officially approved by the Regulator after consultations
with the stakeholders. The level of involvement of stakeholders, the number/rounds of
consultations and the subject of the consultations vary by MS. For instance, in France a
permanent stakeholders’ body has been established while in some MS stakeholders
provide data and prognoses to the TSOs that are considered in the scenarios
development and consequently in the Network Development Plans.
The main data sources are mostly the national TSOs themselves with possible
contributions by the Ministries, DSOs, stakeholders etc. at various combinations.
5.11.2 Scenario building process
In most of the Member States reviewed there is no formally established scenario development
process similar to the one followed by ENTSO-E at the European level, except in France and
Germany. In general, the future scenarios are developed in the framework of the Transmission
Development Plan process driven mainly by the national TSOs. In large countries (such as
France and Germany) the scenario development process is better organized and supported by
the active involvement of stakeholders. In some countries the main hypotheses and
assumptions for the scenarios building are officially approved (usually by the Regulator and/or
the relevant Ministry, as in Latvia, Belgium, Spain and Germany) while in others they are just
consulted with the public or indirectly approved by the Regulator as a part of the Transmission
Development Plan.
It is also worth noting that in the big countries (Germany, France, and United Kingdom) there
is a long term view (up to 2050) considered in relevant scenarios and acting as the basis for the
national policies towards 2050. These scenarios have a major role in informing the
stakeholders on all (electricity) planning activities on a national level. Such scenarios seem to
be highly compatible with the relevant European views for the long – term horizon.
With respect to the number of scenarios considered in each MS, in general more than one
scenario is considered by the TSOs and up to 4 with additional “sensitivity” analysis cases. Most
of the TSOs follow a bottom-up approach to develop the relevant scenarios. In some cases,
(e.g. France) there is also a top-down approach implemented to determine a balanced result
in terms of compatibility with the national targets and generation adequacy requirements. In
most of the cases, the scenarios of the Transmission Plans seem not to be (fully) compatible
with the NREAPs (developed using a top-down approach with reference to 2020). Actually, the
compatibility of the scenarios used for Transmission Development Plans, generation adequacy
and NREAPs is quite unclear.
Although in most of questionnaires a very high consistency level between the scenarios used
at national level and the ones considered by ENTSO-E is claimed, it is not always confirmed by
the relevant answers to specific questions. The level of compatibility among the national and
ENTSO-E scenarios cannot be easily verified. In some cases, the compatibility level is high (such
as France, Germany and the United Kingdom) especially for the bottom – up scenarios as
concluded by the relevant processes but for most of the MS the national scenarios are rather
different than the ones used by ENTSO-E. The top – down scenarios developed by ENTSO-E are
CBA and scenario development for energy and power system planning Final Report
EXERGIA S.A. 73
obviously different than those used at the national level as they have been developed through
a different methodology.
5.11.3 Generation adequacy
Generation adequacy studies are inextricably related to the Transmission Development Plans
and the relevant scenarios considered for its development. In most of the countries
investigated, generation adequacy studies are performed under a legal requirement (except
for Slovakia and Spain). TSOs are mandated to perform such studies (in Germany), sometimes
in the framework of the Transmission Development Plan. The results of these studies are public
or partially public (except Slovakia, Poland and Spain). The study horizon of the generation
adequacy studies published significantly varies among MS from one year ahead (United
Kingdom) up to 2030 (France).
Since both Transmission Development Plans and generation adequacy studies are performed
- in their majority - by the TSOs, the background scenarios are in general highly compatible and,
in any case, not far to each other, but still much different than the ENTSO-E top-down
scenarios. The compatibility to the hypotheses used in other national planning activities (such
as NREAPs, National energy programs, etc.) is very unclear though.
As a conclusion, it seems that the scenarios used at the national level are in general different
than those used by ENTSO-E, especially the top-down scenarios. The big countries (Germany,
France and the United Kingdom) show a higher degree of compatibility with ENTSO-E since
they apply similar approaches in developing future views and have published detailed plans
and roadmaps towards 2050.
In general, there are no scenario building methodologies and processes established at the
national level. Also, the procedures followed are not harmonized. It seems that the national
policy dimension is much stronger than the European aspects although there is a trend to
increase the impact of the European energy targets.
5.11.4 CBA issues
Traditionally, some European TSOs used to perform CBA studies for the major transmission
projects. This is becoming a requirement recently triggered mainly by the EC and the relevant
processes to harmonize and optimize transmission infrastructure development in the
continent. Actually, the “official” requirement for CBA of transmission projects is a rather new
issue for TSOs, especially under the deregulated electricity market environment. At this early
stage of CBA application, the main findings of the investigation are summarized below.
The majority of the TSOs perform a CBA assessment for certain transmission projects included
in the National Transmission Development Plan (e.g. in Italy the CBA was performed for
projects with investment cost above 25 million Euros in the Plan of 2015, in Spain CBA is
conducted specifically for electricity transmission projects related to structural reinforcement

CBA and scenario development for energy and power system planning Final Report
EXERGIA S.A. 74
of the transmission grid, in Latvia CBA is performed for strategic PCIs while in Poland some
form of CBA analysis is conducted for certain NTDP projects). No CBA analysis is performed in
Slovakia, Germany (for which some market simulations and network analyses are reoirteed to
be performed though) and Austria.
Standardized CBA methodologies have been developed and applied in the United Kingdom,
Italy and France. These methodologies are publicly available only in the United Kingdom and
Italy. Several TSOs reported that they follow the ENTSO-E CBA methodology principles but this
cannot be verified since the relevant documents are not public. The methodologies used are
subject to approval by the relevant NRAs (UK, B, IT, FR).. Most of the TSOs perform market
and network studies to assess the costs and benefits of each project. The tools used for the
market studies (the most crucial ones for the CBA) vary a lot among TSOs with respect to the
type of methodology (deterministic vs probabilistic) and the modelling of generation. A large
variety of software tools is used, some of them being in house tools but also some
commercially available tools.
5.12 Recommendations for further harmonisation
The analysis shows that certain steps towards harmonization have been taken. Nonetheless,
there is still a need to accelerate the procedures and actions in many aspects so as to increase
transparency and facilitate the required level of collaboration and common planning activities
of European TSOs. These activities are required in order to determine the transmission needs
and optimize the transmission infrastructure development in Europe and therefore facilitate
the integration of the internal electricity market. In Consultant’s view the main issues on which
further harmonization is required include:
The number and type of scenarios used for the Transmission Development Plans should
gradually converge with those elaborated by ENTSO-E.
The establishment and application of a formal “scenario building” process should be
progressively aligned with ENTSO-E relevant provisions, including among others the
institutional participation of stakeholders.
The methodologies of scenario building and relevant policy assumptions to develop
future visions should be gradually harmonized to the largest extent possible.
Data sources and the possible contribution of stakeholders should be better described
and organized.
The compatibility of the scenarios considered by the TSOs to develop the NTDPs
(bottom-up scenarios) with the ones used by ENTSO-E in the TYNDP should be verified
by ENTSO-E.
Top – down scenarios used at the national level (wherever applicable) should be aligned
with the respective ENTSO-E scenarios.
The market studies methodologies should be harmonized at least at the overall
methodological approach level (treatment of intermittent RES, availability of thermal
generation, modelling of hydros and pump-hydros, etc.) and most preferably at the level
of software tools used.

CBA and scenario development for energy and power system planning Final Report
EXERGIA S.A. 75
The entire process of Transmission Development Plans release should be harmonized,
including the frequency of execution (an annual basis is recommended), but roughly the
dates of the official release, so as to avoid discrepancies.
In Consultant’s view, the establishment of an “official” and commonly applied CBA
methodology at the European level being followed by all TSOs in a compulsory mode is
feasible. Practically, this should be probably the ENTSO-E CBA methodology (and its
updates) being approved centrally (by NRAs in the framework of ACER). This seems a
realistic task that could be easily achieved at this early stage of national CBA processes
development.
CBA and scenario development for energy and power system planning Final Report
EXERGIA S.A. 76
6 CONCLUDING OVERVIEW
This Section outlines the main findings and conclusions discussed throughput this Report. In
line with the ToR requirements, the analysis performed by the Consultant has focused on the
following areas:
The processes used by ENTSO-E to build future scenarios for the electricity sector.
The CBA methodology developed by ENTSO-E and its application.
A high level review of the relevant processes both on scenario building and CBA utilised
in 10 selected Member States.
The analysis carried out throughout the Study aimed to:
Assess the compatibility of the methodology with the provisions of the relevant
legislative framework.
Identify weak and unclear points in the processes and make reasonable
recommendations.
Assess the clarity of the methodologies for the external stakeholders.
Assess the level of transparency and publicity of data and relevant results, as well as the
stakeholders’ involvement.
Identify the future challenges and elaborate relevant recommendations.
Assess the compatibility and level of harmonization of relevant processes at national
level among Member States.
Assess the level of adjustment of the methodologies to the comments made by the
Agency and other stakeholders to the scenario building and the CBA methodologies.
In general, the progress achieved so far in view of the preparation of TYNDP 2016 is quite
significant in all aspects and considerable improvements have been made in comparison to the
2014 TYNDP. Nevertheless, there are still steps in the processes that should be further clarified
or improved.
The majority of the comments made by ACER on the basis of the 2014 TYNDP have been
addressed by ENTSO-E in the 2016 Scenario Development Report. Some of them which are still
pending were identified in this Report. It should be also noted that the major weak points of
the methodologies used and future challenges expected to be faced (such as the provision and
treatment of ancillary services, the assessment of storage projects etc.) are well recognized
by the TSOs and ENTSO-E is understood to have launched relevant processes for tackling these
issues commented by ACER and other stakeholders.
Scenario building and CBA assessments are performed to a large extend in a decentralized
manner by member TSOs or at regional level by the corresponding Regional Groups of ENTSO-
E. In fact, ENTSO-E relies heavily on the work of its member TSOs. Thus, the scenarios / visions
for the preparation of TYNDPs are developed on the basis of a pan-European global view at
the ENTSO-E level, i.e. taking into account the power system of all ENTSO-E members (which
includes non EU members as well), while the CBA of each project is performed by the ENTSO-

CBA and scenario development for energy and power system planning Final Report
EXERGIA S.A. 77
E Regional Groups, principally on the basis of the corresponding regional part of the power
system. Therefore, depending on the case, some processes may be carried out on different
subsets of data. Generally, the impact of the TSOs’ view is crucial even for the centralized
processes and mainly for the construction of top-down scenarios. The level of harmonization
of local (TSO level) or regional views (RG level) is an important issue that is recommended to
be further assessed by ENTSO-E.
The following sections present a concluding overview of the findings and recommendations
derived from the analysis of the scenario planning process and the CBA methodology at
European level, as well as the analysis of these two issues for specific MS.
6.1 Scenario Building
The scenario building methodology implemented by ENTSO-E has contributed in the
improvement of the European power system planning in comparison to the previous years.
The methodology described in the TYNDP 2016 Scenario Development Report is a large step
towards the positive direction but there is still large room for improvement in various respects.
A major issue related to the scenario planning and the CBA as an integrated process is that the
time frame of the studies focuses explicitly on the 2030 failing to provide policymakers and
stakeholders an intermediate picture of the evolution until that point. Targets set for
renewables, energy efficiency, de-carbonization and interconnections, frame the direction of
the studies and resulting recommendations for grid development up to 2030. Nonetheless, the
absence of an intermediate roadmap towards the generation mix foreseen for 2030 (e.g.
annually, every two or five years) does not provide a clear picture of the evolution of the EU
power system.
In Consultant’s view, even though the development of the 2020 scenario is towards a positive
direction, still the disclosure of all intermediate steps and a more accurate trajectory towards
2030 remains a prerequisite to allow for a complete CBA but also to allow stakeholders and
NRAs to obtain a better comprehension of each view and relevant justification. Furthermore,
there is need for a different treatment of the long term horizon (˃ 10 years) than the medium
term. In this context, the role of stakeholders could be much more useful in developing long
term views as TSOs have no data on very long term developments.
There is a strong policy dimension with regard to determining the detailed scenarios and
parameters and the targets and interaction with other energy sectors. On the other hand,
there is quite a number of other studies developing future scenarios, some of them officially
endorsed by EC, performed by entities such as EC-DG Energy, IEA and other institutions and
organisations. The Consultant recommends that the EC and Member States are more actively
involved in the process of scenarios / visions development and potentially even undertake the
overall exercise in broader collaboration with stakeholders. This approach would allow for
more consistency with policy directions in one hand but it would also take into account the
most up-to-date evolution of technologies. Such a procedure would also increase significantly
the transparency and acceptability of the scenarios among stakeholders and facilitate the

CBA and scenario development for energy and power system planning Final Report
EXERGIA S.A. 78
effective distribution and communication of both the approaches and methodologies utilized
and the results.
The Agency and NRAs should keep having a key consulting role by providing opinions and
assessments on the scenarios in the framework of this process. This approach would release
as well ENTSO-E resources to be used in other activities related to the CBA assessment and
allow him to focus in assessing the technical aspects of the scenarios implementation from the
transmission infrastructure point of view.
According to ENTSO-E the four visions ‘provide the envelope within which the future is likely
to occur’. There is a strong debate whether this ‘envelope’ contains all or the major part of the
possible feature system evolution states in the long term. On the other hand, the extremes
represented by the 4 scenarios / visions may not present the most adequate basis for the
assessment of projects. This is evident by the deviation of CBA results among visions. In
general, as far as the CBA results are concerned, these high deviations do not provide a clear
ground for decisions (related to CBA, CBCA etc.). The probability of the CBA assessment results
actually becoming reality, i.e. the robustness of the results across scenarios is of much more
value for the readers and should be somehow tackled.
Therefore, the development of a “best estimate” scenario until 2030 attaching the probability
of occurrence along with a sensitivity assessment (addressing the potential variation of the
key assumptions adopted for the ‘main’ scenario) would provide a clearer view of what is
anticipated or at least a complementary set of results referring to the most likely future
evolutions. It is noted that in this direction, ENTSO-E has developed an intermediate 2020
scenario reflecting the “expected progress” according to TSOs best estimate, but not until
2030.
The 2016 Scenario Development Report could be characterized as a high level description of
specific tasks rather than a concrete and detailed methodology. As such, it occasionally fails to
explain and elucidate to the reader various aspects of the process. It is, thus, unclear, to the
reader if and how certain considerations are taken into account. Specific aspects of the
methodology that could be improved or presented more clearly to the reader include: (a) a
detailed explanation of how visions are (technically) translated into scenarios (b) an
explanation on the rationale for choosing the specific parameters and a quantifiable
description (c) clarifications are required on how these parameters are used and clustered to
develop the scenarios (d) a clear distinction between assumptions/parameters and results (e)
a clearer presentation of the implementation details on the building of top-down scenarios
from bottom-up scenarios. The elaboration of a well substantiated, documented and
commonly approved methodology would vastly alleviate the quality, reliability and
transparency of the scenario building process.
With regard to the stakeholders’ involvement to scenario building process, it is noted that the
number consultation meetings already carried out seems adequate, However, despite the
existing formal procedure for interaction and consultation with stakeholders, it is not clear to
what extend stakeholders can contribute and affect the formulation of scenarios and how the
respective contributions are taken into account. A streamlining of the consultation process, in

CBA and scenario development for energy and power system planning Final Report
EXERGIA S.A. 79
terms of an advance consideration by ENTSO-E of the role and involvement of each
stakeholder in the consultation process would result in higher efficiency and transparency.
Last but not least, apart from the presentation of the methodology a more detailed reporting
on scenario findings and especially the publication of: (a) country balances, (b) capacities and
(c) cross-country imports/exports would improve the planning process and increase
transparency.
6.2 Cost Benefit Analysis
The CBA methodology developed by ENTSO-E addresses quite successfully the challenging
specific requirements posed by the relevant EU regulatory framework, both from the
methodological, as well as from the organisational / procedural points of view. The numerous
consultations carried out and comments expressed by various stakeholders have helped
considerably towards the improvement of the methodology. In this context, the remarks
expressed in the previous sections attempt to address and fine tune issues which in the opinion
of the Consultant will contribute to the clarity and further improvement of the methodology.
Transmission investments are frequently clustered together and the CBA is performed on the
resulting cluster. Clusters aim to support avoiding the underestimation of the potential net
benefit resulting from the completion of more than one projects which are located in the same
area or along the same transmission corridor and contribute to achieve a common measurable
goal. One of the two rules currently used by ENTSO-E for clustering the individual projects
takes into account the influence of the project on the GTC and the other the time distance of
the commissioning dates which is up to 5 years. However, the definition of the first rule in the
CBA methodology requires a more comprehensible definition. The second rule also when
applied literary seems problematic and rather arbitrary. It could however be used in a more
flexible way, by allowing reasoned justifications for clustering projects which break this rule by
a small margin, while it could at the same time, become stricter (i.e. allowing a shorter
difference of commissioning times) so as to create pressure for better time alignment of
clustered projects.
In the same direction, it is important that GTC, which is a very significant factor in the whole
TYNDP process is defined and explained more comprehensively to its in order to ensure that it
takes into consideration realistic power flows, any applicable transmission margins (i.e.
margins allocated for regulation or other system security issues), etc. Gradual adoption of flow
based methodologies for calculation of GTCs would allow taking into account potential crucial
internal congestions within each TSO area, which could be expected due to the high
uncertainties caused by high RES penetration and the markets’ volatility.
Currently the CBA indicators are calculated only for the end year of the time period analysed
(i.e. 2030) as it is evidenced by the results for each project which were presented in the TYNDP
2014, while in the forthcoming 2016 TYNDP, they are expected to be calculated for 2020 as
well. This approach practically eliminates the impact/benefit which is accumulated by a project
from the commissioning date till the end of the studied period and therefore the respective

CBA and scenario development for energy and power system planning Final Report
EXERGIA S.A. 80
cumulative benefits. In other words, if a project is commissioned in the beginning of the
studied period the calculated benefit will be the same to that of a similar project commissioned
at the end of the studied period.
As the resources and the effort required for assessing each year of the studied period are very
significant, the task for extending the scope and depth of the CBA analysis to address each
year of the studied period is a very challenging issue. However, this should be counterweighted
against the higher credibility of the CBA results. Potential improvements in the process of
application of the CBA methodology could also assist in saving effort and resources which
could be allocated to the aforementioned task, e.g. the adoption of a common tool for the
performance of the market studies uniformly for all projects assessed and at the EU level
instead with different tools and at regional level which is the case today, calculating the
Security of Supply indicator only for the whole TYNDP and selected individual projects which
are expected to have a high relevant impact, as discussed in the respective sections of the
Report. In any case, as an intermediate step, the CBA should align with the 5-yearly time
periods foreseen by the regulation.
CBA methodology employs 2 impact indicators, 7 benefit indicators plus the cost of a project
in order to conclude the analysis. Out of the benefit indicators, B2 which measures the benefit
from the project on social welfare is the one with the highest significance as it internalizes the
“B3: RES integration” and “B5: Variation in CO2 emissions” indicators and it usually represents
the major portion of the benefits achieved by a project. On the other hand, indicator B7
(“Flexibility”), in the opinion of the Consultant is a “mixed” bag, attempting to capture
complicated aspects of the power system operation, seemingly on the basis of the experience
alone of TSOs and with too high level guidelines by the CBA methodology. In the opinion of
the Consultant, B7 should be restricted in indicating the adaptability of a project on the various
system conditions (as expressed by the different scenarios), and this could be accomplished in
a more concrete manner, i.e. by assessing the relative variation of a project’s benefits across
the scenarios.
The environmental benefit is internalised in indicator B2 (“Social Welfare”), by considering the
avoided CO2 costs due to the decrease of thermal generation, whereby the avoided CO2 cost
is based on the future value per ton of CO2 emissions. However, it is not certain that this value
of CO2 emissions captures the real external cost of electricity in relation to GHG. Furthermore,
the impact on human health from thermal generation, and therefore the benefit from the
reduction of such generation, is not considered at all. A more thorough assessment and
potential reconsideration of the environmental benefit of transmission projects is
recommended.
Regarding the impact of a project on the flexibility of a system in terms of ancillary services,
which is of high importance again due to the high penetration of RES, and due to the high
difficulty and complexity of such an assessment, it is recommended that this assessment
becomes a future task for ENTSO-E. A methodology for the calculation of ancillary services
should be provided within the framework of the “target model” on an ENTSO-E-wide base. On
the basis of this methodology, an additional benefit indicator (B8) reflecting the benefits
related to ancillary services could be potentially added in the current CBA methodology.
CBA and scenario development for energy and power system planning Final Report
EXERGIA S.A. 81
Market studies provide the main results to support the calculation of the benefit indicators for
each project. It is understood though that sometimes the number of market studies carried
out is greater than the minimum required as in many RG more than one market study tools are
applied by different TSOs. Although the concepts followed by ENTSO-E RGs in market studies
methodologies are very similar, it seems that there are differences among the methodologies
used by the various RGs around Europe. Several different relevant tools are reported being
used. This could lead to inconsistencies of the results among ENTSO-E regions. The lack of
uniformity of either the methodology or the tools utilized for market studies among RGs is
understood to impose a heavier work load and additional effort for resolving any kind of
inconsistencies. It is recommended that, after consultation with the stakeholders, a common
methodology is applied Europe wide, by all regional groups and preferably, a commercial
widely used market studies S/W tool should be adopted.
Finally, due to the importance of the CBA for future investments in electricity transmission and
storage, not only for projects planned and promoted by the ENTSO-E members (European
TSOs) but also for projects promoted by 3rd parties as well as for PCI selection, the
transparency of the application of the CBA methodology is of high importance as well.
Therefore, the necessary data for performing the CBA, should become publicly available, to
the extent that practical and/or other considerations allow. A relevant road map for the release
of this data is therefore highly recommended.
6.3 Review of Selected Member States
In line with the ToR requirements, 10 MS have been reviewed using information collected by
questionnaires on issues related to the scenario building and CBA at national level. Although
all MSs fully respect the 3rd Energy Package provisions related to the development of a
National Transmission Development Plan in terms of legal obligation, stakeholders’
involvement and publicity, there are still several issues that should be harmonized in the
underlying processes such as the scenario building and CBA. More specifically:
Scenarios Development
In most of the MS analysed there is not an established “scenario development” process at the
national level similar to the one followed by ENTSO-E at the European level. In general, the
future scenarios are developed in the framework of the National Transmission Development
Plan process driven mainly by the national TSOs. Most of the TSOs follow a bottom-up
approach to develop the relevant scenarios. In some cases, there is also a top-down approach
applied to achieve a balance compatible with the national targets and generation adequacy
requirements.
The level of compatibility among the national and ENTSO-E scenarios cannot be easily verified.
In some cases, the compatibility level is high (e.g. France, Germany, United Kingdom)
especially for the bottom – up scenarios as concluded by the relevant processes but for most
of the MS the national scenarios are rather different than the ones used by ENTSO-E. The top-
-down scenarios developed by ENTSO-E are obviously different than those at the national level

CBA and scenario development for energy and power system planning Final Report
EXERGIA S.A. 82
as they have been developed through a different methodology. Furthermore, in the
aforementioned big countries the scenarios development process is better organized with the
deep involvement of stakeholders.
It is also notable that in the big countries (Germany, France and United Kingdom) the long-
term perspective (up to 2050) is reflected in relevant scenarios, being the basis for the national
policies towards 2050. We recommend that the construction of such scenarios should be
extended at EU level. Similarly, the time horizon covered by NREAPs might be extended
accordingly. Special care should be given to the compatibility of such scenario to the ENTSO-E
views.
CBA issues
With respect to the CBA, the requirement for CBA of transmission projects is a rather new
obligation for many TSOs, especially under the deregulated electricity market environment,
even though some European TSOs traditionally used to perform CBA studies for major
transmission projects. The majority of the TSOs reported that they perform CBA only for major
transmission projects, with very few TSOs performing CBA for all the projects included in the
National Transmission Development Plan.
Standardized CBA methodologies have been developed and applied only in specific countries
(United Kingdom, Italy and France). Several TSOs reported that in general they follow the
ENTSO-E CBA guidelines but this cannot be verified since the relevant documents are not
public. The methodologies used are usually subject to approval by the relevant NRAs. The CBA
results (when available and if any) are either fully or partially published for selected projects in
the relevant National Transmission Development Plans.
6.4 Overview of proposed recommendations on scenario development and CBA methodology
Proposed recommendations for the improvements in scenario development and CBA
methodology have been discussed in detail in the respective sections of this Report. The
following Tables 6.1 and 6.2 present a critical overview of the main recommendations with
regard to scenario development and CBA methodology respectively, including their objectives
and a qualitative assessment of the anticipated level of difficulty for their implementation, the
resources needed, the priority for addressing them. The table includes as well the anticipated
risks and the bodies that should have a main role in implementing these recommendations.

CBA and scenario development for energy and power system planning Final Report
EXERGIA S.A. 83
Table 6.1: Overview of proposed recommendations on scenario development
Issue / comment Recommendation Objective Level of
difficulty
Resources
needed Priority Risks
Bodies
involved
Formulation of Visions/Scenarios
Selection of basic parameters
of scenarios/visions (i.e.
climate targets and
strengthening of European
governance) difficult to
justify.
Broader collaboration with other more
expert bodies (EC, IEA, etc.) especially
for the long term period.
To improve
transparency and
credibility of visions
and effectiveness
of the scenario
development
process
Med
Low
Hi
Coordination of the
collaboration
ACER, ENTSO-
E, EC
Ongoing significant
activity on development
of scenarios for the
future outlook of the EU
energy system by several
organisations, including
development of
scenarios endorsed by
the EC
Strong policy dimension
with regard to
determining the detailed
scenarios and
parameters and the
targets and interaction
with other energy
sectors (e.g. gas, etc.).
EC and Member States should take a
more active role on the definition of
scenarios / visions, and potentially
undertake this activity. NRAs and ACER
should have a major consultative role in
this process.
Med-Hi Med Med Potential conflicts -
coordination issues. EC, MS, ACER,
NRAs

CBA and scenario development for energy and power system planning Final Report
EXERGIA S.A. 84
Issue / comment Recommendation Objective Level of
difficulty
Resources
needed Priority Risks
Bodies
involved
Extensive debate on the
“envelope” of future power
system states created by the
4 scenarios / visions
Development of a Best Estimate
Scenario, accompanied by variation
range for key parameters
Clearer view of
future expectations
for the system
development
Med Low Low-
Med
Reaching a commonly
acceptable set of key
assumptions and
respective values
ENTSO-E,
ACER, EC
Methodology for scenarios / visions development
Poor description of certain
aspects of the methodology. More clarifications on the methodology
are needed by ENTSO-E.
To improve clarity,
transparency,
consistency of
results
Low Low Hi
Time consuming
process
Involvement of
many TSOs
ENTSO-E,
TSOs
Unclear process of
construction of the bottom
up scenarios at the TSO level. Harmonization among TSOs Med Low Med
Unclear level of
harmonisation with the
national energy policy / goals
and unclear assumptions for
the development of the
bottom-up scenarios in the
2020-30 period.
Development of guidelines for bottom
up scenario building by the TSOs Med Med Med
Not accounting for
interactions and
substitution effects
among energy sub-
sectors and elasticity of
demand.
Unclear coordination
with ENTSO-G
Interaction among energy sub-
sectors should be considered more
explicitly
Coordinate ENTSO-E/ ENTSO-G
TYNDPs (harmonise scenarios,
dates of release etc.).
Improve quality
and credibility /
acceptability of
results
Med-Hi Med Med
Agreement on
initial hypotheses
Views of Gas
TSOs and relevant
stakeholders to
be aligned to
electricity sector
views
ACER, ENTSO-
E, TSOs

CBA and scenario development for energy and power system planning Final Report
EXERGIA S.A. 85
Issue / comment Recommendation Objective Level of
difficulty
Resources
needed Priority Risks
Bodies
involved
Scenario definition and inputs
Poor description of input
data and initial hypotheses Full disclosure of the scenario building
methodology and assumptions.
Improve clarity
Low Low Hi
Difficulty to agree
generation mix
among stakeholders
ACER, ENTSO-
E, TSOs
Some key parameters for
each scenario are presented
in qualitative terms. Unclear
how these are quantified.
Clarifications on the use of parameters
to scenario formulation and
quantification hypotheses. Hi Low Med
Missing info on future
internal networks.
A full description of inputs referring to
future development of internal
networks (publicly available data).
Increase
transparency Low Med Med
Confidentiality issues
may arise ENTSO-E
Time frame of scenarios
System outlook is defined for
only 2 time points (i.e. 2020,
2030) per scenario.
Definition of system outlook for more
time points of the TYNDP time period
to allow for better scenario definition
and performing a CBA over the
complete TYNDP period.
Improve quality of
the results,
increase
transparency.
Hi Hi Hi Large workload for
ENTSO-E ENTSO-E
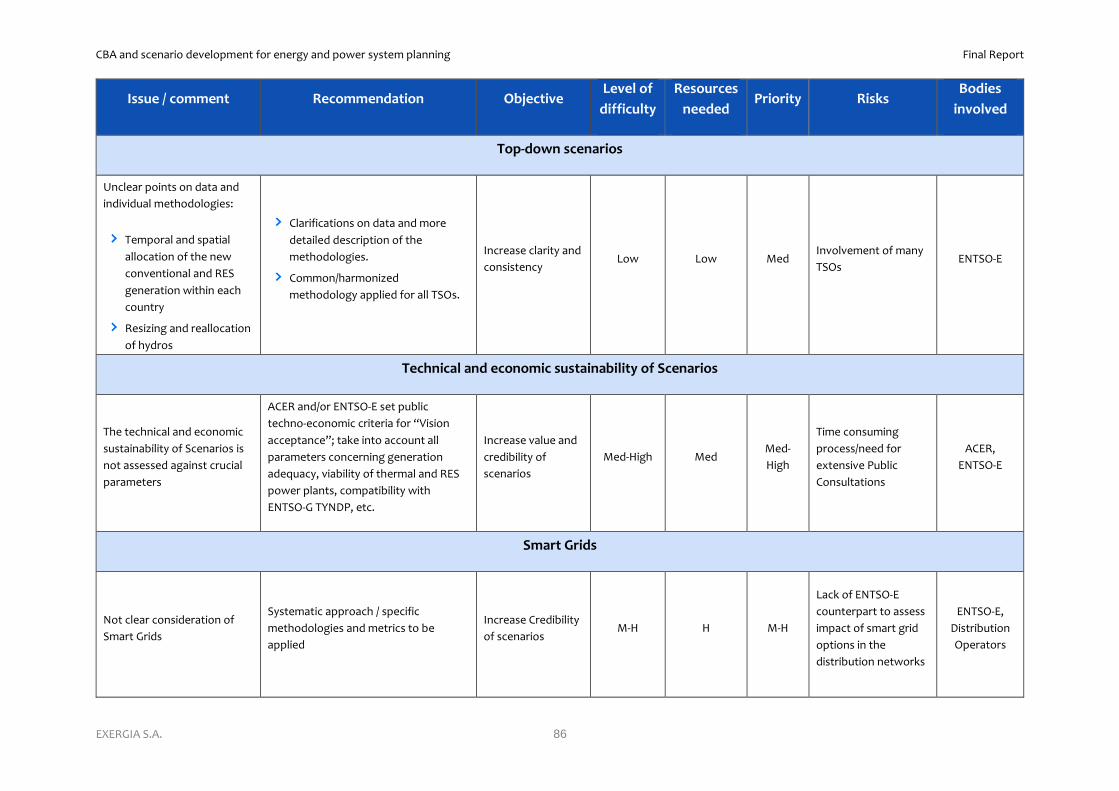
CBA and scenario development for energy and power system planning Final Report
EXERGIA S.A. 86
Issue / comment Recommendation Objective Level of
difficulty
Resources
needed Priority Risks
Bodies
involved
Top-down scenarios
Unclear points on data and
individual methodologies:
Temporal and spatial
allocation of the new
conventional and RES
generation within each
country
Resizing and reallocation
of hydros
Clarifications on data and more
detailed description of the
methodologies.
Common/harmonized
methodology applied for all TSOs.
Increase clarity and
consistency Low Low Med
Involvement of many
TSOs ENTSO-E
Technical and economic sustainability of Scenarios
The technical and economic
sustainability of Scenarios is
not assessed against crucial
parameters
ACER and/or ENTSO-E set public
techno-economic criteria for “Vision
acceptance”; take into account all
parameters concerning generation
adequacy, viability of thermal and RES
power plants, compatibility with
ENTSO-G TYNDP, etc.
Increase value and
credibility of
scenarios Med-High Med
Med-
High
Time consuming
process/need for
extensive Public
Consultations
ACER,
ENTSO-E
Smart Grids
Not clear consideration of
Smart Grids
Systematic approach / specific
methodologies and metrics to be
applied
Increase Credibility
of scenarios M-H H M-H
Lack of ENTSO-E
counterpart to assess
impact of smart grid
options in the
distribution networks
ENTSO-E,
Distribution
Operators

CBA and scenario development for energy and power system planning Final Report
EXERGIA S.A. 87
Issue / comment Recommendation Objective Level of
difficulty
Resources
needed Priority Risks
Bodies
involved
Engagement of Stakeholders
Involvement of stakeholders
can be enlarged and
improved.
ENTSO-E issues an explanatory
document at the beginning of the
TYNDP building process dealing with
stakeholders involvement and relevant
roles on methodologies proposed and
data publication (with respect to
confidentiality issues).
Increase
transparency and
scenario
acceptance
L
L
M
Increased work load
for ENTSO-E ENTSO-E,
Stakeholders

CBA and scenario development for energy and power system planning Final Report
EXERGIA S.A. 88
Table 6.2: Overview of proposed recommendations on CBA methodology
Issue / comment Recommendation Objective Level of
difficulty
Resources
needed Priority Risks Bodies
Clustering of transmission projects
The clustering rules seem
unclear and arbitrary.
Competitive project” term
is unclear
Clarifications needed as well
as a brief presentation of
the concept leading to the
clustering rules.
5-year time threshold rule
for clustering to be
reconsidered allowing for
more flexibility / pushing for
higher time alignment of
projects commissioning
Increase clarity and
transparency
Increase credibility of
results
L L H ENTSO-
E
Time horizon and CBA assessment
The time horizons applied
differ from Regulation
347/2013 provisions.
Time horizons considered
do not allow a CBA of a
project over the entire
TYNDP period
ENTSO-E provides input data
sets and relevant network and
market analysis results for at
least four time horizons within
the TYNDP
Compatibility with the
Regulation, more accuracy
with respect to results
L
H
H
Considerable increase of
work load for ENTSO-E ENTSO-
E

CBA and scenario development for energy and power system planning Final Report
EXERGIA S.A. 89
Issue / comment Recommendation Objective Level of
difficulty
Resources
needed Priority Risks Bodies
CBA indicators seem to be
assessed only for the end
year of the TYNDP period
Effect on the CBA
indicators of the
commissioning year of a
project is not taken into
account
CBA indicators should be
assessed considering the whole
TYNDP period
To consider project
impacts over the
complete TYNDP period
Low Hi Hi
Availability and transparency of CBA background data for verification
The necessary data to
reproduce and verify CBA
results are not sufficiently
provided to the public.
ENTSO-E should define a
roadmap for making publically
available all the necessary data
for the CBA.
Increase transparency Med Low Hi Confidentiality issues
which may arise ENTSO-
E
CBA indicators
Indicator B7 attempts to
capture several complicated
issues of system development,
however provided
methodological guidance is
insufficient
Indicator B7 is focused on the
adaptability of a project to the
various system development
scenarios
More clarity for Indicator
B7 Med Low Med -
ENTSO-
E

CBA and scenario development for energy and power system planning Final Report
EXERGIA S.A. 90
Issue / comment Recommendation Objective Level of
difficulty
Resources
needed Priority Risks Bodies
Methodology for assessment of
the environmental benefit of
transmission projects seems to
underestimate benefit
Assessment of the
environmental benefit should be
based on the external cost of
thermal electricity generation
More accurate capture of
environmental benefit Med L Med
Agreement on value of
external cost of thermal
generation
ENTSO-
E
The SoS indicator is not
monetised
To be monetized especially in
sounding cases (new areas
connection or weak
connections) using an agreed
VOLL (approved regionally)
Improve credibility of
results and transparency
L
L
H
(for
specific
projects)
Differentiation of
VOLL/hypotheses on
VOLL
ENTSO-
E
Additional impact of transmission projects (ancillary services)
Ancillary services are not
considered in the CBA through
appropriate indicators.
Introduction of an additional
impact indicator (B8) accounting
for contribution to ancillary
services (especially system
“flexibility”).
Improve credibility of
results H H L-M
Difficulties in the
assessment of ancillary
services. Some entities
claim that it is not
possible to assess the
ancillaries’ requirements
ENTSO-
E

CBA and scenario development for energy and power system planning Final Report
EXERGIA S.A. 91
Issue / comment Recommendation Objective Level of
difficulty
Resources
needed Priority Risks Bodies
Market and Network studies
It seems that there are
differences among the
methodologies and the S/W
tools used by the various RGs.
This could lead to
inconsistencies of the results
among ENTSO-E regions.
ENTSO-E proposes a common
methodology (and preferably
common tool) to be applied by
all RGs.
Enable much higher
consistency level of the
results and increased
transparency and
potentially decrease
considerably the work
load for consistency
checks
M M H/M
Differentiation among
TSOs and difficulties in
harmonization.
ENTSO-
E
Transmission capacity (GTC)
Calculation of GTC is described
very briefly, thus the whole
process is unclear to the reader.
More information is
provided on GTC calculation
Relationship of GTC and NTC
is explained
In any case, the utilization of
harmonized “flow-based”
methodologies is proposed
at least for the calculation of
the GTCs.
Increase the credibility of
the results
L
H
L
H
H
L-M
Possible delays / need
for agreement among
TSOs
ENTSO-
E

CBA and scenario development for energy and power system planning Final Report
EXERGIA S.A. 92
Issue / comment Recommendation Objective Level of
difficulty
Resources
needed Priority Risks Bodies
Assessment of storage projects
There is no information on the
modelling of storage projects in
the market framework and their
operational objectives (i.e.
profit maximization, overall
system cost minimization,
minimization of RES spillage
etc.).
ENTSO-E proposes a general
methodology on the modelling
and simulation of storage
projects in the market studies (to
be adopted by the Agency after
consultation with the
stakeholders)
Increase transparency and
the credibility of the
results
M M H
Difficulties to converge
towards a harmonized /
common methodology
ENTSO-
E