Embed Size (px)
Citation preview

ORIGINAL PAPER
Can ants be used as indicators of environmental impactscaused by arsenic?
Carla R. Ribas • Ricardo R. C. Solar •
Renata B. F. Campos • Fernando A. Schmidt •
Clarisse L. Valentim • Jose H. Schoereder
Received: 10 February 2011 / Accepted: 20 July 2011 / Published online: 4 August 2011
� Springer Science+Business Media B.V. 2011
Abstract We evaluated ants as bioindicators of envi-
ronmental impacts caused by arsenic residuals in the soil.
We tested the hypotheses that the presence of arsenic in the
soil affects: (1) estimates of resources and habitat condition
for arboreal and epigaeic ants; (2) species richness of
arboreal and epigaeic ants and (3) arboreal and epigaeic ant
species composition. Ants were sampled at an inactivated
raticide factory in Nova Lima, Minas Gerais, Brasil, which
used arsenic as one of its main byproducts. The following
environmental variables were measured: bioavailable
arsenic concentration in the soil, the number and density of
tree species, plant cover and leaf litter depth. The species
richness of arboreal ants decreased with increased bio-
available arsenic concentration whilst epigaeic ants
increased with arsenic. Arboreal ants were positively
related to the number of tree species, which in turn were
negatively affected by arsenic. We verified which ants are
good bioindicators of arsenic. Independent verification of
the influence of arsenic on background environmental
variables was fundamental in defining responses of ant
communities, as well as in identifying the most effective
pathways for the recovery of biological communities in
degraded areas.
Keywords Arboreal ants � Brazil � Epigaeic ants � Species
composition � Species richness � Toxic residuals
Introduction
One of the most prevalent negative impacts of human
activities on ecosystems is the release of toxic residuals
(e.g. heavy metals) (Ribeiro-Filho et al. 2001). These
residuals are highly toxic to plants and animals and may
have long-lasting effects on the structure of biological
communities (Hoffmann et al. 2000; Hoffmann and
Andersen 2003). They also are cumulative in plant tissues
that are ingested by animals, which may in turn be used for
human nutrition (Foster 2003).
The use of pesticides and fertilizers in agriculture
together with various aspects of the mining industry (Baird
2002; Smith et al. 1998) can lead to heavy metal release.
The release of arsenic to the environment is one of the
major risk factors facing the future integrity of ecosystems,
in addition to causing severe damage to human health,
including mutagenic and carcinogenic effects, and heart,
vascular and pulmonary diseases (Felipe et al. 2009).
C. R. Ribas � J. H. Schoereder
Departamento de Biologia Geral, Universidade Federal de
Vicosa, Vicosa, MG 36570-000, Brazil
e-mail: [email protected]
C. R. Ribas (&)
Setor de Ecologia, Departamento de Biologia, Universidade
Federal de Lavras, Lavras, MG 37200-000, Brazil
e-mail: [email protected]
R. R. C. Solar � F. A. Schmidt � C. L. Valentim
Departamento de Entomologia—Programa de Pos-Graduacao
em Entomologia, Universidade Federal de Vicosa, Vicosa, MG
36570-000, Brazil
e-mail: [email protected]
F. A. Schmidt
e-mail: [email protected]
C. L. Valentim
e-mail: [email protected]
R. B. F. Campos
Instituto Superior de Educacao de Divinopolis, Fundacao
Educacional de Divinopolis, Av. Parana, 3001, Jardim
Belvedere, Divinopolis, MG 35501-170, Brazil
e-mail: [email protected]
123
J Insect Conserv (2012) 16:413–421
DOI 10.1007/s10841-011-9427-2

Environmental monitoring protocols have been devel-
oped to verify the level of toxic residuals in affected
locations (Hilty and Merenlender 2000). The simplest way
to detect the presence of toxic residuals on the environ-
ment is to directly measure their concentration, but this
could be too expensive and the presence of toxins alone
may or may not be indicative of a negative (or positive)
effect on biological communities (Goodsell et al. 2009).
Another, complementary approach is to use bioindicators
which can reveal the impact of toxins on overall envi-
ronmental condition, allowing some insight into the likely
ecological mechanisms that may herald future environ-
mental problems (McGeoch 1998; Niemi and McDonald
2004).
The use of certain species or groups of organisms as
indicators of the effectiveness of environmental manage-
ment practices has been widespread in recent decades
(Gardner 2010; Hilty and Merenlender 2000). The bio-
logical parameters most commonly employed to evaluate
the level of environmental impacts include measurements
of abundance, diversity, evenness and species composition
(Gollan et al. 2011; Graham et al. 2009).
Ants are among the groups of organisms most com-
monly employed as bioindicators (e.g. Andersen and
Majer 2004; Andersen et al. 2004; Majer et al. 2007;
Ottonetti et al. 2006; Philpott et al. 2010). Their use has
been proposed for monitoring recovery from environ-
mental impacts, as indicators of conservation status as
they present a wide distribution, high levels of abundance,
are amenable to sampling, play ecologically significant
roles in the functioning of ecosystems, are sensitive to
environmental changes, and are relatively well known
ecology and taxonomy (Agosti et al. 2000; Underwood
and Fischer 2006).
Some authors report that some ant species can easily
accumulate heavy metals, including arsenic (Eeva et al.
2004; Rabitsch 1997; Sorvari et al. 2006). On the other
hand, Kuehnelt et al. (1997) and Moriarty et al. (2009)
observed that other species did not accumulate arsenic or
stored very low levels of it in their bodies.
The present study is aimed at assessing the potential use
of ant communities as bioindicators of the environmental
impact caused by residuals of arsenic in the soil. We tested
the following hypotheses about the effect of bioavailable
arsenic concentration on ant communities: (1) estimates of
resource availability and habitat condition for ants are
negatively related to bioavailable arsenic concentration and
this response is reflected in changes in ant species richness;
(2) the species richness of arboreal and epigaeic ants
decreases with the increased concentration of bioavailable
arsenic in the soil; and (3) arboreal and epigaeic ant species
composition is modified relative to levels of bioavailable
arsenic concentration in the soil.
Materials and methods
Sampling site
The sampling was performed in March 2007, at a hill know
as Morro do Galo (19859005.400S and 43849033.200W), in
Nova Lima, Metropolitan area of Belo Horizonte, in Minas
Gerais state, southeastern Brazil.
The area of study belongs to the mining company An-
gloGold Ashanti South America, where a rat poison factory
operated for around 35 years. This factory was installed at
the base of the hill and it had a main chimney through
which arsenic trioxide residuals were released, resulting in
a complete clearance of the native vegetation.
In 1975, the factory ceased its activities, after that in the
area began a progressive natural vegetation regeneration
process. However, for about 20 years, the vegetation was
sparse and almost exclusively composed of grasses. Due to
this fact, in 1995 a vegetation recovery program was
implemented with soil tillage, lime and fertilizers appli-
cation and the introduction of 41,124 tree seedlings from
80 native and exotic species, with arboreal and shrubby
characteristics.
Ants
A transect of 270 m was delimited from the location where
the plant chimney was installed. Twenty-seven sampling
points 10 m apart from each another were distributed along
the transect. At each sampling point, we collected ants in
two microhabitats (epigaeic and arboreal) with the use of
pitfall traps. The transect length was limited by a ditch
made by the company to catch the flow of the rainfall
together with arsenic leached from the soil. Most ants have
relatively short foraging distances (Lach et al. 2010), and it
is likely that ants collected in two consecutive pitfall
belong to different colonies.
The traps were made of plastic pots (diameter of 8 cm;
height of 12 cm) with two recipients installed in its central
part holding bait (sardines and honey). The area of the trap
surrounding the baits contains 200 ml of a conservative
solution of glycerol (5%) and salt (0.9%), such that the ants
that access the trap are captured without making contact
with the baits. The epigaeic traps are buried with their
opening at the soil level (Bestelmeyer et al. 2000) and the
arboreal traps are fixed at about 1.3 m of height (breast
height) in tree trunks (Ribas et al. 2003).
The traps remained in the field for 48 h after which they
were taken to the Universidade Federal de Viscosa (UFV)
Laboratory of Community Ecology, where the ants were
screened and identified up to the level of genus, with the
use of identification keys provided by Bolton (1994) and
Fernandez (2003). When possible, individuals were
414 J Insect Conserv (2012) 16:413–421
123

identified up to the level of species or to morphospecies by
Rodrigo Feitosa (USP) through the comparison with
specimens in the reference collection of the Sao Paulo
University (USP) Museum of Zoology.
Environmental and arsenic variables
The following environmental variables were measured at
each sampling point: number of tree species, tree density,
plant coverage, depth of litter and bioavailable arsenic
concentration.
To determine the number of tree species and the density
of trees, we delimited a rectangle of 2 9 5 m around each
sampling point. In each one of these areas, we counted the
morphospecies and the number of individuals of trees with
circumference at breast height (CBH) of at least 15 cm.
The sampling was alternately performed on the right and
left sides of the transect to avoid any systematic bias. We
opted to analyze tree density at a very local scale because
this environmental variable is likely to have local effects.
Moreover, as we sampled ants at each 10 m interval an
increase in the sampling area for trees would introduce
interdependency amongst points.
The plant coverage at the level of the trees was mea-
sured using digital images with the use of a camera posi-
tioned at a height of 1.3 m, with a fish-eye lens facing
upwards. The percentage of plant coverage of the photos
was analyzed using the Gap Light Analyzer software sys-
tem—GLA (Frazer et al. 1999). The analysis of the plant
coverage at the soil level was performed similarly to the
procedure described for the plant coverage at tree level, but
photographs were taken with the camera installed at soil
level.
Using a digital caliper rule, we also measured the litter
depth, near to each epigaeic trap, and collected soil sam-
ples for the evaluation of the bioavailable arsenic
concentration.
The bioavailable arsenic concentration was assessed by
chemical analysis, extracting the arsenic from the soil
samples with a Mehlich 3 extractor that consists of a
mixture of acids, salts and chelants able to extract the
bioavailable arsenic (Mehlich 1984). To quantify the bio-
available arsenic, dry soil samples of 5 cm3 (three samples)
were sifted (mesh sieve—2 mm) and mixed with 50 mL of
Mehlich 3 extractor in erlenmeyer flasks. These samples
were homogenized in a shaker for 5 min at 220 rpm and
then kept at rest by 16 h. Next, 10 mL of the supernatant
were pipetted and used to measure the bioavailable arsenic
concentration in a spectrophotometry inductively coupled
plasma emission (Perkin Elmer Optima—3300 DV). To
evaluate the accuracy of the method we used blank samples
as a reference.
Statistical analyses
To assess if the enhancing of bioavailable arsenic con-
centration (explanatory variable) leads to a reduction in the
measured environmental variables we used linear regres-
sions, with a Poisson distribution for count data and
Gaussian for the others. Our approach differs from the
classical ANCOVA approaches, as we opted to use GLMs
to choose the most appropriate distribution of errors for
different response variables. When using frequency data
(e.g. count data - number of ant/trees species), the Pois-
son distribution is more suitable than Gaussian (for more
details see Logan 2010). Therefore, we use chi squared
tests with count data because the analysis of frequency data
involves comparing observed and expected frequency
ratios. Moreover the v2 distribution of probabilities is the
most fitted on Poisson data. On the other hand, when data
were Gaussian, we made the classical F test approach to
reach the probabilities (Crawley 2007).
The analyses were performed with the use of the R
statistical software (R Development Core Team 2009),
followed by the analysis of residuals to verify the distri-
bution of errors and adequacy of the model (Crawley
2002).
To verify the effect of the environmental variables on
ant species richness hierarchical partitioning (Chevan and
Sutherland 1991) was used to examine the independent
effects of the five key environmental variables (number and
density of tree species, plant cover at the level of the trees
and at the soil level and depth of litter) and arsenic on the
richness of arboreal and epigaeic ant species. Hierarchical
partitioning is a multiple-regression technique in which all
possible linear models are jointly considered to indentify
the most likely causal factors, providing a measure of the
effect of other variables (Chevan and Sutherland 1991;
Mac Nally 2000). The models included Poisson errors, and
we evaluated competing models based on changes to the
log-likelihood goodness of fit statistic. The significance of
independent effects was obtained by using a randomization
routine with 1,000 iterations (Mac Nally 2002). Hierar-
chical partitioning and associated randomization tests were
implemented using the hier.part package, freely available
in the R statistical software (R Development Core Team
2009).
To test the hypothesis that the arboreal and epigaeic ant
species richness decreases with the increased bioavailable
arsenic concentration in the soil, an analysis of covariance
was carried out, in which the bioavailable arsenic con-
centration in the soil and the microhabitat were the
explanatory variables, with ant species richness (at each
point) as the response variable. The analyses were also
performed using the R statistical software (R Development
Core Team 2009), followed by the analysis of residuals for
J Insect Conserv (2012) 16:413–421 415
123

evaluating the error distribution and adequacy of the model
(Crawley 2002).
To verify if arboreal and epigaeic ant species compo-
sition is modified relative to bioavailable arsenic concen-
tration in the soil we produced a two dimensional
ordination by NMDS (non-metric multidimensional scal-
ing), using the Raup-Crick index of similarity (Hammer
et al. 2001) calculated from matrices of presence/absence
using PAST (Hammer et al. 2001). We plotted the two axes
of NMDS scaling each point in the graph by its bioavail-
able arsenic concentration.
Results
Thirty-six ant species belonging to 16 genera were col-
lected, representing seven out of the 14 subfamilies
described by Bolton (2003) for the Neotropical region
(‘‘Appendix’’). The epigaeic microhabitat presented the
highest number of species, with a total of 32 belonging to
16 genera, while the arboreal microhabitat presented only
17 species, belonging to eight genera.
Myrmicinae was the subfamily with the highest number
of species with 16 species of ants (44%), followed by
Formicinae with ten species (28%), Pseudomyrmecinae
with four species (12%), Ponerinae and Ectatomminae with
two species (6%), Dolichoderinae was represented by only
two species (6%) and Ecitoninae by only one species (3%).
Environmental variables
When the relations between the environmental variables and
arsenic were analyzed, the number of tree species presented a
negative relation with the bioavailable arsenic concentration
(v2 = 4.71; P = 0.03; Fig. 1) while plant cover at the soil
level presented a positive relationship with the bioavailable
arsenic concentration (F = 7.24; P = 0.01; Fig. 2). The
density of trees (v2 = 4.36; P = 0.18); depth of litter
(v2 = 531.6; P = 0.10) and plant cover at the tree level
(F = 1.13; P = 0.30) did not present a significant relation-
ship with arsenic levels.
Ant species richness
In the hierarchical partitioning analyses, only the number
of tree species (NTS) presented a positive and significant
influence on the arboreal ant species richness (Fig. 3a).
None of the other environmental variables (density of
trees = DT, plant cover at the level of the trees = PCTL
and depth of litter = DL) or arsenic (A) presented a sig-
nificant relationship with epigaeic ant species richness,
although the plant cover at the soil level (PCSL) can
explain most of the variation in species richness (Fig. 3b).
The ant species richness varied between the arboreal and
epigaeic microhabitats (v2 = 22.3; P \ 0.0001), with a
significant interaction with bioavailable arsenic concen-
tration (v2 = 4.73; P = 0.03; Fig. 4). In other words, the
relationship with arsenic is distinct depending on the
microhabitat (v2 = 1.66; P = 0.20), being positive for
the epigaeic microhabitat and negative for the arboreal.
Species composition
The variation in the arboreal and epigaeic ant species
composition among the 27 sampling points seems not to be
explained by changes in arsenic levels, as the scaling of
points according to the bioavailable arsenic concentration
did not produce a consistent trend in the species compo-
sition (Fig. 5).
Bioavailable arsenic concentration (ppm)0 200 400 600 800
Num
ber
of tr
ee s
peci
es
0.0
0.5
1.0
1.5
2.0
2.5
3.0
3.5
Fig. 1 Relationship between number of tree species and bioavailable
arsenic concentrations in the soil (v2 = 4.71; P = 0.03)
Bioavailable arsenic concentration (ppm)0 200 400 600 800 1000 1200 1400 1600
Pla
nt c
over
at s
oil l
evel
0
20
40
60
80
Fig. 2 Relationship between plant cover at soil level and bioavailable
arsenic concentration in the soil (F = 7.24; P = 0.01)
416 J Insect Conserv (2012) 16:413–421
123

Discussion
Differences in arboreal and epigaeic ant species richness
were related to increases in bioavailable arsenic concen-
tration in the soil, but in opposite ways. Increases in bio-
available arsenic concentration leads to lower numbers of
arboreal ant species, whilst the number of epigaeic ant
species increased. These results may be explained by a
direct effect of arsenic on ant communities or by an indi-
rect effect of arsenic on the resources and conditions that
affect the ant species richness.
Some studies report that ants can easily accumulate
heavy metals, such as arsenic (Eeva et al. 2004; Rabitsch
1997; Sorvari et al. 2006). However, Kuehnelt et al. (1997)
and Moriarty et al. (2009) observed that ants do not
accumulate arsenic or store it at very low levels in their
bodies, with higher metal accumulation found only in the
jaws of the ants. Nummelin et al. (2006) argue that among
several groups of invertebrates, ants are the less sensitive to
detect differences in the pollution caused by heavy metals.
According to results found by Grze‘s (2009), ant species
richness increases as pollution by metals increases, sug-
gesting that it can be explained by changes in the inter-
actions among species, rather than any changes in abiotic
conditions.
In the present study it is possible to infer that arsenic
does not affect ants directly (Fig. 3). The number of tree
species was the environmental variable that appears to
make an important contribution to the species richness of
arboreal ants, while the plant cover at soil level was the
variable that contributed most (although it was not signif-
icant) for the determination of the epigaeic ant species
richness. Thus, a possible explanation is that arsenic levels
affect changes in key environmental variables, which, in
turn, affect ant species richness. The structure of the veg-
etation, such as the number of tree species, affects ant
communities (Lassau and Hochuli 2004; Vasconcelos et al.
2008, 2010), and a reduction in the availability of resources
and/or the quality of the resource is related to a decrease in
the ant species richness (Ribas et al. 2003).
The same rationale may be used to explain the increased
epigaeic ant species richness with the bioavailable arsenic
concentration. The positive relationship between the plant
cover at soil level and arsenic may be caused by the
decreased number of tree species, probably caused by the
increased spaces in the canopy, which favors the success of
(a) Arboreal ant species richness
Environmental variables
PCTL DT NTS A
% In
depe
nden
t effe
ct
0
20
40
60
80
+
Environmental variablesDL A PCSL
% In
depe
nden
t effe
ct
0
10
20
30
40
50
60 (b) Epigaiec ant species richness
Fig. 3 Distribution of percentage of independent effects of measured
environmental variables on (a) arboreal ant species richness and
(b) epigaeic ant species richness, as determined by hierarchical
partitioning. Black bars represent significant effects (P \ 0.05), as
determined by randomization tests. Positive relationships are shown
by ? symbol. Environmental variables include plant cover at the level
of trees (PCTL), depth of litter (DL), density of trees (DT), number of
tree species (NTS), bioavailable arsenic concentration (A) and plant
cover at soil level (PCSL)
Fig. 4 Relationship between ant species richness in arboreal and
epigaeic microhabitats (v2 = 22.3; P \ 0.0001), and the bioavailable
arsenic concentration in the soil (v2 = 1.66; P = 0.20). Distinct
response of arboreal and epigaeic ants to bioavailable arsenic
concentration (interaction: v2 = 4.73; P = 0.03)
J Insect Conserv (2012) 16:413–421 417
123

grasses and low shrubs resistant to arsenic. Larger plant
cover at the soil positively affects the ant species richness,
with increased structural heterogeneity of the environment,
or increased protection against water loss.
According to Hoffmann (2009), the structure of ant
communities is primarily and directly influenced by
parameters related to the vegetation and soil over distur-
bance events. Our results corroborate these insights, since
the concentration of arsenic (disturbance) does not appear
to be the main explanatory variable for the variation in the
ant species richness (Fig. 3). The causality of the relation is
only noticed by the relation between the number of tree
species (main explanatory variable of the arboreal ant
species richness) with the bioavailable arsenic concentra-
tion and with the arboreal ant species richness.
Although several studies have used ants as bioindicators
in Brazil (e.g. Coelho et al. 2009; Costa et al. 2010;
Delabie et al. 2006; Pereira et al. 2007; Santana-Reis and
Santos 2001; Schmidt and Diehl 2008; Vasconcelos 1999;
Vasconcelos et al. 2000), most authors analyzed the
response of the ant species richness and/or the species or
guild composition, and achieved contrasting results. Some
studies found significant responses of ant species richness
to different environmental impacts (Costa et al. 2010;
Delabie et al. 2006; Pereira et al. 2007; Silva and Brandao
1999), while others concluded that changes in species
composition is a more adequate parameter for bioindication
(Coelho et al. 2009; Schmidt and Diehl 2008; Vasconcelos
et al. 2000), especially in dynamic environments (Gollan
et al. 2011).
Contrary to the work cited above, in our study there was
no variation in the species composition in any of the two
microhabitats sampled, though species richness did vary.
This could mean that there is homogeneity among the
sampling units which host a generalist ant fauna and that
each species has the same chance to access every habitat
within the area. However, the variability in environmental
variables determines which species from the generalist ant
pool should occur in each sampling unit, resulting in a
variation of species richness among them.
One of the possible explanations for the relationships
with species richness is that richness is more responsive to
disturbance in more homogeneous systems, or those with
higher gradients of disturbance, while in more complex and
dynamic systems, such as those found by Coelho et al.
(2009), Schmidt and Diehl (2008) and Vasconcelos et al.
(2000), the turnover of specialist and generalist among
habitats results in comparable levels of richness yet clear
differences in species composition. Thus, species richness
could be a better parameter for bioindication of disturbance
in homogeneous areas (as in this study) than in heteroge-
neous and dynamic areas (where species composition may
be more appropriate).
Conclusions
Most studies on bioindicators focus only on the direct
response pattern of the ant community to environmental
impact, rather than seeking to identify indirect effects from
changes in environmental parameters.
Ant communities belonging to different microhabitats
may present different responses to environmental impacts
(Underwood and Fischer 2006) because they are exposed to
different situations of habitat condition and resource
availability. Therefore, it is important to analyze changes to
ant communities in different microhabitats as demonstrated
in this study, where different ant-disturbance relations were
observed between the arboreal and epigaeic microhabitats.
The present study demonstrated that ants could be used
as bioindicators of the presence of arsenic (and probably
Axis 2-0.4 -0.3 -0.2 -0.1 0.0 0.1 0.2 0.3 0.4
Axi
s 1
-0.3
-0.2
-0.1
0.0
0.1
0.2
0.3(a) Arboreal ant species composition
Axis 2-0.4 -0.3 -0.2 -0.1 0.0 0.1 0.2 0.3
Axi
s 1
-0.3
-0.2
-0.1
0.0
0.1
0.2
0.3 (b) Epigaiec ant species composition
Fig. 5 Non-metric multidimensional scaling of a arboreal ant species
composition and b epigaeic ant species composition with individual
points scaled by changes in bioavailable arsenic concentration. Larger
points represent higher levels of bioavailable arsenic concentration
418 J Insect Conserv (2012) 16:413–421
123
other heavy metals) in the soil. The ant faunas of the two
microhabitas had contrasting relationships with bioavail-
able arsenic concentrations. The fact that the two strata
exhibited contrasting responses to arsenic through their ant
fauna is easily explained. We observed that the ant com-
munities were responsive to changes in arsenic effects via
changes in the habitat condition and availability of envi-
ronmental resources. Ants may also provide good indica-
tors of biodiversity, since they indicated variations in the
ecological structure of the environment (number of tree
species, in this study), an important variable for several
other groups of organisms (e.g. Felton et al. 2010; Paillet
et al. 2010; Tilman and Pacala 1993).
We concluded that our proposal to verify the influence
of different environmental variables, besides the direct
effect of the pollutant itself, is fundamental to evaluating
the responses of biological communities to environmental
impacts caused by the application of pollutant. Moreover,
the analyses of different community strata allowed us to
observe that different microhabitats can respond differently
to the same pollutant. These results have practical impli-
cations as the use of biologically meaningful environ-
mental variables to describe habitat condition is important
for guiding future restoration work in degraded areas.
Acknowledgments This study is resulted from the research project:
CRA—270/07—‘‘Utilizacao de formigas como bioindicadoras de
impacto ambiental e de sua recuperacao em Cerrado e em Mata
Atlantica’’. We are grateful to AngloGold Ashanti South America for
allowing the collections, to Julio N.C. Louzada for his assistance with
some statistical analyses, to Toby A. Gardner for his valuable sug-
gestions in the English expression and to anonymous referees for its
critical reading. We are also grateful for Rodrigo M. Feitosa, who
checked identification of ant species. The authors received grants and
funding from FAPEMIG, CAPES and CNPq.
Appendix
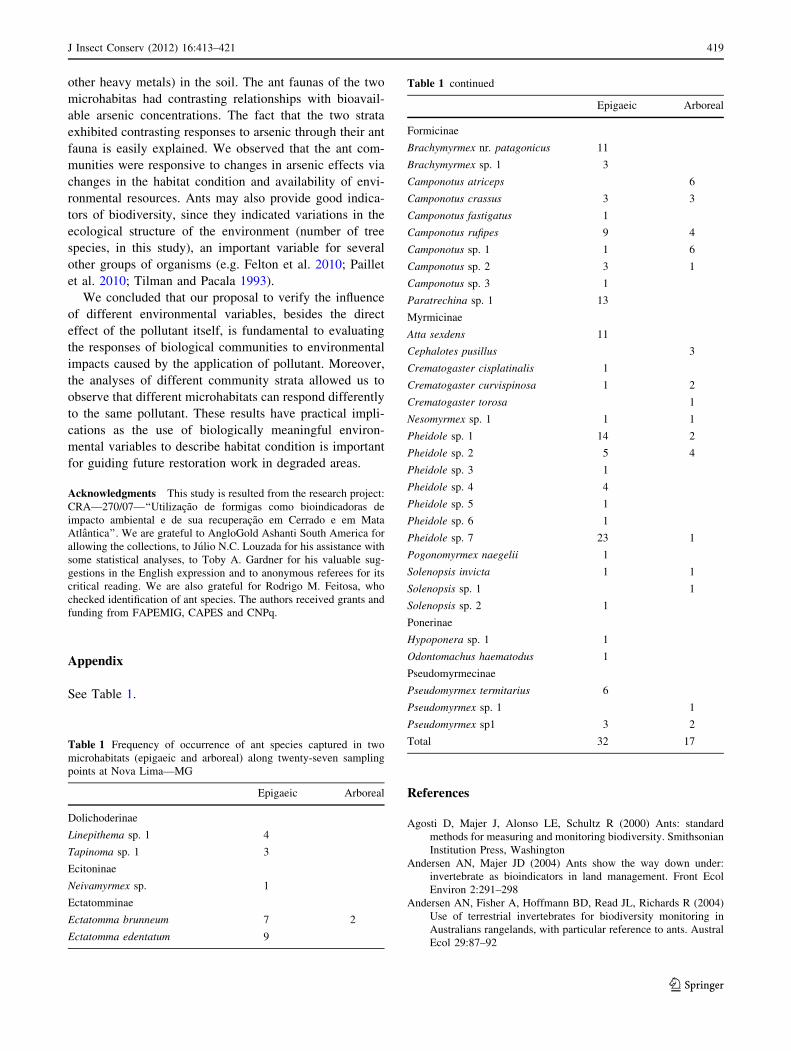
See Table 1.
References
Agosti D, Majer J, Alonso LE, Schultz R (2000) Ants: standard
methods for measuring and monitoring biodiversity. Smithsonian
Institution Press, Washington
Andersen AN, Majer JD (2004) Ants show the way down under:
invertebrate as bioindicators in land management. Front Ecol
Environ 2:291–298
Andersen AN, Fisher A, Hoffmann BD, Read JL, Richards R (2004)
Use of terrestrial invertebrates for biodiversity monitoring in
Australians rangelands, with particular reference to ants. Austral
Ecol 29:87–92
Table 1 Frequency of occurrence of ant species captured in two
microhabitats (epigaeic and arboreal) along twenty-seven sampling
points at Nova Lima—MG
Epigaeic Arboreal
Dolichoderinae
Linepithema sp. 1 4
Tapinoma sp. 1 3
Ecitoninae
Neivamyrmex sp. 1
Ectatomminae
Ectatomma brunneum 7 2
Ectatomma edentatum 9
Table 1 continued
Epigaeic Arboreal
Formicinae
Brachymyrmex nr. patagonicus 11
Brachymyrmex sp. 1 3
Camponotus atriceps 6
Camponotus crassus 3 3
Camponotus fastigatus 1
Camponotus rufipes 9 4
Camponotus sp. 1 1 6
Camponotus sp. 2 3 1
Camponotus sp. 3 1
Paratrechina sp. 1 13
Myrmicinae
Atta sexdens 11
Cephalotes pusillus 3
Crematogaster cisplatinalis 1
Crematogaster curvispinosa 1 2
Crematogaster torosa 1
Nesomyrmex sp. 1 1 1
Pheidole sp. 1 14 2
Pheidole sp. 2 5 4
Pheidole sp. 3 1
Pheidole sp. 4 4
Pheidole sp. 5 1
Pheidole sp. 6 1
Pheidole sp. 7 23 1
Pogonomyrmex naegelii 1
Solenopsis invicta 1 1
Solenopsis sp. 1 1
Solenopsis sp. 2 1
Ponerinae
Hypoponera sp. 1 1
Odontomachus haematodus 1
Pseudomyrmecinae
Pseudomyrmex termitarius 6
Pseudomyrmex sp. 1 1
Pseudomyrmex sp1 3 2
Total 32 17
J Insect Conserv (2012) 16:413–421 419
123

Baird C (2002) Quımica ambiental. Bookman, Porto Alegre
Bestelmeyer BT, Agosti D, Alonso LE, Brandao CRF, Brown WL,
Delabie JHC, Silvestre R (2000) Field techniques for the study of
ground dwelling ants—an overview, description, and evaluation.
In: Agosti D, Majer JD, Alonso LE, Schultz TR (eds) Ants—
standard methods for measuring and monitoring biodiversity.
Smithsonian Institution Press, Washington, pp 122–144
Bolton B (1994) Identification guide to the ant genera of the world.
Harvard University Press, Harvard
Bolton B (2003) Synopsis and classification of Formicidae. Memoirs
of the American Entomological Institute, Florida
Chevan A, Sutherland M (1991) Hierarchical partitioning. Am Stat
45:90–96
Coelho MS, Fernandes GW, Santos JC, Delabie JHC (2009) Ants
(Hymenoptera: Formicidae) as bioindicators of land restoration
in a Brazilian Atlantic Forest Fragment. Sociobiology 54:51–63
Costa CB, Ribeiro SP, Castro PTA (2010) Ants as bioindicators of
natural succession in Savanna and Riparian vegetation impacted
by dredging in the Jequitinhonha River Basin, Brazil. Restor
Ecol 18:148–157
Crawley MJ (2002) Statistical computing: an introduction to data
analysis using s-plus. John Wiley and Sons, Chichester
Crawley MJ (2007) The R book. John Wiley and Sons, Chichester
Delabie JHC, Paim VRLM, Nascimento IC, Campiolo S, Mariano
CSF (2006) As formigas como indicadores biologicos do
impacto humano em Manguezais da costa sudeste da Bahia.
Neotrop Entomol 35:602–615
Eeva T, Sorvari J, Koivunen V (2004) Effects of heavy metal
pollution on red wood ant (Formica s. str.) populations. Environ
Pollut 132:533–539
Felipe RTA, Oliveira JA, Leao GA (2009) Potencial de Cajanus cajane Crotalaria spectabilis para fitorremediacao: absorcao de
arsenio e respostas antioxidativas. Rev Arv 33:245–254
Felton A, Knight E, Wood J, Zammit C, Lindenmayer D (2010) A
meta-analysis of fauna and flora species richness and abundance
in plantations and pasture lands. Biol Conserv 143:545–554
Fernandez F (2003) Introduccion a las hormigas de la region
Neotropical. Instituto de Investigacion de Recursos Biologicos
Alexander von Humboldt, Colombia
Foster AL (2003) Spectroscopic investigation of arsenic species in
solid phases. In: Welch AH, Stollenwerk KG (eds) Arsenic in
ground water: geochemistry and occurrence. Kluwer, Massa-
chusetts, pp 27–65
Frazer GW, Canham CD, Lertzman KP (1999) Gap Light Analyzer
(GLA): imaging sowftware to extract canopy structure and gap
light transmission indices from truecolour fisheye photographs,
user manual and program documentation. Simon Fraser Univer-
sity, Burnaby. British Colombia and The Institute of Ecosystem
Studies, Millbrook, New York
Gardner TA (2010) Monitoring forest biodiversity: improving con-
servation through ecologically-responsible management. Earth-
scan, London
Gollan JR, Bruyn LL, Reid N, Smith D, Wilkie L (2011) Can ants be
used as ecological indicators of restoration progress in dynamic
environments? A case study in a revegetated riparian zone. Ecol
Ind 11:1517–1525
Goodsell PJ, Underwood AJ, Chapman MG (2009) Evidence
necessary for taxa to be reliable indicators of environmental
conditions or impacts. Mar Pollut Bull 58:323–331
Graham JH, Krzysik AJ, Kovacic DA et al (2009) Species richness,
equitability, and abundance of ants in disturbed landscapes. Ecol
Ind 9:866–877
Grze‘s IM (2009) Ant species richness and evenness increase along a
metal pollution gradient in the Boleslaw zinc smelter area.
Pedobiologia 53:65–73
Hammer Ø, Harper AT, Ryan PD (2001) PAST: paleontological
statistics software package for education and data analysis.
Palaentologia Electronica 4:9
Hilty J, Merenlender A (2000) Faunal indicator taxa selection for
monitoring ecosystem health. Biol Conserv 92:185–197
Hoffmann BD (2009) Using ants for rangeland monitoring: global
patterns in the responses of ant communities to grazing. Ecol
Indic 10:105–111
Hoffmann BD, Andersen AN (2003) Responses of ants to disturbance
in Australia, with particular reference to functional groups.
Austral Ecol 28:444–464
Hoffmann BD, Griffiths AD, Andersen AN (2000) Responses of ant
communities to dry sulfur deposition from mining emissions in
semi-arid tropical Australia, with implications for the use of
function groups. Austral Ecol 25:653–663
Kuehnelt D, Goessler W, Schlagenhaufen C, Irgolic KJ (1997)
Arsenic compounds in terrestrial organisms III: arsenic com-
pounds in Formica sp. from an old arsenic smelter site. Appl
Organomet Chem 11:859–867Lach L, Parr CL, Abbott KL (2010) Ant ecology. Oxford University
Press, Oxford
Lassau SA, Hochuli DF (2004) Effects of habitat complexity on ant
assemblages. Ecography 27:157–164
Logan M (2010) Biostatistical design and analysis using R: a practical
guide. Wiley-Blackwell, United Kingdom
Mac Nally R (2000) Regression and model-building in conservation
biology, biogeography and ecology: the distinction between-and
reconciliation of-‘predictive’ and ‘explanatory’ models. Biodi-
vers Conserv 9:655–671
Mac Nally R (2002) Multiple regression and inference in ecology and
conservation biology: further comments on identifying important
predictor variables. Biodivers Conserv 11:1397–1401
Majer JD, Brennan KEC, Moir ML (2007) Invertebrates and the
restoration of a forest ecosystem: 30 years of research following
bauxite mining in Western Australia. Restor Ecol 15:S104–S115
McGeoch MA (1998) The selection, testing and application of
terrestrial insects as bioindicators. Biol Rev 73:181–201
Mehlich A (1984) Mehlich 3 soil test extractant—a modification of
Mehlich 2 extractant. Commun Soil Sci Plant Anal
15:1409–1416
Moriarty MM, Koch I, Gordon RA, Reimer KJ (2009) Arsenic
speciation of terrestrial invertebrates. Environ Sci Technol
43:4818–4823
Niemi GJ, McDonald ME (2004) Application of ecological indicators.
Annu Rev Ecol Syst 35:89–111
Nummelin M, Lodenius M, Tulisalo E, Hirvonen H, Alanko T (2006)
Predatory insects as bioindicators of heavy metal pollution.
Environ Pollut 145:339–347
Ottonetti L, Tucci L, Santini G (2006) Recolonization patterns of ants
in a rehabilitated lignite mine in central Italy: potential for the
use of Mediterranean ants as indicators of restoration processes.
Restor Ecol 14:60–66
Paillet Y, Berges L, Hjalten J et al (2010) Biodiversity differences
between managed and unmanaged forests: meta-analysis of
species richness in Europe. Conserv Biol 24:101–112
Pereira MPS, Queiroz JM, Valcarcel R, Mayhe-Nunes AJ (2007)
Fauna de formigas como ferramenta para monitoramento de area
de mineracao reabilitada na Ilha da Madeira, Itaguai, RJ. Cienc
Florest 17:197–204
Philpott SM, Perfecto I, Armbrecht I, Parr CL (2010) Ant diversity
and fuction in disturbed and changing habitats. In: Lach L, Parr
CL, Abbott KL (eds) Ant ecology. Oxford, Nwew York,
pp 137–156
Rabitsch WB (1997) Tissue-specific accumulation patterns of Pb, Cd,
Cu, Zn, Fe, and Mn in workers of three ant species (Formicidae,
420 J Insect Conserv (2012) 16:413–421
123

Hymenoptera) from a metal-polluted site. Arch Environ Contam
Toxicol 32:172–177
Ribas CR, Schoereder JH, Pic M, Soares SM (2003) Tree heteroge-
neity, resource availability, and larger scale process regulating
arboreal ant species richness. Aust Ecol 28:305–314
Ribeiro-Filho MR, Siqueira JO, Curi N, Simao JBP (2001) Fracio-
namento e biodisponibilidade de metais pesados em solo
contaminado, incubado com materiais organicos e inorganicos.
Rev Bras Cienc Solo 25:495–507
Santana-Reis VPG, Santos GMM (2001) Influencia da estrutura do
habitat em comunidades de formigas (Hymenoptera–Formici-
dae) em Feira de Santana, Bahia, Brasil. Sitientibus Serie Cienc
Biol 1:66–70
Schmidt FA, Diehl E (2008) What is the effect of soil use on ant
communities? Neotrop Entomol 37:381–388
Silva RR, Brandao CRF (1999) Formigas (Hymenoptera: Formicidae)
como indicadores da calidad ambiental e da biodiversidad de
otros invertebrados terrestres. Biotemas 12:55–73
Smith E, Naidu R, Alston AM (1998) Arsenic in the soil environment:
a review. Adv Agron 64:149–165
Sorvari J, Rantala LM, Rantala MJ, Hakkarainen H, Eeva T (2006)
Heavy metal pollution disturbs immune response in wild ant
populations. Environ Pollut 145:324–328
R Development Core Team (2009) R: a language and environment for
statistical computing. R Foundation for Statistical computing,
Vienna, Austria. http://www.r-project.org
Tilman D, Pacala S (1993) The maintenance of species richness in
plant communities. In: Ricklefs RE, Schluter D (eds) Species
diversity in ecological communities. University of Chicago
Press, Chicago, pp 13–25
Underwood EC, Fischer BL (2006) The role of ants in conservation
monitoring: if, when, and how. Biol Conserv 132:166–182
Vasconcelos HL (1999) Effects of forest disturbance on the structure
of ground-foraging ant communities in central Amazonia.
Biodiversity Conserv 8:409–420
Vasconcelos HL, Vilhena JMS, Caliri GJA (2000) Responses of ants
to selective logging of a central Amazonian forest. J Appl Ecol
37:508–514
Vasconcelos HL, Leite MF, Vilhena JMS, Lima AP, Magnusson WE
(2008) Ant diversity in an Amazonian savanna: relationship with
vegetation structure, disturbance by fire, and dominant ants.
Austral Ecol 33:221–231
Vasconcelos HL, Vilhena JMS, Facure KG, Albernaz ALKM (2010)
Patterns of ant species diversity and turnover across 2000 km of
Amazonian floodplain Forest. J Biogeogr 37:432–440
J Insect Conserv (2012) 16:413–421 421
123