Embed Size (px)
Citation preview

CALIFORNIA PUBLIC CALIFORNIA PUBLIC CALIFORNIA PUBLIC CALIFORNIA PUBLIC UTILITY COMMISSION UTILITY COMMISSION CSI RDD#1 HIGH CSI RDD#1 HIGH CSI RDD#1 HIGH CSI RDD#1 HIGH PENETRATION PV PENETRATION PV INITIATIVEINITIATIVERon DavisDirector of Transmission and DistributionBEW Engineering, a DNV CompanyApril 20, 2012
1

Industry DG ConcernsIndustry DG ConcernsIndustry DG ConcernsIndustry DG ConcernsEmerging levels of distributed generation “behind-the-meter” generation is increasingLevels are exceeding “rules-of-thumb” used in standard utility
i f l ipractices for planning◦ Installed levels of DG are a continually moving targetIndustry lacks capability (tools/data) to effectively plan for PV impacts on the gridimpacts on the gridCurrently no cost-effective, commercially available capability exists to meet solar forecasting needs and industry standardization of monitoring equipment is lackingIntegrating utility departments and software communications is essential for sustainable renewable deployments (transmission, distribution, operations, forecasting, financing)Developing a collaborative of utility staff, developers, regulatory p g y , p , g yagencies to develop a cooperative framework for a sustainable and cost effective renewable expansion plan◦ Combining utility optimal locational value of development
strategies with public and private preferenceg p p p◦ Integration of energy efficiency, renewable development while
reducing greenhouse emissions2

SMUD/HECO SMUD/HECO HiPHiP--PV Initiative Analysis PV Initiative Analysis Goals & TasksGoals & Tasks
OVERALL STUDY GOALSImprove observability and visibility of
TASKS1 Feeder SelectionImprove observability and visibility of
operations and planning, to impacts of HiP-PV on the distribution feeders◦ Conclude on level of measured data
required in the future to improve visibility for operations and planning
1. Feeder Selection2. Data Collection and Review3. Definition of Analysis Points4. Base Case Definitiony p p g
Determine validity of common analysis filtersQuantify impact on select feeders to demonstrate new modeling and analysis techniques
5. Model Validation6. Detailed Analysis7. Conclude on HiP-PV Impacts feeder of interesttechniques
Inform how future studies and interconnect processes can be expeditedChanging perception of how to deal with high renewable penetrations (solutions to address problems)
Impacts feeder of interest8. Conclude on administrative screens for Feeder Studies9. Plan roadmap for future address problems)
Technology transfer/outreach and publicationApply results and support strategic studies◦ Example: GE Hawaii Solar Integration
9. Plan roadmap for future Feeder/Regional Analysis Goals based on Results10. Reportingp g
work (HSIS)
3
BEW’s CPUC CSI RDD #1 BEW’s CPUC CSI RDD #1 ObjectivesObjectives
Identify high penetration analysis needs for each circuit
Id if ddi i l d d l f hi h fid li Identify additional data parameters and placement of high-fidelity monitoring equipment
Record and collect a minimum of 6 to 12 months of load data and l dsolar data
Collect electrical equipment nameplate data for the distribution feeder: DG, inverters, energy storage, circuit data (conductor size, length, loading), switchgear, transformers, fuses, etc.
Investigate varying incremental levels of PV penetration and determine potential mitigation solutions
Develop a methodology for extending the findings using simulation tools to inform and expedite interconnection studies at higher penetrations
4

Issues Discovered with Installing Issues Discovered with Installing Data Recording EquipmentData Recording Equipment
Safety - Installations would not cause potential risk to injury
Security – Equipment cannot be stolen easily Communication needs Data transfer by cell phone Communication needs – Data transfer by cell phone, SCADA, fiber optics, etc.Equipment and budget availability – Type, cost, and utility available budgetData storage and management – Data can be one second or higher which creates large data filessecond or higher which creates large data files
5

Modeling and Field Verification for Modeling and Field Verification for Analysis of ResultsAnalysis of Results
• Identification of high penetration feeder circuits
Monitoring
• Identification of high penetration feeder circuits• Evaluation of load characteristics over a period of time capturing high and low load
conditions
Ch b d l d f l d l f d l
Modeling
• Characterize circuit based on loading profile and generalize for modeling purposes• Convert GIS database to SynerGEE format• Identify corrections and where to correct (BEW/utility)
Validation• Gather Field data and verify model and analysis output
Integration
• Feed distribution impacts into system level models• Continue monitoring and model validation as part of planning process• Develop visualization tool and decision aids for operations & planning
6

Distribution ResourceTransmission
Graphical Flow of Handshaking Between ModelsGraphical Flow of Handshaking Between Models
Individual12 kV Feeder
46 kV System 138 kV System Generation
Distribution Planning
ResourcePlanning
Transmission Planning
SynerGEEUnbalanced
PSS/E138 kV Model
PPLUSPV Data
y
Distribution
SynerGEE Balanced PowerWorld
138 kV Model
Generic PV/Inverter
Res
ourc
es
2,20
0Si
tes
Aggregated BEW PV Sites
SynerGEE Balanced System
46 kV/12 kV
Balanced 138 kV/46 kV
Model
Generic PV/Inverter User- Defined
Model
900Sites
Aggregated BEW System/PV Sites PSLF Models PSS/E
400Sites
Data Transfer Point7
Note: Line ratings shown for Oahu system for illustrationIndustry Partners: SMUD/HECO Hi-
Penetration Initiative, BEW Engineering, GL Noble Denton, GIS & EMS providers 7

PV Penetration Analysis StepsPV Penetration Analysis StepsPV Penetration Analysis StepsPV Penetration Analysis StepsExtract (GIS) or build (when GIS not available) SynerGEEmodelmodelCollect and apply detailed equipment information◦ Transformers, switches, fuses distributed loading, capacitors,
inverters, PV panels etc.Collect PV data for area of interest if availableAnalyze PV performance◦ Associated weather dataCollect full system sub-transmission/transmission model, and dynamic dataModel inverters◦ Future detailed SynerGEE model, or◦ Existing equivalent impedance model, andPSLF dynamic inverter modely
8

PV Step Analysis Cont’dPV Step Analysis Cont’dPV Step Analysis Cont dPV Step Analysis Cont dPerform base case load flow analysis with and without existing PV◦ Single point in time, minimum load day, and maximum load daySingle point in time, minimum load day, and maximum load day◦ Perform basic fault current analysis with/without existing PVRepeat load flow and fault current analysis for potential and predicted PV casesVerify feeder performance with measured data (load flows, voltage levels etc.)Repeat analysis after verification of dataC i f d t f t i t l iConversion of data for transient analysisConduct advanced post-validation studies including:◦ Protection coordination◦ Harmonic and Flicker studies◦ Harmonic and Flicker studies◦ Islanding study (voltage and frequency limits)◦ Transient study
9
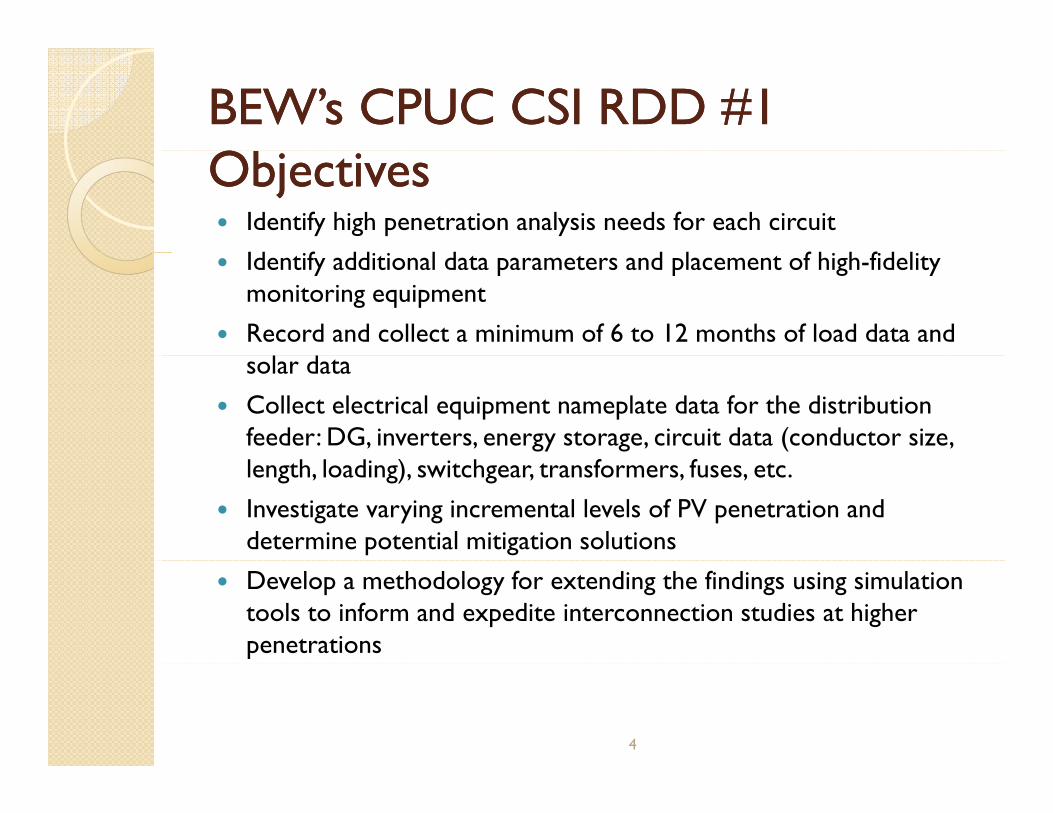
What Time Period is Important for What Time Period is Important for PV Penetration StudiesPV Penetration Studies
10

Select SMUD/HECO Feeders Select SMUD/HECO Feeders –– Broad Representation of Broad Representation of Different Loads & CharacteristicsDifferent Loads & Characteristics
Feeder Utility Voltage Load Type Existing PV Existing DG
AN (3 feeders)
SMUD 12.47 kV Residential Yes - 0.6 MW No(3 feeders)
EB(1 feeder)
SMUD 12.47 kV Rural None Dairy Digester
CT (2 feeders)
SMUD 12.47 kV Residential/Rural Yes – 3000MW No(2 feeders)
EG (3 feeders)
SMUD 69 kV Residential/ Commercial/Rural
No No
L7 (1 feeder)
SMUD 69 kV Industrial Yes - 2 MW No(1 feeder)
W1 &IN
(2 circuits)
HECO 12.47 kV Residential/ Commercial/
Industrial
Yes – 1MW No
ML HELCO 4 16 kV Commercial Yes 43kW Yes possiblyML (4 feeders)
HELCO 4.16 kV Commercial Yes – 43kW Yes – possibly out of service
WA (6 feeders);KI (2 circuits)
MECO 13.09 kV Residential/ Commercial
Yes No( )
11

Goal of Steady State Analysis StudiesGoal of Steady State Analysis StudiesGoal of Steady State Analysis StudiesGoal of Steady State Analysis Studies
DistributionIllustrative Chart Showing Approach for Circuit Concerns
Technical ImpactsImpacts
Transmission Point of No
Point of possible mitigation
Point of unreasonable
Defined by E iImpact
gstrategy
unreasonable impact
Economics
12

Findings: Categorizing Study Requirements Findings: Categorizing Study Requirements bby Type y Type and Size of Siteand Size of Site
Single L S Node ClusterLarge SiteF d V lt P fil &
NodeFeeder Voltage Profile &
Th l Li i i
ClusterFeeder Voltage Profile &
Th l Li i iFeeder Voltage Profile & Thermal Limitations
Thermal Limitations
Tap Changer Cycling Backfeed & LTC Settings
Thermal Limitations
Tap Changer Cycling Backfeed & LTC Settings
LTC Settings & Backfeed N-1 Contingency Conditions
Anti-Islanding Trip
N-1 Contingency Conditions
Anti-Islanding Trip
Flicker
Anti Islanding Trip
Flicker & Harmonics
Anti Islanding Trip
Flicker & Harmonics
13

Recommended Validation Data to Recommended Validation Data to Improve Overall Planning ModelsImprove Overall Planning Modelsp gp g
Analysis Type Time-Frame Study Level (Cluster/Nodal/Large Individual/Small individual)
Validation Data Time-Step Required
Voltage Profile Steady State All 15 minuteThermal Limits Steady State All 15 minuteTap Changer Cycling/Inverter
Steady State All, evaluate with each interconnect 15 to 30 s irradiance data y g
interactionsChange existing LDC settings
Steady State All, evaluate with each interconnect Time delay of LDC
Protection Steady State All Sub-cycley y
N-1 Generator Trip Dynamic Nodal/Cluster 1 second
N-1 Line Trip Dynamic Nodal/Cluster 1 second
All PV trip Dynamic Nodal, Cluster and large individual 1 second
Flicker Dynamic Nodal, Cluster and large individual 1 second
Harmonics Dynamic and Steady Nodal, Cluster and Large Individual Sub-cycleState
Generator Dispatch Dynamic and Steady State
Cluster 15 minute
14

Levels of Data Collection RequiredLevels of Data Collection RequiredLevels of Data Collection RequiredLevels of Data Collection RequiredKey Goal was defining levels of data collection required for validation, quantification and improved observability of distribution level issuesBased on feeder analysis the following was found
Sub Cycle Seconds Sub-
Minute15
Minutes Hourly
◦ Values will be updated as HiP-PV study continues
• Protection• Harmonics• Dynamic
• N-1 Incidents
• All PV Trip
• Tap Changer CyclingLDC
• Voltage Profiles
• Thermal L
• Generator Dispatch
St d St tD i
yStudies • Flicker • LDC
SettingsLimits
Steady StateDynamic
15

Findings: Enhancements Findings: Enhancements to to Typical Typical Interconnect ProcessInterconnect Process
Analysis Type Normal Detail Level Enhancement
STEADY STATE STUDIES
P k L d C ditiMinimum Daytime Load
I ti t i t tti d Load Flow - Back-feed
potential
Peak Load ConditionsComment on equipment setting (LTC and
LDC)
Investigate equipment settings and impact of changing
Irradiance data for capacity vs. generated power
Ti i l l i i h d
Tap Changer CyclingStep Maximum output to Minimum Output
at Peak Load, 1% limit in voltage change specified to impact LTC
Time sequential analysis with measured irradiance data over seconds and time
delay of LTCPeak and Minimum daytime load
di iconditions
Protection/Short Circuit Study - Protection
Coordination
Evaluation at POI for first screening (Rule 21/Rule 14H), if does not pass screen detailed study include evaluation of the
i f d
Impact of varied location, impact of changing size of inverter
entire feeder
Load Flow -Thermal Loading Peak Load conditionsMinimum Daytime Load
L d Fl V lt P filPeak Load Conditions
C i i (LTC d Mi i D i L dLoad Flow -Voltage Profile Comment on equipment settings (LTC and LDC)
Minimum Daytime Load
16
Findings: Enhancements Findings: Enhancements to to Typical Typical Interconnect Interconnect Process: Dynamic StudiesProcess: Dynamic Studiesyy
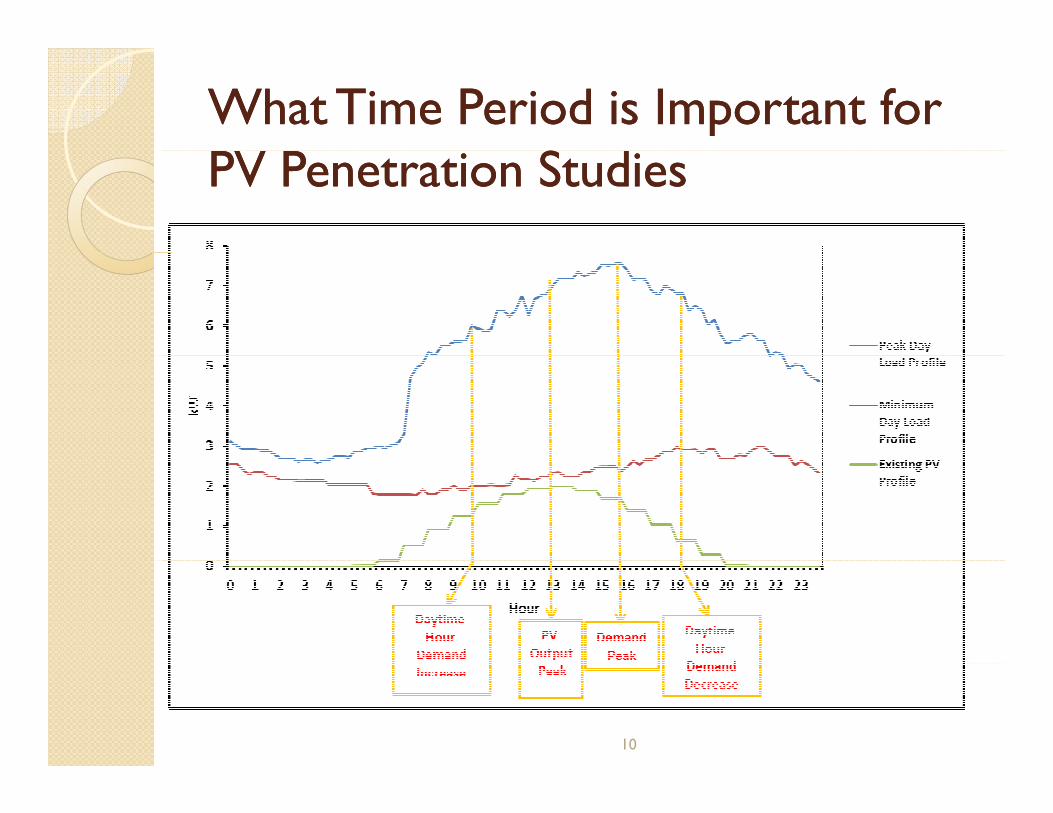
Analysis Type Normal Detail Level Enhancement
STEADY STATE STUDIESPeak Load Conditions
Minimum Daytime LoadLoad Flow - Losses With and without project
Minimum Daytime LoadWith and without a range of projects
Protection/Short Circuit Study Interrupt Rating
Evaluation at POI for screening, detailed study include evaluation of the entire
Impact of different locations, increasing PV size and spreadStudy - Interrupt Rating
feederPV size and spread
HarmonicsOnly considered if source is present or
specifically requested by UtilityRange of inverter types/conditions
Analysis Type Normal Detail Level Enhancement
DYNAMIC STUDIESDynamic/Stability Studies -
All PV tripNot normally completed
Multiple sites/nodal/cluster studies, PV is dynamic InverterAll PV trip dynamic Inverter
Dynamic/Stability Studies -N-1
Not normally completedFull dynamic analysis on range of site
sizes and configurationsDynamic/Stability Studies -
FlickerInstantaneous step change in output
compared to IEEE 519 standards1 second steps time sequential study with high fidelity irradiance data inputFlicker compared to IEEE 519 standards with high fidelity irradiance data input
17
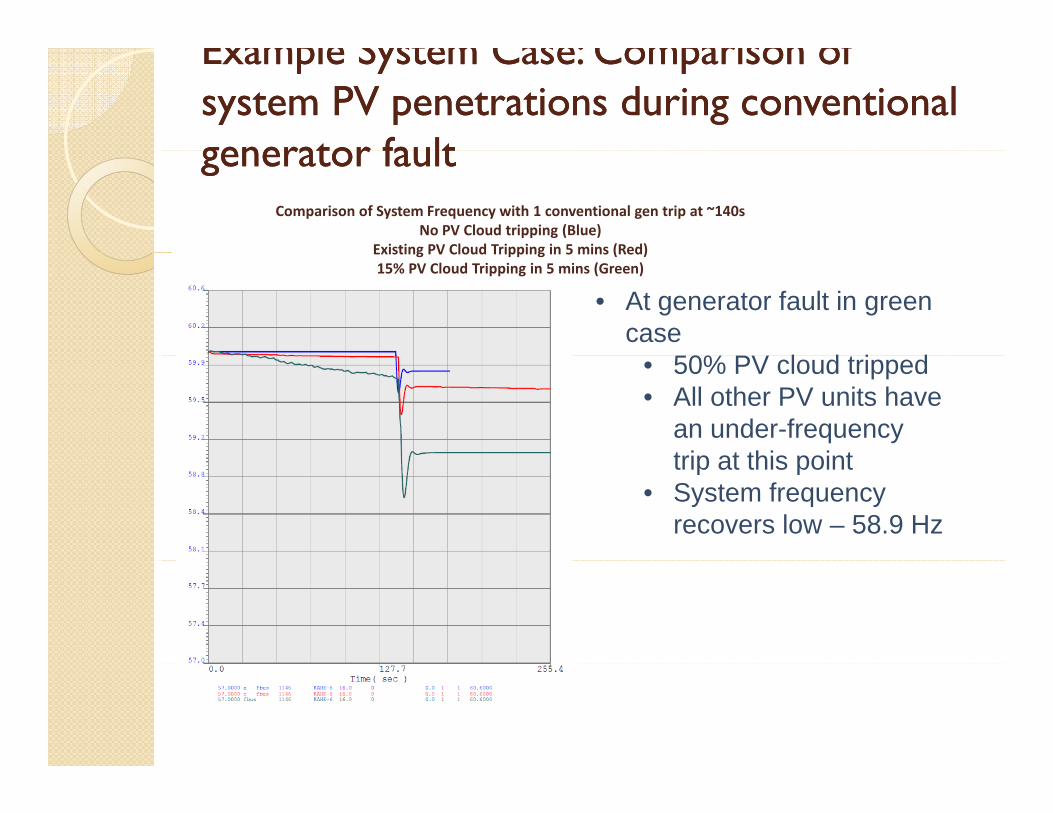
Example System Case: Comparison of Example System Case: Comparison of system PV penetrations during conventional system PV penetrations during conventional generator generator ffaultaultgenerator generator ffaultault
Comparison of System Frequency with 1 conventional gen trip at ~140sNo PV Cloud tripping (Blue)
Existing PV Cloud Tripping in 5 mins (Red)Existing PV Cloud Tripping in 5 mins (Red)15% PV Cloud Tripping in 5 mins (Green)
• At generator fault in green case
50% PV l d t i d• 50% PV cloud tripped• All other PV units have
an under-frequency trip at this pointtrip at this point
• System frequency recovers low – 58.9 Hz
18
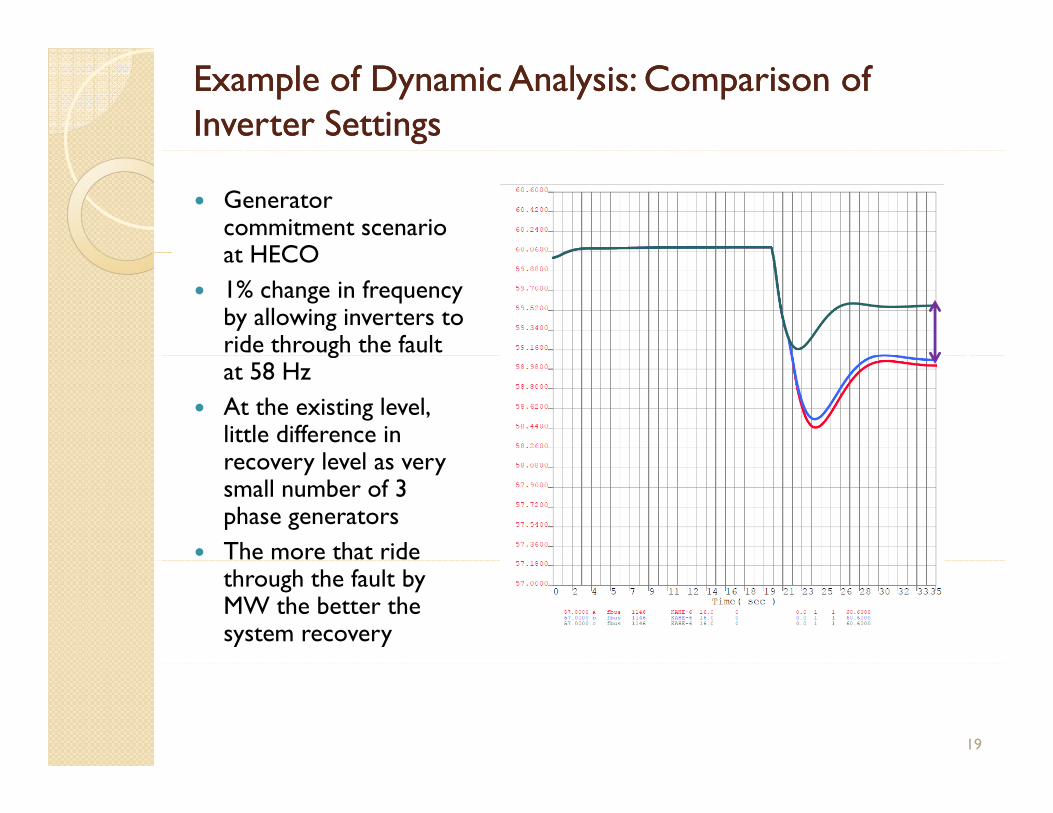
Example of Dynamic Analysis: Comparison of Example of Dynamic Analysis: Comparison of Inverter SettingsInverter Settings
Generator commitment scenario at HECOat HECO1% change in frequency by allowing inverters to ride through the fault
0.55 Hgat 58 HzAt the existing level, little difference in rec er le el as er
HZ
recovery level as very small number of 3 phase generatorsThe more that ride through the fault by MW the better the system recovery
19

Model Development: Adding Existing PV to ModelModel Development: Adding Existing PV to Model
Done in Excel & AccessInput from utility◦ Address
For each existing PV unit◦ Convert address to geographical coordinates
(X,Y)◦ Match to nearest node with same feeder & ◦ Rated kW Capacity
◦ Feeder◦ Phasing at point of interconnection
◦ Match to nearest node with same feeder & phasing
Aggregate existing PV units as necessary
20Source: HECO20

Enable Ability to Evaluate Impacts from DG to System back to DG Enable Ability to Evaluate Impacts from DG to System back to DG Level Across the IslandsLevel Across the Islands
5MWb d
100 MW
10‐50MWCentral PV
Distributed PV
10‐20MWCentral PVCentral PV
Identify DG and Central PV Scenarios for HSIS Study
Aggregate individual DG generators for
transmission modeling
Develop complete island-wide distribution
transmission modeling
System-level DG impact model view
Circuit level DG impact model view with monitoring locations
model with DG generation included
I f & p dit f d
21Model & field verification
Inform & expedite feeder level studies (nodal &
clusters)

Integrating Integrating HiPHiP--PV and HSISPV and HSISg gg gHiP-PV evaluates the distribution impacts of high penetrations of PV on feeders, substations, regions and grid wideHSIS evaluates power plant impacts from high penetrations of central plant and distributed PV on a system wideProblem is converting aggregating and Problem is converting, aggregating, and transferring data begin electric utility simulation models without losing inverter integrityDistrib ti n st dies l k at c rrent Distribution studies look at current, expected and economic potential DG PVResource planning studies and transmission studies look at current, economic and technical impacts Integrating solar, wind, load variability and energy projections across models, time periods and study criteria is vital periods and study criteria is vital
22
Individual Distribution Solar Inverter Modeling Individual Distribution Solar Inverter Modeling vsvsTransmission Aggregated ModelingTransmission Aggregated ModelingTransmission Aggregated ModelingTransmission Aggregated Modeling
Converting single phase inverters to aggregated representation◦ Distribution simulations are unbalanced single phase models◦ Transmission simulations are balanced three phase models
P i f b l d t b l i k◦ Proper conversion from unbalanced to balance is key◦ Single phase inverters lack ability to offer utility support◦ Three phase inverters could support frequency, voltage, VAR, p pp q y, g , ,
ancillary services
Tested and validated procedures to convert required◦ When aggregating to substation bus, need two inverter
representationsAll single phase inverters aggregatedAll three phase inverters aggregated
23
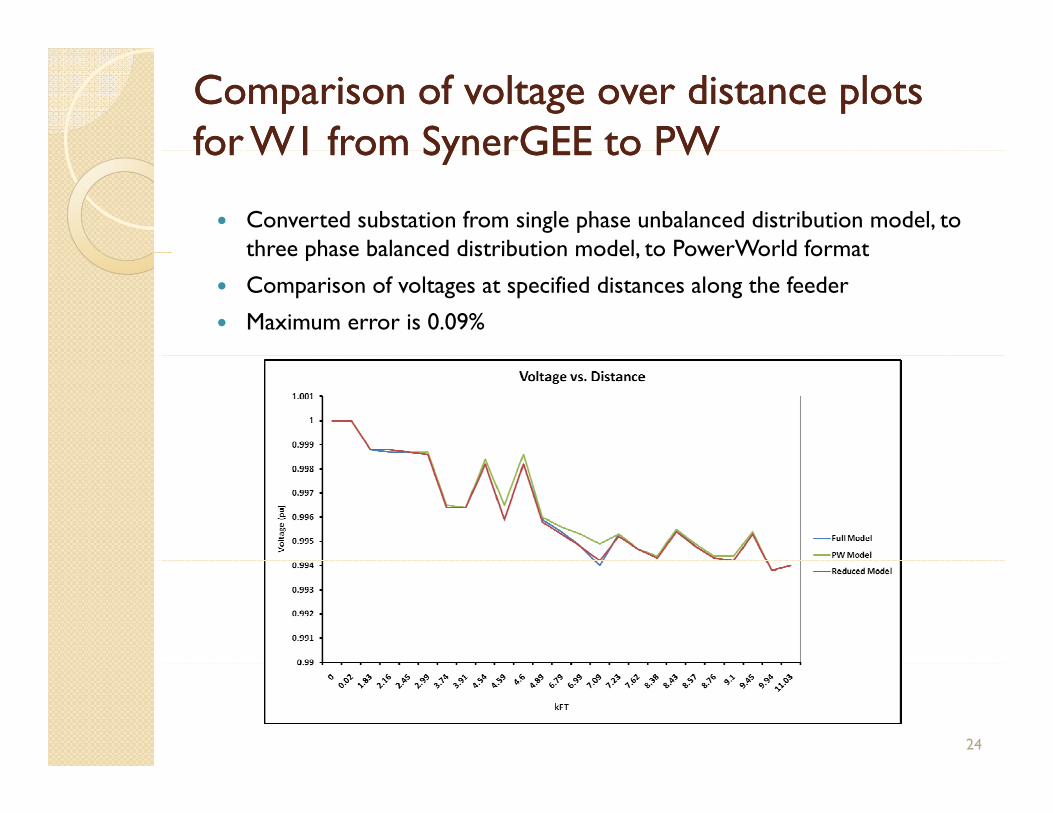
Comparison of voltage over distance plots Comparison of voltage over distance plots for W1 from for W1 from SynerGEESynerGEE to PWto PWfor W1 from for W1 from SynerGEESynerGEE to PWto PW
Converted substation from single phase unbalanced distribution model, to three phase balanced distribution model to PowerWorld formatthree phase balanced distribution model, to PowerWorld format
Comparison of voltages at specified distances along the feeder
Maximum error is 0.09%
24

SMUDSMUDSMUDSMUD
25

SMUD ASMUD A--C Feeder One Line C Feeder One Line SMUD ASMUD A C Feeder One Line C Feeder One Line
Feeder 1
Feeder 2
Solar Smart Homes
Large Customer PV models
26

SMUD ASMUD A--C1C1Rest of Anatolia 1:- 5735 kVA installed load- 36 kW installed PV
Rancho Cordova area:- 219 kVA installed load219 kVA installed load- 625 kW installed PV
27

AC Feeder 1 Load ProfilesAC Feeder 1 Load Profiles
1 21.41.61.8
AC Feeder 1 Gross and Net DemandOctober 9, 2011
0.20.40.60.8
11.2
00.2
0:00 2:24 4:48 7:12 9:36 12:00
Zero PV Existing PV 1.2MW PV 1.36MW PV
0 60.70.80.9
Inside Rancho Cordova Smart Home Gross and Net Demand, October 9, 2011
0 10.20.30.40.50.6
28
-0.10
0.1
0:00 2:24 4:48 7:12 9:36 12:00
Zero PV Existing PV 1.2MW PV 1.36MW PV
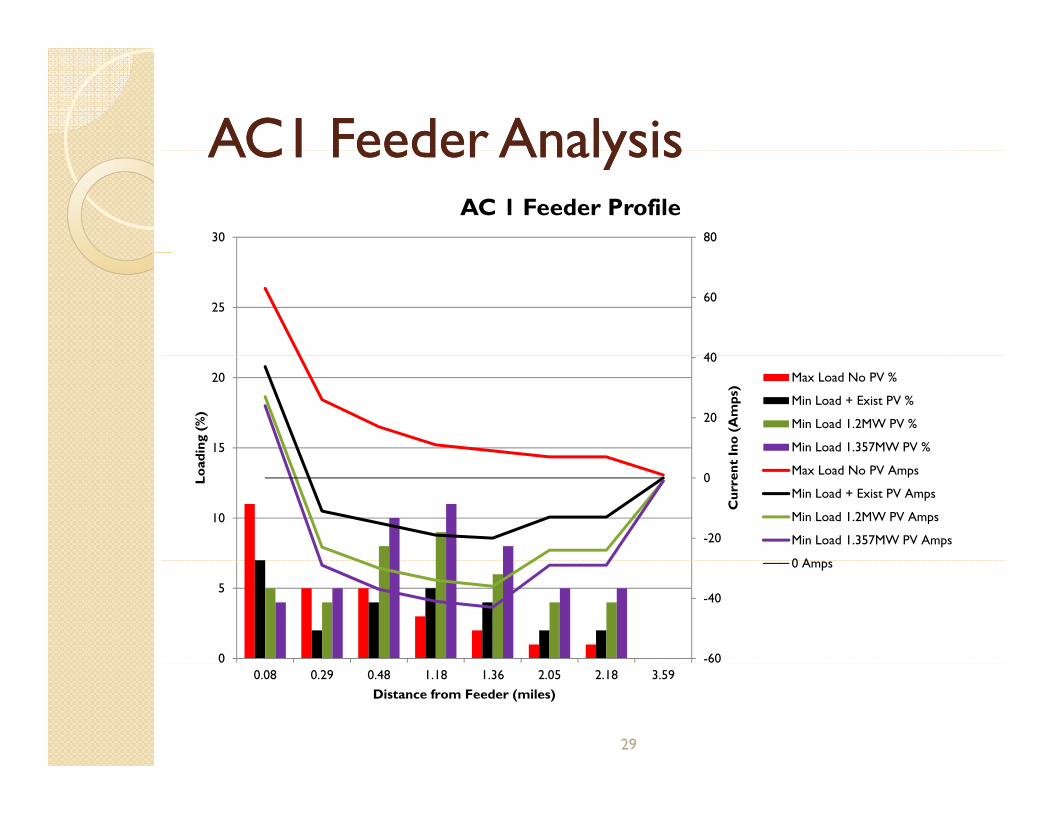
AC1 Feeder AnalysisAC1 Feeder AnalysisAC1 Feeder AnalysisAC1 Feeder Analysis8030
AC 1 Feeder Profile
40
6025
20
40
15
20
Ino
(Am
ps)
ding
(%
)
Max Load No PV %
Min Load + Exist PV %
Min Load 1.2MW PV %
Min Load 1.357MW PV %
-20
0
10
Cur
rent
Load Max Load No PV Amps
Min Load + Exist PV Amps
Min Load 1.2MW PV Amps
Min Load 1.357MW PV Amps
0 A
-60
-40
0
5
0 Amps
29
0.08 0.29 0.48 1.18 1.36 2.05 2.18 3.59Distance from Feeder (miles)

AC 1 Preliminary ResultsAC 1 Preliminary ResultsAC 1 Preliminary ResultsAC 1 Preliminary Results
1 00
1.20
1.40
AC 1 PV Penetration
0.00
0.20
0.40
0.60
0.80
1.00
0.00No PV Existing .68 MW
PV1.2 MW PV 1.36 MW PV
Net Load PV
AC 1 Min and Max Voltage at a Feeder
123 5
124.0
AC 1 Min and Max Voltage at a Feeder Segment
122.5
123.0
123.5
No PV Existing .68 MW PV
1.2 MW PV 1.36 MW PV
30
PVMinimum Voltage Maximum Voltage

SMUD EB FeederSMUD EB FeederSMUD EB FeederSMUD EB Feeder
Feeder
PV
Dairy Digesters
31

SMUD Impacts of High PV Penetrations during Minimum SMUD Impacts of High PV Penetrations during Minimum D ti P k (A il S d )D ti P k (A il S d )Daytime Peak (April Sunday noon)Daytime Peak (April Sunday noon)
Volta
geVo
ltage
Volta
ge
32

HECOHECOHECOHECO
33

HECO W1 Feeder ParametersHECO W1 Feeder ParametersHECO W1 Feeder ParametersHECO W1 Feeder ParametersCurrent PV penetration of 24.1% of feeder peak d ddemandSolar irradiance monitors, load monitors located at substation and customer site (end of feeder), and LM-1 substation and customer site (end of feeder), and LM 1 monitorSolar monitors collect solar availability as % of panel output in one second increments and visual dataLoad monitors collect voltage, amps, power factor, LTC position and counts real and reactive power and total position and counts, real and reactive power and total power
34
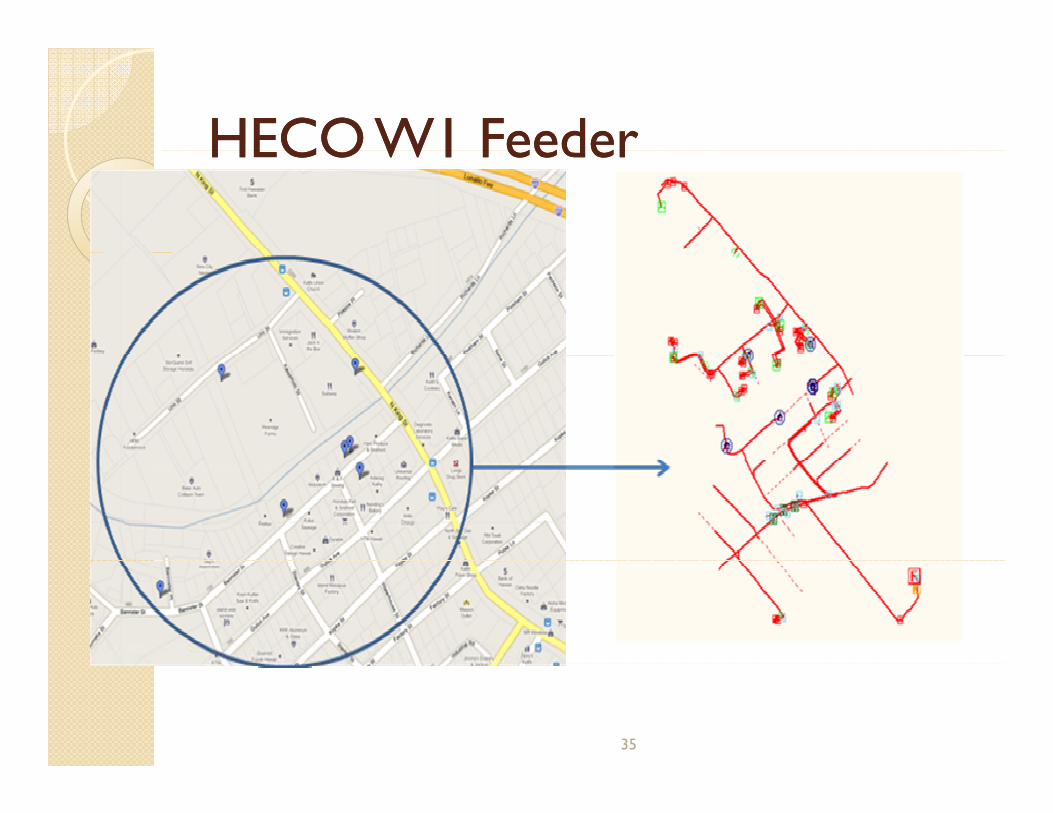
HECO W1 FeederHECO W1 FeederHECO W1 FeederHECO W1 Feeder
35
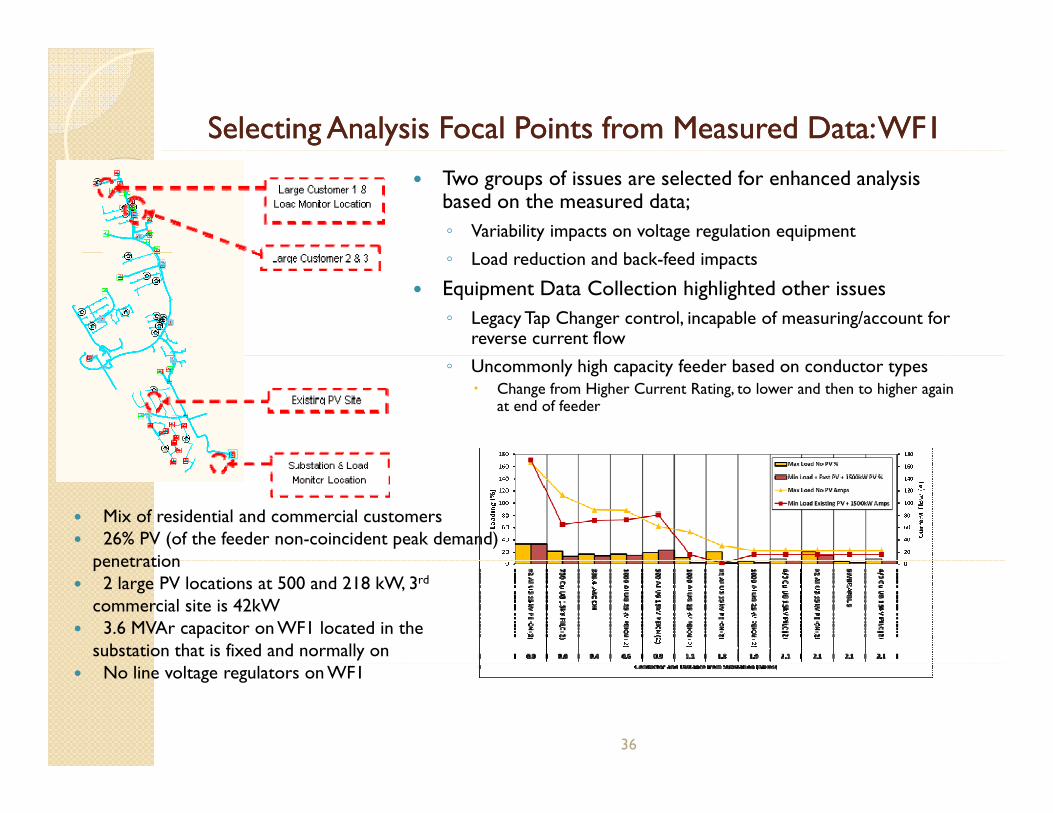
Selecting Analysis Focal Points from Measured Data: WF1Selecting Analysis Focal Points from Measured Data: WF1Two groups of issues are selected for enhanced analysis based on the measured data;◦ Variability impacts on voltage regulation equipment
L d d d b k f d ◦ Load reduction and back-feed impacts
Equipment Data Collection highlighted other issues◦ Legacy Tap Changer control, incapable of measuring/account for
reverse current flow
◦ Uncommonly high capacity feeder based on conductor typesChange from Higher Current Rating, to lower and then to higher again at end of feeder
Mix of residential and commercial customers26% PV (of the feeder non-coincident peak demand)
penetrationpenetration2 large PV locations at 500 and 218 kW, 3rd
commercial site is 42kW3.6 MVAr capacitor on WF1 located in the
substation that is fixed and normally on
36
No line voltage regulators on WF1

Average tap changer count over 6 month periodAverage tap changer count over 6 month period
Highlighted % of total days with tap changer count above 5 for months of Jan to June
Numb
Increase in count corresponds with most highly variable months- May and April
er
of
Ey pvents
Change in Irradiance [W/m2s]
37
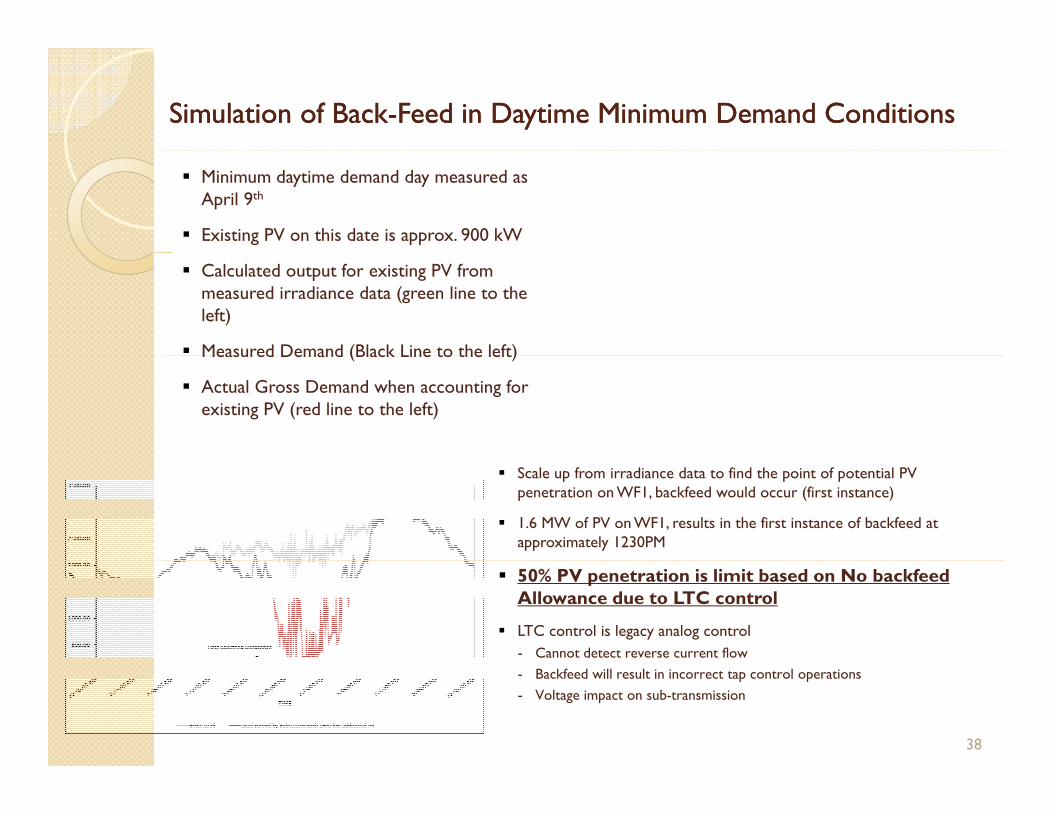
Simulation of BackSimulation of Back--Feed in Daytime Minimum Demand ConditionsFeed in Daytime Minimum Demand Conditions
Minimum daytime demand day measured as April 9th
Existing PV on this date is approx. 900 kW
Calculated output for existing PV from measured irradiance data (green line to the left)
Measured Demand (Black Line to the left)
Measured Demand (Black Line to the left)
Actual Gross Demand when accounting for existing PV (red line to the left)
Scale up from irradiance data to find the point of potential PV penetration on WF1, backfeed would occur (first instance)
1.6 MW of PV on WF1, results in the first instance of backfeed at approximately 1230PM
50% PV penetration is limit based on No backfeedAllowance due to LTC control
LTC control is legacy analog control - Cannot detect reverse current flow- Backfeed will result in incorrect tap control operations- Voltage impact on sub-transmission
38

HELCOHELCOHELCOHELCO
39

Comparison of 2008 and 2011 Weekend Comparison of 2008 and 2011 Weekend (light load) (light load)
Source: HELCO
2008 difference
2011 difference
• Weekday• Weekday comparison: evening peak has not significantly changedsignificantly changed between 2008 and 2011 but daytime demand has.
• Weekend comparison (light load day): difference between
40
daytime peak and evening peak has increased. 40

Model Building Model Building –– From Scanned Distribution Maps From Scanned Distribution Maps t El t i l M d lt El t i l M d lto Electrical Modelto Electrical Model
Start Point: Scanned Distribution Maps
Map Pole Locations into SynerGEE map
Lengths and connectivity translated to electrical power flow modelp
41

SynerGEESynerGEE Geo View of the Big Island with the Modelled Geo View of the Big Island with the Modelled Area around KArea around K--KK
42

SynerGEESynerGEE Map and Geo Map and Geo View View of the of the Modelled AreaModelled Area
43
Initial Findings & Lessons LearnedInitial Findings & Lessons Learned
Availability of measured data is key to fully understanding impacts and sustainable developmentsustainable development
Accuracy of models (Distribution SynerGEE Electric) is greatly improved through HiP-PV studies
◦ Determine system wide corrections, and lessons learned applied to all Determine system wide corrections, and lessons learned applied to all Hawaiian utilities efforts
◦ Mapping processes to update PV penetration installations regularly
Software integration is essential for maintaining growing PV portfolioSoftware integration is essential for maintaining growing PV portfolio
Utilities must prepare for high penetrations of variable resources and get ahead of the curve
◦ Nodal and cluster study analysis quantify aggregated impact from Nodal and cluster study analysis quantify aggregated impact from distribution to sub-transmission feeding to transmission level analysis
Legacy and aging distribution equipment, such as load tap changers, are particularly impacted by variability of high PV penetrations
Accurate and regularly updated models allow planning for upgrades and operational changes ahead of time, with informed and validated analysis
44
Next StepsNext Steps
Continue development of distribution scenario studiesConduct additional site validations – nodal and cluster levelsDevelop visualization tools Develop visualization tools Transfer models and conduct training on modeling methodology
45