Embed Size (px)
Citation preview

Calibrating Dates Philip Barratt
INSTAR workshop 3rd October 2009

Two faces of radiocarbon dating
Radiocarbon (14C) dating presents us with two personalities;
The 14C date e.g. 5100 ± 65 14C BP
The calibrated range e.g. 4040 - 3713 BC
The 14C date
A 14C date is derived from the measurement of radiocarbon in a sample submitted to a laboratory, from which a date is calculated.
Although measurement of a date does involve uncertainty, it is has a mathematically pleasant form
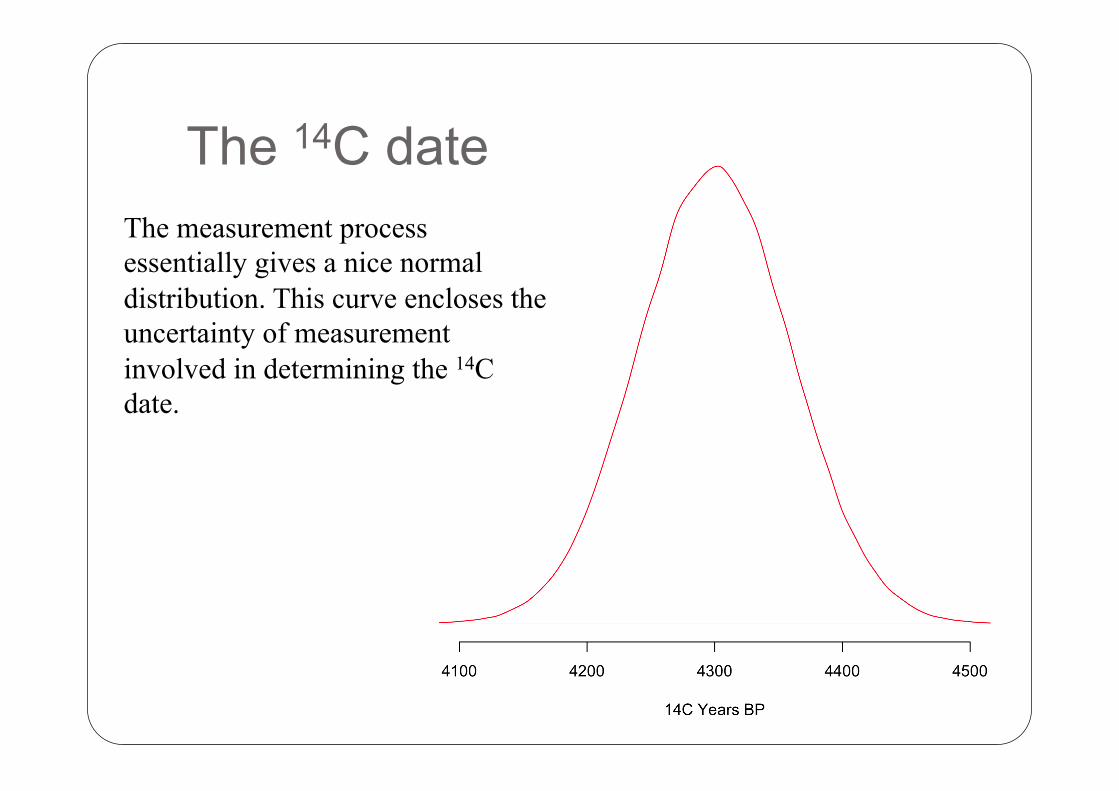
The 14C date The measurement process essentially gives a nice normal distribution. This curve encloses the uncertainty of measurement involved in determining the 14C date.
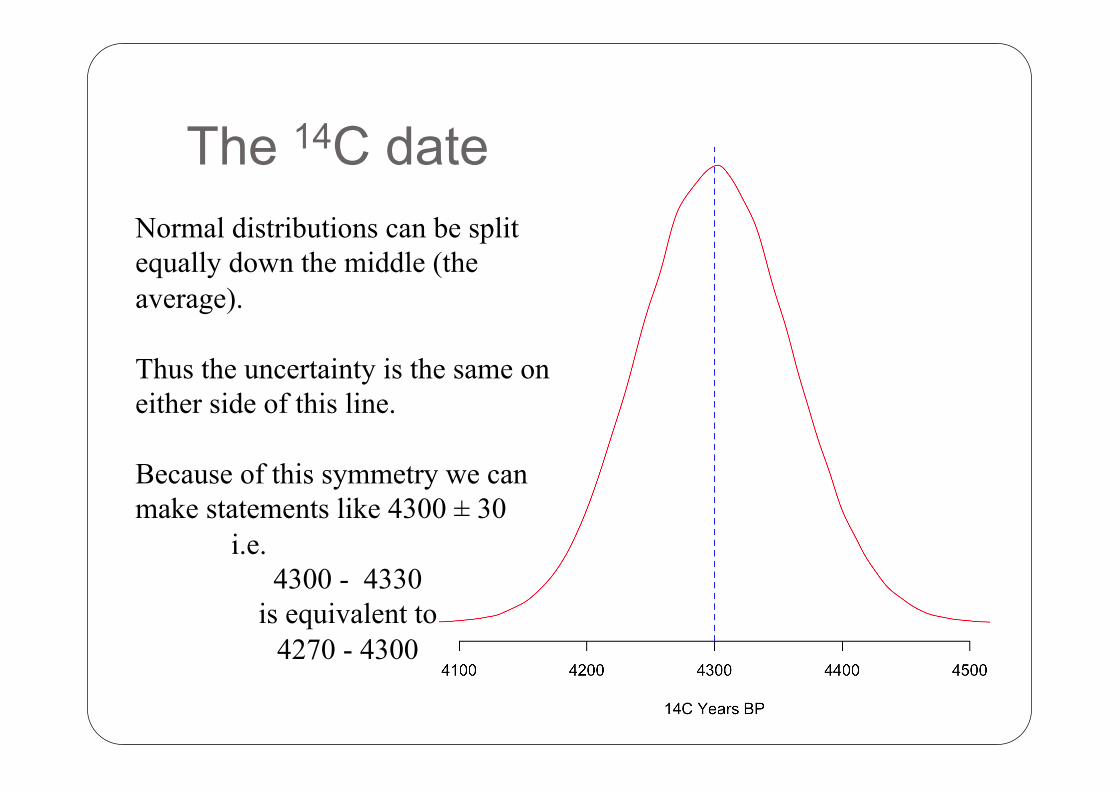
The 14C date Normal distributions can be split equally down the middle (the average).
Thus the uncertainty is the same on either side of this line.
Because of this symmetry we can make statements like 4300 ± 30
i.e. 4300 - 4330
is equivalent to 4270 - 4300

The 14C date A measure of the uncertainty in normal distributions is the standard deviation, where 1 standard deviation means there is 68% chance of the correct value being in the blue area of the curve, and at 2 standard deviations there is a 95.4% chance of it being in the red and blue areas.
Notice that as our chance of having the correct value increases, 68% to 95%, the precision of the date decreases.
68% 95.4%
Calibrating
Calibration is necessary because of past variations in the amount of 14C. A radiocarbon date is not a calendar date.
To convert to calendar dates we need something to calibrate the 14C dates against – a calibration curve.
A calibration curve is created by radiocarbon dating something of known calendar age such as tree rings.

Calibrating Unfortunately, the calibration curve is not as mathematically well behaved as the laboratory measurements. This is due to those variations in 14C production, and other environmental processes affecting its availability through time.

Calibrating We have to ‘compare’ our measured 14C results, at the required precision e.g. 68% or 95%, to the calibration curve. The result of this is a calibrated age range.

Calibrated The results of calibrations are ‘messy’ compared to the 14C date.
We often have an irregular shape under which the true date probably lies.
Since this is not a nice normal distribution we shouldn’t report the date as 3864 ± 162.
For calibrated dates, the range of the dates needs to be reported.

Reporting Dates
When reporting dates in publications, reports, web sites etc, there are several things that need to be included to make them useful for others
Laboratory number Lab-010203 14C measurement 4300 ± 30 13C measurement -25.6 (state whether AMS or other) Calibrated range 3011-2880 BC Probability used to calibrate 95.4% (2 sigma) Calibration curve used IntCal04 (possibly even software) Calib Reservoir correction used None
With this information others can recreate the calibrated date if new calibration curves become available, improvements in calibration techniques, or so that the date can be used in models.

Calibrate in OxCal
Main screen
Data input

Calibrate in OxCal

Calibrate in OxCal

Precision
Two types of precision
One limited by laboratory techniques and technology
One limited by the calibration process.

Precision 1 Just now we calibrated the 14C date 4300 ± 60 14C BP (span of 120 14C
years)
Our calibrated date was 3097 - 2698 BC (span of 399 years)
Suppose we have managed to get a more precise 14C date
4300 ± 30 14C BP (span of 60 14C years)
Calibrate this date and look at the range
The calibrated range is 3011 - 2880 BC
This is a shorter and more precise span of 131 years rather than 399. This is the effect of laboratory measurement precision.
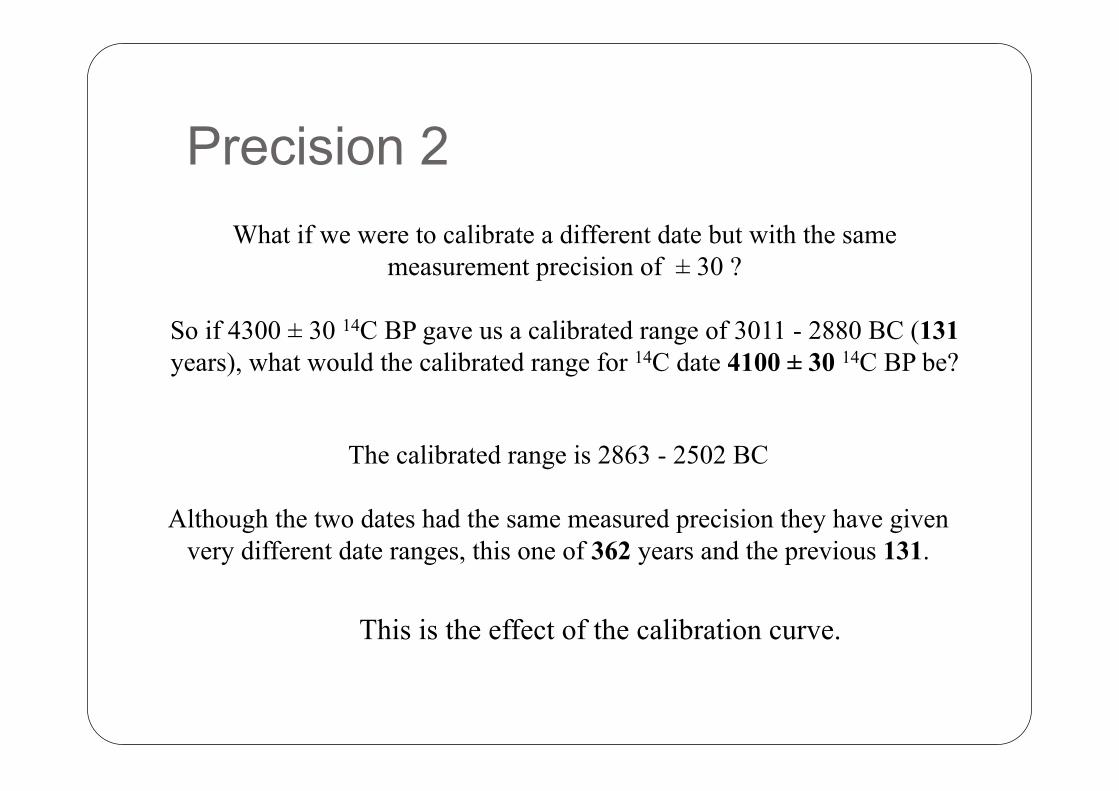
Precision 2 What if we were to calibrate a different date but with the same
measurement precision of ± 30 ?
So if 4300 ± 30 14C BP gave us a calibrated range of 3011 - 2880 BC (131 years), what would the calibrated range for 14C date 4100 ± 30 14C BP be?
The calibrated range is 2863 - 2502 BC
Although the two dates had the same measured precision they have given very different date ranges, this one of 362 years and the previous 131.
This is the effect of the calibration curve.

Calibration Plateaux 4300 ± 30 14C BP -131 years 4300 ± 10 14C BP -23 years
4100 ± 30 14C BP - 361 years 4100 ± 10 14C BP - 263 years
On the left the steepness of the calibration curve allows a greater precision to be derived from a 14C date. Where the curve become flatter – reaches a plateau, the calibrated date becomes 'smeared' and increased measurement precision is of limited help.

Precision - the next step
Today we can move beyond calibration alone as a tool to derive more precise dates.
Bayesian analysis


![シクロプロトリン...10 2011 2 3 5 3 14C [cyc-14C] 3-14C [phe-14C] mg/kg g/g 1 2 Fischer 3 [cyc-14C] 50 mg/kg 5,000 mg/kg Fischer 3 7 2 1 50 mg/kg 5,000 mg/kg 50 mg/kg / Tmax](https://img.dokumen.tips/doc/110x75/60ef4da753c03d22e86933e7/ffffff-10-2011-2-3-5-3-14c-cyc-14c-3-14c-phe-14c-mgkg.jpg)