Embed Size (px)
Citation preview
8/6/2019 14C Luciferin Kinetics
http://slidepdf.com/reader/full/14c-luciferin-kinetics 1/11
ORIGINAL ARTICLE
Uptake kinetics and biodistributionof
14C- D-luciferin — a radiolabeled substrate for the firefly
luciferase catalyzed bioluminescence reaction: impacton bioluminescence based reporter gene imaging
Frank Berger & Ramasamy Paulmurugan &
Srabani Bhaumik & Sanjiv Sam Gambhir
Received: 14 January 2008 /Accepted: 1 June 2008 / Published online: 26 July 2008# Springer-Verlag 2008
Abstract Purpose Firefly luciferase catalyzes the oxidative decar- boxylation of D-luciferin to oxyluciferin in the presence of cofactors, producing bioluminescence. This reaction is usedin optical bioluminescence-based molecular imagingapproaches to detect the expression of the firefly luciferasereporter gene. Biokinetics and distribution of the substratemost likely have a significant impact on levels of light signal and therefore need to be investigated. Methods Benzene ring 14 C(U)-labeled D-luciferin wasutilized. Cell uptake and efflux assays, murine biodistribu-tion, autoradiography and CCD-camera based optical bioluminescence imaging were carried out to examine thein vitro and in vivo characteristics of the tracer in cellculture and in living mice respectively.
Results Radiolabeled and unlabeled D-luciferin revealedcomparable levels of light emission when incubated withequivalent amounts of the firefly luciferase enzyme. Celluptake assays in pCMV-luciferase-transfected cells showedslow trapping of the tracer and relatively low uptake values(up to 22.9-fold higher in firefly luciferase gene-transfectedvs. nontransfected cells, p =0.0002). Biodistribution studiesin living mice after tail-vein injection of 14 C-D-luciferindemonstrated inhomogeneous tracer distribution with early predominant high radioactivity levels in kidneys (10.6%injected dose [ID]/g) and liver (11.9% ID/g), followed at later time points by the bladder (up to 81.3% ID/g) and smallintestine (6.5% ID/g), reflecting the elimination routes of thetracer. Kinetics and uptake levels profoundly differed whenusing alternate injection routes (intravenous versus intraper-itoneal). No clear trapping of 14 C-D-luciferin in fireflyluciferase-expressing tissues could be observed in vivo.Conclusions The data obtained with 14 C-D-luciferin pro-vide insights into the dynamics of D-luciferin cell uptake,intracellular accumulation, and efflux. Results of the biodistribution and autoradiographic studies should beuseful for optimizing and adapting optical imaging proto-cols to specific experimental settings when utilizing thefirefly luciferase and D-luciferin system.
Keywords Optical imaging . Luciferase . D-Luciferin .Reporter Genes . Biodistribution
AbbreviationsFL firefly luciferaseFluc firefly luciferase geneCMV-Luc CMV-luciferase plasmidPBS phosphate-buffered salineFBS fetal bovine serum
Eur J Nucl Med Mol Imaging (2008) 35:2275 – 2285DOI 10.1007/s00259-008-0870-6
Electronic supplementary material The online version of this article(doi: 10.1007/s00259-008-0870-6 ) contains supplementary material,which is available to authorized users.
F. Berger Department of Clinical Radiology,Ludwig-Maximilians University Munich,Marchioninistr. 15, 81377,
Munich, Germanye-mail: [email protected]
S. Bhaumik GE Global Research, Niskayuna, NY, USA
R. Paulmurugan : S. S. Gambhir ( * )Departments of Radiology and Bioengineering,Molecular Imaging Program at Stanford,James H. Clark Center, 318 Campus Dr, East Wing, first floor,Stanford, CA 94305-5427, USAe-mail: [email protected]
8/6/2019 14C Luciferin Kinetics
http://slidepdf.com/reader/full/14c-luciferin-kinetics 2/11
Ad-CMV-Luciferase
adenovirus carrying fluc under the controlof the cytomegalie virus promoter
293T Luccells
293T cells expressing the Firefly luciferasegene
%ID/g percent injected dose/gram
Introduction
Optical imaging techniques, either fluorescence- or biolu-minescence-based (e.g., green fluorescence protein [GFP]- based fluorescence microscopy, luciferase-based benchtopluminometry), have been in use for a long time for in vitroapplications in molecular and cellular biology [ 1]. Anextension of this concept toward noninvasive in vivoimaging with light photons represents an interestingapproach for collecting relevant biological informationfrom small living subjects. In molecular imaging, visuali-zation of reporter gene expression is used for noninvasivemonitoring of gene expression in living subjects in variousexperimental settings [ 2]. Optical imaging allows for a relatively low-cost alternative for studying reporter geneexpression in small animal models compared to other strategies such as positron emission tomography (PET) [ 3].
One key advantage of optical bioluminescence imagingis that it can be used to detect very low levels of signal because the light emitted from a sample in the dark chamber of a charged coupled device (CCD) camera is —
in contrast to fluorescence imaging — virtually background-free. It is quick and easy to perform and allows rapid testingof biological hypotheses in living experimental smallanimal models.
Luciferases consist of a wide range of enzymes that catalyze the oxidation of substrate luciferins to yieldnonreactive oxyluciferins and the release of photons of light that may be detected, collected, and quantifiedexternally. Some luciferins require the presence of a cofactor to undergo oxidation, such as Ca 2+ or adenosinetriphosphate (ATP). Other systems like the sea pansy Renilla luciferase which uses a different substrate (coelen-terazine) and is not ATP dependent as well as the Gaussialuciferase system have been recently validated for applica-tions in living subjects [ 4, 5].
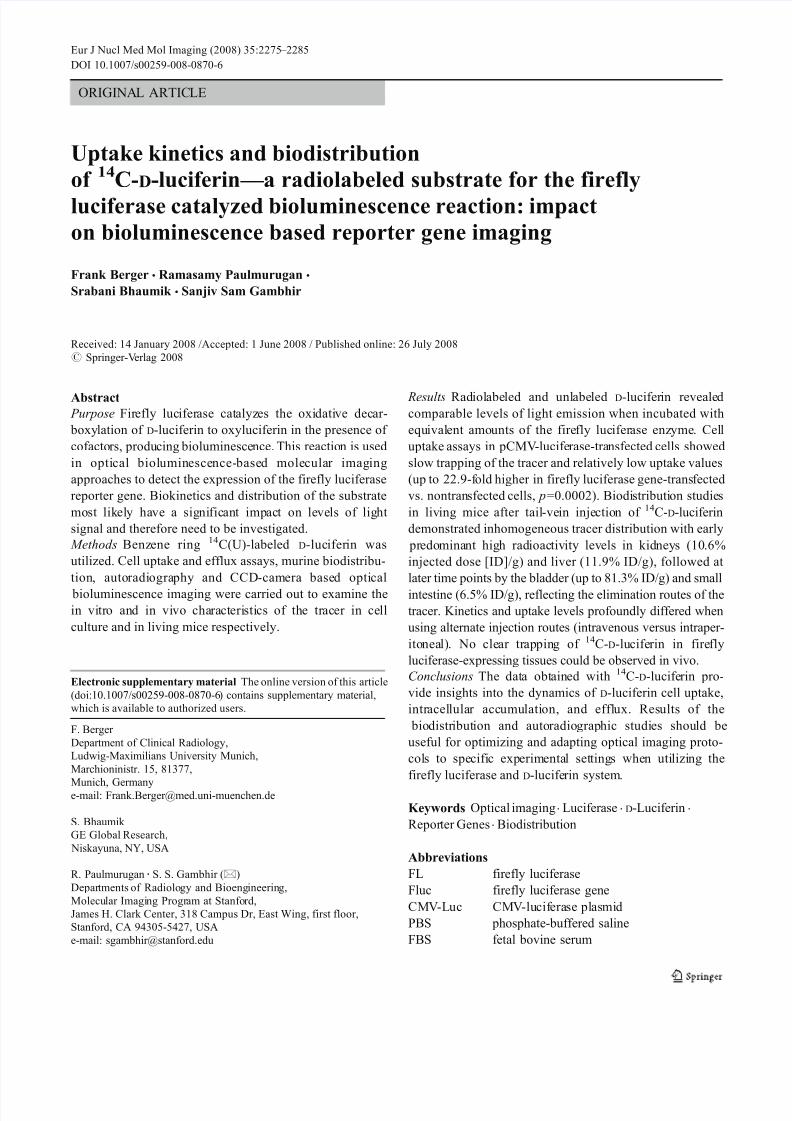
The most common luciferase – luciferin system used inmolecular imaging is that derived from the firefly Photinus pyralis [6]. The firefly luciferase gene (fluc) encodes for firefly luciferase (FL), an enzyme that oxidizes its substrateD-luciferin in the presence of ATP, magnesium, and oxygento result in light emission (bioluminescence, Fig. 1a). Thesystem has several favorable characteristics: It does not need external light excitation, the fast rate of enzymeturnover in the presence of substrate D-luciferin allows for real-time measurements, and the relationship between the
enzyme concentration and the peak height of emitted light invitro is linear up to seven to eight orders of magnitude. These properties potentially allow for sensitive, quantitative non-invasive imaging of fluc expression in living subjects [ 7].
In vitro transgene expression assays were utilizing thefact that light emission is proportional to the concentrationof FL when substrate is provided in excess. However, for invivo experiments aimed to image fluc expression in variousorgans after systemic administration of D-luciferin, a con-cern for fluc-based gene imaging is whether local substratedelivery/distribution can affect luminescence intensity.
In this work, we report cell uptake characteristics of a fully functional, 14 C-labeled D-luciferin substrate in nativeand fluc-expressing cells in cell culture. We examine biodistribution patterns of 14 C-labeled D-luciferin in miceusing different injection routes (intravenous/intraperitoneal)of the tracer. The in vitro and in vivo biodistribution data are substantiated by autoradiographic studies. Finally, biodistribution data in mice with adenoviral-mediated flucexpression are discussed in context of the cell cultureresults and efforts to work toward a multimodality optical/ radiotracer-based reporter probe system.
Materials and methods
Production of 14 C-D-luciferin
Benzene 14 C (U) luciferin was obtained from Moravek Biochemicals ( http://www.moravek.com ) with a specific
Mg 2++ Light
Firefly luciferase
14 C-D-luciferin
14C
a
b
Fig. 1 a Firefly Luciferase catalyzes the oxidative decarboxylation of Luciferin in the presence of ATP, O 2 , and Mg 2+ , producing yellow-
green light ( λmax
=560 nm). b Chemical structure of D
-luciferin,[benzene ring – 14 C (U)] – : Approximately one carbon atom of the benzene ring in this radiotracer is randomly replaced by 14 C. Thefunctionality of 14 C-D-luciferin was preserved in all our tests
2276 Eur J Nucl Med Mol Imaging (2008) 35:2275 – 2285
8/6/2019 14C Luciferin Kinetics
http://slidepdf.com/reader/full/14c-luciferin-kinetics 3/11
activity of 2.11 GBq/mmol and a radiochemical purity of 97.0%. The tracer was synthesized by this companyfollowing the pathway described in detail in [ 8]. Conden-sation of p-anisidine [ 14 C] with carbamoyl thiocarbonylthioacetic acid was the critical step in this synthesis. In theend product, D-luciferin [benzene ring – 14 C(U)] – , approxi-mately one carbon atom of the benzene ring per moleculewas randomly replaced by 14 C, but no foreign atom or charge was introduced into the molecule (Fig. 1 b).
Verification of the functionality of 14 C-D-luciferin in buffer solution
To a buffer solution with fixed amounts of ATP and MgSO 4
and rising amounts of FL concentrations (from 64 to400 ng/ μ l), a fixed amount of 14 C-labeled or unlabeled D-luciferin solution (125 ng) was added, and the biolumines-cence signal was measured using a Luminometer (Turner 20/20, Turner, Sunnyvale, CA, USA).
The bioluminescence signal of labeled and unlabeled D-luciferin, measured in relative light units per minute (RLU/ min), were then compared in samples with same amounts of FL. The buffer ingredients used in this experiment were thefollowing: 20 mM tricine, 2.5 mM MgSO 4 , 0.1 mMethylenediamine tetraacetic acid, 33.3 mM dithiothreitol,530 μ M ATP, and 270 μ M coenzyme A (CoA) – Li salt. The buffer was prepared at room temperature, CoA – lithium salt and potassium Luc were added to the solution after the pHwas adjusted to 7.8.
Verification of the functionality of 14 C-D-luciferin in cellculture
To test the functionality of 14 C-D-luciferin in cell culture,2.5×10 5 293T cells were plated in 12-well plates inmodified Eagle ’ s medium (MEM) containing 10% fetal bovine serum (FBS). pCMV-luciferase plasmid was built by cloning fluc in the pcDNA3.1(+) backbone (InvitrogenUSA, http://www.invitrogen.com ), utilizing the Nhel – Xholrestriction enzyme site. Transient transfections were per-formed 24 h later (~80% confluency) by using Superfect transfection reagent. Each transfection mix contained the pCMV-luciferase plasmid (2 μ g CMV-Luc per row). Threehours after transfection, the cell medium was added, and thecells were incubated for 24 h. The medium was carefullyremoved, and phosphate-buffered saline (PBS) containing1 μ g 14 C-D-luciferin (~7.4 kBq) or a corresponding amount of unlabeled D-luciferin was added to each well. Light emission of wells with 14 C-D-luciferin was compared tolight emission of wells with D-luciferin.
The bioluminescence was measured in a cooled CCDcamera (Xenogen IVIS; Xenogen). Photons emitted fromcells were collected and integrated for a period of 2 min.
Images were obtained by using LIVING IMAGE software(Xenogen) and IGOR image analysis software (Wave-Metrics, Lake Oswego, OR, USA). For quantification of measured light, regions of interest were drawn over thespecific wells and the maximum photons per second per square centimeter per steradian were obtained.
Cell culture and cell transfection protocols
Human embryonic kidney cancer cells 293T (AmericanType Culture Collection [ATCC], Manassas, VA, USA),used for most of the experiments, were grown in MEMsupplemented with 10% FBS and 1% penicillin/streptomy-cin solution. Cells were plated in 12-well plates.
Transient transfections were performed 24 h later byusing Superfect transfection reagent. Each transfection mixcontained pCMV-luciferase plasmid (2 μ g CMV-Luc per row, unless stated otherwise). Three hours after transfec-tion, the cell medium was added, and the cells wereincubated for 24 h before cell uptake tests were carried out.
Cell uptake and cell efflux experiments
Cell uptake experiments were done using native 293T cellsand transiently with the CMV-Luc plasmid-transfected293T cells. In one experiment, stably fluc transfected C6rat glioma cells were utilized. The C6 cells were obtainedfrom the ATCC ( http://www.atcc.org ). The stably fluc-transfected C6 rat glioma cells were created by utilizing the previously introduced pcDNA3.1(+)-fluc plasmid andselecting with the G418 (Neomycin) antibiotic marker.
Transfections were carried out as described above. Twomicrograms of CMV-Luc plasmid per row in a 12-well plate was used, unless stated otherwise.
Cell uptake experiments were done in 12-well plates24 h after CMV-Luc transfection. During the tracer uptaketime, cells were kept either in cell media containing FBS or in PBS without serum.
14 C-D-Luciferin (3.7 kBq) was added to each 12-well plate. In the experiments in which mass levels of carrier D-luciferin was added, 1,500 μ g unlabeled D-luciferin per well was used.
Cells were incubated at 37°C for different uptake times.At the end of each incubation period, radioactivity in themedium was measured. The wells were washed with coldPBS, the cells were harvested using a cell scraper, and theradioactivity in the cell pellet was determined. Triplicatesamples were performed for all uptake studies. The samewells were also used to determine total protein content.Data are expressed as the net accumulation of probe in[dpm cells/total count (dpm cells+ dpm supernatant)/ μ gtotal protein]±standard error or in (dpm cells/total count)×100±standard error.
Eur J Nucl Med Mol Imaging (2008) 35:2275 – 2285 2277
8/6/2019 14C Luciferin Kinetics
http://slidepdf.com/reader/full/14c-luciferin-kinetics 4/11
8/6/2019 14C Luciferin Kinetics
http://slidepdf.com/reader/full/14c-luciferin-kinetics 5/11
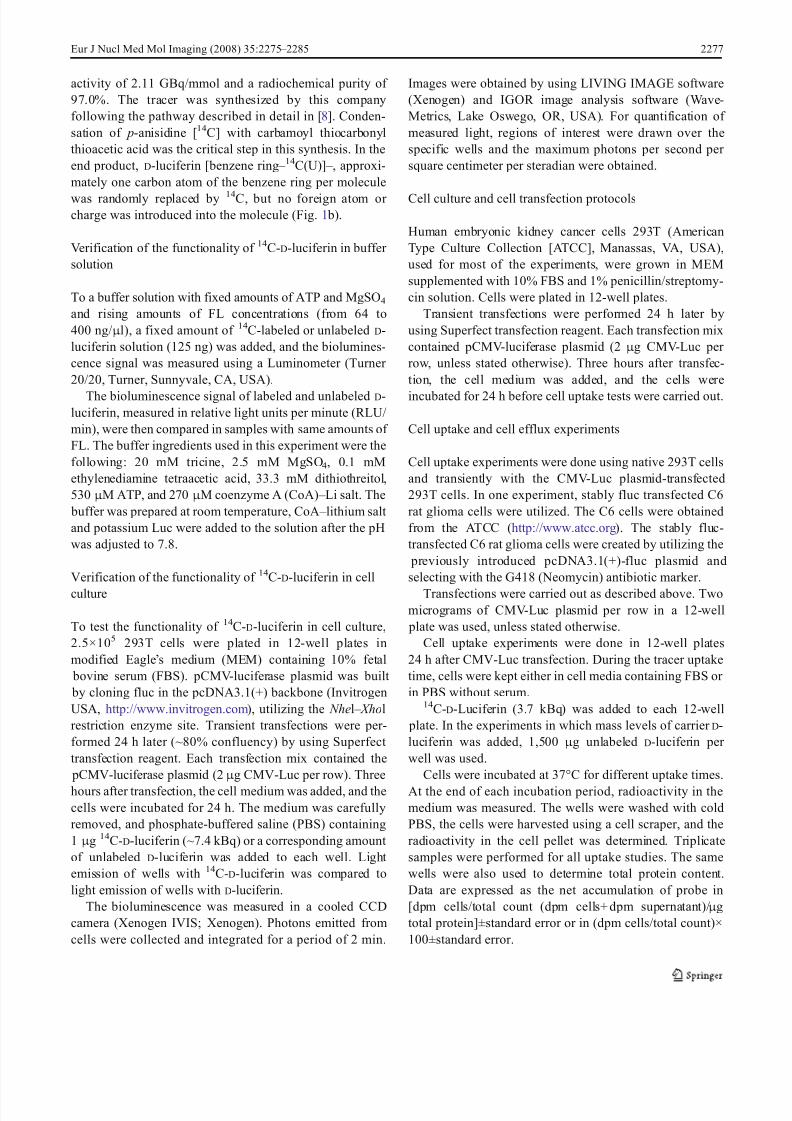
light emission of wells with unlabeled D-luciferin. Up to173 min after adding the substrate to the FL-expressing293T cells, we found slightly lower light levels ( p=0.02) inwells with labeled D-luciferin. At time point 720 min, nosignificant differences between wells exposed with unlabeledor 14 C-labeled D-luciferin are observed ( p=0.2; Fig. 2 b).
FL-expressing cells in FBS-containing media show onlyminimal enhanced 14 C- D-luciferin uptake levels compared
to cells not expressing FL The 293T control cells andtransiently transfected cells expressing FL were exposed for up to 70 min to cell media containing FBS with 14 C-D-luciferin. Only minimally enhanced ( p=0.2, not statisticalsignificant) accumulation levels of 14 C-derived radioac-tivity in transfected cells — as compared to nontransfectedcells — are observed (see Supplemental Fig. 1 on thewebsite).
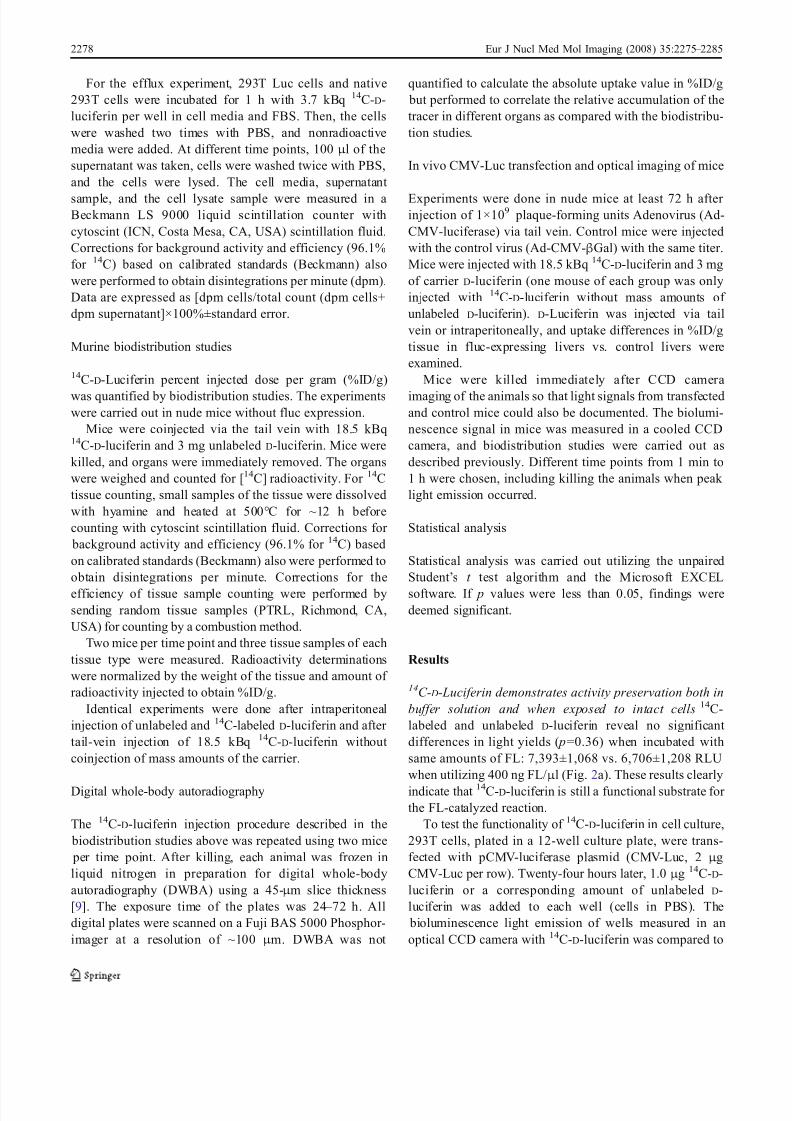
Adding mass amounts of cold D-luciferin to the cell media further enhances intracellular 14 C- D-luciferin uptake lev-els Adding mass amounts of unlabeled D -luciferin(1,500 μ g per well in a 12-well plate) additionally to traceamounts (3.7 kBq per well) of 14 C-D-luciferin enhances14 C-D-luciferin uptake in cells expressing FL when the cellsare kept in cell media containing FBS. The 14 C-D-luciferincell uptake at 15 min is 1.6-fold higher when adding massamounts of unlabeled D-luciferin ( p=0.04; Fig. 3). Addinghigher activity levels of 14 C-D-luciferin alone is not able tofurther enhance the cell uptake levels. There is also no peak uptake in the first 5 min (data not shown).
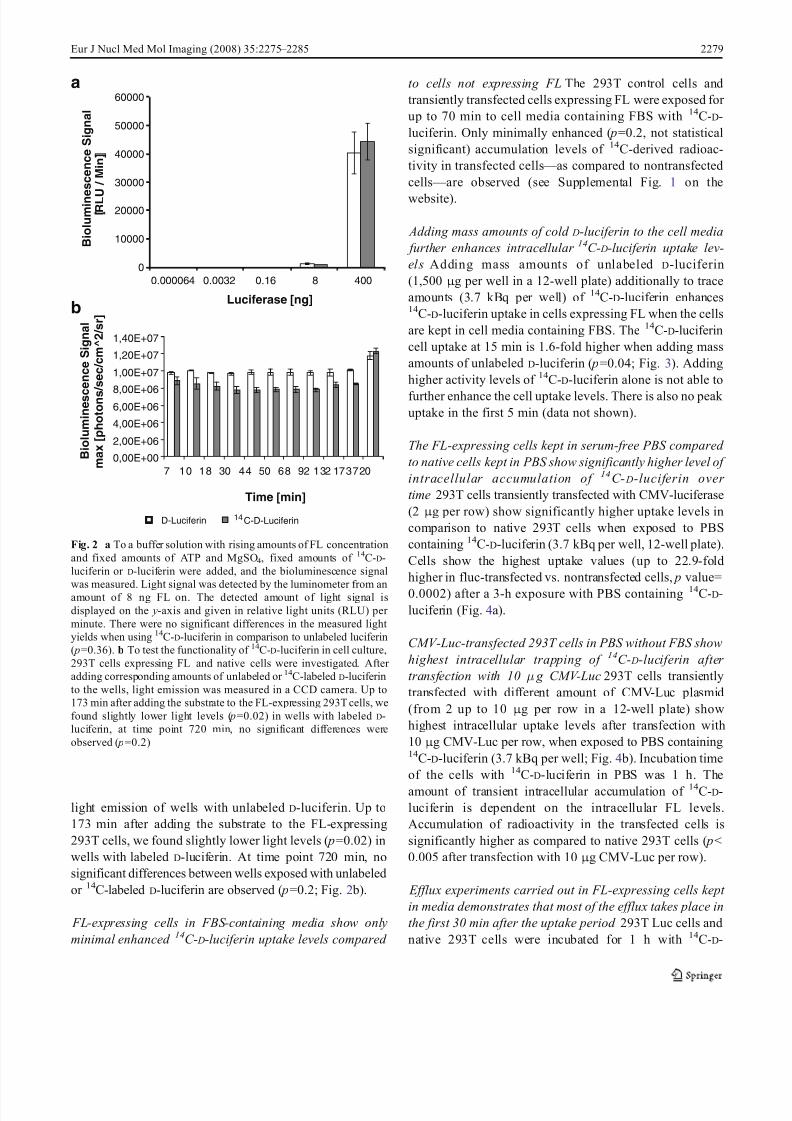
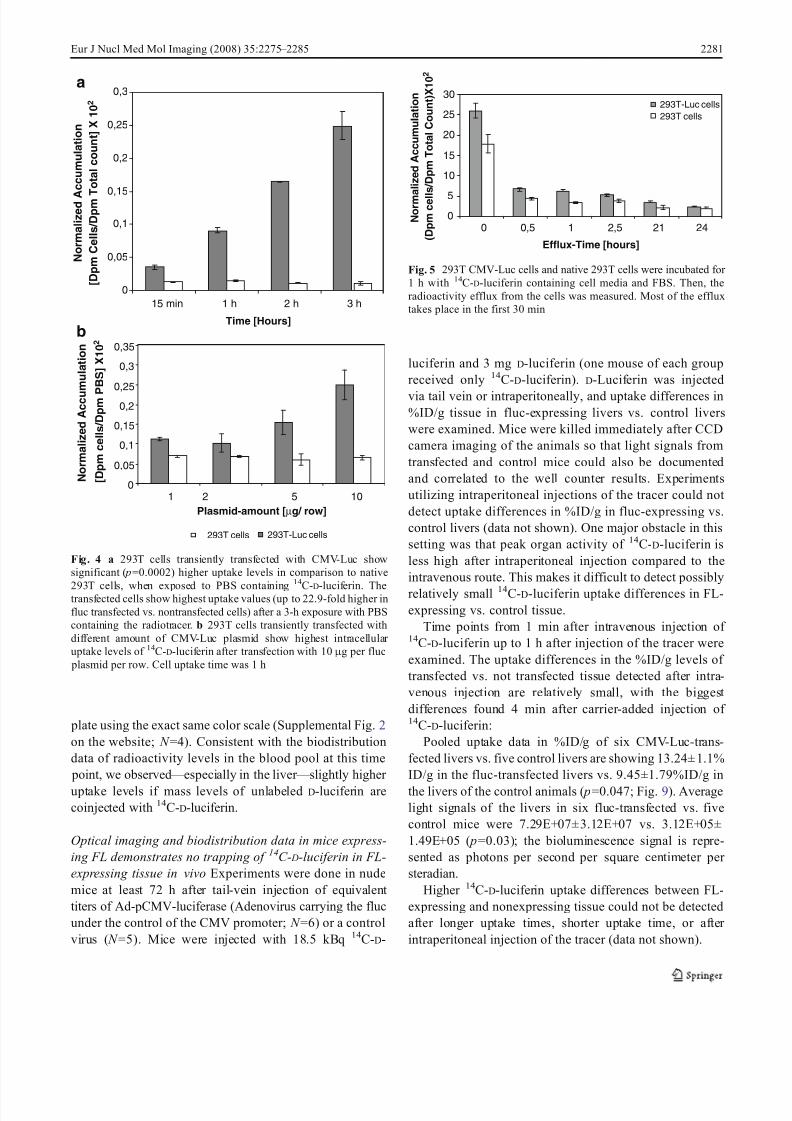
The FL-expressing cells kept in serum-free PBS compared to native cells kept in PBS show significantly higher level of intracellular accumulation of 14 C- D-luciferin over time 293T cells transiently transfected with CMV-luciferase(2 μ g per row) show significantly higher uptake levels incomparison to native 293T cells when exposed to PBScontaining 14 C-D-luciferin (3.7 kBq per well, 12-well plate).Cells show the highest uptake values (up to 22.9-foldhigher in fluc-transfected vs. nontransfected cells, p value=0.0002) after a 3-h exposure with PBS containing 14 C-D-luciferin (Fig. 4a).
CMV-Luc-transfected 293T cells in PBS without FBS showhighest intracellular trapping of 14 C- D-luciferin after transfection with 10 μ g CMV-Luc 293T cells transientlytransfected with different amount of CMV-Luc plasmid(from 2 up to 10 μ g per row in a 12-well plate) showhighest intracellular uptake levels after transfection with10 μ g CMV-Luc per row, when exposed to PBS containing14 C-D-luciferin (3.7 kBq per well; Fig. 4 b). Incubation timeof the cells with 14 C-D-luciferin in PBS was 1 h. Theamount of transient intracellular accumulation of 14 C-D-luciferin is dependent on the intracellular FL levels.Accumulation of radioactivity in the transfected cells issignificantly higher as compared to native 293T cells ( p<0.005 after transfection with 10 μ g CMV-Luc per row).
Efflux experiments carried out in FL-expressing cells kept in media demonstrates that most of the efflux takes place inthe first 30 min after the uptake period 293T Luc cells andnative 293T cells were incubated for 1 h with 14 C-D-
0,00E+00 2,00E+06 4,00E+06 6,00E+06 8,00E+06
1,00E+07 1,20E+07 1,40E+07
7 10 18 30 44 50 68 92 132 173720
Time [min]
B i o l u m
i n e s c e n c e
S i g n a l
m a x
[ p h o
t o n s
/ s e c / c m ^ 2 / s r ]
D-Luciferin 14 C-D-Luciferin
0
10000
20000
30000
40000
50000
60000
0.000064 0.0032 0.16 8 400
Luciferase [ng]
B i o l u m
i n e
s c e n c e
S i g n a l
[ R L U
/ M i n ]
a
b
Fig. 2 a To a buffer solution with rising amounts of FL concentrationand fixed amounts of ATP and MgSO 4 , fixed amounts of 14 C-D-luciferin or D-luciferin were added, and the bioluminescence signal
was measured. Light signal was detected by the luminometer from anamount of 8 ng FL on. The detected amount of light signal isdisplayed on the y-axis and given in relative light units (RLU) per minute. There were no significant differences in the measured light yields when using 14 C-D-luciferin in comparison to unlabeled luciferin( p=0.36). b To test the functionality of 14 C-D-luciferin in cell culture,293T cells expressing FL and native cells were investigated. After adding corresponding amounts of unlabeled or 14 C-labeled D-luciferinto the wells, light emission was measured in a CCD camera. Up to173 min after adding the substrate to the FL-expressing 293T cells, wefound slightly lower light levels ( p=0.02) in wells with labeled D-luciferin, at time point 720 min, no significant differences wereobserved ( p=0.2)
Eur J Nucl Med Mol Imaging (2008) 35:2275 – 2285 2279
8/6/2019 14C Luciferin Kinetics
http://slidepdf.com/reader/full/14c-luciferin-kinetics 6/11
luciferin containing cell media and FBS. Then, the cellswere washed two times and kept with fresh medium. At different time points, 100 μ l of the supernatant was takenand measured for 14 C-D-luciferin. The cell lysate was alsomeasured in the scintillation counter. As displayed in Fig. 5,most of the efflux takes place in the first 30 min after termination of the cell uptake period. However, FL-expressing cells show significantly higher radioactivitylevels as compared to native cells up to 2.5 h after start of the efflux experiment ( p<0.05).
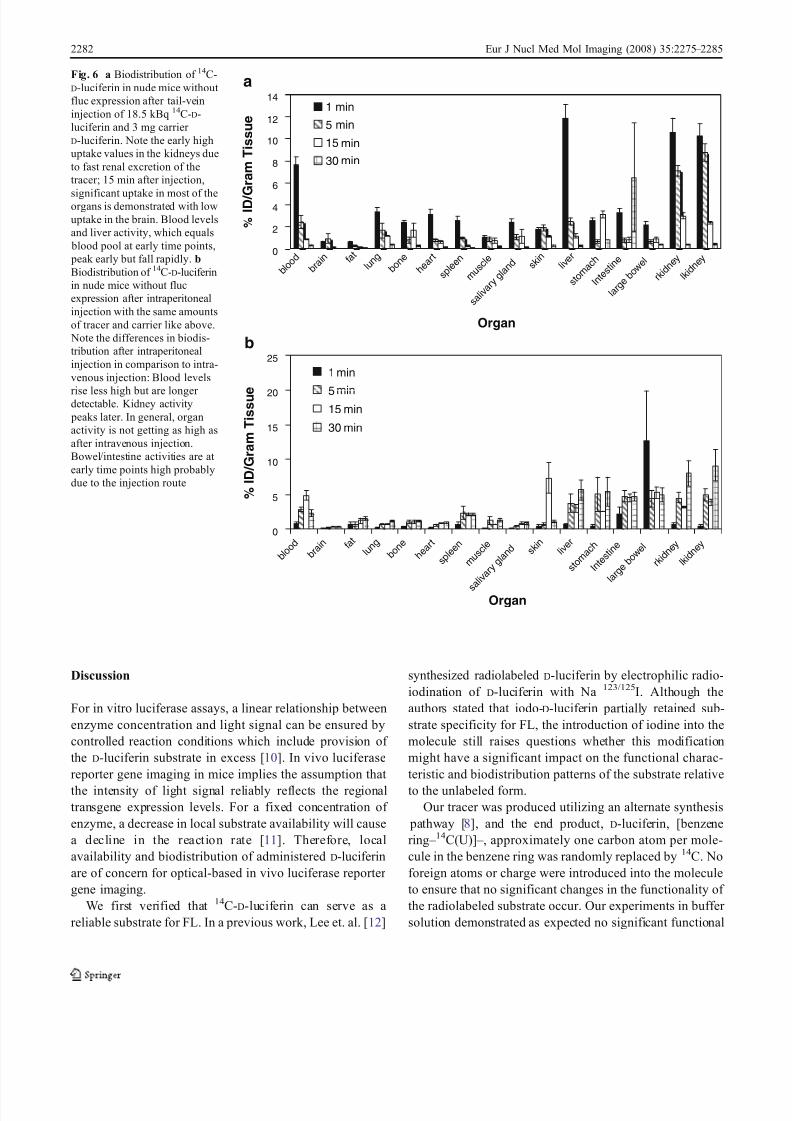
Biodistribution after tail-vein coinjection of carrier cold D-luciferin added with 14 C- D-luciferin in mice without flucexpression Experiments were carried out in nude mice ( N =8) without fluc expression. 14 C-D-Luciferin (18.5 kBq) and3 mg D-luciferin was coinjected via the tail vein. Two mice per time point and three tissue samples of each tissue typewere measured for 14 C-derived radioactivity. Biodistribu-tion of 14 C-D-luciferin after tail-vein injection shows earlyhigh uptake values in the kidneys; 15 min after injection,significant uptake was observed in most of the organs withlow uptake in the brain, and 30 min after injection, highactivity in the gastrointestinal tract was observed. Bloodlevels and liver activity (approximating blood pool at earlytime points) peak early but then fall rapidly. The data aredetailed in Fig. 6a.
Biodistribution after intraperitoneal injection of carrier cold D-luciferin added with 14 C- D-luciferin in mice differ from the results after tail-vein injection The experimentswere carried out in nude mice ( N =8) without fluc
expression. 14 C- D-Luciferin (18.5 kBq) and 3 mg D-luciferin were coinjected intraperitoneally. Two mice per time point and three tissue samples of each tissue type weremeasured for 14 C-D-luciferin-derived radioactivity. Thereare significant ( p<0.05) differences in biodistribution after intraperitoneal in comparison to intravenous injection:Blood levels rise slower and do not peak to as high levels but are detectable for a prolonged time after intraperitonealinjection. Kidney activity peaks much later. In general,organ activity does not get as high as after intravenousinjection but stays increased for a prolonged time. Brainuptake is low with both routes; highest levels are reached inthe first 5 min after injection but not significantly higher than after intraperitoneal injection of the tracer ( p=0.09).Bowel/intestine shows high activity after (local) intraperi-toneal injection. The data are listed in Fig. 6 b.
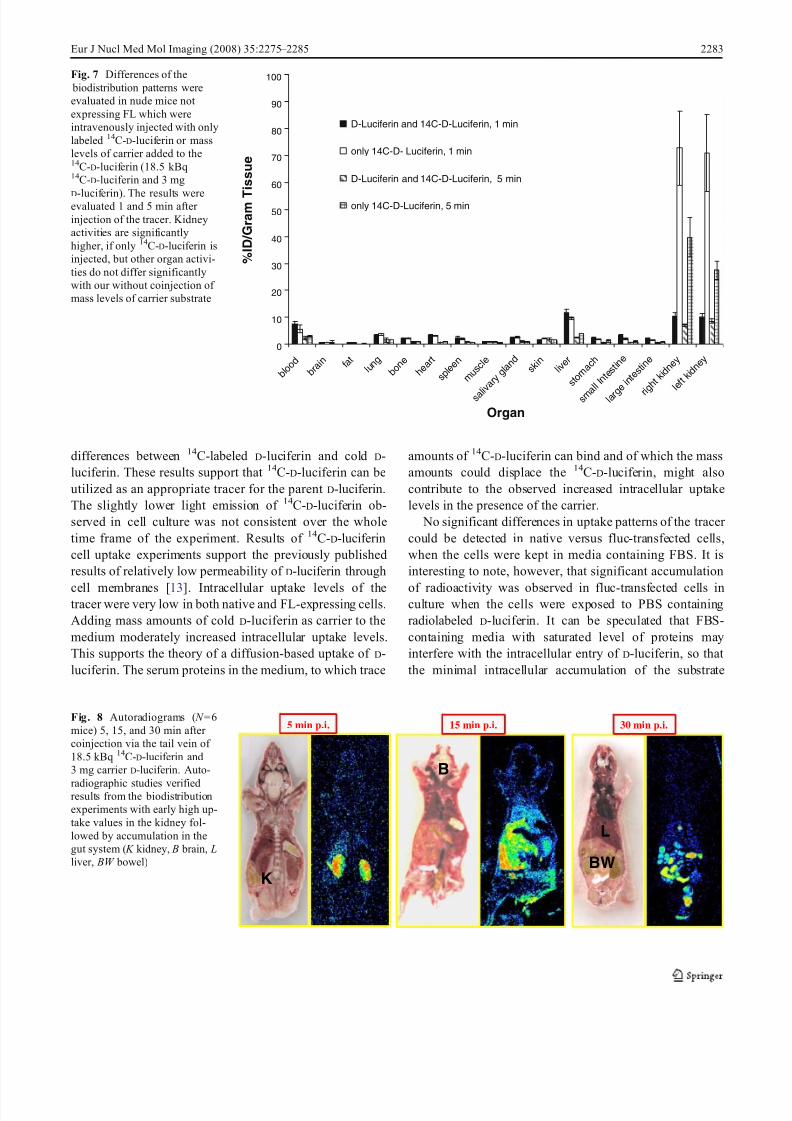
Significant differences of biodistribution patterns after intravenous injection of labeled/or injection of carrier cold D-luciferin added with 14 C- D-luciferin are detectable in thekidneys Differences of the biodistribution patterns wereevaluated in nude mice ( N =8) which were intravenouslyinjected with only labeled/or coinjected with mass levels of carrier cold D-luciferin added to the 14 C- D-luciferin(18.5 kBq 14 C-D-luciferin and 3 mg unlabeled D-luciferin).The results were evaluated 1 and 5 min after injection of thetracer. The data are plotted in Fig. 7. We detected very highradioactivity levels in the kidneys if no mass level of carrier was coinjected, pointing to a possibly higher renalexcretion of the tracer. The fact that kidney activity ismuch higher after only 14 C-D-luciferin in comparison tocarrier and 14 C-D-luciferin is highly significant ( p=0.0015after 5 min). However, no consistent significant uptakedifferences in organs other than the kidneys could bedetected 5 min after injection of only 14 C-D-luciferin or 14 C-D-luciferin and carrier D-luciferin. One minute after injection of only labeled or carrier added 14 C-D-luciferin,observed radioactivity levels in the blood pool are slightly but not significantly higher in coinjected mice ( p=0.07).
Autoradiographic studies verified the results obtained inthe biodistribution experiments To further confirm the biodistribution results obtained from the different tissues,autoradiograms of animals ( N =6) injected with the 14 C-D-luciferin in similar conditions were studied (Fig. 8).Autoradiographic studies after tail-vein injection of 14 C-D-luciferin demonstrate inhomogeneous tracer distribution inmice with early predominant high radioactivity values inthe kidneys and later predominant uptake in the gastroin-testinal tract, likely reflecting the second elimination routeof the tracer via the hepato-biliary system.
Autoradiograms 1 min after injection of only labeled or carrier-added 14 C-D-luciferin were developed on the same
0
2E-124E-12
6E-12
8E-12
1E-11
1,2E-11
1,4E-11
1
Sample
N o r m a l i z e d
A c c u m u
l a t i o n
D p m
c e l l s / D p m
T o
t a l C o u n
t / µ g
P r o
t e i n
2 3
Fig. 3 293T CMV-Luc cells were exposed for 15 min with 14 C-D-luciferin, followed by cell uptake measurements for 14 C-derivedradioactivity. The cell uptake of 14 C-D-luciferin is 1.6 fold higher ( p=0.04) in the presence of mass amounts of unlabeled D-luciferinduring the uptake period. Sample 1 : 293T-CMV-Luc cells, + 14 C-D-luciferin. Sample 2 : 293T-CMV-Luc cells, + 14 C- D-luciferin+massamounts of carrier D-luciferin. Sample 3 : No radioactivity added(background control with 293T-CMV-Luc cells)
2280 Eur J Nucl Med Mol Imaging (2008) 35:2275 – 2285
8/6/2019 14C Luciferin Kinetics
http://slidepdf.com/reader/full/14c-luciferin-kinetics 7/11
plate using the exact same color scale (Supplemental Fig. 2on the website; N =4). Consistent with the biodistributiondata of radioactivity levels in the blood pool at this time point, we observed — especially in the liver — slightly higher uptake levels if mass levels of unlabeled D-luciferin arecoinjected with 14 C-D-luciferin.
Optical imaging and biodistribution data in mice express-ing FL demonstrates no trapping of 14 C- D-luciferin in FL-expressing tissue in vivo Experiments were done in nudemice at least 72 h after tail-vein injection of equivalent titers of Ad-pCMV-luciferase (Adenovirus carrying the flucunder the control of the CMV promoter; N =6) or a controlvirus ( N =5). Mice were injected with 18.5 kBq 14 C-D-
luciferin and 3 mg D-luciferin (one mouse of each groupreceived only 14 C-D-luciferin). D-Luciferin was injectedvia tail vein or intraperitoneally, and uptake differences in%ID/g tissue in fluc-expressing livers vs. control liverswere examined. Mice were killed immediately after CCDcamera imaging of the animals so that light signals fromtransfected and control mice could also be documentedand correlated to the well counter results. Experimentsutilizing intraperitoneal injections of the tracer could not detect uptake differences in %ID/g in fluc-expressing vs.control livers (data not shown). One major obstacle in thissetting was that peak organ activity of 14 C-D-luciferin isless high after intraperitoneal injection compared to theintravenous route. This makes it difficult to detect possiblyrelatively small 14 C-D-luciferin uptake differences in FL-expressing vs. control tissue.
Time points from 1 min after intravenous injection of 14 C-D-luciferin up to 1 h after injection of the tracer wereexamined. The uptake differences in the %ID/g levels of transfected vs. not transfected tissue detected after intra-venous injection are relatively small, with the biggest differences found 4 min after carrier-added injection of 14 C-D-luciferin:
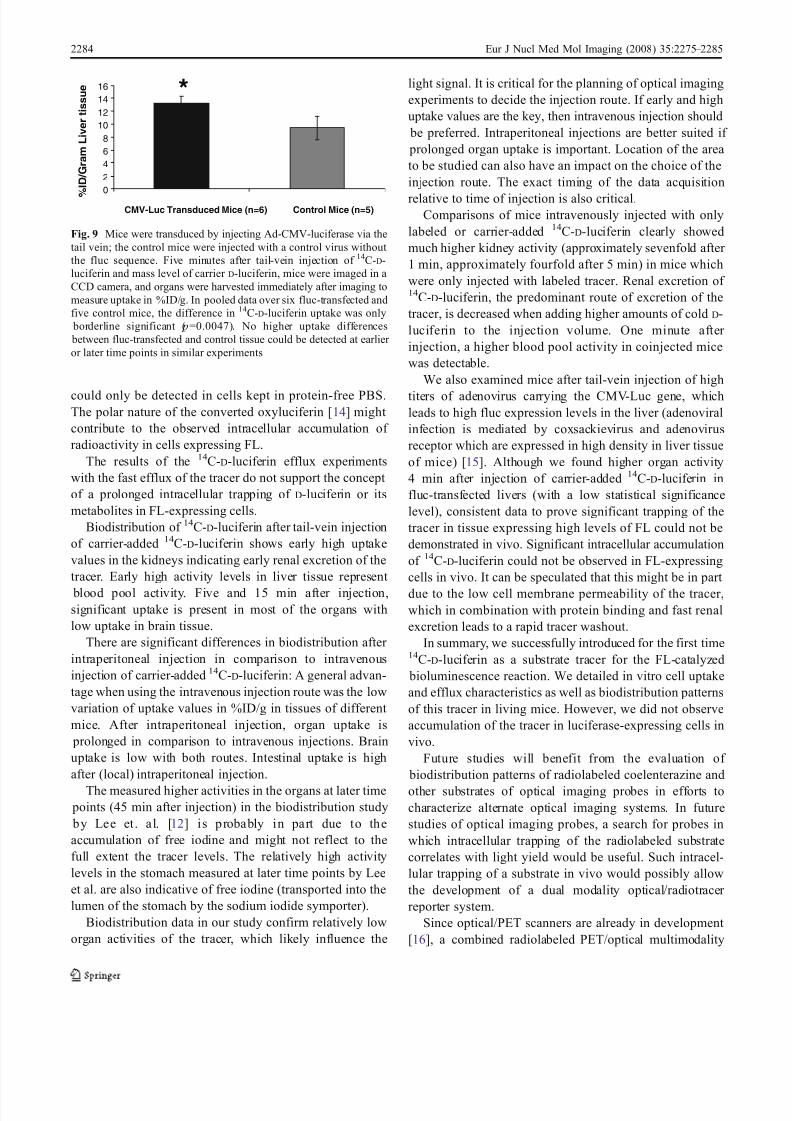
Pooled uptake data in %ID/g of six CMV-Luc-trans-fected livers vs. five control livers are showing 13.24± 1.1%ID/g in the fluc-transfected livers vs. 9.45±1.79%ID/g inthe livers of the control animals ( p=0.047; Fig. 9). Averagelight signals of the livers in six fluc-transfected vs. fivecontrol mice were 7.29E+07±3.12E+07 vs. 3.12E+05±1.49E+05 ( p=0.03); the bioluminescence signal is repre-sented as photons per second per square centimeter per steradian.
Higher 14 C-D-luciferin uptake differences between FL-expressing and nonexpressing tissue could not be detectedafter longer uptake times, shorter uptake time, or after intraperitoneal injection of the tracer (data not shown).
05
10
15
20
25
30
0 0,5 1 2,5 21 24
Efflux-Time [hours]
N o r m a l i z e d
A c c u m u
l a t i o n
( D p m
c e l l s / D p m
T o
t a l C o u n
t ) X 1 0 2
293T-Luc cells293T cells
Fig. 5 293T CMV-Luc cells and native 293T cells were incubated for 1 h with 14 C-D-luciferin containing cell media and FBS. Then, theradioactivity efflux from the cells was measured. Most of the effluxtakes place in the first 30 min
0
0,05
0,1
0,15
0,2
0,25
0,3
15 min 1 h 2 h 3 h
Time [Hours]
N o r m a l i z e d A c c u m u
l a t i o n
[ D p m
C e l l s / D p m
T o
t a l c o u n
t ] X 1 0 2
0
0,05
0,1
0,15
0,2
0,25
0,3
0,35
1 2 5 10Plasmid-amount [ µ g/ row]
293T-Luc cells293T cells
N o r m a l i z e d
A c c u m u
l a t i o n
[ D p m
c e l l s / D p m P
B S ] X 1 0 2
a
b
Fig. 4 a 293T cells transiently transfected with CMV-Luc showsignificant ( p=0.0002) higher uptake levels in comparison to native
293T cells, when exposed to PBS containing14
C-D-luciferin. Thetransfected cells show highest uptake values (up to 22.9-fold higher influc transfected vs. nontransfected cells) after a 3-h exposure with PBScontaining the radiotracer. b 293T cells transiently transfected withdifferent amount of CMV-Luc plasmid show highest intracellular uptake levels of 14 C-D-luciferin after transfection with 10 μ g per fluc plasmid per row. Cell uptake time was 1 h
Eur J Nucl Med Mol Imaging (2008) 35:2275 – 2285 2281
8/6/2019 14C Luciferin Kinetics
http://slidepdf.com/reader/full/14c-luciferin-kinetics 8/11
Discussion
For in vitro luciferase assays, a linear relationship betweenenzyme concentration and light signal can be ensured bycontrolled reaction conditions which include provision of the D-luciferin substrate in excess [ 10]. In vivo luciferasereporter gene imaging in mice implies the assumption that the intensity of light signal reliably reflects the regionaltransgene expression levels. For a fixed concentration of enzyme, a decrease in local substrate availability will causea decline in the reaction rate [ 11 ]. Therefore, localavailability and biodistribution of administered D-luciferinare of concern for optical-based in vivo luciferase reporter gene imaging.
We first verified that 14 C-D-luciferin can serve as a reliable substrate for FL. In a previous work, Lee et. al. [ 12]
synthesized radiolabeled D-luciferin by electrophilic radio-iodination of D-luciferin with Na 123/125 I. Although theauthors stated that iodo- D-luciferin partially retained sub-strate specificity for FL, the introduction of iodine into themolecule still raises questions whether this modificationmight have a significant impact on the functional charac-teristic and biodistribution patterns of the substrate relativeto the unlabeled form.
Our tracer was produced utilizing an alternate synthesis pathway [8], and the end product, D-luciferin, [benzenering – 14 C(U)] – , approximately one carbon atom per mole-cule in the benzene ring was randomly replaced by 14 C. Noforeign atoms or charge were introduced into the moleculeto ensure that no significant changes in the functionality of the radiolabeled substrate occur. Our experiments in buffer solution demonstrated as expected no significant functional
0
2
4
6
8
10
12
14
Organ
Organ
e u s s i
T m a r
G / D I %
1 minmin
minmin
min
minmin
min
5
15
30
0
5
10
15
20
25
b l o o d
b r a i n f a t
l u n g
b o n e
h e a r t
s p l e e
n
m u s c
l e
s a l i v a
r y g l a n
d s k i n
l i v e r
s t o m a
c h
I n t e s
t i n e
l a r g e b o w e
l
r k i d n e y
l k i d n e y
b l o o d
b r a i n f a t
l u n g
b o n e
h e a r t
s p l e e
n
m u s c
l e
s a l i v a
r y g l a n
d s k i n
l i v e r
s t o m a
c h
I n t e s
t i n e
l a r g e b o w e
l
r k i d n e y
l k i d n e y
e u s s i T m a r
G / D I %
1
515
30
a
b
Fig. 6 a Biodistribution of 14 C-D-luciferin in nude mice without fluc expression after tail-veininjection of 18.5 kBq 14 C-D-luciferin and 3 mg carrier D-luciferin. Note the early highuptake values in the kidneys dueto fast renal excretion of thetracer; 15 min after injection,
significant uptake in most of theorgans is demonstrated with lowuptake in the brain. Blood levelsand liver activity, which equals blood pool at early time points, peak early but fall rapidly. bBiodistribution of 14 C-D-luciferinin nude mice without flucexpression after intraperitonealinjection with the same amountsof tracer and carrier like above. Note the differences in biodis-tribution after intraperitonealinjection in comparison to intra-venous injection: Blood levels
rise less high but are longer detectable. Kidney activity peaks later. In general, organactivity is not getting as high asafter intravenous injection.Bowel/intestine activities are at early time points high probablydue to the injection route
2282 Eur J Nucl Med Mol Imaging (2008) 35:2275 – 2285
8/6/2019 14C Luciferin Kinetics
http://slidepdf.com/reader/full/14c-luciferin-kinetics 9/11
differences between 14 C-labeled D-luciferin and cold D-luciferin. These results support that 14 C-D-luciferin can beutilized as an appropriate tracer for the parent D-luciferin.The slightly lower light emission of 14 C-D-luciferin ob-served in cell culture was not consistent over the wholetime frame of the experiment. Results of 14 C-D-luciferincell uptake experiments support the previously publishedresults of relatively low permeability of D-luciferin through
cell membranes [ 13]. Intracellular uptake levels of thetracer were very low in both native and FL-expressing cells.Adding mass amounts of cold D-luciferin as carrier to themedium moderately increased intracellular uptake levels.This supports the theory of a diffusion-based uptake of D-luciferin. The serum proteins in the medium, to which trace
amounts of 14 C-D-luciferin can bind and of which the massamounts could displace the 14 C-D-luciferin, might alsocontribute to the observed increased intracellular uptakelevels in the presence of the carrier.
No significant differences in uptake patterns of the tracer could be detected in native versus fluc-transfected cells,when the cells were kept in media containing FBS. It isinteresting to note, however, that significant accumulation
of radioactivity was observed in fluc-transfected cells inculture when the cells were exposed to PBS containingradiolabeled D-luciferin. It can be speculated that FBS-containing media with saturated level of proteins mayinterfere with the intracellular entry of D-luciferin, so that the minimal intracellular accumulation of the substrate
0
10
20
30
40
50
60
70
80
90
100
d o o l ba r b n i t a f u ln
g o b
n e h e
t r a p s
l n e e c s u m
l e
s l av
i
y r a l g
n ad
s kn i r e v i l
t s m o
c ah
m s al l
n I s e t i t
e n
n i e g r a l
e t i t s
n e
g i r
t h i k
n d y e y e n d i k t f e l
Organ
e u s s i
T m a r G / D I %
D-Luciferin and 14C-D-Luciferin, 1 min
only 14C-D- Luciferin, 1 min
D-Luciferin and 14C-D-Luciferin, 5 min
only 14C-D-Luciferin, 5 min
Fig. 7 Differences of the biodistribution patterns wereevaluated in nude mice not expressing FL which wereintravenously injected with onlylabeled 14 C-D-luciferin or masslevels of carrier added to the14 C-D-luciferin (18.5 kBq14 C-D-luciferin and 3 mg
D-luciferin). The results wereevaluated 1 and 5 min after injection of the tracer. Kidneyactivities are significantlyhigher, if only 14 C-D-luciferin isinjected, but other organ activi-ties do not differ significantlywith our without coinjection of mass levels of carrier substrate
5 min p.i. 15 min p.i. 30 min p.i.
L
KBW
B
K
B
L
BW
Fig. 8 Autoradiograms ( N =6mice) 5, 15, and 30 min after coinjection via the tail vein of 18.5 kBq 14 C-D-luciferin and3 mg carrier D-luciferin. Auto-
radiographic studies verifiedresults from the biodistributionexperiments with early high up-take values in the kidney fol-lowed by accumulation in thegut system ( K kidney, B brain, Lliver, BW bowel)
Eur J Nucl Med Mol Imaging (2008) 35:2275 – 2285 2283
8/6/2019 14C Luciferin Kinetics
http://slidepdf.com/reader/full/14c-luciferin-kinetics 10/11
could only be detected in cells kept in protein-free PBS.The polar nature of the converted oxyluciferin [ 14] might contribute to the observed intracellular accumulation of radioactivity in cells expressing FL.
The results of the 14 C-D-luciferin efflux experimentswith the fast efflux of the tracer do not support the concept of a prolonged intracellular trapping of D-luciferin or itsmetabolites in FL-expressing cells.
Biodistribution of 14 C-D-luciferin after tail-vein injectionof carrier-added 14 C-D-luciferin shows early high uptakevalues in the kidneys indicating early renal excretion of thetracer. Early high activity levels in liver tissue represent blood pool activity. Five and 15 min after injection,significant uptake is present in most of the organs withlow uptake in brain tissue.
There are significant differences in biodistribution after intraperitoneal injection in comparison to intravenousinjection of carrier-added 14 C-D-luciferin: A general advan-tage when using the intravenous injection route was the lowvariation of uptake values in %ID/g in tissues of different mice. After intraperitoneal injection, organ uptake is prolonged in comparison to intravenous injections. Brainuptake is low with both routes. Intestinal uptake is highafter (local) intraperitoneal injection.
The measured higher activities in the organs at later time points (45 min after injection) in the biodistribution study by Lee et . a l. [12 ] is probably in part due to theaccumulation of free iodine and might not reflect to thefull extent the tracer levels. The relatively high activitylevels in the stomach measured at later time points by Leeet al. are also indicative of free iodine (transported into thelumen of the stomach by the sodium iodide symporter).
Biodistribution data in our study confirm relatively loworgan activities of the tracer, which likely influence the
light signal. It is critical for the planning of optical imagingexperiments to decide the injection route. If early and highuptake values are the key, then intravenous injection should be preferred. Intraperitoneal injections are better suited if prolonged organ uptake is important. Location of the area to be studied can also have an impact on the choice of theinjection route. The exact timing of the data acquisitionrelative to time of injection is also critical.
Comparisons of mice intravenously injected with onlylabeled or carrier-added 14 C-D-luciferin clearly showedmuch higher kidney activity (approximately sevenfold after 1 min, approximately fourfold after 5 min) in mice whichwere only injected with labeled tracer. Renal excretion of 14 C-D-luciferin, the predominant route of excretion of thetracer, is decreased when adding higher amounts of cold D-luciferin to the injection volume. One minute after injection, a higher blood pool activity in coinjected micewas detectable.
We also examined mice after tail-vein injection of hightiters of adenovirus carrying the CMV-Luc gene, whichleads to high fluc expression levels in the liver (adenoviralinfection is mediated by coxsackievirus and adenovirusreceptor which are expressed in high density in liver tissueof mice) [ 15]. Although we found higher organ activity4 min after injection of carrier-added 14 C-D-luciferin influc-transfected livers (with a low statistical significancelevel), consistent data to prove significant trapping of thetracer in tissue expressing high levels of FL could not bedemonstrated in vivo. Significant intracellular accumulationof 14 C-D-luciferin could not be observed in FL-expressingcells in vivo. It can be speculated that this might be in part due to the low cell membrane permeability of the tracer,which in combination with protein binding and fast renalexcretion leads to a rapid tracer washout.
In summary, we successfully introduced for the first time14 C-D-luciferin as a substrate tracer for the FL-catalyzed bioluminescence reaction. We detailed in vitro cell uptakeand efflux characteristics as well as biodistribution patternsof this tracer in living mice. However, we did not observeaccumulation of the tracer in luciferase-expressing cells invivo.
Future studies will benefit from the evaluation of biodistribution patterns of radiolabeled coelenterazine andother substrates of optical imaging probes in efforts tocharacterize alternate optical imaging systems. In futurestudies of optical imaging probes, a search for probes inwhich intracellular trapping of the radiolabeled substratecorrelates with light yield would be useful. Such intracel-lular trapping of a substrate in vivo would possibly allowthe development of a dual modality optical/radiotracer reporter system.
Since optical/PET scanners are already in development [16], a combined radiolabeled PET/optical multimodality
02468
10121416
CMV-Luc Transduced Mice (n=6) Control Mice (n=5)
*
%
I D / G r a m
L i v e r t i s s u e
Fig. 9 Mice were transduced by injecting Ad-CMV-luciferase via thetail vein; the control mice were injected with a control virus without the fluc sequence. Five minutes after tail-vein injection of 14 C-D-luciferin and mass level of carrier D-luciferin, mice were imaged in a CCD camera, and organs were harvested immediately after imaging tomeasure uptake in %ID/g. In pooled data over six fluc-transfected andfive control mice, the difference in 14 C-D-luciferin uptake was only borderline significant ( p=0.0047). No higher uptake differences between fluc-transfected and control tissue could be detected at earlier or later time points in similar experiments
2284 Eur J Nucl Med Mol Imaging (2008) 35:2275 – 2285
8/6/2019 14C Luciferin Kinetics
http://slidepdf.com/reader/full/14c-luciferin-kinetics 11/11
tracer — with corresponding and correlative trapping of thesubstrate in light emitting cells — would be a significant stepin the emerging scientific field of multimodality molecular imaging.
Acknowledgments This work was supported by National Cancer Institute (NCI) Small Animal Imaging Resource Program (SAIRP)grant R24 CA93862, NCI ICMIC P50 CA114747 (SSG), and NIHR01 CA82214 (SSG). FB was supported by a grant of the GermanResearch Foundation (DFG), a grant by the Bayerisch-KalifornischeHochschulinitiative (BACATEC), and the Friedrich Baur Stiftung. Wealso thank Xenogen for purchasing 14 C(U)-labeled D-luciferin fromMoravek Biochemicals. The reported experiments comply with thecurrent laws of the USA inclusive of ethics approval.
Conflict of interest statement All authors state that they have noconflict of interests.
References
1. Contag CH, Ross BD. It ’ s not just about anatomy: in vivo bioluminescence imaging as an eyepiece into biology. J MagnReson Imaging 2002;16:378 – 87.
2. Massoud TF, Gambhir SS. Molecular imaging in living subjects:seeing fundamental biological processes in a new light. GenesDev 2003;17(5):545 – 80.
3. Iyer M, Sato M, Johnson M, Gambhir SS, Wu L. Applications of molecular imaging in cancer gene therapy. Curr Gene Ther 2005;5(6):607 – 18.
4. Bhaumik S, Gambhir SS. Optical imaging of Renilla luciferasereporter gene expression in living mice. Proc Natl Acad Sci USA2002;99(1):377 – 82.
5. Tannous BA, Kim DE, Fernandez JL, Weissleder R, Breakefield XO.Codon-optimized Gaussia luciferase cDNA for mammalian geneexpression in culture and in vivo. Mol Ther 2005;11(3):435 – 43.
6. Contag PR, Olomu IN, Stevenson DK, Contag CH. Biolumines-cent indicators in living mammals. Nat Med 1998;4:245 – 7.
7. Gheysens O, Gambhir SS. Studying molecular and cellular processes in the intact organism. Prog Drug Res 2005;62:117 – 50.
8. Bowie LJ. Synthesis of radiolabeled Luciferin. Methods inEnzymol 1985;57:18 – 24.
9. Gambhir SS Barrio JR, Wu L, Iyer M, Namavari M, Satyamurthy N, et al. Imaging of adenoviral-directed herpes simplex virus type1 thymidine kinase reporter gene expression in mice withradiolabeled ganciclovir. J Nucl Med 1998;39(11):2003 – 11.
10. Nguyen VT, Morange M, Bensaude O. Firefly luciferase lumines-cence assays using scintillation counters for quantitation intransfected mammalian cells. Anal Biochem 1988;171(2): 404 – 8.
11. Lembert N, Idahl LA. Regulatory effects of ATP and luciferin onfirefly luciferase activity. Biochem J 1995;305(Pt 3):929 – 33.
12. Lee KH, Byun SS, Paik JY, Lee SY, Song SH, Choe YS, et al.Cell uptake and tissue distribution of radioiodine labelled D-luciferin: implications for luciferase based gene imaging. NuclMed Commun 2003;24:1003 – 9.
13. de Wet JR, Wood KV, DeLuca M, Helinski DR, Subramani S.Firefly luciferase gene: structure and expression in mammaliancells. Mol Cell Biol 1987;7(2):725 – 37.
14. Wang JQ, Pollok KE, Cai S, Stantz KM, Hutchins GD, ZhengQH. PET imaging and optical imaging with D-luciferin [11C]methyl ester and D-luciferin [11C]methyl ether of luciferase geneexpression in tumor xenografts of living mice. Bioorg Med ChemLett 2006;16(2):331 – 37.
15. Adams JY, Johnson M, Sato M, Berger F, Gambhir SS, Carey M,et al. Visualization of advanced human prostate cancer lesions inliving mice by a targeted gene transfer vector and optical imaging. Nat Med 2002;8(8):891 – 7.
16. Cherry SR. In vivo molecular and genomic imaging: new challengesfor imaging physics. Phys Med Biol 2004;49(3):R13 – 48.
Eur J Nucl Med Mol Imaging (2008) 35:2275 – 2285 2285

![シクロプロトリン...10 2011 2 3 5 3 14C [cyc-14C] 3-14C [phe-14C] mg/kg g/g 1 2 Fischer 3 [cyc-14C] 50 mg/kg 5,000 mg/kg Fischer 3 7 2 1 50 mg/kg 5,000 mg/kg 50 mg/kg / Tmax](https://img.dokumen.tips/doc/110x75/60ef4da753c03d22e86933e7/ffffff-10-2011-2-3-5-3-14c-cyc-14c-3-14c-phe-14c-mgkg.jpg)

![SkeletalMuscleAMP-activatedProteinKinaseIsEssentialfor … · 2009-10-07 · 15min.Theupperaqueousphase(containing2-[14C]DG)wasusedtodetermine2-[14C]DG-Pasdescribedpreviously(29).Aportion](https://img.dokumen.tips/doc/110x75/5f3b5d9a091da77b4f678521/skeletalmuscleamp-activatedproteinkinaseisessentialfor-2009-10-07-15mintheupperaqueousphasecontaining2-14cdgwasusedtodetermine2-14cdg-pasdescribedpreviously29aportion.jpg)


![INDUCTION OF BIOLUMINESCENCE CAPABILIT IN THE Y ...Bioluminescence in Porichthys 43 Table 1. Schedule of oral administration of Vargul14C]luciferina [ [14C]luciferin/fishDay 1 7-5](https://img.dokumen.tips/doc/110x75/60e71280e78add15017138f3/induction-of-bioluminescence-capabilit-in-the-y-bioluminescence-in-porichthys.jpg)