Embed Size (px)
Citation preview

Adult Education Location Analysis in LA County
by
Lu Lu
Instructor: Leo F. EstradaTA:Nic Jay Aulston&: Peter Capone-Newton
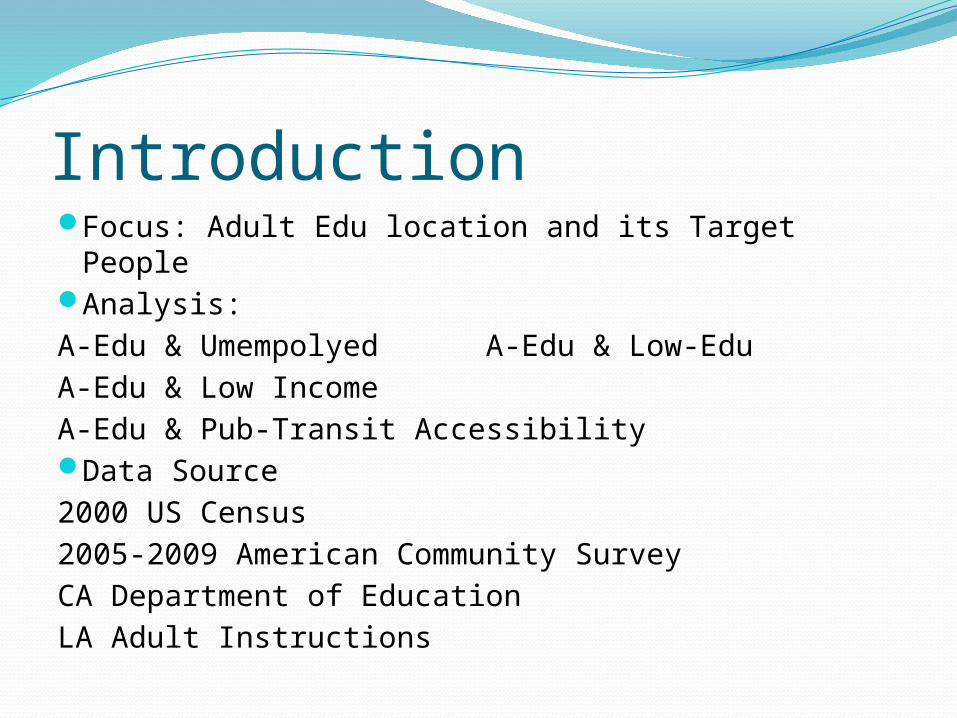
IntroductionFocus: Adult Edu location and its Target PeopleAnalysis: A-Edu & Umempolyed A-Edu & Low-Edu A-Edu & Low Income A-Edu & Pub-Transit AccessibilityData Source2000 US Census2005-2009 American Community SurveyCA Department of EducationLA Adult Instructions

StructureStep1 •A-Edu Center Locations in LA County
Step2•A-Edu and Unemployed people•A-Edu and Low-educated people•A-Edu and Low-income people
Step 3 •Transit Accessibility Analysis
Step4 •Further Studies

Part 1 LA County introductionAdult Education Centers in Los Angeles County

Skills: Inset-map, Geocoding, Charts or image
Demographic Stats:Area(sq mi): 4,060.87Population: 9,848,011Density: 2,344.1
Los Angeles County Basics
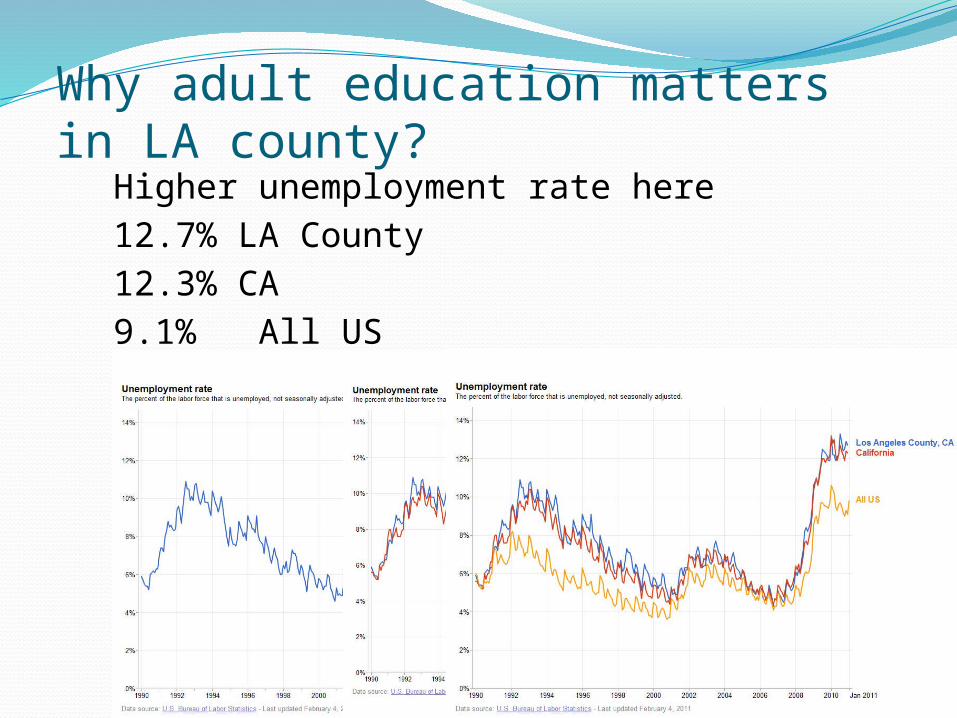
Why adult education matters in LA county?Higher unemployment rate here12.7% LA County12.3% CA9.1% All USMore people having a lower education69.9% LA 76.8% CAPoorer People Here15.3% LA 13.3% CA

BUTeconomic recession= lower opportunity
costTherefore,
A HIGHER DEMAND FOR ADULT EDUCATION HERE.

Part 2 A-Edu and Its Target People1. A-Edu and Unemployed people2. A-Edu and Low Educated people & . A-Edu and
Low-Income people

A-Edu and Unemployed people
A higher unemployment rate
in the northeast part, far from the
A-Edu centers.
Skills: Geocoding, Charts or image, Graduated colors, Selection by Attributes
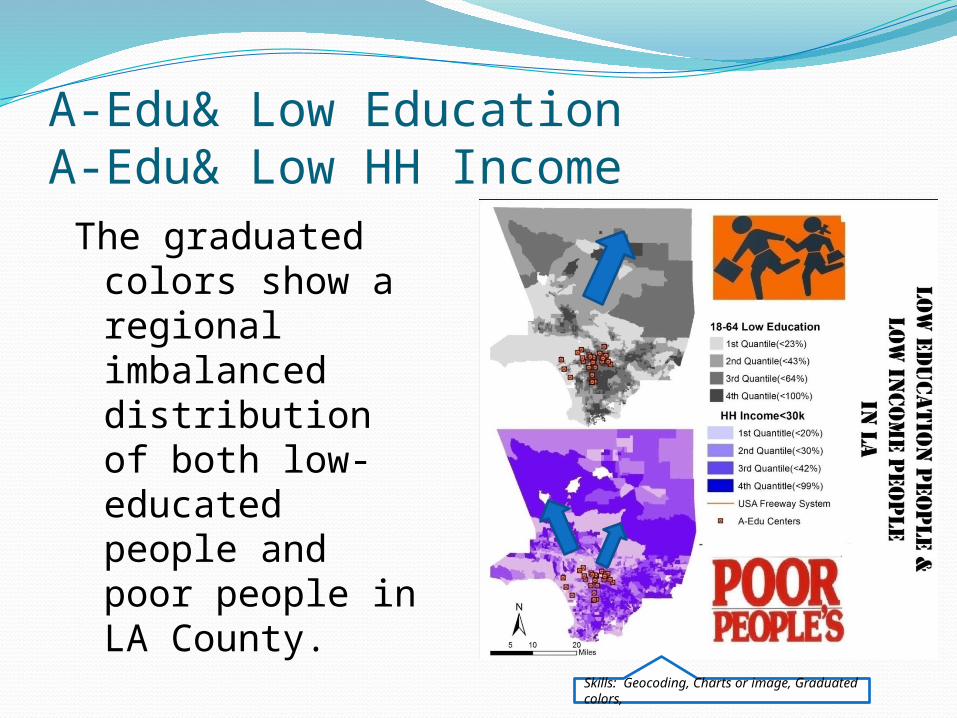
A-Edu& Low Education A-Edu& Low HH Income
The graduated colors show a regional imbalanced distribution of both low-educated people and poor people in LA County.
Skills: Geocoding, Charts or image, Graduated colors,
Part3 Spatial Analysis & Transit Accessibility Analysis 1. Analyzing people within 2-mile buffer of A-Edu
Centers in LA County2. Analyzing people within 0.5-mile buffer of Transit
line to LA A-Edu Centers

People within 2-mile buffer of A-Edu Centers
Skills: Geocoding, Charts or image, Graduated colors, Buffering
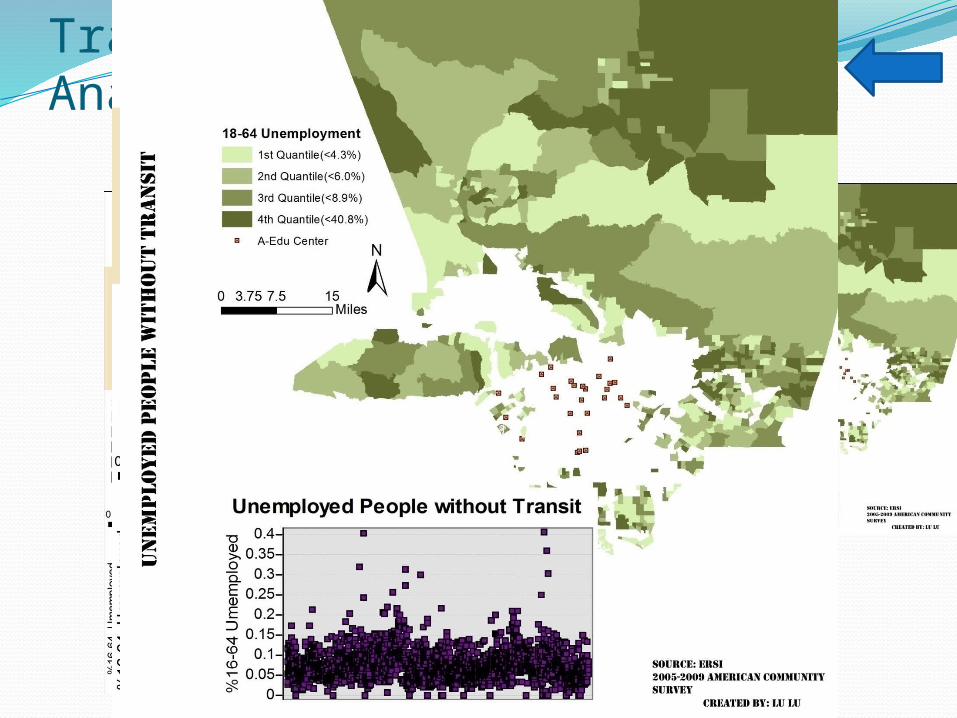
Transit Accessibility AnalysisSkills: Geocoding, Charts or image, Graduated colors, Buffering, Selection by location

Transit Accessibility AnalysisSkills: Geocoding, Charts or image, Graduated colors, Buffering, Selection by location

Transit Accessibility AnalysisSkills: Geocoding, Charts or image, Graduated colors, Buffering, Selection by location

Part4 Further Studies

Further StudiesFinding an index to integrate all three
variablesDoing hotspot analysis to find area
demanding more education resources
SkillsInset mapAttribute sub-sets selectionsBoundary sub-sets selectionsBufferingGeoprocessingGeocodingCharts or Images