Embed Size (px)
Citation preview

By Adam Hollingworth
Heart as a pump - 1
2.Heart as a Pump Table of Contents
Cardiac Cycle ......................................................................................................................................................... 2 CVS Pressures .................................................................................................................................................................... 3 Heart Failure ..................................................................................................................................................................... 3 Pericardium ....................................................................................................................................................................... 3 Timing .................................................................................................................................................................................. 4 Length of Systole & Diastole ......................................................................................................................................... 4
Arterial Pulse ........................................................................................................................................................ 4 JVP ............................................................................................................................................................................. 4
Cardiac Graph ....................................................................................................................................................... 5 Heart Sounds ..................................................................................................................................................................... 5 Murmurs ............................................................................................................................................................................. 6
Cardiac Output ...................................................................................................................................................... 6 Measurement .................................................................................................................................................................... 6 Factors effecting CO ........................................................................................................................................................ 6 Definitions .......................................................................................................................................................................... 6
Preload .................................................................................................................................................................... 7 Factors Effecting EDV ..................................................................................................................................................... 8 Relation of Tension to Length in Myocardium (Starlings Law) ........................................................................ 9
Afterload ................................................................................................................................................................. 9
Myocardial Contractility ................................................................................................................................. 10 Positive Inotropic Factors .......................................................................................................................................... 10
Heart rate ............................................................................................................................................................. 12 O2 Consumption ............................................................................................................................................................ 13
Summary Effects on CO .................................................................................................................................... 13
Functional Factors Effecting CO Overall .................................................................................................... 13
Ventricular Function Curves .......................................................................................................................... 15 Ventricular Pressure Volume Loops ...................................................................................................................... 15
Vascular Function Curves ............................................................................................................................... 18
Coupling Between Heart & Vasculature ..................................................................................................... 20 Athletes, Heart Transplant & Sympathetic Control of CO .................................................................... 23

By Adam Hollingworth
Heart as a pump - 2
Cardiac Cycle • With av HR of 72/min:
o Total cycle = 0.8 seconds o Systole = 0.3 s o Diastole = 0.5s ! ∴ vent filling ~ 2/3 cycle
Mid Diastole • Atrial & vent pressure both low • ↓Rate filling ventricles as V pressure rises above A pressure due to wall stretch • vents now 80% full • cusps of mitral/tricuspid valves drift towards closed • 80% vent filling occurs passively Atrial Systole (late Diastole) • SA node fires ⇒ P wave on ECG ⇒ atrial contraction (atrial a wave) • contraction of atria narrows IVC & SVC orifices to ↓backflow
! is some regurg • see small rise in vent pressure • atrial kick contributes ~20% vent EDV
! (vent EDV in supine ~160ml; stand ~130ml) • impt in fast AF with loss of kick Vent Systole • @ start AV valves close ⇒ isovolumetric contraction:
o 1st heart sound o sharp rise in intravent pressure o lasts 0.05s o mitral/tricuspid valves bulge into atrium
! = C wave of atrial pressure wave (↑pressure LA:10mmHg. RA:5mmHg • once ventr pressure higher than aorta & pulmon ⇒ ejection • rapid vent ejection phase after valve open followed by prolonged reduced phase • pressure changes:
o aorta: 80⇒120 o pulmonary a: 5⇒25
• late systole : pressure aorta > L vent but momentum keeps blood flowing • elasticity of aortic walls & periph resistance to flow maintain aortic pressure • SV ~ 70-90ml • End diastolic vent volume ~ 120ml • End systolic vent volume ~50ml • Atria:
o Rapid ejection phase: mitral/tricuspid valves pulled down by vent systole ⇒ ↓atrial pressure⇒ aiding filling ! = x descent
o Rest vent systole: rise atrial pressure as blood fills atria = v wave (! in tricuspid regurg c & v merged into one large v wave)
Early diastole • Protodiastole =
o Before aortic/pulmon valve closed o Rapid drop vent pressure o Lasts 0.04s o Ends with valve closure
• Isovolumetric vent relaxation:
Ejection fraction ~65% in norm heart
By Adam Hollingworth
Heart as a pump - 3
o Begins with closure of aorta & pulmon valves (2nd heart sound – may be split if aortic closes 1st) o Incursura in aortic pressure waveform produced by closure of valve causing brief backflow of
blood o Atrial pressures: LA ~5mmHg; RA ~2mmHg o Ends when vent pressure falls below atrial pressure ⇒ mitral/tricuspid valve opening
• Atrial pressure ↑s after systole until mitral/tricuspid valves opens • Rapid filling of ventricle occurs after mitral/tricuspid opening – most impt part of vent filling as time
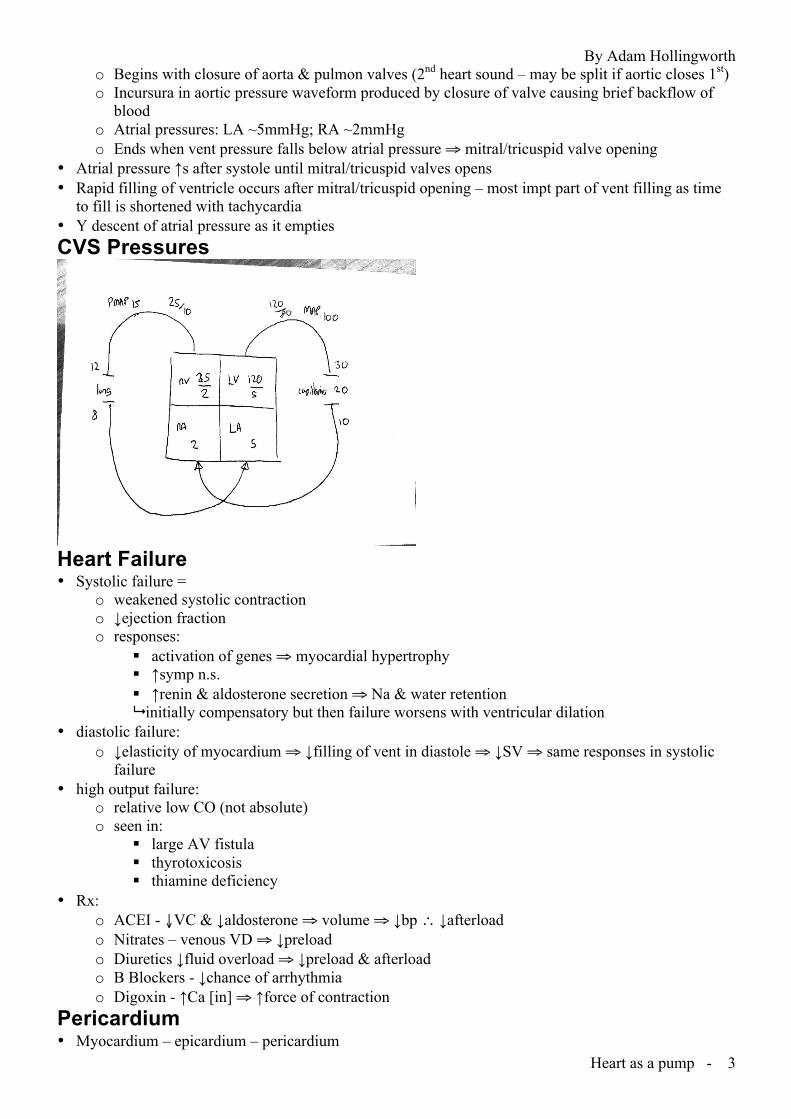
to fill is shortened with tachycardia • Y descent of atrial pressure as it empties CVS Pressures
Heart Failure • Systolic failure =
o weakened systolic contraction o ↓ejection fraction o responses:
! activation of genes ⇒ myocardial hypertrophy ! ↑symp n.s. ! ↑renin & aldosterone secretion ⇒ Na & water retention ! initially compensatory but then failure worsens with ventricular dilation
• diastolic failure: o ↓elasticity of myocardium ⇒ ↓filling of vent in diastole ⇒ ↓SV ⇒ same responses in systolic
failure • high output failure:
o relative low CO (not absolute) o seen in:
! large AV fistula ! thyrotoxicosis ! thiamine deficiency
• Rx: o ACEI - ↓VC & ↓aldosterone ⇒ volume ⇒ ↓bp ∴ ↓afterload o Nitrates – venous VD ⇒ ↓preload o Diuretics ↓fluid overload ⇒ ↓preload & afterload o B Blockers - ↓chance of arrhythmia o Digoxin - ↑Ca [in] ⇒ ↑force of contraction
Pericardium • Myocardium – epicardium – pericardium

By Adam Hollingworth
Heart as a pump - 4
• Between epicardium & pericardium = 5-30ml fluid Timing • R atrial systole then L atrial systole • Left ventricular contraction then R vent • R vent ejection just before L vent
! as pressure in pulmon circuit < aortic pressures • End of systole (S2 heart sound)
o During inspiration – pulmon valve closure delayed o During expiration – aortic & pulmon valves together
Length of Systole & Diastole • Duration of systole is more fixed than diastole
! although speed of systole does decr with ↑HR • Marked decr in diastole with high HRs – results in:
o ↓vent filling ! up to 180/min filling adequate if enough venous return
o ↓ perfusion of coronary circulation • cardiac mm cannot tetanise like skeletal mm • max theoretical rate of vents =400 • only see rate >230 in vents in VT
! max AV node d/c rate
Arterial Pulse • pulse felt is a pressure wave NOT blood moving forward • pressure wave moves faster than blood flow:
o aorta 4m/s o large arteries 8m/s o small arteries 16m/s ! older rigid arteries wave moves faster
• pulse pressure ∝ strength of felt pulse eg ! no relation to mean pressure
o shock – narrow pulse pressure 2nd to ↑diastolic pressure ⇒ thready pulse o aortic insufficiency – high pulse pressure 2nd to regurg & ↓diastolic ⇒ collapsing pulse
• dicrotic notch = o notch on falling phase of pulse o unable to feel; only measure o vibrations from aortic/pulmon valve shutting
JVP • atrial pressure:
o ↑ in atrial systole o ↑ in isovolumetric contraction – bulge of AV valve into atria o rapid↓ in early systole – AV valves pulled into ventricle o slow ↑ through systole – atrial filling o ↓ as AV valves open in diastole
• JVP waves: o A – atrial systole o C – isovolumetric contraction - bulging of AV-valves into atrial chambers o V – rise in atrial pressure until tricuspid valve opens (due to atrial filling during ventricular
systole (lasts until end of isovolumetric relaxation))

By Adam Hollingworth
Heart as a pump - 5
o x-descent: (follows c wave) initial pressure drop in atria during initial rapid ventricular ejection = due to atrial relaxation as well as ballistic effect of contracting ventricles on atria.
o y-descent: (follows v wave) drop in atrial pressure as AV valves open at end of isovolumetric relaxation and onset of early diastole.
• Respiration effects volume of JVP waves: o Inspiration & ↑ed -ve intra-thoracic pressure ⇒ ↓venous pressure o Expiration ⇒ ↑venous pressure
Cardiac Graph = Wiggers diagram:
Heart Sounds • S1 = closure of AV valves = start of systole • S2 =
o closure of aortic & pulmon valves = end of systole
Phases: 1. atrial systole 2. isovolumetric contraction 3. vent ejection 4. isovolumetric relaxation 5. vent filling

By Adam Hollingworth
Heart as a pump - 6
o inspiration ⇒ physiological splitting of S2 by late closure of pulmon valve due to incr preload • S3 (always follows S2) =
o rapid vent filling 1/3 through diastole o can be normal
• S4 = o Filling of stiff ventricle following atrial contraction o Just before S1 o Always pathological
Murmurs • Blood flow speeds up through narrowing eg:
o stenosis o regurgitation
• turbulent flow ⇒ murmur • aortic or pulmon valve:
o stenosis ⇒ systolic o regurg ⇒ diastolic
• AV Valve: o Stenosis ⇒ diastolic o Regurg ⇒ systolic
Cardiac Output Measurement • Fick principle = amount of substance taken up by organ/time = arterial level of the substance minus the
venous level (A-V difference) x blood flow • Norm CO = ~70ml/kg/min or 5 litre/min • Cardiac index =
o CO/body surface area o output/min/m2 o norm ~ 3.2 ! CI adjusts for differing body sizes
Factors effecting CO • CO = HR x SV • As circ is a close system CO usually = VR • SV determined by:
o Loading factors – ! preload (PL) ! afterload (AL)
o Myocardial contractility (Cx) • ∴ 4 determinants of CO:
o HR o Cx o AL o PL ! All these factors also determine Myocardial O2 demand
Definitions • Preload = amount of stretch of ventricular mm fibres at end of ventricular filling (aka inial fibre
length) • Afterload = impedance to the ejection of blood into the arterial circulation
o Impedance rather than resistance as it is a changing resistance o Afterload because ventricle only performs work after the aortic valve opens

By Adam Hollingworth
Heart as a pump - 7
• Contractility = factor responsible for changes in myocardial performance which are not due to HR, preload or afterload
! not to confuse with Starlings law) • All myocytes display 5 chars:
o Bathmotropy = excitability o Dromotropy = conductivity o Chronotropy = rhythmicity o Inotropy = contractility o Lusitropy = relaxation
Preload • Starlings Law of heart = diastolic length of vent mm fibres determine the force of their contraction
! ie intrinsic quality of cardiac myocytes NOT contractility • ∴ Amount of vent mm fibre stretch at end of diastole forms basis of Starling Law • Summary preload factors:
o filling pressure ∴ CVP: ! blood volume ! gravity ! Tx pump ! mm pump ! CO ! periph tone
o ventricular compliance Right Side of Heart • cannot measure stretch but EDV is next best indicator of preload • EDV can be measured with ECHO • Another indicator of preload = end-diastolic pressure (EDP) aka filling pressure • EDV is proportional to EDP but EDV achieved will depend on ventricular compliance
compliance = ΔV / ΔP ∴ EDV = ventricular compliance x filling P
Left Side of Heart • LVEDP cannot be measured directly • ∴ next best way to determine LV preload is surrogate pressure measurement = PCWP • PCWP theory:
o End diastole: continuous communicating coloum of blood from LV ⇒ LA ⇒ pulm veins ⇒ pulmon caps
o Inflate pulmon art catheter balloon, float pressure sensor distally until wedged in pulmon capillary
o Pressure measured is PCWP o Ideally catheter should be in West zone 3 (Pa>Pv>PA)
• Next surrogate of LV preload = CVP: o CVP ≈ RAP ≈ RVP ≈ PAP ≈ PCWP ≈ LAP ≈ LVP ≈ LV volume ≈ LV preload
• Downsides of R side pressure surrogates of LV preload are many!!: o Valvular disease o Pulmon disease o Changes in LV/RV compliance

By Adam Hollingworth
Heart as a pump - 8
Factors Effecting EDV • EDV depends on:
o Compliance – of ventricle o Transmural pressure distending it:
! = internal pressure – external pressure ! external p = intrathoracic pressure
• compliance: o ↓compliance ⇒ ↓EDV for a given distending pressure
• external pressure: o ITP (intrathoracic pressure)
! end expiration = -5cmH20 ! end inspiration = -10cmH20 ! ∴ inspiration creates a suction effect around heart & central veins ⇒ ↑vent filling
• internal pressure: o EDP in RV ~ CVP o Therefore CVP plays key role in determining preload….
Factors influencing CVP • Blood volume:
o 2/3 of total blood volume is in venous system o any ↑ in volume ⇒ sig ↑ in CVP
• gravity: o influence distribution of venous blood between periph & thoracic veins o eg ~500ml blood pools in LLs in erect position
• Periph venous tone: o Esp skin, kidney, splachnic veins o Innervated by symp ns ⇒ venoconstriction ⇒ ↑CVP
• MM pump: esp impt in exercise ⇒ ↑VR ⇒ ↑CVP • Throacic pump:
o With ↑ing insp ⇒ ↑negative ITP & abdo pressure ↑+ve ⇒ ↑venous gradient from abdo to thorax ! venous valves prevent back flow during expiration
• Cardiac output: o Heart transfers blood from venous to arterial system ⇒ ↑MAP & ↓CVP o ∴ Everything else being the same ↑MAP & ↓CVP acts as a brake
Functional Examples • decreasing EDV:
o ↑intrapericardial pressure ! eg pericardial effusion, ! pressure from tumour
o ↓ventricular compliance: ! MI ! Inflam disease
• increasing EDV: o atrial contraction o hypervolaemia ⇒ ↑venous return o ↑pressure gradient to heart along venous flow:
! inspiration ! muscular activity ! moving to lying

By Adam Hollingworth
Heart as a pump - 9
Relation of Tension to Length in Myocardium (Starlings Law)
• Nb force of contraction or initial fibre length difficult to measure ∴
o Y axis usually = CO, SV, stroke index, stroke work o X axis usually = LVEDV, LVEDP, PCWP
• Curve also known as ventricular function curve ! in vitro measurement
• Starlings law of heart = energy of contraction is ∝ to initial length of cardiac mm fibre up to a point • This is defined by myocardial sarcomere length (~2.2um) & ratchet mechanism:
o Immediate rise in contractile force – due to overlapping actin filaments & myosin bridges o Delayed response (over mins) - ↑in systolic calcium flux – due to stretch sensitive Ca channels
• Starling mechanisms function: o Balance outputs of R & L ventricle:
! 1% difference in RV > LV output over 30mins ⇒ ↑pulmon blood from ~600mls to ~2100mls ⇒ severe pulmon oedema
! RV output > LV ⇒ ↑LVEDV ⇒ starling mechanism ⇒ ↑LV output o Valsalva Manoeuvre – causes fall in SV o In upright exercise: if CVP rises contributes to ↑SV o Mediates postural hypotension o Mediates arterial hypotension following haemorrhage
Guyton Cardiac Function Curve • = in vivo curve • Displays pivotal role of CVP in regards to CO • Shows how CVP raised the CO by means of Starling mechanism provided HR & MAP are unchanged • Differs from Starling vent function curve in that is affected by changes afterload & contractility ie
invivo ! a ventricular function curve shows only Frank Starling relationship ie isolated mm strip (in vitro)
• Homometric regulation = changes of contractility not due to change in fibre length
! ie autonomic system, drugs, ischaemia • heterometric regulation = changes in CO due to mm fibre length changes
Afterload • afterload = impedance to vent ejection • function of:
o SVR o Laplace law: ventricular wall tension
! T = P.R/wall thickness ! ∴ ↑intrathoracic pressure seen with IPPV ⇒ ↓afterload via ↓R & ↑wall thickness
o aortic root compliance

By Adam Hollingworth
Heart as a pump - 10
o aortic valve dysfunction • for LV = MAP during systole; for RV = mean pulmonary arterial pressure (during systole) • MAP = CO x SVR (chief site of resistance = arterioles) NB: • isotonic cardiac contraction = against a fixed afterload (in vitro only) • auxotonic = contraction against a changing afterload (happens in vivo) Effect of Afterload • afterload is reflected by ↑myocardial wall tension (T) • ventricular hypertrophy ⇒ ↓wall tension by ↑ing wall thickness
! explained by La Place’s Law: for thin walked spheres or tubes:
P = 2T/r can rearrange: T = P x r / 2
For thick walled sphere or tube:
Tension = wall stress (S) x wall thickness (w) ∴ wall stress = P x r 2w • thus wall stress ↑ed by:
o ↑pressure in chamber (afterload) o ↑radius (dilated heart)
• thus wall stress ↓ed by: o ↑wall thickness (LVH)
• it is the ↑ed wall stress which ↑s myocardial o2 demand
Myocardial Contractility • Starling mechanism = intrinsic regulation of contractile strength • ∴ myocardial contractility = extrinsic or change in contractile energy not due to fibre length changes • inotropic state = contractility Positive Inotropic Factors • Positive inotropic effect on heart ⇒ shifts length-tension curve UP & LEFT eg:
o Symp n.s. = ! ↑norad release at symp nerve terminals ! circulating catecholamines ie norad, adrenaline, dopamine
• act on β1 receptors ⇒ ↑cAMP o Drugs:
! Xanthines eg caffeine & theophylline – • Phosphodiesterase inhibitor ⇒ ↓breakdown of cAMP
! Digoxin – inhibitory effect on NaK ATPase ∴ indirect inhibition of NCX pump ! Angiotensin 2 ! ↑extracellular Ca ! thyroxine
o Force frequency relation:

By Adam Hollingworth
Heart as a pump - 11
! Vent extrasystole condition next beat to be stronger ! Due to ↑ Ca [in]
o ↑HR – ! small incr in contractility ! not very much in vivo ! if HR ↑ed the 1st beat is weaker than following beats with progressive ↑in strength ! = Bowditch rate effect ! due to ↑size of calcium influx
Noradrenaline effects • =most impt ionotrope • NA released from symp nerve terminals in vent wall:
o binds to B1 receptors on myocytes ( GS linked) ⇒ o activates a prot – cAMP – prot kinase A – calcium channel phosphorylation sequence ⇒ o ↑ inward calcium current during the plateau of the AP ⇒ ↑ intracellular calcium stores ⇒ more
forceful systolic contraction • In addition:
o sarcoplasmic reticulum calcium uptake pumps are accelerated ⇒ shorter systole o This is beneficial as it preserves diastolic filling time (impt in tachycardia) ! This property (ie relative shortening of systole) is called lusitropy.
• Thus the effect of NA is a more forceful and shorter systole, which results in following: o ↑ed bp: Ventricular pressure ↑s more rapidly in the isovolumetric phase o ↑ed Ejection fraction: - velocity of contraction and shortening are enhanced by NA.
! EF is sometimes used as an indirect index of contractility o Stroke volume: -
! Transient ↑ as EF rises, BUT ! then limited by the concomitant ↓ in EDV as well as ↑MAP.
o ↓ed Systolic duration: (lusitropy) – shorter ejection time does not significantly curtail SV, because the velocity of shortening is increased. (ie more forceful contraction).
**** **** ****** • Negative ionotropic ⇒ DOWN and to RIGHT
o Para symp = vagal tone via Ach o ↑CO2, ↓O2 o ischaemia via acidosis & hypoxia o drugs:
! BBs & CCBs ! Barbituates ! Many anaesthetic drugs
o heart failure – intrinsic depression: ! ? cause but thought:
• ↓regulation of B receptors • ↓Ca liberation from Sarcoplasmic reticulum

By Adam Hollingworth
Heart as a pump - 12
Heart rate • CO = SV x HR • Any change in HR usually occurs as part of integrated response to a ↑↓MAP • HR under autonomic control:
o Symp ⇒ ↑HR o Parasymp ⇒ ↓HR
• Heart = demand pump ∴ any change in HR will only effect CO if assoc with change in demand from tissues
• Tissues set their demand by means of total venous return ⇒ ↑↓tendancy for VR ⇒ Starling mechanism ⇒ adjustment of CO
! ∴ VR = CO Isolated Changes in HR • Eg pacing, atropine • Will see surprisingly little change in CO (within limits)
! cos see an inverse change in SV for any change in HR • Isolated ↑HR:
o ↑artificial pacing rate ⇒ ↓diastole but not systole ⇒ ↓ed vent filling time o transfer of blood from venous side to arterial side ⇒ ↓EDP & ↑MAP both of which ↓SV ! at a threshold actually start seeing ↓CO due to ↓↓ed vent filling time
• isolated ↓HR: o initially CO will remain constant:
! ↓HR offset by ↑vent filling time ⇒ ↑SV o at threshold will see a ↓CO as ventricles max filled ∴ ↓ing HR ⇒ ↓ing CO

By Adam Hollingworth
Heart as a pump - 13
O2 Consumption • o2 consumption determined by:
o intramyocardial wall stress (surrogate for afterload) o contractile state of heart o HR
• Ventricular work = SV x mean arterial pressure
! thus LV work x7 more than RV • Pressure work requires ↑↑o2 consumption compared to volume work ie afterload > preload
! incompletely understood ! why angina is more common AS : AR • basal o2 consumption 2ml/100g/min
! much bigger than skeletal mm • beating heart 9ml/100g/min • ↑in o2 consumption require ↑in blood flow
Summary Effects on CO • ∴ 4 determinants of CO:
o HR o Cx o AL o PL ! All these factors also determine Myocardial O2 demand
• But any change in single factor remarkable ineffective • Need coordinated cooperative change in all factor to change CO substantially
Functional Factors Effecting CO Overall • No change:
o Sleep o Mod changes in environmental temperature
• Increase: o Anxiety ↑50-100% o Eating ↑30% o Exercise ↑up to 700% o ↑temp o pregnancy o Adrenaline

By Adam Hollingworth
Heart as a pump - 14
• Decrease: o Lie to sit/stand ↓20-30% o Arrhythmias o Heart disease

By Adam Hollingworth
Heart as a pump - 15
Ventricular Function Curves Ventricular Pressure Volume Loops Normal P-V loop for LV:
• All the information obtained from Vent P-V loop (favourite exam topic):
o EF o LVEDV – Note: this is number on x axis – NOT point B o Indices for afterload = Ea line o Indices for ventricular compliance (EDVP Line) o Contractility = Ees line o Stroke work (PxV = Joules) = area within loop o B-A = diastolic filling o C-B=isolvolumetric contraction o D-C = volume ejected o D-A= isovolumetric relaxation
EDPV Line • P-V relationship during diastole (A⇒B) gives an idea of ventricular compliance
! most important part of line is End Diastolic P-V line (EDPV) • ∆P is plotted against ∆V ∴ talk about elastance (ie inverse of compliance)
• EDVP line as shown ESPV Line • Similar line to EDVP but drawn on top of ventricular function curve at End systole • Aka endsystolic elastance of EEs line ie measure of contractility

By Adam Hollingworth
Heart as a pump - 16
Effect of Isolated ↑Preload on LV PV Loop • Loop 1 = normal; loop 2 shows ↑ed preload • Loop 2 has ↑ed stroke volume as wider • Contractility & afterload are constant
Effect of Isolated ↑Afterload • Index for afterload =
o slope of line connecting LVEDV & End systolic point o aka effective arterial elastance (Ea line)
• In loop above this line parallel; in this loop clear ↑in afterload in loop 2 • Loop 2 has ↓ed SV 2nd to ↑ed afterload which manifests as earlier aortic valve closure
(Ea line)
(Ea line)

By Adam Hollingworth
Heart as a pump - 17
Effect of ↑ed Contractility • LVEDV is same for both loops ie preload same • Ea line is the same ie afterload same • ESPV Line = index of contractility • Loop 2 demonstrates ↑SV by mechanism of isolated ↑contractility ∴ ESPV ↑ed gradient
NB: Above lines demonstrate differences in vitro. In body more integrated changes seen Effect of Systolic & Diastolic Dysfunction • L curve = systolic dysfunction:
o ↓ed stroke volume o curve also implies afterload ↑ed by steeper Ea line (not drawn)
• R curve = diastolic dysfunction: o EDPV shifted up and left ie preload ↓ed due to ↑elastance ⇒ ↓SV
(Ea line)
ESPV Line

By Adam Hollingworth
Heart as a pump - 18
Mechanical Energy & Work • = a pressure volume area • Area within the loop = stroke work (mechanical energy) done by heart during single contraction
! = external work of ventricle
• Isovolumetric contraction (upstroke):
o no ejection & ∴ no external work o energy expended to generate potential energy ⇒ converted to heat during diastole
• Potential energy: o Purple triangle (EDPV – ESPV – isovolumetric relaxation line) o = amount potential energy available during a contraction
! correlates well with heat generated during contraction • total mechanical work + heat generated = PVA of stroke work + potential energy
! pressure volume area • PVA correlates well with O2 consumption (VO2) of myocardium during single contraction • Gross energy efficiency of heart ~15%:
o Much of contractile energy goes into raising pressure rather than ejection o ∴ ↓bp can improve SV in heart failure
• metabolic energy source variable: o 2/3 FFAs o rest = glucose & lactate ! heart is an omnivore
Vascular Function Curves • Starling Curve (&Guyton Curve) = cardiac function curves which relate:
o Change CVP – x axis (indep variable) o Change in CO – y axis (dependant variable)
! ie how changes in CVP effect CO ! = a compliance curve
• Vascular function curve relates: (switch-a-roo) o Change in CO – x axis (indep variable) o Change in CVP – y axis (dependant variable) ! ie how changes in CO effect CVP ! = a elastance curve

By Adam Hollingworth
Heart as a pump - 19
• Impt points:
o CO = 0 ie cardiac arrest: ! Pressure becomes an equilibrium throughout whole CVS ie not just venous ! This = Mean circulatory pressure (MCP) (or Pmc as in diagram) ! MCP ~ 7mmHg ie vascular system overfilled
o Point A: ! @normal CO ~5l/min ! CVP = ~2mmHg ! = norm operating pressure of system
o Break point of line below point A: ! ↑ing CO ⇒ ↓ing CVP up to a point ! here intravascular pressure falls < extravascular pressure ⇒ collapse of distensible large
vessels ! CO now limited by VR & cannot ↑anymore
o If a VFC is combined with a CFC then CFC axis orientation take precedence for convenience Effect of Change in Blood Volume & Venous Tone • Transfusion or venoconstriction ⇒ upward shift of curve ie ↑ed MCP
! converse is true ie haemorrhage & venodilation ⇒ downward curve shift • NB neither will affect position or shape of cardiac function curve!!
Effect of change in SVR (ie ↑afterload) • MCP does not change – only ~3% of total blood is in the arterioles • Vasodilation ⇒ larger CO (or VR) ⇒ anticlockwise rotation of VFC • Vasoconstriction ⇒ ↓CO (or VR) ⇒ clockwise rotation of VFC • NB change in SVR (VasoC or VasoD) will also effect cardiac function curve

By Adam Hollingworth
Heart as a pump - 20
Coupling Between Heart & Vasculature • NB CO = VR ie both describe total flow around closed circuit • Coupling can be demonstrated by plotting CFC & VFC on same graph (with CFC axis orientation)
(! Guyton) • Intersection of 2 curves = equilibrium point at which CVS tends to operate
• Curve shows how disturbances in equilibrium are dealt with:
o ↑CVP: ! CFC moved to point A ! ↑ed CVP would ⇒ ↑CO ie point A ⇒ point B during next systole ! As a result of ↑CO NET transfer of blood from venous to arterial side of circ ⇒ ↓CVP
(due to VFC) ! With each beat this transfer would be small ie point B ⇒ point C (not B ⇒ C1) ! Due to ↓CVP next CO of next beat will also be ↓ed (due to CFC) ie point C ⇒ D ! Point D is still above equilibrium ∴ heart will pump blood from venous to art circ every
beat at a rate faster than blood will flow across peripheral capillaries back to venous circulation ∴ CVP continue to ↓ until equilibrium reached
! above example needs total volume to stay same ie inject blood into venous side during diastole, while simultaneous removing same volume from arterial circ
Effect of ↑ed Contractility on Cardiac-Vascular Coupling • Isolated ↑ed contractility due to symp stim

By Adam Hollingworth
Heart as a pump - 21
! in vitro demonstration cos symp stim would also have effect on vasculature in vivo! • equilibrium values will change:
o CO shift upto point B (due to ↑ed contractility ie no change in CVP initially) o NET transfer of blood to art side ⇒ ↓ing CVP (B to C) o CO will continue to fall until reach new equilibrium (C to D)
! at intersection of same VFC but with new CFC
• Summary effect = SNS stim ⇒ greater CO at same CVP
! VFC is the same!! Effect of Changes in SVR • ↑SVR (vasoC) effects both CFC & VFC downwards • @equilibrium for an ↑SVR ⇒ ↓CO (point A to B)
Effect of Transfusion on Coupling • VFC shifted parallel up to right • CFC not changed • CO & CVP are both ↑ed (point A to B)
! the ↑CVP is reflected on the CFC by Starlings Mechanism ie moves along curve but does not change its shape

By Adam Hollingworth
Heart as a pump - 22
Coordinated Effect of Max Symp Activity (in Vivo) • CFC is shifted up & left - ↑contractility overrides the ↑afterload effects • VFC shifted:
o Up – venoconstriction predominant o Slight rotation down – vasoconstriction = less predominant
Effect of Heart Failure

By Adam Hollingworth
Heart as a pump - 23
• Acute pump failure: o Mod to severe failure: CFC shifted right & down o Blood volume remains constant immediately o ∴ equilibrium (point A) will slide down normo-volaemia line
! equilibrium point of will correspond to ↓ed contractility (point B or C) • Chronic congestive Heart failure:
o ↑blood volume ⇒ VFC shift upwards ! 2nd to aldosterone fluid retention & ↓GFR
o CFC remains shifted down and right from pump failure (↓contractility) o ∴mod heart failure – can maintain norm CO (point D) but with higher CVP o BUT with severe failure CO↓ing & CVP remains high
• Disparate changed in vent contractility: o Eg ant MI effecting LV only ⇒ ↓LV contractility but norm RV contractility o Initially LAP norm but ↓LV output o RV continue with norm output ⇒
! ↓ing RAP ⇒ ↓ing RV output ! ↑ing LAP ⇒ ↑LV output ! both via CFC effects
o continue until new equilibrium reached & 2 vent will have same outputs BUT ↑ed L sided pressures ⇒ ↑pulmon venous P which can lead to pulmon oedema
Athletes, Heart Transplant & Sympathetic Control of CO • During exercise = ↑symp activity ⇒ ↑HR & ↑SV
o In untrained individuals: bigger ↑HR; less ↑SV o In trained athlete: less ↑HR; bigger ↑SV o In heart transplant: no direct symp innervation thus
! Circulating catecholamines – small effect ! ↑EDV ⇒ ↑vent contraction ⇒ ↑SV ! mm pump ⇒ ↑venous return ! ↑Respiration ⇒ ↑venous pressure gradient ! ↑VD of arterioles in mm ⇒ ↓afterload ⇒ ↑CO


![By Adam Hollingworth Respiratory - · PDF fileRespiratory RE01 [Mar96] Which of the following is a normal characteristic of lung? A. 3,000,000 alveoli 500m alveoli B. Alveolar diameter](https://img.dokumen.tips/doc/110x75/5a9e0bc67f8b9a4a238df3d5/by-adam-hollingworth-respiratory-re01-mar96-which-of-the-following-is-a-normal.jpg)