Embed Size (px)
Citation preview
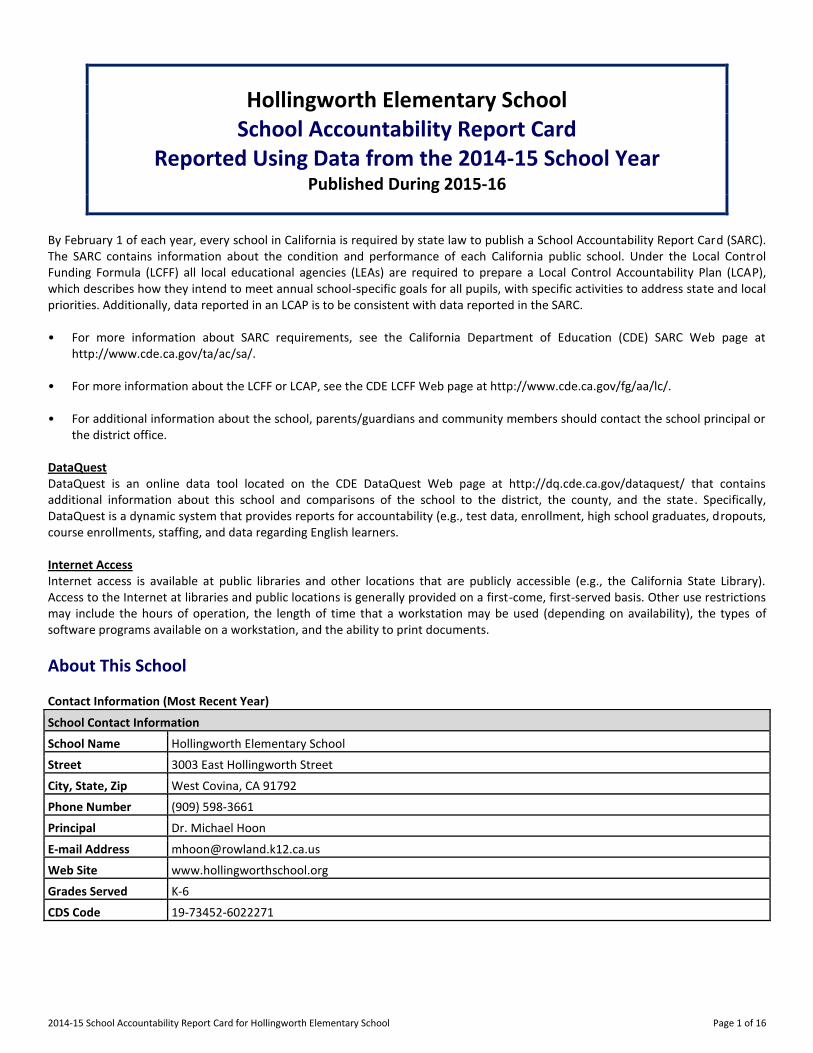
2014-15 School Accountability Report Card for Hollingworth Elementary School Page 1 of 16
Hollingworth Elementary School
School Accountability Report Card
Reported Using Data from the 2014-15 School Year
Published During 2015-16
By February 1 of each year, every school in California is required by state law to publish a School Accountability Report Card (SARC). The SARC contains information about the condition and performance of each California public school. Under the Local Control Funding Formula (LCFF) all local educational agencies (LEAs) are required to prepare a Local Control Accountability Plan (LCAP), which describes how they intend to meet annual school-specific goals for all pupils, with specific activities to address state and local priorities. Additionally, data reported in an LCAP is to be consistent with data reported in the SARC. • For more information about SARC requirements, see the California Department of Education (CDE) SARC Web page at
http://www.cde.ca.gov/ta/ac/sa/. • For more information about the LCFF or LCAP, see the CDE LCFF Web page at http://www.cde.ca.gov/fg/aa/lc/. • For additional information about the school, parents/guardians and community members should contact the school principal or
the district office. DataQuest DataQuest is an online data tool located on the CDE DataQuest Web page at http://dq.cde.ca.gov/dataquest/ that contains additional information about this school and comparisons of the school to the district, the county, and the state. Specifically, DataQuest is a dynamic system that provides reports for accountability (e.g., test data, enrollment, high school graduates, dropouts, course enrollments, staffing, and data regarding English learners. Internet Access Internet access is available at public libraries and other locations that are publicly accessible (e.g., the California State Library). Access to the Internet at libraries and public locations is generally provided on a first-come, first-served basis. Other use restrictions may include the hours of operation, the length of time that a workstation may be used (depending on availability), the types of software programs available on a workstation, and the ability to print documents.
About This School Contact Information (Most Recent Year)
School Contact Information
School Name------- Hollingworth Elementary School
Street------- 3003 East Hollingworth Street
City, State, Zip------- West Covina, CA 91792
Phone Number------- (909) 598-3661
Principal------- Dr. Michael Hoon
E-mail Address------- [email protected]
Web Site------- www.hollingworthschool.org
Grades Served K-6
CDS Code 19-73452-6022271
2014-15 School Accountability Report Card for Hollingworth Elementary School Page 2 of 16
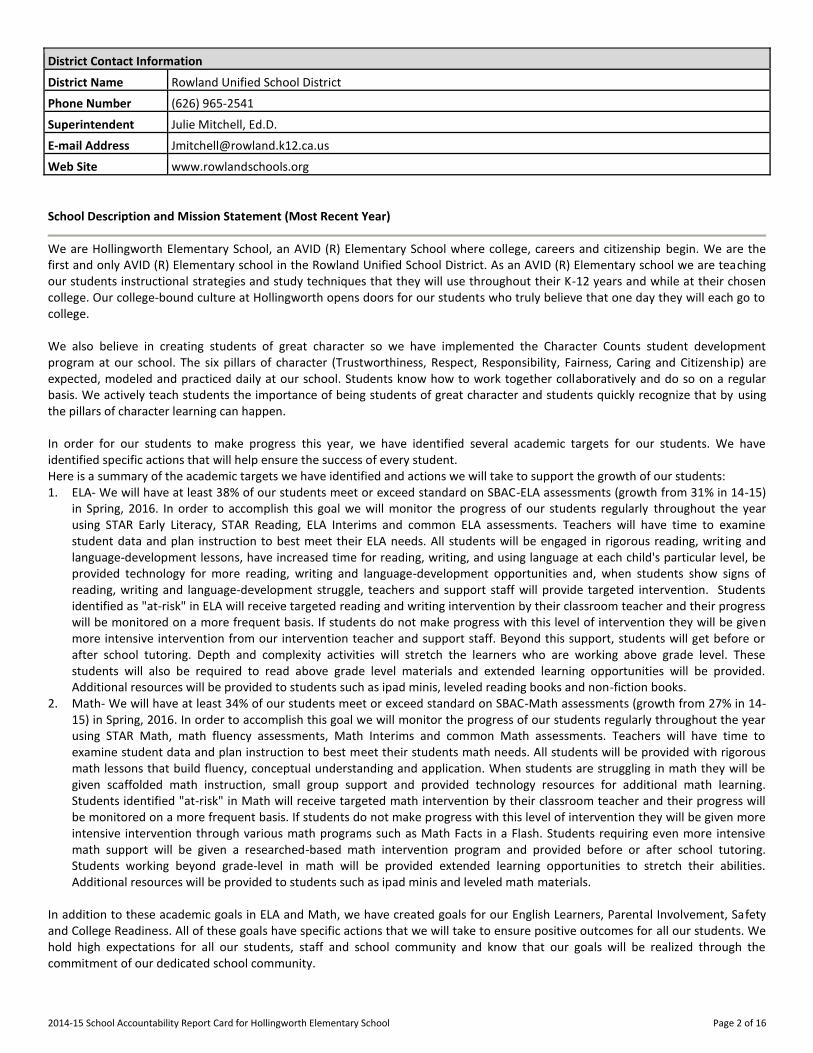
District Contact Information
District Name------- Rowland Unified School District
Phone Number------- (626) 965-2541
Superintendent------- Julie Mitchell, Ed.D.
E-mail Address------- [email protected]
Web Site------- www.rowlandschools.org
School Description and Mission Statement (Most Recent Year)
We are Hollingworth Elementary School, an AVID (R) Elementary School where college, careers and citizenship begin. We are the first and only AVID (R) Elementary school in the Rowland Unified School District. As an AVID (R) Elementary school we are teaching our students instructional strategies and study techniques that they will use throughout their K-12 years and while at their chosen college. Our college-bound culture at Hollingworth opens doors for our students who truly believe that one day they will each go to college. We also believe in creating students of great character so we have implemented the Character Counts student development program at our school. The six pillars of character (Trustworthiness, Respect, Responsibility, Fairness, Caring and Citizenship) are expected, modeled and practiced daily at our school. Students know how to work together collaboratively and do so on a regular basis. We actively teach students the importance of being students of great character and students quickly recognize that by using the pillars of character learning can happen. In order for our students to make progress this year, we have identified several academic targets for our students. We have identified specific actions that will help ensure the success of every student. Here is a summary of the academic targets we have identified and actions we will take to support the growth of our students: 1. ELA- We will have at least 38% of our students meet or exceed standard on SBAC-ELA assessments (growth from 31% in 14-15)
in Spring, 2016. In order to accomplish this goal we will monitor the progress of our students regularly throughout the year using STAR Early Literacy, STAR Reading, ELA Interims and common ELA assessments. Teachers will have time to examine student data and plan instruction to best meet their ELA needs. All students will be engaged in rigorous reading, writing and language-development lessons, have increased time for reading, writing, and using language at each child's particular level, be provided technology for more reading, writing and language-development opportunities and, when students show signs of reading, writing and language-development struggle, teachers and support staff will provide targeted intervention. Students identified as "at-risk" in ELA will receive targeted reading and writing intervention by their classroom teacher and their progress will be monitored on a more frequent basis. If students do not make progress with this level of intervention they will be given more intensive intervention from our intervention teacher and support staff. Beyond this support, students will get before or after school tutoring. Depth and complexity activities will stretch the learners who are working above grade level. These students will also be required to read above grade level materials and extended learning opportunities will be provided. Additional resources will be provided to students such as ipad minis, leveled reading books and non-fiction books.
2. Math- We will have at least 34% of our students meet or exceed standard on SBAC-Math assessments (growth from 27% in 14-15) in Spring, 2016. In order to accomplish this goal we will monitor the progress of our students regularly throughout the year using STAR Math, math fluency assessments, Math Interims and common Math assessments. Teachers will have time to examine student data and plan instruction to best meet their students math needs. All students will be provided with rigorous math lessons that build fluency, conceptual understanding and application. When students are struggling in math they will be given scaffolded math instruction, small group support and provided technology resources for additional math learning. Students identified "at-risk" in Math will receive targeted math intervention by their classroom teacher and their progress will be monitored on a more frequent basis. If students do not make progress with this level of intervention they will be given more intensive intervention through various math programs such as Math Facts in a Flash. Students requiring even more intensive math support will be given a researched-based math intervention program and provided before or after school tutoring. Students working beyond grade-level in math will be provided extended learning opportunities to stretch their abilities. Additional resources will be provided to students such as ipad minis and leveled math materials.
In addition to these academic goals in ELA and Math, we have created goals for our English Learners, Parental Involvement, Safety and College Readiness. All of these goals have specific actions that we will take to ensure positive outcomes for all our students. We hold high expectations for all our students, staff and school community and know that our goals will be realized through the commitment of our dedicated school community.
2014-15 School Accountability Report Card for Hollingworth Elementary School Page 3 of 16
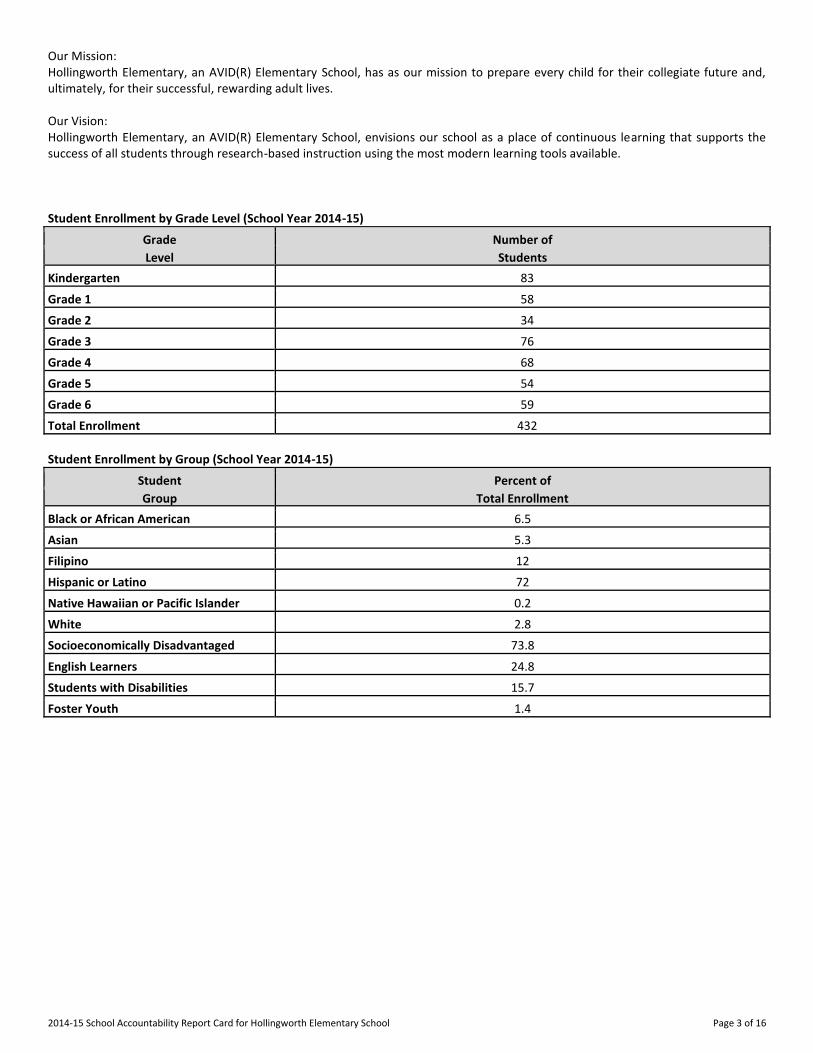
Our Mission: Hollingworth Elementary, an AVID(R) Elementary School, has as our mission to prepare every child for their collegiate future and, ultimately, for their successful, rewarding adult lives. Our Vision: Hollingworth Elementary, an AVID(R) Elementary School, envisions our school as a place of continuous learning that supports the success of all students through research-based instruction using the most modern learning tools available. Student Enrollment by Grade Level (School Year 2014-15)
Grade Number of
Level Students
Kindergarten 83
Grade 1 58
Grade 2 34
Grade 3 76
Grade 4 68
Grade 5 54
Grade 6 59
Total Enrollment 432
Student Enrollment by Group (School Year 2014-15)
Student Percent of
Group Total Enrollment
Black or African American 6.5
Asian 5.3
Filipino 12
Hispanic or Latino 72
Native Hawaiian or Pacific Islander 0.2
White 2.8
Socioeconomically Disadvantaged 73.8
English Learners 24.8
Students with Disabilities 15.7
Foster Youth 1.4
2014-15 School Accountability Report Card for Hollingworth Elementary School Page 4 of 16
A. Conditions of Learning
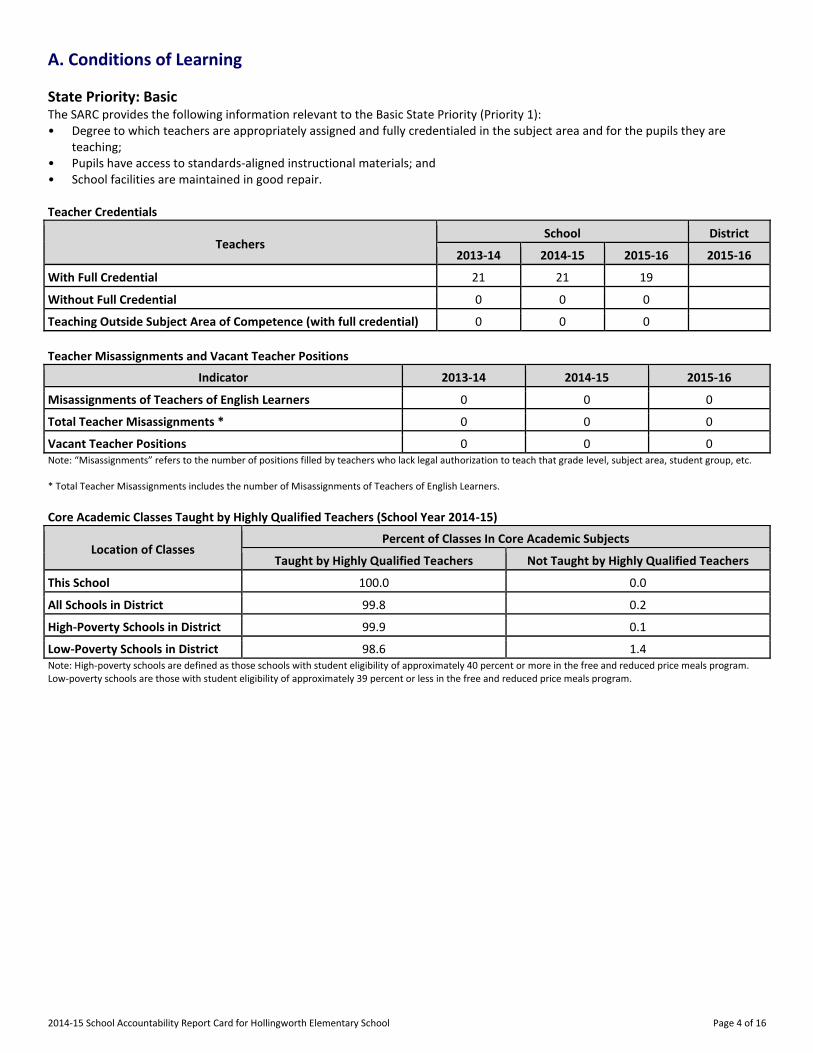
State Priority: Basic The SARC provides the following information relevant to the Basic State Priority (Priority 1): • Degree to which teachers are appropriately assigned and fully credentialed in the subject area and for the pupils they are
teaching; • Pupils have access to standards-aligned instructional materials; and • School facilities are maintained in good repair. Teacher Credentials
Teachers School District
2013-14 2014-15 2015-16 2015-16
With Full Credential 21 21 19
Without Full Credential 0 0 0
Teaching Outside Subject Area of Competence (with full credential) 0 0 0
Teacher Misassignments and Vacant Teacher Positions
Indicator 2013-14 2014-15 2015-16
Misassignments of Teachers of English Learners 0 0 0
Total Teacher Misassignments * 0 0 0
Vacant Teacher Positions 0 0 0 Note: “Misassignments” refers to the number of positions filled by teachers who lack legal authorization to teach that grade level, subject area, student group, etc. * Total Teacher Misassignments includes the number of Misassignments of Teachers of English Learners. Core Academic Classes Taught by Highly Qualified Teachers (School Year 2014-15)
Location of Classes Percent of Classes In Core Academic Subjects
Taught by Highly Qualified Teachers Not Taught by Highly Qualified Teachers
This School 100.0 0.0
All Schools in District 99.8 0.2
High-Poverty Schools in District 99.9 0.1
Low-Poverty Schools in District 98.6 1.4 Note: High-poverty schools are defined as those schools with student eligibility of approximately 40 percent or more in the free and reduced price meals program. Low-poverty schools are those with student eligibility of approximately 39 percent or less in the free and reduced price meals program.
2014-15 School Accountability Report Card for Hollingworth Elementary School Page 5 of 16
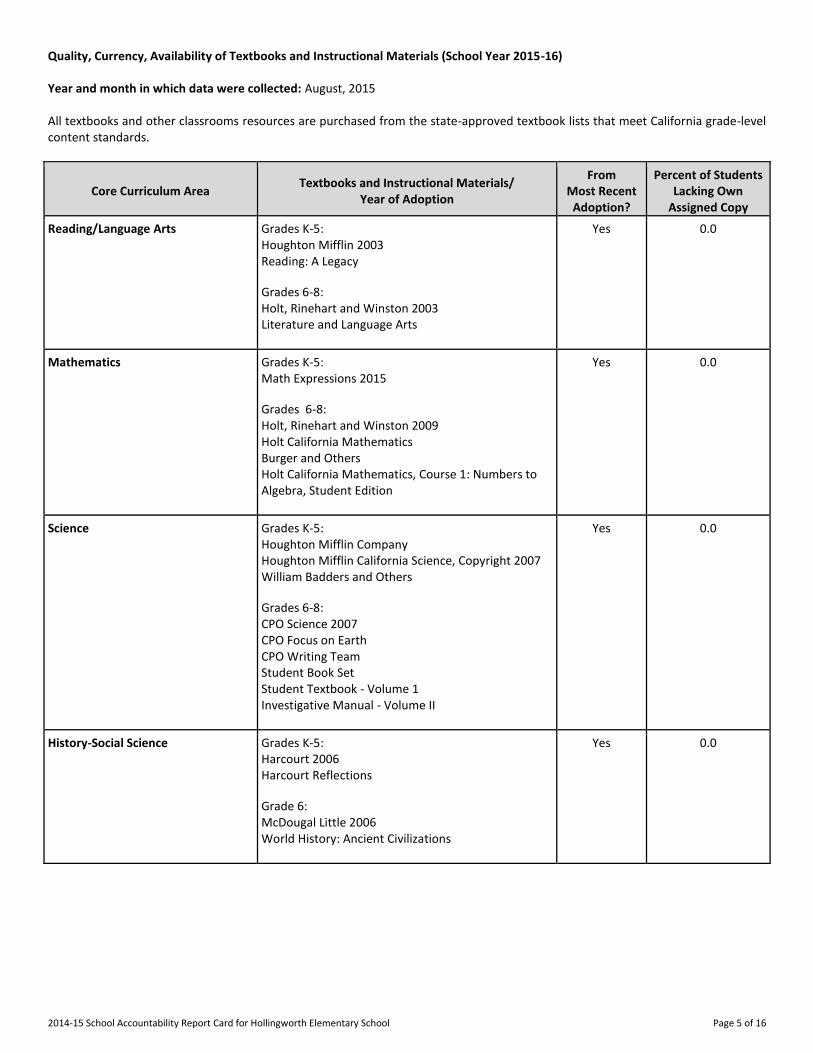
Quality, Currency, Availability of Textbooks and Instructional Materials (School Year 2015-16) Year and month in which data were collected: August, 2015 All textbooks and other classrooms resources are purchased from the state-approved textbook lists that meet California grade-level content standards.
Core Curriculum Area Textbooks and Instructional Materials/
Year of Adoption
From Most Recent
Adoption?
Percent of Students Lacking Own
Assigned Copy
Reading/Language Arts Grades K-5: Houghton Mifflin 2003
Reading: A Legacy
Grades 6-8: Holt, Rinehart and Winston 2003
Literature and Language Arts
Yes 0.0
Mathematics Grades K-5: Math Expressions 2015
Grades 6-8: Holt, Rinehart and Winston 2009
Holt California Mathematics
Burger and Others
Holt California Mathematics, Course 1: Numbers to Algebra, Student Edition
Yes 0.0
Science Grades K-5: Houghton Mifflin Company
Houghton Mifflin California Science, Copyright 2007
William Badders and Others
Grades 6-8: CPO Science 2007
CPO Focus on Earth
CPO Writing Team
Student Book Set
Student Textbook - Volume 1
Investigative Manual - Volume II
Yes 0.0
History-Social Science Grades K-5: Harcourt 2006
Harcourt Reflections
Grade 6: McDougal Little 2006
World History: Ancient Civilizations
Yes 0.0
2014-15 School Accountability Report Card for Hollingworth Elementary School Page 6 of 16
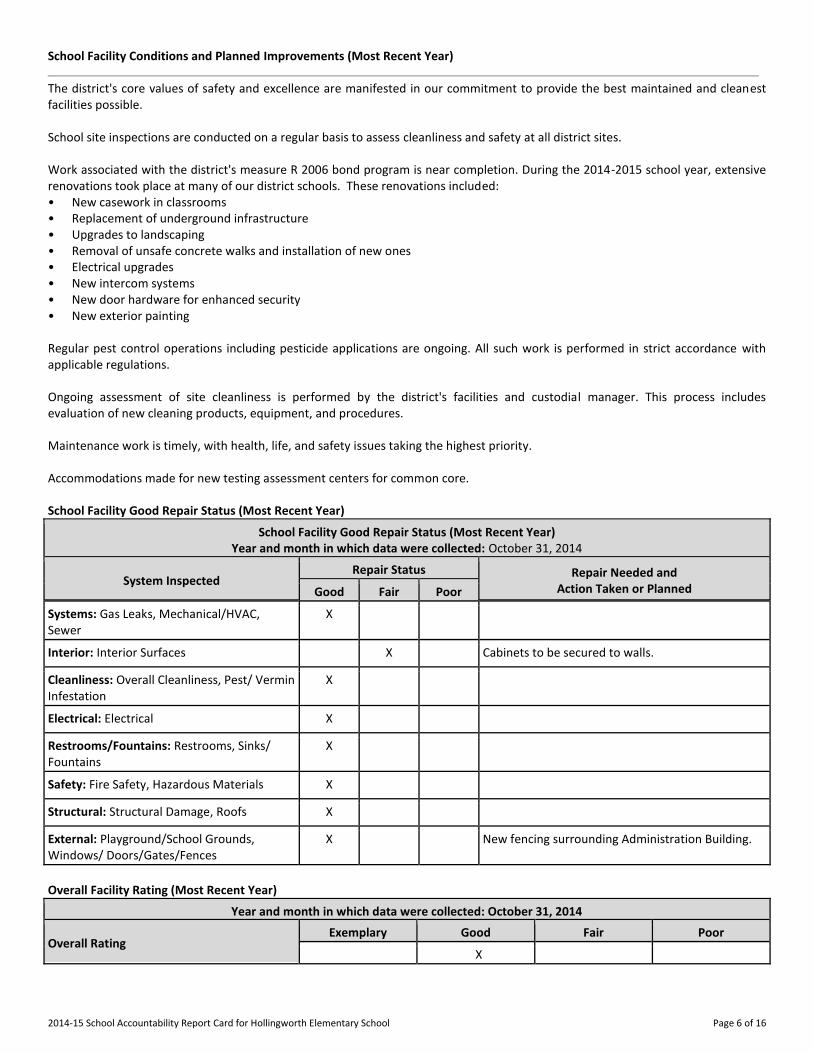
School Facility Conditions and Planned Improvements (Most Recent Year)
The district's core values of safety and excellence are manifested in our commitment to provide the best maintained and cleanest facilities possible. School site inspections are conducted on a regular basis to assess cleanliness and safety at all district sites. Work associated with the district's measure R 2006 bond program is near completion. During the 2014-2015 school year, extensive renovations took place at many of our district schools. These renovations included: • New casework in classrooms • Replacement of underground infrastructure • Upgrades to landscaping • Removal of unsafe concrete walks and installation of new ones • Electrical upgrades • New intercom systems • New door hardware for enhanced security • New exterior painting Regular pest control operations including pesticide applications are ongoing. All such work is performed in strict accordance with applicable regulations. Ongoing assessment of site cleanliness is performed by the district's facilities and custodial manager. This process includes evaluation of new cleaning products, equipment, and procedures. Maintenance work is timely, with health, life, and safety issues taking the highest priority. Accommodations made for new testing assessment centers for common core. School Facility Good Repair Status (Most Recent Year)
School Facility Good Repair Status (Most Recent Year) Year and month in which data were collected: October 31, 2014
System Inspected Repair Status Repair Needed and
Action Taken or Planned Good Fair Poor
Systems: Gas Leaks, Mechanical/HVAC, Sewer
X
Interior: Interior Surfaces X Cabinets to be secured to walls.
Cleanliness: Overall Cleanliness, Pest/ Vermin Infestation
X
Electrical: Electrical X
Restrooms/Fountains: Restrooms, Sinks/ Fountains
X
Safety: Fire Safety, Hazardous Materials X
Structural: Structural Damage, Roofs X
External: Playground/School Grounds, Windows/ Doors/Gates/Fences
X New fencing surrounding Administration Building.
Overall Facility Rating (Most Recent Year)
Year and month in which data were collected: October 31, 2014
Overall Rating Exemplary Good Fair Poor
X
2014-15 School Accountability Report Card for Hollingworth Elementary School Page 7 of 16
B. Pupil Outcomes
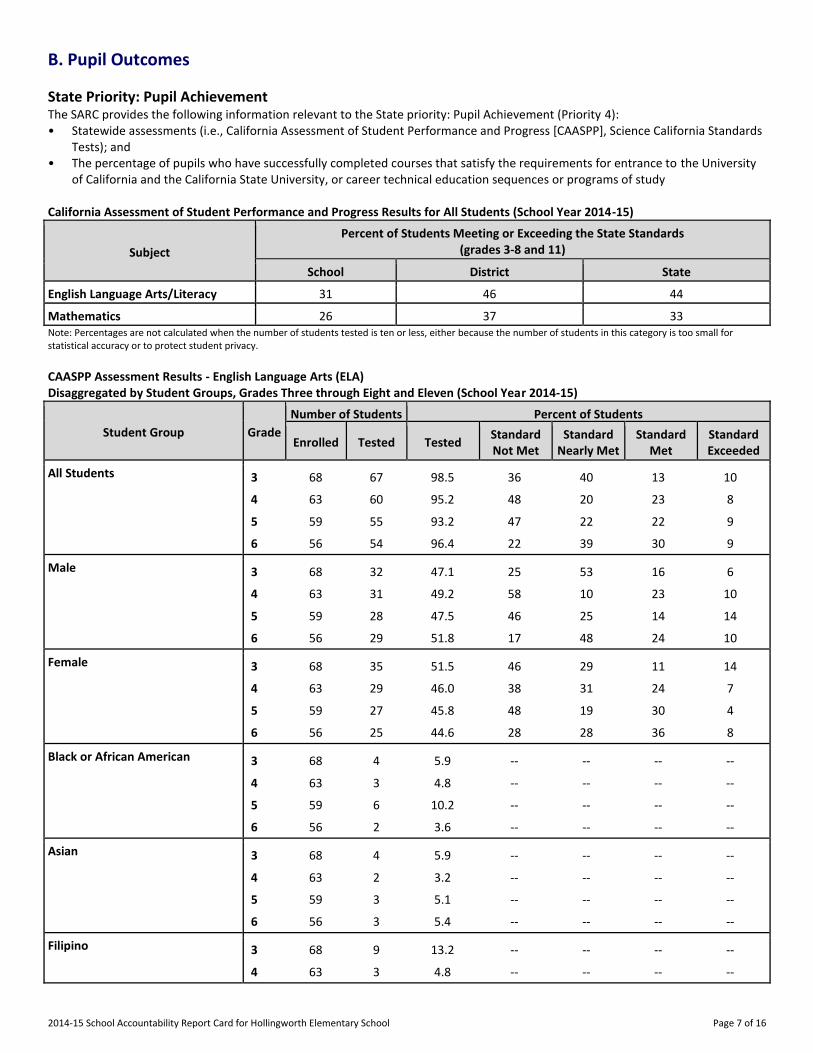
State Priority: Pupil Achievement The SARC provides the following information relevant to the State priority: Pupil Achievement (Priority 4): • Statewide assessments (i.e., California Assessment of Student Performance and Progress [CAASPP], Science California Standards
Tests); and • The percentage of pupils who have successfully completed courses that satisfy the requirements for entrance to the University
of California and the California State University, or career technical education sequences or programs of study California Assessment of Student Performance and Progress Results for All Students (School Year 2014-15)
Subject
Percent of Students Meeting or Exceeding the State Standards (grades 3-8 and 11)
School District State
English Language Arts/Literacy 31 46 44
Mathematics 26 37 33 Note: Percentages are not calculated when the number of students tested is ten or less, either because the number of students in this category is too small for statistical accuracy or to protect student privacy.
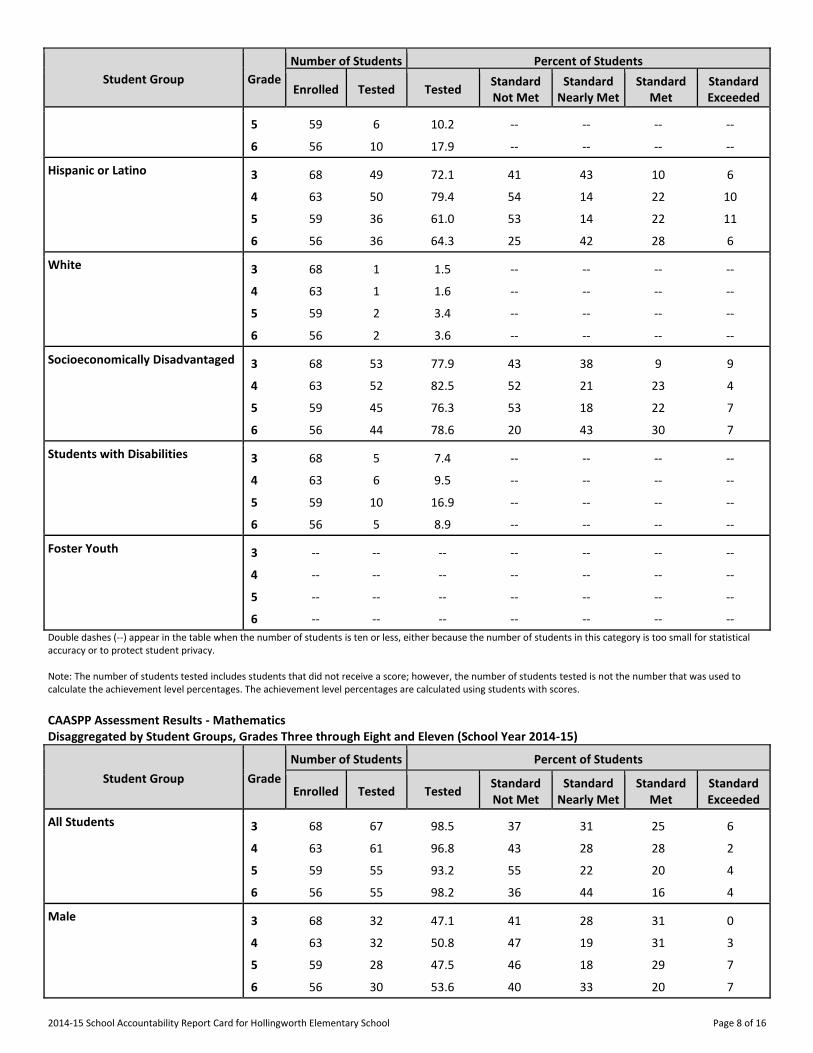
CAASPP Assessment Results - English Language Arts (ELA) Disaggregated by Student Groups, Grades Three through Eight and Eleven (School Year 2014-15)
Student Group Grade
Number of Students Percent of Students
Enrolled Tested Tested Standard Not Met
Standard Nearly Met
Standard Met
Standard Exceeded
All Students 3 68 67 98.5 36 40 13 10
4 63 60 95.2 48 20 23 8
5 59 55 93.2 47 22 22 9
6 56 54 96.4 22 39 30 9
Male 3 68 32 47.1 25 53 16 6
4 63 31 49.2 58 10 23 10
5 59 28 47.5 46 25 14 14
6 56 29 51.8 17 48 24 10
Female 3 68 35 51.5 46 29 11 14
4 63 29 46.0 38 31 24 7
5 59 27 45.8 48 19 30 4
6 56 25 44.6 28 28 36 8
Black or African American 3 68 4 5.9 -- -- -- --
4 63 3 4.8 -- -- -- --
5 59 6 10.2 -- -- -- --
6 56 2 3.6 -- -- -- --
Asian 3 68 4 5.9 -- -- -- --
4 63 2 3.2 -- -- -- --
5 59 3 5.1 -- -- -- --
6 56 3 5.4 -- -- -- --
Filipino 3 68 9 13.2 -- -- -- --
4 63 3 4.8 -- -- -- --
2014-15 School Accountability Report Card for Hollingworth Elementary School Page 8 of 16
Student Group Grade
Number of Students Percent of Students
Enrolled Tested Tested Standard Not Met
Standard Nearly Met
Standard Met
Standard Exceeded
5 59 6 10.2 -- -- -- --
6 56 10 17.9 -- -- -- --
Hispanic or Latino 3 68 49 72.1 41 43 10 6
4 63 50 79.4 54 14 22 10
5 59 36 61.0 53 14 22 11
6 56 36 64.3 25 42 28 6
White 3 68 1 1.5 -- -- -- --
4 63 1 1.6 -- -- -- --
5 59 2 3.4 -- -- -- --
6 56 2 3.6 -- -- -- --
Socioeconomically Disadvantaged 3 68 53 77.9 43 38 9 9
4 63 52 82.5 52 21 23 4
5 59 45 76.3 53 18 22 7
6 56 44 78.6 20 43 30 7
Students with Disabilities 3 68 5 7.4 -- -- -- --
4 63 6 9.5 -- -- -- --
5 59 10 16.9 -- -- -- --
6 56 5 8.9 -- -- -- --
Foster Youth 3 -- -- -- -- -- -- --
4 -- -- -- -- -- -- --
5 -- -- -- -- -- -- --
6 -- -- -- -- -- -- --
Double dashes (--) appear in the table when the number of students is ten or less, either because the number of students in this category is too small for statistical accuracy or to protect student privacy. Note: The number of students tested includes students that did not receive a score; however, the number of students tested is not the number that was used to calculate the achievement level percentages. The achievement level percentages are calculated using students with scores.
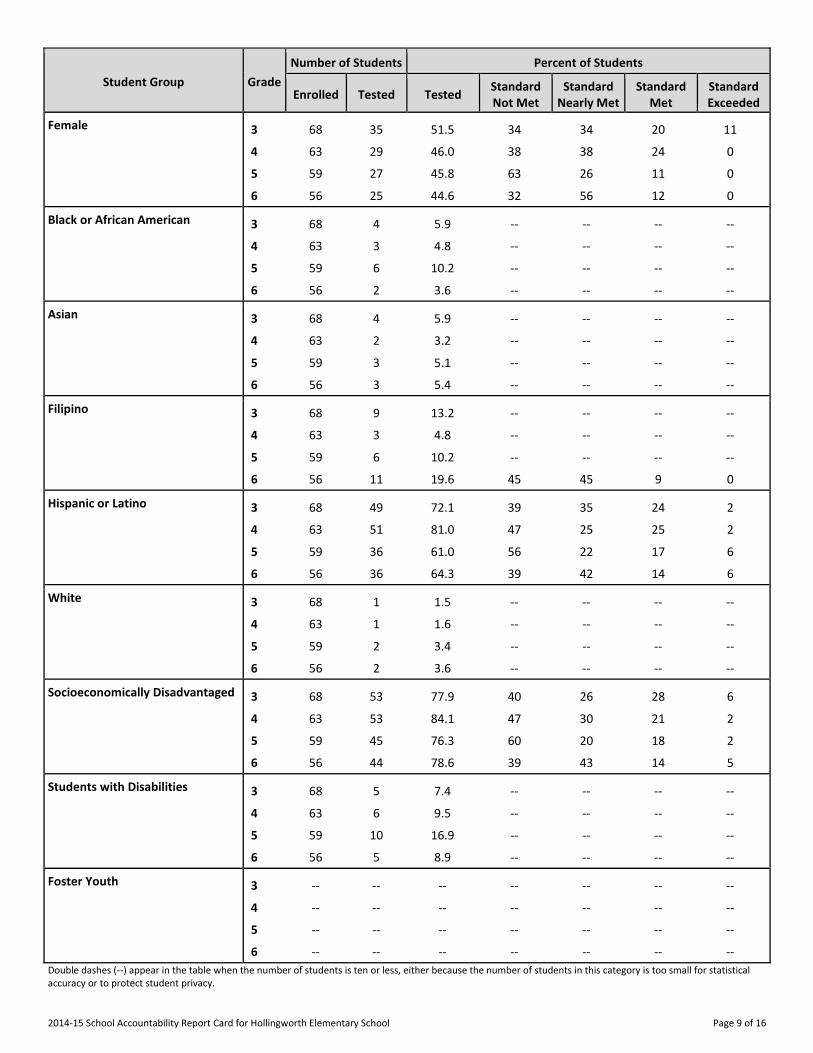
CAASPP Assessment Results - Mathematics Disaggregated by Student Groups, Grades Three through Eight and Eleven (School Year 2014-15)
Student Group Grade
Number of Students Percent of Students
Enrolled Tested Tested Standard Not Met
Standard Nearly Met
Standard Met
Standard Exceeded
All Students 3 68 67 98.5 37 31 25 6
4 63 61 96.8 43 28 28 2
5 59 55 93.2 55 22 20 4
6 56 55 98.2 36 44 16 4
Male 3 68 32 47.1 41 28 31 0
4 63 32 50.8 47 19 31 3
5 59 28 47.5 46 18 29 7
6 56 30 53.6 40 33 20 7
2014-15 School Accountability Report Card for Hollingworth Elementary School Page 9 of 16
Student Group Grade
Number of Students Percent of Students
Enrolled Tested Tested Standard Not Met
Standard Nearly Met
Standard Met
Standard Exceeded
Female 3 68 35 51.5 34 34 20 11
4 63 29 46.0 38 38 24 0
5 59 27 45.8 63 26 11 0
6 56 25 44.6 32 56 12 0
Black or African American 3 68 4 5.9 -- -- -- --
4 63 3 4.8 -- -- -- --
5 59 6 10.2 -- -- -- --
6 56 2 3.6 -- -- -- --
Asian 3 68 4 5.9 -- -- -- --
4 63 2 3.2 -- -- -- --
5 59 3 5.1 -- -- -- --
6 56 3 5.4 -- -- -- --
Filipino 3 68 9 13.2 -- -- -- --
4 63 3 4.8 -- -- -- --
5 59 6 10.2 -- -- -- --
6 56 11 19.6 45 45 9 0
Hispanic or Latino 3 68 49 72.1 39 35 24 2
4 63 51 81.0 47 25 25 2
5 59 36 61.0 56 22 17 6
6 56 36 64.3 39 42 14 6
White 3 68 1 1.5 -- -- -- --
4 63 1 1.6 -- -- -- --
5 59 2 3.4 -- -- -- --
6 56 2 3.6 -- -- -- --
Socioeconomically Disadvantaged 3 68 53 77.9 40 26 28 6
4 63 53 84.1 47 30 21 2
5 59 45 76.3 60 20 18 2
6 56 44 78.6 39 43 14 5
Students with Disabilities 3 68 5 7.4 -- -- -- --
4 63 6 9.5 -- -- -- --
5 59 10 16.9 -- -- -- --
6 56 5 8.9 -- -- -- --
Foster Youth 3 -- -- -- -- -- -- --
4 -- -- -- -- -- -- --
5 -- -- -- -- -- -- --
6 -- -- -- -- -- -- --
Double dashes (--) appear in the table when the number of students is ten or less, either because the number of students in this category is too small for statistical accuracy or to protect student privacy.
2014-15 School Accountability Report Card for Hollingworth Elementary School Page 10 of 16
Note: The number of students tested includes students that did not receive a score; however, the number of students tested is not the number that was used to calculate the achievement level percentages. The achievement level percentages are calculated using students with scores.
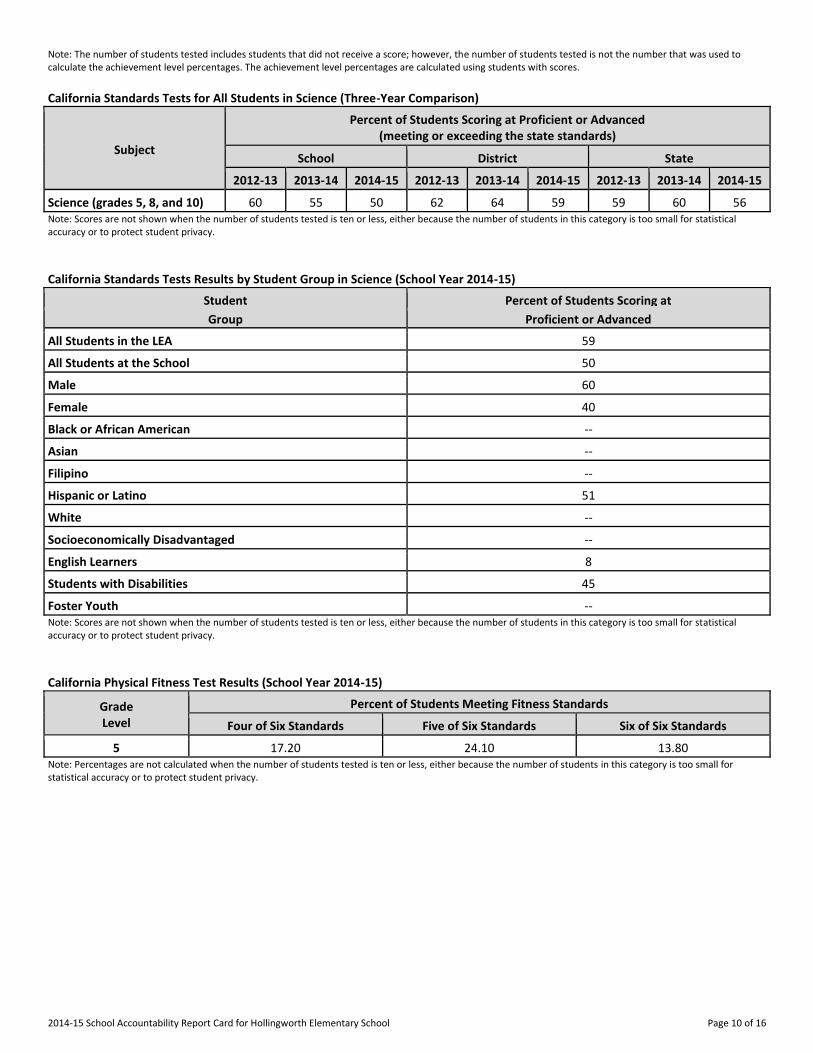
California Standards Tests for All Students in Science (Three-Year Comparison)
Subject
Percent of Students Scoring at Proficient or Advanced (meeting or exceeding the state standards)
School District State
2012-13 2013-14 2014-15 2012-13 2013-14 2014-15 2012-13 2013-14 2014-15
Science (grades 5, 8, and 10) 60 55 50 62 64 59 59 60 56 Note: Scores are not shown when the number of students tested is ten or less, either because the number of students in this category is too small for statistical accuracy or to protect student privacy.
California Standards Tests Results by Student Group in Science (School Year 2014-15)
Student Percent of Students Scoring at
Group Proficient or Advanced
All Students in the LEA 59
All Students at the School 50
Male 60
Female 40
Black or African American --
Asian --
Filipino --
Hispanic or Latino 51
White --
Socioeconomically Disadvantaged --
English Learners 8
Students with Disabilities 45
Foster Youth -- Note: Scores are not shown when the number of students tested is ten or less, either because the number of students in this category is too small for statistical accuracy or to protect student privacy.
California Physical Fitness Test Results (School Year 2014-15)
Grade Level
Percent of Students Meeting Fitness Standards
Four of Six Standards Five of Six Standards Six of Six Standards
---5--- 17.20 24.10 13.80 Note: Percentages are not calculated when the number of students tested is ten or less, either because the number of students in this category is too small for statistical accuracy or to protect student privacy.
2014-15 School Accountability Report Card for Hollingworth Elementary School Page 11 of 16
C. Engagement
State Priority: Parental Involvement The SARC provides the following information relevant to the Parental Involvement State Priority (Priority 3): • Efforts the school district makes to seek parent input in making decisions for the school district and each schoolsite. Opportunities for Parental Involvement (Most Recent Year)
We truly believe in strong home and school collaboration and commitments. We encourage all parents/guardians to become active members of our school community and provide many opportunities for parents/guardians to be involved. As a child's first and most important teachers, parents/guardians are encouraged to play a vital role at our school. Parents/guardians are involved and supported as participants in home-learning activities, including supervising assigned homework, daily reading, and family discussions that reinforce or enrich children's classroom learning. Parents/guardians are invited to support their children by attending parent conferences, learning workshops, student performances, parent meetings or events, assemblies and sports events. We communicate parental involvement opportunities though parent volunteer opportunity meetings, flyers home to parents/guardians, phone calls encouraging participation to school events and by making personal contact daily with parents/guardians on campus. Programs and opportunities for parent involvement include: • Hollingworth PTO (Parent Teacher Organization) is dedicated to promoting our students' well-being and personal success
through strong parent, family, and community involvement, sponsored activities and fundraising. Our HPTO brings into closer relation the home and the school as Hollingworth's parents, teachers and staff work together on behalf of all our students.
• School Site Council, English Learner Advisory Committee, GATE Parent Advisory Committee: The school site council and advisory
committees play an important role in decision-making, providing input on goals of the school and evaluating the school's progress toward those goals.
• FOR US Foundation: The FOR US Foundation is a non-profit educational foundation that raises fund for RUSD schools. Each year,
funds are provided for teacher grants for innovative classroom projects, field trips and academic enrichment activities. • Watch DOGS (Dads Of Great Students)- Bringing male role models to our campus to promote learning and safety. • Recess and Lunch Volunteers- Parents can sign up to help out during recess or lunch. Oftentimes, this gives parents a good
perspective about the school, child's friends and the daily life students lead while at Hollingworth. • Classroom volunteers- We encourage parents to come into classrooms to learn about classroom instruction and to assist with
activities in the classrooms. • Library volunteers- Parents help support our library by shelving books, helping students find books at their reading level and by
working with our school librarian to make our library an outstanding place that supports literacy. Parents our an invaluable resource to the success of our students and we encourage every parent/guardian to be involved at our school.

2014-15 School Accountability Report Card for Hollingworth Elementary School Page 12 of 16
State Priority: School Climate The SARC provides the following information relevant to the School Climate State Priority (Priority 6): • Pupil suspension rates; • Pupil expulsion rates; and • Other local measures on the sense of safety. Suspensions and Expulsions
Rate School District State
2012-13 2013-14 2014-15 2012-13 2013-14 2014-15 2012-13 2013-14 2014-15
Suspensions------- 1.55 0.96 1.86 4.32 3.80 2.56 5.07 4.36 3.80
Expulsions------- 0.00 0.00 0.00 0.00 0.00 0.00 0.13 0.10 0.09
School Safety Plan (Most Recent Year)
Once again, the California Department of Education's Safe Schools Assessment Program has designated Rowland Unified as among the safest school districts in the East San Gabriel Valley. As one of the district's core values, student and staff safety is kept in the forefront of all decision-making. Hollingworth's Safety Plan was reviewed, updated and discussed with school faculty in October of 2014 prior to the annual state wide earthquake drill and school advisory boards and councils in January of 2015. In addition to maintaining closed campuses that are secured with fencing, schools are carefully monitored by campus police officers - before, during and after school. An up-to-date phone system, fire alarm, security cameras, intercom and other communications systems have been installed at all schools. The phone system gives teachers the ability to make outside calls to parents, and emergency support services when needed. Check-in procedures, combined with one-way access through the school office, limit the number of visitors on campus. A parent sign-in and sign-out procedure assures student safety. Our commitment to safety is further evidenced by: • Strong partnerships with law enforcement agencies through Operation Safe Community. • Ongoing training and practice drills keep staff attuned to crisis warning signs. • Specially trained canine units - that can detect even the minutest traces of drugs, gunpowder, and other illegal substances -
regularly inspect classrooms, desks and lockers to deter students from negative activity. • Campus peace officers patrol schools and District facilities before, during and after school at all school and/or District-sponsored
events. • All campuses are closed; security fencing ensures students are safe and secure on school grounds. Check-in procedures,
combined with one-way access through the school office, limit the number of visitors on campus. • School site safety plans safeguard the well being of students and staff. All schools maintain safety plans and conduct routine
safety drills and maintain emergency supplies for students and staff. • New phone, fire alarm, intercom and other communications systems have been installed at all schools. The new phones allow
teachers to call outside numbers - including 911 - in the event of an emergency. • Strictly enforced dress code policies keep students focused on the business of learning. • Thanks to the passage of Measure R, a $70 million general obligation bond, the district will continue to invest in safety
improvements on all campuses. Modernization efforts include the removal of asbestos, the addition of exterior safety lighting, the replacement of fencing, the installation of new communications systems, and the installation of security cameras
2014-15 School Accountability Report Card for Hollingworth Elementary School Page 13 of 16
D. Other SARC Information
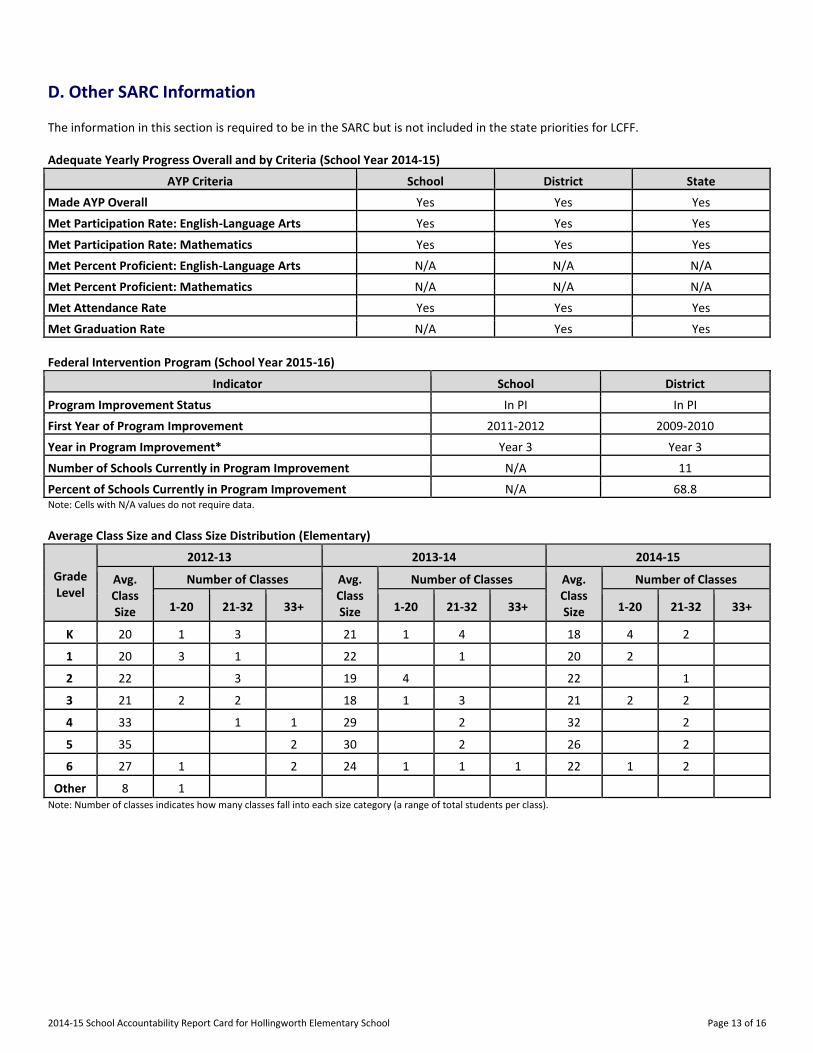
The information in this section is required to be in the SARC but is not included in the state priorities for LCFF. Adequate Yearly Progress Overall and by Criteria (School Year 2014-15)
AYP Criteria School District State
Made AYP Overall Yes Yes Yes
Met Participation Rate: English-Language Arts Yes Yes Yes
Met Participation Rate: Mathematics Yes Yes Yes
Met Percent Proficient: English-Language Arts N/A N/A N/A
Met Percent Proficient: Mathematics N/A N/A N/A
Met Attendance Rate Yes Yes Yes
Met Graduation Rate N/A Yes Yes
Federal Intervention Program (School Year 2015-16)
Indicator School District
Program Improvement Status In PI In PI
First Year of Program Improvement 2011-2012 2009-2010
Year in Program Improvement* Year 3 Year 3
Number of Schools Currently in Program Improvement N/A 11
Percent of Schools Currently in Program Improvement N/A 68.8 Note: Cells with N/A values do not require data.
Average Class Size and Class Size Distribution (Elementary)
Grade Level
2012-13 2013-14 2014-15
Avg. Class Size
Number of Classes Avg. Class Size
Number of Classes Avg. Class Size
Number of Classes
1-20 21-32 33+ 1-20 21-32 33+ 1-20 21-32 33+
K
20 1 3 21 1 4 18 4 2
1
20 3 1 22 1 20 2
2
22 3 19 4 22 1
3
21 2 2 18 1 3 21 2 2
4
33 1 1 29 2 32 2
5
35 2 30 2 26 2
6
27 1 2 24 1 1 1 22 1 2
Other
8 1 Note: Number of classes indicates how many classes fall into each size category (a range of total students per class).
2014-15 School Accountability Report Card for Hollingworth Elementary School Page 14 of 16
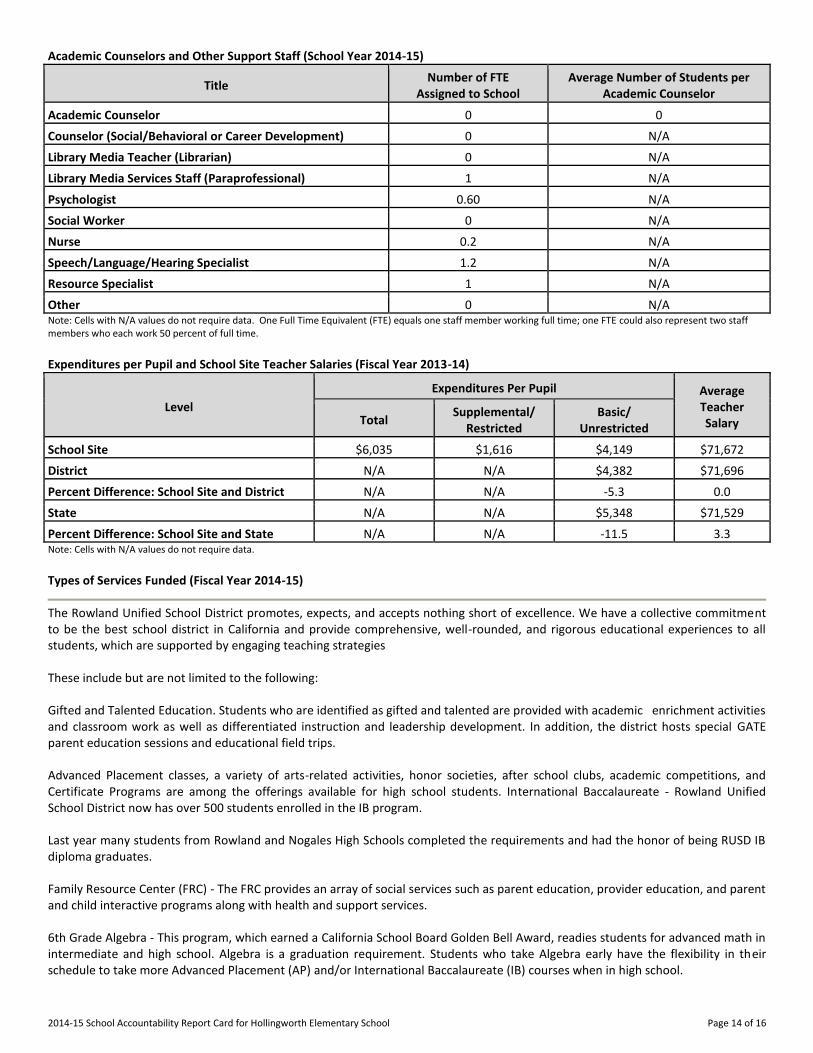
Academic Counselors and Other Support Staff (School Year 2014-15)
Title Number of FTE
Assigned to School Average Number of Students per
Academic Counselor
Academic Counselor------- 0 0
Counselor (Social/Behavioral or Career Development) 0 N/A
Library Media Teacher (Librarian) 0 N/A
Library Media Services Staff (Paraprofessional) 1 N/A
Psychologist------- 0.60 N/A
Social Worker------- 0 N/A
Nurse------- 0.2 N/A
Speech/Language/Hearing Specialist 1.2 N/A
Resource Specialist------- 1 N/A
Other------- 0 N/A Note: Cells with N/A values do not require data. One Full Time Equivalent (FTE) equals one staff member working full time; one FTE could also represent two staff members who each work 50 percent of full time.
Expenditures per Pupil and School Site Teacher Salaries (Fiscal Year 2013-14)
Level
Expenditures Per Pupil Average Teacher Salary Total
Supplemental/ Restricted
Basic/ Unrestricted
School Site------- $6,035 $1,616 $4,149 $71,672
District------- N/A N/A $4,382 $71,696
Percent Difference: School Site and District N/A N/A -5.3 0.0
State------- N/A N/A $5,348 $71,529
Percent Difference: School Site and State N/A N/A -11.5 3.3 Note: Cells with N/A values do not require data.
Types of Services Funded (Fiscal Year 2014-15)
The Rowland Unified School District promotes, expects, and accepts nothing short of excellence. We have a collective commitment to be the best school district in California and provide comprehensive, well-rounded, and rigorous educational experiences to all students, which are supported by engaging teaching strategies These include but are not limited to the following: Gifted and Talented Education. Students who are identified as gifted and talented are provided with academic enrichment activities and classroom work as well as differentiated instruction and leadership development. In addition, the district hosts special GATE parent education sessions and educational field trips. Advanced Placement classes, a variety of arts-related activities, honor societies, after school clubs, academic competitions, and Certificate Programs are among the offerings available for high school students. International Baccalaureate - Rowland Unified School District now has over 500 students enrolled in the IB program. Last year many students from Rowland and Nogales High Schools completed the requirements and had the honor of being RUSD IB diploma graduates. Family Resource Center (FRC) - The FRC provides an array of social services such as parent education, provider education, and parent and child interactive programs along with health and support services. 6th Grade Algebra - This program, which earned a California School Board Golden Bell Award, readies students for advanced math in intermediate and high school. Algebra is a graduation requirement. Students who take Algebra early have the flexibility in their schedule to take more Advanced Placement (AP) and/or International Baccalaureate (IB) courses when in high school.
2014-15 School Accountability Report Card for Hollingworth Elementary School Page 15 of 16
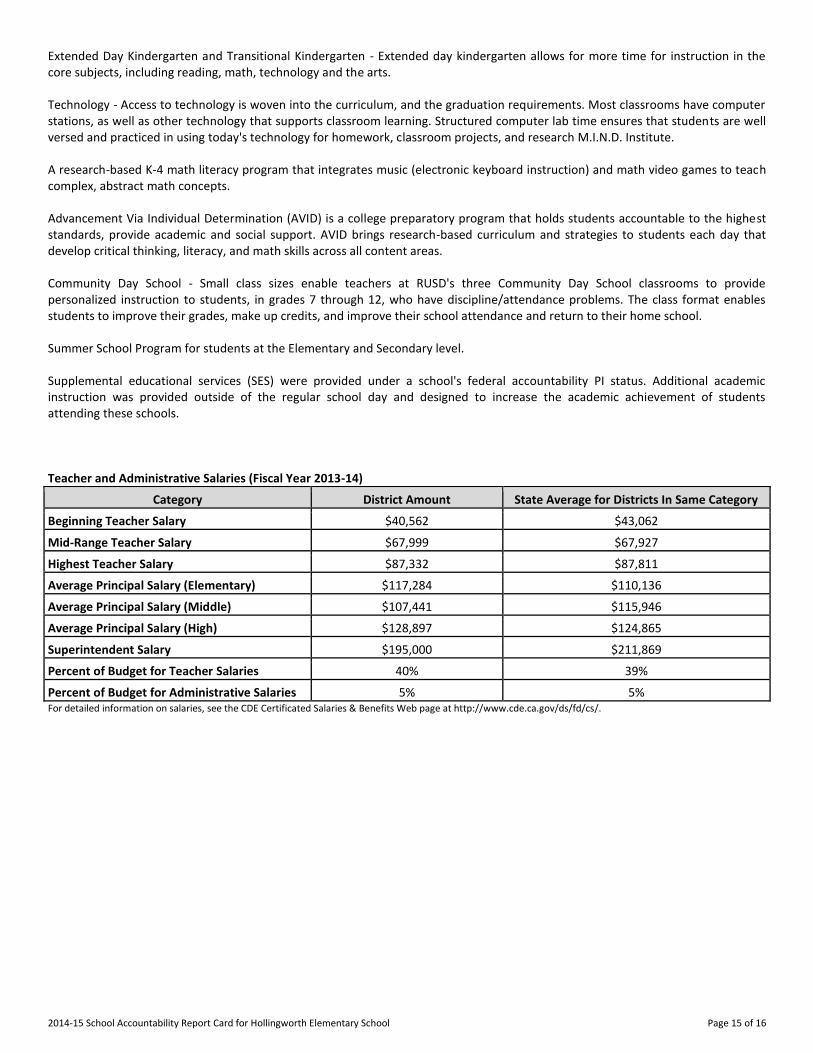
Extended Day Kindergarten and Transitional Kindergarten - Extended day kindergarten allows for more time for instruction in the core subjects, including reading, math, technology and the arts. Technology - Access to technology is woven into the curriculum, and the graduation requirements. Most classrooms have computer stations, as well as other technology that supports classroom learning. Structured computer lab time ensures that students are well versed and practiced in using today's technology for homework, classroom projects, and research M.I.N.D. Institute. A research-based K-4 math literacy program that integrates music (electronic keyboard instruction) and math video games to teach complex, abstract math concepts. Advancement Via Individual Determination (AVID) is a college preparatory program that holds students accountable to the highest standards, provide academic and social support. AVID brings research-based curriculum and strategies to students each day that develop critical thinking, literacy, and math skills across all content areas. Community Day School - Small class sizes enable teachers at RUSD's three Community Day School classrooms to provide personalized instruction to students, in grades 7 through 12, who have discipline/attendance problems. The class format enables students to improve their grades, make up credits, and improve their school attendance and return to their home school. Summer School Program for students at the Elementary and Secondary level. Supplemental educational services (SES) were provided under a school's federal accountability PI status. Additional academic instruction was provided outside of the regular school day and designed to increase the academic achievement of students attending these schools. Teacher and Administrative Salaries (Fiscal Year 2013-14)
Category District Amount State Average for Districts In Same Category
Beginning Teacher Salary $40,562 $43,062
Mid-Range Teacher Salary $67,999 $67,927
Highest Teacher Salary $87,332 $87,811
Average Principal Salary (Elementary) $117,284 $110,136
Average Principal Salary (Middle) $107,441 $115,946
Average Principal Salary (High) $128,897 $124,865
Superintendent Salary $195,000 $211,869
Percent of Budget for Teacher Salaries 40% 39%
Percent of Budget for Administrative Salaries 5% 5% For detailed information on salaries, see the CDE Certificated Salaries & Benefits Web page at http://www.cde.ca.gov/ds/fd/cs/.
2014-15 School Accountability Report Card for Hollingworth Elementary School Page 16 of 16
Professional Development (Most Recent Three Years)
The Rowland Unified School District’s major areas of focus for professional development are the District’s Essential Priorities for Teaching and Learning: Strengthen Best First Instruction and RTI 2, Implement districtwide agreements about efficacious instruction, Build cultural proficiency across the system to foster and sustain literacy improvement for whole systems change. The major professional development initiatives include focusing on 21st century skills as the overarching premise while developing the following: • Unpacking the Common Core State Standards • English Language Development Standards • Specially Designed Academic Instruction in English • Unpacking the Next Generation Science Standards • Balanced Literacy • Exploration of the Framework for Efficacious Instruction • Using Data & Collaborative Inquiry • Interim Assessment and Digital Library • Response to Instruction and Intervention RTI2 • OARS and SBAC Training • Instructional Rounds • Thinking Maps-Path to Proficiency • New Teacher Support • Writing Workshop • READ and MATH 180 Interventions • Edge & Inside Curriculum Training • Advancement Via Individual Determination Program training The professional learning described includes processes and structures to promote organizational learning and connectedness. School Instructional Leadership teams that include administrators and teachers from each school site TK-12, meet throughout the school year in all day meetings to lead the learning of the district priorities and design opportunities for learning at each school site to implement the goals of each initiative. Instructional coaches support TK-12 teachers, site teams, and site leadership with modeling of lessons, supporting through the coaching cycle, planning lessons, reflecting on lessons after delivery, lesson design, and incorporating best practices and research based effective learning strategies.