Embed Size (px)
Citation preview
Bovis Homes Group PLC Page 1
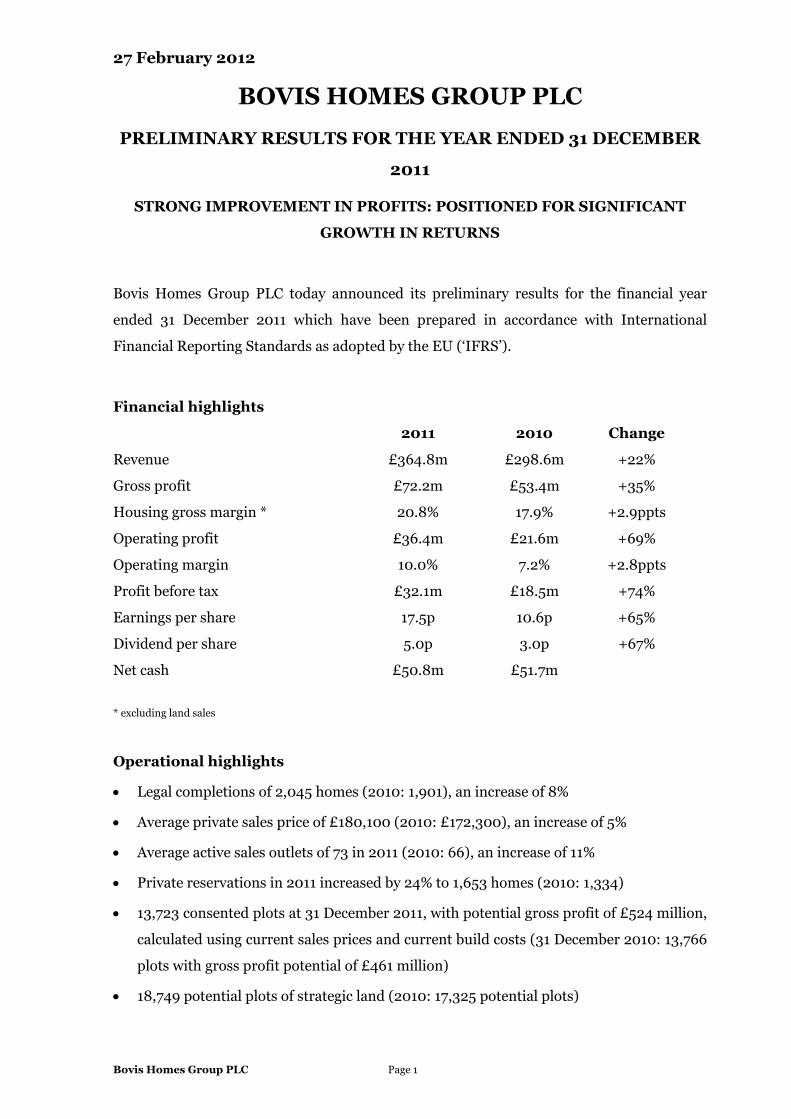
27 February 2012
BOVIS HOMES GROUP PLC PRELIMINARY RESULTS FOR THE YEAR ENDED 31 DECEMBER
2011
STRONG IMPROVEMENT IN PROFITS: POSITIONED FOR SIGNIFICANT
GROWTH IN RETURNS
Bovis Homes Group PLC today announced its preliminary results for the financial year
ended 31 December 2011 which have been prepared in accordance with International
Financial Reporting Standards as adopted by the EU (‘IFRS’).
Financial highlights
2011
2010
Change
Revenue £364.8m £298.6m +22%
Gross profit £72.2m £53.4m +35%
Housing gross margin * 20.8% 17.9% +2.9ppts
Operating profit £36.4m £21.6m +69%
Operating margin 10.0% 7.2% +2.8ppts
Profit before tax £32.1m £18.5m +74%
Earnings per share 17.5p 10.6p +65%
Dividend per share 5.0p 3.0p +67%
Net cash £50.8m £51.7m
* excluding land sales
Operational highlights
• Legal completions of 2,045 homes (2010: 1,901), an increase of 8%
• Average private sales price of £180,100 (2010: £172,300), an increase of 5%
• Average active sales outlets of 73 in 2011 (2010: 66), an increase of 11%
• Private reservations in 2011 increased by 24% to 1,653 homes (2010: 1,334)
• 13,723 consented plots at 31 December 2011, with potential gross profit of £524 million,
calculated using current sales prices and current build costs (31 December 2010: 13,766
plots with gross profit potential of £461 million)
• 18,749 potential plots of strategic land (2010: 17,325 potential plots)
Bovis Homes Group PLC Page 2
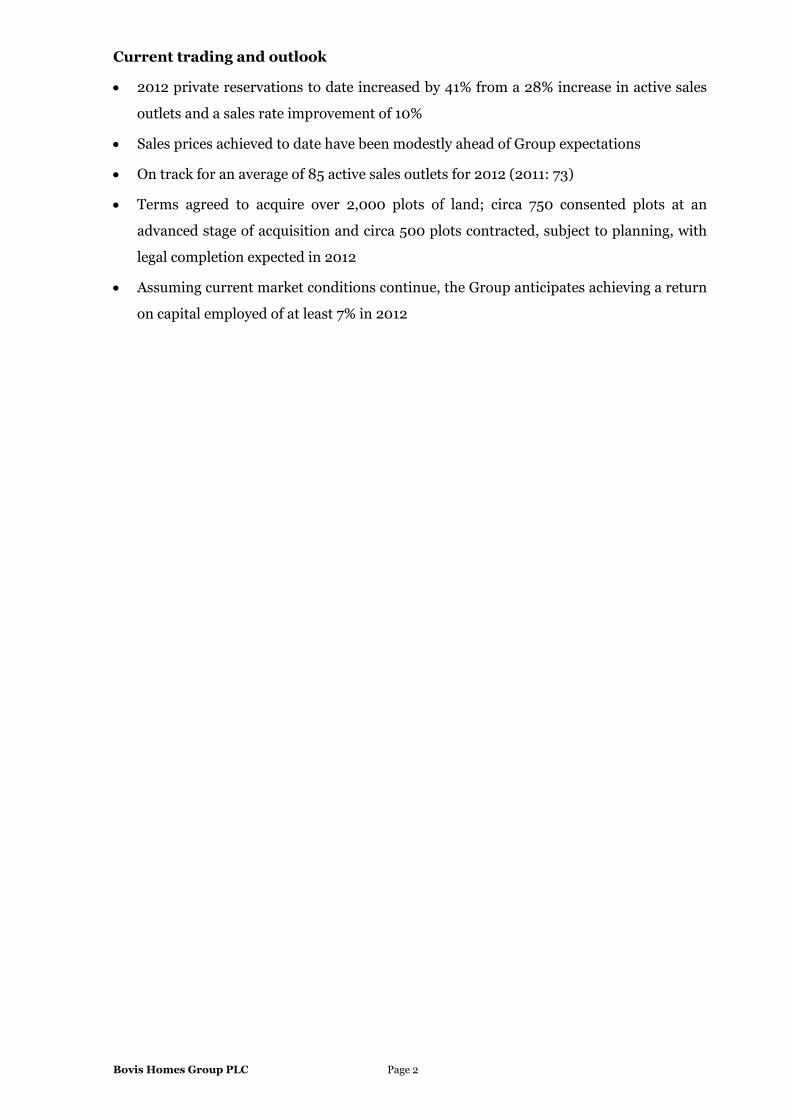
Current trading and outlook
• 2012 private reservations to date increased by 41% from a 28% increase in active sales
outlets and a sales rate improvement of 10%
• Sales prices achieved to date have been modestly ahead of Group expectations
• On track for an average of 85 active sales outlets for 2012 (2011: 73)
• Terms agreed to acquire over 2,000 plots of land; circa 750 consented plots at an
advanced stage of acquisition and circa 500 plots contracted, subject to planning, with
legal completion expected in 2012
• Assuming current market conditions continue, the Group anticipates achieving a return
on capital employed of at least 7% in 2012
Bovis Homes Group PLC Page 3
Commenting on the results, David Ritchie, the Chief Executive of Bovis Homes
Group PLC said:
“The Group has delivered a strong improvement in profit in 2011 against a challenging but
stable market environment. This profit improvement has been delivered through the
compound positive effect of increased volumes, improved sales prices and stronger
margins.
“Significant progress has also been made in positioning the Group for continued improving
returns. The substantial land investment in recent years will deliver a strong increase in
active sales outlets in 2012. Based on a continuation of current market conditions, this will
further enhance volumes, sales prices and profit margins.
“As well as driving profitability, the Group is focused on enhancing shareholder returns
through improving the efficiency of its capital employed, through land bank management,
including the sale of consented plots on selected sites, and by managing working capital
tightly.
“Looking forward, based on current market conditions continuing, increasing profits
combined with further improvements in the use of capital will deliver a strongly increasing
return on capital employed in 2012 and beyond.
“I would like to recognise the considerable effort, commitment and hard work of our
employees during 2011 and to thank them all for their contribution to the Group’s success.”
Enquiries: David Ritchie, Chief Executive Results issued by Andrew Jaques/Reg Hoare/ Jonathan Hill, Finance Director James White Bovis Homes Group PLC MHP Communications On 27 February –
tel: 07855 432 699
On 27 February -
tel: 020 3128 8100 Thereafter – tel: 01474 876200
Certain statements in this press release are forward looking statements. Forward looking statements involve evaluating a number of risks, uncertainties or assumptions that could cause actual results to differ materially from those expressed or implied by those statements. Forward looking statements regarding past trends, results or activities should not be taken as a representation that such trends, results or activities will continue in the future. Undue reliance should not be placed on forward looking statements.
Bovis Homes Group PLC Page 4
Chief Executive’s Statement
Bovis Homes has made significant progress in 2011, delivering a strong improvement in
profits and earnings against a backdrop of challenging, but stable, market conditions.
The Group has continued to position itself for significant improvement in returns through
the continued acquisition of high quality consented sites in order to grow active sales
outlets, leading to higher volumes, increased average sales price and higher profit margins.
Additionally, the Group has taken steps to improve the efficiency of capital employed, both
through the sale of consented plots on selected sites and by managing working capital
tightly.
Bovis Homes aims to be a quality housebuilder delivering high returns generated from a
strong land bank, much of it strategically sourced, and a quality product sold at a premium
price. In order to deliver improved returns, the following clear strategic objectives for 2011
were set out and have been delivered:
• Increase operating profits
• Build future margin potential in the land bank
• Improve efficiency of capital employed
Increase operating profits
Operating profit increased in the year by 69% to £36.4 million. This resulted from the
compound positive effect of an increased volume of legal completions at a higher average
sales price with an improved profit margin.
Volume growth was driven from the increased number of active sales outlets in 2011.
Having opened 33 sales outlets during the year, the average number of active sales outlets
grew to 73 from 66 in the prior year and the Group finished 2011 with 80 active sales
outlets.
Bovis Homes Group PLC Page 5
The increase in active sales outlets contributed to the delivery of 2,045 legal completions
during 2011, 8% ahead of the previous year (2010: 1,901). The Group legally completed
1,624 private homes (2010: 1,592, including the 215 home joint venture deal), with an
underlying increase, excluding the joint venture deal, of 18%. As a result of the quantity of
new site openings during the year, legal completions of social homes increased by 36% to
421 (2010: 309), 21% of total volume, compared to 16% in 2010.
In addition to increased volume, the Group’s average sales price also increased. The average
sales price of private homes was 5% higher at £180,100 in 2011 (2010: £172,300). This
uplift was almost entirely due to the mix of homes as the Group increased the contribution
from family homes in the south of England. Taking private and social homes together, the
overall average sales price in 2011 was £162,400 (2010: £160,700).
Gross profit margin (excluding land sales) increased to 20.8% in 2011 from 17.9% in 2010.
This resulted from two factors: the full year benefit of construction cost savings in 2011 and
the increased contribution from legal completions on stronger profit margin sites acquired
post the housing market downturn.
As a result of the compound positive effect of volume growth, higher average sales price and
improved gross profit margin, gross profit (excluding land sales) increased by 30% to £69.5
million. Combined with land sales profits of £2.7 million and with overheads well
controlled, the significant growth in operating profit to £36.4 million (2010: £21.6m) was
achieved at an operating margin of 10% (2010: 7.2%).
Build future margin potential in the land bank
During 2011, 2,552 plots were added to the consented land bank at a cost of £134 million
(2010: 3,690 consented plots at a cost of £203 million). Approximately 88% of these plots
are located in the south of England, where the housing market continues to show greater
robustness. The plots added have an estimated future revenue of £542 million and an
estimated future gross profit potential of £137 million, based on current sales prices and
current build costs, and are expected to deliver an estimated gross margin of over 25%. Of
the plots added to the consented land bank, circa 1,000 plots were delivered through
conversion of strategic land.
Bovis Homes Group PLC Page 6
The Group has agreed terms for the acquisition of more than 2,000 further plots. Of these,
circa 750 consented plots on five sites are at an advanced stage in the acquisition process
with a targeted acquisition date in H1 2012. An additional circa 500 plots on five sites are
contracted, subject to planning, with planning expected in 2012.
The consented land bank amounted to 13,723 plots as at 31 December 2011, marginally
below the 13,766 plots held at 31 December 2010. The Group estimates that the gross profit
potential on the plots within the consented land bank at the 2011 year end, based on current
sales prices and current build costs, was £524 million with a gross margin of 21.4% (31
December 2010: gross profit potential of £461 million with a gross margin of 20.0%). The
increase in 2011 of £63 million arose from the land additions (£137 million) less utilisation
from home sales (£69 million) and land sales (£26 million). The balancing positive value of
£21 million reflects other added value changes delivered by the Group in respect of
improving gross profit, including cost savings and site replans.
Of the 13,723 plots, 72% are located in the south of England (2010: 69%). At the year end,
the consented land bank included 5,797 consented plots (42% of total), which have been
acquired since the housing market downturn (2010: 3,931, 29% of total). The average
consented land plot cost was £39,800 at the start of 2011 and increased over the year to
£42,100, as a result of a lower number of written down plots held in the land bank (17% of
land plots versus 26% at the start of the year) and the addition of new prime southern
traditional housing sites where the average plot cost is higher.
The Group intends to increase its investment in strategic land as visibility over the effects of
the changes to the planning environment improves. The strategic land bank at 31 December
2011 stood at 18,749 potential plots as compared to 17,325 potential plots at 31 December
2010. The Group added circa 2,400 potential plots to the strategic land bank during the
year, thus enabling the strategic land bank to grow in size notwithstanding the successful
conversion of circa 1,000 plots into the consented land bank.
Improve efficiency of capital employed
The Group has controlled the size and value of the consented land bank during 2011, with a
lower number of plots being acquired than in 2010, whilst legal completions have increased
and a number of land sales have been successfully delivered. At the same time the Group is
increasing the number of active sales outlets, thus employing its capital more effectively.
Bovis Homes Group PLC Page 7
In order to improve the spread of the Group’s land bank to enhance capital turn, the Group
has achieved its five targeted consented land sales on selected sites in 2011, particularly on
those sites which have a longer trade out period by virtue of their size. Of these, four land
sales completed in 2011 and the fifth completed in early January 2012. As a result of the
four completed sales, the land bank reduced in size by 532 consented plots.
The Group has tightly controlled work in progress, with the number of units of production
held at the end of 2011 reduced to 949 units (2010: 1,093). Additionally, work in progress
associated with infrastructure, roads and sewers has been reduced.
Improving returns
Strong growth in profits during 2011 combined with improved efficiency of capital
employed has resulted in a significant increase in return on capital employed to 5% in 2011
from 3% in 2010.
The Group is firmly of the view that, based on current market conditions continuing, return
on capital employed will further improve in 2012, fuelled by the aforementioned compound
positive effect on profit of volume improvement, growth in average sales price and increase
in profit margin. Whilst future output capacity will grow, the capital base will remain tightly
controlled in respect of land and work in progress. Therefore, assuming current market
conditions continue, the Group anticipates achieving a return on capital employed of at
least 7% in 2012.
Market conditions
A lack of availability in 2011 of high loan to value mortgage products continued to constrain
market demand for new build homes. This was particularly an issue for first time buyers,
who, since the financial crisis, have had to provide a higher level of deposit for their home
purchase than had historically been the case. Monthly mortgage approval levels have been
stable throughout 2011, but at significantly lower levels than the position historically.
Bovis Homes Group PLC Page 8
With a backdrop of continuing economic and employment uncertainty, trading conditions
are expected to remain challenging during 2012. However, the Group regards positively the
anticipated launch of the Government backed mortgage indemnity scheme and welcomes
the stimulus that this scheme can provide to activity in the new build homes market
through the availability of 95% loan to value mortgages. The mortgage indemnity scheme is
expected to work in a similar way to the Group’s existing Perfect 10 product and the Group
will work with the industry, lenders and the Government with the aim of launching the new
scheme in good time for the spring market this year. As well as working with the industry,
the Group will continue to seek innovative ways to enable its customers to access
appropriate mortgage finance.
During 2011, sales prices have been stable with some regional variations. Although the
market remains challenging and customer confidence and commitment levels remain
subdued, the Group currently believes that the pricing environment will be broadly stable
for 2012 as a whole, on the expectation that a limited supply of homes for sale will not
satisfy demand from purchasers. At the same time, buyers are likely to remain constrained
by mortgage availability. It is anticipated that sales prices will continue to be more robust in
the south of England than in the north, which will assist the Group given the southern bias
of its sites.
Current trading
The Group entered 2012 with a forward sales order position of 568 homes, a 35%
improvement on the 420 homes brought forward at the start of 2011. This improvement
was contributed to by the increase in average active sales outlets to 73 in 2011 from 66
during 2010.
Active sales outlets were 83 in the eight weeks to 24 February 2012, up by 28% from 65 in
the same period in 2011. This increase has been instrumental in delivering the robust
trading achieved in the period to 24 February 2012, with sales enquiries and site visitors
higher by 26% and 32% respectively. From these enhanced visitor levels, the Group has
achieved 320 net private reservations in the first eight weeks of 2012 against 227 in the
comparative period in 2011, an increase of 41%. The average private sales rate was 0.48 net
reservations per site per week, an improvement of 10% on the sales rate of 0.44 in the same
period in 2011. Sales prices achieved to date have been modestly ahead of Group
expectations.
Bovis Homes Group PLC Page 9
As at 24 February 2012, the Group held 926 net sales for legal completion in 2012, as
compared to 647 net sales at the same point in 2011, an increase of 43%. Of these, private
sales amounted to 550 units (2011: 428 units) and social housing sales amounted to 376
units (2011: 219 units).
Outlook
As a result of the robust investment in land in 2010 and 2011, the Group expects to trade
from an average of 85 sales outlets in 2012 versus 73 in 2011, an increase of 16%. Given the
focus on acquiring land in the south of England, it is anticipated that 75% of the active sales
outlets at the end of the 2012 will be southern located versus 60% at the start of 2012. As
new sales outlets are opened by the Group, absolute weekly reservation levels are
anticipated to increase.
The continued growth in active sales outlets should, based on stable market conditions,
enable the Group to deliver increased volumes, at a higher average sales price with
improved profit margins. With a clear focus on controlling the capital employed of the
Group through rigorous management of the landbank and tight control of work in progress,
the Group expects to deliver a strong improvement in returns in 2012 and beyond.
The Board is confident in the Group’s prospects for 2012, assuming a continuation of
current market conditions. The Board continues to believe that the Group’s growth strategy
will increase profits, which, combined with improving capital efficiency, will materially
improve shareholder returns.
Bovis Homes Group PLC Page 10
Financial Review
Revenue
During 2011, the Group generated total revenue of £364.8 million, 22% up on 2010 at
£298.6 million. Housing revenue in 2011 was £332.1 million, 13% ahead of the prior year
(2010: £292.7 million). Other income was £2.7 million (2010: £5.9 million). Four land
sales (representing 532 consented plots) legally completed in 2011, with a total income of
circa £38 million. With one of these land sales being a land swap, £30.0 million was
recognised as revenue in 2011. There were no land sales in 2010.
Operating profit
The Group delivered an operating profit for the year ended 31 December 2011 of £36.4
million at an operating margin of 10.0%, as compared to £21.6 million in the previous year,
at an operating margin of 7.2%.
Gross margin (excluding land sales) increased to 20.8% in 2011 from 17.9% in 2010, with
the gross margin (excluding land sales) in H2 2011 increasing to 21.2% from 18.9% in H2
2010. The gross margin benefited from the full year positive effect of construction cost
savings in 2011 combined with the increased contribution from legal completions on sites
acquired post housing market downturn. Subject to current market conditions continuing,
with an increasing proportion of legal completions coming from sites acquired since the
housing market downturn, the gross margin achieved in 2011 can be further improved in
2012. The profit on land sales was £2.7 million, a margin of 9.0%, which resulted in a total
gross profit of £72.2 million at a gross margin of 19.8%.
Overheads, including sales and marketing costs, increased in 2011 by 13%, as the Group
invested to support the growing activity levels. The overheads to revenue ratio improved to
9.8% in 2011 from 10.7% in 2010.
Bovis Homes Group PLC Page 11
Profit before tax and earnings per share
The Group achieved a profit before tax of £32.1 million, comprising operating profit of
£36.4 million, net financing charges of £4.5 million and a profit from the joint venture of
£0.2 million. This compares to £21.6 million of operating profit, £3.2 million of net
financing charges and a profit from the joint venture of £0.1 million, which generated £18.5
million of profit before tax in 2010. Profit before tax increased by 74%. Basic earnings per
share for the year improved by 65% to 17.5p compared to 10.6p in 2010.
Financing
The Group incurred net financing charges of £4.5 million in 2011 (2010: £3.2 million).
With a reduced average net cash position (average net cash of £5 million during 2011,
compared to average net cash of £78 million in 2010), net bank charges for 2011 were £2.8
million (2010: £2.2 million), which included the amortisation of arrangement fees (£0.8
million) and commitment fee charges (£2.0 million). The Group incurred a £4.3 million
finance charge (2010: charge of £2.7 million), reflecting the difference between the cost and
nominal price of land bought on deferred terms which is charged to the income statement
over the life of the deferral of the consideration payable. The Group benefited from a £0.6
million (2010: £0.2 million) net pension financing credit during 2011, as a result of the
expected return on scheme assets being in excess of the interest on the scheme obligations.
The Group also benefited from a finance credit of £1.6 million (2010: £1.2 million) arising
from the unwinding of the discount on its available-for-sale financial assets during 2011.
There were £0.4 million of other financing credits during the year (2010: £0.3 million of
other credits).
Taxation
The Group has recognised a tax charge of £8.8 million on profit before tax of £32.1 million
at an effective tax rate of 27.5% (2010: tax charge of £4.5 million at an effective rate of
24.1%). The effective rate is above the underlying rate, due to the effects on the deferred tax
asset of the reduction of the statutory corporation tax rate. The prior year benefited from
land remediation allowances and the finalisation of prior years’ tax submissions. The
Group has recognised a current tax liability of £4.0 million in its closing balance sheet as at
31 December 2011 (2010: current tax liability of £1.5 million).
Bovis Homes Group PLC Page 12
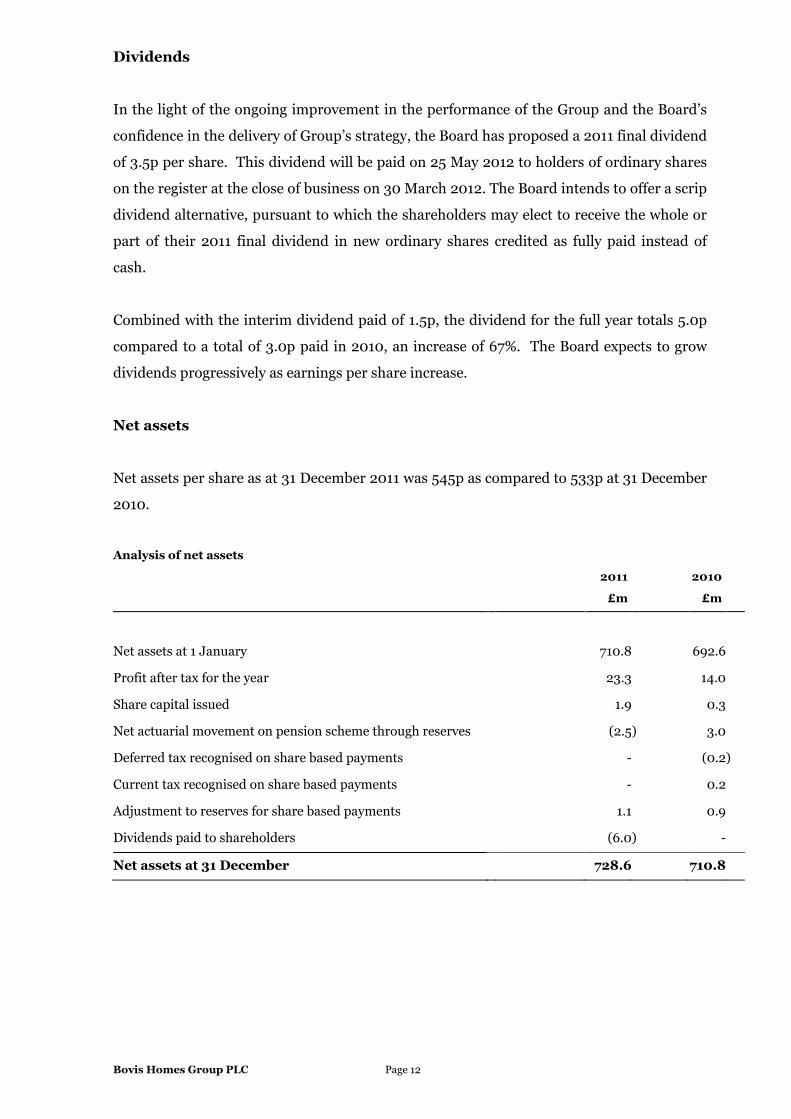
Dividends
In the light of the ongoing improvement in the performance of the Group and the Board’s
confidence in the delivery of Group’s strategy, the Board has proposed a 2011 final dividend
of 3.5p per share. This dividend will be paid on 25 May 2012 to holders of ordinary shares
on the register at the close of business on 30 March 2012. The Board intends to offer a scrip
dividend alternative, pursuant to which the shareholders may elect to receive the whole or
part of their 2011 final dividend in new ordinary shares credited as fully paid instead of
cash.
Combined with the interim dividend paid of 1.5p, the dividend for the full year totals 5.0p
compared to a total of 3.0p paid in 2010, an increase of 67%. The Board expects to grow
dividends progressively as earnings per share increase.
Net assets
Net assets per share as at 31 December 2011 was 545p as compared to 533p at 31 December
2010.
Analysis of net assets
2011 2010
£m £m
Net assets at 1 January 710.8 692.6
Profit after tax for the year 23.3 14.0
Share capital issued 1.9 0.3
Net actuarial movement on pension scheme through reserves (2.5 ) 3.0
Deferred tax recognised on share based payments - (0.2 )
Current tax recognised on share based payments - 0.2
Adjustment to reserves for share based payments 1.1 0.9
Dividends paid to shareholders (6.0 ) -
Net assets at 31 December 728.6 710.8
Bovis Homes Group PLC Page 13
Pensions
Taking into account the latest estimates provided by the Group’s actuarial advisors, the
Group’s pension scheme had a deficit of £2.4 million at 31 December 2011, an improvement
of £0.5 million on the opening deficit of £2.9 million at 31 December 2010. Scheme assets
grew over the year to £76.7 million from £73.5 million and the scheme liabilities increased
to £79.1 million from £76.4 million. The increase in liabilities was primarily a result of a fall
in bond yields. Scheme assets benefited from a £2.8 million special cash contribution made
by the Group into the scheme in July 2011.
Net cash and cashflow
Having started the year with a net cash balance of £51.7 million, the Group generated
operating cash inflow pre land expenditure of £114 million (2010: £93 million),
demonstrating the strong underlying cash generation from the Group’s existing assets. Net
cash payments in 2011 for land investment were £96 million (2010: £137 million). Non-
trading cash outflow was £19 million. As at 31 December 2011 the Group’s net cash balance
was £50.8 million with £56.2 million of cash in hand, offset by £5.0 million of loans
received from the Government and £0.4 million representing the fair value of an interest
rate swap. At the end of the year, the Group had in place a £150 million committed
syndicated facility, maturing in September 2013, with flexible borrowing terms at a low
cost.
Bovis Homes Group PLC Page 14
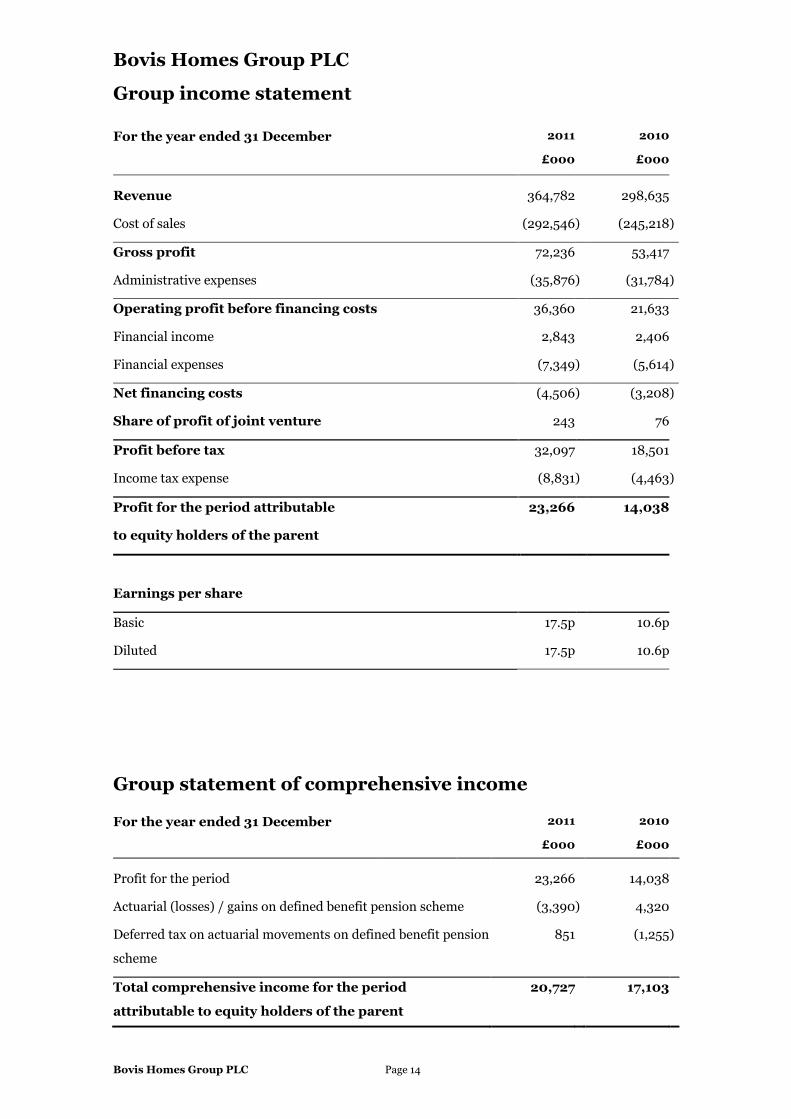
Bovis Homes Group PLC
Group income statement
For the year ended 31 December 2011 2010
£000 £000
Revenue 364,782 298,635
Cost of sales (292,546 ) (245,218 )
Gross profit 72,236 53,417
Administrative expenses (35,876 ) (31,784 )
Operating profit before financing costs 36,360 21,633
Financial income 2,843 2,406
Financial expenses (7,349 ) (5,614 )
Net financing costs (4,506 ) (3,208 )
Share of profit of joint venture 243 76
Profit before tax 32,097 18,501
Income tax expense (8,831 ) (4,463 )
Profit for the period attributable
to equity holders of the parent
23,266 14,038
Earnings per share
Basic 17.5p 10.6p
Diluted 17.5p 10.6p
Group statement of comprehensive income
For the year ended 31 December 2011 2010
£000 £000
Profit for the period 23,266 14,038
Actuarial (losses) / gains on defined benefit pension scheme (3,390 ) 4,320
Deferred tax on actuarial movements on defined benefit pension
scheme
851 (1,255 )
Total comprehensive income for the period
attributable to equity holders of the parent
20,727 17,103
Bovis Homes Group PLC Page 15
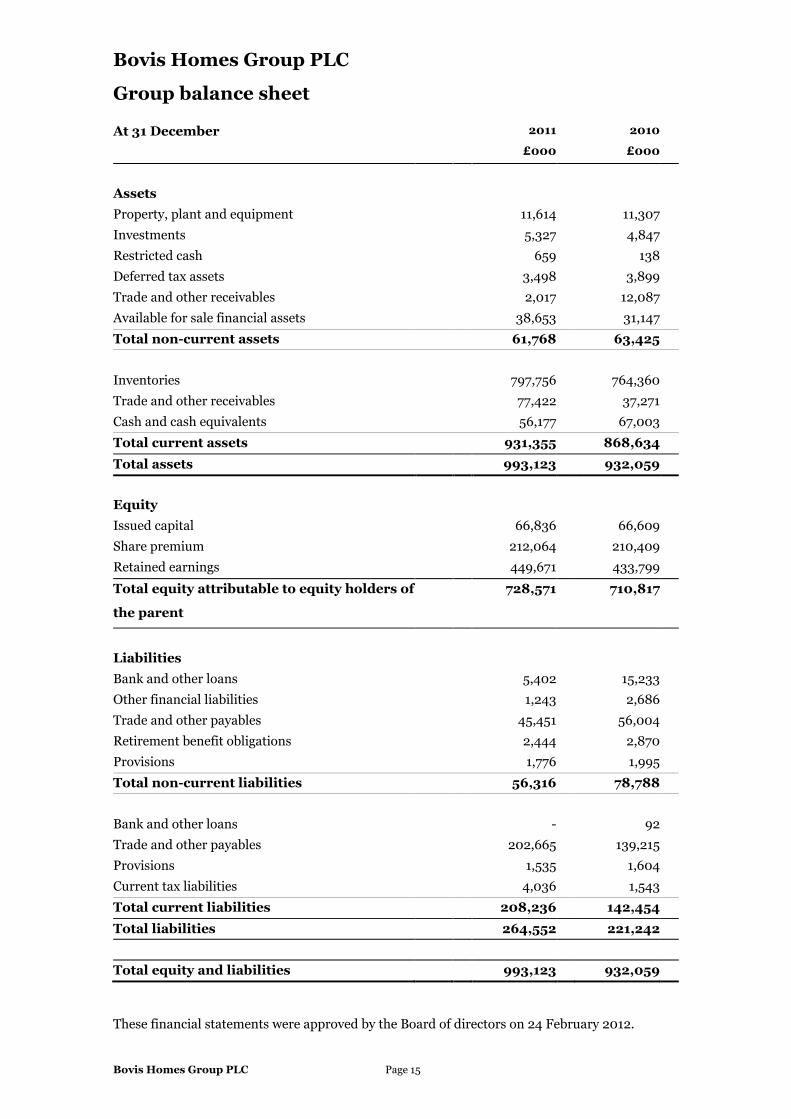
Bovis Homes Group PLC
Group balance sheet
At 31 December 2011 2010
£000 £000
Assets Property, plant and equipment 11,614 11,307 Investments 5,327 4,847 Restricted cash 659 138 Deferred tax assets 3,498 3,899 Trade and other receivables 2,017 12,087 Available for sale financial assets 38,653 31,147 Total non-current assets 61,768 63,425 Inventories 797,756 764,360 Trade and other receivables 77,422 37,271 Cash and cash equivalents 56,177 67,003 Total current assets 931,355 868,634 Total assets 993,123 932,059 Equity Issued capital 66,836 66,609 Share premium 212,064 210,409 Retained earnings 449,671 433,799 Total equity attributable to equity holders of
the parent
728,571 710,817
Liabilities Bank and other loans 5,402 15,233 Other financial liabilities 1,243 2,686 Trade and other payables 45,451 56,004 Retirement benefit obligations 2,444 2,870 Provisions 1,776 1,995 Total non-current liabilities 56,316 78,788 Bank and other loans - 92 Trade and other payables 202,665 139,215 Provisions 1,535 1,604 Current tax liabilities 4,036 1,543 Total current liabilities 208,236 142,454 Total liabilities 264,552 221,242 Total equity and liabilities 993,123 932,059
These financial statements were approved by the Board of directors on 24 February 2012.
Bovis Homes Group PLC Page 16
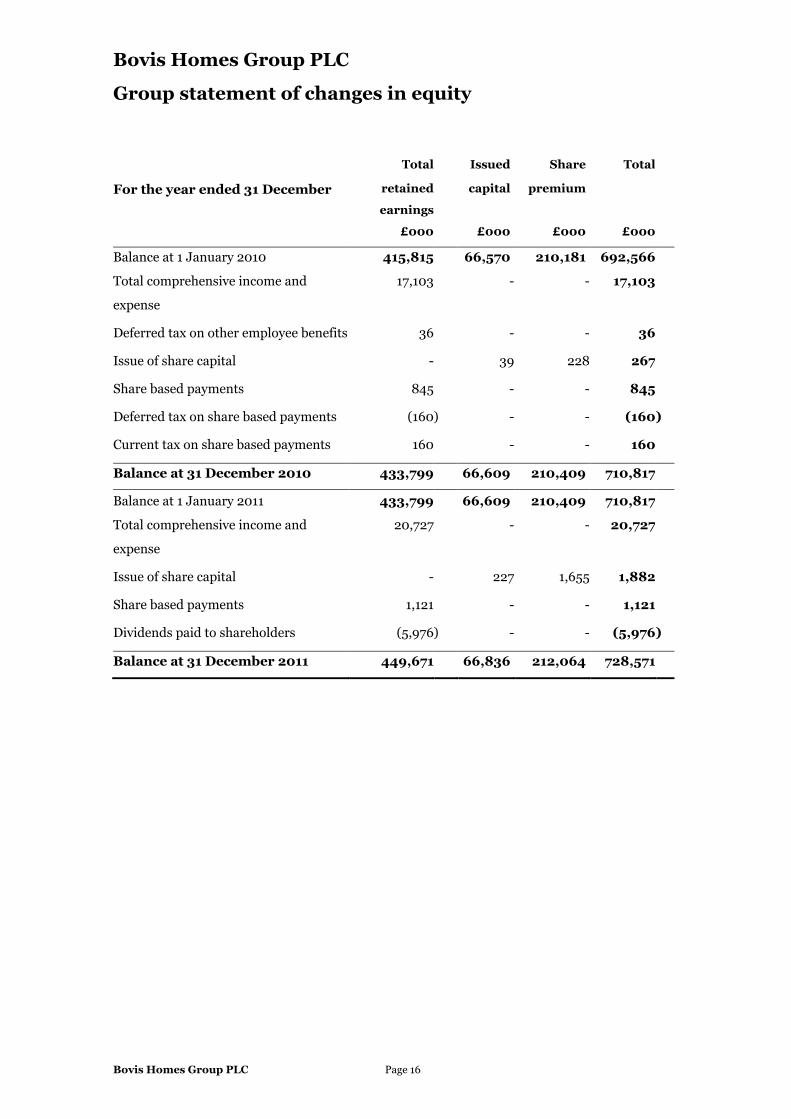
Bovis Homes Group PLC
Group statement of changes in equity
Total Issued Share Total
For the year ended 31 December retained
earnings
capital premium
£000 £000 £000 £000
Balance at 1 January 2010 415,815 66,570 210,181 692,566
Total comprehensive income and
expense
17,103 - - 17,103
Deferred tax on other employee benefits 36 - - 36
Issue of share capital - 39 228 267
Share based payments 845 - - 845
Deferred tax on share based payments (160 ) - - (160 )
Current tax on share based payments 160 - - 160
Balance at 31 December 2010 433,799 66,609 210,409 710,817
Balance at 1 January 2011 433,799 66,609 210,409 710,817
Total comprehensive income and
expense
20,727 - - 20,727
Issue of share capital - 227 1,655 1,882
Share based payments 1,121 - - 1,121
Dividends paid to shareholders (5,976 ) - - (5,976 )
Balance at 31 December 2011 449,671 66,836 212,064 728,571
Bovis Homes Group PLC Page 17
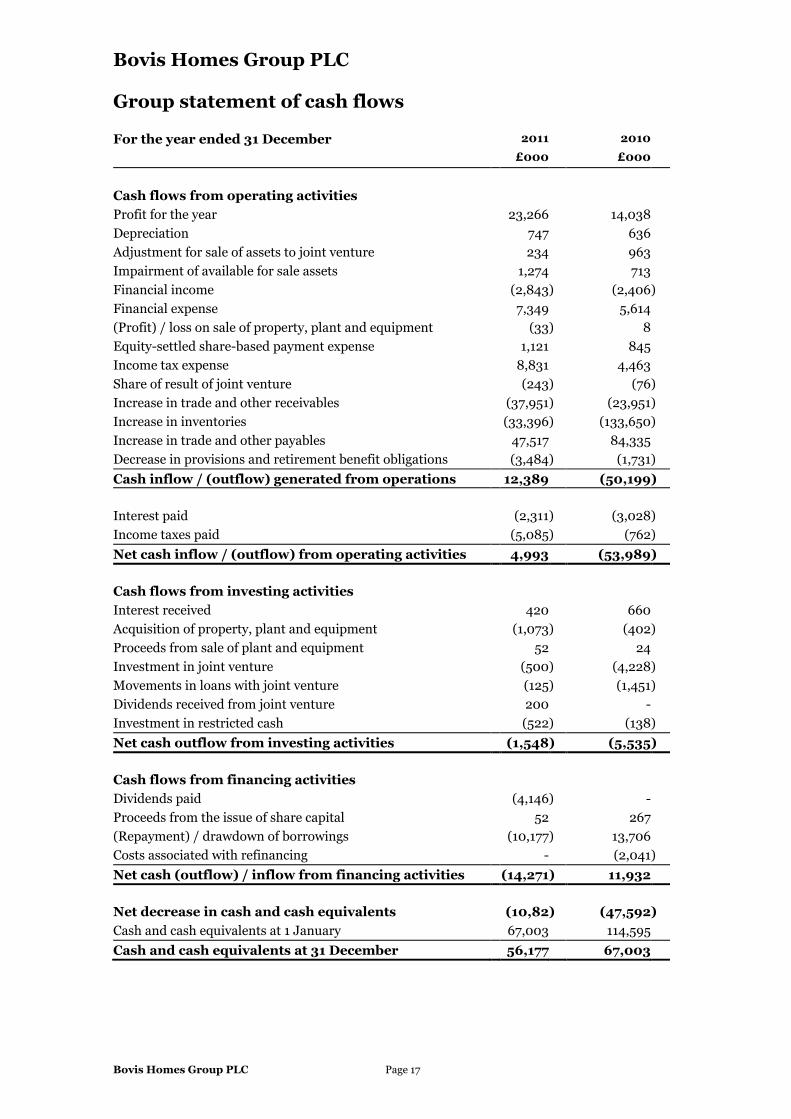
Bovis Homes Group PLC
Group statement of cash flows
For the year ended 31 December 2011 2010 £000 £000
Cash flows from operating activities Profit for the year 23,266 14,038 Depreciation 747 636 Adjustment for sale of assets to joint venture 234 963 Impairment of available for sale assets 1,274 713 Financial income (2,843 ) (2,406 ) Financial expense 7,349 5,614 (Profit) / loss on sale of property, plant and equipment (33 ) 8 Equity-settled share-based payment expense 1,121 845 Income tax expense 8,831 4,463 Share of result of joint venture (243 ) (76 ) Increase in trade and other receivables (37,951 ) (23,951 ) Increase in inventories (33,396 ) (133,650 ) Increase in trade and other payables 47,517 84,335 Decrease in provisions and retirement benefit obligations (3,484 ) (1,731 ) Cash inflow / (outflow) generated from operations 12,389 (50,199 ) Interest paid (2,311 ) (3,028 ) Income taxes paid (5,085 ) (762 ) Net cash inflow / (outflow) from operating activities 4,993 (53,989 ) Cash flows from investing activities Interest received 420 660 Acquisition of property, plant and equipment (1,073 ) (402 ) Proceeds from sale of plant and equipment 52 24 Investment in joint venture (500 ) (4,228 ) Movements in loans with joint venture (125 ) (1,451 ) Dividends received from joint venture 200 - Investment in restricted cash (522 ) (138 ) Net cash outflow from investing activities (1,548 ) (5,535 ) Cash flows from financing activities Dividends paid (4,146 ) - Proceeds from the issue of share capital 52 267 (Repayment) / drawdown of borrowings (10,177 ) 13,706 Costs associated with refinancing - (2,041 ) Net cash (outflow) / inflow from financing activities (14,271 ) 11,932 Net decrease in cash and cash equivalents (10,82
) (47,592 ) Cash and cash equivalents at 1 January 67,003 114,595 Cash and cash equivalents at 31 December 56,177 67,003
Bovis Homes Group PLC Page 18
Notes to the financial statements
1 Basis of preparation
Bovis Homes Group PLC (‘the Company’) is a company domiciled in the United Kingdom. The
consolidated financial statements of the Company for the year ended 31 December 2011 comprise the
Company and its subsidiaries (together referred to as ‘the Group’) and the Group’s interest in
associates and joint ventures.
The consolidated financial statements were authorised for issue by the directors on 24 February 2012.
The financial statements were audited by KPMG Audit Plc.
The financial information set out above does not constitute the company's statutory financial
statements for the years ended 31 December 2011 or 2010 but is derived from those financial
statements. Statutory financial statements for 2010 have been delivered to the registrar of
companies, and those for 2011 will be delivered in due course. The auditors have reported on those
financial statements; their reports were (i) unqualified, (ii) did not include a reference to any matters
to which the auditors drew attention by way of emphasis without qualifying their report and (iii) did
not contain a statement under section 498 (2) or (3) of the Companies Act 2006.
The consolidated financials statements have been prepared in accordance with IFRS as adopted by
the EU, and the accounting policies have been applied consistently for all periods presented in the
consolidated financial statements.
The preparation of financial statements in conformity with IFRS requires management to make
judgements, estimates and assumptions that affect the application of policies and reported amounts of
assets and liabilities, income and expenses. The estimates and associated assumptions are based on
historical experience and various other factors that are believed to be reasonable under the
circumstances, the results of which form the basis of making judgements about carrying values of
assets and liabilities that are not readily apparent from other sources. Actual results may differ from
these estimates.
2 Basis of consolidation
The consolidated financial statements incorporate the financial statements of the Company and
entities controlled by the Company (its subsidiaries) made up to 31 December. Control is achieved
where the Company has the power to govern the financial and operating policies of an entity so as to
obtain benefits from its activities. The existence and effect of potential voting rights that are currently
exercisable or convertible are considered when assessing whether the Group controls another entity.
The financial statements of subsidiaries are included in the consolidated financial statements from
the date that control commences until the date that control ceases.
Bovis Homes Group PLC Page 19
Notes to the financial statements (cont)
Associates are those entities in which the Group has significant influence, but not control, over the
financial and operating policies. The consolidated financial statements include the Group’s share of
the total recognised gains and losses of associates on an equity accounted basis, from the date that
significant influence commences until the date that significant influence ceases.
Joint ventures are those entities in which the Group has joint control over the financial and operating
policies. The consolidated financial statements include the Group’s share of the total recognised gains
and losses of joint ventures on an equity accounted basis, from the date that joint control commenced
until joint control ceases.
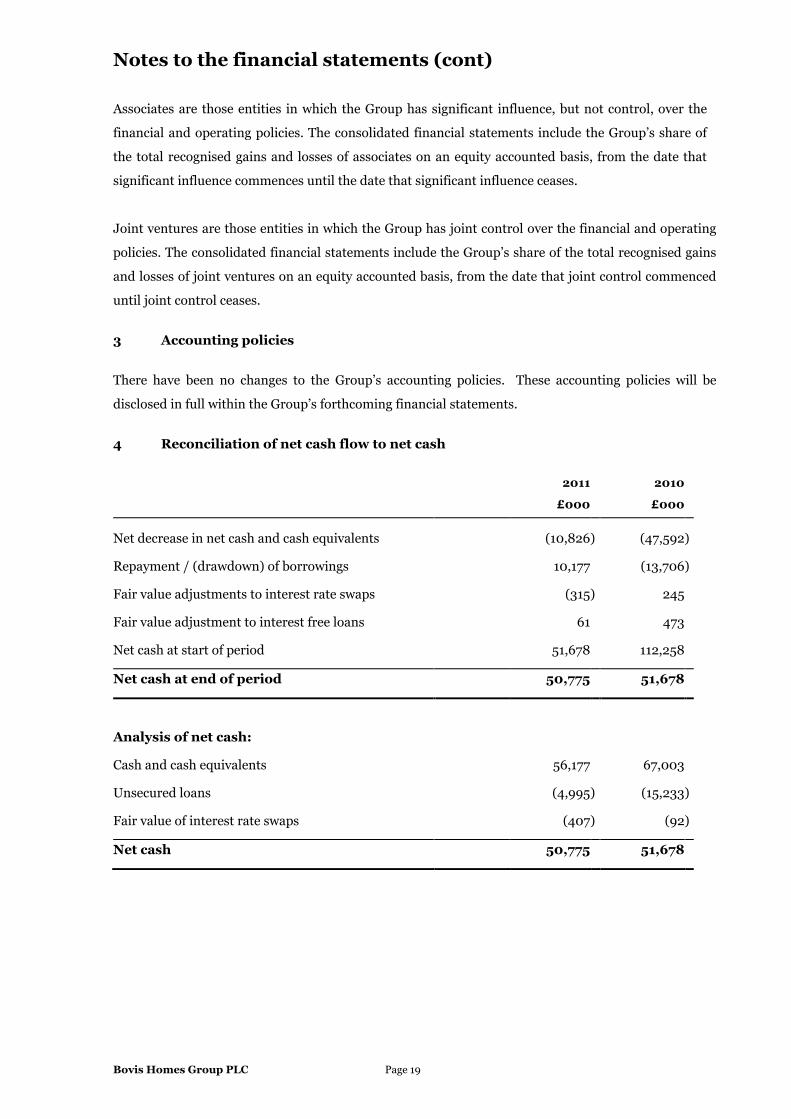
3 Accounting policies
There have been no changes to the Group’s accounting policies. These accounting policies will be
disclosed in full within the Group’s forthcoming financial statements.
4 Reconciliation of net cash flow to net cash
2011 2010
£000 £000
Net decrease in net cash and cash equivalents (10,826 ) (47,592 )
Repayment / (drawdown) of borrowings 10,177 (13,706 )
Fair value adjustments to interest rate swaps (315 ) 245
Fair value adjustment to interest free loans 61 473
Net cash at start of period 51,678 112,258
Net cash at end of period 50,775 51,678
Analysis of net cash:
Cash and cash equivalents 56,177 67,003
Unsecured loans (4,995 ) (15,233 )
Fair value of interest rate swaps (407 ) (92 )
Net cash 50,775 51,678
Bovis Homes Group PLC Page 20
Notes to the financial statements (cont)
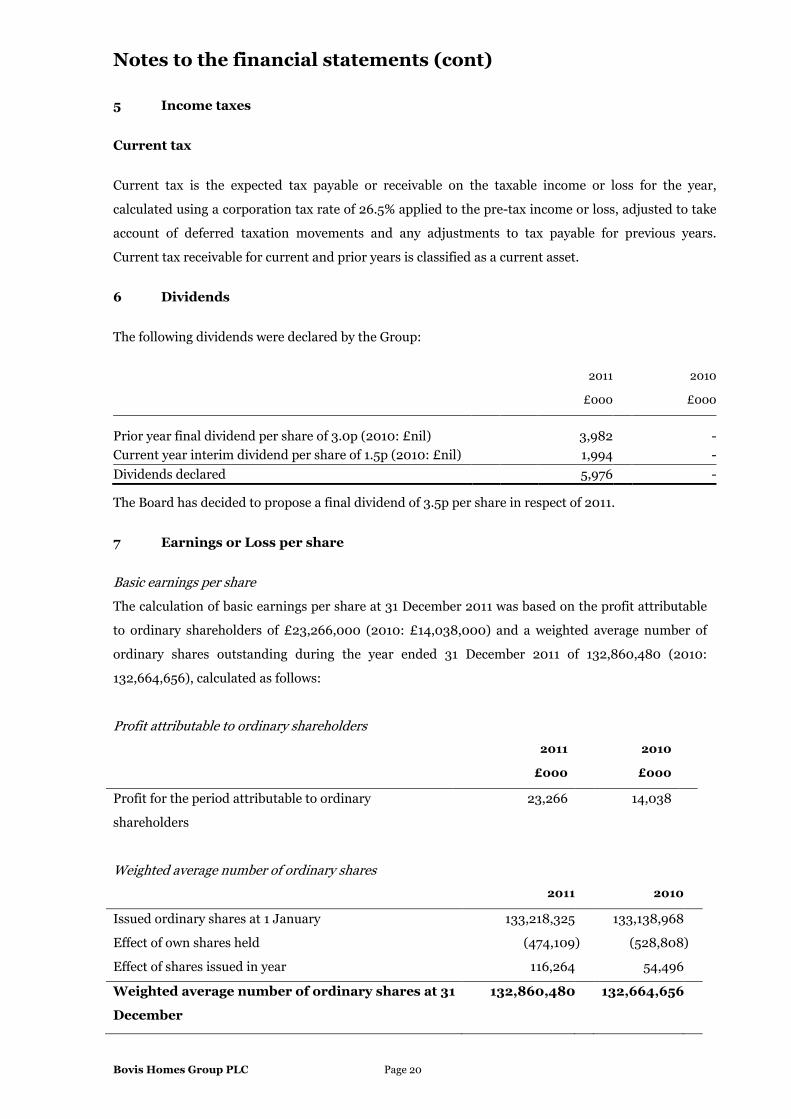
5 Income taxes
Current tax
Current tax is the expected tax payable or receivable on the taxable income or loss for the year,
calculated using a corporation tax rate of 26.5% applied to the pre-tax income or loss, adjusted to take
account of deferred taxation movements and any adjustments to tax payable for previous years.
Current tax receivable for current and prior years is classified as a current asset.
6 Dividends
The following dividends were declared by the Group:
2011 2010
£000 £000
Prior year final dividend per share of 3.0p (2010: £nil) 3,982 - Current year interim dividend per share of 1.5p (2010: £nil) 1,994 - Dividends declared 5,976 -
The Board has decided to propose a final dividend of 3.5p per share in respect of 2011.
7 Earnings or Loss per share
Basic earnings per share The calculation of basic earnings per share at 31 December 2011 was based on the profit attributable
to ordinary shareholders of £23,266,000 (2010: £14,038,000) and a weighted average number of
ordinary shares outstanding during the year ended 31 December 2011 of 132,860,480 (2010:
132,664,656), calculated as follows:
Profit attributable to ordinary shareholders
2011 2010
£000 £000
Profit for the period attributable to ordinary
shareholders
23,266 14,038
Weighted average number of ordinary shares
2011 2010
Issued ordinary shares at 1 January 133,218,325 133,138,968
Effect of own shares held (474,109 ) (528,808 )
Effect of shares issued in year 116,264 54,496
Weighted average number of ordinary shares at 31
December
132,860,480 132,664,656
Bovis Homes Group PLC Page 21
Notes to the financial statements (cont)
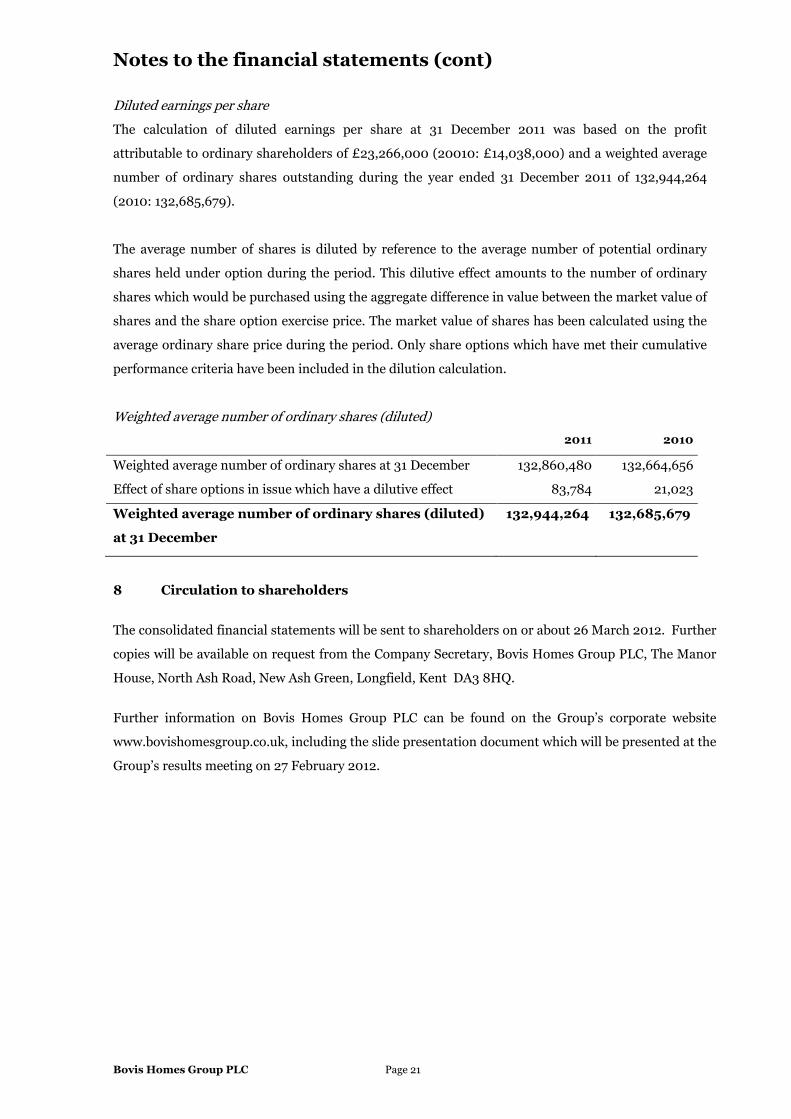
Diluted earnings per share The calculation of diluted earnings per share at 31 December 2011 was based on the profit
attributable to ordinary shareholders of £23,266,000 (20010: £14,038,000) and a weighted average
number of ordinary shares outstanding during the year ended 31 December 2011 of 132,944,264
(2010: 132,685,679).
The average number of shares is diluted by reference to the average number of potential ordinary
shares held under option during the period. This dilutive effect amounts to the number of ordinary
shares which would be purchased using the aggregate difference in value between the market value of
shares and the share option exercise price. The market value of shares has been calculated using the
average ordinary share price during the period. Only share options which have met their cumulative
performance criteria have been included in the dilution calculation.
Weighted average number of ordinary shares (diluted)
2011 2010
Weighted average number of ordinary shares at 31 December 132,860,480 132,664,656
Effect of share options in issue which have a dilutive effect 83,784 21,023
Weighted average number of ordinary shares (diluted)
at 31 December
132,944,264 132,685,679
8 Circulation to shareholders
The consolidated financial statements will be sent to shareholders on or about 26 March 2012. Further
copies will be available on request from the Company Secretary, Bovis Homes Group PLC, The Manor
House, North Ash Road, New Ash Green, Longfield, Kent DA3 8HQ.
Further information on Bovis Homes Group PLC can be found on the Group’s corporate website
www.bovishomesgroup.co.uk, including the slide presentation document which will be presented at the
Group’s results meeting on 27 February 2012.