Embed Size (px)
Citation preview
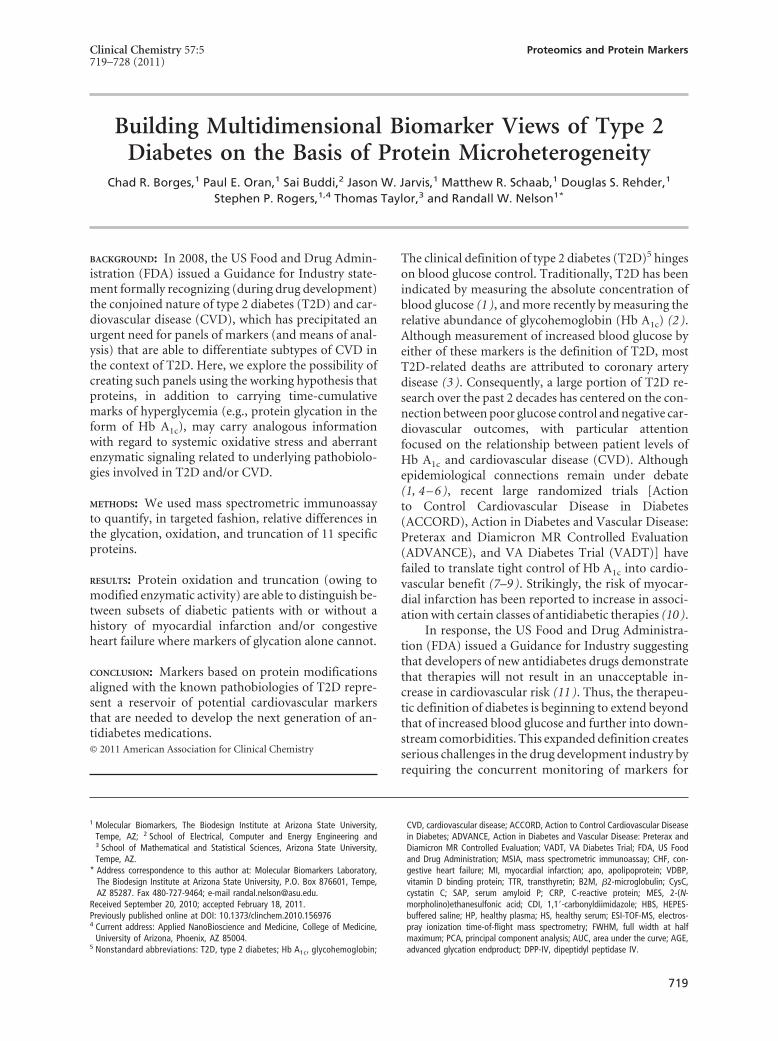
Building Multidimensional Biomarker Views of Type 2Diabetes on the Basis of Protein Microheterogeneity
Chad R. Borges,1 Paul E. Oran,1 Sai Buddi,2 Jason W. Jarvis,1 Matthew R. Schaab,1 Douglas S. Rehder,1
Stephen P. Rogers,1,4 Thomas Taylor,3 and Randall W. Nelson1*
BACKGROUND: In 2008, the US Food and Drug Admin-istration (FDA) issued a Guidance for Industry state-ment formally recognizing (during drug development)the conjoined nature of type 2 diabetes (T2D) and car-diovascular disease (CVD), which has precipitated anurgent need for panels of markers (and means of anal-ysis) that are able to differentiate subtypes of CVD inthe context of T2D. Here, we explore the possibility ofcreating such panels using the working hypothesis thatproteins, in addition to carrying time-cumulativemarks of hyperglycemia (e.g., protein glycation in theform of Hb A1c), may carry analogous informationwith regard to systemic oxidative stress and aberrantenzymatic signaling related to underlying pathobiolo-gies involved in T2D and/or CVD.
METHODS: We used mass spectrometric immunoassayto quantify, in targeted fashion, relative differences inthe glycation, oxidation, and truncation of 11 specificproteins.
RESULTS: Protein oxidation and truncation (owing tomodified enzymatic activity) are able to distinguish be-tween subsets of diabetic patients with or without ahistory of myocardial infarction and/or congestiveheart failure where markers of glycation alone cannot.
CONCLUSION: Markers based on protein modificationsaligned with the known pathobiologies of T2D repre-sent a reservoir of potential cardiovascular markersthat are needed to develop the next generation of an-tidiabetes medications.© 2011 American Association for Clinical Chemistry
The clinical definition of type 2 diabetes (T2D)5 hingeson blood glucose control. Traditionally, T2D has beenindicated by measuring the absolute concentration ofblood glucose (1 ), and more recently by measuring therelative abundance of glycohemoglobin (Hb A1c) (2 ).Although measurement of increased blood glucose byeither of these markers is the definition of T2D, mostT2D-related deaths are attributed to coronary arterydisease (3 ). Consequently, a large portion of T2D re-search over the past 2 decades has centered on the con-nection between poor glucose control and negative car-diovascular outcomes, with particular attentionfocused on the relationship between patient levels ofHb A1c and cardiovascular disease (CVD). Althoughepidemiological connections remain under debate(1, 4 – 6 ), recent large randomized trials [Actionto Control Cardiovascular Disease in Diabetes(ACCORD), Action in Diabetes and Vascular Disease:Preterax and Diamicron MR Controlled Evaluation(ADVANCE), and VA Diabetes Trial (VADT)] havefailed to translate tight control of Hb A1c into cardio-vascular benefit (7–9 ). Strikingly, the risk of myocar-dial infarction has been reported to increase in associ-ation with certain classes of antidiabetic therapies (10 ).
In response, the US Food and Drug Administra-tion (FDA) issued a Guidance for Industry suggestingthat developers of new antidiabetes drugs demonstratethat therapies will not result in an unacceptable in-crease in cardiovascular risk (11 ). Thus, the therapeu-tic definition of diabetes is beginning to extend beyondthat of increased blood glucose and further into down-stream comorbidities. This expanded definition createsserious challenges in the drug development industry byrequiring the concurrent monitoring of markers for
1 Molecular Biomarkers, The Biodesign Institute at Arizona State University,Tempe, AZ; 2 School of Electrical, Computer and Energy Engineering and3 School of Mathematical and Statistical Sciences, Arizona State University,Tempe, AZ.
* Address correspondence to this author at: Molecular Biomarkers Laboratory,The Biodesign Institute at Arizona State University, P.O. Box 876601, Tempe,AZ 85287. Fax 480-727-9464; e-mail [email protected].
Received September 20, 2010; accepted February 18, 2011.Previously published online at DOI: 10.1373/clinchem.2010.1569764 Current address: Applied NanoBioscience and Medicine, College of Medicine,
University of Arizona, Phoenix, AZ 85004.5 Nonstandard abbreviations: T2D, type 2 diabetes; Hb A1c, glycohemoglobin;
CVD, cardiovascular disease; ACCORD, Action to Control Cardiovascular Diseasein Diabetes; ADVANCE, Action in Diabetes and Vascular Disease: Preterax andDiamicron MR Controlled Evaluation; VADT, VA Diabetes Trial; FDA, US Foodand Drug Administration; MSIA, mass spectrometric immunoassay; CHF, con-gestive heart failure; MI, myocardial infarction; apo, apolipoprotein; VDBP,vitamin D binding protein; TTR, transthyretin; B2M, �2-microglobulin; CysC,cystatin C; SAP, serum amyloid P; CRP, C-reactive protein; MES, 2-(N-morpholino)ethanesulfonic acid; CDI, 1,1�-carbonyldiimidazole; HBS, HEPES-buffered saline; HP, healthy plasma; HS, healthy serum; ESI-TOF-MS, electros-pray ionization time-of-flight mass spectrometry; FWHM, full width at halfmaximum; PCA, principal component analysis; AUC, area under the curve; AGE,advanced glycation endproduct; DPP-IV, dipeptidyl peptidase IV.
Clinical Chemistry 57:5719–728 (2011)
Proteomics and Protein Markers
719
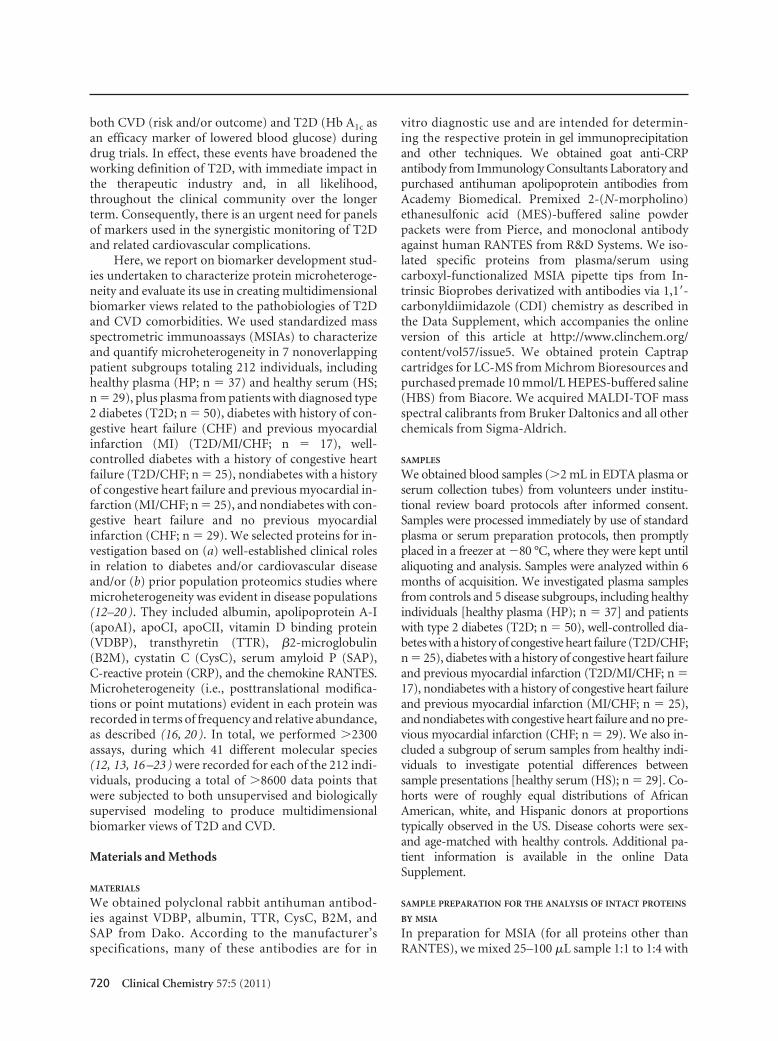
both CVD (risk and/or outcome) and T2D (Hb A1c asan efficacy marker of lowered blood glucose) duringdrug trials. In effect, these events have broadened theworking definition of T2D, with immediate impact inthe therapeutic industry and, in all likelihood,throughout the clinical community over the longerterm. Consequently, there is an urgent need for panelsof markers used in the synergistic monitoring of T2Dand related cardiovascular complications.
Here, we report on biomarker development stud-ies undertaken to characterize protein microheteroge-neity and evaluate its use in creating multidimensionalbiomarker views related to the pathobiologies of T2Dand CVD comorbidities. We used standardized massspectrometric immunoassays (MSIAs) to characterizeand quantify microheterogeneity in 7 nonoverlappingpatient subgroups totaling 212 individuals, includinghealthy plasma (HP; n � 37) and healthy serum (HS;n � 29), plus plasma from patients with diagnosed type2 diabetes (T2D; n � 50), diabetes with history of con-gestive heart failure (CHF) and previous myocardialinfarction (MI) (T2D/MI/CHF; n � 17), well-controlled diabetes with a history of congestive heartfailure (T2D/CHF; n � 25), nondiabetes with a historyof congestive heart failure and previous myocardial in-farction (MI/CHF; n � 25), and nondiabetes with con-gestive heart failure and no previous myocardialinfarction (CHF; n � 29). We selected proteins for in-vestigation based on (a) well-established clinical rolesin relation to diabetes and/or cardiovascular diseaseand/or (b) prior population proteomics studies wheremicroheterogeneity was evident in disease populations(12–20 ). They included albumin, apolipoprotein A-I(apoAI), apoCI, apoCII, vitamin D binding protein(VDBP), transthyretin (TTR), �2-microglobulin(B2M), cystatin C (CysC), serum amyloid P (SAP),C-reactive protein (CRP), and the chemokine RANTES.Microheterogeneity (i.e., posttranslational modifica-tions or point mutations) evident in each protein wasrecorded in terms of frequency and relative abundance,as described (16, 20 ). In total, we performed �2300assays, during which 41 different molecular species(12, 13, 16 –23 ) were recorded for each of the 212 indi-viduals, producing a total of �8600 data points thatwere subjected to both unsupervised and biologicallysupervised modeling to produce multidimensionalbiomarker views of T2D and CVD.
Materials and Methods
MATERIALS
We obtained polyclonal rabbit antihuman antibod-ies against VDBP, albumin, TTR, CysC, B2M, andSAP from Dako. According to the manufacturer’sspecifications, many of these antibodies are for in
vitro diagnostic use and are intended for determin-ing the respective protein in gel immunoprecipitationand other techniques. We obtained goat anti-CRPantibody from Immunology Consultants Laboratory andpurchased antihuman apolipoprotein antibodies fromAcademy Biomedical. Premixed 2-(N-morpholino)ethanesulfonic acid (MES)-buffered saline powderpackets were from Pierce, and monoclonal antibodyagainst human RANTES from R&D Systems. We iso-lated specific proteins from plasma/serum usingcarboxyl-functionalized MSIA pipette tips from In-trinsic Bioprobes derivatized with antibodies via 1,1�-carbonyldiimidazole (CDI) chemistry as described inthe Data Supplement, which accompanies the onlineversion of this article at http://www.clinchem.org/content/vol57/issue5. We obtained protein Captrapcartridges for LC-MS from Michrom Bioresources andpurchased premade 10 mmol/L HEPES-buffered saline(HBS) from Biacore. We acquired MALDI-TOF massspectral calibrants from Bruker Daltonics and all otherchemicals from Sigma-Aldrich.
SAMPLES
We obtained blood samples (�2 mL in EDTA plasma orserum collection tubes) from volunteers under institu-tional review board protocols after informed consent.Samples were processed immediately by use of standardplasma or serum preparation protocols, then promptlyplaced in a freezer at �80 °C, where they were kept untilaliquoting and analysis. Samples were analyzed within 6months of acquisition. We investigated plasma samplesfrom controls and 5 disease subgroups, including healthyindividuals [healthy plasma (HP); n � 37] and patientswith type 2 diabetes (T2D; n � 50), well-controlled dia-betes with a history of congestive heart failure (T2D/CHF;n � 25), diabetes with a history of congestive heart failureand previous myocardial infarction (T2D/MI/CHF; n �17), nondiabetes with a history of congestive heart failureand previous myocardial infarction (MI/CHF; n � 25),and nondiabetes with congestive heart failure and no pre-vious myocardial infarction (CHF; n � 29). We also in-cluded a subgroup of serum samples from healthy indi-viduals to investigate potential differences betweensample presentations [healthy serum (HS); n � 29]. Co-horts were of roughly equal distributions of AfricanAmerican, white, and Hispanic donors at proportionstypically observed in the US. Disease cohorts were sex-and age-matched with healthy controls. Additional pa-tient information is available in the online DataSupplement.
SAMPLE PREPARATION FOR THE ANALYSIS OF INTACT PROTEINS
BY MSIA
In preparation for MSIA (for all proteins other thanRANTES), we mixed 25–100 �L sample 1:1 to 1:4 with
720 Clinical Chemistry 57:5 (2011)
HBS (with or without 0.05% Tween 20) and/orMES-buffered saline. Detailed methods for the analysisof individual proteins have been described in detail(12, 13, 16 –24 ). In preparation for RANTES, wemixed 230 �L sample with 115 �L of a detergent solu-tion containing 4.5% Tween 20, 150 mmol/L octyl-�-glucopyranoside, 1.5 mol/L ammonium acetate, andconcentrated PBS (0.67 mol/L sodium phosphate, 1mol/L sodium chloride), for a total analytical volumeof 345 �L, as described in detail (20 ). Antibody-linkedtips were stored in HBS at 4 °C until the day of use, atwhich time they were loaded onto a 96-well pipettingrobot and prerinsed (400 �L/well; 150 �L aspirate anddispense cycles; 10 cycles) with HBS and then used toextract specific proteins from individual samples atroom temperature (85 �L aspirate and dispense cycles;250 cycles). After extraction, tips were washed (bydrawing from a fresh reservoir of liquid and dispensingto waste) as follows. Five cycles of 200 �L HBS, 5 cyclesof 200 �L distilled water, 5 cycles of 200 �L of 2 mol/Lammonium acetate/acetonitrile (3:1 vol/vol), 10 cyclesof 200 �L distilled water, and 5 cycles of air (to removeany residual water). Retained proteins were eluted forMALDI-TOF-MS by drawing 4 �L of matrix solution(33% acetonitrile in water containing 0.4% trifluoro-acetic acid saturated with sinapinic acid), allowing thesolution to dwell in the tip for 20 s, and then dispensingonto a MALDI target (13 ). For electrospray ionizationtime-of-flight mass spectrometry (ESI-TOF-MS), wereplaced the matrix solution with 10 �L of 0.4% trif-luoroacetic acid and deposited the eluent into a 96-well(conical) polypropylene autosampler tray.
MALDI-TOF MS
We performed MALDI-TOF mass spectrometry forTTR, CysC, B2M, SAP, apoCI, apoCII, and RANTESusing a Bruker Autoflex III or Ultraflex III operating inpositive-ion, delayed-extraction linear mode. Instru-ment settings for each analyte are provided as a table inthe online Data Supplement. We used a laser (Nd:YAG) repetition rate of 100 –200 Hz to sum 20 000 la-ser shots (into an individual spectrum) for each sam-ple, resulting in typical mass resolutions [full width athalf maximum (FWHM)] �1000 and signal-to-noiseratios (S/N) �3 for low-level signals [i.e., relative ionsignals (integral) of 1% or less of total ion signal]. Spec-tra were mass calibrated externally (from calibrationspots placed on each sample target) with a mixture ofubiquitin (calculated MH�
avg 8565.76), cytochrome C(calculated MH�
avg 12360.97), and trypsinogen (cal-culated MH�
avg 23982) (MH�avg: isotopically aver-
aged molecular mass of a protonated molecule). Forsemiquantitative data, we processed spectra by baselinesubtraction followed by signal integration (Zebra, Bea-vis Informatics) of each signal corresponding to the
protein of interest. For each sample, we measured andrecorded the relative abundances of the variants bynormalizing the integral of each variant to the summedintegrals of all observed forms of the protein.
ESI-TOF MS
We performed ESI-TOF MS for albumin, VDBP, CRP,and apoAI using a column-free trap-and-elute approach(rather than traditional liquid chromatography gradientmethods). ESI rather than MALDI was used for theselarger proteins because of its ability to achieve greater re-solving power than MALDI at masses �25 kDa. Eluent (5�L) was injected by a Spark Holland Endurance autosam-pler in microliter pickup mode and loaded by an EksigentnanoLC*1D at 10 �L/min [90/10 water/acetonitrile con-taining 0.1% formic acid (solvent A)] onto a protein Cap-trap (polymeric/reversed phase sorbent, Michrom Biore-sources) configured for unidirectional flow on a 6-portdivert valve. After 2 min, the divert valve position wasautomatically toggled and flow over the cartridge changedto 1 �L/min solvent A (running directly to the ESI inlet),which was ramped by use of acetonitrile (solvent B) over 8min to 1/99 water/acetonitrile. By 10.2 min, the run wascompleted and the flow back to 100% solvent A. All pro-teins targets eluted between 5 and 7.5 min into a BrukerMicrOTOF-Q (quadrupole time-of-flight) mass spec-trometer operating in positive-ion, TOF-only mode, ac-quiring spectra in the m/z range of 50–3000. ESI settingsfor the Agilent G1385A capillary nebulizer ion sourcewere as follows: end plate offset �500 V, capillary �4500V, nebulizer nitrogen 2 bar, dry gas nitrogen 3.0 L/min at225 °C. Data were acquired in profile mode at a digitizersampling rate of 2 GHz, with spectra rate control by sum-mation at 1 Hz. Spectra were mass calibrated by use of amultipoint calibration curve generated from Agilent’sproprietary ESI-MS tuning mix. For semiquantitativedata, 1.5 min of recorded spectra were averaged across thechromatographic peak apex of protein elution. The ESIcharge-state envelope was deconvoluted with BrukerDataAnalysis v3.4 software to a mass range of 1000 Da oneither side of any identified peak. Deconvoluted ESI massspectra were baseline subtracted, and all peaks were inte-grated. For each sample, we measured and recorded therelative abundances of the variants by normalizing theintegral of each variant to the summed integrals of all ob-served forms of the protein.
DATA PREPARATION
Each assay analyzed �1 molecular species, resulting ina total of 41 values for each of the 212 individuals. Datafor each molecular species were tabulated as relativeabundance per individual. For all species, the lowerlimit of quantification was approximately 1% whilemaintaining standard errors of �10% [i.e., 1%(0.1%)], as illustrated elsewhere (16, 20 ). The relative
Multidimensional Biomarker Views of Type 2 Diabetes
Clinical Chemistry 57:5 (2011) 721
abundance data for each analyte were then mean-centered and normalized by the SD of the entire pop-ulation, so that each molecular species was treated(weighted) equally during subsequent analyses.
DATA ANALYSIS: UNSUPERVISED PRINCIPAL
COMPONENT ANALYSIS
We applied principal component analysis (PCA) (25 )to the entire data set of 41 variables observed in 212individuals. The first 3 PC scores were extracted andused to create a 3-dimensional plot, after which colorcoding was superimposed on each point correspond-ing to the subgroups to which the point belonged: HP(dark green), HS (light green), T2D (red), T2D/MI/CHF (dark blue), CHF/T2D (orange), MI/CHF (lightblue), and CHF (yellow). To obtain ROC area underthe curve (AUC) values between each group, a best-separating plane was constructed in the 3D space by useof a linear kernel support vector machine classifierwhich places, orthogonal to this plane, a single line rep-resenting a new univariate scale that cuts across the3-dimensional space (see online Supplemental Fig. 1for a graphical representation of this process). Usingthis new 1-dimensional scale, ROC curves were con-structed for every possible pair of cohorts and the areaunderneath them obtained in the traditional manner(Table 1). For readers interested in further discussion ofthe significance of ROC curves, Zweig and Campbell (26)
provide an excellent review on the use of ROC plots in theclinical laboratory. Matlab software was used to imple-ment the support vector machine classifier.
DATA ANALYSIS: BIOLOGICALLY SUPERVISED PCA
Protein variants were grouped by identity to align withcommon themes of (a) protein glycation (glycemic con-trol), (b) protein oxidation (oxidative stress), or (c) pro-tein truncation (alterations in enzymatic and signalingpathways). Using PCA, each marker was evaluated incombination with the other markers within a commonpathobiology to find the most efficient and significantcombination of markers—i.e., the minimum number ofmarkers that provided the greatest degree of separationbetween disease subgroups. In this manner, glycationmarkers under consideration were reduced to (glycated)albumin, B2M, CysC, VDBP, and CRP. Oxidation mark-ers under consideration were sulfoxidized apoAI andapoC1. Truncation markers were found as N-terminal di-peptide truncations on RANTES and apoC1. We usedPCA to condense multimarker data in each category intoa single metric (PC1), resulting in 3 numerical descriptors(1 for each of the pathobiologies) for each sample,which were plotted in 3D with color coding as de-scribed above. We ascertained ROC AUCs betweenall possible pairwise combinations of subgroups asdescribed above (Table 1).
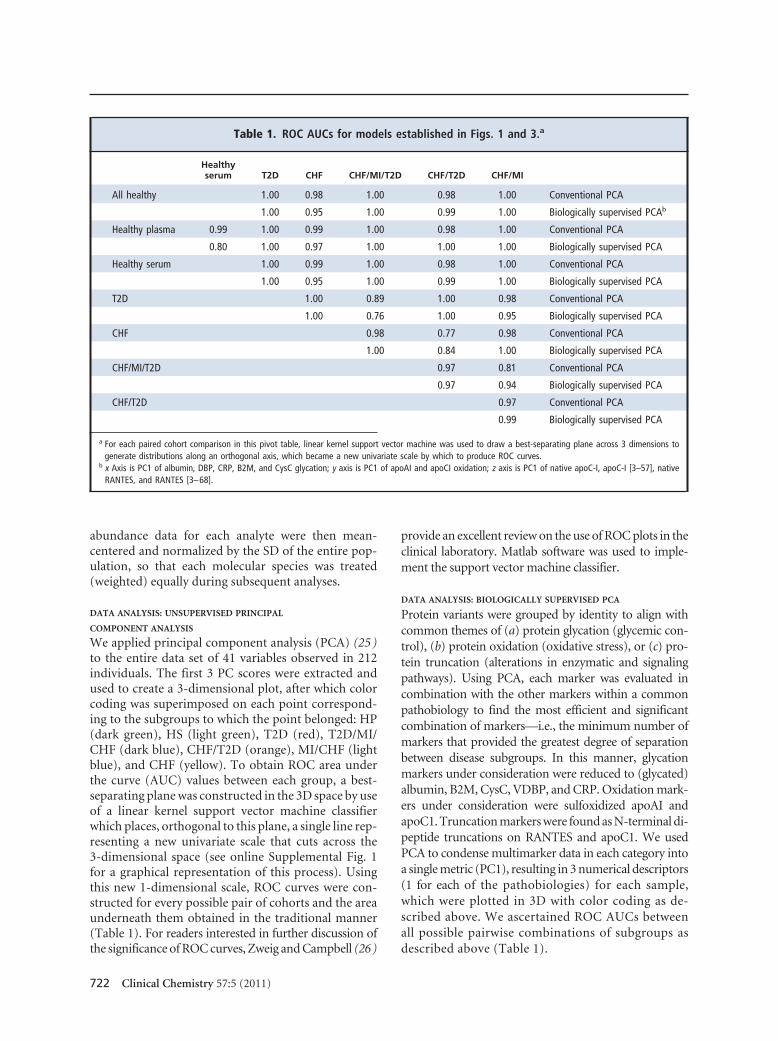
Table 1. ROC AUCs for models established in Figs. 1 and 3.a
Healthyserum T2D CHF CHF/MI/T2D CHF/T2D CHF/MI
All healthy 1.00 0.98 1.00 0.98 1.00 Conventional PCA
1.00 0.95 1.00 0.99 1.00 Biologically supervised PCAb
Healthy plasma 0.99 1.00 0.99 1.00 0.98 1.00 Conventional PCA
0.80 1.00 0.97 1.00 1.00 1.00 Biologically supervised PCA
Healthy serum 1.00 0.99 1.00 0.98 1.00 Conventional PCA
1.00 0.95 1.00 0.99 1.00 Biologically supervised PCA
T2D 1.00 0.89 1.00 0.98 Conventional PCA
1.00 0.76 1.00 0.95 Biologically supervised PCA
CHF 0.98 0.77 0.98 Conventional PCA
1.00 0.84 1.00 Biologically supervised PCA
CHF/MI/T2D 0.97 0.81 Conventional PCA
0.97 0.94 Biologically supervised PCA
CHF/T2D 0.97 Conventional PCA
0.99 Biologically supervised PCA
a For each paired cohort comparison in this pivot table, linear kernel support vector machine was used to draw a best-separating plane across 3 dimensions togenerate distributions along an orthogonal axis, which became a new univariate scale by which to produce ROC curves.
b x Axis is PC1 of albumin, DBP, CRP, B2M, and CysC glycation; y axis is PC1 of apoAI and apoCI oxidation; z axis is PC1 of native apoC-I, apoC-I [3–57], nativeRANTES, and RANTES [3–68].
722 Clinical Chemistry 57:5 (2011)
Results
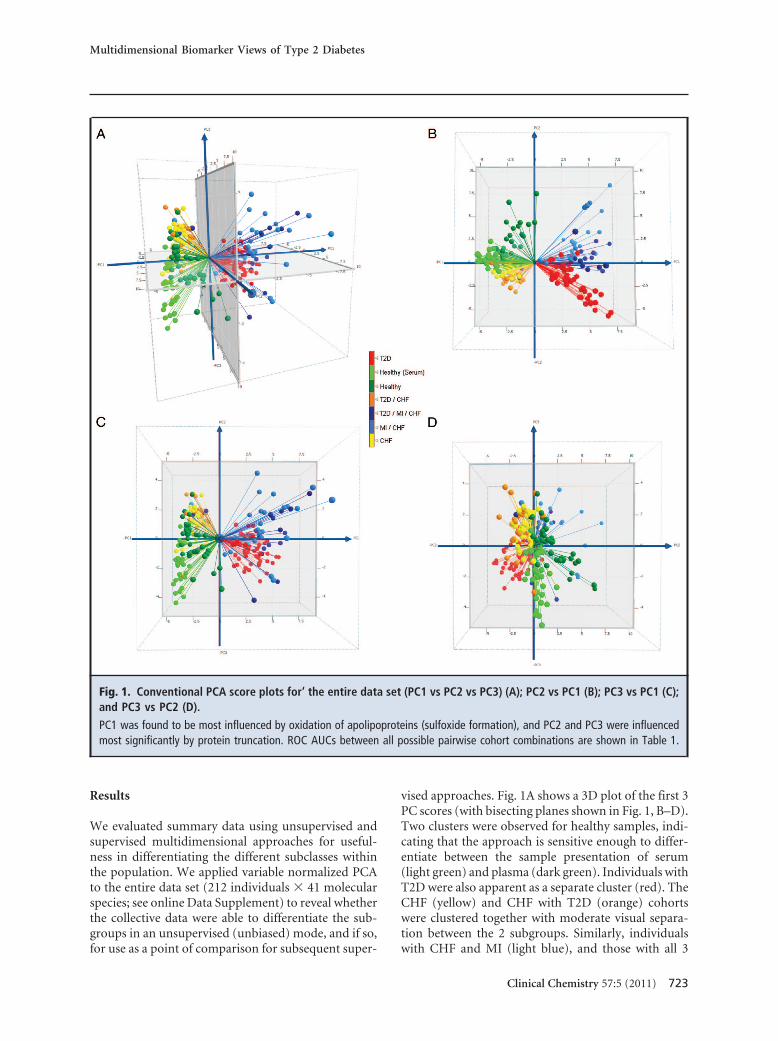
We evaluated summary data using unsupervised andsupervised multidimensional approaches for useful-ness in differentiating the different subclasses withinthe population. We applied variable normalized PCAto the entire data set (212 individuals � 41 molecularspecies; see online Data Supplement) to reveal whetherthe collective data were able to differentiate the sub-groups in an unsupervised (unbiased) mode, and if so,for use as a point of comparison for subsequent super-
vised approaches. Fig. 1A shows a 3D plot of the first 3PC scores (with bisecting planes shown in Fig. 1, B–D).Two clusters were observed for healthy samples, indi-cating that the approach is sensitive enough to differ-entiate between the sample presentation of serum(light green) and plasma (dark green). Individuals withT2D were also apparent as a separate cluster (red). TheCHF (yellow) and CHF with T2D (orange) cohortswere clustered together with moderate visual separa-tion between the 2 subgroups. Similarly, individualswith CHF and MI (light blue), and those with all 3
Fig. 1. Conventional PCA score plots for‘ the entire data set (PC1 vs PC2 vs PC3) (A); PC2 vs PC1 (B); PC3 vs PC1 (C);and PC3 vs PC2 (D).
PC1 was found to be most influenced by oxidation of apolipoproteins (sulfoxide formation), and PC2 and PC3 were influencedmost significantly by protein truncation. ROC AUCs between all possible pairwise cohort combinations are shown in Table 1.
Multidimensional Biomarker Views of Type 2 Diabetes
Clinical Chemistry 57:5 (2011) 723
conditions (dark blue), were clustered in 1 group withmoderate separation. On evaluation of the loading val-ues contributing most significantly to the principalcomponents, we found PC1 to be most influenced byoxidation of apolipoproteins (sulfoxide formation),and PC2 and PC3 were influenced most significantly byprotein truncation. Interestingly, protein glycation wasnot in the top 5 loading values for any of PC1–3, despitethe fact that one eighth of the variables in the data setstem from protein glycation.
ROC AUC values between the subgroups are re-ported in Table 1. A significant ROC value was ob-served between healthy plasma and serum (0.99). Incontrast, the ROC AUC values of the disease subgroupsdid not change significantly compared with either ofthe healthy sample presentations. These findings indi-cate that the molecular differences present in the dis-ease subgroups were more pronounced than thosefound in the healthy controls (regardless of sample pre-sentation). As a note of protocol, biomarker develop-ment should be undertaken with standardized (singu-lar) sample presentation. Accordingly, all subgroupsunder investigation were presented in plasma, whichcomparatively yielded ROC AUC values of 0.98 –1.0between healthy groups and any of the disease sub-groups. ROC AUC values between the disease sub-groups ranged from 0.77 to 1.0, indicating moderate toexcellent separation of the nonhealthy subcohorts.
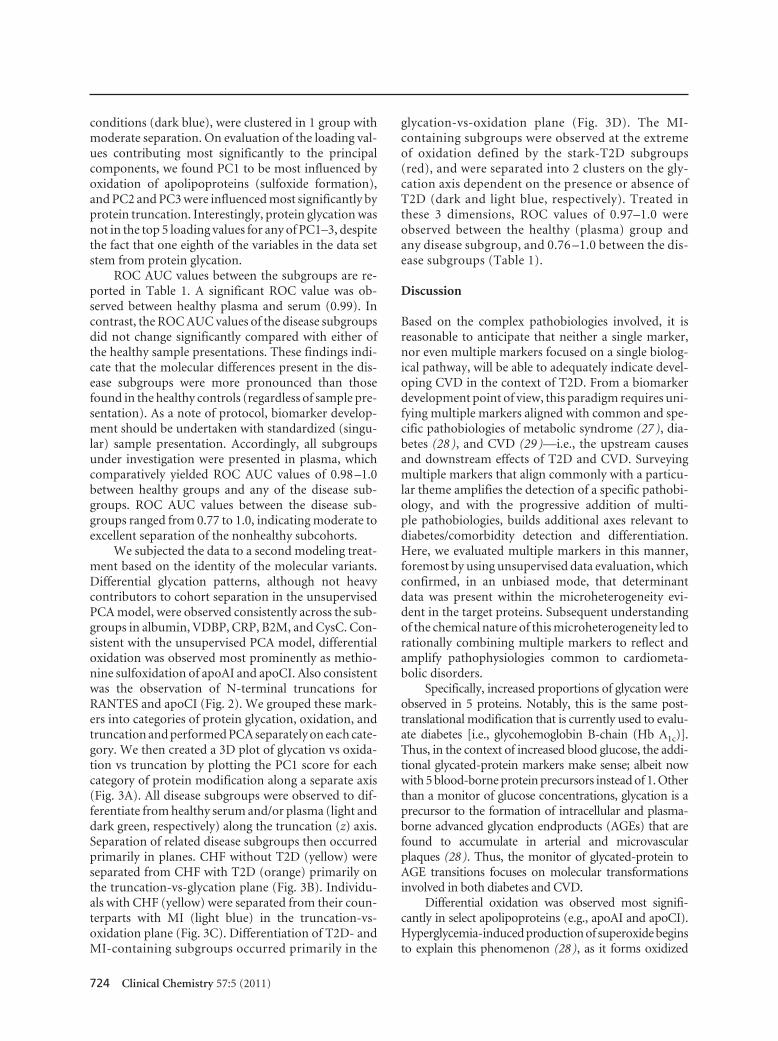
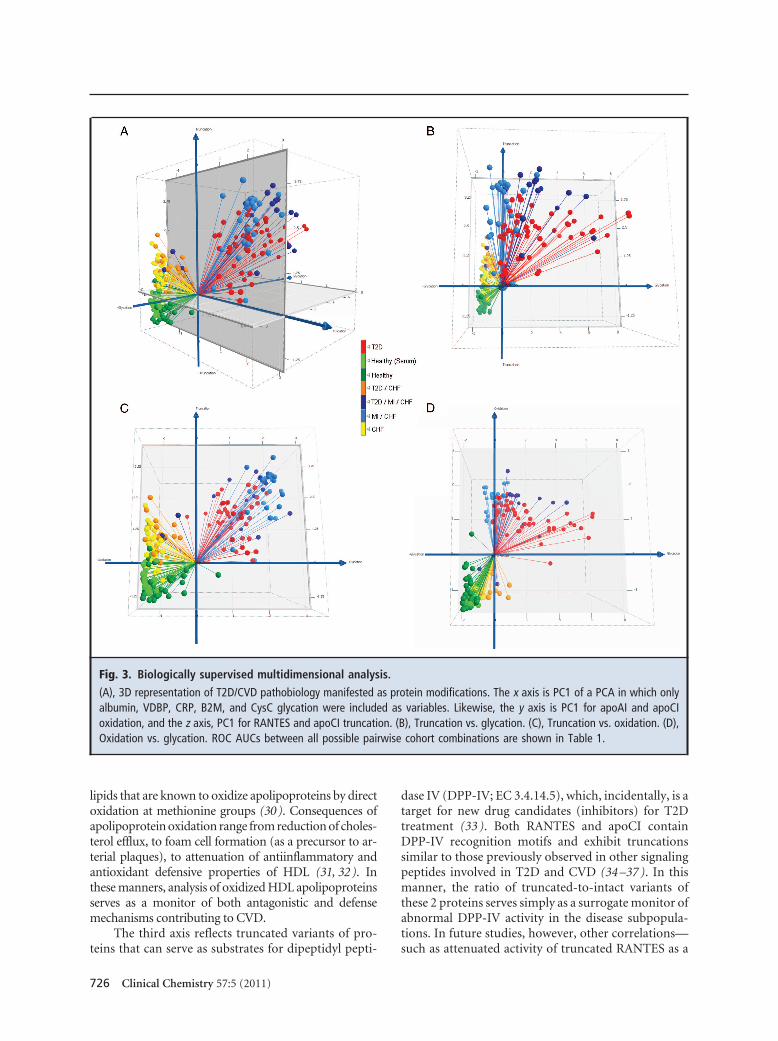
We subjected the data to a second modeling treat-ment based on the identity of the molecular variants.Differential glycation patterns, although not heavycontributors to cohort separation in the unsupervisedPCA model, were observed consistently across the sub-groups in albumin, VDBP, CRP, B2M, and CysC. Con-sistent with the unsupervised PCA model, differentialoxidation was observed most prominently as methio-nine sulfoxidation of apoAI and apoCI. Also consistentwas the observation of N-terminal truncations forRANTES and apoCI (Fig. 2). We grouped these mark-ers into categories of protein glycation, oxidation, andtruncation and performed PCA separately on each cate-gory. We then created a 3D plot of glycation vs oxida-tion vs truncation by plotting the PC1 score for eachcategory of protein modification along a separate axis(Fig. 3A). All disease subgroups were observed to dif-ferentiate from healthy serum and/or plasma (light anddark green, respectively) along the truncation (z) axis.Separation of related disease subgroups then occurredprimarily in planes. CHF without T2D (yellow) wereseparated from CHF with T2D (orange) primarily onthe truncation-vs-glycation plane (Fig. 3B). Individu-als with CHF (yellow) were separated from their coun-terparts with MI (light blue) in the truncation-vs-oxidation plane (Fig. 3C). Differentiation of T2D- andMI-containing subgroups occurred primarily in the
glycation-vs-oxidation plane (Fig. 3D). The MI-containing subgroups were observed at the extremeof oxidation defined by the stark-T2D subgroups(red), and were separated into 2 clusters on the gly-cation axis dependent on the presence or absence ofT2D (dark and light blue, respectively). Treated inthese 3 dimensions, ROC values of 0.97–1.0 wereobserved between the healthy (plasma) group andany disease subgroup, and 0.76 –1.0 between the dis-ease subgroups (Table 1).
Discussion
Based on the complex pathobiologies involved, it isreasonable to anticipate that neither a single marker,nor even multiple markers focused on a single biolog-ical pathway, will be able to adequately indicate devel-oping CVD in the context of T2D. From a biomarkerdevelopment point of view, this paradigm requires uni-fying multiple markers aligned with common and spe-cific pathobiologies of metabolic syndrome (27 ), dia-betes (28 ), and CVD (29 )—i.e., the upstream causesand downstream effects of T2D and CVD. Surveyingmultiple markers that align commonly with a particu-lar theme amplifies the detection of a specific pathobi-ology, and with the progressive addition of multi-ple pathobiologies, builds additional axes relevant todiabetes/comorbidity detection and differentiation.Here, we evaluated multiple markers in this manner,foremost by using unsupervised data evaluation, whichconfirmed, in an unbiased mode, that determinantdata was present within the microheterogeneity evi-dent in the target proteins. Subsequent understandingof the chemical nature of this microheterogeneity led torationally combining multiple markers to reflect andamplify pathophysiologies common to cardiometa-bolic disorders.
Specifically, increased proportions of glycation wereobserved in 5 proteins. Notably, this is the same post-translational modification that is currently used to evalu-ate diabetes [i.e., glycohemoglobin B-chain (Hb A1c)].Thus, in the context of increased blood glucose, the addi-tional glycated-protein markers make sense; albeit nowwith 5 blood-borne protein precursors instead of 1. Otherthan a monitor of glucose concentrations, glycation is aprecursor to the formation of intracellular and plasma-borne advanced glycation endproducts (AGEs) that arefound to accumulate in arterial and microvascularplaques (28). Thus, the monitor of glycated-protein toAGE transitions focuses on molecular transformationsinvolved in both diabetes and CVD.
Differential oxidation was observed most signifi-cantly in select apolipoproteins (e.g., apoAI and apoCI).Hyperglycemia-induced production of superoxide beginsto explain this phenomenon (28), as it forms oxidized
724 Clinical Chemistry 57:5 (2011)

B2M CysCNative protein
Native protein
OH-Pro11 730
13 344
13 360
11 700 11 750 11 800 11 850 11 900 11 950 m/z
Glycation
13 000 13 100 13 200 13 300 13 400 13 500 13 600 m/z
Glycation
Albumin Native Cysteinylated (S-SCys)m/z 66 558
−S (N-terminal)−SSP (N-terminal)
51 189 Vitamin D Binding N ti t i
11 892
Formm/z 66 439
m/z
Glycated & Cysteinylated
Glycated & S-CysGlycinyl, m/z 66 601 & 66 615, respectively
Doubly Glycated & Cysteinylated
m/z 66 720
Doubly Glycatedm/z 66 763
51 351 (Glycation)
51 846 Glycosylation
52 008(Glycosylation
gProteinNative protein
66 000 66 200 66 400 66 600 66 800 67 000 67 200 m/z
y ym/z 66 882
50 800 51 000 51 200 51 400 51 600 51 800 52 000 m/z
(Glycosylation& Glycation)
23 029
CRPNative protein
23 191Glycation
22 600 22 700 22 800 22 900 23 000 23 100 23 200 23 300 23 400 23 500 m/z
28079
NativeProtein apoAI
apoCI NativeProtein
+16, +32, +48 Da
28 080
6632
t i l)
+16 Da
+16 Da
27 400 27 600 27 800 28 000 28 200 28 400 28 600 m/z
6300 6350 6400 6450 6500 6550 6600 6650 6700 6750 6800 m/z
−TP (N-terminal)6433
7848RANTESNative protein [1–68]
7664Truncated protein [3–68]
7000 7200 7400 7600 7800 8000 8200 8400 m/z
Fig. 2. Representative mass spectra of glycated, oxidized, and/or truncated proteins.
Spectra from healthy patients are shown in green, and spectra from diabetic patients are shown in red. Differences in proteinglycation, oxidation, and truncation between the patient cohorts are apparent in the mass spectra. Proteins with a nominalmolecular weight �20 kDa were analyzed by ESI-MS.
Multidimensional Biomarker Views of Type 2 Diabetes
Clinical Chemistry 57:5 (2011) 725
lipids that are known to oxidize apolipoproteins by directoxidation at methionine groups (30). Consequences ofapolipoprotein oxidation range from reduction of choles-terol efflux, to foam cell formation (as a precursor to ar-terial plaques), to attenuation of antiinflammatory andantioxidant defensive properties of HDL (31, 32). Inthese manners, analysis of oxidized HDL apolipoproteinsserves as a monitor of both antagonistic and defensemechanisms contributing to CVD.
The third axis reflects truncated variants of pro-teins that can serve as substrates for dipeptidyl pepti-
dase IV (DPP-IV; EC 3.4.14.5), which, incidentally, is atarget for new drug candidates (inhibitors) for T2Dtreatment (33 ). Both RANTES and apoCI containDPP-IV recognition motifs and exhibit truncationssimilar to those previously observed in other signalingpeptides involved in T2D and CVD (34 –37 ). In thismanner, the ratio of truncated-to-intact variants ofthese 2 proteins serves simply as a surrogate monitor ofabnormal DPP-IV activity in the disease subpopula-tions. In future studies, however, other correlations—such as attenuated activity of truncated RANTES as a
Fig. 3. Biologically supervised multidimensional analysis.
(A), 3D representation of T2D/CVD pathobiology manifested as protein modifications. The x axis is PC1 of a PCA in which onlyalbumin, VDBP, CRP, B2M, and CysC glycation were included as variables. Likewise, the y axis is PC1 for apoAI and apoCIoxidation, and the z axis, PC1 for RANTES and apoCI truncation. (B), Truncation vs. glycation. (C), Truncation vs. oxidation. (D),Oxidation vs. glycation. ROC AUCs between all possible pairwise cohort combinations are shown in Table 1.
726 Clinical Chemistry 57:5 (2011)

chemokine and influences on ApoCI activation of lec-ithin cholesterol acyltransferase (38 – 40 )—may beconsidered.
These studies have produced multidimensional“views” based on microheterogeneity aligned with dis-ease pathobiologies, which are able to accurately differ-entiate between small scouting cohorts of differentsubtypes of T2D/CVD. We consider these findings apromising starting point for expanded studies—i.e.,addition of more markers reflective of other pathobi-ologies and application to large longitudinal cohorts—aimed at verifying multimarker panels for use in mon-itoring across the T2D–CVD continuum.
Author Contributions: All authors confirmed they have contributed tothe intellectual content of this paper and have met the following 3 re-
quirements: (a) significant contributions to the conception and design,acquisition of data, or analysis and interpretation of data; (b) draftingor revising the article for intellectual content; and (c) final approval ofthe published article.
Authors’ Disclosures or Potential Conflicts of Interest: Upon man-uscript submission, all authors completed the Disclosures of PotentialConflict of Interest form. Potential conflicts of interest:
Employment or Leadership: R.W. Nelson, President, Intrinsic Bio-probes, Inc.Consultant or Advisory Role: R.W. Nelson, Intrinsic Bioprobes, Inc.Stock Ownership: R.W. Nelson, Intrinsic Bioprobes, Inc.Honoraria: None declared.Research Funding: R.W. Nelson, NIH grants R24DK083948 andR01DK082542.Expert Testimony: None declared.
Role of Sponsor: The funding organizations played no role in thedesign of study, choice of enrolled patients, review and interpretationof data, or preparation or approval of manuscript.
References
1. Brunner EJ, Shipley MJ, Witte DR, Fuller JH, Mar-mot MG. Relation between blood glucose andcoronary mortality over 33 years in the WhitehallStudy. Diabetes Care 2006;29:26–31.
2. Diagnosis and classification of diabetes mellitus.Diabetes Care 2010;33 Suppl 1:S62–9.
3. Bierman EL. George Lyman Duff MemorialLecture: Atherogenesis in diabetes. ArteriosclerThromb 1992;12:647–56.
4. Libby P, Plutzky J. Diabetic macrovascular disease:the glucose paradox? Circulation 2002;106:2760–3.
5. Selvin E, Marinopoulos S, Berkenblit G, Rami T,Brancati FL, Powe NR, Golden SH. Meta-analysis:glycosylated hemoglobin and cardiovascular dis-ease in diabetes mellitus. Ann Intern Med 2004;141:421–31.
6. Selvin E, Steffes MW, Zhu H, Matsushita K,Wagenknecht L, Pankow J, et al. Glycated hemo-globin, diabetes, and cardiovascular risk in non-diabetic adults. N Engl J Med 2010;362:800–11.
7. Gerstein HC, Miller ME, Byington RP, Goff DC Jr,Bigger JT, Buse JB, et al. Effects of intensiveglucose lowering in type 2 diabetes. N Engl J Med2008;358:2545–59.
8. Duckworth W, Abraira C, Moritz T, Reda D,Emanuele N, Reaven PD, et al. Glucose controland vascular complications in veterans with type2 diabetes. N Engl J Med 2009;360:129–39.
9. Patel A, MacMahon S, Chalmers J, Neal B,Billot L, Woodward M, et al. Intensive bloodglucose control and vascular outcomes in pa-tients with type 2 diabetes. N Engl J Med2008;358:2560 –72.
10. Nissen SE, Wolski K. Rosiglitazone revisited: anupdated meta-analysis of risk for myocardial in-farction and cardiovascular mortality. Arch InternMed 2010;170:1191–201.
11. FOA. FDA guidance for industry: diabetesmellitus: evaluating cardiovascular risk in newantidiabetic therapies to treat type 2 diabetes.U.S. Department of Health and Human Services,Food and Drug Administration, Center for DrugEvaluation and Research (CDER); 2008.
12. Nedelkov D, Kiernan UA, Niederkofler EE, TubbsKA, Nelson RW. Investigating diversity in human
plasma proteins. Proc Natl Acad Sci U S A 2005;102:10852–7.
13. Niederkofler EE, Tubbs KA, Gruber K, NedelkovD, Kiernan UA, Williams P, Nelson RW. Deter-mination of beta-2 microglobulin levels inplasma using a high-throughput mass spectro-metric immunoassay system. Anal Chem 2001;73:3294 –9.
14. Niederkofler EE, Tubbs KA, Kiernan UA, NedelkovD, Nelson RW. Novel mass spectrometric immu-noassays for the rapid structural characterizationof plasma apolipoproteins. J Lipid Res 2003;44:630–9.
15. Borges CR, Jarvis JW, Oran PE, Rogers SP, NelsonRW. Population studies of intact vitamin D bind-ing protein by affinity capture ESI-TOF-MS.J Biomol Tech 2008;19:167–76.
16. Borges CR, Rehder DS, Jarvis JW, Schaab MR,Oran PE, Nelson RW. Full-length characterizationof proteins in human populations. Clin Chem2010;56:202–11.
17. Kiernan UA, Addobbati R, Nedelkov D, NelsonRW. Quantitative multiplexed C-reactive proteinmass spectrometric immunoassay. J ProteomeRes 2006;5:1682–7.
18. Kiernan UA, Nedelkov D, Nelson RW. Multiplexedmass spectrometric immunoassay in biomarkerresearch: a novel approach to the determinationof a myocardial infarct. J Proteome Res 2006;5:2928–34.
19. Kiernan UA, Nedelkov D, Tubbs KA, NiederkoflerEE, Nelson RW. Proteomic characterization ofnovel serum amyloid P component variants fromhuman plasma and urine. Proteomics 2004;4:1825–9.
20. Oran PE, Sherma ND, Borges CR, Jarvis JW, Nel-son RW. Intrapersonal and populational hetero-geneity of the chemokine RANTES. Clin Chem2010;56:1432–41.
21. Nedelkov D, Tubbs KA, Niederkofler EE, KiernanUA, Nelson RW. High-throughput comprehensiveanalysis of human plasma proteins: a step towardpopulation proteomics. Anal Chem 2004;76:1733–7.
22. Jaleel A, Halvatsiotis P, Williamson B, Juhasz P,
Martin S, Nair KS. Identification of Amadori-modified plasma proteins in type 2 diabetes andthe effect of short-term intensive insulin treat-ment. Diabetes Care 2005;28:645–52.
23. Bar-Or D, Heyborne KD, Bar-Or R, Rael LT, Win-kler JV, Navot D. Cysteinylation of maternalplasma albumin and its association with intra-uterine growth restriction. Prenat Diagn 2005;25:245–9.
24. Kiernan UA, Nedelkov D, Niederkofler EE,Tubbs KA, Nelson RW. High-throughput affinitymass spectrometry. Methods Mol Biol 2006;328:141–50.
25. Jolliffe IT. Principal component analysis. Springer-Verlag, 1986:78–108pp.
26. Zweig MH, Campbell G. Receiver-operatingcharacteristic (ROC) plots: a fundamental eval-uation tool in clinical medicine. Clin Chem1993;39:561–77.
27. Reaven GM. Banting Lecture 1988: Role of insulinresistance in human disease. Diabetes 1988;37:1595–607.
28. Brownlee M. The pathobiology of diabeticcomplications: a unifying mechanism. Diabetes2005;54:1615–25.
29. Stump CS, Clark SE, Sowers JR. Oxidative stress ininsulin-resistant conditions: cardiovascular impli-cations. Treat Endocrinol 2005;4:343–51.
30. Mashima R, Yamamoto Y, Yoshimura S. Reduc-tion of phosphatidylcholine hydroperoxide byapolipoprotein A-I: purification of thehydroperoxide-reducing proteins from humanblood plasma. J Lipid Res 1998;39:1133–40.
31. Shao B, Cavigiolio G, Brot N, Oda MN, HeineckeJW. Methionine oxidation impairs reverse choles-terol transport by apolipoprotein A-I. Proc NatlAcad Sci U S A 2008;105:12224–9.
32. Barter PJ, Nicholls S, Rye KA, AnantharamaiahGM, Navab M, Fogelman AM. Antiinflammatoryproperties of HDL. Circ Res 2004;95:764–72.
33. McIntosh CH, Demuth HU, Kim SJ, Pospisilik JA,Pederson RA. Applications of dipeptidyl peptidaseIV inhibitors in diabetes mellitus. Int J BiochemCell Biol 2006;38:860–72.
34. Oran PE, Jarvis JW, Borges CR, Nelson RW.
Multidimensional Biomarker Views of Type 2 Diabetes
Clinical Chemistry 57:5 (2011) 727

C-peptide microheterogeneity in type 2 diabe-tes populations. Proteomics Clin Appl 2010;4:1– 6.
35. Niederkofler EE, Kiernan UA, O’Rear J, Menon S,Saghir S, Protter AA, et al. Detection of endoge-nous B-type natriuretic peptide at very low con-centrations in patients with heart failure. CircHeart Fail 2008;1:258–64.
36. Rasmussen HB, Branner S, Wiberg FC, Wagtmann
N. Crystal structure of human dipeptidyl pepti-dase IV/CD26 in complex with a substrate analog.Nat Struct Biol 2003;10:19–25.
37. Brandt I, Lambeir AM, Maes MB, Scharpe S, DeMeester I. Peptide substrates of dipeptidyl pepti-dases. In: Lendeckel U, Reinhold D, Bank U, eds.Dipeptidyl aminopeptidases: basic science andclinical applications. Springer Science�BusinessMedia, 2006:3–18.
38. Jong MC, Hofker MH, Havekes LM. Role of ApoCsin lipoprotein metabolism: functional differencesbetween ApoC1, ApoC2, and ApoC3. ArteriosclerThromb Vasc Biol 1999;19:472–84.
39. Tall AR. An overview of reverse cholesterol trans-port. Eur Heart J 1998;19 Suppl A:A31–5.
40. Spady DK. Reverse cholesterol transport and ath-erosclerosis regression. Circulation 1999;100:576–8.
728 Clinical Chemistry 57:5 (2011)