Embed Size (px)
Citation preview

1 | Biomass Program eere.energy.gov
Biomass Utilization for Fuels, Products and Power
The Chemical Sciences Roundtable:Opportunities and Obstacles in Large-Scale Biomass UtilizationNAS Keck Center May 31,2012
Brian DuffDOE Biomass Program

2 | Biomass Program eere.energy.gov
Outline
• The Importance of Biomass Utilization for Fuels and Chemicals
• The Potential of Biomass
• The Biomass Utilization “Supply Chain”o Feedstockso Conversion Technologieso Products and Markets
• Project Development for New Technology Applications in an Emerging Industry
“ Emphasis on the contribution of the Chemical Sciences including Process Engineering and Synthetic Biology”

3 | Biomass Program eere.energy.gov
Why are Biomass and Biofuels so Important?

4 | Biomass Program eere.energy.gov
Energy links major global challenges
Global Energy Challenges
EnergyEnvironment
Security
Economy

5 | Biomass Program eere.energy.gov
A Clean Energy Vision
Clean Energy Solutions
Environment
Security
• Jobs• Innovation• Exports
• Clean air• Climate
• Energy self‐reliance• Stable, diverse energy supply
Economy

6 | Biomass Program eere.energy.gov
The Importance and Relevance of Biofuels
Energy Security:o We import ~50% of our liquid fuels, often from countries who are
antagonistic towards the USo We are a captive market dependent on countries we cannot rely on
National Security:o We expend a significant amount of our military budget in funding and
personnel in activities directly related to maintaining our access to oilo Our National Security is related to our Economy
Economic Security:o Our dependence on oil and impact of oil prices acts like a throttle on
our economic engineo The impact of rising oil prices reverberates through the economy,
raising the prices of goods and services and driving inflation
SECURITY!

7 | Biomass Program eere.energy.gov
Trade Deficit• We spend over $300 billion/year on
imported oil, much of which finds its way into foreign treasuries:
• ~$1 billion/day!!!!
THE ECONOMY
www.census.govGDP: Rural Economic Development and JOBS
• Creating 50-75 new direct jobs per biorefinery
• Reinvigorating rural economies• Creating major new energy crop
markets
The Importance and Relevance of Biofuels

8 | Biomass Program eere.energy.gov
Value of Biofuels
Pump price: $125/bbl($3/gal)
Biomass Cost of feedstock supply and logistics: $31/bbl
Cost of conversion, distribution, marketing:
$74/bbl
Taxes: $20/bbl =+ +
Pump price: $125/bbl($3/gal)
Cost of production & transport (avg.): $20/bbl
Profit to host country : $55/bbl
Cost of refining & marketing: $30/bbl
Taxes: $20/bbl =+ ++
Price differential between imported crude oil and biomass: $75/bbl x 4.3 x 10⁹ barrels/year = $323 billion/year
Sources: EIA, Annual Energy Review OBP MYPP
Lost
Imported crude oil ($75/bbl)

9 | Biomass Program eere.energy.gov
High Cost for Oil Imports
All costs in US$2011Sources: IEA, WhatItCosts.com, Wikipedia, CFO.com Magazine, USInflationCalculator.com
Cost of Oil imports (2010)
$300 B ≈
2 x Apollo Space Program
is equivalent to
$135 B ≈
$300 B ≈
20 x Chunnel
5 x Three
Gorges Dam

10 | Biomass Program eere.energy.gov
The Importance and Relevance of Biofuels
• Petroleum dependency contributes to anthropogenic GHG emissions
• Rising levels of CO2 are decreasing the pH of our oceans, upsetting delicate and vital ecosystems such as coral reefs
• Biofuels can reduce GHG and CO2 emissions up to 130%
• Biofuels can reduce risks & damages from oil production/transport
Sustainability• Many of our industrial practices are not sustainable• Biofuels are renewable• Production technologies and metrics are being
developed for sustainable biofuels production
The ENVIRONMENT!
Source: http://prasoondiwakar.com

11 | Biomass Program eere.energy.gov
The Importance and Relevance of Biofuels
• Biofuels contribute to our economic prosperity
• As developing nations grow their economies, the US will need to move away from using 25% of every daily barrel of oil to ~10% or less , more reflective of our relative populations
• To maintain our quality of life, we need to develop new energy sources and renewable bio-based analogs for petrochemical fuels and products
QUALITY OF LIFE!

12 | Biomass Program eere.energy.gov
Drivers:
Growing energy demand, especially in China, India and Latin America
Increasing expectations onclimate change and sustainability
Increasing concern about security / diversity of energy supply
National priorities to support rural / agricultural jobs and communities
Desire to improve balance of trade
Biomass Potential–Global Perspectives
Constraints:Crude oil pricesLand – DLUC & ILUCAvailability of capitalTrade barriers and regulationsWater supply and waste-treatment facilities capacityInputs – Logistics fertilizer, labor, . . . Community impacts – odor, noise, traffic . . NIMBY / BANANA / CAVE

13 | Biomass Program eere.energy.gov
The Importance and Relevance of Biofuels
Other Considerations
• Liquid fuels are a premium product application: we pay for energy density and convenience. In the near term, biofuels are the only alternative that fits our lifestyle
• Biomass is not unlimited: “Best Use of Biomass” dictates the highest value product application
• Electricity generation has many other options: Hydro, Nuclear, Wind, Solar, Geothermal, Wave, Ocean Thermal
• There is no other option for liquid transportation fuels and petrochemicals besides biomass
• Electrifying the vehicle fleet does not address GHG issues unless generation uses renewable, sustainable sources

14 | Biomass Program eere.energy.gov14
The Future of Energy
“The Stone Age did not end for lack of stone, and the Oil Age will end long before the world runs out of oil.”
-- Sheikh Zaki Yamani, Saudi Arabian oil minister in the 1970s
Source: IEA Resources to Reserves 2005

15 | Biomass Program eere.energy.gov
The Potential of Biomass for Fuels, Chemicals and Power

16 | Biomass Program eere.energy.gov
The Potential of Biomass
• Dramatically reduce dependence on foreign oil for fuels and chemicals
• Promote the use of diverse, domestic and sustainable energy resource
• Establish a domestic bioindustry
• Reduce carbon emissions from energy production and consumption

17 | Biomass Program eere.energy.gov
Biomass: Value to the Nation(and States, Counties, Cities & Towns)
• Creates / saves jobs and provides boost to rural economies
• Majority of jobs cannot be outsourced
• Mitigates direct and indirect costs of imported oil (trade deficit, diplomatic & military impacts)
• Supports preservation / expansion of U.S. leadership status in key industrial / agricultural technology & manufacturing
• Reduces environmental impacts of continued use of imported and domestic crude oil

18 | Biomass Program eere.energy.gov
• Cannot replace a multi-trillion dollar infrastructure overnight
• Must balance pace and cost of disruption • Economics will drive transitions . . .
at their own pace!
Pace as important as direction

19 | Biomass Program eere.energy.gov19
Mandates Drive U.S. Biofuels Demand
Source: EIA Annual Energy Outlook 2009 & Chevron Analysis
0.0
0.5
1.0
1.5
2.0
2.5
3.0
3.5
2005 2010 2015 2020 2025 20300.0%
2.0%
4.0%
6.0%
8.0%
10.0%
12.0%
14.0%
16.0%
U.S. Biofuels Demand in MMBOED % of U.S. Liquids Demand
Corn Ethanol (15 BGY Cap)
Biodiesel & Advanced
Biofuels Targets Under EISA
Obama
60 BGY Plan
Percentage of Biofuels in Total U.S. Liquids Demand

20 | Biomass Program eere.energy.gov
Feedstocks, Platforms, ProductsFeedstocks: Use of waste streams (ag / forest / urban wastes), energy crops & algae – could replace >50% of imported crude (>$200 billion/yr.)
Flexible platforms for multiple current & future products – portfolio approach to optimize across multiple feedstocks and regions:• Fermentable sugars• Synthesis gas
Products:• Ethanol – Gasoline blendstock; feedstock supply, logistics, and processing
technologies can be leveraged for other / next-generation fuels and products• Renewable Hydrocarbon Fuels – Compatible with existing infrastructure,
vehicles & refineries; address long-term need for diesel and jet fuel• Enabling and Complementary Technologies
– Bioproducts – Improve projects economics and fully replace crude product slate– Biopower – GHG reduction, feedstock supply & logistics
• Pyrolysis oil• Algal oil/lipids

21 | Biomass Program eere.energy.gov
Biomass Potential

22 | Biomass Program eere.energy.gov
Biomass Potential: Power or Fuels?Power Potential:
Electrical Capacity in the US is ~985 GW
Renewable Energy currently contributes ~125 GW (~13%)
Hydro is ~78 GW (63% of RE; ~8% of total)
Biomass (waste and wood) is currently ~13 GW (11% of RE; 1.3% of total
1 billion tons of biomass is ~47 GW of potential; ~4.7% of total
Fuels Potential
US currently uses ~220 billion gallons of liquid fuels annually
1 billion tons of biomass is ~65 billion gallons of potential; ~30%
Best use of biomass is for fuels and chemicals

23 | Biomass Program eere.energy.gov
Feedstocks like naphtha, pen-hex, BTX, light paraffins & olefins help form the basis of a ~$375 billion petrochemical industry.
Products Made from a Barrel of Crude Oil (gallons)

24 | Biomass Program eere.energy.gov
Value in a Barrel of Crude Oil (gallons)

25 | Biomass Program eere.energy.gov
Biomass Potential:Chemical Products
35
30
25
10
Chemical Industry Sectors by Percent of Sales
Basic Chemicals
Life Sciences
Specialty Chemicals
Consumer Products
26 | Biomass Program eere.energy.gov
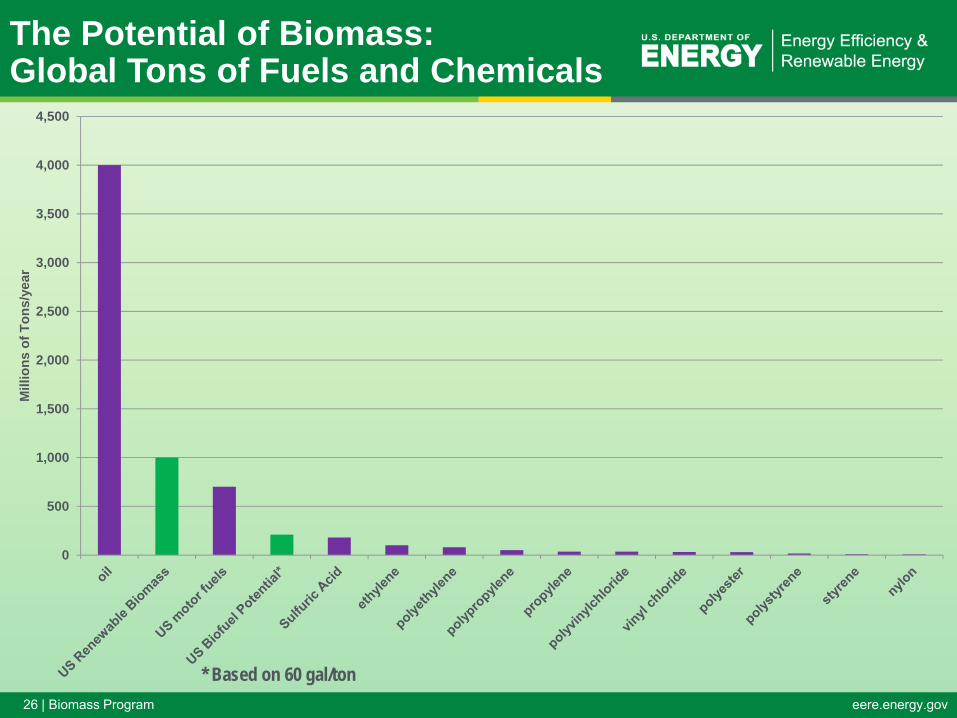
The Potential of Biomass:Global Tons of Fuels and Chemicals
0
500
1,000
1,500
2,000
2,500
3,000
3,500
4,000
4,500
Mill
ions
of T
ons/
year
* Based on 60 gal/ton

27 | Biomass Program eere.energy.gov
The Potential of Biomass: Global Tons of Top Polymers
0
200,000,000
400,000,000
600,000,000
800,000,000
1,000,000,000
1,200,000,000
mill
ion
tons
per
yea
r
* Based on 60 gal/ton

28 | Biomass Program eere.energy.gov
The Potential of Biomass: Top 10 US Chemicals by Production
0
5,000,000
10,000,000
15,000,000
20,000,000
25,000,000
30,000,000
35,000,000
40,000,000
45,000,000
50,000,000
sulfuric acid nitrogen ethylene oxygen lime ammonia propylene polyethylene chlorine phosphoric acid
mill
ion
tons
per
yea
r

29 | Biomass Program eere.energy.gov
Products from Biomass and Petroleum
P.N.R. Vennestrøm, C.M. Osmundsen and E. Taarning—Haldor Topsøe A/S

30 | Biomass Program eere.energy.gov
1,4-Diacids 2,5-Furan-dicarboxylic acid
3-Hydroxy-propionic acid
Aspartic acid
Glucaric acid Glutamic acid Itaconic acid Levulinic acid
3-Hydroxy-butyrolactone
Glycerol Sorbitol Xylitol/Arabitol
OHOH
O
OO
OH
OO
OH OH OH
OOH
OHO
ONH2
OH
O
OH
OH
O
OHOH
OH
OH
O
NH2
OH
O
OHOH
O
OOH
O
O
O O
OH
OH OHOH
OHOH
OHOHOH
OHOH
OH
OHOHOH
Building Blocks Derived From Sugars
Werpy, T., and Petersen, G. 2004. Top Value-Added Chemicals from Biomass. Volume 1: Results of Screening for Potential Candidates from Sugars and Synthesis Gas. http://www.nrel.gov/docs/fy04osti/35523.pdf

31 | Biomass Program eere.energy.gov
The Biomass Supply Chain

32 | Biomass Program eere.energy.gov
FeedstockProduction
FeedstockLogistics
BiofuelsProduction
BiofuelsDistribution
BiofuelsEnd Use
Conceptual Framework:“Farm to Fuels” or “Well to Wheels”
Sustainability and Analysis
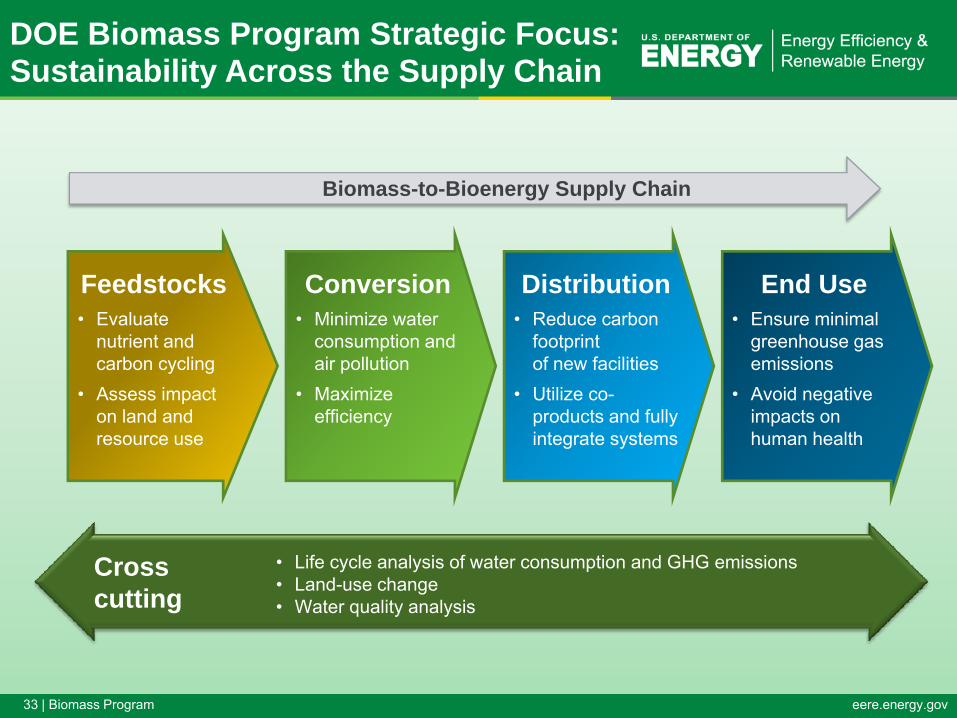
33 | Biomass Program eere.energy.gov
End Use• Ensure minimal
greenhouse gas emissions
• Avoid negative impacts on human health
• Life cycle analysis of water consumption and GHG emissions• Land-use change• Water quality analysis
Cross cutting
Distribution• Reduce carbon
footprint of new facilities
• Utilize co-products and fully integrate systems
Conversion• Minimize water
consumption and air pollution
• Maximize efficiency
Feedstocks• Evaluate
nutrient and carbon cycling
• Assess impact on land and resource use
Biomass-to-Bioenergy Supply Chain
DOE Biomass Program Strategic Focus:Sustainability Across the Supply Chain

34 | Biomass Program eere.energy.gov34
● Drivers
● Constraints
● Sources may rise & fall, but Classes of FS will exist
● Key factors:
+ Scale
+ Cost
+ Sustainability
Feedstock
● Integration with feedstock
● Integration with product
● Yield, OPEX, CAPEX
● Pathways:
+ Sugar Oil
+ Pyrolysis
+ Chemical Conversion
+ Catalytic Upgrading
+ Bio-Ethanol
Conversion
● HC Diesel
● HC Jet
● HC Gasoline
● Ethanol
● Byproducts
+ Lubricants
+ Chemicals
+ Materials
+ Power & Heat
Product
Biomass for Fuels, Chemicals, and Power–Supply Chain Issues

35 | Biomass Program eere.energy.gov35
Feedstock Conversion Product
“Initially, advanced biofuels will be produced in integrated supply
chains; no one will grow new crops without an assured customer,
and no one will finance / build new conversion capacity without an
assured source of feedstock. Truly fungible products will be traded
as commodities, but most products will also form part of an end-to-
end supply chain in early applications”
Biomass for Fuels, Chemicals, and Power–Supply Chain Issues

36 | Biomass Program eere.energy.gov
Biomass Value Chain:
Feedstocks

37 | Biomass Program eere.energy.gov37
Biofuels Feedstock
Produce scalable, sustainable, and economic feedstocks:
• Utilize existing waste streams wherever possible.
• Avoid impacts on food / feed (land, water, fertilizer, etc., ...)
• Focus on GHG footprint to meet mandate levels.
• Integrate primary conversion with feedstock type & location.
• Wood, paper, mill wastes• Agricultural & urban wastes• New oilseed crops & algae• Fast-growing grasses & trees

38 | Biomass Program eere.energy.gov
Biomass Feedstocks Have “Issues”
• Diffuse Regional Supplies
• Not Centralized or Aggregated
• Low Bulk Densities
• Inconsistent Composition (annual,
local, individual)
• Low Energy Density
• High Water Content
• Perishable
• High Oxygen Content

39 | Biomass Program eere.energy.gov
Feedstock Logistics Technical Challenges and Barriers
• Sustainable Harvesting
• Feedstock Quality and Monitoring
• Biomass Storage Systems
• Biomass Material Properties
• Biomass Physical State Alteration
• Biomass Material Handling and
Transportation
• Overall Integration and Scale-Up

40 | Biomass Program eere.energy.gov
U.S. Billion-Ton Update: Biomass Supply for a Bioenergy and Bioproducts Industry• Officially released August 10, 2011• 5 years in the making• Comprehensive and detailed
• Supply cost curves• County estimates• Modeled land use change
• Collaborative effort – 50 contributors
• Report only provides national summary – more information on website
Data and analysis tools located on the Knowledge Discovery Framework: http://bioenergykdf.net
Terrestial Feedstocks:U.S. Billion-Ton Update

41 | Biomass Program eere.energy.gov
U.S. Billion-Ton Update: Findings
• Baseline scenario at $60/dry ton– 2012
• About 473 million dry tons annually
• 45% is currently used for energy
– 2030• Nearly 1.1 billion dry tons
annually• About 30% as used• 70% as potentially additional
• High-yield scenario at $60/dry ton– Total resources
• Ranges from nearly 1.4 to over 1.6 billion dry tons annually (1% to 4% yield increases)
• 80% is potentially additional– No high-yield scenario for forest
residues
Baseline
High-yield

42 | Biomass Program eere.energy.gov
Unlocking the Resource – Addressing Stranded Feedstock Resources
Approximately 19% of the Nation’s potentially available feedstock resources are stranded – or not produced at a density that makes collection and transport economically viable
(Stranded)(Available)

43 | Biomass Program eere.energy.gov
5-20 miles
50-150 miles
150-300 miles
Current Barrier Uniform Format Supply System
SolutionLow productivity areas/stranded resources
Access to stranded resources via local depots
Risk associated with lack of stable feedstock supply (i.e. price fluctuations, extreme weather events, year-round availability)
Biomass exchange market commodity systemdecreases supply risk and price fluctuations
Lack of consistent feedstock specifications
Ability to achieve conversion specifications for feedstock quality
Technical barriers – low density, dry matter loss, etc.
Density ImprovementsMet density target of 12 lbs/cubic foot in 2010 (improved from 9 lbs/cubic foot in 2009)Pioneer depot design needs to achieve 14 -16 lbs/cubic foot
Unlocking the Resource –Creating A Depot Supply System

44 | Biomass Program eere.energy.gov
Unlocking the Resource – Ensuring a High-Quality, High-Density, Stable Feedstock Supply
Existing Feedstock Supply System
Uniform Format Supply System
Solution
~ 50% of total feedstock resource can be utilized
~ 90% of total feedstock resource can be utilized
Dry matter loss during storage >10%
Dry matter loss during storage ~ 5%
Average Transport Distance ~ 50 miles
Average Transport Distance ~ 300 miles
Achieved density target of 12 lbs/cubic foot in 2010 (improved from 9 lbs/cubic foot in 2009)
Depot design needs to achieve 20+ lbs/cubic foot
Related Projects
Idaho National Laboratory Deployable Process Demonstration Unit – Replicates one depot preprocessing unit at pilot scale
5 Industry and University-led demonstration projects to test logistics units at field scale
Core Engineering and Design work conducted at Idaho National Laboratory
Advanced Preprocessing
2012 SOT Feedstocks
Uniform FormatTargets

45 | Biomass Program eere.energy.gov
$53.70/dry ton
$37.80/dry ton$35.00/dry ton $35.00/dry ton
Maintain cost at higher feedstock quality (i.e. density, stability, convertibility, etc.) and quantities
Niche Resource Full Resource Potential
Feedstock Logistics and Supply Cost Reduction
46 | Biomass Program eere.energy.gov
Microalgae Potential
“A National Resource Availability Assessment for Microalgae Biofuel Production”
Courtesy of Pacific Northwest National LaboratoryWigmosta, MS et al., manuscript in preparation.
Critical Resources and Constraints• Climate (temperature, sunlight)• Land (10 acre ponds; 1,200 acre/farm)• Water (seawater, saline groundwater, brackish water, non-competitive surface water)• CO2 and nutrients (2 tons of carbon dioxide to 1 ton biomass; co-locate with stationary emitters)
Conclusions• Water intensity projected to be comparable to corn or soy-based biofuels• ~50M hectares available nationally
• 0 -1% slope• Excluded cropland, urban areas, open water, state parks, wilderness areas, military lands, etc.• minimum 1,200 acres contiguous area
• Gulf Coast (Texas, Louisiana, Arkansas) and Southwest (Arizona, New Mexico, and Colorado) are among ideal locations• >10 B gallons of biofuels technically feasible
•5 M hectares used (one tenth availability)• 30 T/ha/year productivity (lowest projected)• 70 gallons /T conversion (same as cellulosic)
47 | Biomass Program eere.energy.gov
The Bottom Line:Feedstock Costs Dictate Product Prices
$30
$35
$40
$45
$50
$55
$1.00
$1.25
$1.50
$1.75
$2.00
$2.25
$2.50
$2.75
$3.00
2008 2009 2010 2011 2012*
Conv
ersio
n Te
chno
logi
es $/
gal E
tOH Feedstock Logistics $/dry ton
Thermochemical ConversionBiochemical Conversion
Feedstock Logistics

48 | Biomass Program eere.energy.gov
Biomass Value Chain:
Conversion Technologies

49 | Biomass Program eere.energy.gov
Two Basic Conversion Options:
Biochemical
Thermochemical

50 | Biomass Program eere.energy.gov
Two Classic Thermochemical Options:
Gasification
Pyrolysis

51 | Biomass Program eere.energy.gov
Thermochemical Conversion: Gasification
• Rapid heating and partial oxidation– Biomass converted to CO, H2, CO2, H2O (syngas)
• High temperature (> 900 °C)• Unconverted tars, HC must be reformed• Syngas contaminants complicate downstream processes if not
removed or converted to syngas– Advantages:
• ‘Blank canvas’ for downstream catalytic conversion• Many possible chemistries to ‘build’ molecules from syngas
with current understanding of catalyst design and tools• Many examples of industrial success with syngas processes• Majority of carbon in biomass converted to CO/CO2
– Deoxygenation is straightforward: form CO2 (from CO + O) or H2O (from H2 + O) as products are made; low theoretical carbon efficiency process

52 | Biomass Program eere.energy.gov
52
Feedstock Processing
and Handling
Gasification
Feedstock
Balance of Plant
Gas Conditioning
Fuel
Catalysis / Fuel
synthesis
Gas Cleanup
Thermochemical Conversion: Gasification
Intermediate is Syngas

53 | Biomass Program eere.energy.gov
Syngas Products
• ‘Building block’ intermediates like methanol, ethylene/propylene
• Acid catalysis– MTG (Exxon) {med-quality gasoline}– Triptane (BP) {ultra-premium gasoline or jet additive}
• Fischer Tropsch– Diesel, jet, naphtha
• Mixed alcohol (e.g., Octamix, Ecalene, Envirolene)– Gasoline blendstock– Intermediate for C4 olefins, jet?
• Greater potential to replace ‘the whole barrel’ with the exception of VGO, asphalt
54 | Biomass Program eere.energy.gov
Thermochemical Conversion: Pyrolysis
• Rapid heating and liquefaction– Constituents broken down to smaller molecules
• Moderate T (300-700°C)• H2O produced• Oxygenated aromatics• Ketones, ethers, organic acids, other oxygenates• Light gases
– Advantages:• Lower energy input to biomass deconstruction• Theoretical yield of liquid products high
– Upgrading required for use as blendstocks for refineries through• Cracking• Hydrotreating

55 | Biomass Program eere.energy.gov
55
Feedstock Processing
and Handling
Pyrolysis
Feedstock
Balance of Plant
Bio-OilStabilization
Fuel
Fuel Processing
&Upgrading
Thermochemical Conversion: Pyrolysis
Intermediate is Pyrolysis Oil

56 | Biomass Program eere.energy.gov
Pyrolysis Products
• Partially deoxygenated pyrolysis oil can be inserted within the oil refining process to provide:– Medium octane gasoline and naphtha – Diesel (from aromatics)– Hydrogen for hydrotreating processes
• Full deoxygenation at biorefinery may not be cost-effective– ‘Finished’ bio-oil likely to be sold as ‘crude’ blend stock
at petroleum refineries• Compared to syngas processes tradeoffs are:
– Syngas processes: lower theoretical yield, higher value product that is a blendstock for gasoline, diesel or jet fuel
– Pyrolysis processes: higher theoretical yield to lower value product, an intermediate, that needs further upgrading to final product (if at a refinery, less capital needed)

57 | Biomass Program eere.energy.gov
Biomass Refinery-Ready Intermediates
Near-Fuels and Blendstocks
ResearchAreas
Existing Refinery Infrastructure
Atm
osph
eric
and
Vacu
um D
istil
latio
n GasLight
NaphthaHeavy
NaphthaLGOVGO
Atm. Res.Vac. Res.
Reform
FCC
Alky/Poly
HT/HC
Coker
GasolineJet Fuel
Diesel FuelCrude
Oil
Drop-In Fuels
Drop inPoint #1:Pyrolysis
Oil
Drop inPoint #3:
Fuels Blendstock
Drop inPoint #2: Stable Oil
Drop in Points 1&2 requires different tax policy than Point 3
Pyrolysis Drop-in Points Could Use Today’s Infrastructure

58 | Biomass Program eere.energy.gov
Classical Biochemical Approach to Fuels and Chemicals: Fermentation
Pretreatment Hydrolysis/Saccharification Fermentation
FuelFeedstock
Distillation/Purification
Saccharification and FermentationIntermediate is Sugar
Balance of Plant

59 | Biomass Program eere.energy.gov
FeedstockDelivery $$$
FeedstockPreparation
AnaerobicDigester orBioreactor
AnaerobicCompost $$$
Screw Press/Solids Removal
Liquid Storage
$$$
Process Heat
Biogas Storage
Co-GenSet
Flare
Energy Salesto Grid $$$
Anaerobic Digestion
Alternate Biochemical Approach to Fuels and Chemicals:

60 | Biomass Program eere.energy.gov
Novel Biological Approaches to Fuels and Chemicals
Photons
Reducing Equivalents
Acetyl-CoA
Fuel
Electrofuels

61 | Biomass Program eere.energy.gov
Significant level of R&D and available
technology
The Future of Biomass Conversion
Classical Chemical Thermochemical Domain
Bioprocessing – Biocatalyst Domain
Feed
stock Sources
Fossil/pe
troleu
m
based
Biob
ased
or R
enew
able
(sug
ars an
d ligno
cellulosics)
Width and height represent the magnitude and breadth of R&D and use in the process area or the feedstock source domain
Courtesy of B. Davison, ORNL & New Biocatalysts: Essential Tools for a Sustainable 21st Century Chemical Industry
Hybrids are the Future
Modest level of R&D and limited technology

62 | Biomass Program eere.energy.gov
New Hybrid Approaches: Syngas Fermentation
62
Thermochemical Gasification coupled with Biological Fermentation
Fermentation
Fuel
Distillation/Purification
Feedstock Processing
and HandlingGasification
Feedstock
Balance of Plant

63 | Biomass Program eere.energy.gov
New Hybrid Approaches Aqueous Phase Reforming
63
Pretreatment Hydrolysis/Saccharification
Feedstock
Balance of Plant
Chemical Catalysiscoupled with Biological Saccharification
Catalysis
Fuel
Purification

64 | Biomass Program eere.energy.gov
Algae Pathway:Intermediate is Algal Oil
64
Green = algae cell density
Lipid Extraction
PhaseSeparation
Solvent Distillation
Upgrading (hydrotreater)
Anaerobic Digestion
Algae Growth
CO2
Makeup nutrients
Recycle nutrients/ water
Makeup solvent Solvent recycle
Spent algae+ water
Sludge
Biogas for
energy Flue gas from turbine
HydrogenOffgas
Naphtha
Diesel
Rawoil
Power
Flocculent
Recycle water Blowdown
Makeup water
CentrifugeDAFSettling
0.05% (OP)0.4% (PBR)
1% 10% 20%
Steam turbinecombined cycle
10%
5%
Red = harvesting/extraction losses
10%
65 | Biomass Program eere.energy.gov
Feedstock Conversion Intermediate Conversion Product Partner
Biomass Conversion Pathways

66 | Biomass Program eere.energy.gov
Feedstock Conversion Intermediate Conversion Product Partner
Biomass Conversion Pathways

67 | Biomass Program eere.energy.gov67
Biofuels Conversion
Create technologies to bring biofuels to an industrial scale:
• Utilize existing refinery equipment where possible.
• Minimize CAPEX for primary conversion; generate energy-dense liquid intermediates.
• Match conversion strategy to feedstock chemistry.
• Learn from agricultural & fuels industries’ practices.
• Integrate final conversion with existing plants / locations and distribution infrastructure.

68 | Biomass Program eere.energy.gov
Biomass Value Chain:
Products and Markets for Bio-based Fuels and Chemicals

69 | Biomass Program eere.energy.gov
Map of Products from Petroleum-based Feedstocks

70 | Biomass Program eere.energy.gov
Map of Potential Products from Biomass Feedstocks

71 | Biomass Program eere.energy.gov
Start with the End in Mind: What Fuels?
• Aviation Fuels– Jet A (most common commercial fuel)– Jet B (cold regions)– JP-X (military grades)– Requirements:
• Essentially zero O, S• C8-C16• Very low freeze point = branching and unsaturation (≤ - 40°C)• High auto ignition temperature (≥ 210°C)• Aromatics ≤ 20%
• Diesel– Requirements:
• high cetane (≥ 40 required) = minimal branching• High energy density = some aromatics (≤ 30% allowed)• Low cloud point = branching• C8-C21• Low S (≤ 15 ppm, may get lower with new fuel standards)• No O allowed for non-FAME blends without EPA register/waiver/E-tests (big $)
• Gasoline– Requirements:
• High octane (≥ 87) = branching, low MW• C4-C12• High energy density = more aromatics• Aromatics ≤ 40% (Europe), similar regulations coming for US• Low O, S (≤ 3.7%, 80ppm, may get lower with new fuel standards)• Required ranges for boiling, vapor pressure• Stable, no crystallization (durene +) or phase separation in water
cost
of p
rodu
ctio
n an
d sa
le v
alue
oxyg
en c
onte
nt, f
uel c
ompo
nent
s’ in
com
patib
ilitie
s

72 | Biomass Program eere.energy.gov
What is in Biomass?
O
OO
O H
O H
O H
H OH O
O HO
O
OO
O H
O H
O H
H OH O
O HO
O
OO
O H
O H
O H
H OH O
O HO
O
OO
O H
O H
O H
H OH O
O HO
O
OO
O H
O H
O H
H OH O
O HO
O
OO
O H
O H
O H
H OH O
O HO
O
OO
O H
O H
O H
H OH O
O HO
O
OO
O H
O H
O H
H OH O
O HO
OO
O
O H
H O
O
OO
O
O H
H O
O H
O H
OO
O
O H
H O
O H
O H
OO
O
O H
H O
O H
O H
O
OO
O H
O H
O H
H OH O
O HO
O
OO
O H
O H
O H
H OH O
O HO
O
OO
O H
O H
O H
H OH O
O HO
O
OO
O H
O H
O H
H OH O
O HO
O
OO
O H
O H
O H
H OH O
O HO
O
OO
O H
O H
O H
H OH O
O HO
O
OO
O H
O H
O H
H OH O
O HO
O
OO
O H
O H
O H
H OH O
O HO
starchlipidsprotein
lignin
cellulose
Prevalent in woody, herbaceous feedstocks:
Prevalent in seeds, grains (foodstuffs)hemicellulose

73 | Biomass Program eere.energy.gov
Raw OilLowSev Condensate B2HiSev Condensate B
Goal: Produce drop-in hydrocarbon fuels in the gasoline, diesel, and jet range
2D GC-GC/MS Analysis Capabilities –Characterization of Upgraded Products
From Oxygen-Rich Biomass to Hydrocarbons
Refinery catalysts and innovative processing techniques have led to hydrocarbon production from bio oil.
Next: Improved catalysts and catalyst supports for long-term viability in acidic and aqueous environments
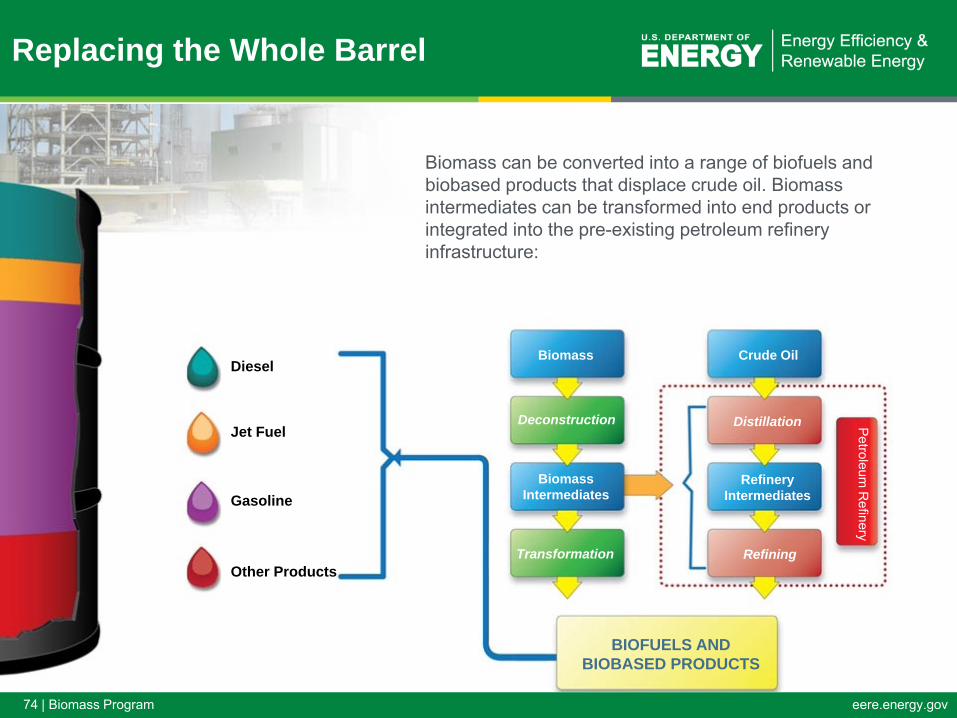
74 | Biomass Program eere.energy.gov
Deconstruction
Biomass Intermediates
Transformation
Distillation
Refinery Intermediates
Refining
Biomass Crude Oil
Petroleum
Refinery
BIOFUELS AND BIOBASED PRODUCTS
Diesel
Jet Fuel
Gasoline
Other Products
Biomass can be converted into a range of biofuels and biobased products that displace crude oil. Biomass intermediates can be transformed into end products or integrated into the pre-existing petroleum refinery infrastructure:
Replacing the Whole Barrel

75 | Biomass Program eere.energy.gov
Fuel: Diesel
Diesel FuelsRequirements: • high cetane (≥ 40
required) = minimal branching
• High energy density = some aromatics (≤ 30% allowed)
• Low cloud point = branching
• C8-C21• Low S (≤ 15 ppm, may
get lower with new fuel standards)
• No O allowed for non-FAME blends without EPA register/waiver/E-tests (big $)

76 | Biomass Program eere.energy.gov
Fuel: Jet
Aviation Fuels• Jet A (most common
commercial fuel)• Jet B (cold regions)• JP-X (military grades)• Requirements:
• Essentially zero O, S
• C8-C16• Very low freeze
point = branching and unsaturation (≤ - 40°C)
• High auto ignition temperature (≥ 210°C)
• Aromatics ≤ 20%

77 | Biomass Program eere.energy.gov
Fuel: Gasoline
GasolineRequirements:• High octane (≥ 87) =
branching, low MW• C4-C12• High energy density =
more aromatics• Aromatics ≤ 40%
(Europe), similar regulations coming for US
• Low O, S (≤ 3.7%, 80ppm, may get lower with new fuel standards)
• Required ranges for boiling, vapor pressure
• Stable, no crystallization or phase separation in water

78 | Biomass Program eere.energy.gov
Project Development for New Technology Applications in an Emerging Industry

79 | Biomass Program eere.energy.gov79
Commercialization & Deployment:The Challenge is Financing
“Out of the Labs and into the Market”

80 | Biomass Program eere.energy.gov
Barriers to Speed and Scale of Technology Deployment
Deploying Technologies Deploying Biofuels Industry
Near TermMid Term
Long Term
Public acceptance
Policy Drivers: Crop / product subsidies, mandates, carbon cost, tax credits
Conversion technology breakthroughs & maturation
Feedstock availability and logistics
Meeting cost targets & proving at pilot / demo scale
NEPA approval
No process guarantees
No long-term offtake agreements
No long-term feedstock contracts
Debt and equity financing (loan guarantees)
Discovery, Science, and Innovation
Pioneer Plants
2012 2017
Low-level biodiesel & ethanol blends . . . . . . . . . . . . . . Drop-in hydrocarbon fuels

81 | Biomass Program eere.energy.gov
Chicken-and-Egg barriers exist throughout the value chain:
Feedstock: Who’s going to invest in planting a new crop when
there’s no plant to take it to? Financing/Capital:
Who’s going to finance a plant when there’s no feedstock to supply it?
Who’s going to finance a plant when the Conversion Technology can’t get a performance guarantee?
Product Off-take: Who’s going to finance a plant when the longest off-take
contract you can get is 2-3 years?
Challenges for the Broad Deployment of Biomass Utilization

82 | Biomass Program eere.energy.gov
Conversion Technology Development
Market Surety
Project Financing
Challenges for the Broad Deployment of Biomass Utilization
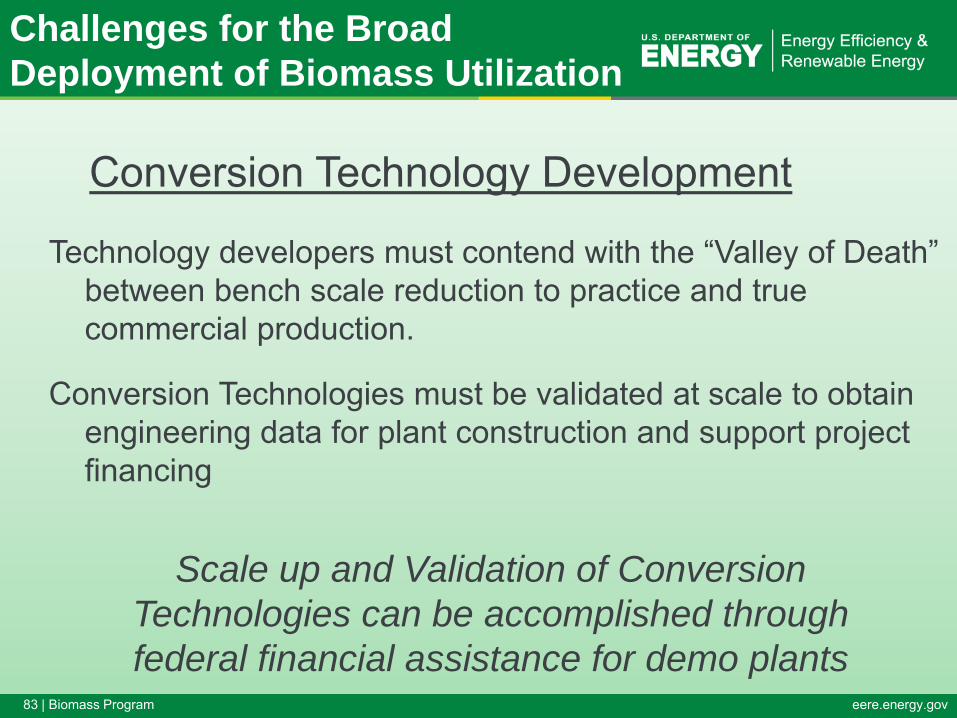
83 | Biomass Program eere.energy.gov
Conversion Technology Development
Technology developers must contend with the “Valley of Death” between bench scale reduction to practice and true commercial production.
Conversion Technologies must be validated at scale to obtain engineering data for plant construction and support project financing
Scale up and Validation of Conversion Technologies can be accomplished through federal financial assistance for demo plants
Challenges for the Broad Deployment of Biomass Utilization

84 | Biomass Program eere.energy.gov
Market Surety
The price of oil fluctuates dramatically and therefore there is no surety in the off-take product price for the renewable analogs
Federal incentive policies and market mandates are subject to change and expiration, and there is no surety that they will cover the tenor of the loan
Market Surety can be increased through consistent public policy
Challenges for the Broad Deployment of Biomass Utilization
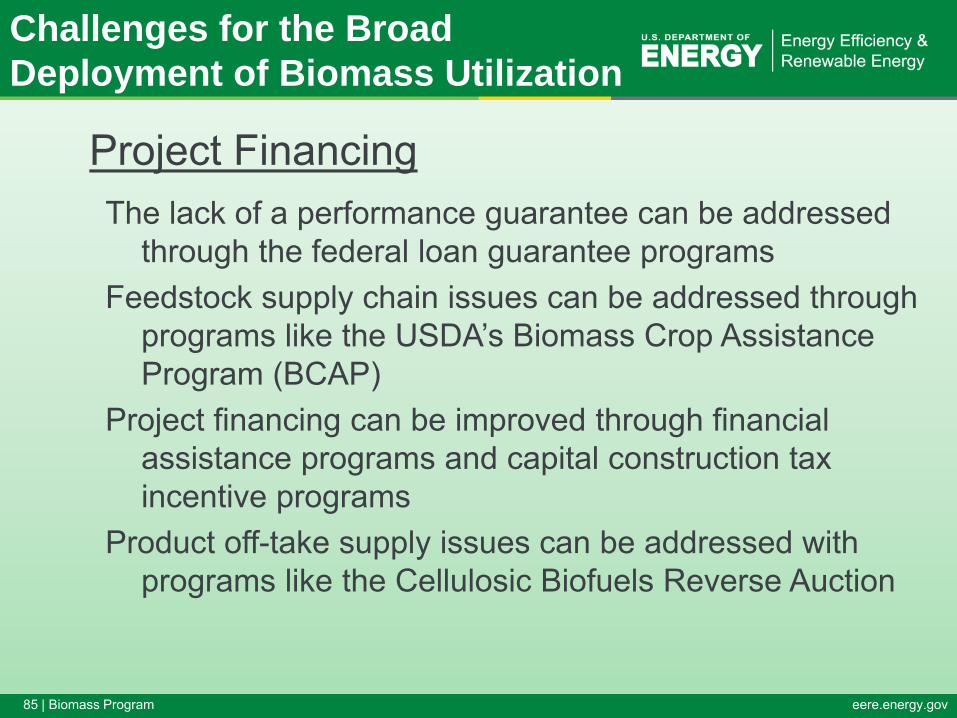
85 | Biomass Program eere.energy.gov
Project FinancingThe lack of a performance guarantee can be addressed
through the federal loan guarantee programsFeedstock supply chain issues can be addressed through
programs like the USDA’s Biomass Crop Assistance Program (BCAP)
Project financing can be improved through financial assistance programs and capital construction tax incentive programs
Product off-take supply issues can be addressed with programs like the Cellulosic Biofuels Reverse Auction
Challenges for the Broad Deployment of Biomass Utilization

86 | Biomass Program eere.energy.gov
Risks associated with Financing Commercial Scale Biorefinery
Projects

87 | Biomass Program eere.energy.gov
Process/ConversionTechnology
FeedstockSupply
ConstructionProject
FinancialPerformance/DCR
ProductOff-take
Risks Associated with Project Financing
Product Performance
Markets
Environmental/ Permitting

88 | Biomass Program eere.energy.gov
Feedstock Supply Risks
• Demonstrate reliable and secure feedstock supply
• Evaluate historical production and supply availability in the region of the plant for the last 10+ years
• Prove that the average regional production will be adequate to supply the plant in good years and bad
• Demonstrate the plant will not require more than 25% of the feedstock within the feedstock production region (to avoid driving up the price)
• Identify backup sources of feedstock to avoid being captive to supplier (price hedging)
• Demonstrate a long term feedstock supply contract, either signed or contingent

89 | Biomass Program eere.energy.gov
Conversion Technology Risks
• Demonstrate conversion technology is proven and reliable
• Non-recourse project financing is generally available only to projects utilizing proven technologies with substantial track records
• A reputable independent engineer must opine that technology and processes involved are proven and viable, as well as the reasonableness of key operating assumptions
• Strong warranties and performance guarantees from technology provider or EPC firm required
• Technology must support financial model even when stressed

90 | Biomass Program eere.energy.gov
Construction/Completion Risks
• Demonstrate construction will be completed according to schedule
• Construction risk, even for well proven technologies, needs to be mitigated through a robust EPC contract
• Preference for fixed-price, turn-key contract with guaranteed date-certain milestones
• Robust liquidated damages provisions that can cover debt service in the event of a construction delay

91 | Biomass Program eere.energy.gov
Environmental/Permitting Risks
• Demonstrate the project can comply with all environmental requirements and obtain all permits
• All required federal, state, and local permits must be in place prior to financial close
• All required environmental reviews completed by financial close
• All land rights and/or leases in place
• All or nearly all of the development stage work should be completed prior to starting the project financing process
• Environmental Site Assessment (or an alternative environmental study) must be complete and in hand

92 | Biomass Program eere.energy.gov
Product Performance Risks
• Prove the product will perform as intended
• Demonstrate product meets all required specifications for intended applications and uses
• Validate quality through vendor qualification testing
• Demonstrate product equivalence in both fit, form and function

93 | Biomass Program eere.energy.gov
Off-Take Risks
• Demonstrate that off-take contracts will support economic viability and financial performance
• Long term off-take agreement(s) (fixed price or “tolling”) with an investment-grade or near-investment grade counterparty
• Term of the debt will likely be limited by term of the off-take agreement(s) so comparable tenor
• If a feedstock is required, long-term feedstock agreement or cost pass-though likely required to prove financial viability

94 | Biomass Program eere.energy.gov
Market Risks
• Demonstrate the project is sufficiently robust to weather market changes
• Feedstock costs can vary due to market conditions; financial model should be able to prove the debt can be serviced over the range of historical feedstock highs
• Product price can vary due to market conditions; financial model should be able to prove the debt can be serviced over the range of historical product lows
• Tax incentives, subsidies and legislated markets can evaporate; project must prove its ability to perform based on economic performance and not be reliant on policy drivers

95 | Biomass Program eere.energy.gov
Financial Performance Risks
• A robust financial model is required to prove economic feasibility and demonstrate adequate debt coverage ratio (DCR)
• Detailed, dynamic pro-forma projections for at least 20 years
• Production and operating inputs vetted by 3rd party consultants (independent engineer and other consultants as appropriate for the particular project)
• Sensitivity analyses around key inputs and economics drivers support debt service over tenor of financing

96 | Biomass Program eere.energy.gov
Process/ConversionTechnology
FeedstockSupply
ConstructionQuestions?
FinancialPerformance/DCR
ProductOff-take
Product Performance
Markets
Environmental/ Permitting

97 | Biomass Program eere.energy.gov
THANKS!
98 | Biomass Program eere.energy.gov
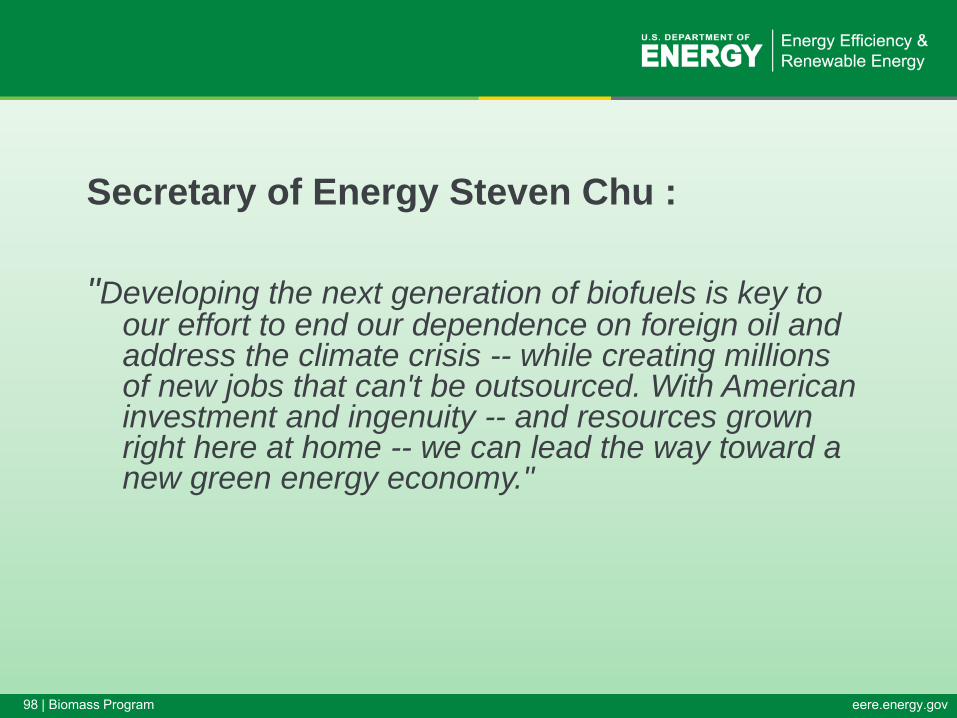
Secretary of Energy Steven Chu :
"Developing the next generation of biofuels is key to our effort to end our dependence on foreign oil and address the climate crisis -- while creating millions of new jobs that can't be outsourced. With American investment and ingenuity -- and resources grown right here at home -- we can lead the way toward a new green energy economy."

99 | Biomass Program eere.energy.gov
Thank you!
Brian DuffTeam Lead for Demonstration and Deployment
DOE Office of the Biomass Program720-356-1526
[email protected]://www1.eere.energy.gov/biomass/

100 | Biomass Program eere.energy.gov
Backup Slides

101 | Biomass Program eere.energy.gov
Focus on Feedstock Supply Risks for Biofuels Projects

102 | Biomass Program eere.energy.gov
Feedstock Supply Risks
• Unproven feedstock production history• New feedstocks such as Switchgrass, Miscanthus, Jatropha, and
dedicated energy crops have no long term production history to evaluate reliability and projected supplies = RISK
• Cannot use production statistics to demonstrate availability in good years and bad = RISK
• Seasonal variations in yield and composition are still being evaluated and may not support projected yield or economics = RISK
• Demonstrated acreage is not there = RISK• Backup sources of feedstock are not available to avoid being captive
to supplier (no alternative if supply dries up; AOG) = RISK• No project should rely on capturing >25% of any feedstock in any
given region = RISK• Obtaining a long term feedstock supply contract for an emerging
feedstock may not be possible = RISK

103 | Biomass Program eere.energy.gov
Feedstock Supply Risks
• Unproven feedstock price history
• New feedstocks such as Switchgrass, Miscanthus, Jatropha, and dedicated energy crops have no long term price history to evaluate = RISK
• Demonstrated production costs are still evolving; suppliers might bump up price = RISK
• Market value of feedstocks has yet to be determined = RISK
• Policy-driven feedstock incentives, subsidies and legislated markets can evaporate (BCAP) = RISK
• Alternate uses may develop that negates presumed feedstock value: “Best use of Biomass” = RISK

104 | Biomass Program eere.energy.gov
Feedstock Supply Risks
• No feedstock collection and storage infrastructure• Biomass feedstocks are not densified or commoditized; this limits
collection radius, delivered feedstock price, and ultimately, the size of the plant project = RISK
• Biomass feedstocks lack the regional network of grain elevators and terminals that are required for a robust industry; no spot markets, no backup regional supplies, plant may be captive to a limited number of local suppliers = RISK
• Lack of infrastructure mandates the location of the biofuels plant be “in the field” or near the feedstock, which increases product selling price and limits commercial deployment and replication = RISK
• Project developers must get involved in feedstock collection and storage logistics to make project financeable = RISK

105 | Biomass Program eere.energy.gov
Feedstock Supply Risks
• Perishable feedstocks
• Ag-residues and dedicated energy crops are seasonal, requiring harvest over 3 month window and 9 months of storage = RISK
• Composition can change over time affecting yield and plant productivity = RISK
• Feedstock can catch on fire = RISK• Project may be dependent on “edge of field” storage
and farmer behaviors = RISK• If feedstock supplies perish (weather, AOG,
decompostion) there is no regional network of supply depots to maintain production = RISK
106 | Biomass Program eere.energy.gov
Summary
• Biofuels projects are fraught with risks throughout the value chain: feedstock production and supply logistics, unproven conversion technologies, and uncertain product markets
• In order to obtain project financing, all risks must be mitigated for investors (equity) and “the Bank” (debt)
• Biomass feedstocks present exceptional and unique challenges for production, collection, transport and storage that accentuate risk in the emerging industry
• The emerging industry must develop the companion infrastructure for feedstock delivery and storage on a regional and national basis
• Densified feedstocks, blended feedstocks produced to “spec” are needed to commoditize biomass feedstocks
• Long term, consistent federal policies and financial support are needed to drive the development of ACREAGE and harvest methodologies if biomass is to supplant grain and oilseed crops

107 | Biomass Program eere.energy.gov
Crude oil is cheap . . . to produce!Crude oil is cheap to buy . . . sometimes!
Oil prices 1996-2010NYMEX Light Sweet
Price of crude oil has ranged from 2x – 7x the
actual cost of its production in recent years.
Sources: oilprices.org; World Economic Forum

108 | Biomass Program eere.energy.gov
Product $/2000 kcal
Corn grain $0.19
Ethanol $0.19
High fructose corn syrup $0.34
Chicken $2.63
Beef $9.79
How much are U.S. consumers paying for energy or calories?
Average per capita income per day in Sub-Saharan Africa = $0.33
Sources: USDA/ERS, National Life Stock and Meat Board, National Chicken Council, IFPRI, CalorieKing.com

109 | Biomass Program eere.energy.gov
Product $ / bushelAs corn grain $7.61
As ethanol (1 bushel yields 2.7 gal)* $6.89
As HFCS (1.7 lbs corn yields 1 lb)* $7.00
As chicken (2.6 lbs corn yields 1 lb) $38.00
As beef (7.9 lbs corn yields 1 lb) $32.00
What is a bushel of corn “worth?”
Average per capita income per day in Sub-Saharan Africa = $0.33
Sources: USDA/ERS, National Life Stock and Meat Board, National Chicken Council, IFPRI* Not including significant animal feed co-product value

110 | Biomass Program eere.energy.gov
Crop yields “outgrow” population ☺
-30
20
70
120
170
220
0
1,000,000,000
2,000,000,000
3,000,000,000
4,000,000,000
5,000,000,000
6,000,000,000
7,000,000,000
8,000,000,000
9,000,000,000
10,000,000,000
1950 1970 1990 2010 2030 2050
Population CORN YIELD, BU/AC
Potential for bioenergy production from food-based crops
Sources: USDA/NASS, World Bank

111 | Biomass Program eere.energy.gov
Population “outgrows” crop yields
Potential food shortages
-30
20
70
120
170
220
0
1,000,000,000
2,000,000,000
3,000,000,000
4,000,000,000
5,000,000,000
6,000,000,000
7,000,000,000
8,000,000,000
9,000,000,000
10,000,000,000
1950 1970 1990 2010 2030 2050
Population CORN YIELD, BU/AC
112 | Biomass Program eere.energy.gov
• The world has vast untapped agricultural potential– Many (developed) countries have trade barriers to food imports
– Developing countries are limited in developing crop exports
– Energy crops create new markets ☺
• The world has an enormous “thirst” for liquid fuels– Many food markets are currently local or regional
– New biofuel markets expose local food crops to global fuel prices
– Linkage drives local food prices higher (Veg oil! Casava?)
• Global competition can affect prices for land, water, labor, and other resources that did not exist before.
Global vs. Local Markets

113 | Biomass Program eere.energy.gov
• Advanced biofuels industry has been slow to develop• Mandates, subsidies, and broad agreement on benefits
have not had a sufficient impact• Solution lies in policies that consider environmental,
societal, and economic sustainability:– Scale of the liquid fuels industry & existing infrastructure – Uncertainty in commodity prices, especially for crude oil– Global vs. local markets & issues– Tension between food & fuel markets– Yield increases vs. population increases & lifestyle changes– Need for sustainable production and use– Addressing goal plus path plus pace
Mismatches between policy and technical solutions
114 | Biomass Program eere.energy.gov
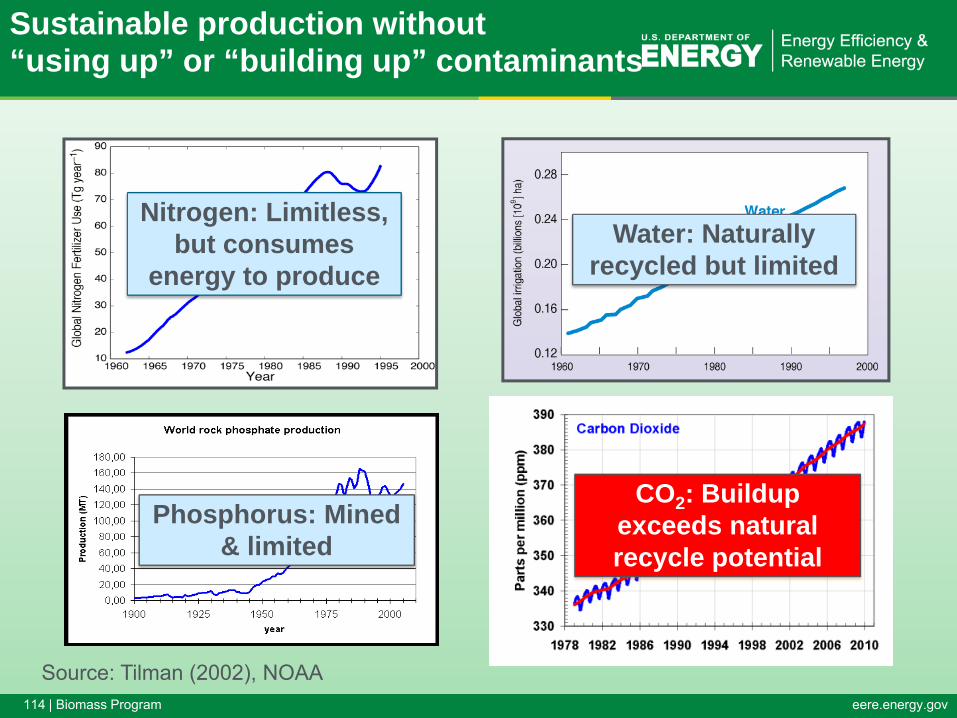
Sustainable production without “using up” or “building up” contaminants
Source: Tilman (2002), NOAA
Water: Naturally recycled but limited
Nitrogen: Limitless, but consumes
energy to produce
Phosphorus: Mined & limited
CO2: Buildup exceeds natural recycle potential

115 | Biomass Program eere.energy.gov
• Food supplies must be protected by policy– Economics alone will pull food into fuel markets
• Biofuels will require long-term price protection– They cannot compete on cost-of-production for decades, if ever– The source and justification lie in the “hidden costs” of crude oil
• Biofuel production must be made and kept sustainable– Criteria can tighten slowly, as market grows, but they must
approach an asymptote of 100% sustainability
• Policies must be global, enforceable, and enforced– Local or regional exceptions will simply drive problematic
behaviors elsewhere; short-term exceptions to allow for local issues and economic conditions may be justified
• Technology must keep pace with population growth– The alternative will be unsustainable . . . and tragic!
Features of rational policies I

116 | Biomass Program eere.energy.gov
• Policies must be stable over the long term– Large investments with long pay-out times require stability
• Conflicting policies must be eliminated or counteracted– Significant subsidization of petroleum production & products
defeats the purpose of renewable-fuel support
• Both technology-focused and technology-neutral policies are appropriate:– Technology-focused policies work best at R&D / Demo phase– Technology-neutral policies for commercial projects allows the
marketplace to “pick the winners”
• Use of “Feebates” can shift funds from undesirable to desirable technologies at zero net cost– Requires caution in selecting the mid-point– Shifting mid-point upward with time maintains pressure
Features of rational policies II

117 | Biomass Program eere.energy.gov117
5-20 miles
50-150 miles 150-300 miles
Unlocking the Resource –Creating A Depot Supply System

118 | Biomass Program eere.energy.gov
• America’s transportation sector relies almost exclusively on refined petroleum products, accounting for over 70% of the oil used.
• Oil accounts for 94% of transportation fuel use, with biofuels, natural gas, and electricity accounting for the balance.
• Nearly 9 million barrels of oil are required every day to fuel the 247 million vehicles that constitute the U.S. light-duty transportation fleet.
• Only about 40% of a barrel of crude oil is used to produce light duty petroleum gasoline.
Replace the Whole Barrel!
• For the industry to be as effective as possible, it needs to focus on research, development, demonstration, and deployment of a range of technologies to displace the entire barrel of petroleum crude.
• Reducing dependence on oil will require developing technologies to replace other fuels, such as diesel, jet, heavy distillates, and a range of bio-based chemicals and products.
119 | Biomass Program eere.energy.gov
119
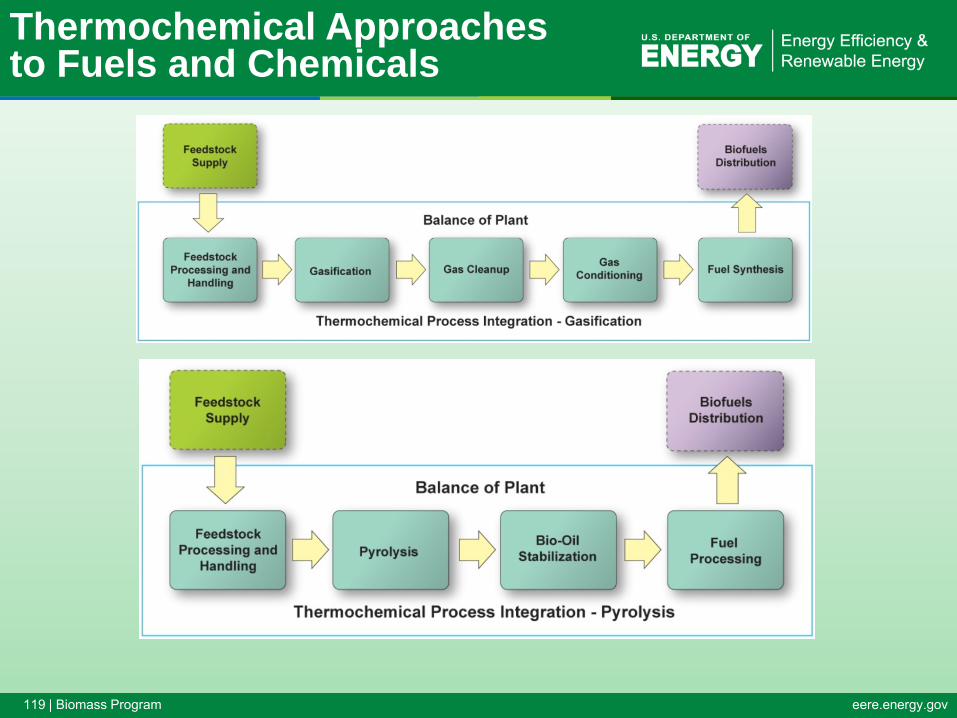
Thermochemical Approaches to Fuels and Chemicals

120 | Biomass Program eere.energy.gov
R E
F I
N I
N G
Focus of Biomass Conversion RD&D:Exploring Multiple Routes to Biofuels
Platforms
FeedstockProduction& Logistics• Energy
crops• Waste
Streams• Algae
EthanolButanolOlefinsAromaticsGasolineDieselJetHeat and Power
Co or By Products
Power
Pyrolysis Oil Platform
Syngas Platform
LiquidBio-oil
Enzymatic Hydrolysis
Sugars Fermentation
Cellulosic Sugar Platform
Algal and other Bio-Oils
Transesterification Catalytic Upgrading
Research on multiple conversion pathways aims to improve the efficiency and economics of biofuels production.
ProductsFeedstocks
Fast Pyrolysis
Gasification
Lipid (Oil) Platform
Raw syngas
Filtration & Clean-up
Upgrading
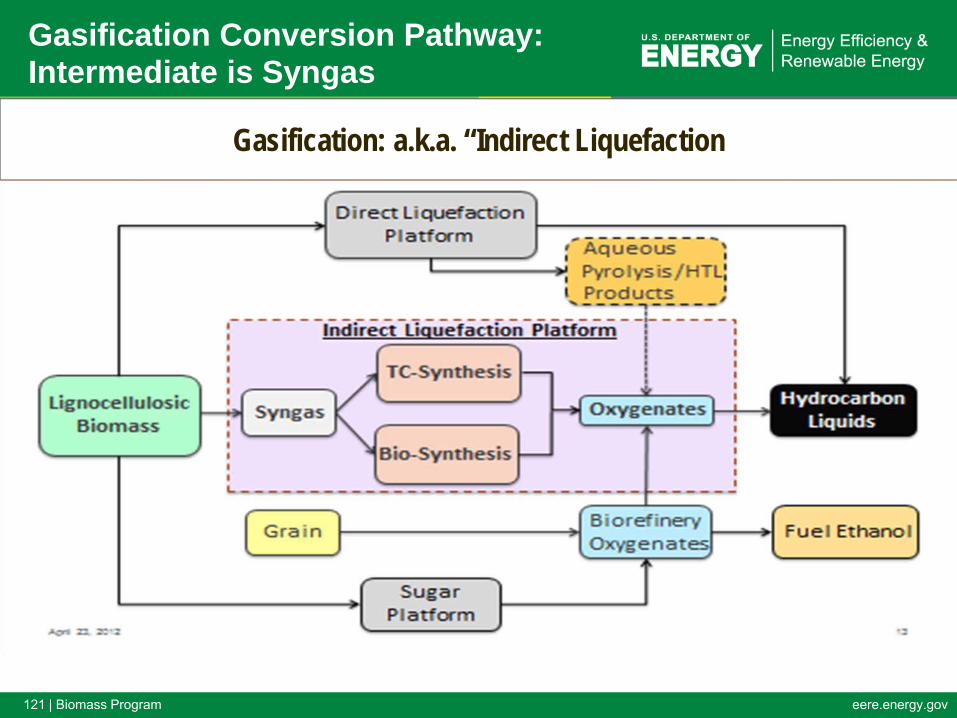
121 | Biomass Program eere.energy.gov
Gasification: a.k.a. “Indirect Liquefaction
Gasification Conversion Pathway:Intermediate is Syngas

122 | Biomass Program eere.energy.gov
Pyrolysis Conversion Pathway:Intermediate is Pyrolysis Oil
Key Challenges• Stabilizing bio‐oil for > 6 months under ambient conditions (Solicitation: ≤ $7.5 million, Performers: UOP, RTI, Virginia Polytechnic, Iowa State University, University Massachusetts Amherst)
• Fuel processing and operating fuel processing catalysts for ≥ 1000 hours (Solicitation: ≤ $12 million, Performers: GTI, Battelle, W. R. Grace, PNNL)
Current Target• By 2017, a biomass-based thermochemical route that produces gasoline
and diesel blendstocks and will achieve a conversion cost of $1.56 per gallon of total blendstock ($1.47/GGE, 2007$, modeled).
PyrolysisFeed Processing
Reduce oxygen content and total
acid number (TAN)
Catalytic upgrading distillation of bio-oil
Bio-oil stabilization
and upgradingFuel Synthesis
Limit char formation
Minimize ash, size and moisture as
needed
Biomass Transportation Fuels

123 | Biomass Program eere.energy.gov
Biochemical Conversion Pathway: Intermediate is Sugar
Pretreatment Conditioning
Co-fermentationof C5 & C6
Sugars
ProductRecovery Products
By-products
EnzymaticHydrolysis
Residue Processing
Simultaneous Saccharification and Co fermentation
Ethanol YieldsEthanol Concentration
Xylose YieldXylose Degradation
Reactor CostsSolids Loading
Sugar Losses
Glucose YieldSolids Loading
Feedstock VariationFeedstock Quality
Enzyme Cost:Titer and Activity
RateHydrolyzate Toxicity
Feedstock Cost
EnzymeProduction

124 | Biomass Program eere.energy.gov
F
Biomass Recalcitrance
Lignocellulosic biomass is often described as “recalcitrant.”
• Plant biomass has evolved superb mechanisms for resistingassault on its structural sugars from the microbial and animalkingdoms.
• These mechanisms are comprised of both chemical andstructural elements:
– a waxy barrier and dense cells form the rind of grasses and bark oftrees,
– the vascular structures (tubes) carefully limit liquid penetrationthroughout plant stems,
– the composite nature of the plant cell wall restricts transfer from cell tocell,
– the crystalline nature of cellulose itself, and– the inherent difficulty enzymes have acting on insoluble surfaces like
cellulose.Source: Mike Himmel, NREL

125 | Biomass Program eere.energy.gov
BC Conversion to Cellulosic EthanolGoals for “Deconstruction”
Major NeedsGood Cellulose Digestibility out of Pretreatment
• enzymes will need to convert ~90% glucan to glucose
Conversion of Hemicellulose to Sugars• enzymes weren’t capable of converting unreacted xylan / xylo-oligomers
Efficient Conditioning Strategy• optimum pH ~5-6 (enzymes) and ~6-8 (fermentation organisms)
Fully Integrated, Process Relevant Demonstration Capability• integrated pilot scale experimental data w/Aspen model to estimate commercial scale• better understanding of impacts downstream needed
ApproachNational Lab, Academic and Industry R&D
• national lab/academic R&D, pretreatment development between NREL/DuPont, CAFI, expansion of IBRF, BRCs, targeted pilot scale solicitations