Embed Size (px)
Citation preview

8/10/2019 Synthesis Transportation Fuels Biomass
http://slidepdf.com/reader/full/synthesis-transportation-fuels-biomass 1/55

8/10/2019 Synthesis Transportation Fuels Biomass
http://slidepdf.com/reader/full/synthesis-transportation-fuels-biomass 2/55

8/10/2019 Synthesis Transportation Fuels Biomass
http://slidepdf.com/reader/full/synthesis-transportation-fuels-biomass 3/55
As discussed in this review, the transition to the carbo-hydrate economy is already occurring with many companies,including traditional oil and chemical companies, such asShell,16 UOP,17 Petrobras, Conoco-Phillips,18 Dupont,19,20
Dow and BP, developing the technology and infrastructurefor biofuels and biochemicals production. Governmentalleaders are also recognizing the importance of this fledglingindustry by providing tax breaks, money, and mandates. TheEuropean Commission has set a goal that by 2010, 5.75%
of the transportation fuels in the EU will be biofuels. It hasbeen estimated that this goal requires 4-13% of theagricultural land in the EU be used for biofuel production.21
A number of EU countries, including Austria, Italy, Poland,Spain, Germany, and Sweden, and other countries includingFrance, give full tax exemption for biotransportation fuels,and the U.K. gives partial tax exemption.21 The EU evenprovides a carbon credit of $54/ha for farmers who growenergy crops used for biodiesel and bioethanol production.21
The U.S. government also supports biofuels and givessubsidies of $0.14/L for ethanol production. For the transitionto the carbohydrate economy to continue, it is vital that low-cost processing technologies be developed for conversionof low-cost biomass into fuels and chemicals. Chemists,
scientists, and engineers will play a key role in developingthese processes. The laws of economics dictate that aspetroleum reserves dwindle, the price of petroleum productswill increase, and biofuels eventually will be cost-competitiveand even cheaper than petroleum-derived fuels.
The purpose of this review is to discuss current methodsand future possibilities for obtaining transportation fuels frombiomass. We will present the review in an integrated wayby including not only the chemistry and catalysis involvedin the process but also engineering solutions and challengesbecause these also can have an important impact on theglobal process. Life cycle and economic analyses arepresented for the various processes to help researchers selectareas where they can focus. These types of analyses can vary
considerably and are dependent on the assumptions madewith current regional information; therefore, these analysesshould be viewed only as first order indicators.
Figure 1 shows an idealized biomass growth and manu-facturing scheme in which CO2, H2O, light, air, and nutrientsare the inputs for biofuel production, and energy to powertransportation vehicles and food are the outputs. The threemain technologies necessary for a carbohydrate economy are(1) growth of the biomass feedstock, (2) biomass conversioninto a fuel, and (3) fuel utilization. In this review, we focus
on biomass conversion into a fuel, while recognizing thatresearch in biomass production and fuel conversion are alsovery important. Ideally, it would be desirable to use high-yield crops that required little nutrients, fertilizers, and energyinput. It would also be desirable to have a biomass conversionprocess that is able to convert all the energy in the biomassto a transportation fuel that could easily be fit into existinginfrastructure and without air pollution. In practice, it isimpossible to convert all the energy in the biomass into a
fuel just as it is impossible to convert all the energy in crudeoil into gasoline and diesel fuels. Conversion technologieshave a wide range of energy efficiencies as will be discussedin this review. Some current biomass technologies have beencriticized because they have low overall thermal conversionefficiencies, in which only a small part of the energy in theplant is converted into the final fuel product. The biofuelsindustry is only in its infancy, and it is likely that advancesin conversion technology and process integration willultimately improve overall energy and economic efficiency.Novel biomass conversion technologies are being developedthat have higher thermal efficiencies than traditional tech-nologies,22 and it is vital that we continue to develop novelroutes. In addition, plant breeding is producing plants that
have higher yields, require less water, can grow on arid land,and have lower fertilizer inputs.Energy to power transportation vehicles is produced from
the biofuel, and while we currently use spark ignition anddiesel fuel engines for automobiles,23,24 other types of energyconversion devices for transportation vehicles are beingdeveloped such as polymer electrolyte membrane (PEM) fuelcells, hybrid electric vehicles, and homogeneous chargedcompression ignition engines. Important air quality controland infrastructure issues also need to be addressed inchoosing the optimal biofuel. The choice of biomassfeedstock will ultimately depend on crops yields, regionalconditions, food coproduction, economics, and the life cyclethermal efficiency (LCTE). Biomass, which is typically in a
low density form, must be collected and transported to acentral processing faculty so that it can be converted intotransportation fuel. The edible and nonedible part of biomasscan be separated, and the nonedible fraction can then beconverted into a fuel. The nutrients from the biomass alsocan be separated and reused for further biomass growth(Figure 1).
Biomass combustion produces electricity and heat. Fur-thermore, although a number of other renewable options forsustainable electricity and heat production are available suchas solar, wind, and hydroelectric, plant biomass is the onlycurrent renewable source of carbon that can be used directlyfor liquid fuels and chemicals. Our view is that the long-term optimal use of biomass is for fuels and chemical
production, and other forms of renewable energy should beused for stationary power generation.We will first discus the chemical composition of biomass
and growth rates of various species (Section 2) because thefirst step in producing biofuels is to have a cheap andabundant biomass feedstock. Lignocellulose (or cellulose)is the cheapest and most abundant source of biomass, andtherefore we first begin with discussing its conversion. Highyield lignocellulosic energy crops such as switchgrass canbe grown. Another strategy is to use lignocellulosic biomassresidues, such as agricultural, industrial, and forest wastes.The production of liquid fuels from lignocellulosic biomassinvolves removal of some oxygen, as CO2 or H2O, andconversion into a higher-density liquid fuel. Lignocellulosic
Figure 1. Sustainable production of transportation fuels frombiomass in an integrated biomass production-conversion system.
Synthesis of Transportation Fuels from Biomass Chemical Reviews C

8/10/2019 Synthesis Transportation Fuels Biomass
http://slidepdf.com/reader/full/synthesis-transportation-fuels-biomass 4/55
biomass typically has 40-45 wt % oxygen, and oxygenremoval increases the heating value. The more oxygenremoved, the higher the energy density of the fuel; however,to improve fuel combustion characteristics it may be desirableto leave some of the oxygen in the fuel.
Lignocellulosic material can be converted into liquid fuelsby three primary routes, as shown in Figure 2, including syn-gas production by gasification (Section 3), bio-oil productionby pyrolysis or liquefaction (Section 5), or hydrolysis of biomass to produce sugar monomer units (Section 7).Synthesis gas can be used to produce hydrocarbons (dieselor gasoline), methanol, and other fuels (Section 4). Bio-oilsmust be upgraded if they are to be used as transportation
fuels (Section 5). Transportation fuels such as ethanol,gasoline, and diesel fuel can be produced from sugar andassociated lignin intermediates (Sections 8 and 9). Anothermethod of producing biofuels is to grow energy crops whichhave high energy density structures that are easily convertedinto liquid fuels such as vegetable oils (Section 10) orhydrocarbon-producing plants (Section 2.5). Biodiesel pro-duced from transesterification of rapeseed or other trigly-cerides represents 80% of the current biofuel market inEurope and will be discussed in Section 10.21
Hydrogen production will be discussed in this review, eventhough H2 is currently not being used as a transportationfuel. Hydrogen, which is the feedstock for PEM fuel cells,can also be used as an intermediate for biofuels production,
just as it is for gasoline and diesel production. Therefore,processes to produce hydrogen may be an integral part of the future biorefinery, just as they are an integral part of thecurrent petroleum refinery. It has previously been pointedout that the full benefits of a hydrogen economy are onlyrealized when hydrogen is derived from renewable resourcessuch as biomass.25
Biomass and biofuels appear to hold the key for supplyingthe basic needs of our societies for the sustainable productionof liquid transportation fuels and chemicals without com-promising the needs of future generations. A major 21stcentury goal for academia, industry, and government shouldbe the emergence of efficient and economical utilization of biomass resources.
2.0. Biomass Chemistry and Growth Rates
The optimal type of biomass for biofuels production willdepend on regional issues such as soil quality, precipitation,and climate. Biomass can be produced not only on agricul-tural land but also on forest, aquatic, and arid land. Natureproduces a wide range of structures from biomass. However,most biomass is built from a few basic monomer units, andin this section we describe the chemistry of different typesof biomass along with biomass growth rates.
2.1. Lignocellulose and Starch-Based Plants
Plants use solar energy to combine carbon dioxide andwater forming a sugar building block (CH2O)n and oxygenas shown in eq 1. The sugar is stored in a polymer form ascellulose, starch, or hemicellulose. Most biomass is ap-proximately 75 wt % sugar polymer.
The first step for biofuels production is obtaining aninexpensive and abundant biomass feedstock. Biofuel feed-stocks can be chosen from the following: waste materials(agricultural wastes, crop residues, wood wastes, urbanwastes), forest products (wood, logging residues, trees,shrubs), energy crops (starch crops such as corn, wheat,barley; sugar crops; grasses; woody crops; vegetable oils;hydrocarbon plants), or aquatic biomass (algae, water weed,water hyacinth). Table 1 shows the growth rate or productiv-ity, the lower heating value, the total production energy, andthe chemical composition of different types of biomass.26
Plant growth rates vary, with a typical range from 6 to 90metric tons/ha-year or 19 to 280 boe/ha-year.2 Plants typicallycapture 0.1 to 1.0% of solar energy, with the percentage of solar energy captured proportional to the plant growth rate.The energy inputs reported in Table 1 include the energyrequired to make fertilizer as well as the transportation energyassociated with crop growth. The growth rates of plants and
Figure 2. Strategies for production of fuels from lignocellulosic biomass adapted from Huber and Dumesic.22
nCO2 + nH2O + light98 chlorophyll
(CH2O)n + nO2 (1)
D Chemical Reviews Huber et al.

8/10/2019 Synthesis Transportation Fuels Biomass
http://slidepdf.com/reader/full/synthesis-transportation-fuels-biomass 5/55
the energy requirements for plant growth are dependent onplant species (Table 1). Plant breeding, biotechnology, andgenetic engineering promise to develop more efficient plantmaterials with faster growth rates, which require less energyinputs.
Starches are a glucose polysaccharide that have R-1,4glycoside linkages.27 Starches also have a large amount of R-1,6 glycoside linkages. These R-linkages make the polymer
amorphous. Human and animal enzyme systems can easilydigest starches due to the R-linkages. Starches are commonlyfound in the vegetable kingdom (e.g., corn, rice, wheat,beans, and potatoes). When treated in hot water, starchesform two principle components: water-soluble amylose (10-20 wt %) and water-insoluble amylopectin (80-90 wt %).Amylose contains only R-1,4 glycoside linkages, whereasamylopectin contains both R-1,4 and R-1,6 glycoside linkageswith an approximate R-1,4 to R-1,6 linkage ratio of 20:1.
The structured portion of biomass is composed of cel-lulose, hemicellulose, and lignin. Cellulose (a crystallineglucose polymer) and hemicellulose (a complex amorphouspolymer, whose major component is a xylose monomer unit)make up 60-90 wt % of terrestrial biomass (Table 1).
Lignin, a large polyaromatic compound, is the other majorcomponent of biomass. Extractives (Table 1) are defined asthose compounds that are not an integral part of the biomassstructure.27 Extractives are soluble in solvents such as hotand cold water, ethers, or methanol and can include differenttypes of carbohydrates such as sucrose from sugarcane andamylose from corn grains. Ash listed in Table 1 is biomassmaterial that does not burn. Uronic acids are sugars that are
oxidized to acids.27
Other minor components of biomassinclude triglycerides, alkaloids, pigments, resins, sterols,terpenes, terpenoids, and waxes. Importantly, certain plants,such as rapeseed or soybeans, can have large amounts of these minor components.
Cellulose, as shown in Figure 3, consists of a linearpolysaccharide with -1,4 linkages of D-glucopyranosemonomers.3 Unlike starch, cellulose is a crystalline materialwith an extended, flat, 2-fold helical conformation.3 Hydro-gen bonds help maintain and reinforce the flat, linearconformation of the chain. The top and bottom of thecellulose chains are essentially completely hydrophobic. Thesides of the cellulose chains are hydrophilic and capable of hydrogen bonding, because all the aliphatic hydrogen atoms
Table 1. Chemical Composition, Energy Content, and Yield of Various Terrestrial Biomass Species a
biomass componentcorngrain
cornstover switchgrass sugarcane
sweetsorghum eucalyptus pine
productivity (dry metric tons/ha-year)2,26 7 13-24 8-20 73-87 43.8 40.0 11.6lower heating value (MJ/dry kg)26 17.0 17.5 ≈17 16.8 17.3 18.1 18.6energy inputs (MJ/dry kg)26 1.35 1.20 0.346 2.82 5.57 7.43energy content (GJ/ha-year) 120 228-420 136-340 1230-1460 760 720 210energy content (boe/ha-year) 20 40-70 23-58 210-250 128 123 37representative components (dry wt %)
celluloses 3 36 40-45 22 35 48 46-50
hemicelluloses 6 23 31-35 15 17 14 19-22extractives (starches, terpenes) 72 6 0 43 23 2 3lignins 2 17 6-12 11 17 29 21-29uronic acid 0 0.00 1 4 3proteins 10 5-11ash 10 5-6 9 5 1 0.3
aAdapted from Towler et al.,26 Lynd et al.,13 and Klass.2
Figure 3. Structures of different biomass fractions (lignocellulose, cellulose, lignin and hemicellulose) before and after reactions.(Lignocellulose structure adapted from Hsu et al.29)
Synthesis of Transportation Fuels from Biomass Chemical Reviews E

8/10/2019 Synthesis Transportation Fuels Biomass
http://slidepdf.com/reader/full/synthesis-transportation-fuels-biomass 6/55
are in axial positions, and the polar hydroxyl groups are inequatorial positions. The degree of polymerization of cel-lulose is approximately 10 000 to 15 000 glucopyranose
monomer units in wood and cotton, respectively.28
Uponpartial acid hydrolysis, cellulose is broken into cellobiose(glucose dimer), cellotriose (glucose trimer), and cellotetrose(glucose tetramer), whereas upon complete acid hydrolysisit is broken down into glucose.29
Hemicellulose is a sugar polymer that typically constitutes20-40 wt % of biomass.27 In contrast to cellulose, which isa polymer of only glucose, hemicellulose is a polymer of five different sugars. This complex polysaccharide occursin association with cellulose in the cell walls. It containsfive-carbon sugars (usually xylose and arabinose) and six-carbon sugars (galactose, glucose, and mannose), all of whichare highly substituted with acetic acid. The most abundantbuilding block of hemicellulose is xylan (a xylose polymer
linked at the 1 and 4 positions). Hemicellulose is amorphousbecause of its branched nature and it is relatively easy tohydrolyze to its monomer sugars compared to cellulose.
Ten to twenty-five weight percent of biomass is typicallycomposed of lignin which is a highly branched, substituted,mononuclear aromatic polymer found in the cell walls of certain biomass, particularly woody biomass. Lignin is oftenassociated with the cellulose and hemicellulose materialsmaking up lignocellulose compounds. The manner in whichit is produced from lignocellulose affects its structure andreactivity. Figure 3 shows the structural monomer units of lignin. Softwood lignins are formed from coniferyl alcohol.Hardwood lignins have both coniferyl and sinapyl alcoholas monomer units. Grass lignin contains coniferyl, sinapyl,
and coumaryl alcohol.30 Lignin is an irregular polymer, whichis formed by an enzyme-initiated free-radical polymerizationof the alcohol precursors. The bonding in the polymer can
occur at many different sites in the phenylpropane monomerdue to electron delocalization in the aromatic ring, the doublebond-containing side chain, and the oxygen functionalities.31
Some lignin structural linkage units are shown in Figure 4.32
2.2. Triglyceride-Producing Plants
High-energy density liquid molecules, which can be usedto make liquid fuels, are produced in plants as triglyceridesor terpenes (Section 2.4). Triglycerides, or fats and oils, arefound in the plant and animal kingdom and consist of water-insoluble, hydrophobic substances that are made up of onemole of glycerol and three moles of fatty acids. Fats andoils are used mainly for cooking and food purposes, as well
as for lubricants and raw materials for soap, detergents,cosmetics, and chemicals. From the more than 350 knownoil-bearing crops, those with the greatest potential for fuelproduction, according to Peterson, are sunflower, safflower,soybean, cottonseed, rapeseed, canola, corn, and peanut oil.33
Table 2 lists triglyceride crop and oils derived from oil-producing plants. The annual yields of oil seeds are 1000-2000 kg/ha and potentially could range from 2500-6000kg/ha. The exception is the Chinese tallow tree, a native of subtropical China and from the Euphorbiaceae family, whichhas tremendous potential due to its high growth rate.2
Vegetable oils have a higher heating value of approximately40 MJ/kg;34 thus, the annual energy yield of the plants listedin Table 2 ranges from 6.8 to 13.6 boe/ha-year. The annual
Figure 4. Common lignin linkages adapted from Chakar et al.32
Table 2. Annual Seed and Oil Yields from Oil-Producing Plants a
seed yields oil yields
average potential average potential
common name species (kg/ha) (kg/ha) (kg/ha) (L/ha) (kg/ha) (L/ha)
castorbean Ricinus communis 950 3810 428 449 1504 1590chinese tallow tree Sapium sebiferum 12553 5548 6270corn (high oil) Zea mays 5940 596 650rapeseed Brasica napus 2690 1074 1220safflower Carthamus tinctorius 1676 2470 553 599 888 940soybean Glycine max 1980 3360 354 383 591 650sunflower Helianthus annuus 1325 2470 530 571 986 1030
a Adapted from Klass.2
F Chemical Reviews Huber et al.

8/10/2019 Synthesis Transportation Fuels Biomass
http://slidepdf.com/reader/full/synthesis-transportation-fuels-biomass 7/55
energy yields of lignocellulosic material (Table 1) rangesfrom 19 to 280 boe/ha-year, which is significantly greaterthan the energy yields of oil seeds. However, as will bediscussed later, oil seeds can be efficiently converted intoliquid fuel. The problems with vegetable oils as feedstockare that they are more expensive than cellulosic biomass,and there are limited quantities.
Currently, vegetable oils are being used for biodieselproduction by transesterification (Section 9). The most
common feedstocks for biodiesel production are rapeseedand sunflower in the EU, palm oil in tropical countries, andsoybean oils and animal fats in the U.S.35 Eighty percent of transportation biofuels in the EU are biodiesel producedprimarily from transesterification of rapeseed and to a lesserextent sunflower seeds.21 Approximately 20% of the rapeseedproduced in the EU is used for biodiesel production.21
All oil-producing plants contain triglycerides, carbohy-drates, protein, fiber, and ash. As shown in Table 3 a soybean
plant only contains 20 wt % triglyceride.36 The first step inthe production of vegetable oils is extraction of the oils fromthe plant. A pretreatment step that involves cleaning, drying,and dehulling must be done prior to extraction. The oils arethen extracted by one of three methods: hydraulic pressing,expeller pressing, or solvent extraction.36 Two main productsare produced in this process: vegetable oil and the dry solidresidue known as meal. The meal has a high amount of protein and is used as a protein supplement for animal feeds.
All triglycerides can be broken into one glycerol moleculeand three fatty acid molecules. The carbon chain length andnumber of double bonds in the fatty acids vary, as shown inTable 4, depending on the source of vegetable oil. A numberof waste triglycerides are available including yellow greases(waste restaurant oil) and trap grease (which is collected atwastewater treatment plants).37 Yellow grease is used in themanufacturing of animal feed and tallow, although concerns
about mad cow disease are limiting its usage as an animalfeed. Trap grease has a zero or negative feedstock cost butis contaminated with sewage components.37 A recent studyof 30 metropolitan areas in the U.S. indicated that the U.S.produces 4.0-6.0 kg/(year-person) of yellow and trap grease,respectively.37 Multiplying this number by the populationof the U.S. indicates the potential production of biodiesel of 1.3 billion and 1.9 billion L/year from yellow and trap grease,respectively.33 The U.S. consumed 160 billion L of diesel
fuel in 2003 in the transportation sector;9
therefore, biodieselderived from yellow and trap grease could only supply upto 2% of the annual diesel fuel consumption in the U.S.However, trap grease must be disposed of, and convertingit into biodiesel would be an efficient way of using aninexpensive waste material.
2.3. Algae
Aquatic algae are another source of triglycerides as wellas carbohydrates and lignin. The advantage of using mi-croalgae is that they have very high growth rates, utilize alarge fraction of the solar energy (up to 10% of the solarenergy), and can grow in conditions that are not favorablefor terrestrial biomass growth. From 1978 to 1996, the U.S.Department of Energy funded a program to develop renew-able transportation fuels from algae, and the results of thisprogram are reported by Sheehan et al.38 Over 3000 strainsof microalgae were collected as part of this program, andaccording to Sheehan et al. currently 300 species, mostlygreen algae and diatoms, are still housed at the Universityof Hawaii in a collection available to researchers.38 Microal-gae are one of the most primitive forms of plants and aremicroscopic photosynthetic organisms. While the photosyn-thesis mechanism in algae is similar to other plant material,they can convert more of their solar energy into cellularstructure.
Macroalgae are commonly known as seaweed. Bothmicroalgae and macroalgae are fast-growing marine andfreshwater plants. Commercial production of triglyceridesfrom microalgae has been estimated to be 72 000 L/ha-year(390 boe/ha-year), and it has been estimated that rates ashigh as 130 000 L/ha-year (700 boe/ha-year) could beaccomplished with continued research.39 Thus, algae havetriglyceride production rates 45-220 times higher thanterrestrial biomass (Table 2). Other estimates indicate that2000 ha of land would be required to produce 1 EJ/year of fuel with microalgae.38 (The U.S. consumed 42 EJ of
Table 3. Composition of Soybeans a
component wt %
protein 40triglyceride 20
cellulose and hemicellulose 17sugars 7crude fiber 5ash (dry weight) 6
a From Erickson et al.36
Table 4. Chemical Composition of Fatty Acids in Vegetable Oils a
fatty acid composition (wt %)(no. of carbons: CdC bonds)vegetable
oil 8:0 10:0 12:0 14:0 16:0 18:0 18:1 18:2 18:3 22:1
iodine
value
sapon
valuecanola 1.2-6 1-2.5 52-66.9 16.1-31 6.4-14.1 1-2 110-126 188-193coconut 4.6-9.5 4.5-9.7 44-51 13-20.6 7.5-10.5 1-3.5 5-8.2 1.0-2.6 0-0.2 6-12 248-265corn 0-0.3 7-16.5 1-3.3 20-43 39-62.5 0.5-13.5 103-140 187-198cotton-seed
0.6-1.5 21.4-26.4 2.1-5 14.7-21.7 46.7-58.2 90-119 189-198
olive 0-1.3 7-20 0.5-5.0 55-84.5 3.5-21 75-94 184-196palm 0-0.4 0.5-2.4 32-47.5 3.5-6.3 36-53 6-12 35-61 186-209peanut 0-0.5 6-14 1.9-6 36.4-67.1 13-43 0-0.3 80-106 187-196rapeseed 0-1.5 1-6 0.5-3.5 8-60 9.5-23 1-13 5-56 94-120 168-187soybean 2.3-13.3 2.4-6 17.7-30.8 49-57.1 2-10.5 0-0.3 117-143 189-195sunflower 3.5-7.6 1.3-6.5 14-43 44-74 110-143 186-194tallow(beef)
2.1-6.9 25-37 9.5-34.2 14-50 26-50 35-48 218-235
a Adapted from Knothe et al.307
Synthesis of Transportation Fuels from Biomass Chemical Reviews G

8/10/2019 Synthesis Transportation Fuels Biomass
http://slidepdf.com/reader/full/synthesis-transportation-fuels-biomass 8/55
petroleum products in 2003.9) Microalgae are categorizedinto four major classes in terms of their abundance: diatoms,green algae, blue-green algae, and golden algae. Table 5shows the composition of various microalgae grown underdifferent conditions. Microalgaes can contain from 7 to 60
dry wt % triglycerides.2
Pilot plant tests, conducted over a six-year period,demonstrated that microalgae could be produced at pro-ductivity rates as high as 500 kgalgae /ha-year in a 1000 m2
pond for a single day.38 The ponds were an open face shal-low water design where the water and algae are circulatedaround the pond. Nutrients and CO2 were continually addedto the algae pond. The productivity was dependent ontemperature and sunlight, which varied over the course of the experiments. Ideally, algae could be produced on algaefarms in open, shallow ponds where a waste source of CO2, for example, from a fossil fuel power plant, could beefficiently bubbled into the ponds and captured by thealgae.
The current limitation of microalgae is the high productioncost.38 Table 6 shows the production cost of algae on a largealgae farm of 400 ha.38 Two scenarios were used for costestimation with algae growth rates of 112 and 224 metrictons/ha-year. The total biomass algae cost was $273 and
$185/metric ton, which is considerably higher than the costof lignocellulosic biomass (less than $40/metric ton). Thecost for CO2 is 20-30% of the total cost, and using wasteCO2 from fossil fuel power plants would decrease the costof algae production. One of the conclusions from the costanalysis is that alternative engineering designs for microalgaeproduction would not significantly reduce the cost of microalgae production.38 The limiting factor in cost analysisis microalgae cultivation issues, and according to Sheehahfuture research work should focus on the biological issuesregarding microalgae production.38 Microalgae cultivationissues are limited by the availability of water, CO2, sunlights,and flat land. The development of low-cost harvestingprocesses could also reduce the cost of algae.
Table 5. Composition of Microalgae as Dry Wt % Grown under Different Conditions a
growth conditions organic component (dry wt %)
species NaCl level (molar) nutrients ash lipid (triglyceride) protein carbohydrate glycerol unknown
Botryococcu b raunii 0 enriched 5.6 44.5 22.0 14.1 0.1 19.30 deficient 7.8 54.2 20.6 14.3 0.1 10.80.5 enriched 59.6 46.3 15.0 13.3 0.1 25.3
Dunaliella bardawil 2.0 deficient 14.7 10.4 9.7 40.4 16.4 23.1 Dunaliella salina 0.5 enriched 8.6 25.3 29.3 16.3 9.4 19.7
0.5 deficient 7.7 9.2 12.5 55.5 4.7 18.1
2.0 enriched 21.7 18.5 35.9 12.5 27.7 5.4 Ankistrodesmus sp. 0 enriched 4.5 24.5 31.1 10.8 0.1 33.5 Isochrysis sp. 0.5 enriched 12.0 7.1 37.0 11.2 0.1 44.6
0.5 deficient 52.0 26.0 23.3 20.5 0.1 30.11.0 enriched 65.9 15.3 34.7 15.5 0.1 34.4
Nanochloris sp. 0 enriched 13.6 20.8 33.1 13.2 0.1 32.8 Nitzschia sp. 1.4 enriched 20.4 12.1 16.8 9.2 0.1 61.8
a Adapted from Klass.2
Table 6. Capital and Operating Costs in 1987 U.S. Dollars for an Open Pond System for Algae Production on a 400 ha System withNutrient and CO2 Recycle from Anaerobic Digesters a
capital costs ($/ha/year) operating costs ($/ha/year)
112 mton/ha/year
224 mton/ha/year
112 mton/ha/year
224 mton/ha/year
growth ponds operating costsearthworks 10135 10135 CO2 (2 kg/kg of biomass) 6290 12580walls & structural 8304 8304 N (5.3% in biomass) as NH3 370 750mixing systems 4919 4919 P superphosphate, Fe as FeSO4 530 1070carbonation system 1830 2978 flocculants 1120 2250instrumentation 500 500 power mixing (10,730 kWh/ha) 700 700primary (settling ponds) 7479 7479 1E harvest (1,770 kWh/ha) 120 120secondary (centrifuges) 3958 6467 2E harvest (1,770 kWh/ha) 370 600
system-wide costs water supply (8750 kWh/ha) 570 570water supply/distrib 4426 4426 other (1562 kWh/ha) 110 110co2 distribution 260 421 power production (6.5¢/kWh) (-2250) (-5100)nutrient supply 781 781 salt disposal ($67/m ton) 1130 1130salt disposal 833 833 maintenance 1970 2940buildngs 573 573 labor 1390 1390road and drainage 521 521 total operating cost 12420 19110electrical distr./supply 1924 2215 capital costs (25%/year of total) 18238 22491machinery 417 417 total cost 30658 41601eng. + contg (25%) 11715 12742land costs ($1,250/ha) 2500 2500gen-set (eng + const.) 8250 16500anaerobic digestion 3627 7254
total capital cost ($/ha) 72952 89965 total biomass costs ($/m ton) 273 185
aAdapted from Sheehah.38
H Chemical Reviews Huber et al.

8/10/2019 Synthesis Transportation Fuels Biomass
http://slidepdf.com/reader/full/synthesis-transportation-fuels-biomass 9/55
2.4. Terpenes and Rubber-Producing Plants
Some plant species convert carbohydrates into a mixtureof isomeric hydrocarbons of molecular formula (C5H8)n
called terpenes. Terpenes are classified by the number of isoprene units (C5H8) such as (C5H8)2, monoterpenes;(C5H8)3, sesquiterpenes; (C5H8)4, diterpenes; (C5H8)6, triter-penes; and (C5H8) x, polyterpenes.2 Terpenes are open acyclicchain, monocyclic, bicyclic, tricyclic, etc., and more than23 000 structures of terpenes are known. These naturalhydrocarbons can be used as transportation fuels if they canbe economically produced. Natural rubber, cis-1,4-polyiso-prene with a molecular weight from 500 000 to 2 000 000,is produced commercially from the latex of the HeV eabrasiliensis tree, a member of the Euphorbiaceae family.40
In 1993, 5.3 million metric tons of natural rubber wasproduced mainly in Malaysia, Indonesia, and Thailand.40 Theaverage yield in the rubber-producing countries varies from0.4 to 1.2 metric ton/ha-year. This corresponds to ap-proximately 2.0-9.4 boe/ha-year, which is below the pro-duction rate of vegetable oils and lignocellulosic biomass.Natural rubbers can also be produced from Guayule, amember of the sunflower family, and in 1910 50% of all
commercial U.S. rubber was made from wild guayule.
2
During World War II, guayule plantations were used to makenatural rubber in the U.S. Terpene feedstocks can also beused as building blocks for the fine chemical industry.41
While rubber is a high value product, it can also be convertedinto fuels by depolymerization processes.
Buchanan et al. evaluated over 206 species from 57different families and 141 generas, that can be grown in theU.S., for hydrocarbon and rubber-producing potential.42,43
The plant materials have between 0.1 to 7 dry wt % oilcontent. Buchanan et al. claimed that the species Cacaliaatriplicifolia and Sassafras albidum have the best potentialfor producing natural rubber in the U.S. at a rate of 2.0 metricton/ha-year. Melvin Calvin, who won the Noble Prize for
his work on photosynthesis, developed plantations in the U.S.to produce low molecular weight hydrocarbons (less than10 000) from the Euphorbia tree, which is a relative of thenatural rubber-producing trees.44,45 The plantations in the U.S.used the species Euphorbia lathyris (gopher plant) and Euphorbia tirucalli (African milk bush).2 These plants wereharvested every 6-7 months and grew to about 4 feet high.When the plants were harvested, they were crushed and theoil was extracted. The Italians had plans in 1938 to build aEuphorbia gasoline refinery, and the French have plantedand harvested Euphorbia in Morocco.45 Euphorbia plants canbe grown on semi-arid land, which is not suitable for foodproduction, with a minimum amount of water. Initialexperimental results showed that Euphorbia lathyris could
produce 8-12% of its dry weight as oil or approximately20 boe/ha-year over a 7-month growing period with unse-lected seeds.2 It was felt that plant breeding would be ableto greatly increase the yield to up to 65 boe/ha-year.
Other species of plants, like the Brazilian tropical treeCopaifera multijua, can produce oil that can be used directlyas diesel fuel. A single tree of this type could produce 40-60 L of oil/year, which is obtained by drilling a hole in thetree to collect the oil.44 The hole is plugged, and every sixmonths can be drained to collect more oil. According toKlass, “the main difficulties with the concept of naturalhydrocarbon production from biomass are that most of thespecies that have been tested exhibit low liquid yieldscompared to the mass of biomass that must be harvested
and the naturally produced liquids are complex mixtures andnot pure hydrocarbons.”2 Field studies of E. lathyris indicatethat the biocrude has to sell for $100-200/bbl to beeconomical.
3.0. Biomass Gasification
Gasification is a process in which solid or liquid carbon-aceous material, such as biomass, coal, or oil, react with air,
oxygen, and/or steam to produce a gas product called syn-gas or producer gas that contains CO, H2, CO2, CH4, and N2
in various proportions.2,46-49 The principle difference betweenproducer and syn-gas is that air is used to make producergas, which has higher levels of N2 and lower concentrationsof CO, H2, CO2, and CH4 than syn-gas. Producer gas isusually combusted to electricity and/or heat. Biomassgasification is an old technology, and in the mid-1940s itwas used to power over a million vehicles in Europe. 50
Biomass gasification is similar to coal gasification with afew differences. Biomass gasification occurs at lower tem-perature than coal gasification because biomass is morereactive than coal. Biomass also contains potassium, sodium,and other alkali that can cause slagging and fouling problems
in conventional gasification equipment. A number of com-mercial biomass gasification units exist mainly to produceheat and electricity, and in the 1970s and 1980s about 40worldwide companies offered to build biomass gasificationplants.2 As discussed in Section 4.0 syn-gas is used forproduction of fuels and chemicals, and many industrial routesfor utilization of syn-gas exist such as production of H2 bythe water gas shift reaction, diesel fuel by FTS, methanolby methanol synthesis, and methanol-derived fuels. Syn-gasis produced industrially from coal and natural gas.51,52
3.1. Gasification Chemistry
A complex combination of reactions in the solid, liquid,
and gas phases occurs during biomass gasification includingpyrolysis, partial oxidation, and steam gasification. Table 7shows some examples of the gasification reactions. Pyrolysisis the thermal decomposition of the feedstock into gaseous,liquid, and solid products without oxygen or steam. Partialoxidation processes use less than the stoichiometric amountof oxygen required for complete combustion. Steam reform-ing involves the reaction of water with the biomass-derivedfeedstock to produce CO, CO2, and H2. The water-gas shift(WGS) reaction (water and CO react to form H2 and CO2)and methanation (CO and H2 react to form CH4 and H2O)are two other important reactions that occur during gasifica-tion. Heat to drive gasification reactions is generated in twoways: indirect gasification, where heat is generated outside
the gasifier and transferred into the gasifier, or directgasification, where the heat is generated by exothermiccombustion and partial combustion reactions inside thegasifier.
Evans and Milne observed three major reaction regimesduring the gasification process identified as primary, second-ary, and tertiary regimes as shown in Figure 5.53 Thisthermochemical process can be optimized to produce solid,liquid, or gaseous products depending on residence times,temperature, and heating rate as discussed in Section 5.During the primary stage of gasification solid biomass formsgaseous H2O, CO2, and oxygenated vapors and primaryoxygenated liquids (Figure 5). The primary oxygenatedvapors and liquids include cellulose-derived molecules (such
Synthesis of Transportation Fuels from Biomass Chemical Reviews I

8/10/2019 Synthesis Transportation Fuels Biomass
http://slidepdf.com/reader/full/synthesis-transportation-fuels-biomass 10/55
as levoglucosan, hydroxyacetaldehyde), their analogoushemicellulose-derived products, and lignin-derived methoxy-phenols.50 No chemical interactions are observed among theorganic compounds during primary pyrolysis reactions, which
are substantially free of secondary gas-phase crackingproducts.53 Primary pyrolysis vapors are of rather lowmolecular weight, representing monomers and fragments of monomers. (A more complete discussion on primary chem-istry is discussed in Section 5.3, since bio-oils are primarypyrolysis products.) Charcoal, which retains the morphologyof the original lignocellulose, is also a major product formedduring slow pyrolysis.
During secondary reactions, the primary vapors and liquidsform gaseous olefins, aromatics, CO, CO2, H2, H2O, andsecondary condensed oils such as phenols and aromatics. Theprimary vapors undergo cracking (secondary reaction re-gimes) when heated above 500 °C, and the secondaryreaction temperature regime is from 700 to 850 °C. Further
heating to 850-1000 °C results in tertiary reactions fromsecondary products forming CO, CO2, H2, H2O, and poly-nuclear aromatics (PNA) compounds including methylderivatives of aromatics such as methyl acenaphthylene,methyl naphthalene, toluene, and indene. Some tertiaryproducts, including benzene, naphthalene, acenaphthylene,anthracene/phenanthrene, and pyrene, condense to form aliquid tertiary phase. Soot and coke are formed during thesesecondary and tertiary processes. Coke forms from ther-molysis of liquids and organic vapors. The homogeneousnucleation of high-temperature decomposition products of hydrocarbons in the gas-phase produces soot.53 The inorganiccomponents of the gasification feedstock are usually con-verted into bottom ash, which is removed from the bottom
of the gasification reactor, or into fly ash, which leaves withthe product gas.49 The composition of the ash includes CaO,K2O, P2O5, MgO, SiO2, SO3, and Na2O.2 Ash melts around1000 °C, and it is important to keep the operating temperaturebelow this temperature to avoid ash sintering and slagging.47
The actual outlet gas composition from the gasificationreactor depends on the biomass composition, gasificationprocess, and the gasifying agent.46,48,54 Higher molecular
weight hydrocarbons are called tars and are problematicbecause they condense in exit pipes and on particulate filtersleading to blockages and clogged filters. Tars are defined asany material in the product stream that is condensable inthe gasifier or in downstream processing equipment.50 Tarscause further downstream problems and clog fuel lines andinjectors in internal combustion engines. The amount of tarscan be reduced by choosing the proper gasification conditionsand reactor.55
The chemical structure and formation of tars in biomassgasification is the subject of a report by Milne, Abatzoglou,and Evans.50 According to this report, “tar is the mostcumbersome and problematic parameter in any gasificationcommercialization effort.”50 Tar removal, conversion, or
destruction has been reported to be one of the greatesttechnical challenges for the successful development of commercial gasification technologies,56 and many times newbiomass gasification projects end because the cost of removing the tars is greater than the cost of project.50 Thechemical components of tars, which are a strong function of temperature, are shown in Table 8. The composition of thetars changes as the temperatures increases in the followingorder: mixed oxygenates, phenolic ethers, alkyl phenolics,heterocyclic ethers, polyarmoatic hydrocarbons, and largerpolyarmoatic hydrocarbons.57
One approach to decrease the tar concentration is to addsolid catalysts inside the gasification reactor.58-60 Catalyststhat have been added into the gasification reactor include
Pd, Pt, Ru and Ni supported on CeO2 /SiO2, and dolomite.Rh/CeO2 /SiO2 was the most effective catalyst for reducingtar levels.59 Nickel-based catalysts have also been tested byBaker et al. in the gasification reactor, but they deactivatedrapidly due to coke formation and catalyst attrition.60
Another approach to reduce tars is to mix alkali metalcatalysts with the biomass feedstock by dry mixing or wetimpregnation.61 Some of the alkali salts added to the biomassinclude K2CO3,62,63 Na2CO3,62,63 Na3H(CO3)2,62 Na2B4O7‚10H2O,62 CsCO3,63 NaCl,64 KCl,64 and ZnCl2, AlCl3‚6H2O.64
While alkali salts decrease tar formation, they also enhancechar yields as has been shown by several fundamental studiesof cellulose and biomass pyrolysis compounds.65-68 Accord-ing to Dayton, alkali metals are unattractive as commercial
Table 7. Fundamental Reactions and Enthalpy of Selected Cellulose Gasification Reactions a
classification stoichiometryenthalpy (kJ/g-mol)
ref temp 300 K
pyrolysis C6H10O5 f 5CO + 5H2 + C 180C6H10O5 f 5CO + CH4 + 3H2 300C6H10O5 f 3CO + CO2 + 2CH4 + H2 -142
partial oxidation C6H10O5 + 1 / 2 O2 f 6CO + 5H2 71C6H10O5 + O2 f 5CO + CO2 + 5H2 -213C6H10O5 + 2O2 f 3CO + 3CO2 + 5H2 -778
steam gasification C6H10O5 + H2O f 6CO + 6H2 310C6H10O5 + 3H2O f 4CO + 2CO2 + 8H2 230C6H10O5 + 7H2O f 6CO2 + 12H2 64
water-gas shift CO + H2O f CO2 + H2 -41methanation CO + 3H2 f CH4 + H2O -206
a Adapted from Klass.2
Figure 5. Gasification and pyrolysis reaction pathways adaptedfrom Milne et al.50
J Chemical Reviews Huber et al.

8/10/2019 Synthesis Transportation Fuels Biomass
http://slidepdf.com/reader/full/synthesis-transportation-fuels-biomass 11/55
gasification catalysts because of poor carbon conversion,increased ash content, and the difficulty in recovering alkalimetals.56
3.2. Gasification Reactors
The following steps are important in the conversion of biomass to syn-gas: biomass storage and transport, sizereduction, drying, feeding, gasification, product gas condi-tioning, and ash disposal or recycling. Biomass particle sizeaffects the gasification reaction rate and the product gascomposition. Size control is expensive and energy intensive,and there is a tradeoff between the optimal biomass particlesize and the gasification process. Specialized equipment isused to feed the solid biomass into a gasifier. Screw feeders,where the screw forms a compact, pressure-retaining plug,are used for atmospheric gasifiers, and lock-hopper feederor a lock-hopper/screw-piston feeder for pressurized gasifiers.Inside the gasifiers the following sequence of events oc-curs: drying, heating, thermal decomposition (combustionand pyrolysis), and gasification.47 The high moisture feed-stock content of the feedstock has a negative influence onthe thermal process efficiency and is usually the most energy-intensive part of the gasification process.
There are hundreds of different types of gasifiers in thepatent literature. However, they can be divided into threeprinciples types:50
(1) Updraft gasifier (Figure 6A) where biomass enters fromthe top of the reactor and air/oxygen/steam enter from thebottom of the reactor, flow upward, and the product gasleaves from the top. In this reactor, mainly primary tars format a level of approximately 100 g/Nm3. The advantages of updraft gasifiers are that they are a mature technology for
heat production, can be used for small-scale applications,can handle feeds with a high moisture content, and there isno carbon in the ash. The disadvantages of updraft gasifiersare that they have a feed size limit, a high tar yield, andslagging potential.
(2) Downdraft gasifier (Figure 6B) in which the air oroxygen and the solid biomass enter at top of the reactor flowdownward, and the product gas leaves at the bottom of thereactor. The product gas contains the lowest concentrationof particulates and tars (approximately 1 g/Nm3) becausemost of the tars are combusted in this reactor. The flametemperature in this reactor is 1000-1400 °C, and the tarsproduced are almost exclusively tertiary tars. This reactor isideal when clean gas is desired. Disadvantages of this type
of gasifier include a lower overall thermal efficiency anddifficulties in handling higher moisture and ash content.
(3) Fluidized-bed gasifier (Figure 6C) where the biomass,which is previously reduced to a fine particle size, and air,steam, or oxygen enter at the bottom of the reactor. A highvelocity of the gas steam forces the biomass upward througha bed of heated ceramic or silica particles. Both pyrolysisand char gasification occur in this process. This gasifier isgood for large-scale applications, has a medium tar yield,
and the exit gas has a high particle loading. The typical tarlevel, 10 g/Nm3, is an intermediate level between the updraftand the downdraft gasifier, and the tars are a mixture of secondary and tertiary tars.
3.3. Supercritical Gasification
Gasification of biomass to produce a mixture of H2, CO,CO2, CH4, and char can also be accomplished in supercriticaland near-supercritical water.69 Modell and co-workers werethe first to use supercritical water to gasify biomass whenthey gasified maple sawdust and water to produce a highBTU gas containing CO, CO2, H2, and CH4 as the majorcomponents.70,71 The combustible product gas is mainly used
Table 8. Chemical Components in Biomass Tars a
mixed oxygenates400 °C
f phenolic ethers500 °C
f alkyl phenolics600 °C
f heterocyclic ethers700 °C
f PAH800 °C
f larger PAH900 °C
conventional flashpyrolysis
high-temperatureflash pyrolysis
conventionalsteam gasification
high-temperaturesteam gasification
450-550 °C 600-650 °C 700-800 °C 900-1000 °Cacids benzenes naphthalenes naphthalenealdehydes phenols acenaphthylenes acenaphthyleneketones catechols fluorenes phenanthrene
furans naphthalenes phenanthrenes fluoranthenealcohols biphenyls benzaldehydes pyrenecomplex oxygenates phenanthrenes phenols acephenanthrylenephenols benzofurans naphthofurans benzanthracenesguaiacols benzaldehydes benzopyrenessyringols 226 MW PAHscomplex phenols 276 MW PAHs
a Adapted from Elliott.57
Figure 6. Gasification reactors.
Synthesis of Transportation Fuels from Biomass Chemical Reviews K

8/10/2019 Synthesis Transportation Fuels Biomass
http://slidepdf.com/reader/full/synthesis-transportation-fuels-biomass 12/55
for stationary power and heat application from waste biomasssources.69 A number of waste biomass feedstocks have beenused as feeds, including manure solids, saw dust, corn fiber,and wood residue. The product gas can be converted intoeither a more H2-rich stream by the water gas shift reaction(Section 4.1) or into syn-gas by steam reforming. More nearterm applications of this technology is to produce mixturesof H2 and CH4 that can be used as a substitute natural gas.One advantage of this process is that the water in the biomass
is not vaporized, thereby improving the process thermalefficiency (PTE). Therefore, wet feedstocks can efficientlybe processed with super/subcritical water. The product gasfrom this process is available at high pressure. Supercriticalgasification occurs at both high temperature 500-800 °C72-74
and lower temperatures ranging from 350 to 600 °C withthe addition of a heterogeneous catalyst such as Ru/TiO2.75,76
Carbon also can be used as a catalyst for high-temperaturesupercritical treatment of biomass.77 The important reactionsthat occur in supercritical water are the same as those thatoccur in gasification, including pyrolysis, hydrolysis, steamreforming, WGS, and methanation.78 Supercritical gasifica-tion appears to be a unique technology, which will requirefurther development. Some areas of future research include
the development of highly active, stable, and selective novelcatalysts, reaction chemistry studies, and reactor designs.
3.4. Solar Gasification
Concentrated solar energy can supply the energy to drivethe gasification process.79-84 Solar gasification decreases theamount of biomass that needs to be burned in the gasificationprocess, thus improving the PTE. Heat is provided to thegasification unit using concentrated solar gasifiers andspecially designed solar reactors. Two different reactorconfigurations are used for solar gasification including directirradiation of the reactants through a transparent window,usually made of fused quartz, and indirect heating throughan opaque wall, in which the solar energy is absorbed by anontransparent wall and transferred to inside particles. Solarenergy is also used to dry wet biomass prior to thegasification process.
Figure 7 shows the concept of a solar gasification reactorbased on a design by Adinberg et al.84 The reactor is a centralspherically or cylindrically shaped reactor. An array of vertical tubes are evenly distributed around the reactor.Incoming solar radiation is absorbed in these tubes, whichcontain a molten salt. The tubes provide thermal storage of the solar energy as well as a reaction chamber. Secondaryconcentrating optics (compound parabolic concentrator) can
be added to enhance the thermal concentration and reducethermal losses. The absorbed radiation can heat the moltensalt up to approximately 850 °C.
3.5. Gas Conditioning
Tars must be removed by gas conditioning, which is ageneral term for removing unwanted impurities from theproduct gas that usually involves a multistep, integratedapproach.85 A combination of three main strategies are usedfor gas conditioning (see Figure 8): hot gas conditioning,
wet scrubbing, or dry/wet-dry scrubbing. We will not coverall the technologies for gas cleaning in this review but willpresent some of the more common ones. Tars can bedestroyed by thermal destruction, but this typically requiresvery high temperatures of greater than 1000 °C. This hightemperature causes material and economical problems and
also produces soot. Therefore, it is usually desirable toremove the tars at a lower temperature, which requires theaddition of a catalyst and often steam and/or oxygen to theproduct gas.
Catalysts are used to react the hydrocarbon tars with H2O,CO2, and/or O2 producing CO, CO2, CH4, H2, and H2O. TheCO/H2 /CO2 ratio is adjusted during this reaction, and thisratio is very important for downstream processing of the syn-gas. Catalytic tar destruction avoids the cost of accumulatingand disposing tars by converting them into useful gaseousproducts. If the syn-gas is to be used at high temperaturethen some method of hot gas cleaning at high temperatureis desirable, since cooling and reheating the gas, as occurswith wet scrubbing, decreases the PTE. Recent reviews have
been published on catalytic reforming of tars,50,56,61,86
whichhas been shown to be an effective method of tar removal.According to Sutton et al. a desirable catalyst for hot gas
conditioning should have the following characteristics:61
(1) The catalyst must be effective for tar removal.(2) If the desired product is syn-gas, the catalyst must
reform the methane.(3) The catalyst should provide a suitable CO/H2 ratio for
downstream processing.(4) The catalyst should be resistant to deactivation as a
result of carbon fouling and sintering.(5) The catalyst should be easily regenerated.(6) The catalyst should be strong.(7) The catalyst should be inexpensive.
Figure 7. Solar gasification reactor concept. (Figure adapted fromAdinberg et al.84)
Figure 8. Gas cleaning strategies for gas from biomass gasificationreactors adapted from Milne et al.50
L Chemical Reviews Huber et al.

8/10/2019 Synthesis Transportation Fuels Biomass
http://slidepdf.com/reader/full/synthesis-transportation-fuels-biomass 13/55
Two main types of catalysts are used for hot gasconditioning: nonmetallic mixed oxide catalysts and metal-based catalysts. The principle nonmetallic mixed oxidecatalyst that has been used is calcined dolomite.50,56,61
Dolomite is an inexpensive natural sedimentary rock formingmineral consisting of calcium magnesium ore with thegeneral formula CaMg(CO3)2 and found all over the world.Calcination at a temperature of 800-900 °C removes theCO2 from the dolomite to form the active catalytic phase, a
mixed MgO-CaO. The calcination reaction is reversible, andif the CO2 partial pressure is too high the inactive dolomitephase will form. Thus, dolomite is not a good catalyst whenthe syn-gas is highly pressurized. Other problems withdolomite include severe catalyst attrition and the productionof fine particulate material in fluidized bed reactors. Delgadoet al.,87,88 Sutton et al.,61 and Dayton56 wrote reviews on gasconditioning with dolomite catalysts. Other researchers whohave studied dolomite catalysts include Simell and co-workers89-91and Corella and co-workers.92,93 The operatingconditions for using dolomite catalyst are temperatures from700 to 100 °C and space times from 0.007 to 7 s.56 Othernonmetallic oxide catalysts used for this reaction includeMgO,87 CaO,87 and olivine (a magnesium aluminosili-
cate).58,94,95
Ni-based catalysts are used industrially for steam reformingof naphtha and methane,96,97 so it is not surprising that Ni-based catalysts have proven to be very effective for hot gasconditioning of biomass gasification product gases. Ni-basedcatalysts have a high activity for tar destruction, methanereforming, and have some WGS activity. Tar destructionoccurs by steam reforming of hydrocarbons, which can bedescribed by three stoichiometric reactions. In the firstreaction, the hydrocarbon dissociates on the metal surface(eq 2) to form CO and H2. Once the CO and H2 are produced,equilibrium concentrations of CO, H2, CH4, CO2, and H2Oare formed according to the methanation (eq 3) and WGS(eq 4) reactions. Syn-gas can also be produced by dry
reforming of methane in which the CO2 instead of waterreacts with the methane. The kinetic limiting step in methanesteam and dry reforming is probably C-H bond activation.98
Reviews of Ni-based catalysts for hot gas conditioning arepublished elsewhere.50,56,61,86 The reaction conditions forNi-based catalysts are temperatures of 600-900 °C andcontact times of 0.01-3 s.56 Most of the Ni catalysts were
supported on low-surface area aluminas. Additives such asMgO, CaO, SiO2, K2O, and CuO have been added to Ni-based catalysts.60,92,99-108 A number of novel catalyst com-positions have been tried as well for this reaction includingNi/dolomite,109 Co/MgO,110 Ni/MgO,111 LaNi0.3Fe0.7O3,112 andNi/LaO/Al2O3.113 The steam reforming of heavier hydrocar-bons is rapid in the range of 500-600 °C, while methanesteam reforming occurs more slowly at temperatures of 800°C.96,97
Several deactivation mechanisms occur with nickel-basedcatalysts. These include poisoning by sulfur, chlorine, andalkali metals, and coke formation. The high levels of impurities in biomass such as sulfur, chlorine, and alkalinebring new problems in regard to catalyst stability. The coke
can be removed by oxidation; however, repeated high-temperature regenerations of nickel-based catalyst lead tosintering, phase transformations, and volatilization of thenickel.
If the syn-gas is to be used at atmospheric conditions, itis possible to use a number of physical methods to removethe tars such as web scrubbing. A disadvantage of wetscrubbing is the formation and accumulation of wastewater,as well as tar disposal. For wet scrubbing technologies,
cyclones are followed by cooling or scrubbing towers as thefirst units where the heavy tars condense. Venturi scrubbersare usually the second wet scrubbing units. Other tarseparation units include demisters, granular filers, and wetelectrostatic precipitators (ESP). Wet ESP are significantlymore expensive than other tar removal systems. All wet gascleaning systems generate contaminated wastewater withorganics, inorganic acids, NH3, and metals, which must betreated downstream by wet oxidation, active carbon adsorp-tion, and/or gasification process ash carbon adsorption. Hotgas filtration with fabric, ceramic, or metallic filter to removenear-dry condensing tar particles is also possible and isusually combined with catalytic reforming.
4.0. Syn-Gas Utilization
Figure 9 shows routes for transportation fuels and chemi-cals production from syn-gas.114 The fuels produced fromsyn-gas include hydrogen by the water gas-shift reaction,methanol by methanol synthesis, alkanes by Fischer-TropschSynthesis, isobutane by isosynthesis, ethanol by fermentation,or with homogeneous catalysts and aldehydes or alcoholsby oxosynthesis. Methanol is a platform chemical used toproduce a range of other chemicals and fuels includingolefins, gasoline, dimethyl ether, methyl tert -butyl ether,acetic acid, and formaldehyde. In this section, we discussthe various processes to produce fuels and chemicals fromsyn-gas. We then conclude by discussing the economics andthermal efficiency of the various processes.
4.1. Hydrogen Production by Water−Gas ShiftReaction
Industrial hydrogen production, which is mainly used forammonia synthesis and petrochemical reactions, is the majoruse of syn-gas. Hydrogen can be used as a fuel directly inPEM fuel cells. Hydrogen is also an essential reactant for anumber of biomass conversion strageties,18,115 just like it is
CnHm + nH2O f nCO + (n + m2)H2 (2)
CO + 3H2 T CH4 + H2O (3)
CO + H2O T CO2 + H2 (4)
Figure 9. Pathways for fuel production from syn-gas adapted fromSpath and Dayton.114
Synthesis of Transportation Fuels from Biomass Chemical Reviews M

8/10/2019 Synthesis Transportation Fuels Biomass
http://slidepdf.com/reader/full/synthesis-transportation-fuels-biomass 14/55
an essential reactant in the petrochemical refinery. Dependingon the technology, biomass can store H2 in the form of abiofuel.22 The water gas-shift reaction (WGS), where COreacts with water to form CO2 and H2 (eq 5), adjusts theCO/H2 levels for further downstream processing.
Industrial hydrogen production via the WGS reaction is
done in two series of reactors: (1) a high-temperature WGSreactor at 350-500 °C with a Fe-oxide-based catalyst, and(2) a low-temperature WGS reactor at around 200 °C witha Cu-based catalyst.97 The CO concentration decreases toabout 2-3% in the first reactor and further to approximately0.2%. Additional H2 purification can be done with pressureswing adsorption, preferential air oxidation (PROX), or Pdmembranes if high purity H2 is required.116 Recently, it hasbeen shown that nanometer-sized gold supported catalystshave very high activities for CO oxidation and WGSreactions, and Au catalysts may be used for PROX and WGSreactions.117-121
Zhang et al. have designed and operated a process for theproduction of H2 by gasification of switchgrass or discarded
seed corn at a rate of 180 kg h-1
followed by hot-gasconditioning and WGS as shown in Figure 10.122,123 Air
fluidized the switchgrass in a pilot-scale fluidized bed reactorrated at 800 kW. A slip stream (5 L min-1) from thegasification reactor was sent to the hydrogen productionprocess. First trace contaminants and some tars were removedin a dolomite guard bed at 600 °C. The unreacted tars andthe lighter hydrocarbons were converted into CO and H2 bysteam reforming with a Ni catalyst at 800 °C. The CO thenreacted with steam to form H2 and CO2 in the high-temperature WGS reactor with an Fe-Cr catalysts followed
by a low-temperature WGS reactor with a Cu-Zn-Alcatalysts that converted more of the CO. No loss of catalyticactivity was observed during operation over an 8-16 h timeperiod, although deactivation in a short time period wouldbe difficult to detect at the high conversions in the study.The catalysts were characterized and had deposits of sulfur,coke, and chlorine as well as a change in pore size after8-16 h time-on stream.
An exciting alternative to the WGS and/or PROX reactionwas recently reported and tested at the laboratory scale byKim et al. in which CO is converted to CO2 and electricityusing aqueous polyoxometalates at significantly higher ratesthan the WGS reaction.124-126 The overall reaction (eq 6)involves oxidation of CO and water to CO2 and protons with
polyoxyometalates (POM), such as H3PMo12O40, in thepresence of a gold catalyst. The aqueous solution of reducedPOMs and protons can then be used to produce electricityat the anode of a PEM fuel cell. The POM solution isreoxidized in the process. The rate of CO consumption,defined as turnover frequency of 0.75-5 s-1 (turnoverfrequency is defined as moles of CO/(moles of metal surfacesites-second)), at room temperature by using POMs is higherthan the rate of WGS at 220 °C.
Biological methods are also available to do the WGSreaction with photoheterotrophic bacteria at ambient tem-perature and pressure.127 The rate for H2 production withbiological methods is currently very low and has beenreported to be 96 mmol of H2 L-1 h-1.127 It has beenestimated that a 1250 L biological reactor would be requiredto power a 5 kW PEM fuel cell.
4.2. Methanol Production by Methanol Synthesis
Methanol, which is one of the top 10 chemicals producedglobally, is produced by the methanol synthesis reaction fromsyn-gas feedstocks, usually with Cu/ZnO-based catalysts, at220-300 °C and 50-100 bar.97 In 1923, BASF built thefirst synthetic methanol plant on a large scale using a Zn/ Cr2O3 catalyst. Prior to this, methanol was produced by slowpyrolysis of wood. Methanol synthesis is a combination of two exothermic reactions, the WGS reaction and hydrogena-tion of CO2 to methanol, eqs 7 and 8, respectively.128-131
The net reaction of these two reactions is shown in eq 9.Methanol can be produced from H2-CO or H2-CO2
mixtures, but the rate of methanol production is 7 timeshigher for H2-CO-CO2 mixtures.132 Transient in-situ kineticexperiments suggest that at industrially conditions, methanol
synthesis occurs via hydrogenation of CO2.133 For activityand selectivity reasons, the desired stoichimetric ratio forthe syn-gas, defined as (H2-CO2)/(CO+CO2) should beslightly above 2.134
Methanol synthesis is thermodynamically favorable at lowtemperatures and high pressures. Byproducts of the methanolsynthesis reaction include methane, dimethyl ether, methyl
formate, higher alcohols, and acetone. One of the challengesin using methanol synthesis is to design reactors thatefficiently remove the heat from this exothermic reaction.Copper catalysts for methanol synthesis typically last 2-5years and undergo slow deactivation by sintering andpoisoning. Copper catalysts are sensitive to poisoning bysulfur and the syn-gas should be purified to less than 0.1%sulfur.97 The presence of Cl in the gas phase will result insintering of the Cu catalyst. In commercial units, theconversion of syn-gas is limited to about 25% per pass dueto thermodynamic constraints.135
Methanol is a starting material for a number of other fuelsand chemicals including olefins, gasoline, dimethyl ether,methyl tert -butyl ether (MTBE), acetic acid, hydrogen, and
CO + H2O f CO2 + H2 (5)
Figure 10. Pilot plant for H2 production by gasification of switchgrass.122,123
CO + H2O + 2PMo12O403-f
CO2 + 2H+ + 2PMo12O404- (6)
CO + H2O f H2 + CO2 (7)
CO2 + 3H2 f CH3OH + H2O (8)
CO + 2H2 f CH3OH + H2O (9)
N Chemical Reviews Huber et al.

8/10/2019 Synthesis Transportation Fuels Biomass
http://slidepdf.com/reader/full/synthesis-transportation-fuels-biomass 15/55
formaldehyde. The largest industrial use of methanol includeformaldehyde (35% of methanol use), MTBE (25% of methanol use), and acetic acid (9% of methanol use).114
Methanol can be used directly as a transportation fuel ininternal combustion engines,136-138 as a feed for directmethanol fuel cells,139,140 or to produce H2 for fuel cellapplications by on board reforming.141-145 Concerns aboutmethanol’s toxicity, water solubility, low vapor pressure, andphase separation have limited its use as a direct fuel.146 U.S.
regulations limit the blending of methanol in gasoline to amaximum concentration of 0.3 vol %.MTBE is used primarily as a gasoline blend, and it
oxygenates gasoline thereby decreasing air pollutants pro-duced during gasoline combustion. MTBE is produced byreacting isobutene with methanol in the presence of an acidiccatalyst as shown in eq 10. Solid acids, zeolites (H-ZSM-5), and especially sulfonic acid ion-exchange resins are someof the catalysts used for MTBE production.147,148 Recently,MTBE has caused environmental problems, due to MTBEgroundwater contamination owing to leaking tanks in gasstations, and plans are being made to phase out MTBE as agasoline additive in the U.S.
Methanol also can be converted to olefins or gasoline.149,150
This process was first discovered in the 1970s by Mobilscientists who showed that zeolite catalyst, such as ZSM-5,could convert methanol into dimethyl ether (DME) followedby light olefins, and then higher olefins, paraffins, aromatics,and naphthenes. A commercial plant that produced gasolinefrom methanol (MTG) was operated in New Zealand byMobil from 1981 to 1984 and produced 14 500 bbl/day. Thefirst step in this process is dehydration of methanol at 300°C and 27 atm to yield an equilibrium mixture of methanol,dimethyl ether, and water, which is then introduced to areactor containing ZSM-5 at 350 °C and 20 atm to produce
hydrocarbons and water. The selectivity to gasoline is greaterthan 85% with the other 15% being light petroleum gas.135
Approximately 40% of the gasoline produced by MTG isaromatics. This process can also be modified to producelighter olefins such as propylene, ethylene, and butylenes,and UOP currently has a commercial process to produceolefins from methanol using silicoaluminophosphate (SAPO)catalysts.150 Other eight-membered ring zeolites, such aschabazite,149 ITQ-3,151 ITQ-29,152 and ITQ-32,153 offer newopportunities for production of olefins from methanol.
Dimethyl ether can be used as a diesel fuel and is producedin a two-step process involving formation of methanol,followed by dehydration of the methanol. Recent improve-ments in DME involve the development of bifunctional
catalysts to produce DME in a single gas-phase step154,155
or the use of a slurry reactor.156,157 Higher alcohols, includingethanol, 2-propanol, and butanol are made from syn-gas withcatalysts consisting of Cu, Zn, Mo, or Cr, promoted withalkali metals. Commercial processes for production of mixedhigher alcohols have been developed by Snamprogetti-Topsoe, Lurgi, Dow, and IFP-Idemitsu.158 The importantreactions that occur in higher alcohol synthesis includemethanol synthesis, WGS reaction, CO beta addition, ethanolhomologation, higher alcohol homologation, condensation,dehydration, DME formation, branched iso-alcohols, andmethyl ester synthesis.114
Onboard processing of liquid fuels is one of the mostpromising methods of supplying hydrogen to proton-
exchange membrane (PEM) fuel cells. Methanol due to itshigh energy density, low sulfur content, and safe handling/ storage capabilities is one of the leading candidates for fuel-cell-driven automobiles. Methanol can be converted into H2
by steam reforming (eq 11), or partial oxidation of methanol(eq 12). In autothermal reforming of methanol or oxidativemethanol reforming the heat from the exothermic partialoxidation reaction balances the endothermic reforming reac-tion as shown in eq 13.143 Aqueous-phase reforming (APR)
of methanol, where liquid water reacts with liquid methanol,also can be used to produce H2.25,159,160 Methanol reformingand autothermal reforming usually occur at relatively lowtemperature (150-350 °C) and generate H2 with low levelsof CO. A number of catalysts have been used for this reactionincluding Pd/ZnO, Pt/ZnO, and Cu/ZnO.141-145 Direct metha-nol fuel cells also appear to be promising; however,according to Dillon et al. the biggest limitation is that theyhave low kinetic rates of methanol oxidation.140
4.3. Alkane Production by Fischer−TropschSynthesis
The Fischer-Tropsch synthesis (FTS) is an industrialprocess to produce alkanes from syn-gas using Co-, Fe-, orRu-based catalysts. This technology was first developed inthe early 1900s and used by Germany during the 1930s and1940s to produce liquid fuels from syn-gas-derived coal.161,162
After World War II Sasol, in South Africa, used FTS (andstill uses FTS today) to produce gasoline and diesel fuel.163
Shell also uses FTS in a Malaysian plant to produce lubes
and diesel fuel. Several oil companies are currently using orbuilding FTS units to produce liquid fuels from natural gas-derived syn-gas in remote locations. The overall reaction inFTS is shown in eq 14. The WGS reaction, and the reverseof the WGS reaction, occur during FTS (particularly on Fecatalysts) adjusting the CO/H2 ratio, particularly when lowH2 /CO feed ratios are used.
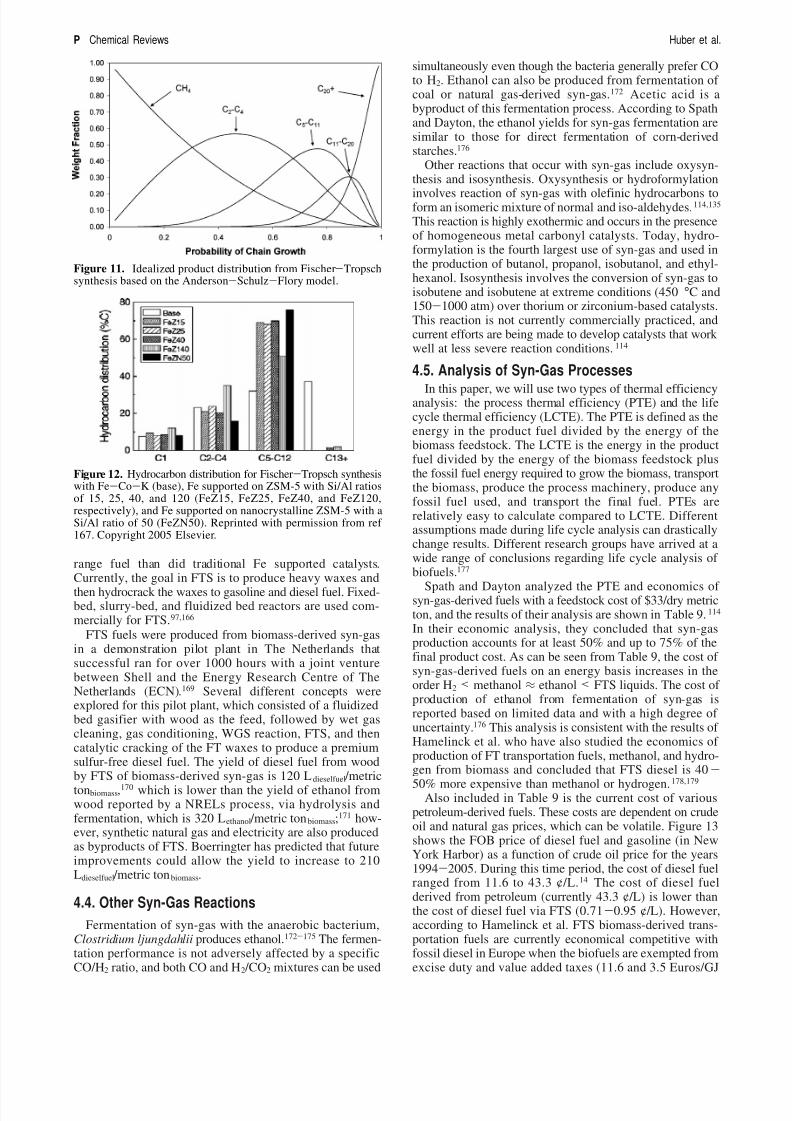
The products from FTS are a range of mostly straight chainalkanes ranging from C1 to C50 governed by the Anderson-Schulz-Flory (ASF) polymerization model. The alkaneproducts are dependent on the chain growth probability
parameter in the ASF model, and gasoline or diesel fuelcannot be made selectively using FTS without producing alarge amount of undesired byproducts as shown in Figure11. Methane formation is usually significantly higher thanthat predicted by the ASF model. Modifying the catalyticproperties can be used to tune the product selectivity,164,165
but attempts to overcome the ASF distribution have not yetbeen successful.166 However, recent results show that it ispossible to directly produce high octane gasoline in a FTSprocess by coupling the Co or Fe catalyst with a ZSM-5zeolite catalyst that cracks the longer chains in-situ producinggasoline range fuel high in branched paraffins and aromaticsas shown in Figure 12.167,168 Thus, Fe catalysts supportedon ZSM-5 had higher alkane carbon distributions for gasoline
i - C4H8 + CH3OHf
(CH3)3COCH3 (10)
CH3OH + H2O f CO2 + 3H2 (11)
CH3OH +12
O2f CO2 + 2H2 (12)
CH3OH + 12
H2O + 14
O2 f CO2 +52
H2 (13)
CO + 2H2 f (1/ n)CnHn + H2O (14)
Synthesis of Transportation Fuels from Biomass Chemical Reviews O
8/10/2019 Synthesis Transportation Fuels Biomass
http://slidepdf.com/reader/full/synthesis-transportation-fuels-biomass 16/55
range fuel than did traditional Fe supported catalysts.Currently, the goal in FTS is to produce heavy waxes and
then hydrocrack the waxes to gasoline and diesel fuel. Fixed-bed, slurry-bed, and fluidized bed reactors are used com-mercially for FTS.97,166
FTS fuels were produced from biomass-derived syn-gasin a demonstration pilot plant in The Netherlands thatsuccessful ran for over 1000 hours with a joint venturebetween Shell and the Energy Research Centre of TheNetherlands (ECN).169 Several different concepts wereexplored for this pilot plant, which consisted of a fluidizedbed gasifier with wood as the feed, followed by wet gascleaning, gas conditioning, WGS reaction, FTS, and thencatalytic cracking of the FT waxes to produce a premiumsulfur-free diesel fuel. The yield of diesel fuel from woodby FTS of biomass-derived syn-gas is 120 Ldieselfuel /metrictonbiomass,170 which is lower than the yield of ethanol fromwood reported by a NRELs process, via hydrolysis andfermentation, which is 320 Lethanol /metric tonbiomass;171 how-ever, synthetic natural gas and electricity are also producedas byproducts of FTS. Boerringter has predicted that futureimprovements could allow the yield to increase to 210Ldieselfuel /metric tonbiomass.
4.4. Other Syn-Gas Reactions
Fermentation of syn-gas with the anaerobic bacterium,Clostridium ljungdahlii produces ethanol.172-175 The fermen-tation performance is not adversely affected by a specificCO/H2 ratio, and both CO and H2 /CO2 mixtures can be used
simultaneously even though the bacteria generally prefer COto H2. Ethanol can also be produced from fermentation of coal or natural gas-derived syn-gas.172 Acetic acid is abyproduct of this fermentation process. According to Spathand Dayton, the ethanol yields for syn-gas fermentation aresimilar to those for direct fermentation of corn-derivedstarches.176
Other reactions that occur with syn-gas include oxysyn-thesis and isosynthesis. Oxysynthesis or hydroformylation
involves reaction of syn-gas with olefinic hydrocarbons toform an isomeric mixture of normal and iso-aldehydes.114,135
This reaction is highly exothermic and occurs in the presenceof homogeneous metal carbonyl catalysts. Today, hydro-formylation is the fourth largest use of syn-gas and used inthe production of butanol, propanol, isobutanol, and ethyl-hexanol. Isosynthesis involves the conversion of syn-gas toisobutene and isobutene at extreme conditions (450 °C and150-1000 atm) over thorium or zirconium-based catalysts.This reaction is not currently commercially practiced, andcurrent efforts are being made to develop catalysts that workwell at less severe reaction conditions.114
4.5. Analysis of Syn-Gas Processes
In this paper, we will use two types of thermal efficiencyanalysis: the process thermal efficiency (PTE) and the lifecycle thermal efficiency (LCTE). The PTE is defined as theenergy in the product fuel divided by the energy of thebiomass feedstock. The LCTE is the energy in the productfuel divided by the energy of the biomass feedstock plusthe fossil fuel energy required to grow the biomass, transportthe biomass, produce the process machinery, produce anyfossil fuel used, and transport the final fuel. PTEs arerelatively easy to calculate compared to LCTE. Differentassumptions made during life cycle analysis can drasticallychange results. Different research groups have arrived at awide range of conclusions regarding life cycle analysis of biofuels.177
Spath and Dayton analyzed the PTE and economics of syn-gas-derived fuels with a feedstock cost of $33/dry metricton, and the results of their analysis are shown in Table 9.114
In their economic analysis, they concluded that syn-gasproduction accounts for at least 50% and up to 75% of thefinal product cost. As can be seen from Table 9, the cost of syn-gas-derived fuels on an energy basis increases in theorder H2 < methanol ≈ ethanol < FTS liquids. The cost of production of ethanol from fermentation of syn-gas isreported based on limited data and with a high degree of uncertainty.176 This analysis is consistent with the results of Hamelinck et al. who have also studied the economics of production of FT transportation fuels, methanol, and hydro-gen from biomass and concluded that FTS diesel is 40-
50% more expensive than methanol or hydrogen.178,179
Also included in Table 9 is the current cost of variouspetroleum-derived fuels. These costs are dependent on crudeoil and natural gas prices, which can be volatile. Figure 13shows the FOB price of diesel fuel and gasoline (in NewYork Harbor) as a function of crude oil price for the years1994-2005. During this time period, the cost of diesel fuelranged from 11.6 to 43.3 ¢/L.14 The cost of diesel fuelderived from petroleum (currently 43.3 ¢/L) is lower thanthe cost of diesel fuel via FTS (0.71-0.95 ¢/L). However,according to Hamelinck et al. FTS biomass-derived trans-portation fuels are currently economical competitive withfossil diesel in Europe when the biofuels are exempted fromexcise duty and value added taxes (11.6 and 3.5 Euros/GJ
Figure 11. Idealized product distribution from Fischer-Tropschsynthesis based on the Anderson-Schulz-Flory model.
Figure 12. Hydrocarbon distribution for Fischer-Tropsch synthesiswith Fe-Co-K (base), Fe supported on ZSM-5 with Si/Al ratiosof 15, 25, 40, and 120 (FeZ15, FeZ25, FeZ40, and FeZ120,respectively), and Fe supported on nanocrystalline ZSM-5 with aSi/Al ratio of 50 (FeZN50). Reprinted with permission from ref 167. Copyright 2005 Elsevier.
P Chemical Reviews Huber et al.

8/10/2019 Synthesis Transportation Fuels Biomass
http://slidepdf.com/reader/full/synthesis-transportation-fuels-biomass 17/55
in the Netherlands 2002).179 The cost of H2 derived frombiomass ($1.1-2.0/kg) is within the same price range of themarket price of H2 ($0.7-1.4/kg). Methanol from biomass($0.21-0.24/L) is slightly more expensive than the marketprice methanol in 2003 ($0.08-0.18/L). Importantly, thesecosts are estimates that are not based on data from pilot plantstudies.
Gasification and other syn-gas reactions are alreadyestablished commercial processes; however, further process
integration and improvement must be made. The advantagesof production of fuels by this route are that all of the biomassis converted into syn-gas, and these are established technolo-gies. The disadvantage of all of these processes is that theyhave a low PTE (typically around 16-50%); thus, a largeamount of energy that was previously in the biomass isirreversibly lost in the biomass conversion steps. Gasificationof the biomass has a PTE of 75%, which represents themaximum PTE possible from syn-gas-derived fuels. Addingthe energy required to produce and transport the biomassdecreases the thermal efficiency even further.
Prins et al. modeled the production of Fischer-Tropschfuels from sawdust and reported the PTE (defined as energyin diesel fuel plus electricity divided by energy in biomass)
to be 36%, with 34% of the energy in the diesel fuel and theother 2% in electricity.180 These results are consistent withthose of Spath and Dayton shown in Table 9. The majorexergy losses (exergy is the amount of energy in a systemthat is able to do work) in a FTS plant are in the gasification(23% loss), steam generation (9% loss), and power generation(24% loss) system.180 The exergy losses in the gasifier areintrinsic because gasification is a partial oxidation processthat decreases the heating value; however, these losses canbe minimized by drying the feedstock and optimizing thegasification system. If more of the syn-gas is converted intoliquid fuels, then the efficiency of the FTS process willincrease, and the energy losses in the power generation
system will decrease. The maximum possible overall energyefficiency for a FTS plant would be 46.2%, consisting of 41.8% fuels and 4.4% electricity.180
Figure 14 summarizes the major processes for conversionof biomass into fuels, chemicals, and electricity by biomassgasification. There are a number of processes for convertingbiomass into liquid fuels including gasification, particulateremoval, hot gas conditioning, WGS, and synthesis gasconversion. The fundamental chemistry in these processesis not well understood, and it is likely that having a morescientific understanding of these processes will lead to moretechnological breakthroughs. Improved catalysts are neededfor a number of these processes. It is likely that gasificationwill continue to play a major role in electricity production
from biomass. Production of fuels by gasification of biomassand subsequent syn-gas conversion has been proven at thepilot plant scale. The extent to which this technology playsa role in the future biofuel industry will depend on whethermore economical and energy-efficient biomass conversionstrategies are developed.
5.0. Bio-Oil Production
In addition to producing gases, thermochemical treatmentof biomass can also produce liquids and solids. The residencetime, heating rate, and temperature are the parameters thatdetermine if thermochemical biomass treatments produceliquids, gases, or solids (Table 10). Process conditions that
Table 9. Thermal Efficiency and Selling Price of Syn-Gas-Derived Fuels a
process thermalefficiency
life cyclethermal efficiency
minimum sellingprice from Spath114
commercial prices2003 from Spath
and Dayton114
productsenergyproduct /
energyfeed (LHV)energyproduct /
energyfeed (LHV)$/GJ
(LHV) $/L or $/kg$/L or$/kg
natural gas to H2 0.83coal to H2 0.44biomass to H2 0.36-0.73 0.27-0.55 9-17 1.1-2.0/kg 0.7-1.4/kgb
natural gas to FTS liquids 0.54-0.63biomass to FTS liquids 0.16-0.43 0.12-0.33 19-25c 0.71-0.95/L 0.20/Ld
natural gas to MeOH 0.61biomass to MeOH 0.29-0.65e 0.22-0.49 13-14 0.21-0.24/L 0.08-0.18/Lethanol via syn-gas
fermenation0.35 0.27 14 0.34/L 0.26-0.37/L
olefins (propylene)from biomass-derived MEOH
0.21-0.46 0.16-0.35 18-20 0.81-0.92/kg 0.29-0.50/kg
a Adapted from Spath and Dayton.114 Cost of biomass used in the analysis is $33/dry metric ton. The PTE for syn-gas production is 0.77 accordingto Prins et al.180 Commercial prices are reported by Spath and Dayton who wrote their report in 2003 when crude oil prices where approximately$25-31/bbl.14 Life cycle thermal efficiencies are estimated with data from Towler26 for eucalyptus tree, which is also reported in Table 1 andassumes that 5.57 MJfossil fuel /kgwood and a LHV of 18.1 MJ/kgwood. b Hydrogen cost is for on-site usage. If H2 is to be sold as a product, it must becompressed, which increases the cost. The cost of liquefying and transportation can increase the cost to $2.2-3.2/kg. c Hamelinck et al. haveestimated the current cost of FTS liquid from biomass to be $19/GJ and that the cost could decrease to $11/GJ in the future. 179 d The price of dieselfuel is dependent on the price of crude oil and in 2005 the current FOB spot price of diesel fuel in the U.S. was $0.44/L with crude oil prices of $57/bbl. e The process thermal efficiency for conversion of wood into methanol has been estimated by Moffatt and Overend to be 0.50. 188
Figure 13. FOB spots prices for low sulfur diesel fuel andreformulated gasoline in New York Harbor as a function of crudeoil price. (Key: diesel fuel, squares; reformulated gasoline, triangle;and year, X. Source: Energy Information Association.14)
Synthesis of Transportation Fuels from Biomass Chemical Reviews Q

8/10/2019 Synthesis Transportation Fuels Biomass
http://slidepdf.com/reader/full/synthesis-transportation-fuels-biomass 18/55
favor liquid products are short residence times, fast heatingrates, and moderate temperatures. The liquids produced bypyrolysis are nonthermodynamically controlled products.Optimal residence times and temperatures are necessary tofreeze the desired intermediates. Long residence times at lowtemperature produce primarily charcoal, and high tempera-tures produce mainly gas products. The slow pyrolysis of wood (24 h residence time) was a common industrialtechnology to produce charcoal, acetic acid, methanol, andethanol from wood until the early 1900s. According to Klass,2
the average product yield per cord of seasoned hardwoodwas 1025 kg of pyrolyligenous acid (containing 80% water,9% tars and oils, 7% acetic acid, and 4% methanol and
acetone), 454 kg of charcoal, and 212 m3
of fuel gas with aheating value of 9-11 MJ/m3.In this section, we discuss how to produce liquid oils,
called bio-oils by thermochemical treatment of biomass.Liquefaction and pyrolysis are the two major technologiesto produce bio-oils. Pyrolysis oils are water soluble and havea higher oxygen content than liquefaction oils. Liquefactionoccurs at 50-200 atm and 250-325 °C, whereas pyrolysisoccurs from 1 to 5 atm and 375-525 °C. Pyrolysis has alower capital cost than liquefaction, and many pyrolysistechnologies are currently being used commercially. Theadvantage of bio-oil production is that it requires only asingle reactor, and a large fraction of the biomass energy(50-90%) can be converted into a liquid.
A wide range of feedstocks can be used for bio-oilproduction, including wood, black liquor, agricultural wastes,and forest wastes. Bio-oils are a mixture that can containmore than 400 different compounds, including acids, alco-hols, aldehydes, esters, ketones, and aromatic compounds.182
Commercially, bio-oils are used as boiler fuel for stationarypower and heat production, and for chemical production. Bio-oils must be upgraded if they are to be used as transportationfuels, which is the subject of Section 6.0.
5.1. Bio-Oils by Fast Pyrolysis
Bio-oils are produced by pyrolysis processes where thebiomass feedstock is heated in the absence of air, forming a
gaseous product, which then condenses. Slow pyrolysisproduces large amounts of coke, which can be used as asolid fuel, whereas fast pyrolysis produces bio-oils in highyields of up to 80 wt % dry feed. Bridgwater and Peacockehave recently completed a review summarizing fast pyrolysistechnology.183 Another recent review on pyrolysis waswritten by Mohan et al.184 A summary of the developmentson direct liquefaction of biomass from 1983 to 1990 by theWorking Group of the International Energy Agency, Bioen-ergy activity on direct liquefaction of biomass is presentedelsewhere.182 A number of fast pyrolysis technologies havebeen commercialized by Ensyn Technologies (six circulatingfluidized bed plants, largest is 50 t/day), Dynamotive (10t/day fluidized bed process, and currently building a 100 t/day
Figure 14. Summary of gasification technology for production of liquid fuels and electricity from biomass. Reprinted from ref 181 with
permission. Copyright 2001 Elsevier.Table 10. Biomass Pyrolysis Technologies, Reaction Conditions, and Products a
name residence time temp (°C) heating rate major products
conventional carbonization hours-days 300-500 very low charcoalpressurized carbonization 15 min-2 h 450 medium charcoalconventional pyrolysis hours 400-600 low charcoal, liquids, gasesconventional pyrolysis 5-30 min 700-900 medium charcoal, gasesflash pyrolysis 0.1-2 s 400-650 high liquidsflash pyrolysis <1 s 650-900 high liquids, gasesflash pyrolysis <1 s 1000-3000 very high gasesvacuum pyrolysis 2-30 s 350-450 medium liquidspressurized hydropyrolysis <10 s <500 high liquids
a Adapted from Klass.2
R Chemical Reviews Huber et al.

8/10/2019 Synthesis Transportation Fuels Biomass
http://slidepdf.com/reader/full/synthesis-transportation-fuels-biomass 19/55
plant), BTG (rotary cone reactor 5 t/day, wants to build a50 t/day plant), Fortum (12 t/day pilot plant), and BioenergyPartners (15 t/day pilot plant, designed 100 t/day plant).185
Table 11 shows the key fast pyrolysis design parameters.These essential parameters include183
(1) A very high heating and heat transfer rate that requiresa finely ground biomass feed.
(2) Carefully controlled temperatures around 450-550 °C(3) Rapid cooling of the pyrolysis vapors (residence time
of less than 1 s).
Table 12 lists the properties of wood-derived fast pyrolysisoils, liquefaction oils, and diesel fuel. Pyrolysis-derived oilshave a higher oxygen content, moisture content, and lowerheating value (17 MJ/kg) than conventional fuel oil (43 MJ/ kg). Liquefaction oils have higher heating content, loweroxygen content, and lower moisture content than fastpyrolysis oils. Fast pyrolysis bio-oils also are acidic, havinga pH of about 2.5. The bio-oils are chemically unstable,undergoing various reactions with time and temperature.
A typical fast pyrolysis system is shown in Figure 15. First,the biomass needs to be dried, which can be done with low-grade process heat such as the outlet flu gas. The biomassparticles must then be ground so that they have the optimalheat transfer properties. Grinding specification are less than
0.2 mm for rotating cone reactors, 2 mm for fluid bed, and6 mm for circulating or transported fluid beds. The cost of grinding increases when smaller particles are desired.
Overviews on drying and grinding of biomass are givenelsewhere.2,186 At the heart of a fast pyrolysis process is thereactor. Most research has focused on the reactor even thoughits cost is only 10-15% of the capital cost of the entire plant.
Four main reactor technologies are currently available forcommercialization including (1) fluidized beds, (2) circulat-ing fluid beds, (3) ablative pyrolyzer, both cyclonic and platetype, and (4) vacuum pyrolyzer.187 However, the two morepopular configurations are fluidized bed and circulatingfluidized bed reactors. A fast pyrolysis reactor must havevery high heating and heat transfer rates, moderate andcarefully controlled temperature, and rapid cooling orquenching of the pyrolysis vapors.183
Fluid beds or bubbling fluid bed, as opposed to circulating
fluid bed have the advantages of good temperature control,very efficient heat transfer, short residence times for vapors,and being technologically feasible. The residence time iscontrolled by the fluidizing gas flow rate, and is higher forchar than for vapors. It is necessary to use shallow bed depthsand/or a high gas flow rate to achieve short volatilesresidence times.187 The high gas-to-biomass fed ratio resultsin a lowering of the thermal efficiency (which is typically60-70%, see Section 6.6). The control of temperature andconcentration gradients in fluid bed reactors requires specialdesign methods due to the low bed height-to-diameter ratio.Small particle sizes of less than 2-3 mm are needed forthis reactor. Reactor heating can be accomplished by hotwalls, hot tubes, hot gas injection, and hot sand recycling.
The products from this reactor have a low concentration of char, since char is rapidly removed from the reactor. A high-quality bio-oil is produced in this reactor.
Circulating fluid beds and transported beds are similar tofluidized beds except that the char residence time is almostthe same as the vapor and gas residence time.187 Thehydrodynamics of circulating fluid beds are complex;however, they can still be used for very high throughputs.Process heat is supplied by recirculation of heated sand. Therotating cone reactor is similar to the circulating fluid bed,except that the sand and biomass are transported bycentrifugal forces of the rotating cone.
Ablative pyrolysis relies on the heat transfer from a hotsurface, such as the reactor wall, to the solid biomass
Table 11. Key Fast Pyrolysis Design Features a
Pretreatmentparticle size small particles needed;
expensivefeed drying essential to ∼10%washing and additives for chemical production
Reactorheat supply high heat transfer rate neededheat transfer gas-solid and/or solid-solidheating rates wood conductivity l imits
heating ratereaction temperature 500 °C maximizes liquids
from woodreactor configuration many configurations have been
developedProduct Conditioning and Collection
vapor residence time critical for chemicals, less for fuelssecondary cracking reduces yieldschar separation difficult from vapor or liquidash separation more difficult than char
separationliquids collection difficult; quench and ep seem best
a Adapted from Bridgewater and Peacocke.183
Table 12. Typical Properties of Wood Pyrolysis Bio-Oil,Liquefaction Bio-Oil, and Heavy Fuel Oil a
propertypyrolysis
oilliquefaction
oilheavy
fuel oil
moisture content, wt % 15-30 5.1 0.1
pH 2.5specific gravity 1.2 1.1 0.94elemental composition, wt %
carbon 54-58 73 85hydrogen 5.5-7.0 8 11oxygen 35-40 16 1.0nitrogen 0-0.2 0.3ash 0-0.2 0.1
higher heating value, MJ/kg 16-19 34 40viscosity (50°c), cP 40-100 15000 (at 61°C) 180solids, wt % 0.2-1 1distillation residue, wt % up to 50 1
a Adapted from Czernik and Bridgwater185 and Elliot and Schiefel-bein.346
Figure 15. Fast pyrolysis reactor system adapted from Bridgwaterand Peacocke.183
Synthesis of Transportation Fuels from Biomass Chemical Reviews S

8/10/2019 Synthesis Transportation Fuels Biomass
http://slidepdf.com/reader/full/synthesis-transportation-fuels-biomass 20/55
particle.187 Increasing the pressure of the reactor increasesthe heating rate, by pushing the biomass particle onto thehot surface with a greater force. The heat moves throughthe biomass particle in a single direction. A residual oil filmforms and provides lubrication for successive biomassparticle. The oil film also evaporates forming pyrolysisvapors. A reactor wall temperature less than 600 °C isrequired, and a high relative motion between particle andreactor wall is also desirable. An advantage of this type of
reactor is that large particles can be used since reaction ratesare not limited by heat transfer. However, the process islimited by the rate of heat supply to the reactor rather thanthe rate of heat absorption by the pyrolyzing biomass. Surfacearea of the reactor is a key design variable. In comparisonwith other reactors large amounts of tar are produced inablative reactors.
Vacuum pyrolysis has the advantage of short residencetime for volatiles, with longer residence time for the solids.187
The disadvantages of vacuum pyrolysis are that poor heatand mass transfer rates occur.
Following the pyrolysis reactor, a cyclone separates thesolid char products.183 It is desirable to collect as much charas possible, since char not removed will collect in the liquid
products causing further downstream processing problems.Char can also act as a vapor cracking catalyst degrading thepyrolysis products. Char separation is difficult, and hot vaporfilters, which are currently being developed, also can be usedwith cyclones. The char is burned to provide process heatfor pyrolysis and biomass drying. The liquid-gas productsare then separated. The liquid products must be quicklycondensed. Otherwise, they will react and crack at hightemperatures. Production of chemicals and food additivesrequires vapor residence times of a few hundred milliseconds.Longer vapor residence times of around 2 s can be used if bio-oils are to be used as a fuel. Short vapor residence timesare an engineering difficulty, and novel techniques such asquenching and electrostatic precipitation have been used.
However, careful design and temperature control are neededto avoid blockage from differential condensation of the heavyproducts.
5.2. Bio-Oils by Liquefaction
Liquefaction of biomass produces a water-insoluble bio-oil by treatments at high pressure (50-200 atm) and lowtemperature (250-450 °C). The overall objective of biomassliquefaction is to control the reaction rate and reactionmechanisms, using pressure, gases, and catalysts, to producea premium liquid oil. The reactor feeds consist of a slurrycontaining the solid biomass feed in a solvent, reducing gasessuch as H2 or CO, and/or a catalyst. The bio-oil produced
by liquefaction has a lower oxygen content and thereforehigher energy content than pyrolysis-derived oils (Table 12).There are a variety of liquefaction processes includinghydrothermal processing (water or aqueous solvent), hydro-pyrolysis (no carrier liquid solvent), and solvolysis (reactiveliquid solvent). The high-pressure processing that occurs withliquefaction causes technical difficulties and an increasedcapital cost. A review of previous biomass liquefactionresearch from 1920 to 1980 is presented by Moffattt andOverend.188
A number of catalysts have been used for liquefactionincluding alkali (from the alkaline ash components in wood,alkaline oxides, carbonates, and bicarbonate), metals (suchas zinc, copper and nickel, formate, iodine, cobalt sulfide,
zinc chloride, ferric hydroxide), and Ni and Ru heterogeneouscatalysts (which aid in preferential hydrogenation). A numberof different solvents have been used for liquefaction includingwater (the most common solvent),188 creosote oil,189 ethyleneglycol,189 methanol,188 and recycled bio-oil.188 Water is oneof the most attractive due to its low cost. Aqueous-phaseliquefaction do not require a drying step and therefore areideal for processing wet biomass. Recycling the product oilinto the reactor has been shown to increase the product
selectivity.188
Hydro-pyrolysis involves liquefaction of bio-mass with high-pressure H2 and a heterogeneous catalyst.188
Solvolysis is a related high-pressure process where liquidssuch as creosote oil, ethylene glycol, simple alcohols, andphenol are used as solvents.
A liquefaction process entitled hydrothermal upgrading(HTU) was originally developed by Shell and is currentlybeing commercialized by Shell, BTG, TNO-MEP, Biofueland Stork Engineers and Contractors. This liquefactionprocess takes place at 300-350 °C, 120-180 bar, and 5-20min residence times.16 A typical product consists of 45 wt% biocrude, 25 wt % gas (mostly CO2), 20% H2O, and 10wt % dissolved organics, acetic acid, methanol. Accordingto Goudriaan et al., the advantages of liquefaction process
are the high thermal efficiencies for conversion of wetfeedstocks, good product quality/flexibility, the potential forupscaling, and rapid rate of commercial development.However, the HTU bio-oils do have a high viscosity, and itis questionable if this technology could indeed be rapidlycommercialized.
5.3. Bio-Oil Chemistry
Bio-oils are usually a dark brown, free-flowing liquid thathas a distinctive odor. During bio-oil production, a largenumber of reactions occur, including hydrolysis, dehydration,isomerization, dehydrogenation, aromatization, retro-con-densation, and coking. The exact composition of the bio-oilis dependent on190
(1) The feedstock (including dirt and moisture content)(2) Organic nitrogen or protein content of the feedstock(3) Heat transfer rate and final char temperature during
pyrolysis(4) Extent of vapor dilution in the reactor(5) Time and temperature of vapors in the reactor(6) Time and temperature of vapors in heated lines from
the reactor to the quench zone(7) If the vapors pass through the accumulated char during
filtration(8) Efficiency of the char removal system(9) Efficiency of the condensation equipment to recover
the volatile components from the noncondensable gas stream
(10) If the condensates have been filtered to removesuspended char fines(11) Water content of the feedstock(12) Extent of contamination of the bio-oil during storage
by leaching of containers(13) Exposure of air during storage(14) Length of storage time(15) Storage temperatureMilne et al. have summarized the chemical composition
of bio-oils, which we report in Figure 16.191 Milne’s analysisis consistent with a more recent study by Branca et al.192
More than 400 organic compounds have been found in bio-oils. Figure 16 shows the range of compositions that can befound in bio-oils. The compounds in the bio-oil can vary by
T Chemical Reviews Huber et al.

8/10/2019 Synthesis Transportation Fuels Biomass
http://slidepdf.com/reader/full/synthesis-transportation-fuels-biomass 21/55

8/10/2019 Synthesis Transportation Fuels Biomass
http://slidepdf.com/reader/full/synthesis-transportation-fuels-biomass 22/55
remove alkali salts by ion-exchange prior to pyrolysis.Pyrolysis of wood and cellulose after alkali removal leadsto high yields of levoglucosan (27% from wood, 45% fromcellulose).195 The pyrolysis behavior of sugars is differentthan that of cellulose even though they have similar chemicalstructures.196 Hydroxyacetaldehyde may be a major productfrom glycosidic rupture pathway, and sugars are known toundergo retro-aldol condensation in sub- and supercriticalwater. Cellulose pyrolysis yields more levoglucosan, fewer
molecular weight oxygenated compounds (such as glycola-ldehyde and acetaldehyde), and fewer furans (such as furfuraland HMF) than does glucose pyrolysis. This difference inreactivity could be because carbohydrates have acyclic oropen ring forms, whereas cellulose is in a fixed polymerstructure.
Evans et al. studied the pyrolysis of lignin with molecular-beam mass spectrometery30 and observed that lignins pref-erentially form their precursor monomers. The lignin fractionundergoes primary pyrolysis by structurally controlled de-polymerization. Lignin components that appear in bio-oilsinclude coniferyl alcohol, sinapyl alcohol, isoeugenol, vanil-lin, vinylguaiacol, methyl guaiacol, guaiacol, and catechol.53
Coniferyl and sinapyl alcohol are the first products to form
from lignin, while the lower molecular weight products(guaiacol and catechol) are formed later. The primarypyrolytic lignin content is mostly oligomeric and monomercontent is small.
Bio-oils contain inorganic compounds as shown in Table13. During bio-oil storage, the inorganic compounds of biomass catalyze polymerization and other reactions in thebio-oil leading to a viscosity increase. Leaching of processingand storage equipment by the acidic bio-oils can also causeinorganic contaminants in the bio-oils. Therefore, care mustbe taken to properly design equipment. In contrast to coaland crude oil, biomass contains low amounts of sulfur, andmost of the sulfur becomes concentrated in the char (Table13).
Cellulose pyrolysis kinetics have been studied by measur-ing the weight loss as a function of temperature in athermogravimetric analyzer (TGA). The reaction is endo-thermic, and the weight loss can be fit with a first-order ratelaw and an activation energy of 240 kJ/mol.65,197 Cellulosederived from different manufacturers have shown a largedifference in the kinetics.197 The kinetics of pyrolysis of lignin and xylan cannot be described by a first-order reactionmodel.198 However, the pyrolysis kinetics of lignocellulosic
material can be modeled with three first-order reactions of three pseudo-components where the models correspond tothe fraction of hemicellulose, cellulose, and lignin.198
A number of different reaction models have been proposedfor cellulose decomposition including the Broido-Shafiza-deh,200,201 Waterloo,202 Diebold,203 Varhegyi-Antal,65 andWooten-Seeman-Hajaligol model.199 The majority of thesemodels have cellulose being converted into a more activeform of cellulose, which is the rate-limiting step. Figure 18shows the Wooten-Seeman-Hajaligol model where the first
Table 13. Inorganic Compounds in Bio-Oils and Char a
feedstock oak southern pine switchgrass hybrid poplar
material bio-oilchar in oil(>2 µm) bio-oil
char in oil(>2 µm)
char in oil(>10 µm)
char in oil(2-10 µm) bio-oil bio-oil
char removalmethod
cyclone cyclone + oilfilter (2 µm)
cyclone cyclone + oilfilter (2 µm)
cyclone + oilfilter (10 µm)
cyclone + oilfilter (2 µm)
hot-gasfilter
hot-gasfilter
char % 0.74 0.13ash % 0.09 0.03 15.3 <0.05 0.01 0.007impurities (ppm)Ca 160 4580 160 8100 7100 2.2 2.2 1Si 112 93 3452 1.4K 55 1300 10 667 8500 175 2.7 1Fe 86 47 1772Al 55 41 2.6 0.3Na 2 60 <0.1 372 690 17 7.2 0.9S <60 <50 349P <50 <50 550 3600 3.6Mg <55 <45 903 0.7Ni <22 <20 288Cr <17 <17 524Zn 28 14 258Li 25 7 110Ti 17 5 130 <0.2Mn 15 6 353 0.063 0.04Cu 39Ba <3 <2 170
V 0.002 <0.01Cl 10600 1600 7.9 11
a Adapted from Diebold.190
Figure 18. Mechanism for cellulose decomposition adapted fromWooten, Seeman and Hajaligo.199
V Chemical Reviews Huber et al.

8/10/2019 Synthesis Transportation Fuels Biomass
http://slidepdf.com/reader/full/synthesis-transportation-fuels-biomass 23/55
step is formation of an active intermediate form of cellulose(identified by NMR) and then the cellulose decomposed intolevoglucosan, carbohydrates, or other compounds containingmethyl, aromatics, ketones, or other functional groups.
Insight into the pyrolysis mechanism can be learned fromstudying the chemistry for the decomposition pathways of cellulose and glucose in aqueous water, which is shown inFigure 19.204-206 Glucose undergoes isomerization to formfructose, which then can undergo dehydration to form HMF.
The mechanism of HMF formation is reviewed by Antal andco-workers.207 Further dehydration of HMF yields a 1:1mixture of levulinic and formic acids. Angelic lactone formsby dehydration of levulinic acid. Retro-aldol reactionsproduce glycolaldehyde, dihydroxyacetone, glycolaldehyde,and erythrose from fructose and glucose. These intermediatesreact further to form pyurvaldehyde, glcolaldehyde, andacids. Glucose can also form 1,6-anhydroglucose by dehy-dration. Decomposition of HMF in pyrolysis chars has beenshown to form 1,2,4-benzenetriol. Hemicellulose undergoesanalogous reaction pathways to those shown in Figure 19.
5.4. Bio-Oil Problems
The most significant problems of bio-oils as a fuel arepoor volatility, high viscosity, coking, corrosiveness, and coldflow problems.185 These problems have limited the applica-tions of bio-oils. No quality standards have yet been madefor bio-oil production. The main concerns for burning bio-oils in diesel engines have to do with difficult ignition (dueto low heating value and high water content), corrosiveness(acids), and coking (thermally unstable components). Bio-oils must be upgraded or blended to be used in diesel engines(Section 6.0).
Bio-oils polymerize and condense with time, and thisprocess is accelerated by increasing temperature, oxygenexposure, and UV light exposure. These reactions result inincreasing viscosity and phase separation in the bio-oil.
Diebold has written a review on the chemical and physicalmechanisms of the storage stability of fast pyrolysis bio-oils.190 According to Diebold, the probable reactions thatoccur within bio-oil that cause degradation are
(1) Organic acids with alcohols forming esters and water(2) Organic acids with olefins forming esters(3) Aldehydes and water to form hydrates(4) Aldehydes and alcohols forming hemiacetals or acetals
and water
(5) Aldehydes forming oligomers and resins(6) Aldehydes and phenols forming resins and water(7) Aldehydes and proteins forming oligomers(8) Organic sulfur forming oligomers(9) Unsaturated compounds forming polyolefins(10) Air oxidation that forms acids and reactive peroxides
(which catalyze polymerization of unsaturated compounds)Reactions 1-4 form products in thermodynamic equilib-
rium where a change in temperature or concentration willcause a reversible reaction. Reactions 5-10 form resins orpolyolefins that are probably irreversibly produced.
5.5. Economics and Thermal Efficiencies ofBio-Oil Production Methods
The major challenges for producing bio-oils are185
(1) Cost of bio-oil is 10-100% more than fossil fuel(based on the cost of fossil fuels in 2004).
(2) Availability: there are limited supplies for testing anddevelopment of applications.
(3) There are a lack of standards and inconsistent quality.(4) Bio-oils are incompatible with conventional fuels.(5) Users are unfamiliar with this material.(6) Dedicated fuel handling systems are needed.(7) Pyrolysis as a technology does not enjoy a good image.The economics and process thermal energy efficiency for
production of liquid transportation fuels have been analyzedby the Working Group of the International Energy Agency
Figure 19. Cellulose decomposition pathways in supercritical water.
Synthesis of Transportation Fuels from Biomass Chemical Reviews W

8/10/2019 Synthesis Transportation Fuels Biomass
http://slidepdf.com/reader/full/synthesis-transportation-fuels-biomass 24/55
direct biomass liquefaction activity, and the results are shownin Table 14.208 The assessment was done with liquid fuelsfrom atmospheric flash pyrolysis (AFP) and liquefaction inpressurized solvent (LIPS). Three steps were analyzedincluding (1) primary liquefaction to a crude oil product,(2) catalytic hydrotreating to upgrade the crude product to adeoxygenated product oil, and (3) refining the deoxygenatedproduct to gasoline and diesel fuel. The refining costs wereestimated based on costs for refined oils derived by liquefac-tion of coal and oil shale and do not represent actualexperimental results. The AFP process consists of rapidpyrolysis in a sand bed of wood fibers to vapors and charsdeveloped at University of Waterloo. The LIPS process isbased on tests at the Biomass Liquefaction ExperimentalFacility in which wood chips are mixed with recycled wood-derived oil, sodium carbonate, and syn-gas in an upflowtubular reaction at 350 °C, 20.5 MPa with a 20 min residencetime. Catalytic hydrotreating was done to upgrade both of the primary oils in two separate stages: a low-temperaturestage (300 °C) followed by a high-temperature stage (350°C).
The economic analysis is based on a plant capacity of 1000
dry tons/day of biomass, a cost of $30/metric ton of woodchips (50% moisture content), and a 10% interest rate. Asshown in Table 14, the capital cost for primary liquefactionof oils with LIPS is 70-80% higher than for AFP. Thecapital cost for the catalytic upgrading of the oils from theAFP process is higher than for the LIPS process, sinceliquefaction-derived oils have a higher oxygen content thando pyrolysis-derived oils. Therefore, the final capital costfor the AFP oils is only 14-22% that for the LIPS process.For both the AFP and LIPS processes the feedstock costrepresents only 30-50% of the final production cost.
Cheaper feedstock costs will significantly change the costof the final product. The minimum selling price of thepyrolysis-derived oils and upgraded products is less than the
liquefaction-derived oils. The cost of producing refined liquidfuels ($13-20/GJ) is greater than the cost of gasoline anddiesel fuel in 2005 ($11.5/GJ). However, the cost of the bio-oil ($7-13/GJ) can be less than the current cost of gasolineand diesel fuel. Economic analysis of the Shell HTUliquefaction process have estimated that biocrude productcan be produced at $4.6/GJ if the biomass feedstock can beobtained at zero cost.16
The process thermal energy efficiency of the primary oilproducts ranges from 0.61 to 0.68 for the pyrolysis oils to0.48-0.55 for the liquefaction oils (Table 14). The PTEdecreases during catalytic upgrading and refining to 0.48-0.52. It has been claimed that the HTU liquefaction processhas an overall PTE of 70-90%.16 Shell currently has a pilotplant with a claimed 75% thermal efficiency. Bio-oil processthermal efficiencies are higher than liquid fuels derived bybiomass-derived syn-gas followed by FTS (0.16-0.43) asshown in Table 9.
Research in bio-oil production has shifted to focus onproduction of less costly fast pyrolysis oils mainly due tothe high capital cost involved for high-pressure liquefactionprocesses (Table 14). According to Elliott et al., upgrading
of the high-pressure liquefaction-derived bio-oils does notappear to have any significant advantage in the upgradingarea.182 However, in the long term liquefaction-derived bio-oils may prove to be more beneficial since they haveproperties more similar to transportation fuels. It would bedesirable to be able to control the chemistry occurring duringpyrolysis and liquefaction by addition of catalysts andcontrolling the reaction parameters. This means that againthe fundamental chemistry of the processes involved needsto be better understood, and future research on this subjectis required. Most of the fuels currently made from pyrolysisare low value products and require further upgrading;therefore, bio-oil upgrading appears to be a promisingresearch area.
Table 14. Economic and Thermal Efficiency Analysis for Production of Gasoline and Diesel Fuels by Pyrolysis and Liquefaction a
atmosphericflash pyrolysis (AFP)
liquefaction inpressurized solvent (LIPS)
present potential present potential
Total Capital Requirement ($U.S. millions)primary liquefaction 49.8 26.4 84.2 48.4crude upgrading 46.6 34.3 26.8 26.0product finishing 14.5 0.7 15.3 0.7total 110.9 61.4 126.3 75.1Production Costs ($U.S. million/year)fixed operating costs 14.48 10.77 14.48 10.03variable operating
costs25.74 23.67 33.44 33.60
(feedstock costs) (20.00) (20.00) (20.00) (20.00)capital charges 12.96 7.17 14.75 8.78total production cost 53.18 41.61 62.67 52.39Minimum Selling Price ($U.S./GJ)bio-oil 9.32 6.91 13.44 12.27refined bio-oil 16.24 12.99 19.54 14.77Process Thermal Efficiency
(energyliquid products /energyfeed+inputs)primary product from liquefaction 0.61 0.68 0.55 0.48finished product 0.52 0.53 0.48 0.49Life Cycle Thermal Efficiency
(energyliquid products /energyfeed+inputs)finished product 0.40 0.40 0.36 0.37
a Results in 1990 U.S. dollars and assuming a feedstock cost of $30/wet metric ton (wood chips with 50% moisture content) biomass based ona 1000 dry metric ton/day of biomass feed according Elliott et al. 208 Current FOB spot price cost of diesel fuel based on higher heating value is$11/GJ with oil at $57/bbl.14 Life cycle thermal efficiencies are estimated with data from Towler26 for eucalyptus trees which is also reported inTable 1 and assumes that 5.57 MJ fossil fuel /kgwood and a LHV of 18.1 MJ/kgwood.
X Chemical Reviews Huber et al.

8/10/2019 Synthesis Transportation Fuels Biomass
http://slidepdf.com/reader/full/synthesis-transportation-fuels-biomass 25/55
6.0. Bio-Oil Upgrading
Bio-oils must be upgraded if they are to be used as areplacement for diesel and gasoline fuels. As was said inthe previous section, the properties that most negatively affectbio-oil fuel quality are low heating value, incompatibilitywith conventional fuels, solids contents, high viscosity,incomplete volatility, and chemical instability. Bio-oils canbe upgraded into a liquid transportation fuel by three differentroutes: (1) hydrodeoxygenation with typical hydrotreatingcatalysts (sulfided CoMo or NiMo) (Section 6.1), (2) zeoliteupgrading (Section 6.2), or (3) forming emulsions with thediesel fuel (Section 6.3). Alternatively, bio-oils and charscan be converted into H2 or syn-gas by steam-reforming(Sections 6.4-6.5).
6.1. Hydrodeoxygenation
Hydrodeoxygenation of bio-oils involves treating bio-oilsat moderate temperatures (300-600 °C) with high-pressureH2 in the presence of heterogeneous catalysts. Reviews onhydrodeoxygenation have been written by Furmisky209 andElliott et al.182 Most hydrodeoxygenation work has focusedon sulfided CoMo and NiMo-based catalysts, which are
industrial hydrotreating catalysts for removal of sulfur,nitrogen, and oxygen from petrochemical feedstocks. Pt/ SiO2-Al2O3,210 vanadium nitride,211 and Ru have also beenused for hydrodeoxygenation. During hydrodeoxygenation,the oxygen in the bio-oil reacts with H2 to form water andsaturated C-C bonds. It is desirable to avoid hydrogenationof aromatics in the bio-oils, since this would decrease theoctane number and increase H2 consumption. The energycontent of the fuel is significantly increased, and the stabilityof the fuel increases during hydrodeoxygenation as shownin Table 15. Partial deoxygenation results in an increase in
oil viscosity, and deoxygenation to less than 5 wt % oxygenis required to a low viscosity like that required for fuelapplications.212 The disadvantage of hydrotreating is that itrequires high-pressure H2, which in an integrated biorefinerycould be produced from the biomass (see Sections 4.1, 6.4,8.3, and 8.4 for H2 production pathways).
Elliott and co-workers developed a two-step hydrotreatingprocess for upgrading of bio-oils derived from pyrolysis.212-214
The first step involves a low temperature (270 °C, 136 atm)catalytic treatment that hydrogenates the thermally unstablebio-oil compounds, which would otherwise thermally de-compose forming coke and plugging the reactor. The secondstep involves catalytic hydrogenation at higher temperature(400 °C, 136 atm). The same catalyst, a sulfided Co-Mo/ Al2O3 or sulfided Ni-Mo/Al2O3, is used for both steps. This
process can produce yields of 0.4 Lrefined-oil /Lbio-oil-feed withthe refined oil containing less than 1 wt % oxygen. Duringthis process, 20-30% of the carbon in the bio-oil is convertedinto gas-phase carbon, decreasing the overall yield. Catalyststability and gum formation in the lines were identified asmajor process uncertainties. The properties of hydrotreatedand untreated bio-oils are shown in Table 15. Upgraded bio-oils have a research octane number (RON) of 72, and anaromatic/aliphatic carbon ratio of 38/62-22/78. The octanenumber is lower than gasoline, and while aromatics do havea higher octane number they cause air pollution problems.
Delmon and co-workers studied the hydrodeoxygenationof model bio-oil compounds with sulfphided CoMo andNiMo catalysts to elucidate the main reaction pathways, the
influence of the important reaction parameters, and thepossible catalytic poisons.215-219 The model feedstock wasa mixture of 4-methylacetophenone, ethyldecanoate, andguaiacol as shown in Figure 20. The ketone group is easilyand selectively hydrogenated into a methylene group above200 °C.217 Carboxylic groups are also hydrogenated underhydrodeoxygenation conditions, but a parallel decarboxyla-tion pathway also occurs at comparable rates.217 Carboxylicgroups and guaiacyl groups are not as reactive as ketonegroups, and temperatures greater than 300 °C are requiredfor their conversion. Guaiacol was hydrogenated into catecholand then to phenol. Guaiacol was the compound that causedcatalyst deactivation due to coking reactions.
The acidity of the catalytic support does not change the
hydrogenation rate of the 4-methylacetophenone, but increas-ing the support acidity does increase rates of decarboxylationand hydrogenation of ethyldecanoete and coke formationfrom guaiacol. Carbon, which has low acidity, is a goodcatalytic support for hydrodeoxygenation. It is necessary toadd sulfur (dimethyl disulfide) to the feed to keep the catalystfrom deactivating, and the catalytic activity is dependentupon the H2S partial pressure. Water decreased the catalyticactivity to one-third the initial activity.219 Future work inhydrodeoxygenation could focus on developing non-sulfur-based catalysts for hydrodeoxygenation.
6.2. Zeolite Upgrading of Bio-Oils
Zeolites, and in general molecular sieve inorganic materi-als, are the most widely used industrial catalyst used for oilrefining, petrochemistry, and production of fine and specialtychemicals.220-222 Zeolites are crystalline microporous materi-als with well-defined pore structures on the order of 5-12Å.220 Zeolites contain active sites, usually acid sites, whichcan be generated in the zeolite framework. The strength andconcentration of the active sites can be tailored for particularapplications. Zeolites have very high surface areas andadsorption capacity. Their adsorption properties can becontrolled, and they can be varied from hydrophobic tohydrophilic materials.
Bio-oils can be upgraded using zeolite catalysts to reduceoxygen content and improve thermal stability. Temperatures
Table 15. Properties of Bio-Oils and Upgraded Bio-Oils a
high-
pressureliquefaction flashpyrolysis
hydro-
deoxygenatedbio-oils
elemental analysiscarbon (wt %) 72.6 43.5 85.3-89.2hydrogen (wt %) 8.0 7.3 10.5-14.1oxygen (wt %) 16.3 49.2 0.0-0.7sulfur (wt %) <45 29.0 0.005H/C atomratio (dry)
1.21 1.23 1.40-1.97
density (g/mL) 1.15 24.8 0.796-0.926moisture (wt %) 5.1 24.8 .001-0.008higher heating
value (MJ/kg)35.7 22.6 42.3-45.3
viscosity (cP) 15,000(61 °C)
59(40 °C)
1.0-4.6(23 °C)
aromatic/aliphatic
carbon
38/62-22/78
research octanenumber (RON)
77
distillation range (wt %)IBP-225 °C 8 44 97-36225-350 °C 32 coked 0-41
a From Elliott and Schiefelbein.346
Synthesis of Transportation Fuels from Biomass Chemical Reviews Y

8/10/2019 Synthesis Transportation Fuels Biomass
http://slidepdf.com/reader/full/synthesis-transportation-fuels-biomass 26/55
of 350-500 °C, atmospheric pressure and gas hourly spacevelocities of around 2 are used for zeolite upgrade. Theproducts from this reaction include hydrocarbons (aromatic,aliphatic), water-soluble organics, water, oil-soluble organics,gases (CO2, CO, light alkanes), and coke. During this processa number of reactions occur including dehydration, cracking,
polymerization, deoxygenation, and aromatization. Similarreactions using zeolite catalysts also occur with otherfeedstocks including methanol (Section 4.2), sugar monomers(Section 8.2), lignin (Section 9), and vegetable oils (Section10). The advantages of using a zeolite catalyst are that noH2 is required, atmospheric processing reduces operating cost,and the temperatures are similar to those for bio-oil produc-tion. According to Bridgwater, this offers significant process-ing and economic advantages over hydrotreating.223 However,poor hydrocarbon yields and high yields of coke generallyoccur under reaction conditions limiting the usefulness of zeolite upgrading.
Table 16 shows the results for zeolite upgrading of wood-derived fast-pyrolysis bio-oils by Bakhshi and co-workers
with different catalysts.224-226 Between 30 and 40 wt % of the bio-oil was deposited on the catalyst as coke or in thereactor as char. The ZSM-5 catalyst produced the highestamount (34 wt % of feed) of liquid organic products of anycatalyst tested. The products in the organic carbon weremostly aromatics for ZSM-5 and aliphatics for SiO2-Al2O3.
Gaseous products include CO2, CO, light alkanes, and lightolefins. Bio-oils are thermally unstable and thermal crackingreactions occur during zeolite upgrading. Bakhshi and co-workers developed a two reactor process, where only thermalreactions occur in the first empty reactor, and catalyticreactions occur in the second reactor that contains thecatalyst.227 The advantage of the two reactor system is thatit improved catalyst life by reducing the amount of cokedeposited on the catalyst.
The transformation of model bio-oil compounds, includingalcohols, phenols, aldehydes, ketones, acids, and mixtures,have been studied over HZSM-5 catalysts, and the majorpathways are shown in Figure 21.228-230 Alcohols wereconverted into olefins at temperatures around 200 °C, then
Figure 20. Hydrodeoxygenation pathways of 4-methylacetophenone, ethyl decanoate, and guaiacol from Ferrari et al.215 (Reprinted fromref 215 with permission. Copyright 2001 Elsevier.)
Table 16. Comparison of Different Catalysts for Zeolite Upgrading of Wood-Derived Fast-Pyrolysis Bio-oils a
HZSM-5silica-alumina
(SiO2-Al2O3 ratio 0.14) SAPO-5 SAPO-11 MgAPO-36
catalyst propertiespore size (nm) 0.54 3.15 0.80 0.56 0.75BET surface area (m2 /g) 329 321 330 205 196acid area (cm2 /g)b 224.9 125.5 76.0 15.5
product yields (wt % of feed)organic liquid product 33.6 24.9 22.2 19.9 16.3gas 6.1 10.3 12.2 10.1coke + charc 20.5-30.2 40 30.0 25.5 38.7tard 0-4.1 9.5 11.9 10.1aqueous fraction 25.0 24.2 26.3 23.1
composition organic liquid product (wt %)total hydrocarbons 86.7 45.6 51.0 56.8 51.6
aromatics 85.9e
2.1 27.5 29.1 26.7aliphatics 18.6 43.5 23.5 24.4 23.4
a From Bakhshi and co-workers.224-226 Reaction temperature 370 °C. b Acid area is measured by ammonia TPD and represents Bronsted plusLewis acid sites. c Coke is defined as organics that could only be removed from catalyst by calcinations. Char is defined as organics deposited inthe reactor due to thermal decomposition, and these compounds were not on the catalyst. d Tar are the heavy oils deposited on the catalysts thatwere only removed with a hexane/acetone wash. e Toluenes and xylenes are the most common aromatics for HZSM-5, whereas benzene is the mostcommon aromatic for SAPO and MgAPO catalysts.
Z Chemical Reviews Huber et al.

8/10/2019 Synthesis Transportation Fuels Biomass
http://slidepdf.com/reader/full/synthesis-transportation-fuels-biomass 27/55
to higher olefins at 250 °C, followed by paraffins and a smallproportion of aromatics at 350 °C (Figure 21).228 Phenol hasa low reactivity on HZSM-5 and only produces smallamounts of propylene and butanes. 2-Methoxyphenol also
has a low reactivity to hydrocarbons and thermally decom-poses generating coke. Acetaldehyde had a low reactivityon ZSM-5 catalysts, and it also underwent thermal decom-position leading to coking problems.229 Acetone, which isless reactive than alcohols, first is dehydrated to i-butene at250 °C (Figure 21) and then converts into C5+ olefins attemperatures above 350 °C. These olefins are then convertedinto C5+ paraffins, aromatics, and light alkenes. Acetic acidis first converted to acetone, which is converted into acetoneproducts. Products from zeolite upgrading of acetic acid andacetone had considerably more coke than did products fromalcohol feedstocks. Thus, different molecules in the bio-oilshave a significant difference in reactivity and coke formationrates. Gayubo et al. recommended that the oil fractions that
lead to thermal coking (such as aldehydes, oxyphenols, andfurfurals) be removed from the bio-oil prior to zeoliteupgrading. Bio-oils can be separated by fractionation usingmainly water and produce an oil layer (with mostly lignin-derived components) and an aqueous carbon containinglayer.185 The patent literature lists processes for the selectiveremoval of phenolic compounds from bio-oils by liquid-liquid extraction, where the phenolic compounds are thenused to make phenol-formaldehyde resins.231,232
6.3. Bio-Oil Mixtures
Bio-oils from fast pyrolysis are not soluble in petroleum-derived fuel due to their high water content; however,
blending of diesel with bio-oils can be accomplished usingsurfactants.233-235 Bio-oil emulsions have promising ignitioncharacteristics but also have a high cost due to surfactantaddition and a high energy cost for emulsification. Highercorrosion levels occur in engine applications with the bio-oil-diesel emulsions.235 Ikura et al. produced emulsions of bio-oil obtained by fast pyrolysis of hardwood (EnsynTechnologies), from 10 to 30 wt % bio-oil using a mixtureof Hypermer B246SF, Hypermer 2234 surfactant, and No.2 diesel fuel.233 The cetane number, which is a measure of the diesel fuel quality with higher cetane numbers beingbetter for engine use, decreased from 46, 43, 38, to 34 asthe bio-oil concentration increased from 0, 10, 20, to 30 wt%, respectively. The corrosivity of the emulsions was about
half that of the bio-oil, and the viscosity of the emulsionincreased as the fraction of the bio-oil increased. Thesurfactant production costs for a fuel with zero stratificationemulsions are reported to be 2.6, 3.4, and 4.1 ¢/L for 10,20, and 30 wt % bio-oil emulsions, respectively.233 Fuelswith a higher weight percent of bio-oils (up to 75% bio-oil)were prepared, characterized, and tested by Chiaramonti etal.234,235 Mixtures of methanol and cetane enhancers can beused to improve the combustion characteristics of bio-oils.
Suppes reported a cetane number of bio-oil as 27;185
however,blending bio-oils with a 4% cetane enhancer (tetraethyleneg-lycol dinitrate), 24% methanol and 72% bio-oils showed aperformance similar to that of diesel fuel in terms of ignitioncharacteristics.
6.4. Steam Reforming of Bio-Oils
Steam reforming of bio-oils produces syn-gas, which canthen be converted into a range of fuels as discussed in Section4.0. One application of this technology would be to have anumber of smaller plants that produce bio-oils, which arethen transported to a large central biorefinery where the bio-oils are converted into syn-gas-derived fuels.236 The largebiorefinery could take advantage of the economy of scale,and transporting the dense bio-oil is cheaper than transportingbiomass. Black liquor, the major waste biomass-containingstream from chemical pulp and paper production, also canbe converted into syn-gas by steam reforming.237 Steamreforming of fossil fuels is a well-established technology,51
and steam reforming of bio-oils is an extension of thistechnology. Steam reforming reactions occur at high tem-perature (600-800 °C) and high space velocities usually witha Ni-based catalyst.
According to Czernik et al., the most important parametersfor steam reforming of bio-oils are temperature, steam-to-carbon ratio, and catalyst-to-feed ratio.238 Steam reformingof bio-oils is complicated since some bio-oil components
are thermally unstable and decompose upon heating. Deac-tivation of the catalysts due to coking is one of the majorproblems, and bio-oils have more deactivation problems thando petroleum-derived feedstocks. In fact, steam reformingof bio-oils in fixed bed reactors requires a catalyst regenera-tion step after 3-4 h of time-on-stream.238 While bio-oilsare more reactive than petroleum oils, high temperature isneeded in the reactor to gasify coke deposits formed bythermal decomposition. High ratios of steam to carbon(greater than 7) are necessary to avoid catalyst deactivationby coking. Czernik et al. developed a fluidized bed reactorfor steam reforming of bio-oils.238 Catalysts were more stablein the fluidized bed reactor than in the fixed bed reactor dueto better contacting of the catalyst particle with steam.238 The
current problem with fluid bed catalysts is due to catalystattrition, and attrition resistant catalysts are being developed.Another advantage of steam reforming of bio-oils is that
higher value products in the bio-oils can be separated fromthe low value products, which can then be steam reformed.238
Bio-oils separate into an aqueous and organic fraction bythe addition of water to the bio-oil. The organic fraction couldbe used to make chemicals, such as phenol-formaldehyderesins, or could be alternatively converted to aromatichydrocarbons and ethers that can be used as high-octanegasoline blending components (Section 9.2). The aqueousfraction can be converted into syn-gas by steam reforming.239
The steam reforming of model biomass compounds,including acetic acid, acetone, phenol, ethanol, cresol,
Figure 21. Products from zeolite upgrading (HZSM-5) of modelbiomass compounds including propanol, butanol, and acetoneadapted from Gayubo et al.228,229
Synthesis of Transportation Fuels from Biomass Chemical Reviews AA

8/10/2019 Synthesis Transportation Fuels Biomass
http://slidepdf.com/reader/full/synthesis-transportation-fuels-biomass 28/55
dibenzyl ether, glucose, xylose, and sucrose, has been carriedout with Ni240 and noble metal-based catalysts.241,242 Aceticacid caused coking problems on the Ni catalyst surface, whileglucose, xylose, and sucrose thermally decomposed prior tothe catalyst bed.240 The sugars once volatilized did not causecoking problems on the catalyst surface but decomposed intubing prior to the catalyst bed. Nobel metal catalysts,including Pt, Rh, and Pd supported on Al2O3 and CeO2-ZrO2 were able to steam reform acetic acid, acetone, phenol,
and ethanol.241
Synthesis gas can also be produced fromgasification of biomass-derived oils without any catalysts.243
One potential way of improving steam reforming of bio-oils would be to partially hydrogenate the bio-oils prior tothe steam reforming section. Partial hydrotreating of bio-oils at lower temperature will improve the thermal stabilityof bio-oils and should decrease the amount of coking on thecatalyst. The hydrogen produced by steam reforming couldbe recycled for hydrogenation purposes.
6.5. Steam Reforming of Chars
During bio-oil production, chars are produced, which canbe converted into H2 or syn-gas by steam reforming.244,245
Alternatively, the chars can be burned as a solid fuel. Steamreforming of chars occurs at temperatures from 700 to 800°C, steam flow rates of 2.5-15 g/(h-gchar) and residencetimes from 0.5 to 2 h without any catalyst. The reaction takesplace in a bed containing the char with flowing steam. Theconcentration of the gases is dependent on the reactionconditions, but the methane concentration is less than 2 mol% with the remaining product gas being H2, CO and CO2.Up to 90% of the char can be gasified. One potential futureapplication of this technology would be the steam reformingof carbon deposited on catalyst during Bio-Oils upgrading.
6.6. Economic and Thermal Analysis ofProcesses for Bio-Oil Upgrading
Bio-oils need to be upgraded if they are to be used as atransportation fuel. Each conversion technology has advan-tages and disadvantages. Hydrotreating of bio-oils canproduce a stable, energy dense, noncorrosive oil, but requireshigh-pressure H2. Zeolite upgrading does not require H2, butextensive coking occurs on the catalyst surface. Bio-oils canform emulsions with diesel fuel, but this fuel has a highcorrosivity, and requires expensive emulsifying agents. Steamreforming of bio-oils is a technically possible route, but asdiscussed in Section 4.5, the thermal efficiency is low forsyn-gas production and the subsequent conversion into fuels.The overall mass and PTE for production of bio-oils fromwood by fast pyrolysis followed by conversion into refined
liquid fuels by hydrotreating or zeolite upgrading is shownin Table 17.223 The pyrolysis oil contains approximately 70%of the energy and 83% of the mass of the wood feedstock.The energy content of the fuel after hydrotreating and zeoliteupgrading is 63% and 53% of the wood feedstock. Furtherrefining of the hydrocarbons reduces the mass and energycontent to 25-27% and 55% of the wood feedstock,respectively. These process thermal efficiencies are higherthan the PTE for syn-gas-derived liquid fuels productionusing biomass gasification and FTS (Table 9).
Evans et al. have estimated that cost of producing H2 bysteam reforming of pyrolysis vapors is $9.51/GJ, $7.78/GJ,and $6.05/GJ when the biomass feedstock is available at $48,$24, and $0 per metric-ton of dry biomass, respectively.246
The cost of H2 from bio-oil steam reforming is similar tothe commercial cost of H2, which in 2003 was $5.7-11/GJaccording to Spath and Dayton.114 The cost of H2 isdependent on the cost of fossil fuels, and as the cost of fossilfuels increases the cost of H2 will also increase.
All of the bio-oil upgrading routes should be explored inthe future, and new catalysts need to be developed for theseroutes to become economical. It would be ideal to use thefunctionality of the bio-oils to produce a high qualitytransportation fuel. For example if the acids and alcohols inthe bio-oil could react to form esters this might improve thecharacteristics of the bio-oil. Future work will also requirethat the upgrading system be integrated into the biorefineryplant. Niche markets, for high-value products from bio-oilsare the near term application of bio-oils. As bio-oil produc-tion becomes more efficient, and bio-oil upgrading technol-ogy improves, it is likely that bio-oils derived from pyrolysisand/or liquefaction could be used as a transportation fuel.
7.0. Biomass Monomer Production
The previous methods for lignocellulose biomass conver-sion require high-temperature treatments (greater than 500°C) for production of gases, liquids or solids. In this section,
we discuss how to selectively convert cellulosic biomass intomonomer units by low temperature reactions where the firstreaction involves acid hydrolysis. The monomer units arethen selectively converted into targeted fuels as discussedin the following sections (8.0 and 9.0). Biomass conversioninto monomer units is a function of the biomass type andsome plant materials, such as cane sugar and corn, are easilyconverted into monomer units. Lignocellulose is difficult tobreak up into monomer units due to its recalcitrant nature,and a significant amount of research has been done toselectively convert this low-cost material into monomer units.Biomass hydrolysis can allow the selective and energy-efficient conversion of biomass into monomer units, whichcan then be selectively converted into fuels or chemicals.
7.1. Pretreatment
To achieve high yields of glucose, lignocellulose must firstbe pretreated. The goal of pretreatment is to decrease thecrystallinity of cellulose, increase biomass surface area,remove hemicellulose, and break the lignin seal.247 Thispretreatment changes the biomass structure and improvesdownstream processing. Pretreatment methods include physi-cal, chemical, and thermal or some combination of the three.Pretreatment is one of the most expensive processing stepsfor the production of sugars from biomass, and the costs havebeen estimated to be as high as $0.08/Lethanol.247 Pretreatmentis also one of the least understood processing options. A
Table 17. Overall Mass and Process Thermal Efficiencies (PTE)for Conversion of Wood into Liquid Fuels by Pyrolysis andCatalytic Upgrading (Hydrotreating and Zeolite) a
pyrolysisoil
partiallyhydro-treated
crudehydro-carbons
refinedhydro-carbons
mass PTE mass PTE mass PTE mass PTE
hydro-treating
0.83 0.70 0.50 0.66 0.30 0.63 0.27 0.55
zeolite 0.83 0.70 0.23 0.53 0.25 0.55
a Adapted from Bridgwater.223 This table does not include the energyadded to the hydrocarbon by the hydrogen.
AB Chemical Reviews Huber et al.

8/10/2019 Synthesis Transportation Fuels Biomass
http://slidepdf.com/reader/full/synthesis-transportation-fuels-biomass 29/55
recent issue of Bioresour. Technol. is dedicated to pretreat-ment methods.247-250
According to Wyman et al. the following is a list of desirable pretreatment attributes:247
(1) Low cost of chemicals for pretreatment, neutralization,and subsequent conditioning
(2) Minimal waste production(3) Limited size reduction because biomass milling is
energy-intensive and expensive(4) Fast reactions and/noncorrosive chemicals to minimize
pretreatment reactor cost(5) The concentration of hemicellulose sugars from pre-
treatment should be above 10% to keep fermentation reactorsize at a reasonable level and facilitate downstream recovery.
(6) Pretreatment must promote high product yields insubsequent enzymatic hydrolysis or fermentation operationswith minimal conditioning costs.
(7) Hydrolysate conditioning in preparation for subsequentbiological steps should not form products that have process-
ing or disposal challenges.(8) Low enzyme loading should be adequate to realizegreater than 90% digestibility of pretreated cellulose in lessthan 5 days and preferably 3 days.
(9) Pretreatment should facilitate recovery of lignin andother constituents for conversion to valuable co/products andto simplify downstream processing.
Physical pretreatment methods include ball milling, com-minution (mechanical reduction of biomass particulate size),and compression milling. Solvents such as H2O2, ozone,glycerol, dioxane, phenol, or ethylene glycol have been usedfor biomass pretreatment, and these solvents are known tobreak apart cellulose structures and promote hydrolysis.247
However, solvent pretreatments appear too expensive for
practical purposes.247
According to Mosier et al., the mostcost-effective and promising pretreatment methods are diluteacid, uncatalyzed steam explosion, pH controlled hot water,treatment with lime, and treatment with ammonia.247
Table 18 shows the effect of various pretreatment methodson the chemical and physical structure of lignocellulosicbiomass. Uncatalyzed steam explosion is used commerciallyto remove hemicellulose for the manufacture of fiberboardand other products by the Masonite process.247 High pressuresteam is applied to wood chips for a few minutes withoutthe addition of chemicals, and this process is terminated bydecompression of the steam. This process increases thesurface area without decrystalizing the cellulose, and cel-lulose downstream digestibility is significantly improved.247
Water treatments at elevated temperatures (200-230 °C)and pressures can increase the biomass surface area andremove hemicellulose.247,249,250 Three types of reactors areused for hot water pretreatment including co-current (biomassand water are heated together for a certain residence time),countercurrent (water and lignocellulose move in opposite
directions), and flow through (hot water passes over astationary bed of lignocellulose).251 The advantage of hotwater treatment is that acid addition and size reduction arenot needed. A disadvantage of these methods is that hot watertreatment forms sugar degradation products (furfural frompentoses and HMF from glucose). The degradation productscan be minimized by controlling the pH of the hot water byaddition of bases such as potassium hydroxide.
Dilute sulfuric acid treatments can be used to hydrolyzehemicellulose to sugars with high yields, change the structureof the lignin, and increase the cellulosic surface area.247,249,250
The disadvantage of this process is that it requires corrosiveacid, with corresponding downstream neutralization, and
special materials for reactor construction. Ammonia fiber/ freeze explosion (AFEX), where anhydrous ammonia iscontacted with lignocellulose, can increase the surface areaof the biomass, decrease crystallinity of cellulose, dissolvepart of the hemicellulose, and remove lignin. Treatment of the biomass with a less concentrated ammonia solution isknown as ammonia recycled percolation (ARP). Ambientconditions can be used for lime treatments; however, the timerequired for these treatments is in terms of weeks. Thisprocess involves mixing lime with water and spraying it ontothe biomass. The major effect of lime pretreatment is removalof lignin. The biomass surface area is increased, and theacetyl and uronic acid fractions of hemicellulose are re-moved.
Table 19 shows the results of different pretreatmentmethods followed by enzymatic hydrolysis for productionof sugars from corn stover.249 Table 20 lists the reactionconditions for the pretreatments.249 Using corn stover feed-stocks sugar yields of over 90% were obtained with thevarious pretreatments. A hot water treatment with a flowthrough reactor was the pretreatment method with the highestoverall soluble product yield; however, the xylose monomeryield was only 2.4%, meaning this method did not producexylose monomers. A dilute acid pretreatment method pro-duced the highest amounts of sugar monomers with a 92%yield. Results are expected to be different with otherfeedstocks.
Table 18. Effect of Promising Pretreatment Methods on the Structure and Composition of Lignocellulose Biomass a
pretreatment method increases surface area decrystalizes cellulose removes hemicellulose removes lignin alters lignin structure
uncatalyzedsteam explosion
*** *** *
liquid hot water *** N.D. *** *pH controlled
hot water*** N.D. *** N.D.
flow-throughliquid hot water
*** N.D. *** * *
dilute acid *** *** ***
flow-through acid *** *** * ***ammonia fiberexplosion (AFEX)
*** *** * *** ***
ammonia recycledpercolation (ARP)
*** *** * *** ***
lime *** N.D. * *** ***
a Adapted from Mosier et al.247 ***, major effect; *, minor effect; N.D., not determined.
Synthesis of Transportation Fuels from Biomass Chemical Reviews AC
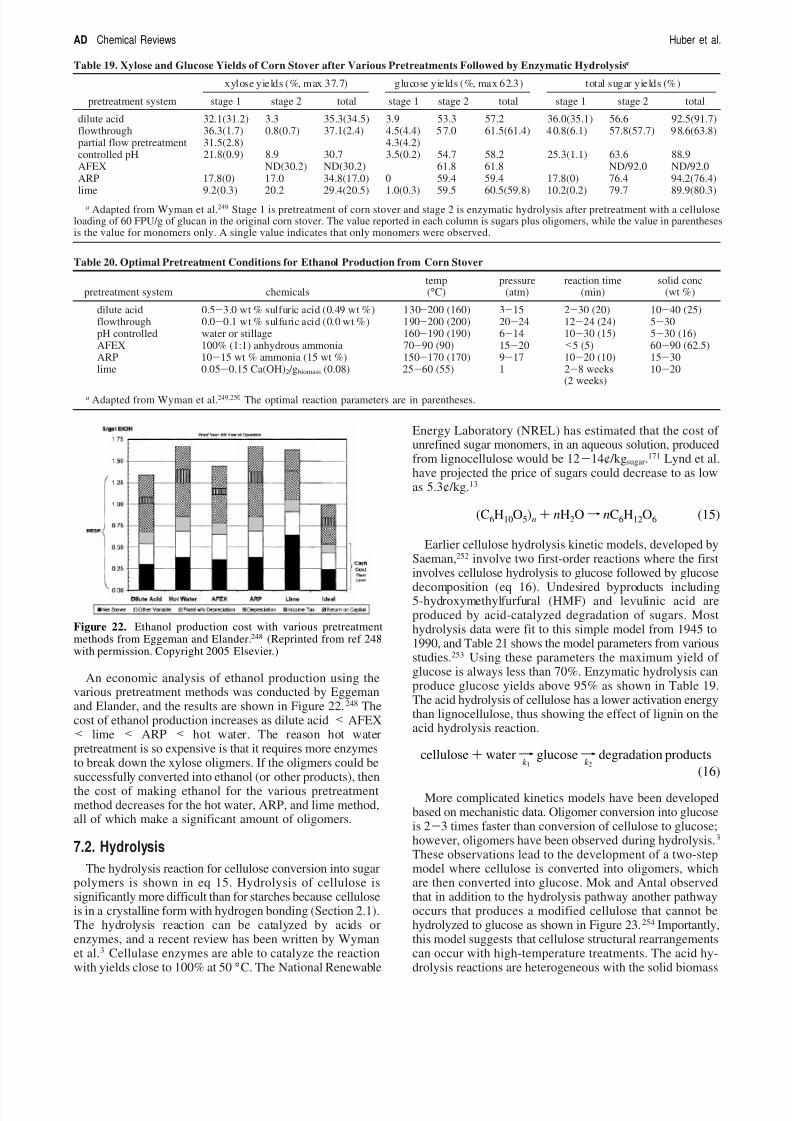
8/10/2019 Synthesis Transportation Fuels Biomass
http://slidepdf.com/reader/full/synthesis-transportation-fuels-biomass 30/55
An economic analysis of ethanol production using thevarious pretreatment methods was conducted by Eggemanand Elander, and the results are shown in Figure 22.248 Thecost of ethanol production increases as dilute acid < AFEX< lime < ARP < hot water. The reason hot waterpretreatment is so expensive is that it requires more enzymesto break down the xylose oligmers. If the oligmers could besuccessfully converted into ethanol (or other products), thenthe cost of making ethanol for the various pretreatmentmethod decreases for the hot water, ARP, and lime method,all of which make a significant amount of oligomers.
7.2. Hydrolysis
The hydrolysis reaction for cellulose conversion into sugarpolymers is shown in eq 15. Hydrolysis of cellulose issignificantly more difficult than for starches because celluloseis in a crystalline form with hydrogen bonding (Section 2.1).The hydrolysis reaction can be catalyzed by acids orenzymes, and a recent review has been written by Wymanet al.3 Cellulase enzymes are able to catalyze the reactionwith yields close to 100% at 50 °C. The National Renewable
Energy Laboratory (NREL) has estimated that the cost of unrefined sugar monomers, in an aqueous solution, producedfrom lignocellulose would be 12-14¢/kgsugar.171 Lynd et al.have projected the price of sugars could decrease to as lowas 5.3¢/kg.13
Earlier cellulose hydrolysis kinetic models, developed bySaeman,252 involve two first-order reactions where the firstinvolves cellulose hydrolysis to glucose followed by glucose
decomposition (eq 16). Undesired byproducts including5-hydroxymethylfurfural (HMF) and levulinic acid areproduced by acid-catalyzed degradation of sugars. Mosthydrolysis data were fit to this simple model from 1945 to1990, and Table 21 shows the model parameters from variousstudies.253 Using these parameters the maximum yield of glucose is always less than 70%. Enzymatic hydrolysis canproduce glucose yields above 95% as shown in Table 19.The acid hydrolysis of cellulose has a lower activation energythan lignocellulose, thus showing the effect of lignin on theacid hydrolysis reaction.
More complicated kinetics models have been developedbased on mechanistic data. Oligomer conversion into glucoseis 2-3 times faster than conversion of cellulose to glucose;however, oligomers have been observed during hydrolysis.3
These observations lead to the development of a two-stepmodel where cellulose is converted into oligomers, whichare then converted into glucose. Mok and Antal observedthat in addition to the hydrolysis pathway another pathwayoccurs that produces a modified cellulose that cannot behydrolyzed to glucose as shown in Figure 23.254 Importantly,this model suggests that cellulose structural rearrangementscan occur with high-temperature treatments. The acid hy-drolysis reactions are heterogeneous with the solid biomass
Table 19. Xylose and Glucose Yields of Corn Stover after Various Pretreatments Followed by Enzymatic Hydrolysis a
xylose yields (%, max 37.7) glucose yields (%, max 62.3) total sugar yields (%)
pretreatment system stage 1 stage 2 total stage 1 stage 2 total stage 1 stage 2 total
dilute acid 32.1(31.2) 3.3 35.3(34.5) 3.9 53.3 57.2 36.0(35.1) 56.6 92.5(91.7)flowthrough 36.3(1.7) 0.8(0.7) 37.1(2.4) 4.5(4.4) 57.0 61.5(61.4) 40.8(6.1) 57.8(57.7) 98.6(63.8)partial flow pretreatment 31.5(2.8) 4.3(4.2)controlled pH 21.8(0.9) 8.9 30.7 3.5(0.2) 54.7 58.2 25.3(1.1) 63.6 88.9AFEX ND(30.2) ND(30.2) 61.8 61.8 ND/92.0 ND/92.0ARP 17.8(0) 17.0 34.8(17.0) 0 59.4 59.4 17.8(0) 76.4 94.2(76.4)lime 9.2(0.3) 20.2 29.4(20.5) 1.0(0.3) 59.5 60.5(59.8) 10.2(0.2) 79.7 89.9(80.3)
a Adapted from Wyman et al.249 Stage 1 is pretreatment of corn stover and stage 2 is enzymatic hydrolysis after pretreatment with a celluloseloading of 60 FPU/g of glucan in the original corn stover. The value reported in each column is sugars plus oligomers, while the value in parenthesesis the value for monomers only. A single value indicates that only monomers were observed.
Table 20. Optimal Pretreatment Conditions for Ethanol Production from Corn Stover
pretreatment system chemicalstemp(°C)
pressure(atm)
reaction time(min)
solid conc(wt %)
dilute acid 0.5-3.0 wt % sulfuric acid (0.49 wt %) 130-200 (160) 3-15 2-30 (20) 10-40 (25)flowthrough 0.0-0.1 wt % sulfuric acid (0.0 wt %) 190-200 (200) 20-24 12-24 (24) 5-30pH controlled water or stillage 160-190 (190) 6-14 10-30 (15) 5-30 (16)AFEX 100% (1:1) anhydrous ammonia 70-90 (90) 15-20 <5 (5) 60-90 (62.5)ARP 10-15 wt % ammonia (15 wt %) 150-170 (170) 9-17 10-20 (10) 15-30lime 0.05-0.15 Ca(OH)2 /gbiomass (0.08) 25-60 (55) 1 2-8 weeks
(2 weeks)10-20
a Adapted from Wyman et al.249,250 The optimal reaction parameters are in parentheses.
Figure 22. Ethanol production cost with various pretreatmentmethods from Eggeman and Elander.248 (Reprinted from ref 248with permission. Copyright 2005 Elsevier.)
(C6H10O5)n + nH2O f nC6H12O6 (15)
cellulose + water98 k 1
glucose98 k 2
degradation products(16)
AD Chemical Reviews Huber et al.

8/10/2019 Synthesis Transportation Fuels Biomass
http://slidepdf.com/reader/full/synthesis-transportation-fuels-biomass 31/55
reacting with liquid acid. Thus, mass transfer limitations alsocan play a role in hydrolysis.
The mechanism for C-O-C bond cleavage in celluloseinvolves protonation of glucoside bonds as shown in Figure24. The proton can either attack the oxygen bond betweenthe two glucose units or the cyclic oxygen, which is definedas pathways A-1 and A-2, respectively.253 The mechanismis thought to involve the rapid formation of an intermediatecomplex with the oxygen and proton, followed by the slowsplitting of glucosidic bonds by the addition of a watermolecule.
Heterogeneous reactions occur during cellulose hydrolysisin the biomass where the acid first penetrates into disorderedcellulose regions leading to an initial rapid decrease in the
degree of polymerization (DP).253 After the rapid initialdecrease, the DP reaches an asymptotic value where the DPremains at a constant value called the degree of polymeri-zation (LOPD). The LODP is dependent on the type of cellulose samples and is reached when only 2-5% of thesample has been hydrolyzed. The average length of crystallitein the cellulose sample is considered to be the same as theLODP. Oxidation of cellulose (with oxidizing agents suchas H2O2, NaClO2, O3, KBrO3, etc.) prior to hydrolysis orduring progressive hydrolysis reduces the DP of partiallyhydrolyzed residues. This treatment decreases the aldehyde
concentration and increases the carboxyaldehyde concentra-tion, which prevents recrystallization. Recrystallization canoccur during acid or enzymatic hydrolysis.253
Prior to enzymatic hydrolysis, the cellulose structure mustbe pretreated to open up the structure of biomass for reactionof the cellulose with cellulase. Initially, a process wasdesigned to produce ethanol through enzymatic hydrolysisby separate hydrolysis and fermentation (SHF) steps. Thisinvolved using improved enzymes from the fungus Tricho-
derma reesei.3 Problems with this methods are that cellobioseand glucose inhibit the reaction, which increased enzyme
Table 21. Kinetic Parameters for Acid Hydrolysis of Various Biomass Feedstocks with the Saeman Model (eq 14) a
feed temp (°C) acid conc (wt %) K 1 (min-1) K 2 (min-1) E 1 (kJ/mol) E 2 (kJ/mol) m n
glucose 160-260 ? 1.85 × 10¹⁴ 136 1.0cellulose 100-130 5-40 H2SO4 1.57 × 10¹⁴ 142 1.42Douglas fir 170-190 0.4-1.0 H2SO4 1.73 × 10¹⁹ 2.38 × 10¹⁴ 180 137 1.34 1.02Kraft paper 180-230 0.2-1.0 H2SO4 28 × 1019 4.9 × 10¹⁴ 189 137 1.78 0.55newsprint 200-240 1.0 H2SO4 28 × 1019 4.8 × 10¹⁴ 189 137 NR NRSolka-floc 180-240 ? 1.22 × 10¹⁹ 3.79 × 10⁴ 178 137 NR NRCane bagasse 100-130 5-40 H2SO4 1.15 × 10²¹ 152 1.42
a
Adapted from Fan et al.253
Saeman model is represented as cellulose + water9
8 k 1 glucose9
8 k 2 degradation products where k 1 ) K 1(Conacid)m
exp(- E 1 / RT ) and k 2 ) K 2(Conacid)n exp(- E 2 / RT ) with ConAcid in wt fraction of acid.
Figure 23. Cellulose acid-catalyzed hydrolysis pathways adaptedfrom Mok and Antal.254
Figure 24. Mechanism of acid hydrolysis of cellulose adapted from Fan et al.253
Synthesis of Transportation Fuels from Biomass Chemical Reviews AE

8/10/2019 Synthesis Transportation Fuels Biomass
http://slidepdf.com/reader/full/synthesis-transportation-fuels-biomass 32/55

8/10/2019 Synthesis Transportation Fuels Biomass
http://slidepdf.com/reader/full/synthesis-transportation-fuels-biomass 33/55
the first reactor; and 193 °C, 14.6 atm, and 12 min residencetime for the second reactor.
A pilot plant was operated for 1 year using paper sludgefeedstocks and producing levulinic acid (70% yield fromcellulose), formic acid (50% yield from cellulose), furfural
(80% yield from hemicellulose), and char at a feed rate of 1dry ton/day. BioMetics estimated that a large-scale plant(1000-2000 dry tons/day) could produce levulinic acid for$0.09-0.11/kg. During the process, the cellulose is firstconverted into sugars, which are then converted into levulinicacid, formic acid, and chars (Figure 27). Cellulose conversioninto sugars is a fast reaction, whereas subsequent sugarconversion into levulinic acid is a slow reaction. Typicalyields were approximately 0.5 kg of levulinic acid/kg of cellulose. The process can use wet feedstocks without drying,improving the overall process energy efficiency.
7.4. Hydrogenation/Hydrolysis
Hydrolysis of biomass can be combined with hydrogena-tion to produce xylitol, sorbitol, and sorbitan from cellulose,aspen, switchgrass, and wood biomass resources at anestimated polyol cost of $0.055-0.070/kg.263 This is doneby adding a Ru/carbon catalyst for hydrogenation, with H3-PO4, acid catalyst for hydrogenolysis, at 155-170 °C and30-50 atm H2. Approximately 50-70% of the cellulose andhemicellulose were converted into polyols. Xylitol, sorbitol,and sorbitan can be used as feedstocks for fuels productionby aqueous-phase processing.
8.0. Sugar Conversion into Fuels
This section discusses production of fuels from sugarmonomers.
8.1. Ethanol Production
Presently, the production of ethanol by fermentation of carbohydrates is the primary technology for the generationof liquid fuels from renewable biomass resources. In 2001,the U.S. and Brazil produced 6.63 × 10⁹ and 11.2 × 10⁹ Lof ethanol per year, respectively.264 Ethanol can be useddirectly as a fuel, and in Brazil hydrous ethanol, whichconsists of 95.5% ethanol and 4.5% water, is used to powervehicles.264 Ethanol is also blended with gasoline, and in theU.S. most ethanol is sold as a blend of 10% ethanol and90% gasoline. Brazil also blends ethanol with gasoline. TheU.S. Clean Air Act of 1990 mandated the use of oxygenates
in fuels in winter months for areas with high CO levels, andethanol oxygenates gasoline. Ethylene hydration is anothermethod used to make ethanol from petroleum. Sugars areconverted to ethanol by fermentation usually with the yeastSaccharomyces cereV isiae as shown in eq 17. Althoughalmost half of the mass of sugar is released as CO2, almostall of the sugar energy is captured in the ethanol. S. cereV isiaeferments glucose, mannose, fructose, and galactose. Hightheoretical yields of ethanol are obtained from this reaction,
and small amounts of byproducts including glycerol, aceticacid, lactic acid, succinic acid, and fusel oil are formed. Yeastproduction requires a small amount of the sugar as afeedstock.
Industrially, a number of different biomass feedstocks areused for ethanol production as shown in Figure 28. The first
step in ethanol production is conversion of the biomass intofermentable sugars. This conversion step depends on thefeedstock. Sugarcane is converted into water-soluble sugarsor cane juice (30 wt % of sugarcane) and insolublelignocellulose or sugarcane bagasse, and sugar fermentationdoes not require extensive pretreatment. The sugarcanebagasse is burned to provide heat for the process. The sugarsare heated to 105-110 °C to reduce microbial contamination,nutrients such as ammonium sulfate and other salts are added,and fermentation is carried out at about 20 wt % sugarconcentration, pH 4-5, temperatures 30-38 °C, and resi-dence time of 28-48 h.2,264 Typical yields for ethanol
Figure 27. Production of levulinic acid by the biorefine processadapted from Manzer.19
C6O6H12 f 2C2H5OH + 2CO2 (17)
Figure 28. Block flow diagram for ethanol production from corn,cane sugar and cellulosic biomass from Wyman.264 Corn wet millsproduce corn oil, corn gluten meal (CGM), and corn gluten feed(CGF) for food and animal feed. Corn dry mills produce an animalfeed called DDGS after the fermentation process. (Reprinted from
ref 264 with permission. Copyright 2004 Elsevier.)
Synthesis of Transportation Fuels from Biomass Chemical Reviews AG

8/10/2019 Synthesis Transportation Fuels Biomass
http://slidepdf.com/reader/full/synthesis-transportation-fuels-biomass 34/55
production from sugarcane are 160-190 L/metric ton.2 Thesugars are then distilled to azetropic levels (95% ethanol)and can be dried further using molecular sieves.
Ethanol is produced from corn grains and other starchesby either wet or dry milling. Corn grain contains 70 wt %starch, 10-11 wt % crude protein, 4.5-6.0 wt % oil, 6 wt% hemicellulose, 2-3 wt % cellulose, 1 wt % lignin, and 1wt % ash.264 The first step in a dry milling plant is tomechanically grind the grain to a 40-mesh size to rupturethe hull walls and expose the starch polymers. The grain isthen heated with water to 85 °C, mixed with R-amylaseenzyme, held for 1 h and heated further to 110-150 °C toreduce bacteria levels and liquefy the starch. This is followed
by cooling back to 85 °C for 1 h with the addition of moreR-amylase.264 The stream is further cooled and gluco-amylaseenzyme is added to finish process.
In the wet milling process, the crude starch, gluten, andcorn oil fractions are separated through a series of steeping,milling, and separation steps.264 The products include glutenmeal, gluten feed, corn germ, meal, and corn oil, which canbe used for human consumption or animal feed. In a drymill plant, a coproduct protein, known as distillers driedgrains with solubles (DDGS) or distillers dried grains (DDG)is recovered after distillation. The ethanol solution, at 12-14 wt % ethanol, is then distilled to azetropic levels (95%ethanol) and dried further using molecular sieves. The sugarsare fermented in both wet and dry milling processes with S.
cereV isiae, and typical yields range from 460 to 490 L/metricton corn grain.2,264 The ethanol yields from corn grain arehigher than those from sugarcane; however, sugarcane hasa higher yield per land area (Section 2.1).
While not currently done commercially, research is beingcarried out to produce ethanol from lignocellulosic biomass.The NREL has modeled a process for conversion of cornstover (lignocellulose) to ethanol based on dilute acidprehydrolysis and enzymatic hydrolysis.171 The first step inthis process is feedstock size reduction to the appropriatesize. The cellulose is then treated in sulfuric acid (1.1 wt%) for 2 min at 190 °C and 12 atm to release most of thehemicellulose sugars and acetic acid. The reaction is thenflash cooled to drop the temperature to 100 °C, and the acid
is neutralized with lime to a pH of about 10. The resultingsolid fraction is sent to a saccharification unit where thecellulose is hydrolyzized to glucose and cellobiose. Thesaccharification reaction occurs at 65 °C for 1.5 days.Cellulose enzymes catalyze the hydrolysis reactions. Theseenzymes contain (1) endoglucanases, which reduce thecellulose polymer size, (2) exoglucanases, which attack theends of cellulose fibers, allowing it to hydrolyze highlycrystalline cellulose, and (3) -glucosidase, which hydrolyzecellobiose released by exoglucanasesto glucose. Cellulase isproduced industrially from T. reesei. Genencor Internationaland Novozymes Biotech are the two largest manufacturersof this enzyme.
In the NREL configuration, the resulting glucose sugarstream is combined with the xylose sugar stream andfermented to ethanol with the recombinant Zymomonasmobilis bacterium at 41°C for 1.5 days. The bacterium mustbe grown in a seed fermentation vessel in a separate processarea. Lignocellulose also contains xylose sugars, whichcannot be fermented by S. cereV isiae without geneticmodification. Organisms have been developed that fermentboth xylose and glucose.265,266 The ethanol water solutionsare distilled to around 95% ethanol, where ethanol and waterform an azetrope. Ethanol is further purified using molecularsieves. The solids left are concentrated in a triple effectevaporator. The first ethanol plant from cellulose (which iscurrently not in operation) was built in South Carolina in
1910 and gave 83 Lethanol /metric tonbiomass (sawdust).2
It isestimated that the new NREL design has a yield of 320Lethanol /metric tondrybiomass.171
Production costs of ethanol will be highly dependent onthe regional cost of producing biomass. Typical ethanolproduction costs from sugarcane, corn grain, and lignocel-lulose are shown in Table 22.171,264,267,268 The ethanolproduction cost decreases depending on the feedstock assugarcane > corn grain > lignocellulose. The feedstock costsare 53 and 28% of the ethanol production costs fromsugarcane and lignocellulose. Coproducts are sold when corn-grain is used as the feedstock, which reduces the overallethanol production cost. Lignocellulose has the lowestfeedstock cost, and research is in progress to reduce the cost
Table 22. Production Costs, Energy Ratios, and Thermal Efficiencies for Ethanol Production from Sugarcane, Corn Grain, andLignocellulose Biomass and Diesel Fuel a
feedstock sugarcane corn grain corn stover (lignocellulose) diesel fuelb
costsfeedstock cost ($/L) 0.127-0.134 0.21-0.25 0.088coproduct credits ($/L) (0.07-0.11)estimated production costs ($/L) 0.21-0.25 0.25 0.31-0.38 0.44estimated production costs ($/GJHHV) 4.9-5.9 5.9 7.25-8.89 11
fossil energy ratio (MJfossil fuel /MJproduct)c
biomass production 0.09-0.14 0.25 0.06-0.15 1.113
biomass transport ? 0.03 0.01-0.04 0.016ethanol production 0.02-0.04 0.62 (0.16-0.37)d 0.00 0.064ethanol conversion ? 0.02 0.01-0.05 0.006
overall 0.10-0.18 0.92 (0.46-0.67)d 0.08-0.24 1.199process thermal efficiency (PTE) 0.20-0.45e 0.41 (0.46-0.51) f 0.49 (0.53)g 0.94life cycle thermal efficiency (LCTE) 0.19-0.43e 0.26 (0.28-0.30) f 0.39-0.45 (0.43-0.49)g 0.83
a From Shapouri et al. 2002,177 Shapouri et al. 1998,267 Wyman,264 Aden et al.,171 Wooley et al.,268 and Sheehan et al.328 b Diesel fuel at a costof $57/bbl. Diesel fuel costs are the FOB spot price of diesel fuel at New York Harbor.14 c Fossil energy ratios are estimated with higher heatingvalue of ethanol of 23.404 MJ/Lethanol. d Fossil energy ratios and efficiencies for ethanol production from corn decreases depending on how energycredits are given for coproducts.177 The values in parentheses are the number with coproduct energy credits. e The process and life cycle thermalefficiencies take into account the energy in the bagasse. It is assumed that the energy content of bagasse and the sugars are equal. Sugarcanecontains 12-17 wt % sugars and 68-72 wt % moisture.264 f The process and life cycle thermal efficiencies take into account the energy in the cornstover. It is assume that corn stover and the sugars have equal energy content, and the mass ratio of corn grain to corn stover is 1:1. The processthermal efficiency does not include the energy required for fossil fuel production. g The values in parentheses count electricity generation as acoproduct.
AH Chemical Reviews Huber et al.
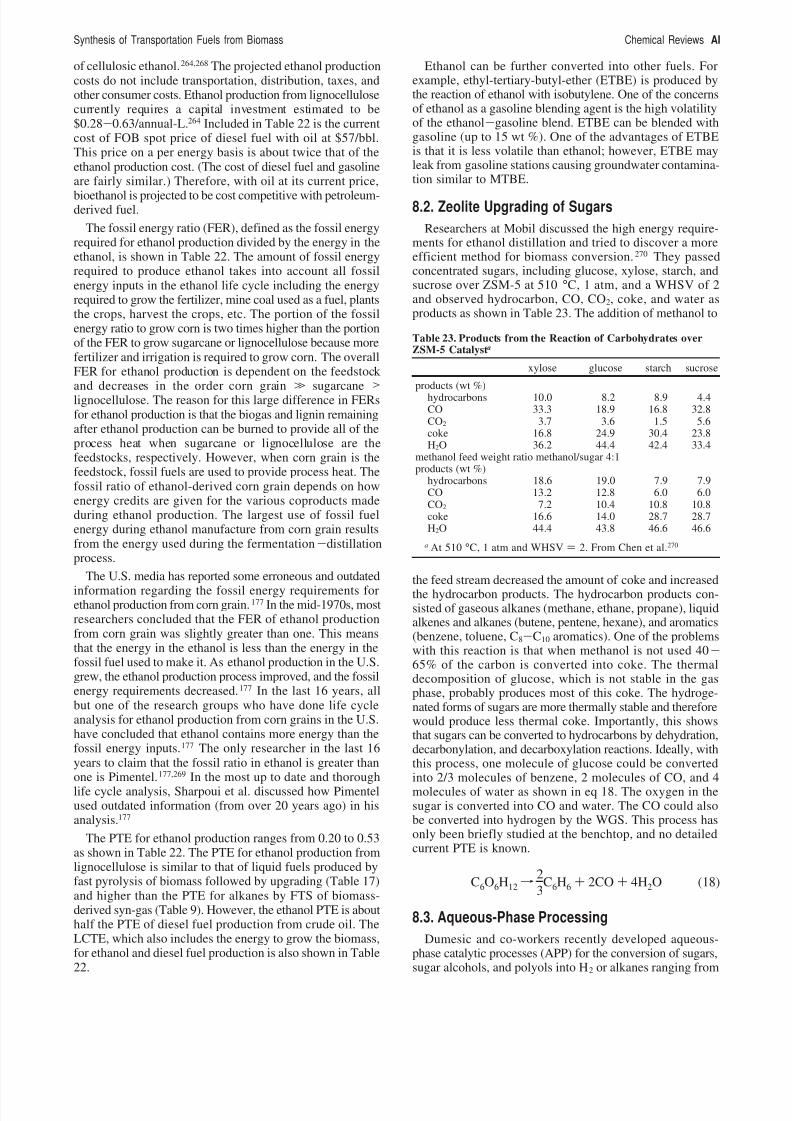
8/10/2019 Synthesis Transportation Fuels Biomass
http://slidepdf.com/reader/full/synthesis-transportation-fuels-biomass 35/55
of cellulosic ethanol.264,268 The projected ethanol productioncosts do not include transportation, distribution, taxes, andother consumer costs. Ethanol production from lignocellulosecurrently requires a capital investment estimated to be$0.28-0.63/annual-L.264 Included in Table 22 is the currentcost of FOB spot price of diesel fuel with oil at $57/bbl.This price on a per energy basis is about twice that of theethanol production cost. (The cost of diesel fuel and gasolineare fairly similar.) Therefore, with oil at its current price,
bioethanol is projected to be cost competitive with petroleum-derived fuel.
The fossil energy ratio (FER), defined as the fossil energyrequired for ethanol production divided by the energy in theethanol, is shown in Table 22. The amount of fossil energyrequired to produce ethanol takes into account all fossilenergy inputs in the ethanol life cycle including the energyrequired to grow the fertilizer, mine coal used as a fuel, plantsthe crops, harvest the crops, etc. The portion of the fossilenergy ratio to grow corn is two times higher than the portionof the FER to grow sugarcane or lignocellulose because morefertilizer and irrigation is required to grow corn. The overallFER for ethanol production is dependent on the feedstockand decreases in the order corn grain . sugarcane >lignocellulose. The reason for this large difference in FERsfor ethanol production is that the biogas and lignin remainingafter ethanol production can be burned to provide all of theprocess heat when sugarcane or lignocellulose are thefeedstocks, respectively. However, when corn grain is thefeedstock, fossil fuels are used to provide process heat. Thefossil ratio of ethanol-derived corn grain depends on howenergy credits are given for the various coproducts madeduring ethanol production. The largest use of fossil fuelenergy during ethanol manufacture from corn grain resultsfrom the energy used during the fermentation-distillationprocess.
The U.S. media has reported some erroneous and outdated
information regarding the fossil energy requirements forethanol production from corn grain.177 In the mid-1970s, mostresearchers concluded that the FER of ethanol productionfrom corn grain was slightly greater than one. This meansthat the energy in the ethanol is less than the energy in thefossil fuel used to make it. As ethanol production in the U.S.grew, the ethanol production process improved, and the fossilenergy requirements decreased.177 In the last 16 years, allbut one of the research groups who have done life cycleanalysis for ethanol production from corn grains in the U.S.have concluded that ethanol contains more energy than thefossil energy inputs.177 The only researcher in the last 16years to claim that the fossil ratio in ethanol is greater thanone is Pimentel.177,269 In the most up to date and thoroughlife cycle analysis, Sharpoui et al. discussed how Pimentelused outdated information (from over 20 years ago) in hisanalysis.177
The PTE for ethanol production ranges from 0.20 to 0.53as shown in Table 22. The PTE for ethanol production fromlignocellulose is similar to that of liquid fuels produced byfast pyrolysis of biomass followed by upgrading (Table 17)and higher than the PTE for alkanes by FTS of biomass-derived syn-gas (Table 9). However, the ethanol PTE is abouthalf the PTE of diesel fuel production from crude oil. TheLCTE, which also includes the energy to grow the biomass,for ethanol and diesel fuel production is also shown in Table22.
Ethanol can be further converted into other fuels. Forexample, ethyl-tertiary-butyl-ether (ETBE) is produced bythe reaction of ethanol with isobutylene. One of the concernsof ethanol as a gasoline blending agent is the high volatilityof the ethanol-gasoline blend. ETBE can be blended withgasoline (up to 15 wt %). One of the advantages of ETBEis that it is less volatile than ethanol; however, ETBE mayleak from gasoline stations causing groundwater contamina-tion similar to MTBE.
8.2. Zeolite Upgrading of Sugars
Researchers at Mobil discussed the high energy require-ments for ethanol distillation and tried to discover a moreefficient method for biomass conversion.270 They passedconcentrated sugars, including glucose, xylose, starch, andsucrose over ZSM-5 at 510 °C, 1 atm, and a WHSV of 2and observed hydrocarbon, CO, CO2, coke, and water asproducts as shown in Table 23. The addition of methanol to
the feed stream decreased the amount of coke and increasedthe hydrocarbon products. The hydrocarbon products con-sisted of gaseous alkanes (methane, ethane, propane), liquidalkenes and alkanes (butene, pentene, hexane), and aromatics(benzene, toluene, C8-C10 aromatics). One of the problemswith this reaction is that when methanol is not used 40-65% of the carbon is converted into coke. The thermaldecomposition of glucose, which is not stable in the gasphase, probably produces most of this coke. The hydroge-nated forms of sugars are more thermally stable and thereforewould produce less thermal coke. Importantly, this showsthat sugars can be converted to hydrocarbons by dehydration,decarbonylation, and decarboxylation reactions. Ideally, withthis process, one molecule of glucose could be convertedinto 2/3 molecules of benzene, 2 molecules of CO, and 4molecules of water as shown in eq 18. The oxygen in thesugar is converted into CO and water. The CO could alsobe converted into hydrogen by the WGS. This process hasonly been briefly studied at the benchtop, and no detailedcurrent PTE is known.
8.3. Aqueous-Phase Processing
Dumesic and co-workers recently developed aqueous-phase catalytic processes (APP) for the conversion of sugars,sugar alcohols, and polyols into H2 or alkanes ranging from
Table 23. Products from the Reaction of Carbohydrates overZSM-5 Catalyst a
xylose glucose starch sucrose
products (wt %)hydrocarbons 10.0 8.2 8.9 4.4CO 33.3 18.9 16.8 32.8CO2 3.7 3.6 1.5 5.6coke 16.8 24.9 30.4 23.8H2O 36.2 44.4 42.4 33.4
methanol feed weight ratio methanol/sugar 4:1products (wt %)
hydrocarbons 18.6 19.0 7.9 7.9CO 13.2 12.8 6.0 6.0CO2 7.2 10.4 10.8 10.8coke 16.6 14.0 28.7 28.7H2O 44.4 43.8 46.6 46.6
a At 510 °C, 1 atm and WHSV ) 2. From Chen et al.270
C6O6H12 f 23
C6H6 + 2CO + 4H2O (18)
Synthesis of Transportation Fuels from Biomass Chemical Reviews AI

8/10/2019 Synthesis Transportation Fuels Biomass
http://slidepdf.com/reader/full/synthesis-transportation-fuels-biomass 36/55
C1 to C15.18,22,25,115,159,160,271-273 Hydrogen, as well as CO2,CO, and light alkanes, are produced by aqueous-phasereforming (APR) of the sugar or sugar-derived feed withliquid water (eq 19) using a heterogeneous (solid) catalystat low temperatures (200-260 °C) in the aqueous phase(10-50 bar). Virent Energy Systems is currently working
to commercialize the APR process. One of the advantagesof APR is that it produces a product H2 gas with low levelsof CO (100-1000 ppm)274 (making it ideal for PEM fuelcells) in a single reactor, whereas conventional steamreforming requires multiple reactors to reduce the CO levels.
The catalytic pathways for H2 and CO2 production by APRinvolves cleavage of C-C, C-H, and O-H bonds to formadsorbed species on the catalyst surface (Figure 29). Ad-sorbed CO species must be removed from the surface bythe water-gas shift reaction to form CO2 and H2 becausehigh surface coverages by CO lead to low catalytic activity.
Undesired byproducts may arise from parallel and seriespathways. Parallel reactions proceed via cleavage of C-Obonds followed by hydrogenation to give alcohols or byrearrangement reactions to form organic acids. Series reac-tions arise from hydrogenation of adsorbed CO and CO2 toform alkanes. Thus, a good catalyst for production of H2 byAPR must facilitate C-C bond cleavage and promoteremoval of adsorbed CO species by the water-gas shiftreaction, but the catalyst must not facilitate C-O bondcleavage and hydrogenation of CO or CO2.
The product selectivity is a function of the feed molecules,the catalyst, and the reaction conditions. Figure 30 showsthe H2 and alkane selectivity (primarily light alkanes,methane, and ethane are produced) as a function of feed
molecule for APR of 1 wt % feeds with a Pt/Al2O3 catalyst.25
As the size of the feed molecule increases, the H2 selectivitydecreases and the alkane selectivity increases. When the feedchanges from sorbitol (hydrogenated glucose) to glucose, theH2 selectivity decreases even more. Hydrogen can be madeselectively by APR from aqueous feedstocks with highglucose concentration (10 wt %) in a two-reactor processwhere the first reactor (at 100 °C) hydrogenates the glucoseto sorbitol, and the second reactor (at 200-265°C) convertsthe sorbitol to CO2 and H2.276 Hydrogen produced from thesecond reactor can be recycled for the hydrogenationreaction.
Reaction kinetic studies were conducted for the APR of ethylene glycol (a probe molecule for sorbitol) at low
temperatures (483 and 498 K) and moderate pressures (22
bar) over silica-supported Ni, Pd, Pt, Ir, Ru and Rh catalysts.The overall catalytic activity for APR of ethylene glycol (asmeasured by the rate of CO2 production per surface site at483 K) decreases in the following order for silica-supportedmetals:272
Silica supported Rh, Ru, and Ni catalysts had lowselectivity for H2 production and high selectivity for alkaneproduction. In addition, Ni/SiO2 showed significant deactiva-tion at 498 K. Thus, silica-supported Pt and Pd catalystsexhibited higher selectivity for production of H2, with lowerrates of alkane production. The activity and selectivity of
monometallic Pt-based catalysts can be improved further bysupporting Pt on TiO2, carbon, or Al2O3.277
A combination of high-throughput and fundamental studieswas undertaken to develop better catalysts for APR. A high-throughput reactor was designed and built that allowed rapidscreening of a large number of catalysts under APR condi-tions. More than 500 different mono- and bimetallic catalyticmaterials were screened using the high-throughput reactor,and inexpensive nonprecious metal catalysts and highlyactive precious metal catalysts were identified.271,278 Theactivity of Pt catalysts can be improved further by addingNi, Co, or Fe to a Pt/Al2O3 catalyst.278 Alumina-supportedPtNi and PtCo catalysts, with Pt/Co or Pt/Ni atomic ratiosranging from 1:1 to 1:9 had the highest turnover frequencies
Figure 29. Reaction pathways and selectivity challenges for H2 production from APR of ethylene glycol. Pathway I is desired C-Ccleavage to form adsorbed CO. Pathway II represents undesired C-O cleavage followed by hydrogenation to produce ethanol, leading toformation of methane and ethane. Pathway III is the desired WGS reaction. Pathway IV represents undesired methanation and Fischer-Tropsch reactions to produce alkanes. (Figure adapted from Huber et al.275)
C6O6H14 + 6H2O f 6CO2 + 13H2 (19)
Figure 30. Selectivities versus oxygenated feedstock for aqueous-phase reforming of 1 wt % oxygenated hydrocarbons over 3 wt %Pt/Al2O3 at 498 K (open symbols) and 538 K (filled symbols).Key: H2 selectivity (circles), alkane selectivity (squares), and EG:ethylene glycol. Figure adapted from Davda et al.160
Pt ∼ Ni > Ru > Rh ∼ Pd > Ir
AJ Chemical Reviews Huber et al.

8/10/2019 Synthesis Transportation Fuels Biomass
http://slidepdf.com/reader/full/synthesis-transportation-fuels-biomass 37/55
for H2 production (TOFH2, defined as moles of H2 per moleof surface site counted by CO chemisorption) with valuesof 2.8-5.2 min-1 for APR of ethylene glycol solutions at483 K, compared to a value of 1.9 min-1 for Pt/Al2O3 undersimilar reaction conditions. A Pt1Fe9 /Al2O3 catalyst showedH2 turnover frequencies of 0.3-4.3 min-1 at 453-483 K,and these values are about 3 times higher than Pt/Al2O3 underidentical reaction conditions.
Ni-based catalysts are active for APR; however, they have
poor selectivity and stability. The H2 selectivity of Ni-basedcatalysts can be improved by adding Sn to the Ni catalyst,and the stability of Ni catalysts can be improved by using abulk Ni-catalyst (e.g., Raney Ni).271,275,279 Therefore, Raney-NiSn catalysts have good activity, selectivity, and stabilityfor H2 production by APR of biomass-derived oxygenatedhydrocarbons. This inexpensive material has catalytic proper-ties (activity, selectivity, and stability) that are comparableto those of Pt/Al2O3 for production of H2 from smalloxygenates, such as ethylene glycol, glycerol, and sorbitol.Rates of H2 production by APR of ethylene glycol overR-NiSn catalysts with NiSn atomic ratios of up to 14:1 arecomparable to 3 wt % Pt/Al2O3, based on reactor volume.
The addition of Sn to Raney Ni catalysts significantly
decreases the rate of methane formation from series reactionsof CO or CO2 with H2, while maintaining high rates of C-Ccleavage necessary for production of H2. However, it isnecessary to operate the reactor near the bubble-pointpressure of the feed and moderate space times to achievehigh H2 selectivities over R-NiSn catalysts, while it isimpossible to achieve these high selectivities under anyconditions over unpromoted R-Ni catalysts. The Sn-promoted Raney-Ni catalyst is catalytically stable for morethan 250 h time on stream.279
According to Davda et al. the advantages of using APRto produce H2 are160
(1) APR eliminates the need to vaporize both water andthe oxygenated hydrocarbon, which reduces the energyrequirements for producing hydrogen.
(2) The oxygenated feedstock compounds of interest arenonflammable and nontoxic, allowing them to be stored andhandled safely.
(3) APR occurs at temperatures and pressures where thewater-gas shift reaction is favorable, making it possible togenerate H2 with low amounts of CO in a single chemicalreactor.
(4) APR is conducted at pressures (typically 15-50 bar)where the H2-rich effluent can be effectively purified usingpressure-swing adsorption or membrane technologies, andthe carbon dioxide can also be effectively separated for eithersequestration or use as a chemical.
(5) APR occurs at low temperatures that minimizeundesirable decomposition reactions typically encounteredwhen carbohydrates are heated to elevated temperatures.
(6) Production of H2 and CO from carbohydrates may beaccomplished in a single-step, low-temperature process, incontrast to the multireactor steam reforming system requiredfor producing H2 from hydrocarbons.
The alkane selectivity can be increased by changing thecatalyst and reaction conditions. Alkanes are produced byaqueous-phase dehydration/hydrogenation (APD/H) of sor-bitol (eq 20) with a catalyst containing metal (e.g., Pt or Pd)and acid (e.g., SiO2-Al2O3) sites to catalyze dehydrationand hydrogenation reactions, respectively.115 Hydrogen isproduced for this reaction by APR (eq 21). These two
reactions can be performed in a single reactor or two separateones. The net reaction is exothermic, in which approximately1.5 mol of sorbitol produce 1 mol of hexane (eq 22). TheAPD/H process occurs in the liquid phase, thereby eliminat-ing the need to vaporize the aqueous feedstock and improvingthe overall thermal efficiency of the process. The alkanesproduced, according to eq 17, retain approximately 95% of the heating value and only 30% of the mass of the biomass-derived reactant. This reaction pathway has one of the highest
theoretical thermal efficiencies of any biomass conversionprocess. However, this process has only been studied at thebenchtop and no detailed process analysis, with PTE, isavailable.
The alkane selectivity depends on the relative rates of C-Cbond cleavage, dehydration, and hydrogenation reactions.
The alkane selectivity can be varied by changing the catalystcomposition, the reaction conditions, and modifying thereactor design.115 In addition, these selectivities can bemodified by co-feeding H2 with the aqueous sorbitol feed,leading to a process in which sorbitol can be converted toalkanes and water without the formation of CO2 (since H2
is supplied externally and need not be produced as anintermediate in the process). As another variation, theproduction of alkanes can be accomplished by replacing thesolid acid with a mineral acid (such as HCl) that is co-fedwith the aqueous sorbitol reactant.
One of the advantages of alkane production from biomassby APD/H is that the majority of the alkanes spontaneouslyseparate from the aqueous feed solution, whereas ethanol
produced during fermentation processes must be removedfrom water by an energy-intensive distillation step. It hasbeen estimated that the overall LCTE for production of alkanes by APP from corn is double the energy efficiencyfor production of ethanol from corn.18,22 Alkanes producedby the APD/H of carbohydrates would provide a renewablesource of transportation fuel that could fit into the currentinfrastructure. Unfortunately, the largest compound producedby APD/H of carbohydrates is hexane, which has a low valueas a fuel additive because of its high volatility.
This limitation has been overcome by combining theAPD/H process with a base-catalyzed aldol condensationstep. This step links carbohydrate-derived moieties throughformation of C-C bonds, to produce larger liquid alkanes
ranging from C7 to C15.18
It should be noted that the C-O-Clinkages (as found in disaccharides) are broken under APD/Hreaction conditions. The aldol condensation process produceslarge organic water-soluble compounds derived from sugars.These molecules are then converted into alkanes in aspecially designed four-phase dehydration/hydrogenationreactor. A conventional APD/H reactor cannot be used toproduce alkanes from large water-soluble organic com-pounds, because extensive amounts of coke form on thecatalyst surface (e.g., 20-50% of the reactant is convertedto coke). Accordingly, to produce liquid alkanes the reactorsystem employed to carry out dehydration/hydrogenationreactions must be modified to a four-phase reactor systemconsisting of (i) an aqueous inlet stream containing the large
C6O6H14 + 6H2 f C6H14 + 6H2O (20)
C6O6H14 + 6H2O f 6CO2 + 13H2 (21)
1913
C6O6H14f C6H14 +3613
CO2 +4213
H2O (22)
Synthesis of Transportation Fuels from Biomass Chemical Reviews AK

8/10/2019 Synthesis Transportation Fuels Biomass
http://slidepdf.com/reader/full/synthesis-transportation-fuels-biomass 38/55
water-soluble organic reactant, (ii) a hexadecane alkane inletstream, (iii) a H2 inlet gas stream, and (iv) a solid catalyst
(Pt/SiO2-Al2O3). As dehydration/hydrogenation takes place,the aqueous organic reactants become more hydrophobic,and the hexadecane alkane stream serves to remove hydro-phobic species from the catalyst before they react further toform coke. In an industrial setting, the alkanes produced fromthe reaction would be recycled to the reactor and used forthe alkane feed. This process can also be modified to producelarge oxygenated compounds that are soluble in diesel fuel.
Figure 31 shows a proposed biorefinery for convertingbiomass into liquid alkanes based on aqueous-phase process-ing. In the first step, cellulose and hemicellulose arerespectively converted to xylose and glucose. Part of thesugar stream is then converted to H2 by APR for useelsewhere in the plant. Furfural and HMF are produced fromthe remaining sugar stream by acid-catalyzed dehydration.Furfural and HMF are then condensed with acetone over asolid base catalysts to produce large water-soluble organiccompounds. In the final reactor, a 4-PD/H, the condensedproducts are dehydrated and hydrogenated to produce largeliquid alkanes (ranging from C7 to C15) over a bifunctionalcatalyst containing metal and acid sites.
Aqueous-phase processing, due to its high thermal ef-ficiency and selectivities, appears to be a promising methodfor converting biomass-derived sugars into alkanes and H2.Other products can also be made by APP including oxygen-ated hydrocarbons, like large alcohols, which could be usedfor oxygenated fuels. Previous APP research has been usedprimarily with clean feeds, and future work should focus onusing real biomass-derived feedstocks. The production of diesel fuel by APP requires that lignocellulose be convertedselectively into HMF and furfural. Furfural can be selectivelyproduced from xylose;280 however, HMF production fromglucose is not currently possible with high yields. Futurecatalysts development work is needed to achieve more activeand selective catalysts.
8.4. Supercritical Reforming of Sugars
Supercritical reforming of sugars can also produce H2 asshown by eq 19.69 Supercritical water conditions occur atconditions above the supercritical point of water (tempera-tures above 375 °C and pressures above 217 atm). Antal
performed thermodynamic calculations for the reforming of glucose at temperatures ranging from 200 to 800 °C and a
pressure of 1 atm as shown in Figure 32.81 The productsfrom the reaction include CO2, CO, H2 and carbon (whichthey claimed represented tar). At temperatures of 300 °C,the equilibrium products are CO2, CH4, and carbon. As thetemperature is increased, the carbon and CH4 equilibriumdecrease, and the CO and H2 equilibrium increase. No carbonis obtained at temperatures above 600 °C. Experiments haveshown that steam reforming of glucose (as well as fastpyrolysis oils and biomass) at atmospheric pressure produceslarge amounts of both thermal and catalytic coke. Highreaction temperatures, above 600 °C, are needed to reformthe coke.
Model showed that supercritical reforming of wood
sawdust was able to produce gaseous products and avoidcoke formation.70,71 Thus, supercritical reactions can be usedto efficiently gasify glucose (and other biomass components)without coke formation. Figure 33 shows the results of supercritical gasification of glucose without a catalyst as afunction of temperature, pressure, and concentration incapillary batch reactors.69 The carbon efficiency is definedas the amount of carbon in the gas-phase divided by thecarbon in the glucose. The product gas yield increased asthe temperature increased. The reaction pressure had littleeffect on the product gas, while the glucose concentrationhad a significant effect. Increasing the glucose concentrationdecreased the yield of gas products.
Heterogeneous catalysts have been used in supercriticalreactions and have been shown to greatly change the productselectivity. The Battelle single-step supercritical gasificationreactor produces gas with high methane levels at tempera-tures around 350 °C and pressures 21 MPa with Ru and Nibimetallic catalysts supported on TiO2, ZrO2 and carbon.69,76
Higher reaction temperatures (600 °C and 34.5 MPa) forsupercritical reactions have been able to produce H2 fromsupercritical reforming of glucose.69 Xu et al. showed thatactivated carbon is an efficient catalyst for supercriticalgasification of glucose.77 At a WHSV of around 20 h-1 closeto 100% of the glucose feed was gasified with a molar gascomposition of 22% H2, 34% CO, 21% CO2, 15% CH4, 6%C2H6, and 2% C3H8.
Figure 31. Self-sustaining biomass-refinery for conversion of biomass into liquid alkanes using aqueous-phase processing.
AL Chemical Reviews Huber et al.

8/10/2019 Synthesis Transportation Fuels Biomass
http://slidepdf.com/reader/full/synthesis-transportation-fuels-biomass 39/55

8/10/2019 Synthesis Transportation Fuels Biomass
http://slidepdf.com/reader/full/synthesis-transportation-fuels-biomass 40/55
must be diluted or long residence times are required. Theorganic acids produced must be sold or converted into otherproducts, and higher yields of H2 from glucose are possiblewith APR or supercritical reforming. The specific biologicalH2 production rate ranges from 8 to 121 mmol of H2 L-1
h-1.127 A biological reactor of approximately 1000-15000L would be necessary to provide enough H2 to power a 5.0kW PEMFC. Other processes can produce H2, such asaqueous-phase reforming (5000-50000 mmol of H2 L-1
h-1 159
), at higher rates. For fermentation technology methodsto become commercially competitive they must developmethods to synthesis H2 at higher rates. Optimization of bioreactor designs, rapid removal and purification of gases,and genetic modification of enzyme pathways offer excitingprospects for improving this technology.
9.0. Conversion of Nonsugar Monomers Derived from Lignocellulose
All components of lignocellulose should be utilized in fuelor chemical production in an integrated biorefinery. Anumber of non-carbohydrates can be selectively producedfrom lignocellulose, including lignin, furfural (from xylose),and levulinic acid (from cellulose). All of these compoundscan be converted into fuels as discussed in this section.
9.1. Lignin Conversion
Lignin, which consists of coniferyl alcohol, sinapylalcohol, and coumaryl alcohol polymers (Section 2.2),represents a major fraction of biomass (10-30 wt %) and iscurrently used as a low-grade fuel to provide heat in the pulpand paper industry. Designs of ethanol production in a
lignocellulosic plant also show lignin being used to provideprocess heat.171 However, it would be ideal to convert thelignin into a higher value fuel or chemical. This would alsorequire the development of alternative ways of providingprocess heat to the biorefinery or developing less energyintensive processes. Lignin can be used as a replacementfor phenol-acetone resins, and other uses are being devel-oped.284 Lignin also can be converted into a transportationfuel by dehydroxygenation or zeolite upgrading. These arethe same methods used to upgraded bio-oils, which containa large fraction of lignin products, discussed in Sections 6.1and 6.2. Previous dehydroxygenation experiments of ligninfeedstocks have used sulfided NiMo and CoMo catalystssupported on alumina, chromium, and zeolites at 250-450°C.
285-288
The major products from dehydroxygenationinclude phenols, cyclohexane, benzene, naphthalene, andphenanthrene with liquid oil yields of 61% the original lignin.It is likely that coking reactions occur under reactionconditions and deactivation due to water similar to what wasobserved by Delmon and co-workers for dehydroxygenationof guaiacol.217-219 The reactions that occur during dehy-droxygenation include hydrogenation of CdC bonds, hy-drogenation of aromatics, and deoxygenation of C-O bonds.Future work in this area should focus on the developmentof nonsulfided catalysts, since sulfur is not present in thefeed in large concentrations.
Thring et al. studied zeolite upgrading of lignin withHZSM-5 catalyst at 500-650 °C and 2.5-7.5 h-1 WHSV.289
Table 24 shows the results of this study. The highest liquidyield was 43%, and the coke and char yields were 15-50%.As the temperature increased gas yields increased, char andcoke yields decreased, and liquid yields decreased. The majorliquid components are toluene, benzene, and xylene.
Joseph Shabtai and the NREL designed a process toconvert lignin into a high-octane-oxygenated gasoline ad-ditive as shown in Figure 34.290,291 The first step in this
process involves base-catalyzed depolymerization with NaOHat 320 °C and 120 atm of a 30% solids feedstock consistingof lignin, water, ash, tar, and some cellulose with methanolor ethanol at alcohol to lignin weight ratios of 3:1 to 5:1.290,292
The alcohol helps maintain supercritical conditions, whichhelp solubilize the lignin. The depolymerization steps breakdown the lignin into monomer units. The products then goto a flash tank where some of the water and the solids areremoved. The insoluble solids are sent to a boiler or sold asboiler fuel. The liquid products are neutralized with sulfuricacid, and the lignin is extracted in a toluene stream.
The lignin, which contains mono-, di-, and polyalkylsubstituted phenols and benzenes with minor amounts of alkyoxyphenols and alkyoxybenzene, is then separated from
C6O6H12 + 2H2O f 2CH3COOH + 4H2 (23)
C6O6H12 f CH3CH2CH2COOH + 2CO2 + 2H2 (24)
Table 24. Zeolite Upgrading of Lignin with ZSM-5 Catalyst a
temperature (°C) 500 550 600 600 600 650WHSV (h-1) 5 5 2.5 5 7.5 5yield of products (%)
gas 11 19 51 54 58 68liquid 39 43 34 30 22 11char + coke 50 38 15 16 20 21
major liquid product (wt %)benzene 8.6 9.4 9.3 13.6 14.5 14.4toluene 33.1 36.7 31.0 42.4 41.9 43.7
xylene 31.5 33.0 25.0 22.7 24.8 21.0ethyl benzene 3.0 2.1 2.2 1.9 1.5 1.3propyl benzene 4.2 2.5 3.7 1.3 1.5 1.0C9+ aromatics 9.0 5.1 6.4 6.0 3.1 3.0
gas composition (wt %)methane 8.7 5.3 13.0 4.4 8.3 13.9ethylene 6.6 19.5 14.7 16.2 19.1 24.3ethane 4.5 2.6 4.5 2.8 2.6 2.9propylene 8.2 21.1 8.9 11.4 14.1 13.4propane 34.6 13.7 4.5 6.6 4.8 2.6C4 18.5 13.2 2.9 4.4 5.0 3.0C5+ 4.8 2.4 1.6 1.0 1.9 3.9CO 3.1 9.4 22.0 23.5 23.9 6.6CO2 10.9 12.4 27.7 29.7 20.1 19.6H2 0.2 0.3 0.1 0.1 0.3 0.1
a Adapted from Thring et al.289
Figure 34. Process for production of gasoline from lignin by base-catalyzed depolymerization of lignin followed by hydrotreatingdeveloped by Shabtai and NREL.290,291
AN Chemical Reviews Huber et al.

8/10/2019 Synthesis Transportation Fuels Biomass
http://slidepdf.com/reader/full/synthesis-transportation-fuels-biomass 41/55
the toluene stream and fed to the hydroprocessing unit.Hydrotreating consists of two reactors for hydrodeoxygen-ation and hydrocracking/ring hydrogenation. The catalystsfor these reactors are sulfided NiMo or CoMo catalysts. Theproducts consists of C7-C11 alkylbenzenes, C5-C11 multi-branched paraffins, and mono-, di-, tri-, and polyalkylated
cyclohexanes and cyclopentanes. The products are 65%aromatics with an octane number of 100-110. The produc-tion cost of the high octane reformulated fuel additive,assuming 100% solubilization of the lignin, and a 70%overall yield, is estimated to be $0.28/L. Alternatively, thedepolymerized lignin could be converted into aryl methylethers (mostly phenyl-, tolyl-, and dimethylphenyl methylethers) by feeding the depolymerized lignin to a reactor fora mild selective C-C hydrocracking treatment, to completelydepolymerize the lignin to monocyclic phenols, and thenetherification of the phenols with methanol.293 Hydrocrackingcatalysts include Pt/SO x /ZrO2 or Pt/WO x /ZrO2. Solid acids,such as SO x /MnO x /Al2O3, SO x /MoO x /Al2O3, and SO x /WO x / Al2O3 are used for the etherification step.
9.2. Levulinic Acid Conversion
Levulinic acid can be converted into fuels by dehydration/ hydrogenation or esterification as shown in Figure 35. Methyltetrahydrofuran (MTHF), which has an octane number of 87 and can be blended with gasoline up to 70%, can beproduced by a dehydration/hydrogenation pathway of le-vulinic acid. MTHF (20 wt % oxygen content) can increasethe oxygen content of gasoline and has been approved bythe USDOE as a component of P Series fuel. Levulinic acidis separated from other reaction products (water, formic acid,and furfural) by vacuum distillation at 160 °C and 10-50mmHg to produce angelica lactone (the dehydration product).
This reaction is reversible, and water addition will promotelevulinic acid formation. Hydrogenation of angelica lactonewith PdRe/carbon catalysts at 200-250 °C and 100 atm H2
produces first γ-valerolactone and then 1,4-pentanediol,which dehydrates to form MTHF in yields up to 90%.294
1-Pentanol and 2-pentanol are also produced in this processin lower yields.
Reaction of angelica lactone with an alcohol in thepresence of an acid or base catalyst yields levulinic esters.20
The base-catalyzed reaction is carried out at 100-150 °C,55 atm N2, and with organic (Et3N), homogeneous (e.g., Na2-CO3, K2CO3) or supported oxide (e.g., MgO/SiO2, LiO/SiO2)basic catalysts. The choice of catalyst depends on the alcoholsused. Levulinic esters have a high octane number and a high
oxygen content (Table 25) making them ideal for gasolinefuels additives. The oxygen content of levulinic esters issignificantly higher than the oxygen content of MTBE, and
therefore oxygenated gasoline requires less levulinic esterthan MTBE. Diesel fuel can be oxygenated by the additionof levulinic esters.295 Levulinic esters also can be producedby reaction of angelica lactone with olefins at 100-150 °C,55 atm N2, and with homogeneous and solid acid catalysts.296
A mixture of levulinic and formic acid can produce levulinicand formic esters by reaction with olefins;297 therefore,levulinic and formic acid do not need to be separated priorto the reaction. Formic esters can be used as fuel additives.Leo Manzer of Dupont has estimated that levulinic esterscould be produced on a large scale at less than $0.50/L.19
9.3. Furfural Conversion
Furfural, 2-furaldehyde, is the triple dehydration productof xylose and is an important chemical obtained from thehemicellulose biomass fraction. Industrially, more than300 000 metric tons/year of furfural are produced.298 Furfuralis currently too expensive for use as a fuel; however, futureproduction of furfural in an integrated biorefinery where allfractions of biomass are used could significantly decreasethe cost. The Quaker Oat Company in 1922 developed thefirst commercial process for production of furfural from oathulls using acid catalyst.299 During the production of furfural,superheated steam passes through a reactor containing thebiomass to provide heat for the reaction and remove thefurfural product. Furfural is reactive under these conditions,so it is vital to remove the furfural before it undergoes
Figure 35. Pathways for production of fuels from levulinic acid.
Table 25. Fuel Characteristics of Levulinic and FormicAcid-Derived Fuels and Comparision to MTBE a
compound
O2
content
(wt %)
requiredwt % for2.7 wt %O2 oxy-genated
gasoline
vaporpressureat 38 °C
(kPa)
blendingoctane no.
(R + M)/2MTBE 11 14.9 55 109methyl formate 3.8 5.1 126 102ethyl formate 4.6 6.3 55 103methyl levulinate 37 7.3 106.5ethyl levulinate 33 8.1 107.5isopropyl levulinate 30 8.9 105isobutyl levulinate 28 9.7 102.5sec-butyl levulinate 28 9.7 102.5
a Adapted from Fagan et al.297
Synthesis of Transportation Fuels from Biomass Chemical Reviews AO

8/10/2019 Synthesis Transportation Fuels Biomass
http://slidepdf.com/reader/full/synthesis-transportation-fuels-biomass 42/55
undesired reactions. Typical reaction conditions for furfuralproduction are 3 wt % sulfuric acid, 2:1 to 3:1 acid solutionto lignocellulosic mass ratios, 170-185 °C, and 3 h retentiontime.298 Sulfuric acid is not necessary if the temperature israised high enough. This is because acetic acid in thehemicellulose reaction is released and can catalyze thedehydration reaction.299 Typical furfural yields are around45-50%.298 Higher yields of up to 60% can be obtained byacid-catalyzed dehydration of pure xylose.300 According to
Zeitsch, the principle yield loss of furfural is due to reactionsbetween furfural and xylose, and by eliminating this problemby proper reactor design, significantly better yields can beobtained.280,301 Another new method, tested at the pilot-plantscale, appears to be promising for producing furfural at yieldsas high as 70%. This method involves using a continuoustubular reactor at high temperature (250 °C), short residencetime (5-60 s), acid concentrations from 0.3 to 2.0 wt %,and steam injection to rapidly remove the furfural.298 Currentfurfural reactors are expensive to operate due to the largequantities of steam (30 to 50 times the amount of furfuralproduced) and lengthy reaction times.280,301 Typical yieldsof furfural, based on current commercial technology, on aweight basis for feedstocks (kg of furfural/kg of feedstock)
are 0.22 for corncobs, 0.12 for bagasse, 0.17 for cornstalks,0.16 for sunflower hulls, and 0.16 for hardwoods.298
The mechanism for formation of furfural from xyloseappears to go through a 2,5-anhydride intermediate.300
Furfural can also be produced from xylose using heteroge-neous catalysts including MCM functionalized sulfonic acidcatalysts,302 heteropolyacids,303 faujasite, and mordenite.304
High yields of furfural, up to 75%, are obtained withheterogeneous catalysts in DMSO and toluene/water sol-vents;302 however, the yield is significantly lower (less than30%) when water is used as a solvent.
Furfural by itself can not be used as a motor fuel becauseof its tendency to polymerize.305 However, as shown inFigure 36, furfural can be hydrogenated to furfuryl alcohol,
methyl furan, tetrohydrofurfural alcohol, and methyltetrahy-drofuran (MTHF), which according to Bayan have octanenumber of 83, 74, 83, and 74, respectively.305 The octanenumber of furfural is 53. Of the hydrogenated forms of furfural, only MTHF is suitable as a motor fuel because itwill not polymerize and has a low volatility.305 As mentionedpreviously, MTHF, which also can be derived from hydro-genation of levulinic acid, is approved by the USDOE foruse as a gasoline additive in P Series type fuels. Ahmeddeveloped a two-step process to produce MTHF from
furfural.306 The first step involved hydrogenation of furfuralto 2-methylfuran over a Cu-based catalyst at 175 °C,followed by hydrocarbon of 2-methylfuran to MTHF with aNi-based catalyst at 100 °C. Furfural can also be used toproduce liquid alkanes (n-C8 to C13) by aqueous-phaseprocessing as discussed in Section 8.3.
10.0. Triglyceride Conversion
Triglycerides are the major component of vegetable oilsand animals fats (Section 2.3). They also can be producedfrom aquatic biomass such as algae (Section 2.4). Vegetableoils can be used directly in diesel engines; however, thereare a number of disadvantages of pure vegetable oils,including high viscosity, low volatility, and engine problems(including coking on the injectors, carbon deposits, oil ringsticking, and thickening of lubricating oils).34,307 Theseproblems require that vegetable oils be upgraded if they areto be used as a fuel. The most common way of upgradingvegetable oils to a fuel is transesterification of triglyceridesinto alkyl-fatty esters (bio-diesel). Waste vegetable oils, likefrying oils, can be used as feedstocks; however, changes inthe process need to be made as waste vegetable oils contain
free fatty acid (FFA) and water impurities. Vegetable oilscan also be blended with diesel fuel or upgraded by othermethods including zeolite upgrading and pyrolysis.
10.1. Transesterification
Transesterification is the reaction of triglycerides (or otheresters) with alcohols to produce alkyl esters (biodiesel) andglycerol, typically in the presence of acid or base catalystsas shown in Figure 37. Methanol, due to its low cost, is thealcohol most commonly used, although other alcoholsincluding ethanol or 2-propanol can produce biodiesel withbetter fuel characteristics. Ethanol is used to producebiodiesel in Brazil because of inexpensive ethanol sources.
Alkyl esters or biodiesel are also called fatty acid methylesters (FAME). Alkyl esters can be used directly in dieselengines with minor engine modifications, and they are soldin the U.S. as a fuel called B100. Alkyl esters can be blendedwith traditional diesel fuel in up to 20 vol %, with no enginemodification. Blends of alkyl esters and diesel fuel are soldas a fuel termed B1-20 ranging from 1 to 20 vol %biodiesel. Biodiesel is soluble with petroleum diesel at alllevels. Reviews of alkyl ester production are publishedelsewhere.34,307,308
Transesterification consists of a number of consecutive,reversible reactions, with diglycerides and monoglyceridesas intermediates (Figure 37).309 The first step in transesteri-fication is production of diglycerides and alkyl esters,
followed by monoglycerides and alkyl esters, and finallyalkyl esters and glycerol. All of these reactions are reversible,and excess alcohol solvent is used (typically 50-200%excess alcohol) to drive the reaction to completion with yieldsof alkyl esters as high as 99.7%. The alkyl esters also separatefrom the alcohol-catalyst phase during the reaction, furtherdecreasing the reverse reaction rate.
The first step in the reaction mechanism for base-catalyzedtransesterification involves reaction of the base with methanolto produce an alkoxide species, as shown in Figure 38.310
The alkoxide then reacts with the triglyceride to form atetrahedral intermediate. This intermediate then decomposesto form an alkyl ester and the corresponding anion of thediglyceride. This step is followed by the deprotonation of
Figure 36. Pathways for hydrogenation of furfural.
AP Chemical Reviews Huber et al.

8/10/2019 Synthesis Transportation Fuels Biomass
http://slidepdf.com/reader/full/synthesis-transportation-fuels-biomass 43/55
methanol by the diglyceride anion regenerating the alkoxidespecies. Diglycerides and monoglycerides are converted bythis same mechanism into alkyl esters and glycerol.
Freedman and co-workers observed second-order reactionkinetics for all three reversible reactions (triglycerides to
diglycerides, diglycerides to monoglycerides, and monogly-cerides to esters) in the transesterification of soybean oil withbutanol and methanol.309 Triglyerides only have a limitedsolubility in methanol, so it is difficult to measure the reactionrate. Mechanically mixing of the two phases is important
Figure 37. Overall and intermediate reactions for transesterification of triglyceride and alcohol to produce alkylesters (biodiesel) andglycerol.
Figure 38. Mechanism for base-catalyzed transesterification of triglycerides adapted from Schuchardt et al.310
Synthesis of Transportation Fuels from Biomass Chemical Reviews AQ

8/10/2019 Synthesis Transportation Fuels Biomass
http://slidepdf.com/reader/full/synthesis-transportation-fuels-biomass 44/55
for improving the mass transfer between the two phases.311
The addition of solvents that increase the solubility of methanol and triglycerides, such as tetrahydrofuran (THF),can significantly increase the reaction rate.312 Water has anegative effect on the reaction because alkyl esters, trigly-cerides, diglycerides, and monoglycerides can react withwater to form free fatty acids (FFA) (eq 25). FFAs reactwith base catalyst to form soap, which causes downstreamproblems such as plugging, gel formation, an increase in
viscosity, and problems with production separation.
Both acid and base catalysts can be used for transesteri-fication; however, base catalysts are 4000 times more activeand cause fewer corrosion problems than do acid catalysts.Most biodiesel processes use mineral acid catalysts foresterification of FFA and alkali base catalysts for transes-terification including sodium hydroxide, potassium hydrox-ide, and sodium methoxide. Sodium methoxide is the mostwidely used biodiesel catalyst with over 60% of industrial
plants using this catalyst.308
The most active and expensivecatalyst is also sodium methoxide.Research is ongoing to develop heterogeneous and enzy-
matic catalysts for esterification and transesterificationbecause removal of homogeneous catalysts requires furtherdownstream processing, increasing bio-diesel production cost.Heterogeneous catalysts have the advantage that they canbe easily removed from the product and recycled, and currentresearch indicates a number of promising heterogeneouscatalysts for biodiesel production.313-317 Problems withcurrent heterogeneous catalysts are that they are not as activeas homogeneous catalysts, and they require higher reactiontemperatures (200-250 °C) and pressures.308
The patent and academic literature lists a number of solid
acid and base heterogeneous catalysts that have been usedfor transesterification.308 It should be taken into account thatthe presence of FFA in the feed will strongly poison solidcatalysts. Thus, special care should be taken to remove FFAbefore they encounter the fixed-bed reactor containing thesolid/base catalyst. Alternatively, researchers have focusedon the development of solid acid catalysts for the transes-terification reaction and/or to eliminate FFAs. The InstitutFrancais de Petrole developed a heterogeneous catalyst,which was a mixture of ZnO, Al2O3, and ZnAl2O4, fortransesterification of vegetable oils with methanol at 230 °Cand 50 atm.318 Lopez et al. studied the transesterification of triacetin with methanol on a range of solid acid and basecatalysts including ETS-10 (Na, K), SO x /ZrO2, WO x /ZrO2,
MgO, Nafion, -zeolite, and phosphoric acid/silicia.313
Themost promising catalysts were Amberlyst, Nafion, SO x /ZrO2,WO x /ZrO2, and ETS-10(Na, K). However, leaching of Naoccurred with ETS-10 catalyst, whereas the deactivation ratefor WO x /ZrO2, Nafion, and amberlyst was small. WO x /ZrO2
and SO x /ZrO2 had activities on a per-site basis similar toH2SO4. However, these catalysts are less active on a massbasis than sulfuric acid because they do not have the samenumber of sites. Toda et al. developed sulfonated catalystsupported on carbonized saccharides.314 They claim that theactivity of this catalyst is more than half that of liquid sulfuricacid and higher than conventional solid acid catalysts.
Cantrell et al. studied the initial activity of mixed Mg-Al-oxide catalysts, derived from hydrotalcite, for transes-
terification reaction of methanol with glyceryl tributyrate atroom temperature and found the catalyst with the highestactivity had a 24 wt % Mg loading.316 Suppes et al. studiedthe transesterification of soybean oil with methanol at 60-120 °C with NaX faujasite zeolite, ETS-10, and metalcatalysts, with ETS catalysts being the most active.317 Kimet al. developed a Na/NaOH/Al2O3 that had activity similarto NaOH catalysts for transesterification of vegetable oils;however, they did not recycle the catalyst, indicating
concerns about catalyst stability.315
Development of futurehighly active, selective, and stable heterogeneous catalystsfor transesterification reaction promises to decrease thebiodiesel production cost and will be an increasing importantresearch area in the future.
Solid base catalysts are used for very similar reactions suchas the glycerolysis reaction of vegetable oils and glycerol toproduce monoglycerides at 240 °C.319 Corma and co-workersstudied this reaction and showed the order of catalytic activitydecreased as MgO > Mg-Al-oxide > Sepiolite-CS > MCM-41-Cs. These authors demonstrated that these catalysts couldbe recycled without a significant loss in activity. SolidBronsted base catalysts have significantly higher activity thanLewis base catalysts for transesterification of oleic acid
methyl esters with glycerol.320
Efforts have been made tosynthesize layered mixed solids (Mg/Al hydrotalcites) withcontrolled crystallite size and large accessible surface areas.321
This has been shown to increase catalyst activity fortransesterification reactions.
Lipase, enzymatic catalysts, can also catalyze esterificationreactions. The advantages of lipase catalysts are their abilityto catalyze both transesterification and esterification of FFAin one step, production of glycerol side stream with minimalwater content and little or no inorganic material, andrecyclability.35 However, enzymatic catalysts have high costsand deactivate due to feed impurities.
At high pressure (120 atm) and temperature (350 °C)triglyceride transesterification occurs without any catalyst.322
Some production plants in Europe use this technology;however, this requires high pressure leading to an increasedcapital cost.35 Advantages of this method are that theesterification reaction can occur rapidly (less than 5 min),323
and no catalyst is required decreasing downstream processingcosts.
A block flow diagram for production of biodiesel fromvegetable oils is shown in Figure 39.312 The first step in theprocess is transesterification of the refined vegetable oils
Figure 39. Block flow diagram for biodiesel production bytransesterification of vegetable oils adapted from Van Gerpen andKnothe.312
R - COOCH3 + H2O f
R - COOH(FFA) + CH3OH (25)
AR Chemical Reviews Huber et al.

8/10/2019 Synthesis Transportation Fuels Biomass
http://slidepdf.com/reader/full/synthesis-transportation-fuels-biomass 45/55
(refined by crushing of vegetable seeds) with methanol anda base catalyst in a CSTR or plug flow reactor at 60 °C,approximately 1 atm, 6:1 methanol/oil molar ratio and 1 hresidence time. Sometimes the transesterification process iscarried out in two different CSTRs where approximately 80%of the catalyst and methanol is added to the first reactor. Inthe second reactor, the remaining alcohol and catalyst isadded. The two-step process has the advantage of using lessmethanol than a single step process.
The products from the reactor are in two phases: aglycerol-rich phase and a methyl ester-rich phase. A settlingtank and centrifuge separates the two phases. The glycerolstream contains approximately 50 wt % glycerol, most of the base catalyst, and most of the soap. This fraction is thenneutralized with acid, and the soap forms FFAs, which phaseseparate from the glycerol stream. The FFAs can be recycledand used for biodiesel production. A vacuum flash processseparates the methanol and glycerol phases, with a 85 wt %glycerol product, which is then sold.
The methyl ester-rich stream, which also contains 2-3wt % methanol, a small amount of base, and small amountsof di- and monoglycerides, is neutralized prior to methanolremoval. The acid removes any remaining catalyst or soap.
The methanol in the methyl ester stream is then stripped byvacuum flash or a falling film evaporator. Water washingof the methyl ester stream removes salts and FFA. Anyremaining water in the biodiesel is removed during a finaldrying step in a vacuum flash process. Water is also removedfrom the methanol stream, and the remaining methanol canbe recycled to the process.
Waste triglycerides oils, such as cooking oils (2-7 wt %FFA) and animal fats (5-30 wt %), contain significantamounts of FFA.312 If base catalysts are used for thetransesterification process, then the FFA will react with thebase catalyst forming soap according to eq 26. Soap causesdownstream processing problems including gel formation,viscosity increases, and product separation difficulty.34
Freedman et al. have recommended that the concentrationof FFA in the oil should be less than 0.5 wt %; otherwise,the FFA will react with base catalysts to form soap andwater.324 Free fatty acids can be removed from vegetableoils by an acid-catalyzed esterification treatment where theFFA react with methanol to form methyl esters and water.Two phases are present in this reaction: a methanol phasethat contains water, acid and some oil and a triglyceride phasethat contains triglycerides, methyl esters, and unreacted FFA.Solid acid heterogeneous catalysts also catalyze the reactionof FFA with methanol.325
Bray analyzed the economics of biodiesel production usingtwo different processes: the CD process which consists of transesterification in three packed column reactors in seriesand an alkaline catalyzed process from Lurgi PSI where thetransesterification reaction occurs in two agitated reactorsin series.308 The Biodiesel production costs are made up of three major components: feedstock costs, capital costs, andbyproduct credits. As shown in Table 26, the biodieselfeedstock (soybean oil, methanol, and catalyst) is the singlelargest cost for biodiesel production representing over 70%of the biodiesel cost in this analysis. The refined productioncost of biodiesel ($0.49-0.50/L) is close to the feedstockcosts ($0.46-0.47/L) because glycerol currently has a highvalue ($1.10-2.20/kg for refined glycerol), which Bray
assumed was $1.21/kg. It has been projected that increased
biodiesel production will significantly decrease glycerolprices. Bray estimates that the refined glycerol price coulddrop to $0.77/kg, which would decrease the credit given forglycerol production to $0.07/L. Haas et al., who also modeledthe biodiesel production cost, had similar economic resultsas those of Bray.326 Haas et al. estimated the biodieselproduction cost to be $0.53/L when the feedstock soybeancost was $0.52/kg, and with a glycerol credit of $0.33/kgfor an 80 wt % glycerol-water solution.
The FOB cost of diesel fuel from crude oil is 44¢/L whenoil prices are $55/bbl.9 Thus, biodiesel is currently slightlymore expensive than petroleum diesel. However, biodieselcan be cost competitive with petroleum-derived diesel fuel,in many countries, if it is exempt from taxes. In the EU, the
tax on diesel ranges from $0.34-0.99/L, which is higherthan the tax in the U.S. of $0.13/L.Since feedstock is the primary cost of biodiesel, decreasing
the feedstock cost will significantly decrease the biodieselcost. Figure 40 shows the cost of biodiesel from cheaper
feedstocks. The feedstock costs decrease from canola oil >soy > tallow and lard > yellow grease > trap greases.Yellow grease is produced from used cooking oil and otherfats collected from restaurants, cafeterias, and other com-mercial cooking industries. Yellow greases today is used as
R - COOH + NaOH f R - COONa + H2O (26)
Table 26. Biodiesel Production Cost for a Plant with Capacity of 99790 Metric Tons Per Year and Soybean Oil Cost of 49¢/kg a
production cost (¢/L)CD
processalkalineprocess
raw materials 46.34 47.71by products -10.21 -10.41utilities 0.78 0.63
total variable costs 36.90 37.94labor (operating, maintenance & control) 2.21 2.06maintenance materials 0.70 0.49
operating supplies 0.13 0.13total direct costs 39.95 40.60plant overhead 1.77 1.65taxes and insurance 0.97 0.72
total plant cash costs 42.68 42.98depreciation, 12-year life, 8.33%/year 4.06 3.04
plant gate costs 46.74 46.02G&A, sales, research, 5% PV 3.11 2.91
net production cost (per L) 49.85 48.92ROI before taxes 25%/year TFC 12.15 9.06
product value (PV) 62.08 57.99
a Adapted from Bray.308 The current diesel fuel FOB spot price atNew York Harbor is 44¢/L, and oil prices are $57/bbl.14
Figure 40. Biodiesel production cost as a function of feedstockcost (1 gal ) 3.79 L, 1 lb ) 0.454 kg) from Schumacher et al.327
(Reprinted from ref 327 with permission. Copyright 2004 Elsevier.)
Synthesis of Transportation Fuels from Biomass Chemical Reviews AS

8/10/2019 Synthesis Transportation Fuels Biomass
http://slidepdf.com/reader/full/synthesis-transportation-fuels-biomass 46/55
an ingredient in animal feeds; however, concerns about MadCow disease caused a ban on it for use as an animal feed. 308
Processing of yellow grease is more expensive than vegetableoils because yellow grease has higher FFA levels. Trapgrease or brown grease is collected from grease traps insewage plants. Trap grease contains high levels of water,FFA, and other impurities.
A life cycle wells to wheel analysis for biodiesel andpetroleum diesel has been done by Sheehan et al., and the
results, in terms of fossil energy ratio (FER), PTE, and LCTEare shown in Table 27.328 Biodiesel and petroleum diesel
require similar amounts of fossil fuel for production, refining,and transport when the energy content of the final dieselfuel product is subtracted from the crude production input.Vegetable oil production and refining are the two majorenergy consumption steps for biodiesel production consum-ing 48 and 49% of the fossil fuel, respectively. The majorenergy consumption step for petroleum diesel is refining(60% of total energy) followed by production (29% of totalenergy). The ethanol refining step (68%) is the major energyconsumption step for ethanol production. From this life cycle
analysis, it can be seen that future work on biodieselproduction should focus first on developing high-yield cropsthat have small amounts of energy inputs and improving therefining process efficiencies.
Biodiesel standards have been developed for a number of countries and are reported elsewhere.33 Table 28 lists fuelproperties of various biodiesel fuels. All of these esters havehigh cetane numbers and flash points. Kinematic viscositiesare also in an acceptable range for diesel fuels. The cetanenumbers of methyl and ethyl esters can be correlated withthe chain length and degree of saturation.329 Problems with
biodiesel include high price, increased NO x exhaust emis-sions, oxidative stability when exposed to air, and cold flowproperties. The cold flow properties of a fuel are defined byits cloud point, pour point, and cold filter plugging point.
Biodiesel is an oxygenated fuel and when blended withpetroleum-based diesel it reduces CO, particulate, and totalhydrocarbon emissions. According to Knothe, biodiesel fuelshave the following advantages when compared to petro-chemical fuels:307
(1) Derivation from renewable domestic resources(2) Biodegradability(3) Reduction of most exhaust emissions (with the excep-
tion of nitrogen oxides)(4) Higher flash point, leading to safer handling and
storage(5) Excellent lubricity, which is particularly important for
low-sulfur petrodiesel fuels, which have greatly reducedlubricity. Adding bio-diesel at low levels (1-2%) restoreslubricity.
The EU produces 90% of the biodiesel in the world witha production capacity of 2.4 million metric tons of biodieselper year.330 The EU has set a target of 5.75% renewabletransportation fuels by 2010, and if this target is to be
achieved with biodiesel fuels then the estimated productionin Europe is 7.9 billion gallons/year.308 Brazil and the U.S.are the world’s major oilseed producing countries. The EUhas chosen to focus on biodiesel production because of thesuperior fuel economy of diesel engines, the agriculturalpractices in Europe, and the fact that most cars run on dieselfuel in the EU.308
10.2 Pyrolysis and Zeolite Upgrading
Pyrolysis of vegetable oil can be used to produce a liquidfuel that contains linear and cyclic paraffins, olefins, alde-hydes, ketones, and carboxylic acids. Pyrolysis products of vegetable oils were used as a fuel during the first and second
World Wars.331
A possible mechanism for thermal decom-position of soybean oil is shown in Figure 41. 332 The exactthermal decomposition mechanism is very complex, generat-ing a wide range of structures. Usually these mechanismproceed through either a free-radical or carbonium ionmechanism. Homologous alkanes and alkenes series occursfrom the generation of RCOO radicals from triglyceridecleavage and subsequent loss of CO2.332 The R radical, upondisproportionation and ethylene elimination, gives the odd-numbered carbon alkanes and alkenes. Unsaturation increasescleavage at the R and positions relative to the unsaturation.
Table 27. Fossil Energy Ratio and Thermal Effiencies forProduction of Diesel Fuel and Biodiesel from Oil and Soy,Respectively a
petroleumdiesel
biodieselfrom soybean
fossil energy ratio (MJfossil fuel /MJproduct)crude production 1.113 0.149crude transport 0.016 0.034refining 0.064 0.151refined transport 0.006 0.004overall energy requirements 1.199 0.311
process thermal efficiency 0.94 0.93life cycle thermal efficiency 0.83 0.80
a Data from Sheehan et al.328 Energy of lignocellulose is not takeninto account for calculating thermal efficiencies of biodiesel.
Table 28. Fuel Properties of Esters of Oils and Fats a
oil or fat ester
cetane
number
∆ H comb
(kJ/kg)
kin visc
(40 °
C; mm2
/s)
cloud pt
(°
C)
pour pt
(°
C)
flash pt
(°
C)coconut ethyl 67.4 38158 3.08 5 -3 190corn methyl 65 38480 4.52 -3.4 -3 111cottonseed methyl 51.2 6.8 (21 °C) -4 110olive methyl 61 37287 4.70 -2 -3 >110palm ethyl 56.2 39070 4.50 (37.8 °C) 8 6rapeseed methyl 48-56 8850-39780 4.53-4.96 -6 to -3 -9 166-169rapeseed ethyl 67.5 40663 6.02 1 -12 170soybean methyl 49.6-51.5 37388-40080 3.99-4.30 -2 to 3 -7 to 0 120sunflower methyl 54-58 38100-38472 4.39 0-1.5 -3 to 3 110tallow methyl 61.8 37531-39961 4.11-4.99 12-15.6 9-12.8 96-188yellow grease methyl 62.6 37144-39817 5.16used frying oil methyl 59 37337 4.50 1 -3 >110waste olive oil methyl 58.7 5.29 -2 -6
a Adapted from Knothe et al.307
AT Chemical Reviews Huber et al.
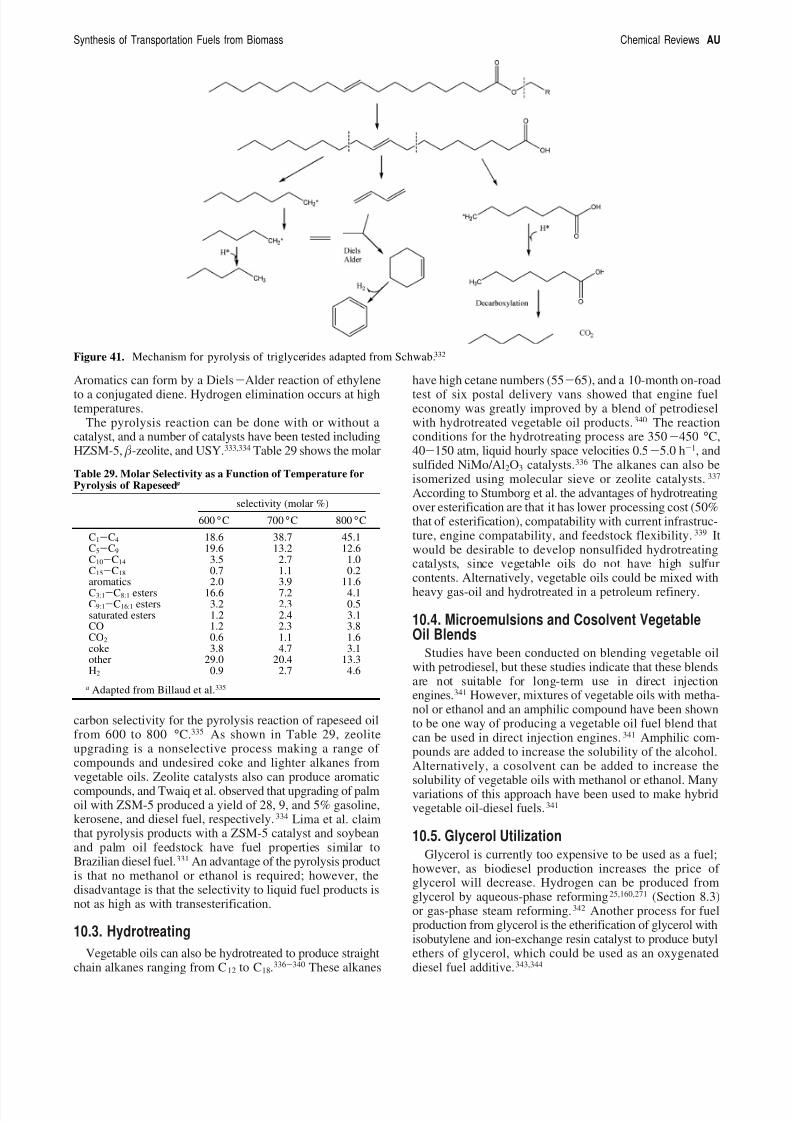
8/10/2019 Synthesis Transportation Fuels Biomass
http://slidepdf.com/reader/full/synthesis-transportation-fuels-biomass 47/55
Aromatics can form by a Diels-Alder reaction of ethylene
to a conjugated diene. Hydrogen elimination occurs at hightemperatures.
The pyrolysis reaction can be done with or without acatalyst, and a number of catalysts have been tested includingHZSM-5, -zeolite, and USY.333,334 Table 29 shows the molar
carbon selectivity for the pyrolysis reaction of rapeseed oilfrom 600 to 800 °C.335 As shown in Table 29, zeoliteupgrading is a nonselective process making a range of compounds and undesired coke and lighter alkanes fromvegetable oils. Zeolite catalysts also can produce aromaticcompounds, and Twaiq et al. observed that upgrading of palmoil with ZSM-5 produced a yield of 28, 9, and 5% gasoline,kerosene, and diesel fuel, respectively.334 Lima et al. claimthat pyrolysis products with a ZSM-5 catalyst and soybeanand palm oil feedstock have fuel properties similar toBrazilian diesel fuel.331 An advantage of the pyrolysis productis that no methanol or ethanol is required; however, thedisadvantage is that the selectivity to liquid fuel products isnot as high as with transesterification.
10.3. Hydrotreating
Vegetable oils can also be hydrotreated to produce straightchain alkanes ranging from C12 to C18.336-340 These alkanes
have high cetane numbers (55-65), and a 10-month on-road
test of six postal delivery vans showed that engine fueleconomy was greatly improved by a blend of petrodieselwith hydrotreated vegetable oil products.340 The reactionconditions for the hydrotreating process are 350-450 °C,40-150 atm, liquid hourly space velocities 0.5-5.0 h-1, andsulfided NiMo/Al2O3 catalysts.336 The alkanes can also beisomerized using molecular sieve or zeolite catalysts.337
According to Stumborg et al. the advantages of hydrotreatingover esterification are that it has lower processing cost (50%that of esterification), compatability with current infrastruc-ture, engine compatability, and feedstock flexibility.339 Itwould be desirable to develop nonsulfided hydrotreatingcatalysts, since vegetable oils do not have high sulfurcontents. Alternatively, vegetable oils could be mixed with
heavy gas-oil and hydrotreated in a petroleum refinery.
10.4. Microemulsions and Cosolvent VegetableOil Blends
Studies have been conducted on blending vegetable oilwith petrodiesel, but these studies indicate that these blendsare not suitable for long-term use in direct injectionengines.341 However, mixtures of vegetable oils with metha-nol or ethanol and an amphilic compound have been shownto be one way of producing a vegetable oil fuel blend thatcan be used in direct injection engines.341 Amphilic com-pounds are added to increase the solubility of the alcohol.Alternatively, a cosolvent can be added to increase the
solubility of vegetable oils with methanol or ethanol. Manyvariations of this approach have been used to make hybridvegetable oil-diesel fuels.341
10.5. Glycerol UtilizationGlycerol is currently too expensive to be used as a fuel;
however, as biodiesel production increases the price of glycerol will decrease. Hydrogen can be produced fromglycerol by aqueous-phase reforming25,160,271 (Section 8.3)or gas-phase steam reforming.342 Another process for fuelproduction from glycerol is the etherification of glycerol withisobutylene and ion-exchange resin catalyst to produce butylethers of glycerol, which could be used as an oxygenateddiesel fuel additive.343,344
Figure 41. Mechanism for pyrolysis of triglycerides adapted from Schwab.332
Table 29. Molar Selectivity as a Function of Temperature forPyrolysis of Rapeseed a
selectivity (molar %)
600 °C 700 °C 800 °C
C1-C4 18.6 38.7 45.1C5-C9 19.6 13.2 12.6C10-C14 3.5 2.7 1.0C15-C18 0.7 1.1 0.2aromatics 2.0 3.9 11.6C3:1-C8:1 esters 16.6 7.2 4.1C9:1-C16:1 esters 3.2 2.3 0.5saturated esters 1.2 2.4 3.1CO 1.2 2.3 3.8CO2 0.6 1.1 1.6coke 3.8 4.7 3.1other 29.0 20.4 13.3H2 0.9 2.7 4.6
a Adapted from Billaud et al.335
Synthesis of Transportation Fuels from Biomass Chemical Reviews AU
8/10/2019 Synthesis Transportation Fuels Biomass
http://slidepdf.com/reader/full/synthesis-transportation-fuels-biomass 48/55
11.0. Ethical Considerations and Conclusions
11.1. Ethical Considerations
Biofuels should and can be produced sustainably with foodand animal feed as coproducts.8 Ethical and moral questionsarise when edible biomass products are converted intobiofuels. Regions where malnutrition exists due to low levelsof food production should first focus on producing ediblebiomass for food use before they produce biofuels fromedible biomass. Shell Oil has a policy to only producebiofuels from nonedible fractions of biomass. However, asdiscussed in this review the largest fraction of biomass isnonedible lignocellulose such as straw, grasses, corn stover,wood, forest products, etc. Edible biomass is coproduced inplant material with lignocellulose biomass. Currently, theeconomics are more favorable for conversion of ediblebiomass into fuels due to their chemical structure, which canbe more efficiently converted. Therefore, it is vital tocontinue to develop processes for conversion of lignocellu-losic biomass into fuels. Agricultural practices in industrial-ized countries are very advanced, and most industrializedregions produce more than enough food for domestic foodconsumption. Farmers do not pick the crops based on howefficiently they produce edible food products. Instead farm-ers’ goals are to grow crops that maximize their income,even though more efficient crops can be grown. Biofuelsalso can provide farmers in developing countries anothermarket for their products, which could improve the econo-mies of developing countries.
The EU has established as the main area of researchsecond-generation biofuels from various biomass resourcesand wastes. As has been shown in this review, it is technicallypossible to convert cellulose materials and organic wastesinto biofuels. However, costs have to be lowered andtechnology has to be demonstrated at a commercial scale(greater than 150 000 metric ton/year). If this is achieved,second-generation biofuels will secure a higher market shareby allowing the use of a wider range of raw materials.Moreover, the cultivation process could be environmentallyless intensive than for ordinary agricultural crops, with thecorresponding cost decrease and lower greenhouse emissionfrom cultivation. On these bases, the EU will support researchon
(a) Biomass to energy conversion processes(b) The “bio-refinery” concept to find valuable uses for
all parts of the plant(c) Second-generation biofuels for improving efficiency
and cost-effectiveness.We recommend that sustainable policies be developed
where food and animal feed is produced along with biofuels
from our agricultural lands. Biofuels are only part of theanswer to our dependence on fossil fuels. Other energysources, such as wind, solar, hydroelectric, and nuclearpower, should be used to produce electricity for stationarypower production, and it is vital that we invest in otherrenewable sources along with biomass. More efficient energyconversion technologies for transportation vehicles, such ashybrid electric cars and fuels cells, should also continue tobe developed. Finally, we need to strive to develop lifestylesthat conserve energy.
11.2. Overall Conclusions
Regional issues greatly affect biomass cost, but biomasscosts from cheapest to most expensive are typically ligno-
cellulose < starches < vegetable oils < terpenes < algaes.Lignocellulose is the cheapest and most abundant form of biomass, and on an energy basis is significantly cheaper thancrude oil. On agricultural land, the growth rate of lignocel-lulose on a per energy basis is 30-240 boe/ha-year. Thelimiting factor is that low-cost processing technologies thatefficiently convert a large fraction of the lignocellulosicbiomass energy into liquid fuels, do not yet exist.13 Vegetableoils, starches, and sugarcane currently have a lower cost of
conversion into liquid fuels than lignocellulose feedstocksif feedstock costs are not considered. Terpenes and algaesare currently too expensive to be used as liquid fuelfeedstocks. Future work with lignocellulose feedstocksshould focus on methods to convert lignocellulose into liquidfuels, whereas research on more expensive feedstocks, whichare easier to break down into liquid fuels, such as vegetableoils and terpenes, should focus on development of bettercrops through plant breeding and genetic engineering. Algaehave a tremendous potential as a feedstock because they havevery high growth rates and can be grown on nonagriculturalland. However, algae are currently too expensive to be grownon energy farms, and future work should focus on thedevelopment of cheaper algae crops.
Figure 42 shows the different routes for production of liquid fuels from biomass discussed in this review. Table30 summarizes the development stage, products, and chal-lenges of each of these technologies. Some of the technolo-gies are currently used commercially, some have been testedat the pilot scale, and others have been tested only at thelaboratory scale. Lignocellulose materials consist of sugarpolymers (cellulose and hemicellulose) and lignin, andlignocellulose into liquid fuels involves removal of oxygenas either CO2 or H2O. In this process, functionality isremoved from a nonthermally stable molecule. This is theopposite of petroleum-type reactions that involve addingfunctionality to a highly thermally stable molecule with lowfunctionality. The three basic technologies for lignocellulosicconversion into liquid fuels, (Figure 42) include gasificationof lignocellulose to syn-gas followed by syn-gas conversion,production of bio-oils by pyrolysis or liquefaction followedby upgrading of bio-oils, and acid hydrolysis of biomass tomonomer units, which can then be converted into fuels.
Gasification of biomass to syn-gas and its subsequentconversion into liquid fuels is a well established butexpensive pathway that could rapidly become commerciallypracticed. The most established processes for biomass-derived syn-gas are production of H2 (by the WGS reaction),methanol (by methanol synthesis), and liquid alkanes (byFTS). Methanol can be converted into gasoline, olefins, orH2. During biomass gasification 23% of the energy of the
biomass feedstock is lost.180
Further conversion of the syn-gas to liquid fuels (FTS alkanes, methanol, or ethanol) ispredicted to have an overall PTE between 0.2 and 0.4 (Table9); thus, a large fraction of the biomass energy is lost insyn-gas conversion.114 It is likely that further advances insyn-gas conversion will only show modest improvements inincreasing the PTE, since these processes have been studiedfor several decades. Production of liquid fuels from biomassby the gasification route is not currently economical com-petitive with production of liquid fuels from petroleum;however, researchers have predicted that in most EUcountries syn-gas-derived biofuels can be cost competitivewith petroleum-derived fuels if they are given tax exemp-tions.114,178,179
AV Chemical Reviews Huber et al.

8/10/2019 Synthesis Transportation Fuels Biomass
http://slidepdf.com/reader/full/synthesis-transportation-fuels-biomass 49/55
Production of bio-oils by fast pyrolysis is a commercialtechnology; however, bio-oils are currently not being usedfor liquid fuels production. (Bio-oils instead are used forprimarily for chemical production.) Bio-oils can be producedby high-pressure liquefaction; however, fast-pyrolysis is acheaper technology.208,223 The PTE for bio-oil production byfast pyrolysis ranges from 61 to 68%.208,223 Bio-oils degrade
with time and therefore cannot be used directly as atransportation fuel without upgrading or blending. Bio-oilscan be upgraded by hydrodeoxygenation182,209 to producehydrocarbons and aromatics, or zeolite upgrading (catalyticcracking),223,224,227-229 to produce aromatics light alkanes andcoke. It has been predicted that both zeolite upgrading andhydrodeoxygenation of bio-oils decreases the energy contentof the bio-oil to about 50% of the biomass feedstock,223
which is significantly higher than the overall thermalefficiency of biofuels derived from syn-gas. However, fuelsderived from bio-oils have not been extensively tested, andthe process of bio-oils upgrading must be further developed.
The third way for producing biofuels from lignocelluloseinvolves the selective conversion of lignocellulose into sugar
and lignin monomer units followed by their subsequentselective conversion into targeted products. It has beenestimated that sugars can be produced from lignocelluloseat costs of 5-14¢/kg.13,171 Efficient pretreatment methodsare needed to facilitate conversion of biomass into monomerunits.250 Sugars can be used to produce ethanol (by fermenta-tion),345 alkanes (by aqueous-phase dehydration-hydrogena-tion),18,22,115 aromatics (by zeolite upgrading),270 or H2 (bysteam, supercritical or aqueous-phase reforming).69,81,160,238,271
The C5 sugars can be dehydrated to furfural,280 which canbe used as a feedstock for n-C8-C13 alkane production (byaqueous-phase processing)18,22 or MTHF (methyltetrahydro-furan) production (by hydrogenation).306 Glucose and otherC6 sugars can be used for levulinic acid production,260-262
which can then be used to produce levulinic esters (byesterification)20,296 or MTHF (by hydrogenation).294 A recentprocess has been developed and tested at the commerciallevel to produce levulinic acid from biomass waste at anestimated cost of $0.09-0.11/kg. MTHF is approved in theU.S. as an oxygenated gasoline additive. Levulinic esters canbe used as an oxygenated diesel fuel additive.
Ethanol is the most widely used biofuel. Corn grain andsugarcane are the feedstocks used in Brazil and the U.S.,respectively. Only the corn grain is used for sugar production,which contains starches that are easily converted into sugarmonomers. The lignocellulose fraction of corn, corn stover,is currently not used for ethanol production; however,processes are being developed to utilize corn stover as afeedstock. Only the water-soluble sugars in sugarcane areused for ethanol production, and the bagasse (the lignocel-lulose section of sugarcane) is used to provide process heat.The overall PTE for production of ethanol is around 0.20-0.40345 and 0.29177 for canesugar and corn grain feedstocks,respectively. The PTE for lignocellulose feedstocks isprojected to be 49%, which is significantly higher than the
PTE for sugar production from sugarcane and corn grain.171
A large fraction of the energy for ethanol production is fordistillation to recover ethanol from the water.
Alkanes, which can be blended with gasoline or dieselfuel, produced by aqueous-phase dehydration/hydration(APD/H) of sugars, contain 95% of the energy of the sugarand only 30% of its mass.18,22 The advantage of alkaneproduction by APD/H is that the majority of alkanesspontaneously separate from the aqueous-biomass feedstock;therefore, a significantly less energy is required for separationof alkanes from water than ethanol from water. While APD/Happears to be a promising technology for sugar conversion,it is only in the initial stage of development and will requiremore study before it can become a commercial process.
Figure 42. Known routes for production of liquid fuels from biomass.
Synthesis of Transportation Fuels from Biomass Chemical Reviews AW

8/10/2019 Synthesis Transportation Fuels Biomass
http://slidepdf.com/reader/full/synthesis-transportation-fuels-biomass 50/55
A large fraction of biomass is lignin, and in an idealbiorefinery the lignin should be used for biofuels and
biochemicals production. Processes exist to convert lignininto liquid fuels including the production of alkyl benzenesand paraffins (by hydrodeoxygenation)285-288 or aromaticsand coke (by zeolite upgrading).289 The alkyl benzenes andparaffins produced by hydrodeoxygenation can be used as ahigh-octane-oxygenated gasoline additive.290,291 The NRELhas designed a process for lignin conversion based onhydrodeoxygenation and hydrocracking technology.290,291
Triglycerides are high energy content molecules producedfrom biomass, and in Europe triglycerides derived fromvegetable oils are the most widely used biomass feedstock.While triglycerides are more expensive than lignocellulosicbiomass, they can efficiently be converted into liquid fuels.
The liquid fuels include alkyl esters (or biodiesel bytransesterification),307 C1-C14 alkanes/alkenes (by zeoliteupgrading or pyrolysis),331-334 C12-C18 n-alkanes (by hy-droprocessing) or be used directly. The direct use of vegetable oil causes engine problems; therefore, vegetableoils need to be converted prior to combustion.307 Biodieselis produced by transesterification of vegetable oils. Glycerolis a byproduct of the transesterification process, and the saleof glycerol improves the economics of biodiesel produc-tion.35,308 However, it has been predicted that with increasedbiodiesel production the cost of glycerol will significantlydecrease. Triglycerides can also be obtained from aquaticalgae; however, current methods of algae production are toocostly to use algae as a feedstock.38
Biomass also produces hydrocarbons of molecular formula(C5H8)n called terpenes. These natural hydrocarbons can be
used as transportation fuels if they can be economicallyproduced. Natural rubber, cis-1,4-polyisoprene, with a mo-lecular weight from 500 000 to 2 000 000, is one exampleof terpenes. Natural rubber is produced commercially fromthe latex of the HeV ea brasiliensis tree, a member of theEuphorbiaceae family.40 The major problem with usingterpenes as biofuel feedstocks is the high-cost of terpeneproduction; therefore, research in this area should focus ondeveloping a cheaper terpene feedstock.
Fuels are a low value commodity produced on a very largescale, and therefore development of economical processesfor fuel production requires a large investment in both moneyand time. Most biomass conversion processes are started with
the goal of rapidly developing commercial technologies. Thefundamental chemistry of most of these reactions is not wellunderstood, and it is likely that further scientific understand-ing will lead us to improved processes. It is vital that newmore efficient catalysts be discovered for these reactions. Itis likely that heterogeneous catalysis, which has been thebackbone of the chemical and petroleum industry, will playa key role in the upcoming transition to the carbohydrateeconomy. According to Bridgwater, “The use of catalyststo improve either the yield or quality of gas and liquid fuelsfrom thermochemical biomass conversion processes is stillin its infancy. While there is extensive fundamental workunderway, considerably more research is necessary to explorethe wide range of conventional and unconventional catalysts.
Table 30. Stages of Development for Production of Liquid Fuels from Biomass
technology productsdevelopment
stage challenges
FTS of biomass-derived syn-gas
liquid alkanes large scalepilot plant
controlling selectivity duringFTS process, Tar removal/ conversion from syn-gas
fermentation of biomass-derived syn-gas
ethanol laboratory scale development of enzymecatalysts
fast pyrolysis bio-oils commercial bio-oils are unstableliquefaction bio-oils pilot plant bio-oils are unstable
hydrotreating of bio-oils mixture of aromatics, alkanes laboratory scale bio-oils are unstable at hightemperatures producing coke,requires expensive H2
zeolite upgrading(catalytic cracking)of bio-oils
mixture of aromatics, alkanes
laboratory scale large amounts of coke produced,quality of final product low
fermentation of corn starchor sugarcane
ethanol commercial requires large amounts of energy for distillation
ethanol via fermentationof cellulosic biomass
ethanol large scale pilot plant conversion of cellulosic biomassto sugars, fermentation of C5
sugars, long residence timeshydrogenation of furfural
(hemicellulose-derived)methyl-tetrahydrofurfural commercial for
chemicalsnot currently economical for fuels,
need more efficient catalystsaqueous-phase processing
of sugar-derivedfeedstocks
straight chain alkanes(C1-C16)
laboratory scale need to test with real biomassfeedstocks, need more efficientcatalysts, multiple steps
esterification of levulinic acid levulinic esters laboratory scale requires low-cost levulinic
acid feedstockhydrotreating of lignin alkyl benzenes, paraffins laboratory scale conversion of solid l ignin residueinto a liquid; requiresexpensive H2
catalytic cracking of lignin aromatics, coke laboratory scale large amounts of coke are producedcatalytic cracking of sugars aromatics, coke laboratory scale large amounts of coke are producedtransesterification of
vegetable oilsalkyl esters (bio-diesel) commercial high-cost of vegetable oils;
need to replace mineralbase catalysts.
hydrotreating of vegetable oils alkanes (n-C12-C18) pilot plant requires expensive H2
catalytic cracking of vegetable oils
aromatics, olefins, paraffins laboratory scale large amounts of coke are produced;multiple products produced
AX Chemical Reviews Huber et al.

8/10/2019 Synthesis Transportation Fuels Biomass
http://slidepdf.com/reader/full/synthesis-transportation-fuels-biomass 51/55
Of particular potential significance is the integration of catalytic processes into the thermal conversion process toimprove efficiency and reduce costs.”223 Biological catalystsalso appear to be promising; however, they are currently onlyused for ethanol production.
Importantly, we should not limit ourselves to currentmethods of production of liquid fuels but also should lookto newer technologies and chemistry. In the short-term, thiswill require more development work, but in the long term it
could yield significantly more energy. However, this willrequire a fundamental understanding of the chemistry anddevelopment of novel heterogeneous, homogeneous, andenzymatic catalysts. We believe that efficient processes forthe sustainable production of biofuels will continue to bedeveloped as the price of crude oil increases.
12. References
(1) Klass, D. L. In Encyclopedia of Energy; Cleveland, C. J., Ed.;Elsevier: London, 2004; Vol. 1.
(2) Klass, D. L. Biomass for Renewable Energy, Fuels and Chemicals;Academic Press: San Diego, 1998.
(3) Wyman, C. E.; Decker, S. R.; Himmel, M. E.; Brady, J. W.; Skopec,C. E.; Viikari, L. In Polysaccharides, 2nd ed.; Dumitriu, S., Ed.;Marcel Dekker: New York, 2005.
(4) Wyman, C. E.; Hinman, N. D. Appl. Biochem. Biotechnol. 1990,24/25, 735.
(5) Wyman, C. E. Appl. Biochem. Biotechnol. 1994, 45/46 , 897.(6) Tyson, K. S. Fuel Cycle E V aluations of Biomass-Ethanol and
Reformulated Gasoline; Report No. NREL/TP-263-2950, DE94000227,National Renewable Energy Laboratory: Golden, CO, 1993.
(7) Lynd, L. R.; Cushman, J. H.; Nichols, R. J.; Wyman, C. E. Science1991, 251, 1318.
(8) Perlack, R. D.; Wright, L. L.; Turhollow, A.; Graham, R. L.; Stokes,B.; Erbach, D. C. Biomass as Feedstock for a Bioenergy andBioproducts Industry: The Technical Feasibility of a Billion-TonAnnual Supply, Report No. DOE/GO-102995-2135; Oak RidgeNational Laboratory: Oak Ridge, TN, 2005; http://www.osti.gov/ bridge.
(9) Energy Information Administration Annual Energy Outlook 2005;Report. No. DOE/EIA-0383; U.S. Department of Energy: Wash-ington, DC, 2006; http://www.eia.doe.gov.
(10) European Biomass Industry Association; http://www.eubia.org, ac-cessed December 2005.
(11) Biofuels for Transport: An International PerspectiV e; InternationalEnergy Agency: Paris, France, 2004.
(12) Ugarte, D. G. D. L. T.; Walsh, M. E.; Shapouri, H.; Slinsky, S. P.The Economic Impacts of Bioenergy Crop Production on U. S.
Agriculture; Agricultural Economic Report No. 816; U. S. Departmentof Agriculture: Washington, DC, 2003.
(13) Lynd, L. R.; Wyman, C. E.; Gerngross, T. U. Biotechnol. Prog. 1999,15, 777.
(14) Energy Information Administration Official Energy Statistics; U. S.Department of Energy, Washington, DC, 2006; http://tonto.eia.doe-.gov/dnav/pet/pet_sum_top.asp.
(15) Biomass Research and DeV elopment Technical Ad V siory Committee Roadmap for Biomass Technologies in the U.S.; U. S. Government,2002; http://www1.eere.energy.gov/biomass/publications.html.
(16) Goudriaan, F.; Beld, B. v. d.; Boerefijn, F. R.; Bos, G. M.; Naber, J.
E.; Wal, S. v. d.; Zeevalkink, J. A. Progress in Thermochemical Biomass ConV ersion; Tyrol, Austria, 2000.
(17) Homgren, J. American Chemical Society Annual Meeting, Atlanta,GA, 2006.
(18) Huber, G. W.; Chheda, J. N.; Barrett, C. J.; Dumesic, J. A. Science2005, 300, 2075.
(19) Manzer, L. E. Biomass DeriV iatiV es: A Sustainable Source of Chemicals; National Science Foundation Workshop: Catalysis forRenewables Conversion, Arlington, VA, April 14-15, 2004; NationalScience Foundation: Washington, DC, 2004.
(20) Manzer, L. E. US 2005/0210738 A1, DuPont, 2005.(21) Bendz, K. EU-25 Oilseeds and Products Biofuels Situation in the
European Union 2005; GAIN Report No. E35058; USDA ForeignAgricultural Service: Washington, DC, 2005.
(22) Huber, G. W.; Dumesic, J. A. Catal. Today 2006, 111, 119.(23) Owen, K.; Coley, T. AutomotiV e Fuels Handbook ; Society of
Automotive Engineers: Warrendale, PA, 1990.
(24) Challen, B.; Baranescu, R. Diesel Engine Reference Book ; Societyof Automotive Engineers, Warrendale, PA, 1999.
(25) Cortright, R. D.; Davda, R. R.; Dumesic, J. A. Nature 2002, 418 ,964.
(26) Towler, G. P.; Oroskar, A. R.; Smith, S. E. EnV iron. Prog. 2004,23, 334.
(27) U.S. Department of Energy, Feedstock Composition Gallery, U.S.Department of Energy, Washington, DC, 2005; http://www.eere.en-ergy.gov/biomass/feedstock_glossary.html.
(28) O’Sullivan, A. C. Cellulose 1997, 4, 173.(29) Hsu, T. A.; Ladisch, M. R.; Tsao, G. T. Chem. Technol. 1980, 10,
315.
(30) Evans, R. J.; Milne, T. A.; Soltys, M. N. J. Anal. Appl. Pyrolysis1986, 9, 207.
(31) Adler, E. Wood Sci. Technol. 1977, 11, 169.(32) Chakar, F. S.; Ragauskas, A. J. Ind. Crop. Prod. 2004, 20, 131.(33) Peterson, C. L. In The Biodiesel Handbook ; Knothe, G., Krahl, J.,
Gerpen, J. V., Eds.; AOCS Press: Champaign, IL, 2005.(34) Ma, F.; Hanna, M. A. Bioresour. Technol. 1999, 70, 1.(35) Haas, M. J.; Foglia, T. A. In The Biodiesel Handbook ; Knothe, G.,
Krahl, J., Gerpen, J. V., Eds.; AOCS Press: Champaign, IL, 2004.(36) Erickson, D. R.; Pryde, E. H.; Brekke, O. L.; Mounts, T. L.; Falb,
R. A. Handbook of Soy Oil Processing and Utilization; AmericanSoybean Association and the American Oil Chemist’s Society: St.Louis, Missouri and Champaign, IL, 1980.
(37) Wiltsee, G. Urban Waste Grease Resource Assessment ; ReportNo. NREL/SR-570-26141; National Renewable Energy Laboratory:Golden, CO, 1998; http://www.osti.gov/bridge.
(38) Sheehan, J.; Dunahay, T.; Benemann, J.; Roessler, P. A Look Backat the U.S. Department of Energy’s Aquatic Species Program-Biodiesel from Algae; Report No. NREL/TP-580-24190; NationalRenewable Energy Laboratory: Golden, CO, 1998; http://ww-w.osti.gov/bridge.
(39) Hill, A. M.; Feinberg, D. A. Fuel Products from Microalgae; ReportNo. SERI/TP-231-2348; National Renewable Energy Laboratory:Golden, CO, 1984.
(40) Baker, C. S. L.; Fulton, W. S. In Kirk-Othmer Encyclopedia of Chemical Technology, 4th ed.; Kroschwitz, J. I., Howe-Grant, M.,Eds.; John Wiley & Sons: New York, 1998; Vol. 21.
(41) Swift, K. A. D. Top. Catal. 2004, 27 , 143.(42) Buchanan, R. A.; Cull, I. M.; Otey, F. H.; Russell, C. R. Econ. Bot.
1978, 32, 146.(43) Buchanan, R. A.; Cull, I. M.; Otey, F. H.; Russell, C. R. Econ. Bot.
1978, 32, 131.(44) Calvin, M. J. Appl. Biochem. 1984, 6 , 3.(45) Calvin, M. Energy 1979, 4, 851.(46) Beenackers, A. A. C. M.; Swaaij, W. P. M. v. In Thermochemical
Processing of Biomass; Bridgwater, A. V., Ed.; Butterworth: London,U.K., 1984.
(47) Bauen, A. In Encyclopedia of Energy; Cleveland, C. J., Ed.;Elsevier: Amderdam, 2004; Vol. 1.
(48) Hos, J. J.; Groeneveld, M. J. In Biomass; Hall, D. O., Overend, R.P., Eds.; Wiley and Sons: Chichester, U.K., 1987.
(49) Babu, S. P. Observations on the current status of biomass gasification,manuscript in preparation.
(50) Milne, T. A.; Evans, R. J.; Abatzoglou, N. Biomass Gasifier Tars:Their Nature, Formation and ConV ersion; Report No. NREL/TP-570-25357; National Renewable Energy Laboratory: Golden, CO,1998; http://www.osti.gov/bridge.
(51) Rostrup-Nielsen, J. R. Catal. Today 2002, 71, 243.(52) Rostrup-Nielsen, J. R. Catal. ReV . - Sci. Eng. 2004, 46 , 247.(53) Evans, R. J.; Milne, T. A. Energy Fuels 1987, 1, 123.(54) Narvaez, I.; Prio, A.; Aznar, M. P.; Corella, J. Ind. Eng. Chem. Res.
1996, 35, 2110.(55) Devi, L.; Ptasinski, K. J.; Janssen, F. J. J. G. Biomass Bioenergy
2003, 24, 125.(56) Dayton, D. A ReV iew of the Literature on Catalytic Biomass Tar Destruction; Report No. NREL/TP-510-32815; National RenewableEnergy Laboratory: Golden, CO, 2002; http://www.osti.gov/bridge.
(57) Elliott, D. C. ACS Symposium Series 376, Denver, CO, 1987; p 55.(58) Rapagna, S.; Jand, N.; Kiennemann, A.; Foscolo, P. U. Biomass
Bioenergy 2000, 19, 187.(59) Tomishige, K.; Asadullah, M.; Kunimori, K. Catal. Today 2004, 89,
389.(60) Baker, E. G.; Mudge, L. K.; Brown, M. D. Ind. Eng. Chem. Res.
1987, 26 , 1335.(61) Sutton, D.; Kelleher, B.; Ross, J. R. H. Fuel Process. Technol. 2001,
73, 155.(62) Mudge, L. K.; Baker, E. G.; Mitchell, D. H.; Brown, M. D. J. Solar
Energy Eng. 1985, 107 , 89.(63) Hallen, R. T.; Sealock, L. T.; Cuello, R.; Bridgwater, A. V. In
Research in Thermochemical Biomass ConV ersion; Kuester, J. L.,Ed.; Elsevier: London, UK, 1988.
Synthesis of Transportation Fuels from Biomass Chemical Reviews AY

8/10/2019 Synthesis Transportation Fuels Biomass
http://slidepdf.com/reader/full/synthesis-transportation-fuels-biomass 52/55
(64) Encinar, J. M.; Beltran, F. J.; Ramiro, A.; Gonzalez, J. F. FuelProcess. Technol. 1998, 55, 219.
(65) Antal, M. J.; Varhegyi, G. Ind. Eng. Chem. Res. 1995, 34, 703.(66) Raveendran, K.; Ganesh, A.; Khilar, K. C. Fuel 1995, 74, 631.(67) Raveendran, K.; Ganesh, A.; Khilar, K. C. Fuel 1996, 75, 987.(68) Richards, G. N.; Zheng, G. J. Anal. Appl. Pyrolysis 1991, 21, 133.(69) Matsumura, Y.; Minowa, T.; Potic, B.; Kersten, S. R. A.; Prins, W.;
Swaaij, W. P. M. v.; Beld, B. v. d.; Elliott, D. C.; Neuenschwander,G. G.; Kruse, A.; Antal, M. J. Biomass Bioenergy 2005, 29, 269.
(70) Modell, M. Am. Soc. Mech. Eng., 1977.(71) Modell, M.; Reid, R. C.; Amin, S. I. US Patent 4,113, 446;
Massachusetts Institute of Technology, 1978.
(72) Lee, I. G.; Lee, J. S.; Kim, M. S. Proceedings of The 5th Korea-Japan Joint Symposium ‘99 on Hydrogen Energy, The Korea EnergySociety: Yusong, Taejon, Korea, 1999; p 365.
(73) Antal, M. J.; Allen, S. G.; Schulman, D.; Xu, X. D.; Divilio, R. J. Ind. Eng. Chem. Res. 2000, 39, 4040.
(74) Yu, D.; Aihara, M.; Antal, M. J. Energy Fuels 1993, 7 , 574.(75) Elliott, D. C.; Sealock, J. L. J. In Fundamentals of Thermochemical
Biomass ConV ersion; Overend, R. P., Milne, T. A., Mudge, L. K.,Eds.; Elsevier: London, UK, 1985.
(76) Elliott, D. C.; L. J. Sealock, J.; Baker, E. G. Ind. Eng. Chem. Res.1993, 32, 1542.
(77) Xu, X.; Matsumura, Y.; Stenberg, J.; Antal, M. J. Ind. Eng. Chem. Res. 1996, 35, 2522.
(78) Aznar, M. P.; Corella, J.; Delgado, J.; Lahoz, J. Ind. Eng. Chem. Res. 1993, 32, 1.
(79) Rustamov, V. R.; Abdullayev, K. M.; Aliyev, F. G.; Kerimov, V. K. Int. J. Hydr. Ener. 1998, 23, 649.
(80) Reed, T. Problems and Opportunities for Solar Energy in Biomass,
Pyrolysis, and Gasification; Report No. SERI/TP-332-495; SolarEnergy Research Institute: Golden, CO, 1979.
(81) Antal, M. J. Synthesis gas production from organic wastes bypyrolysis/steam reforming, In Energy from Biomass and Wastessymposium; Symposium papers presented August 14-18, 1978,Washington, DC; Institute of Gas Technology, Chicago; p 495.
(82) Antal, M. J.; Hofmann, L.; Moreira, J. R.; Brown, C. T.; Steenblik,R. Solar Energy 1983, 30, 299.
(83) Antal, M. J.; Rodot, M.; Royere, C.; Vialaron, A. Proceedings of the International Solar Energy Society Silver Jubilee Congress,Atlanta, May 28-June 1, 1979; Boer, K. W., Glenn, B. H., Eds.;Pergamon, New York, 1979.
(84) Adinberg, R.; Epstein, M.; Karni, J. Trans. ASME 2004, 126 , 850.(85) Bain, R. L.; Dayton, D. C.; Carpenter, D. L.; Czernik, S. R.; Feik,
C. J.; French, R. J.; Magrini-Bair, K. A.; Phillips, S. D. Ind. Eng.Chem. Res. 2005, 44, 7945.
(86) Stevens, D. J. Hot Gas Conditioning: Recent Progress With Larger-Scale Biomass Gasification Systems; Report No. NREL/SR-510-29952; National Renewable Energy Laboratory, Golden, CO, 2001;http://www.osti.gov/bridge.
(87) Delgado, J.; Aznar, M. P.; Corella, J. Ind. Eng. Chem. Res. 1997,36 , 1535.
(88) Delgado, J.; Aznar, M. P.; Corella, J. Ind. Eng. Chem. Res. 1996,35, 3637.
(89) Simell, P. A.; Leppalahti, J. K.; Bredenberg, J. B. S. Fuel 1992, 71,211.
(90) Simell, P. A.; Leppalahti, J. K.; Kurkela, E. A. Fuel 1995, 74, 938.(91) Simell, P. A.; Hirvensalo, E. K.; Smolander, V. T.; Krause, A. O. I.
Ind. Eng. Chem. Res. 1999, 38 , 1250.(92) Narvaez, I.; Corella, J.; Orıo, A. Ind. Eng. Chem. Res. 1997, 36 ,
317.(93) Aznar, M. P.; Caballero, M. A.; Gil, J.; Martin, J. A.; Corella, J.
Ind. Eng. Chem. Res. 1998, 37 , 2668.(94) Devi, L.; Ptasinski, K. J.; Janssen, F. J. J. G. Fuel Process. Technol.
2005, 86 , 707.
(95) Devi, L.; Craje, M.; Thune, P.; Ptasinski, K. J.; Janssen, F. J. J. G. Appl. Catal. A 2005, 294, 68.(96) Rostrup-Nielsen, J. R. Steam Reforming Catalysts, An InV estigation
of Catalysts for Tubular Steam Reforming of Hydrocarbons; TakniskForlag: Copenhagen, 1975.
(97) Farrauto, R. J.; Bartholomew, C. Introduction to Industrial CatalyticProcesses; Chapman & Hall, London, UK, 1997.
(98) Wei, J.; Iglesia, E. J. Catal. 2004, 224, 370.(99) Corella, J.; Orıo, A.; Toledo, J. M. Energy Fuels 1999, 13, 702.
(100) Gebhard, S. C.; Wang, D.; Overend, R. P.; Paisley, M. A. Biomass Bioenergy 1994, 7 , 307.
(101) Kinoshita, C. M.; Wang, Y.; Zhou, J. Ind. Eng. Chem. Res. 1995,34, 2949.
(102) Coll, R.; Salvado, J.; Farriol, X.; Montane, D. Fuel Process. Technol.2001, 74, 19.
(103) Simell, P. A.; Hepola, J. O.; Krause, A. O. I. Fuel 1997, 76 , 1117.(104) Caballero, M. A.; Corella, J.; Aznar, M. P.; Gil, J. Ind. Eng. Chem.
Res. 2000, 39, 1143
(105) Hepola, J.; Simell, P. Appl. Catal. B 1997, 14, 287.(106) Hepola, J.; Simell, P. Appl. Catal. B 1997, 14, 305.(107) Depner, H.; Jess, A. Fuel 1999, 78 , 1369.(108) Bangala, D. N.; Abatzoglou, N.; Chornet, E. AIChE J. 1998, 44, 927.(109) Wang, T. J.; Chang, J.; Wu, C. Z.; Fu, Y.; Chen, Y. Biomass
Bioenergy 2005, 28 , 508.(110) Furusawa, T.; Tsutsumi, A. Appl. Catal. A 2005, 278 , 195.(111) Furusawa, T.; Tsutsumi, A. Appl. Catal. A 2005, 278 , 207.(112) Rapagna, S.; Provendier, H.; Petit, C.; Kiennemann, A.; Foscolo, P.
U. Biomass Bioenergy 2002, 22, 377.(113) Martınez, R.; Romero, E.; Garcıa, L.; Bilbao, R. Fuel Process.
Technol. 2003, 85, 201.(114) Spath, P. L.; Dayton, D. C. Preliminary Screening - Technical and
Economic Assessment of Synthesis Gas t o Fuels and Chemicals with Emphasis on the Potential for Biomass-DeriV ed Syngas; Report No.NREL/TP-510-34929; National Renewable Energy Laboratory, Golden,CO, 2003; http://www.osti.gov/bridge.
(115) Huber, G. W.; Cortright, R. D.; Dumesic, J. A. Angew. Chem., Int. Ed. 2004, 43, 1549.
(116) Rostrup-Nielsen, J. R. Phys. Chem. Chem. Phys. 2001, 3, 283.(117) Haruta, M.; Tsubota, S.; Kobayashi, T.; Kageyama, H.; Genet, M.
J.; Delmon, B. J. Catal. 1993, 144, 175.(118) Guzman, J.; Carrettin, S.; Fierro-Gonzalez, J. C.; Hao, Y.; Gates, B.
C.; Corma, A. Angew. Chem., Int. Ed. 2005, 44, 4778.(119) Fu, Q.; Deng, W.; Saltsburg, H.; Flytzani-Stephanopoulos, M. Appl.
Catal. B 2005, 56 , 57.(120) Fu, Q.; Saltsburg, H.; Flytzani-Stephanopoulos, M. Science 2003,
301, 935.(121) Carrettin, S.; Concepcion, P.; Corma, A.; Nieto, J. M. L.; Puntes, V.
F. Angew. Chem., Int. Ed. 2004, 43, 2538.(122) Zhang, R.; Brown, R. C.; Suby, A. Energy Fuels 2004, 18 , 251.(123) Zhang, R.; Cummer, K.; Suby, A.; Brown, R. C. Fuel Process.
Technol. 2005, 86 , 861.(124) Kim, W. B.; Voitl, T.; Rodriguez-Rivera, G. J.; Evans, S. T.; Dumesic,
J. A. Ange. Chem. Int. Ed. 2005, 44, 778.(125) Kim, W. B.; Voitl, T.; Rodriguez-Rivera, G. J.; Dumesic, J. A. Science
2004, 305, 1280.(126) Kim, W. B.; Rodriguez-Rivera, G. J.; Evans, S. T.; Voitl, T.; Einspahr,
J. J.; Voyles, P. M.; Dumesic, J. A. J. Catal. 2005, 235, 327.(127) Levin, D. B.; Pitt, L.; Love, M. Int. J. Hydrogen Energy 2004, 29,
173.(128) Chinchen, G. C.; Denny, P. J.; Jennings, J. R.; Spencer, M. S.; Waugh,
K. C. Appl. Catal. 1988, 36 , 1.(129) Liu, G.; Willcox, D.; Garland, M.; Kung, H. H. J. Catal. 1984, 90,
139.(130) Klier, K. Ad V . Catal. 1982, 31, 243.(131) Greeley, J.; Gokhale, A. A.; Kreuser, J.; Dumesic, J. A.; Topsoe,
H.; Topsoe, N. Y.; Mavrikakis, M. J. Catal. 2003, 213, 63.(132) Klier, K.; Chatikavanij, V.; Herman, R. G.; Simmons, G. W. J. Catal.1982, 74, 343.
(133) Muhler, M.; Tornqvist, E.; Nielsen, L. P.; Clausen, B. S.; Topsoe,H. Catal. Lett. 1994, 25, 1.
(134) Dybkjaer, I.; Christensen, T. S. Stud. Surf. Sci. Catal. 2001, 136 (Natural Gas ConV ersion VI), 435.
(135) Wender, I. Fuel Process. Technol. 1996, 48 , 189.(136) Reed, T. B.; Lerner, R. M. Science 1973, 182, 1299.(137) Klausmeier, R. F.; Billick, I. F. Energy Fuels 1993, 7 , 27.(138) Specht, M.; Staiss, F.; Bandi, A.; Weimer, T. Int. J. Hydrogen Energy
1998, 23, 387.(139) Arico, A. S.; Srinivasan, S.; Antonucci, V. Fuel Cells 2001, 1, 133.(140) Dillon, R.; Srinivasan, S.; Arico, A. S.; Antonucci, V. J. Power
Sources 2004, 127 , 112.(141) Cubeiro, M. L.; Fierro, J. L. G. J. Catal. 1998, 179, 150.(142) Agrell, J.; Birgersson, H.; Boutonnet, M.; Melian-Cabrera, I.; Navarro,
R. M.; Fierro, J. L. G. J. Catal. 2003, 219, 389.(143) Liu, S.; Takahashi, K.; Uematsu, K.; Ayabe, M. Appl. Catal. A 2005,
283, 125.(144) Park, G.-G.; Yim, S.-D.; Yoon, Y.-G.; Lee, W.-Y.; Kim, C.-S.; Seo,
D.-J.; Eguchi, K. J. Power Sources 2005, 145, 702.(145) Iwasa, N.; Yoshikawa, M.; Nomura, W.; Arai, M. Appl. Catal. A
2005, 292, 215.(146) Brown, L. F. Int. J. Hydrogen Energy 2001, 26 , 381.(147) Corma, A. Studies in Surface Science and Catalysis; Elsevier:
Amsterdam, 1994; Vol. 83, p 461.(148) Collignon, F.; Loenders, R.; Martens, J. A.; Jacobs, P. A.; Poncelet,
G. J. Catal. 1999, 182, 302.(149) Stocker, M. Microporous Mesoporous Mater. 1999, 29, 3.(150) Keil, F. J. Microporous Mesoporous Mater. 1999, 29, 49.(151) Camblor, M. A.; Corma, A.; Lightfoot, P.; Villaescusa, L. A.; Wright,
P. A. Angew. Chem., Int. Ed. Engl. 1997, 36 , 2659.(152) Corma, A.; Rey, F.; Rius, J.; Sabater, M. J.; Valencia, S. Nature
2004, 431, 287.
AZ Chemical Reviews Huber et al.

8/10/2019 Synthesis Transportation Fuels Biomass
http://slidepdf.com/reader/full/synthesis-transportation-fuels-biomass 53/55
(153) Cantin, A.; Corma, A.; Leiva, S.; Rey, F.; Rius, J.; Valencia, S. J. Am. Chem. Soc. 2005, 127 , 11560.
(154) Peng, X. D.; Wang, A. W.; Toseland, B. A.; Tijm, P. J. A. Ind. Eng.Chem. Res. 1999, 38 , 4381.
(155) Ge, Q.; Huang, Y.; Qiu, F.; Li, S. Appl. Catal. A. 1998, 167 , 23.(156) Lee, S.; Saresai, A. Top. Catal. 2005, 32, 197.(157) Sardesai, A.; Lee, S. ReV . Proc. Chem. Eng. 1998, 1, 141.(158) Mills, G. A. Fuel 1994, 73, 1243.(159) Shabaker, J. W.; Davda, R. R.; Huber, G. W.; Cortright, R. D.;
Dumesic, J. A. J. Catal. 2003, 215, 344.(160) Davda, R. R.; Shabaker, J. W.; Huber, G. W.; Cortright, R. D.;
Dumesic, J. A. Appl. Catal., B 2005, 56 , 171.
(161) Dry, M. E. In Catalysis Science and Technology; Anderson, J. R.,Boudart, M., Eds.; Springer-Verlag: New York, 1981.
(162) Anderson, R. B. The Fischer -Tropsch Synthesis; Academic Press:Orlando, FL, 1984.
(163) Dry, M. E. Catal. Today 2002, 71, 227.(164) Iglesia, E. Appl. Catal. A 1997, 161, 59.(165) Iglesia, E.; Reyes, S. C.; Madon, R. J.; Soled, S. L. Ad V . Catal. 1993,
39, 221.(166) Bartholomew, C. H. Stud. Surf. Sci. Catal. 1991, 64 (New Trends
CO Act.), 158.(167) Martinez, A.; Lopez, C. Appl. Catal. A 2005, 294, 251.(168) Martinez, A.; Lopez, C.; Perid, E.; Corma, A. In Stud. Surf. Sci.
Catal.; Cejka, J., Zilkova, N., Nachtigall, P., Eds.; Elsevier: Am-sterdam, 2005; Vol. 158.
(169) Boerrigter, H.; Uil, H. d.; Calis, H.-P. Pyrolysis and Gasification of Biomass and Waste Expert Meeting, September 30-October 1, 2002,Strasbourg, France, 2002.
(170) Boerrigter, H. ‘Green’ Diesel Production with Fischer -TropschSynthesis; Report No. ECN-RX-03-014; Energy Research Centreof The Netherlands: Petten, 2003; http://www.ecn.nl/_files/bio/ RX03014.pdf.
(171) Aden, A.; Ruth, M.; Ibsen, K.; Jechura, J.; Neeves, K.; Sheehan, J.;Wallace, B.; Montague, L.; Slayton, A.; Lukas, J. Lignocellulosic
Biomass to Ethanol Process Design and Economics Utilizing Co-Current Dilute Acid Prehydrolysis and Enzymatic Hydrolysis for CornStoV er ; Report No. NREL/TP-510-32438; National RenewableEnergy Laboratory: Golden, CO, 2002; http://www.osti.gov/bridge.
(172) Klasson, K. T.; Ackerson, M. D.; Clausen, E. C.; Gaddy, J. L. Fuel1993, 73, 1673.
(173) Datar, R. P.; Shenkman, R. M.; Cateni, B. G.; Huhnke, R. L.; Lewis,R. S. Biotechnol. Bioeng. 2004, 86 , 587.
(174) Younesi, H.; Najafpour, G.; Mohamed, A. R. Biochem. Eng. J. 2005,27 , 110.
(175) Phillips, J. R.; Clausen, E. C.; Gaddy, J. L. Appl. Biochem. Biotechnol.1994, 45-46 , 145.
(176) Spath, P. L.; Mann, M. K.; Amos, W. A. Update of Hydrogen from Biomass- Determination of the DeliV ered Cost of Hydrogen; ReportNo. NREL/MP-510-33112; National Renewable Energy Labora-tory: Golden, CO, 2003; http://www.osti.gov/bridge.
(177) Shapouri, H.; Duffield, J. A.; Wang, M. The Energy Balance of Corn: An Update; Agricultural Economic Report 814; U. S.Department of Agriculture, Office of the Chief Economist, Wash-ington, DC, 2002.
(178) Hamelinck, C. N.; Faaij, A. P. C. J. Power Sources 2002, 111, 1.(179) Hamelinck, C. N.; Faaij, A. P. C.; Uil, H. d.; Boerrigter, H. Energy
2004, 29, 1743.(180) Prins, M. J.; Ptasinski, K. J.; Janssen, F. J. J. G. Fuel Process. Technol.
2004, 86 , 375.(181) Stiegel, G. J.; Maxwell, R. C. Fuel Process. Technol. 2001, 71, 79.(182) Elliott, D. C.; Beckman, D.; Bridgwater, A. V.; Diebold, J. P.; Gevert,
S. B.; Solantausta, Y. Energy Fuels 1991, 5, 399.(183) Bridgwater, A. V.; Peacocke, G. V. C. Renewable Sustainable Energy
ReV . 2000, 4, 1.
(184) Mohan, D.; Pittman, C. U.; Steele, P. H. Energy Fuels 2006, 20,848.(185) Czernik, S.; Bridgwater, A. V. Energy Fuels 2004, 18 , 590.(186) Brammer, J. G.; Bridgwater, A. V. Renewable Sustainable Energy
ReV . 1999, 3, 243.(187) Scott, D. S.; Majerski, P.; Piskorz, J.; Radlein, D. J. Anal. Appl.
Pyrolysis 1999, 51, 23.(188) Moffatt, J. M.; Overend, R. P. Biomass 1985, 7 , 99.(189) Vanasse, C.; Chornet, E.; Overend, R. P. Can. J. Chem. Eng. 1988,
66 , 112.(190) Diebold, J. P. A Review of the Chemical and Physical Mechanisms
of the Storage Stability of Fast Pyrolysis Bio-Oils; Report No. NREL/ SR-570-27613; National Renewable Energy Laboratory: Golden, CO,2000; http://www.osti.gov/bridge.
(191) Milne, T. A.; Agblevor, F.; Davis, M.; Deutch, S.; Johnson, D. In DeV elopments in Thermal Biomass ConV ersion; Bridgwater, A. V.,Boocock, D. G. B., Eds.; Blackie Academic and Professional:London, UK, 1997.
(192) Branca, C.; Giudicianni, P.; Blasi, C. D. Ind. Eng. Chem. Res. 2003,42, 3190.
(193) Shafizadeh, F. J. Anal. Appl. Pyrolysis 1982, 3, 283.(194) Nimlos, M. R.; Blanksby, S. J.; Ellison, G. B.; Evans, R. J. J. Anal.
Appl. Pyrolysis 2003, 66 , 3.(195) Dobele, G.; Rossinskaja, G.; Dizhbite, T.; Telysheva, G.; Meier, D.;
Faix, O. J. Anal. Appl. Pyrolysis 2005, 74, 401.(196) Sanders, E. B.; Goldsmith, A. I.; Seeman, J. I. J. Anal. Appl. Pyrolysis
2003, 66 , 29.(197) Antal, M. J.; Varhegyi, G.; Jakab, E. Ind. Eng. Chem. Res. 1998,
37 , 1267.(198) Orfao, J. J. M.; Antunes, F. J. A.; Figueiredo, J. L. Fuel 1999, 78 ,
349.(199) Wooten, J. B.; Seeman, J. I.; Hajaligol, M. R. Energy Fuels 2004,18 , 1.
(200) Broido, A.; Nelson, M. A. Combust. Flame 1975, 24, 263.(201) Bradbury, A. G. W.; Sakai, Y.; Shafizadeh, F. J. Appl. Polym. Sci.
1979, 23, 3271.(202) Piskorz, J.; Radlein, D.; Scott, D. S.; Czernik, S. J. Anal. Appl.
Pyrolysis 1989, 16 , 127.(203) Diebold, J. P. Biomass Bioenergy 1994, 7 , 75.(204) Kruse, A.; Gawlik, A. Ind. Eng. Chem. Res. 2003, 42, 267.(205) Kabyemela, B. M.; Adschiri, T.; Malaluan, R. M.; Arai, K. Ind. Eng.
Chem. Res. 1999, 38 , 2888.(206) Watanabe, M.; Aizawa, Y.; Iida, T.; Levy, C.; Aida, T. M.; Inomata,
H. Carbohydr. Res. 2005, 340, 1931.(207) Antal, M. J.; Mok, W. S. L.; Richards, G. N. Carbohydr. Res. 1990,
199, 91.(208) Elliott, D. C.; Baker, E. G.; Beckman, D.; Solantausta, Y.; Tolenhi-
emo, V.; Gevert, S. B.; Hornell, C.; Ostman, A.; Kjellstrom, B. Biomass 1990, 22, 251.
(209) Furimsky, E. Appl. Catal. A 2000, 199, 147.(210) Sheu, Y.-H. E.; Anthony, R. G.; Soltes, E. J. Fuel Process. Technol.
1988, 19, 31.(211) Ramanthan, S.; Oyama, S. T. J. Phy. Chem. 1995, 99, 16365.(212) Elliott, D. C.; Neuenschwander, G. G. In DeV elopments in Thermo-
chemical Biomass ConV ersion; Bridgwater, A. V., Boocock, D. G.B., Eds.; Blackie Academic and Professional: London, 1996; Vol.1.
(213) Elliott, D. C.; Baker, E. G.; Piskorz, J.; Scott, D. S.; Solantausta, Y. Energy Fuels 1988, 2, 234.
(214) Elliott, D. C.; Oasmaa, A. Energy Fuels 1991, 5, 102.(215) Ferrari, M.; Maggi, R.; Delmon, B.; Grange, P. J. Catal. 2001, 198 ,
47.(216) Centeno, A.; Laurent, E.; Delmon, B. J. Catal. 1995, 154, 288.(217) Laurent, E.; Delmon, B. Appl. Catal. A 1994, 109, 77.(218) Laurent, E.; Delmon, B. Appl. Catal. A 1994, 109, 97.(219) Laurent, E.; Delmon, B. J. Catal. 1994, 146 , 281.(220) Corma, A. J. Catal. 2003, 216 , 298.(221) Corma, A. Chem. ReV . 1997, 97 , 2373.(222) Corma, A. Chem. ReV . 1995, 95, 559.(223) Bridgwater, A. V. Appl. Catal. A 1994, 116 , 5.(224) Adjaye, J. D.; Katikaneni, S. P. R.; Bakhshi, N. N. Fuel Process.
Technol. 1996, 48 , 115.(225) Sharma, R. K.; Bakhshi, N. N. Energy Fuels 1993, 7 , 306.(226) Katikaneni, S. P. R.; Adjaye, J. D.; Bakhshi, N. N. Energy Fuels
1995, 9, 1065.(227) Srinivas, S. T.; Dalai, A. K.; Bakhshi, N. N. Can. J. Chem. Eng.
2000, 78 , 343.(228) Gayubo, A. G.; Aguayo, A. T.; Atutxa, A.; Aguado, R.; Bilbao, J.
Ind. Eng. Chem. Res. 2004, 43, 2610.(229) Gayubo, A. G.; Aguayo, A. T.; Atutxa, A.; Aguado, R.; Olazar, M.;
Bilbao, J. Ind. Eng. Chem. Res. 2004, 43, 2619.(230) Gayubo, A. G.; Aguayo, A. T.; Atutxa, A.; Valle, B.; Bilbao, J. J.
Chem. Technol. Biotech. 2005, 80, 1244.
(231) Gallivan, R. M.; Mattschei, P. K. U.S. Patent 4233465, AmericanCan Company, 1980.(232) Chum, H. L.; Black, S. K. U.S. Patent 4942269, Midwest Research
Institute, 1990.(233) Ikura, M.; Stanciulescu, M.; Hogan, E. Biomass Bioenergy 2003,
24, 221.(234) Chiaramonti, D.; Bonini, M.; Fratini, E.; Tondi, G.; Gartner, K.;
Bridgwater, A. V.; Grimm, H. P.; Soldaini, I.; Webster, A.; Baglioni,P. Biomass Bioenergy 2003, 25, 85.
(235) Chiaramonti, D.; Bonini, M.; Fratini, E.; Tondi, G.; Gartner, K.;Bridgwater, A. V.; Grimm, H. P.; Soldaini, I.; Webster, A.; Baglioni,P. Biomass Bioenergy 2003, 25, 101.
(236) Wang, D.; Czernik, S.; Montane, D.; Mann, M.; Chornet, E. Ind. Eng. Chem. Res. 1997, 36 , 1507.
(237) Sanchez, J. L.; Gonzalo, A.; Gea, G.; Bilbao, R.; Arauzo, J. EnergyFuels 2005, 19, 2140.
(238) Czernik, S.; French, R.; Feik, C.; Chornet, E. Ind. Eng. Chem. Res.2002, 41, 4209.
Synthesis of Transportation Fuels from Biomass Chemical Reviews BA

8/10/2019 Synthesis Transportation Fuels Biomass
http://slidepdf.com/reader/full/synthesis-transportation-fuels-biomass 54/55
(239) Garcia, L.; French, R.; Czernik, S.; Chornet, E. Appl. Catal. A 2000,201, 225.
(240) Marquevich, M.; Czernik, S.; Chornet, E.; Montane, D. Energy Fuels1999, 13, 1160.
(241) Rioche, C.; Kulkarni, S.; Meunier, F. C.; Breen, J. P.; Burch, R. Appl. Catal. B 2005, 61, 130.
(242) Takanabe, K.; Aika, K.-i.; Seshan, K.; Lefferts, L. J. Catal. 2004,227 , 101.
(243) Panigrahi, S.; Dalai, A. K.; Chaudhari, S. T.; Bakhshi, N. N. EnergyFuels 2003, 17 , 637.
(244) Chaudhari, S. T.; Bej, S. K.; Bakhshi, N. N.; Dalai, A. K. EnergyFuels 2001, 15, 736.
(245) Chaudhari, S. T.; Dalai, A. K.; Bakhshi, N. N. Energy Fuels 2003,17 , 1062.
(246) Evans, R.; Czernik, S.; Chornet, E.; Feik, C.; Phillips, S. Proceedingsof the 2001 DOE Hydrogen Program Review, U.S. Department of Energy, 2001.
(247) Mosier, N.; Wyman, C.; Dale, B.; Elander, R.; Lee, Y. Y.; Holtzapple,M.; Ladisch, M. Bioresour. Technol. 2005, 96 , 673.
(248) Eggeman, T.; Elander, R. T. Bioresour. Technol. 2005, 96 , 2019.(249) Wyman, C. E.; Dale, B. E.; Elander, R. T.; Holtzapple, M.; Ladisch,
M. R.; Lee, Y. Y. Bioresour. Technol. 2005, 96 , 2026.(250) Wyman, C. E.; Dale, B. E.; Elander, R. T.; Holtzapple, M.; Ladisch,
M. R.; Lee, Y. Y. Bioresour. Technol. 2005, 96 , 1959.(251) Liu, C.; Wyman, C. E. Bioresour. Technol. 2005, 96 , 1978.(252) Saeman, J. F. Ind. Eng. Chem. 1945, 37 , 42.(253) Fan, L. T.; Gharpuray, M. M.; Lee, Y. H. Cellulose Hydrolysis;
Springer-Verlag: Berlin, 1987.(254) Mok, W. S. L.; Antal, M. J. J. Ind. Eng. Chem. Res. 1992, 31, 94.(255) Lynd, L. R.; Weimer, P. J.; Zyl, W. H. v.; Pretorius, I. S. Microbiol.
Mol. Biol. ReV . 2002, 66 , 506.(256) Mosier, N. S.; Hall, P.; Ladisch, C. M.; Ladisch, M. R. Ad V . Biochem.
Eng. Biotechnol. 1999, 65, 23.(257) Allen, S. G.; Schulman, D.; Lichwa, J.; Antal, M. J. J.; Laser, M.;
Lynd, L. R. Ind. Eng. Chem. Res. 2001, 40, 2934.(258) Lloyd, T. A.; Wyman, C. E. Bioresour. Technol. 2005, 96 , 1967.(259) Horvat, J.; Klaic, B.; Metelko, B.; Sunjie, V. Tetrahedron Lett. 1985,
26 , 2111.(260) Fitzpatrick, S. W. U.S. Patent 4897497; Biofine Incorporated, 1990.(261) Fitzpatrick, S. W. U.S. Patent 5608105; Biofine Incorporated, 1997.(262) Fitzpatrick, S. W. Final Technical Report Commercialization of the
Biofine Technology for LeV ulinic Acid Production from Paper Sludge;BioMetics, Inc.; Report No. DOE/CE/41178; U.S. Department of Energy: Washington, DC, 2002; http://www.osti.gov/bridge.
(263) Robinson, J. M.; Burgess, C. E.; Bently, M. A.; Brasher, C. D.; Horne,B. O.; Lillard, D. M.; Macias, J. M.; Mandal, H. D.; Mills, S. C.;O’Hara, K. D.; Pon, J. T.; Raigoza, A. F.; Sanchez, E. H.; Villarreal,J. S. Biomass Bioenergy 2004, 26 , 473.
(264) Wyman, C. In Encyclopedia of Energy; Cleveland, C. J., Ed.;Elsevier: London, 2004; Vol. 2.
(265) Aristidou, A.; Penttila, M. Curr. Opin. Biotechnol. 2000, 11, 187-198.
(266) Sonderegger, M.; Jeppsson, M.; Larsson, C.; Gorwa-Grauslund, M.-F.; Boles, E.; Olsson, L.; Spencer-Martins, I.; Hahn-Hagerdal, B.;Sauer, U. Biotechnol. Bioeng. 2004, 87 , 90.
(267) Shapouri, H.; Gallagher, P.; Graboski, M. S. USDA’s 1998 EthanolCost-of Production Sur V ey; Agricultural Economic Report Number808; U.S. Department of Agriculture, Office of the Chief Economist,Washington, DC, 1998.
(268) Wooley, R.; Ruth, M.; Glassner, D.; Sheehan, J. Biotechnol. Prog.1999, 15, 794.
(269) Pimentel, D.; Patzek, T. W. Nat. Res. Res. 2005, 14, 65-76.(270) Chen, N. Y.; T. F. Degnan, J.; Koenig, L. R. Chemtech 1986, 16 ,
506.(271) Huber, G. W.; Shabaker, J. W.; Dumesic, J. A. Science 2003, 300,
2075.(272) Davda, R. R.; Shabaker, J. W.; Huber, G. W.; Cortright, R. D.;Dumesic, J. A. Appl. Catal., B 2003, 43, 1.
(273) Shabaker, J. W.; Dumesic, J. A. Ind. Eng. Chem. Res. 2004, 43, 3105.(274) Davda, R. R.; Dumesic, J. A. Angew. Chem., Int. Ed. 2003, 42, 4068.(275) Shabaker, J. W.; Huber, G. W.; Dumesic, J. A. J. Catal. 2004, 222,
180.(276) Davda, R. R.; Dumesic, J. A. Chem. Commun. 2004, 36.(277) Shabaker, J. W.; Huber, G. W.; Davda, R. R.; Cortright, R. D.;
Dumesic, J. A. Catal. Lett. 2003, 88 , 1.(278) Huber, G. W.; Shabaker, J. W.; Evans, S. T.; Dumesic, J. A. Appl.
Catal., B 2006, 62, 226.(279) Shabaker, J. W.; Simonetti, D. A.; Cortright, R. D.; Dumesic, J. A.
J. Catal. 2005, 231, 67.(280) Zeitsch, K. J. The Chemistry and Technology of Furfural and its
Many By-Products; Elsevier: London, 2000.(281) Hallenbeck, P. C.; Benemann, J. R. Int. J. Hydrogen Energy 2002,
27 , 1185.
(282) Nath, K.; Das, D. Appl. Microbiol. Biotechnol. 2004, 65, 520.(283) Khanal, S. K.; Chen, W.-H.; Li, L.; Sung, S. Int. J. Hydrogen Energy
2004, 29, 1123.(284) Gosselink, R. J. A.; Jong, E. d.; Guran, B.; Abacherli, A. Ind. Crop.
Prod. 2004, 20, 121.(285) Piskorz, J.; Majerski, P.; Radlein, D.; Scott, D. S. Energy Fuels 1989,
3, 723.(286) Train, P. M.; Klein, M. T. Fuel Sci. Technol. 1991, 9, 193.(287) Ratcliff, M. A.; Johnson, D. K.; Posey, F. L.; Chum, H. L. Appl.
Biochem. Biotechnol. 1988, 17 , 151.(288) Oasmaa, A.; Alen, R.; Meier, D. Bioresour. Technol. 1993, 45, 189.(289) Thring, R. W.; Katikaneni, S. P. R.; Bakhshi, N. N. Fuel Process.
Technol. 2000, 62, 17.(290) Shabtai, J. S.; Zmierczak, W. W.; Chornet, E. US Patent 5959167,
The University of Utah Research Foundation, 1999.(291) Montague, L. Lignin Process Design Confirmation and Capital Cost
E V aluation; Report No. NREL/SR-510-31579; National RenewableEnergy Laboratory, Golden, CO, 2003; http://www.osti.gov/bridge.
(292) Miller, J. E.; Evans, L.; Littlewolf, A.; Trudell, D. E. Fuel 1999, 78 ,1363.
(293) Shabtai, J. S.; Zmierczak, W. W.; Chornet, E. U.S. Patent 6172272B1, The University of Utah, 2001.
(294) Elliott, D. C.; Frye, J. G. U.S. Patent 5883266, Battelle MemorialInstitute, 1999.
(295) Rae, A.; Hodgson, W. World Patent WO 03/002696 A1, AAETechnologies International PLC, 2003.
(296) Manzer, L. E. U.S. 2005/0171374, DuPont, 2005.(297) Fagan, P. J.; Korovessi, E.; Manzer, L. E.; Mehta, R.; Thomas, S.
M. International Patent Number WO 03/085071 A1, Dupont, 2003.(298) Montane, D.; Salvado, J.; Torras, C.; Farriol, X. Biomass Bioenergy
2002, 22, 295.(299) Kottke, R. H. Kirk-Othmer Encyclopedia of Chemical Technology,
4th ed.; Kroschwitz, J. I., Howe-Grant, M., Eds.; John Wiley &Sons: New York, 1998; Vol. Supplement.
(300) Antal, M. J.; Leesomboon, T.; Mok, W. S.; Richards, G. N.Carbohydr. Res. 1991, 217 , 71.
(301) Zeitsch, K. J. International Patent WO 00/47569, 2000.(302) Dias, A. S.; Pillinger, M.; Valente, A. A. J. Catal. 2005, 229, 414.(303) Dias, A. S.; Pillinger, M.; Valente, A. A. Appl. Catal. A 2005, 285,
126.(304) Moreau, C.; Durand, R.; Peyron, D.; Duhamet, J.; Rivalier, P. Ind.
Crop. Prod. 1998, 7 , 95.(305) Bayan, S.; Beati, E. Chim. Ind. (Milan, Italy) 1941, 23, 432.(306) Ahmed, I. U.S. Patent Application, US 2005/0176974 A1, 2005.(307) Knothe, G.; Krahl, J.; Gerpen, J. V. The Biodiesel Handbook ; AOCS
Press: Champaign, Illinois, 2005.(308) Bray, R. G. Biodiesel Production; SRI Consulting, 2004.(309) Freedman, B.; Butterfield, R. O.; Pryde, E. H. J. Am. Oil Chem. Soc.
1986, 63, 1375.(310) Schuchardt, U.; Sercheli, R.; Vargas, R. M. J. Braz. Chem. Soc. 1998,
9, 199.(311) Noureddini, H.; Zhu, D. J. Am. Oil Chem. Soc. 1997, 74, 1457.(312) Gerpen, J. V.; Knothe, G. In The Biodiesel Handbook ; Knothe, G.,
Krahl, J., Gerpen, J. V., Eds.; AOCS Press: Champaign, IL, 2005.(313) Lopez, D. E.; Jr., J. G. G.; Bruce, D. A.; Lotero, E. Appl. Catal. A
2005, 295, 97.(314) Toda, M.; Takagaki, A.; Okamura, M.; Kondo, J. N.; Hayashi, S.;
Domen, K.; Hara, M. Nature 2005, 438 , 178.(315) Kim, H.-J.; Kang, B.-S.; Kim, M.-J.; Park, Y. M.; Kim, D.-K.; Lee,
J.-S.; Lee, K.-Y. Catal. Today 2004, 93-95, 315.(316) Cantrell, D. G.; Gillie, L. J.; Lee, A. F.; Wilson, K. Appl. Catal. A
2005, 287 , 183.(317) Suppes, G. J.; Dasari, M. A.; Doskocil, E. J.; Mankidy, P. J.; Godd,
M. J. Appl. Catal. A 2004, 257 , 213.(318) Stern, R.; Hillion, G.; Rouxel, J.-J.; Leporq, S. U.S. Patent 5908946;
Institut Francais de Petrole, 1999.(319) Corma, A.; Iborra, S.; Miquel, S.; Primo, J. J. Catal. 1998, 173, 315.(320) Corma, A.; Hamid, S. B. A.; Iborra, S.; Velty, A. J. Catal. 2005,
234, 340.(321) Climent, M. J.; Corma, A.; Iborra, S.; Epping, K.; Velty, A. J. Catal.
2004, 225, 316.(322) Warabi, Y.; Kusdiana, D.; Saka, S. Bioresour. Technol. 2003, 91,
283.(323) Demirbas, A. Energy ConV ers. Manage. 2002, 43, 2349.(324) Freedman, B.; Pryde, E. H.; Mounts, T. L. J. Am. Oil Chem. Soc.
1984, 61, 1638.(325) Mbaraka, I. K.; Shanks, B. H. J. Catal. 2005, 229, 365.(326) Haas, M. J.; McAloon, A. J.; Yee, W. C.; Foglia, T. A. Bioresour.
Technol. 2006, 97 , 671.(327) Schumacher, L. G.; Gerpen, J. V.; Adams, B. In Encyclopedia of
Energy; Cleveland, C. J., Ed.; Elsevier: London, 2004.(328) Sheehan, J.; Camobreco, V.; Dumefield, J.; Graboski, M.; Shapouri,
H. An Overview of Biodiesel and Petroleum Diesel Life Cycles;
BB Chemical Reviews Huber et al.

8/10/2019 Synthesis Transportation Fuels Biomass
http://slidepdf.com/reader/full/synthesis-transportation-fuels-biomass 55/55
Report No. NREL/TP-580-24772; National Renewable EnergyLaboratory, Golden, CO, 1998; http://www.osti.gov/bridge.
(329) Freedman, B.; Bagdy, M. O.; Callhan, T. J.; Ryan, T. W. Cetane Numbers of Fatty Esters, Fatty Alcohols, and Triglycerides Deter-mined in a Constant Volume Combustion Bomb, Society of Automo-tive Engineers, Warrendale, Pennsylvania, 1990.
(330) Bockey, D. In The Biodiesel Handbook ; Knothe, G., Krahl, J., Gerpen,J. V., Eds.; AOCS Press: Champaign, IL, 2005.
(331) Lima, D. G.; Soares, V. C. D.; Ribeiro, E. B.; Carvalho, D. A.;Cardoso, E. C. V.; Rassi, F. C.; Mundim, K. C.; Rubim, J. C.; Suarez,P. A. Z. J. Anal. Appl. Pyrolysis 2004, 71, 987.
(332) Schwab, A. W.; Dystra, G. J.; Selke, E.; Sorenson, S. C.; Pryde, E.
H. J. Am. Oil Chem. Soc. 1988, 65, 1781.(333) Milne, T. A.; Evans, R. J.; Nagle, N. Biomass 1990, 21, 219.(334) Twaiq, F. A.; Zabidi, N. A. M.; Bhatia, S. Ind. Eng. Chem. Res.
1999, 38 , 3230.(335) Billaud, F.; Dominguez, V.; Broutin, P.; Busson, C. J. Am. Oil Chem.
Soc. 1995, 72, 1149.(336) Monnier, J.; Tourigny, G.; Soveran, D. W.; Wong, A.; Hogan, E.
N.; Stumborg, M. USA 5705722, Natural Resources Canada, 1998.(337) Aalto, P.; Piirainen, O.; Kiiski, U. Finnish Patent 19971031, Nestey
Oy, Finland, 1997.
(338) Craig, W. K.; Soveran, D. W. U.S. Patent 4992605 USA, 1991.(339) Stumborg, M.; Wong, A.; Hogan, E. Bioresour. Technol. 1996, 56 ,
13.(340) Wong, A.; Hogan, E. Biomass: A Growth Opportunity in Green
Energy and Value-Added Products, Conference on August 29, 1999-September 2, 1999, Elsevier: Oakland, CA; p 837.
(341) Dunn, R. O. In The Biodiesel Handbook ; Knothe, G., Krahl, J.,Gerpen, J. V., Eds.; AOCS Press: Champaign, IL, 2005.
(342) Hirai, T.; Ikenaga, N.; Miyake, T.; Suzuki, T. Energy Fuels 2005,19, 1761.
(343) Haven S. Kesling, J.; Karas, L. J.; Frank J. Liotta, J. U.S. Patent
5308365, ARCO Chemical Technology, 1994.(344) Klepacova, K.; Mravec, D.; Bajus, M. Appl. Catal. A 2005, 294,141.
(345) Wyman, C. E. Annu. ReV . Energy EnV iron. 1999, 24, 189.(346) Elliott, D. C.; Schiefelbein, G. F. Preprints of PaperssAmerican
Chemical Society, Division of Fuel Chemistry, 1989; Vol 34;p 1160.
CR068360D
Synthesis of Transportation Fuels from Biomass PAGE EST: 54.3 Chemical Reviews BC