Embed Size (px)
Citation preview

Biological Product and HCT/P Deviation Reports – Annual Summary for Fiscal Year 2016
Table of Contents
I. Summary: ................................................................................................................................. 2
II. BPD Reports Submitted by Blood and Plasma Establishments: ....................................... 10
A. Most Frequent BPD Reports Submitted by Licensed Blood Establishments ............. 16 B. Most Frequent BPD Reports Submitted by Unlicensed Registered Blood
Establishments ...................................................................................................... 23 C. Most Frequent BPD Reports Submitted by Transfusion Services .............................. 27 D. Most Frequent BPD Reports Submitted by Source Plasma Establishments ............... 30
III. BPD Reports Submitted by Licensed Manufacturers of Biological Products Other Than Blood and Blood Components (Licensed Non-Blood) ....................................... 34
IV. HCT/P Deviation Reports Submitted by Manufacturers of 361 HCT/Ps .................... 36
V. Attachments ......................................................................................................................... 39
Attachment 1 - Table-Number of BPD Reports by Type of Blood and Souce Plasma Establishment
Attachment 2 - List of BPD Codes for Blood and Source Plasma Establishments Attachment 3 - Table-Number of BPD Reports by Type of Licensed Non-Blood Establishment Attachment 4 - List of BPD Codes for Licensed Non-Blood Establishments Attachment 5 - Table-Number of HCT/P Deviation Reports by Type of 361 HCT/P Establishment Attachment 6 - List of HCT/P Deviation Codes for 361 HCT/P Establishments Attachment 7 - List of Tables
VI. References .......................................................................................................................... 39

2
I. Summary: FDA requires reporting of certain deviations and unexpected events in manufacturing in accordance with 21 CFR 600.14, 606.171 or 1271.350(b). The following manufacturers, who had control over the product when a deviation or unexpected event occurred are required to submit Biological Product Deviation (BPD) reports to the Center for Biologics Evaluation and Research (CBER), if the safety, purity, or potency of a distributed product may be affected:
• Manufacturers of licensed biological products other than blood and blood components (licensed non-blood) who hold the biological product license [21 CFR 600.14];
• Licensed manufacturers of blood and blood components, including Source Plasma [21 CFR 606.171];
• Unlicensed registered blood establishments [21 CFR 606.171]; and • Transfusion services [21 CFR 606.171].
The following are required to submit deviation reports to CBER, if the deviation or unexpected event involving a distributed product is related to a Core Current Good Tissue Practice requirement [21 CFR 1271.150(b)] and related to the prevention of communicable disease transmission or HCT/P contamination:
• Manufacturers of nonreproductive Human Cells, Tissues, and Cellular and Tissue-Based Products (HCT/P) regulated by FDA solely under section 361 of the Public Health Service Act and 21 CFR Part 1271 [21 CFR 1271.350(b)],
Detailed information concerning deviation reporting, including guidance documents on BPD reporting for blood and plasma establishments (Ref. 1) and licensed manufacturers of biological products other than blood and blood components (Ref. 2), is available at http://www.fda.gov/BiologicsBloodVaccines/SafetyAvailability/ReportaProblem/BiologicalProductDeviations/default.htm. A draft guidance for deviation reporting for 361 HCT/Ps (Ref. 3) was published in December 2015, and may be found at http://www.fda.gov/BiologicsBloodVaccines/GuidanceComplianceRegulatoryInformation/Guidances/Tissue/default.htm This annual summary report provides an overview of the reports we received during the fiscal year, including detailed information regarding the number and types of deviation reports received. We provide combined data received over the last three fiscal years in an effort to compare data and highlight changes. Throughout the analysis, we report numbers from past reports, calculate changes, or consider aggregate counts from multiple BPD codes. These data may or may not be included in accompanying tables. Detailed counts for all BPD codes can be found in the attachments and past summary reports are available at http://www.fda.gov/BiologicsBloodVaccines/SafetyAvailability/ReportaProblem/BiologicalProductDeviations/ucm129757.htm.

3
Unfortunately, our system does not collect the necessary denominator data to calculate genuine rates when evaluating possible trends. Some perspective is gained by knowing that in calendar year 2011, an estimated 17.7 million whole blood and red blood cells products were collected and there were 21 million transfusions in the United States. 1 In calendar year 2013, an estimated 14.2 million whole blood and red blood cells products were collected and there were 19 million transfusions in the United States. 2 In addition, there were 29.4 million Source Plasma donations in 2013, 32.6 million Source Plasma donations in 2014, and 35.5 million Source Plasma donations in 2015 made in the U.S.3 During fiscal year 2016 (hereafter FY16), October 1, 2015, through September 30, 2016, CBER’s Office of Compliance and Biologics Quality/Division of Inspections and Surveillance entered 51,229 deviation reports into the BPD database (Table 1):
• We received more than 51,229 reports, but this summary does not capture data for reports that did not meet the reporting threshold. We notified the reporter when a report was not required.
• There was a 10.0% (4,642 reports) increase in the number of reports we received in FY16 compared to FY15 (Table 2).
o Blood and Source Plasma establishments submitted 4,546 more reports in FY16 compared to FY15 (Table 2). Licensed blood establishments submitted four more reports in FY16. Unlicensed registered blood establishments submitted 482 more reports in
FY16. Transfusion services submitted 130 more reports in FY16. Source Plasma establishments submitted 3,930 more reports in FY16.
o Manufacturers of licensed biological products other than blood and blood components submitted 93 more reports in FY16 compared to FY15 (Table 2). Allergenic manufacturers submitted seven more reports in FY16 Blood derivative manufacturers submitted 11 more reports in FY16. Licensed in-vitro diagnostic manufacturers submitted 33 more reports in
FY16. Vaccine manufacturers submitted 42 more reports in FY16. Licensed HCT/P manufacturers (351 HCT/P) submitted the same number
of reports in FY16 as in FY15.
1 Report of the US Department of Health and Human Services. The 2011 national blood collection and utilization
survey report. Washington, DC: US Department of Health and Human Services, Office of the Assistant Secretary of Health. http://www.hhs.gov/ash/bloodsafety/nbcus/index.html
2 Chung, K.-W., Basavaraju, S. V., Mu, Y., van Santen, K. L., Haass, K. A., Henry, R., Berger, J. and Kuehnert, M. J. (2016), Declining blood collection and utilization in the United States. Transfusion. doi: 10.1111/trf.13644 3 Plasma Protein Therapeutics Association at http://pptaglobal.org/plasma/plasma-collection
4
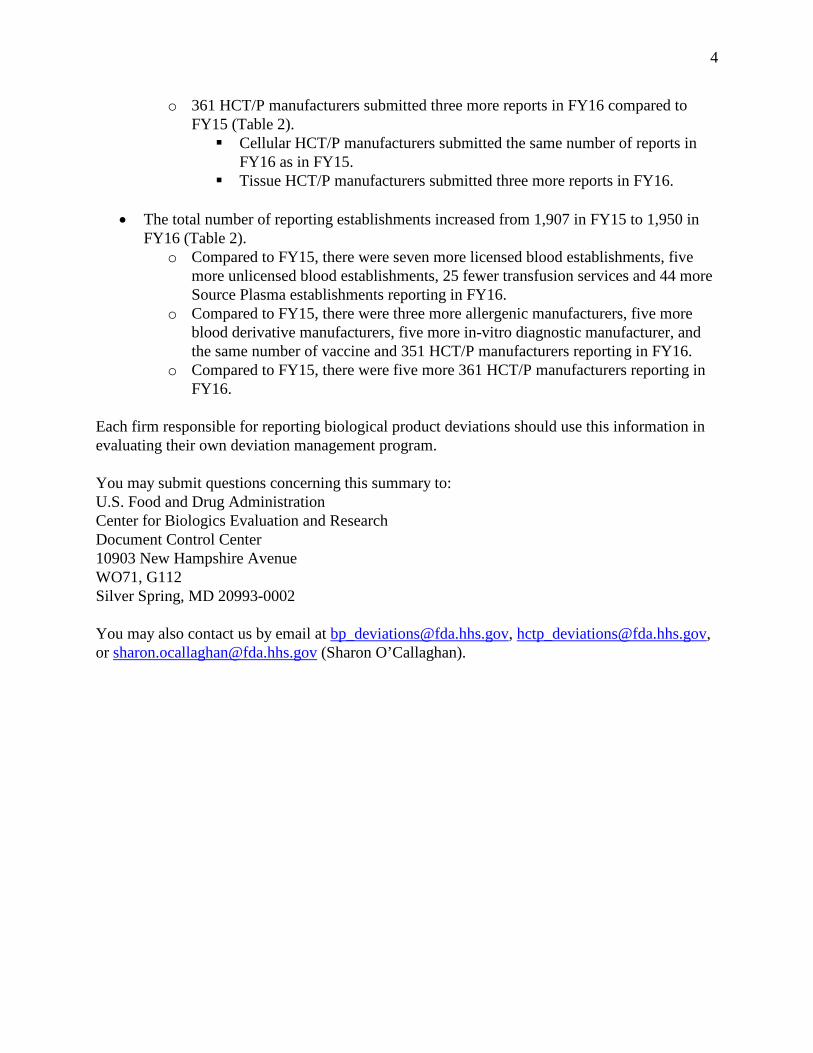
o 361 HCT/P manufacturers submitted three more reports in FY16 compared to FY15 (Table 2). Cellular HCT/P manufacturers submitted the same number of reports in
FY16 as in FY15. Tissue HCT/P manufacturers submitted three more reports in FY16.
• The total number of reporting establishments increased from 1,907 in FY15 to 1,950 in
FY16 (Table 2). o Compared to FY15, there were seven more licensed blood establishments, five
more unlicensed blood establishments, 25 fewer transfusion services and 44 more Source Plasma establishments reporting in FY16.
o Compared to FY15, there were three more allergenic manufacturers, five more blood derivative manufacturers, five more in-vitro diagnostic manufacturer, and the same number of vaccine and 351 HCT/P manufacturers reporting in FY16.
o Compared to FY15, there were five more 361 HCT/P manufacturers reporting in FY16.
Each firm responsible for reporting biological product deviations should use this information in evaluating their own deviation management program. You may submit questions concerning this summary to: U.S. Food and Drug Administration Center for Biologics Evaluation and Research Document Control Center 10903 New Hampshire Avenue WO71, G112 Silver Spring, MD 20993-0002 You may also contact us by email at [email protected], [email protected], or [email protected] (Sharon O’Callaghan).

5
Total Deviation Reports FY16
Table 1 Establishment Type
Number Of Reporting Establishments
Total Reports Received
Potential Recalls3
#Reports % Potential Recall Blood/Plasma Manufacturers Licensed Blood Establishments 226(98*) 18,664 467 2.5% Unlicensed Blood Establishments1 393 3,575 23 0.6% Transfusion Services2 644 1,956 0 0.0% Source Plasma Establishments 506(20*) 26,124 96 0.4% Sub-Total 1,769 50,319 586 1.2% Licensed Non-Blood Manufacturers Allergenic 6(6*) 89 4 4.5% Blood Derivative 30(23*) 134 5 3.7% In Vitro Diagnostic 14(14*) 144 0 0.0% Vaccine 24(18*) 265 0 0.0% 351 HCT/P 5(4*) 19 0 0.0% Sub-Total 79(65*) 651 9 1.4% 361 HCT/P Manufacturers Cellular HCT/P 55 134 0 0.0% Tissue HCT/P 47 125 17 13.6% Sub-Total 102 259 17 6.6% Total 1,950 51,229 612 1.2% 1Unlicensed Blood Establishments – unlicensed blood establishments that perform manufacturing of blood and blood components are required to register with FDA. 2Transfusion Services – blood banks that perform limited blood and blood component manufacturing (e.g. pooling, thawing, compatibility testing), may or may not register with FDA. 3Percent of Potential Recalls calculated for each establishment type (#potential recalls/#total reports) *Number of license holders; one or more establishments operate under one biologics license.
6
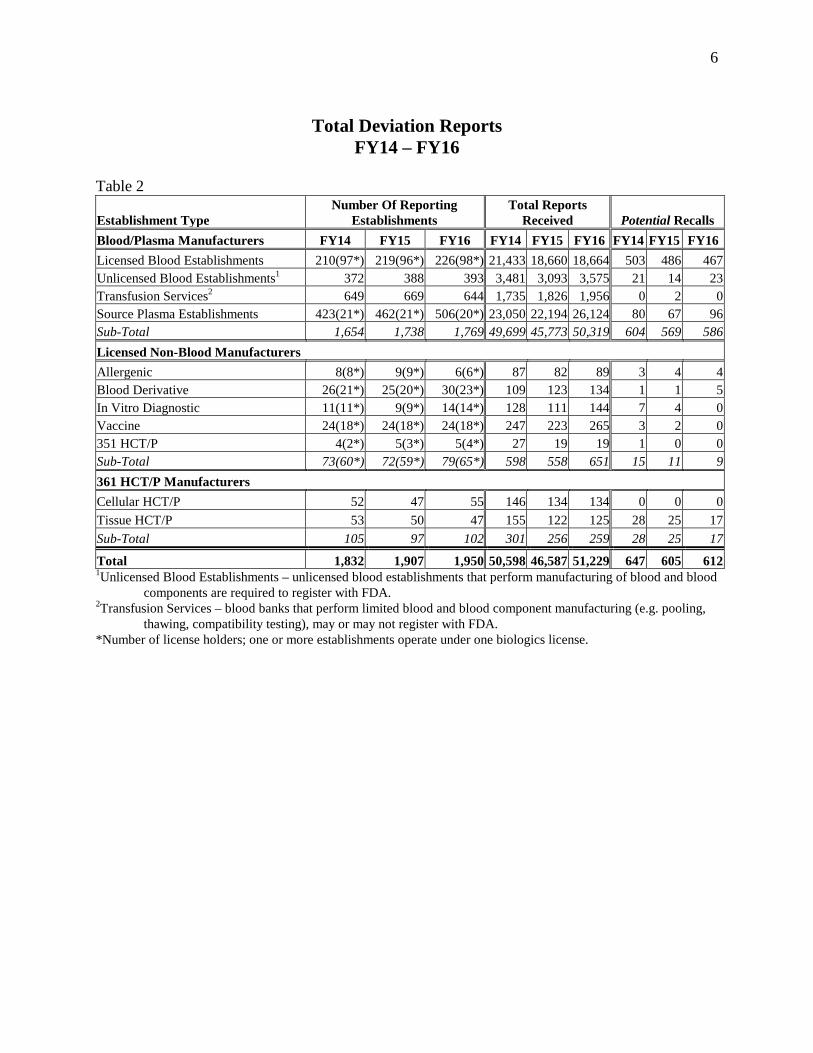
Total Deviation Reports
FY14 – FY16 Table 2
Establishment Type Number Of Reporting
Establishments Total Reports
Received Potential Recalls Blood/Plasma Manufacturers FY14 FY15 FY16 FY14 FY15 FY16 FY14 FY15 FY16 Licensed Blood Establishments 210(97*) 219(96*) 226(98*) 21,433 18,660 18,664 503 486 467 Unlicensed Blood Establishments1 372 388 393 3,481 3,093 3,575 21 14 23 Transfusion Services2 649 669 644 1,735 1,826 1,956 0 2 0 Source Plasma Establishments 423(21*) 462(21*) 506(20*) 23,050 22,194 26,124 80 67 96 Sub-Total 1,654 1,738 1,769 49,699 45,773 50,319 604 569 586 Licensed Non-Blood Manufacturers Allergenic 8(8*) 9(9*) 6(6*) 87 82 89 3 4 4 Blood Derivative 26(21*) 25(20*) 30(23*) 109 123 134 1 1 5 In Vitro Diagnostic 11(11*) 9(9*) 14(14*) 128 111 144 7 4 0 Vaccine 24(18*) 24(18*) 24(18*) 247 223 265 3 2 0 351 HCT/P 4(2*) 5(3*) 5(4*) 27 19 19 1 0 0 Sub-Total 73(60*) 72(59*) 79(65*) 598 558 651 15 11 9 361 HCT/P Manufacturers Cellular HCT/P 52 47 55 146 134 134 0 0 0 Tissue HCT/P 53 50 47 155 122 125 28 25 17 Sub-Total 105 97 102 301 256 259 28 25 17
Total 1,832 1,907 1,950 50,598 46,587 51,229 647 605 612 1Unlicensed Blood Establishments – unlicensed blood establishments that perform manufacturing of blood and blood
components are required to register with FDA. 2Transfusion Services – blood banks that perform limited blood and blood component manufacturing (e.g. pooling,
thawing, compatibility testing), may or may not register with FDA. *Number of license holders; one or more establishments operate under one biologics license.
7
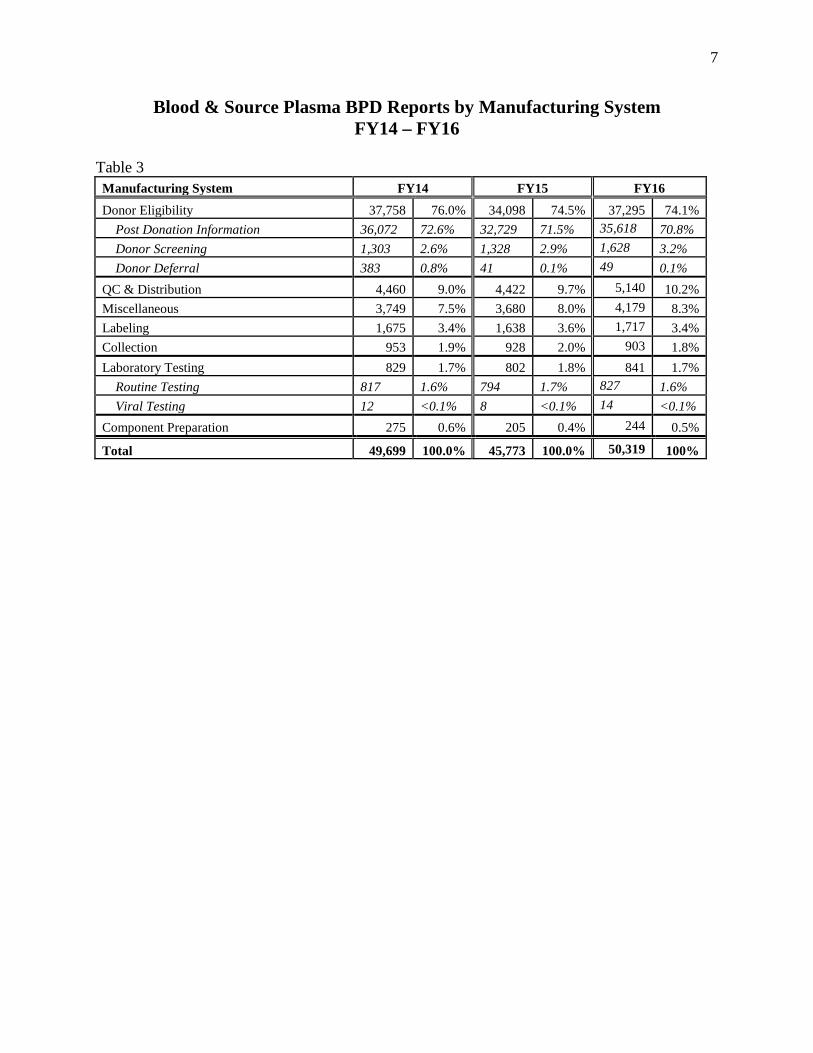
Blood & Source Plasma BPD Reports by Manufacturing System FY14 – FY16
Table 3 Manufacturing System FY14 FY15 FY16 Donor Eligibility 37,758 76.0% 34,098 74.5% 37,295 74.1% Post Donation Information 36,072 72.6% 32,729 71.5% 35,618 70.8% Donor Screening 1,303 2.6% 1,328 2.9% 1,628 3.2% Donor Deferral 383 0.8% 41 0.1% 49 0.1% QC & Distribution 4,460 9.0% 4,422 9.7% 5,140 10.2% Miscellaneous 3,749 7.5% 3,680 8.0% 4,179 8.3% Labeling 1,675 3.4% 1,638 3.6% 1,717 3.4% Collection 953 1.9% 928 2.0% 903 1.8% Laboratory Testing 829 1.7% 802 1.8% 841 1.7% Routine Testing 817 1.6% 794 1.7% 827 1.6% Viral Testing 12 <0.1% 8 <0.1% 14 <0.1% Component Preparation 275 0.6% 205 0.4% 244 0.5%
Total 49,699 100.0% 45,773 100.0% 50,319 100%
8
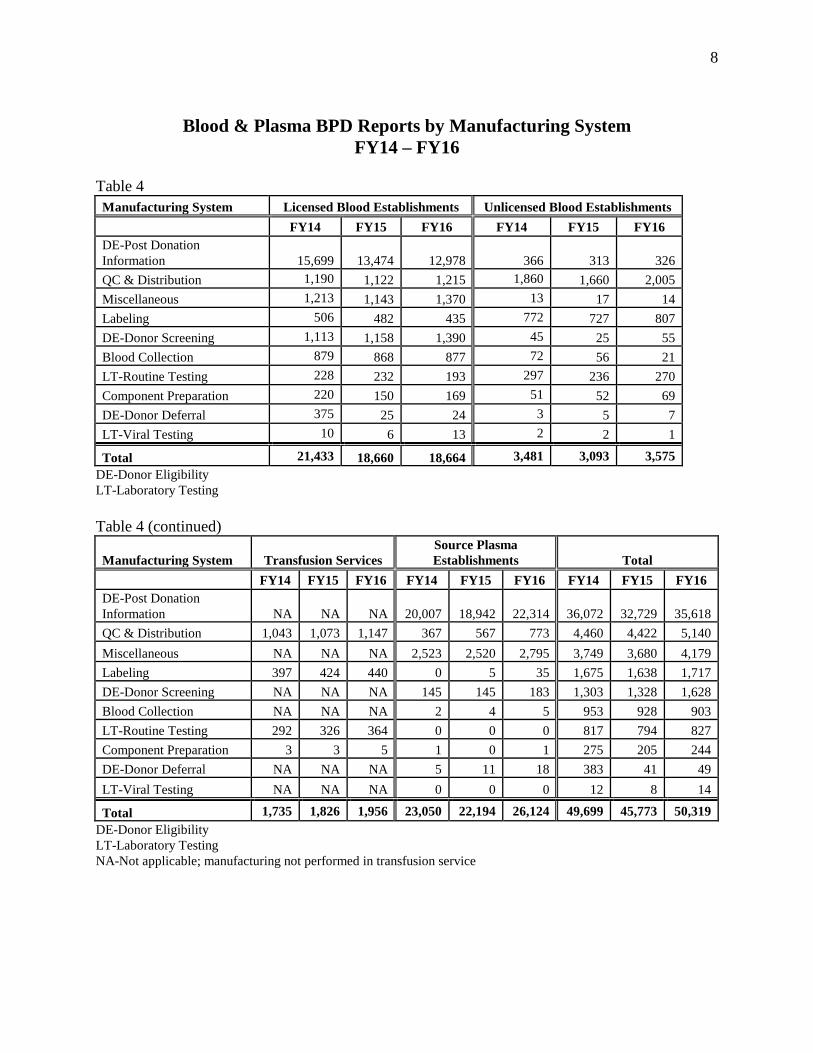
Blood & Plasma BPD Reports by Manufacturing System
FY14 – FY16 Table 4 Manufacturing System Licensed Blood Establishments Unlicensed Blood Establishments FY14 FY15 FY16 FY14 FY15 FY16 DE-Post Donation Information 15,699 13,474 12,978 366 313 326 QC & Distribution 1,190 1,122 1,215 1,860 1,660 2,005 Miscellaneous 1,213 1,143 1,370 13 17 14 Labeling 506 482 435 772 727 807 DE-Donor Screening 1,113 1,158 1,390 45 25 55 Blood Collection 879 868 877 72 56 21 LT-Routine Testing 228 232 193 297 236 270 Component Preparation 220 150 169 51 52 69 DE-Donor Deferral 375 25 24 3 5 7 LT-Viral Testing 10 6 13 2 2 1
Total 21,433 18,660 18,664 3,481 3,093 3,575 DE-Donor Eligibility LT-Laboratory Testing Table 4 (continued)
Manufacturing System Transfusion Services Source Plasma Establishments Total
FY14 FY15 FY16 FY14 FY15 FY16 FY14 FY15 FY16 DE-Post Donation Information NA NA NA 20,007 18,942 22,314 36,072 32,729 35,618 QC & Distribution 1,043 1,073 1,147 367 567 773 4,460 4,422 5,140 Miscellaneous NA NA NA 2,523 2,520 2,795 3,749 3,680 4,179 Labeling 397 424 440 0 5 35 1,675 1,638 1,717 DE-Donor Screening NA NA NA 145 145 183 1,303 1,328 1,628 Blood Collection NA NA NA 2 4 5 953 928 903 LT-Routine Testing 292 326 364 0 0 0 817 794 827 Component Preparation 3 3 5 1 0 1 275 205 244 DE-Donor Deferral NA NA NA 5 11 18 383 41 49 LT-Viral Testing NA NA NA 0 0 0 12 8 14
Total 1,735 1,826 1,956 23,050 22,194 26,124 49,699 45,773 50,319 DE-Donor Eligibility LT-Laboratory Testing NA-Not applicable; manufacturing not performed in transfusion service

9
Licensed Non-Blood Deviation Reports by Manufacturing System FY14 – FY16
Table 5 Manufacturing System Allergenic Blood Derivative In Vitro Diagnostic FY14 FY15 FY16 FY14 FY15 FY16 FY14 FY15 FY16 Product Specifications 81 69 71 33 35 57 76 66 97 Quality Control & Distribution 0 0 1 14 22 18 19 20 29 Labeling 5 6 11 8 2 11 12 14 4 Process Controls 0 2 2 31 27 18 12 3 4 Testing 1 4 4 14 23 13 2 3 6 Miscellaneous 0 0 0 1 7 2 1 1 1 Incoming Material 0 1 0 8 7 15 6 4 3 Total 87 82 89 109 123 134 128 111 144 Table 5 (continued) Manufacturing System Vaccine 351 HCT/P Total FY14 FY15 FY16 FY14 FY15 FY16 FY14 FY15 FY16 Product Specifications 84 74 103 8 8 2 282 252 330 Quality Control & Distribution 48 30 46 1 0 0 82 72 94 Labeling 29 22 17 15 8 14 69 52 57 Process Controls 14 20 40 0 1 0 57 53 64 Testing 36 43 21 3 2 3 56 75 47 Miscellaneous 25 20 25 0 0 0 27 28 28 Incoming Material 11 14 13 0 0 0 25 26 31 Total 247 223 265 27 19 19 598 558 651
361 HCT/P Deviation Reports by Manufacturing System FY14 – FY16
Table 6 Manufacturing System Cellular HCT/Ps Tissue HCT/Ps Total FY14 FY15 FY16 FY14 FY15 FY16 FY14 FY15 FY16 Processing & Processing Controls 76 71 75 14 5 13 90 76 88 Receipt, Pre-Distribution, Shipment & Distribution 57 48 37 22 21 22 79 69 59 Donor Eligibility 1 0 0 61 39 53 62 39 53 Donor Screening 4 0 7 31 35 13 35 35 20 Donor Testing 1 2 1 7 9 16 8 11 17 Recovery 1 7 7 2 3 3 3 10 10 Supplies and Reagents 4 6 5 3 1 3 7 7 8 Storage 2 0 2 5 4 1 7 4 3 Equipment 0 0 0 1 0 1 1 0 1 Labeling Controls 0 0 0 8 5 0 8 5 0 Environmental Control 0 0 0 1 0 0 1 0 0 Total 146 134 134 155 122 125 301 256 259
10
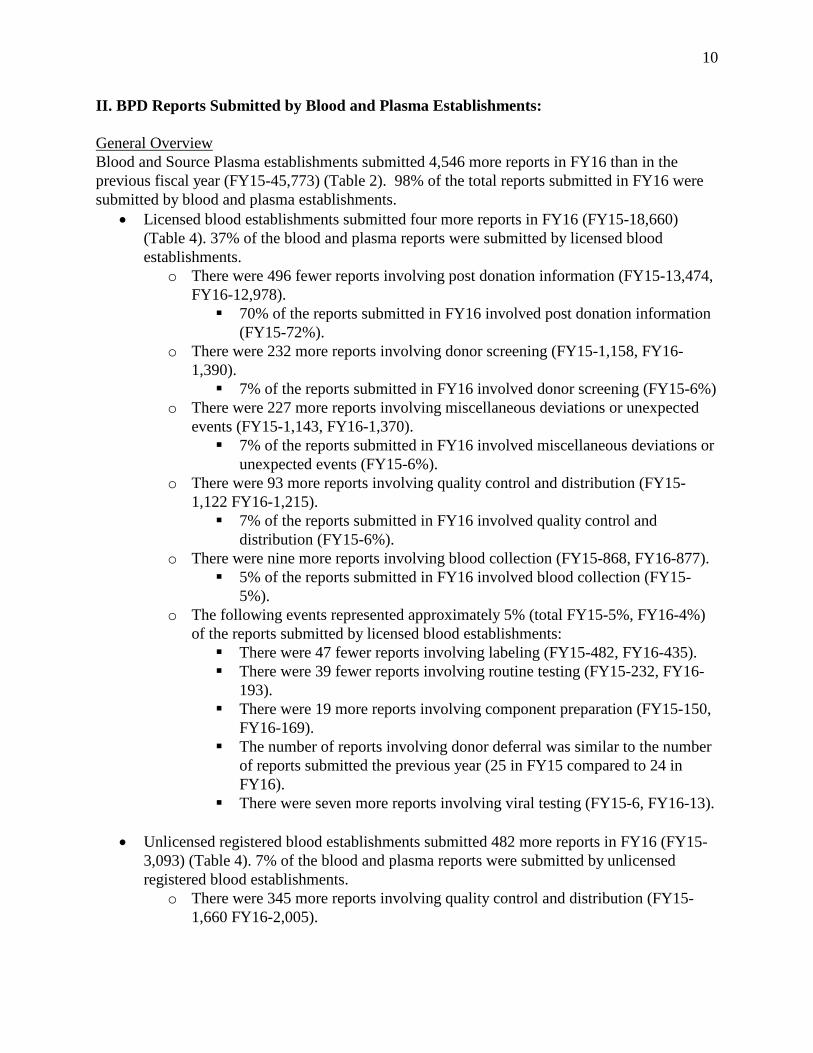
II. BPD Reports Submitted by Blood and Plasma Establishments: General Overview Blood and Source Plasma establishments submitted 4,546 more reports in FY16 than in the previous fiscal year (FY15-45,773) (Table 2). 98% of the total reports submitted in FY16 were submitted by blood and plasma establishments.
• Licensed blood establishments submitted four more reports in FY16 (FY15-18,660) (Table 4). 37% of the blood and plasma reports were submitted by licensed blood establishments.
o There were 496 fewer reports involving post donation information (FY15-13,474, FY16-12,978). 70% of the reports submitted in FY16 involved post donation information
(FY15-72%). o There were 232 more reports involving donor screening (FY15-1,158, FY16-
1,390). 7% of the reports submitted in FY16 involved donor screening (FY15-6%)
o There were 227 more reports involving miscellaneous deviations or unexpected events (FY15-1,143, FY16-1,370). 7% of the reports submitted in FY16 involved miscellaneous deviations or
unexpected events (FY15-6%). o There were 93 more reports involving quality control and distribution (FY15-
1,122 FY16-1,215). 7% of the reports submitted in FY16 involved quality control and
distribution (FY15-6%). o There were nine more reports involving blood collection (FY15-868, FY16-877).
5% of the reports submitted in FY16 involved blood collection (FY15-5%).
o The following events represented approximately 5% (total FY15-5%, FY16-4%) of the reports submitted by licensed blood establishments: There were 47 fewer reports involving labeling (FY15-482, FY16-435). There were 39 fewer reports involving routine testing (FY15-232, FY16-
193). There were 19 more reports involving component preparation (FY15-150,
FY16-169). The number of reports involving donor deferral was similar to the number
of reports submitted the previous year (25 in FY15 compared to 24 in FY16).
There were seven more reports involving viral testing (FY15-6, FY16-13).
• Unlicensed registered blood establishments submitted 482 more reports in FY16 (FY15-3,093) (Table 4). 7% of the blood and plasma reports were submitted by unlicensed registered blood establishments.
o There were 345 more reports involving quality control and distribution (FY15-1,660 FY16-2,005).

11
56% of the reports submitted in FY16 involved quality control and distribution (FY15-54%).
o There were 80 more reports involving labeling (FY15-727, FY16-807). 23% of the reports submitted in FY16 involved labeling (FY15-24%).
o There were 13 more reports involving post donation information (FY15-313, FY16-326). 9% of the reports submitted in FY16 involved post donation information
(FY15-10%). o There were 34 more reports involving routine testing (FY15-236, FY16-270).
8% of the reports submitted in FY16 involved routine testing (FY15-8%). o The following events represented approximately 5% (total FY15-4%, FY16-5%)
of the report submitted by unlicensed registered blood establishments: There were 17 more reports involving component preparation (FY15-52,
FY16-69). There were 30 more reports involving donor screening (FY15-25, FY16-
55). There were 35 fewer reports involving blood collection (FY15-56, FY16-
21). The number of reports involving miscellaneous deviations or unexpected
events was similar to the number of reports submitted the previous year (17 in FY15 compared to 14 in FY16).
The number of reports involving donor deferral was similar to the number of reports submitted the previous year (five in FY15 compared to seven in FY16).
The number of reports involving viral testing was similar to the number of reports submitted the previous year (two in FY15 compared to one in FY16).
• Transfusion services submitted 130 more reports in FY16 (FY15-1,826) (Table 4). 4% of
the blood and plasma reports were submitted by transfusion service. o Transfusion services typically report few BPDs and may file no reports in a given
year. For example, 425 (66%) of those reporting in FY16 submitted one or two reports and only 116 (18%) transfusion services submitted more than five reports during FY16.
o There were 74 more reports involving quality control and distribution (FY-15-1,073, FY16-1,147). 59% of the reports submitted in FY16 involved quality control and
distribution (FY15-59%) o There were 16 more reports involving labeling (FY15-424, FY16-440).
22% of the reports submitted in FY16 involved labeling (FY15-23%) o There were 38 more reports involving routine testing (FY15-326, FY16-364).
19% of the reports submitted in FY16 involved routine testing (FY15-18%)

12
o The number of reports involving component preparation was similar to the number of reports submitted the previous year (three in FY15 compared to five in FY16).
• Source Plasma establishments submitted 3,930 more reports in FY16 (FY15-22,194)
(Table 4). 52% of the blood and Source Plasma reports were submitted by Source Plasma establishments. One Source Plasma center submitted 2,970 more reports in FY16. 248 reports submitted by that Source Plasma center were submitted by 18 locations licensed after FY15.
o There were 3,372 more reports involving post donation information (FY15-18,942, FY16-22,314). 85% of the reports submitted in FY16 involved post donation information
(FY15-85%). o There were 275 more reports involving miscellaneous deviations or unexpected
events (FY15-2,520, FY16-2,795). 11% of the reports submitted in FY16 involved miscellaneous deviations
or unexpected events (FY15-11%). o There were 206 more reports involving quality control and distribution (FY15-
567, FY16-773). 3% of the reports submitted in FY16 involved quality control and
distribution (FY15-3%). o The following events represented less than 5% (total FY15-1%, FY16-1%) of the
report submitted by Source Plasma establishments: There were 38 more reports involving donor screening (FY15-145, FY16-
183). There were 30 more reports involving labeling (FY15-five, FY16-35). There were seven more reports involving donor deferral (FY15-11, FY16-
18). The number of reports involving collection was similar to the number of
reports submitted the previous year (four in FY15 compared to five in FY16).
There were no reports involving component preparation submitted in FY15 and one report submitted in FY16.

13
Total BPDRs by Manufacturing System
Blood and Source Plasma Establishments FY16
Table 7
Manufacturing System Licensed Blood Establishments
Unlicensed Blood Establishments
Transfusion Services
Source Plasma Establishments
Total
DE-Post Donation Information 12,978 326 NA 22,314 35,618 70.8% QC & Distribution 1,215 2,005 1,147 773 5,140 10.2% Miscellaneous 1,370 14 NA 2,795 4,179 8.3% Labeling 435 807 440 35 1,717 3.4% DE-Donor Screening 1,390 55 NA 183 1,628 3.2% Blood Collection 877 21 NA 5 903 1.8% LT-Routine Testing 193 270 364 0 827 1.6% Component Preparation 169 69 5 1 244 0.5% DE-Donor Deferral 24 7 NA 18 49 0.1% LT-Viral Testing 13 1 NA 0 14 <0.1% Total 18,664 3,575 1,956 26,124 50,319 100% DE-Donor Eligibility LT-Laboratory Testing NA-Not applicable: manufacturing not performed in transfusion service

14
Post Donation Information Post donation information (PDI) continues to be the most frequently reported event associated with the manufacturing of blood and plasma products (71% of deviation reports) (Tables 3 and 7). The number of reports blood and plasma establishments submitted involving post donation information increased 9% from the previous fiscal year (FY15-32,729, FY16-35,618) (Table 4). • Blood establishments submitted 483 fewer reports involving post donation information,
which is a decrease of 4%, in FY16 compared to FY15 (Table 8). o They submitted 39 fewer reports involving a donor who traveled to a malarial risk
area, 291 fewer reports involving a donor who traveled to a vCJD risk area, 128 fewer reports involving a donor who received a tattoo and/or piercing, and 119 more reports involving a donor with a history of taking finasteride, Tegison, Accutane, or Avodart, Jalyn, or Absorica, and 20 more reports involving a male donor who had a history of sex with another male.
• Source Plasma establishments submitted 3,372 more reports involving post donation information, which is an increase of 18% in FY16 compared to FY15 (Table 8).
o They submitted 1,140 more reports involving a donor who had a history of tattoo and/or piercing, 565 more reports involving a donor who tested positive for a viral maker at another center, 656 more reports involving a donor who had a positive drug screen, and 344 more reports involving a donor who had a history of incarceration.
Table 8 illustrates the major differences in post donation information reports from FY14 to FY16. Only the five most frequently reported categories are included in the table.
PDI Reports Submitted by Blood and Source Plasma Establishments Table 8
Blood Establishments FY14 FY15 FY16 Post Donation Information (PD) – total 16,065 13,787 13,304
Donor had a history of travel to malarial risk area (PD1236) 5,460 4,223 4,184 Donor had a history of travel to vCJD risk area (PD1242) 2,684 2,393 2,102 Donor had history of male to male sex (PD1214) 1,041 922 942 Donor received finasteride, Tegison, Accutane, or Avodart, Jalyn, or Absorica (PD1245) 829 761 880 Donor received tattoo and/or piercing (PD1259) 1,253 973 845 Source Plasma Establishments FY14 FY15 FY16 Post Donation Information (PD) – total 20,007 18,942 22,314
Donor received tattoo and/or piercing (PD1259) 13,303 12,975 14,115 Donor tested reactive at another center, specific testing unknown (PD1114) 1,119 1,116 1,681 Positive drug screen (PD1254) 865 925 1,581 Donor had a history of incarceration (PD1249) 826 844 1,187 Intimate contact with risk for a relevant transfusion-transmitted infection - HCV (PD1264) 1,039 666 668
Note: All post donation information reports are not included in this table.

15
Miscellaneous The total number of miscellaneous reports increased 14% from the previous fiscal year (FY15-3,680, FY16-4,179) (Table 4). The majority of these reports involved the distribution of a unit that was collected from a donor who subsequently tested confirmed positive for a viral marker on a later donation (FY15-3,652, FY16-4,155). • The number of these reports submitted by blood establishments increased 20% (FY15-
1,132, FY16-1,360) from the previous fiscal year (Table 9). • The number of these reports submitted by Source Plasma establishments increased
11% (FY15-2,520, FY16-2,795) from the previous fiscal year (Table 9).
Table 9 illustrates the number of reports from FY12 to FY16 related to units collected from donors who subsequently tested confirmed positive for selected viral markers (lookback). Note: All lookback reports are not included in these tables.
Viral Marker Lookback Reports
Submitted by Blood and Source Plasma Establishments Table 9
Blood Establishments FY12 FY13 FY14 FY15 FY16 Lookback; Subsequent unit confirmed positive (MI02) - total 927 1,140 1,202 1,132 1,360
HBV (MI0203) 140 343 412 568 435 HCV (MI0204) 506 470 421 321 319 HIV (MI0202) 180 200 191 129 127
Source Plasma Establishments FY12 FY13 FY14 FY15 FY16 Lookback; Subsequent unit confirmed positive (MI02) - total 1,988 2,093 2,523 2,520 2,795
HCV (MI0204) 1,270 1,435 1,643 1,677 1,806 HBV (MI0203) 472 390 578 508 593 HIV (MI0202) 243 264 296 316 391

16
A. Most Frequent BPD Reports Submitted by Licensed Blood Establishments4 Of the 18,664 reports (Table 7) submitted by licensed blood establishments, 12,978 (69.5%) reports involved post donation information (Table 10).
• The number of these reports decreased 4% (FY15-13,474). • The number of reports in which a donor or third party provided subsequent information
related to high risk behavior or history decreased 4% (FY15-12,445). o The number of reports in which a donor or third party provided subsequent
information regarding receiving finasteride, Tegison, Accutane, Avodart, Jalyn, or Absorica increased 15% (FY15-746).
o The number of reports in which a donor or third party provided subsequent information regarding male to male sex increased 2% (FY15-905).
o The number of reports in which a donor or third party provided subsequent information regarding received a tattoo and/or piercing decreased 13% (FY15-951).
o The number of reports in which a donor or third party provided subsequent information regarding travel to a vCJD risk area decreased 12% (FY15-2,311).
o The number of reports in which a donor or third party provided subsequent information regarding travel to a malaria risk area decreased 1% (FY15-4,137).
• The number of reports in which a donor or third party provided subsequent information related to a post donation illness increased 5% (FY15-885).
o The number of reports in which a donor had a fever or diarrhea post donation was similar to the number of reports submitted the previous year (463 in FY15 compared to 459 in FY16).
• The number of reports in which a donor or third party provided subsequent information related to the donor testing positive decreased from 115 in FY15 to 102 in FY16.
4 Licensed blood establishments do not include Source Plasma establishments, for the purpose of this summary.

17
Most Frequent BPD Reports - Post Donation Information From Licensed Blood Establishments
Table 10 POST DONATION INFORMATION (PD) 12,978 # Reports % of Total (PD)
Behavior/History 11,908 91.8% Travel to malaria endemic area/history of malaria 4,079 31.4% Risk factors associated with Creutzfeldt-Jakob Disease (CJD) – travel 2,030 15.6% Male donor had sex with another man 923 7.1% Received finasteride, Tegison, Accutane, Avodart, Jalyn, or Absorica 858 6.6% Donor received tattoo and/or piercing 829 6.4%
Illness 932 7.2% Post donation illness (not hepatitis, HIV, HTLV-I, STD, cancer or cold/flu related) 837 6.4% Fever/diarrhea 459 3.5% Infection 242 1.9% Post donation diagnosis or symptoms of HIV, or reactive test for HIV 32 0.2% Post donation diagnosis or symptoms of HCV, or reactive test for HCV 25 0.2% Post donation diagnosis or symptoms of non-specific hepatitis, reactive test for non-specific hepatitis, or elevated liver enzymes 12 0.1%
Testing * 102 0.8% Tested reactive for HIV prior to donation 45 0.3% Tested reactive for Hepatitis B prior to donation 18 0.1% Tested reactive for Hepatitis C prior to donation 17 0.1% Tested reactive for HTLV prior to donation 8 0.1%
Not specifically related to high risk behavior 36 0.3% Donated to be tested or called back for test results 19 0.1% Donor does not want their blood used 16 0.1%
*Includes testing positive for viral marker prior to donation at another location Note: All post donation information reports are not included in this table.

18
Of the 18,664 reports (Table 7) submitted by licensed blood establishments, 1,390 (7.4%) reports involved donor screening deviations or unexpected events (Table 11).
• The number of these reports increased 20% (FY15-1,158). • The number of reports in which the deferral screening was not done or incorrectly
performed, including using the incorrect donor identification, to determine if the donor was previously deferred increased 34% (FY15-675).
o 90% of these reports involve donors who were not previously deferred • The number of reports in which the donor record was incomplete or incorrect increased
10% (FY15-253). o 92% of these reports involve donor history question that were incomplete or not
documented. Most of these related to asking the incorrect gender specific questions.
• The number of reports in which the donor gave a history that warranted deferral or follow up and was not deferred or follow up questions were not asked, decreased from 208 in FY15 to 187 in FY16.
Most Frequent BPD Reports – Donor Screening
From Licensed Blood Establishments Table 11
DONOR SCREENING (DS) 1,390 # Reports % of Total (DS) Deferral screening not done or incorrectly performed, including incorrect ID used during search 906 65.2% Donor not previously deferred 818 58.8% Donor previously deferred due to history 50 3.6% Donor previously deferred due to testing 38 2.7%
Donor record incomplete or incorrect 278 20.0% Donor history questions 256 18.4% Incorrect gender specific question asked or incorrect answer 150 10.8% Donor identification 12 0.9% Donor signature missing 6 0.4% Donor confidentiality compromised 2 0.1%
Donor gave history which warranted deferral or follow up and was not deferred 187 13.5% Travel to malaria endemic area/history of malaria 96 6.9% Risk factors associated with Creutzfeldt-Jakob Disease (vCJD) - travel 41 2.9%
Donor did not meet acceptance criteria 19 1.4% Hemoglobin or Hematocrit unacceptable or not documented or testing was performed incorrectly 7 0.5% Medical review or physical not performed or inadequate 7 0.5%
Note: All donor screening reports are not included in this table.

19
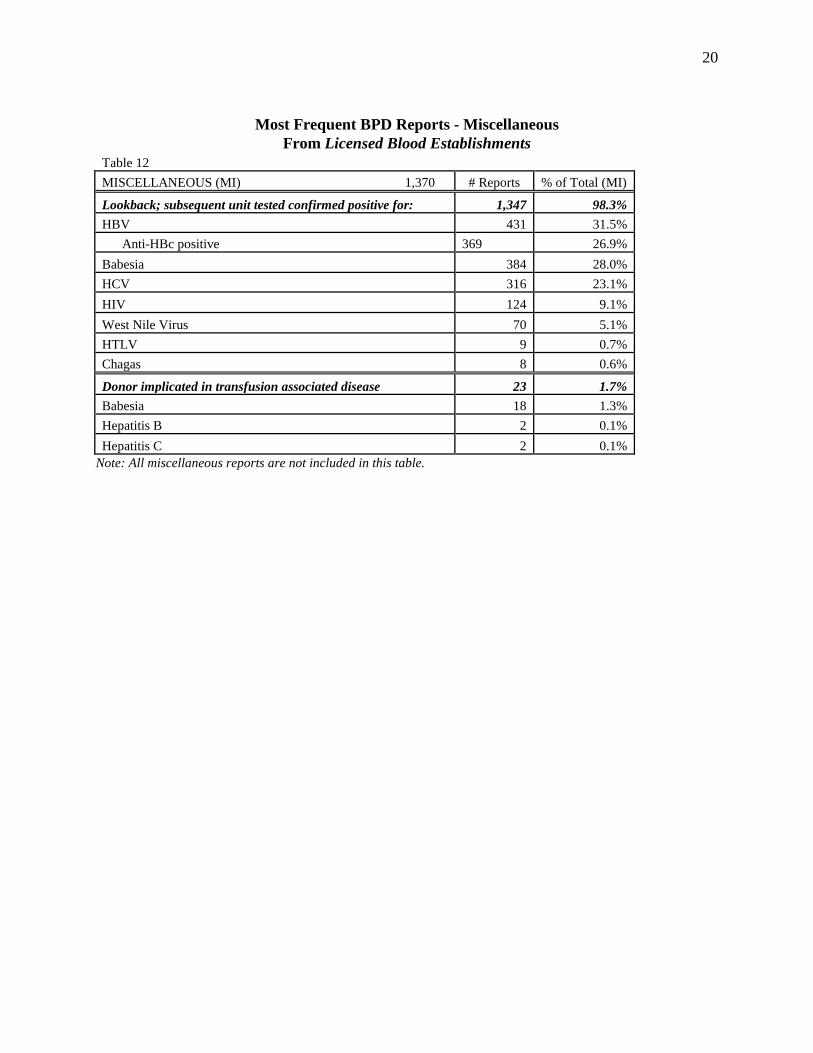
Of the 18,664 reports (Table 7) submitted by licensed blood establishments, 1,370 (7.3%) reports involved miscellaneous deviations or unexpected events (Table 12).
• The number of these reports increased 20% (FY15-1,143). • The number of reports in which distributed products were collected from a donor who
subsequently tested confirmed positive for a viral marker increased 21% (FY15-1,117). o The number of reports in which a donor subsequently tested confirmed positive for
HCV was similar to the number of reports submitted the previous year (321 in FY15 compared to 316 in FY16).
o The number of reports in which a donor subsequently tested confirmed positive for HIV was similar to the number of reports submitted the previous year (127 in FY15 compared to 124 in FY16).
o The number of reports in which a donor subsequently tested confirmed positive for HBV decreased from 566 in FY15 to 431 in FY16.
o The number of reports in which a donor tested repeat reactive on two occasions for anti-HBc, decreased from 504 in FY15 to 369 in FY16.
o The number of reports in which a donor subsequently tested positive (using an IND test) for Babesia increased from five in FY15 to 384 in FY16.
• The number of reports in which a donor was either implicated in or not ruled out of a transfusion associated disease was similar to the number of reports submitted the previous year (26 in FY15 compared to 23 in FY16).
o There were 18 reports submitted in FY16 (20 in FY15) involving Babesia. o There were four reports submitted in FY16 (three in FY15) involving Hepatitis.
There were two reports involving Hepatitis C submitted in FY16 (FY15-one). In one case, a donor was identified as positive for HCV.
There were two reports involving Hepatitis B submitted in FY16 (FY15-two).
20
Most Frequent BPD Reports - Miscellaneous
From Licensed Blood Establishments Table 12
MISCELLANEOUS (MI) 1,370 # Reports % of Total (MI)
Lookback; subsequent unit tested confirmed positive for: 1,347 98.3% HBV 431 31.5% Anti-HBc positive 369 26.9% Babesia 384 28.0% HCV 316 23.1% HIV 124 9.1% West Nile Virus 70 5.1% HTLV 9 0.7% Chagas 8 0.6%
Donor implicated in transfusion associated disease 23 1.7% Babesia 18 1.3% Hepatitis B 2 0.1% Hepatitis C 2 0.1%
Note: All miscellaneous reports are not included in this table.

21
Of the 18,664 reports (Table 7) submitted by licensed blood establishments, 1,215 (6.5%) reports involved quality control and distribution deviations or unexpected events (Table 13).
• The number of these reports increased 8% (FY15-1,122). • The number of reports involving the distribution of a product that did not meet
specifications increased from 623 in FY15 to 790 in FY16. o The number of reports involving the release of a product in which product QC
was unacceptable, not performed, not documented, or incomplete increased from 405 in FY15 to 557 in FY16. The number of reports related to bacterial detection testing increased from 238 in FY15 to 305 in FY16.
• The number of reports involving shipping and storage decreased from 268 in FY15 to 170 in FY16.
• The number of reports involving distribution procedures not performed in accordance with blood bank transfusion service’s specification increased from 128 in FY15 to 143 in FY16.
Most Frequent BPD Reports –Quality Control & Distribution
From Licensed Blood Establishments
Table 13 QC & DISTRIBUTION (QC) 1,215 # Reports % of Total (QC)
Distribution of product that did not meet specifications 790 65.0% Product QC unacceptable, not performed, not documented, or incomplete 557 45.9% Bacterial detection testing 305 25.1% White Blood Cell count 102 8.4% Product in which instrument QC, calibration, or validation was unacceptable, incomplete, not performed or documented 53 4.4% Product identified as unsuitable due to a donor screening deviation or unexpected event 33 2.7% Product identified as unsuitable due to a collection deviation or unexpected event 32 2.6% Product identified as unsuitable due to a component preparation deviation or unexpected event 29 2.4% Product in which specification other than QC was not met 25 2.1% Shipping and storage 170 14.0% Product not packaged in accordance with specifications or no documentation that product was packed appropriately 48 4.0% No documentation that product was shipped or stored at appropriate temperature 39 3.2% Product arrived at consignee at unacceptable temperature 26 2.1% Distribution procedures not performed in accordance with blood bank transfusion service’s specifications 143 11.8% Improper product selected for patient 29 2.4% Product not documented or incorrectly documented as issued in the computer 26 2.1% Product not irradiated as required 20 1.6% Improper ABO or Rh type selected for patient 20 1.6% Testing not performed, incompletely performed, or not documented 64 5.3% Antigen screen 19 1.6% ABO and/or Rh 12 1.0%
Note: All post donation information reports are not included in this table.
22
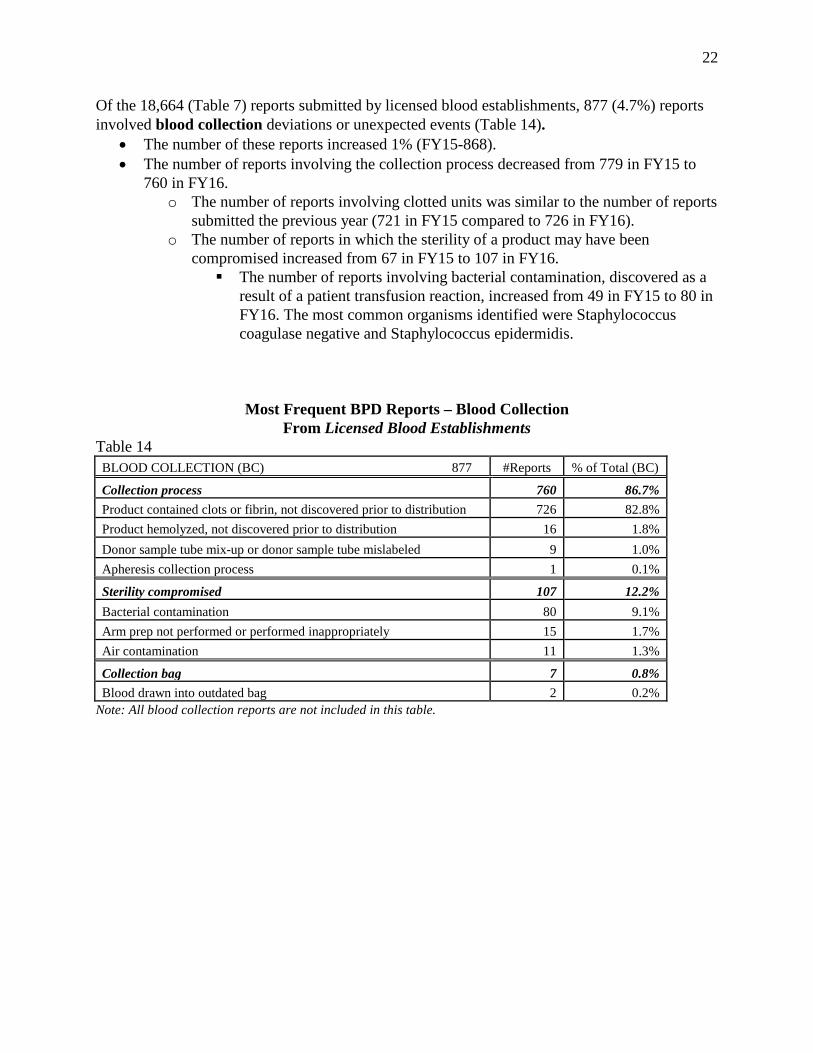
Of the 18,664 (Table 7) reports submitted by licensed blood establishments, 877 (4.7%) reports involved blood collection deviations or unexpected events (Table 14).
• The number of these reports increased 1% (FY15-868). • The number of reports involving the collection process decreased from 779 in FY15 to
760 in FY16. o The number of reports involving clotted units was similar to the number of reports
submitted the previous year (721 in FY15 compared to 726 in FY16). o The number of reports in which the sterility of a product may have been
compromised increased from 67 in FY15 to 107 in FY16. The number of reports involving bacterial contamination, discovered as a
result of a patient transfusion reaction, increased from 49 in FY15 to 80 in FY16. The most common organisms identified were Staphylococcus coagulase negative and Staphylococcus epidermidis.
Most Frequent BPD Reports – Blood Collection From Licensed Blood Establishments
Table 14 BLOOD COLLECTION (BC) 877 #Reports % of Total (BC)
Collection process 760 86.7% Product contained clots or fibrin, not discovered prior to distribution 726 82.8% Product hemolyzed, not discovered prior to distribution 16 1.8% Donor sample tube mix-up or donor sample tube mislabeled 9 1.0% Apheresis collection process 1 0.1%
Sterility compromised 107 12.2% Bacterial contamination 80 9.1% Arm prep not performed or performed inappropriately 15 1.7% Air contamination 11 1.3%
Collection bag 7 0.8% Blood drawn into outdated bag 2 0.2%
Note: All blood collection reports are not included in this table.

23
B. Most Frequent BPD Reports Submitted by Unlicensed Registered Blood Establishments Of the 3,575 reports (Table 7) submitted by unlicensed registered blood establishments, 2,005 (56.1%) involved quality control and distribution deviations or unexpected events (Table 15).
• The number of these reports increased 21% (FY15-1,660). • The number of reports involving distribution procedures not performed in accordance
with the blood bank transfusion service’s specifications increased 26% (FY15-1,311). o The number of reports involving the release of a product that was not documented
or incorrectly documented as issued in the computer, which was the only method of documenting the visual and clerical checks at the time of distribution, increased 18% (FY15-681).
o The number of reports involving the product not irradiated as required increased from 157 in FY15 to 196 in FY16.
• The number of reports involving testing that was not performed, incompletely performed, or not documented decreased from 180 in FY15 to 169 in FY16.
Most Frequent BPD Reports - Quality Control & Distribution
From Unlicensed Registered Blood Establishments Table 15 QC & DISTRIBUTION (QC) 2,005 # Reports % of Total (QC) Distribution procedures not performed in accordance with blood bank transfusion service’s specifications 1,655 82.5% Product not documented or incorrectly documented as issued in the computer 803 40.0% Product not irradiated as required 196 9.8% Improper product selected for patient 195 9.7% Improper ABO or Rh type selected for patient 104 5.2% Procedure for issuing not performed or documented in accordance with specifications 94 4.7% Product issued to wrong patient 60 3.0% Testing not performed, incompletely performed, or not documented 169 8.4% Antibody screen or identification 39 1.9% Antigen screen 38 1.9% ABO and/or Rh 37 1.8% Compatibility 25 1.2%
Distribution of product that did not meet specifications 124 6.2% Product QC unacceptable, not performed, not documented or incomplete 39 1.9% Bacterial detection testing 18 0.9% Outdated product 30 1.5% Product in which instrument QC, calibration, or validation unacceptable, incomplete or not documented 28 1.4% Product in which specification other than QC not met 8 0.4% Shipping and storage 51 2.5% Temperature not recorded or unacceptable upon return, unit redistributed 18 0.9% No documentation that product was shipped or stored at appropriate temperature 18 0.9%
Note: All QC & distribution reports are not included in this table.

24
Of the 3,575 reports (Table 7) submitted by unlicensed registered blood establishments, 807 (22.6%) involved labeling deviations or unexpected events (Table 16).
• The number of these reports increased 11% (FY15-727). • The number of reports involving the crossmatch tag, tie tag, or transfusion record labeled
with incorrect or missing information increased 7% (FY15-516). o The number of reports involving the crossmatch tags or transfused records
switched, but both units were intended for the same patient increased from 144 in FY15 to 163 in FY16.
• The number of reports involving the unit labeled with incorrect or missing information increased from 211 in FY15 to 257 in FY16.
o The number of reports involving the expiration date extended or missing on the product label increased from 86 in FY15 to 110 in FY16.
o The number of reports involving the product type or code incorrect or missing on the product label increased from 25 in FY15 to 41 in FY16.
Most Frequent BPD Reports - Labeling
From Unlicensed Registered Blood Establishments
Table 16 LABELING (LA) 807 #Reports % of Total (LA) Crossmatch tag, tie tag, to transfusion record incorrect or missing information 550 68.2% Crossmatch tags or transfused records switched, both units intended for the same patient 163 20.2% Recipient identification incorrect or missing 133 16.5% Crossmatch tag, tie tag, or transfusion record incorrect or missing or attached to incorrect unit 48 5.9% Unit, lot, or pool number incorrect or missing 39 4.8% Expiration date or time extended or missing 38 4.7% Product type or code incorrect or missing 37 4.6% Labels applied to blood unit or product incorrect or missing information 257 31.8% Extended or missing expiration date or time 110 13.6% Product type or code incorrect or missing 41 5.1% Irradiation status incorrect or missing 34 4.2% HLA type incorrect or missing 20 2.5% Combination of incorrect or missing information 15 1.9% Donor/unit number or lot number incorrect or missing 12 1.5%
Note: All labeling reports are not included in this table.

25
Of the 3,575 reports (Table 7) submitted by unlicensed registered blood establishments, 326 (9.1%) reports involved post donation information (Table 17).
• The number of these reports increased 4% (FY15-313). • The number of reports in which a donor or third party provided subsequent information
related to high risk behavior or history increased from 300 in FY15 to 312 in FY16. o The number of reports in which a donor or third party provided subsequent
information regarding travel to a malarial risk area increased from 86 in FY15 to 105 in FY16.
o The number of reports in which a donor or third party provided subsequent information regarding travel to a vCJD risk area decreased from 82 in FY15 to 72 in FY16.
• The number of reports in which a donor or third party provided subsequent information related to post donation illness was similar to the number of reports submitted the previous year (eight in FY15 compared to 11 in FY16).
Most Frequent BPD Reports - Post Donation Information From Unlicensed Registered Blood Establishments
Table 17 POST DONATION INFORMATION (PD) 326 # Reports % of Total (PD)
Behavior/History 312 95.7% Travel to malaria endemic area/history of malaria 105 32.2% Risk factors associated with Creutzfeldt-Jakob Disease (vCJD) – travel 72 22.1% Received finasteride, Tegison, Accutane, Avodart, Jalyn, or Absorica 22 6.7% Male donor had sex with another man 19 5.8% Donor received tattoo and/or piercing 16 4.9%
Illness 11 3.4% Note: All post donation information reports are not included in this table.

26
Of the 3,575 reports (Table 7) submitted by unlicensed registered blood establishments, 270 (7.6%) reports involved routine testing deviations or unexpected events (Table 18).
• The number of these reports increased 14% (FY15-236). • The number of reports involving testing performed, interpreted or documented incorrectly
increased from 123 in FY15 to 159 in FY16. • The number of reports involving sample identification decreased from 66 in FY15 to 49
in FY16. • The number of reports involving unacceptable reagent QC or the use of expired reagents
increased from 47 in FY15 to 62 in FY16.
Most Frequent BPD Reports - Routine Testing
From Unlicensed Registered Blood Establishments
Table 18 ROUTINE TESTING (RT) 270 # Reports % of Total (RT)
Testing performed, interpreted, or documented incorrectly 159 58.9% Compatibility 68 25.2% Antibody screening or identification 47 17.4% Antigen typing 21 7.8% ABO and/or Rh 13 4.8%
Sample (used for testing) identification 49 18.1% Sample used for testing was incorrectly or incompletely labeled 30 11.1% Unsuitable sample used for testing (e.g., too old) 10 3.7% Incorrect sample tested 9 3.3%
Reagent QC unacceptable or expired reagents used 62 23.0% Antigen typing 18 6.7% Antibody screening or identification 13 4.8% Multiple testing 13 4.8% ABO and/or Rh 11 4.1%
Note: All routine testing reports are not included in this table.
27
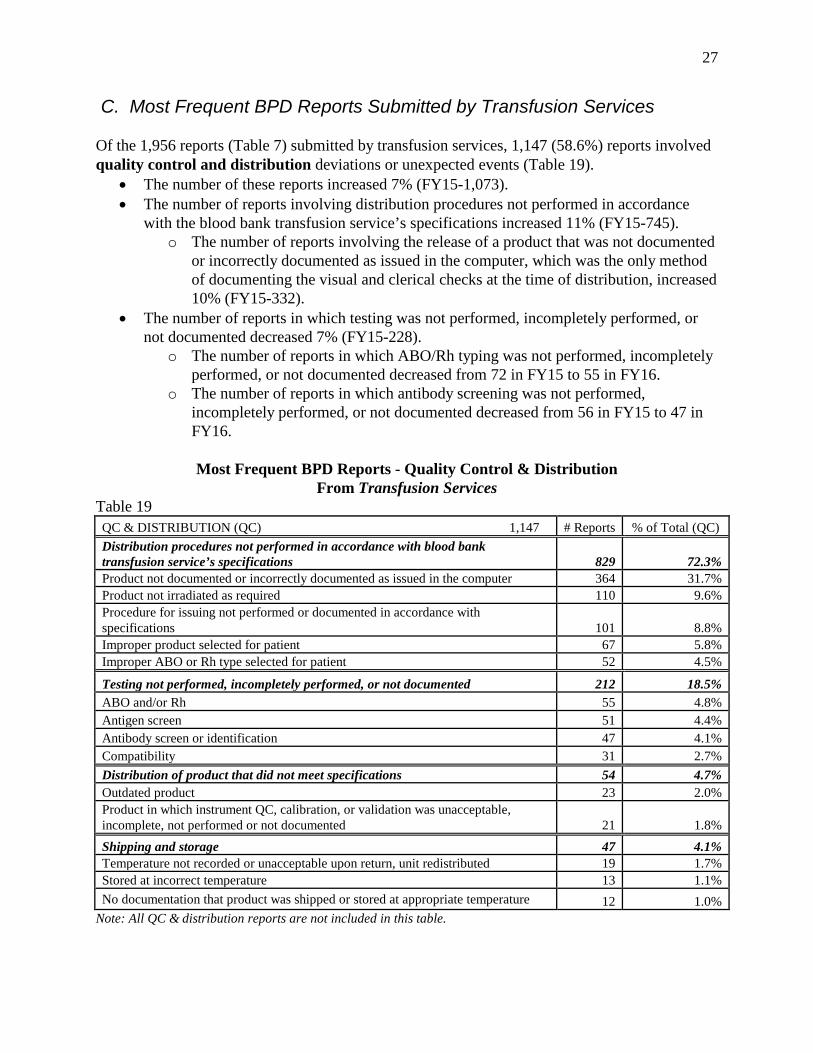
C. Most Frequent BPD Reports Submitted by Transfusion Services Of the 1,956 reports (Table 7) submitted by transfusion services, 1,147 (58.6%) reports involved quality control and distribution deviations or unexpected events (Table 19).
• The number of these reports increased 7% (FY15-1,073). • The number of reports involving distribution procedures not performed in accordance
with the blood bank transfusion service’s specifications increased 11% (FY15-745). o The number of reports involving the release of a product that was not documented
or incorrectly documented as issued in the computer, which was the only method of documenting the visual and clerical checks at the time of distribution, increased 10% (FY15-332).
• The number of reports in which testing was not performed, incompletely performed, or not documented decreased 7% (FY15-228).
o The number of reports in which ABO/Rh typing was not performed, incompletely performed, or not documented decreased from 72 in FY15 to 55 in FY16.
o The number of reports in which antibody screening was not performed, incompletely performed, or not documented decreased from 56 in FY15 to 47 in FY16.
Most Frequent BPD Reports - Quality Control & Distribution
From Transfusion Services Table 19 QC & DISTRIBUTION (QC) 1,147 # Reports % of Total (QC) Distribution procedures not performed in accordance with blood bank transfusion service’s specifications 829 72.3% Product not documented or incorrectly documented as issued in the computer 364 31.7% Product not irradiated as required 110 9.6% Procedure for issuing not performed or documented in accordance with specifications 101 8.8% Improper product selected for patient 67 5.8% Improper ABO or Rh type selected for patient 52 4.5%
Testing not performed, incompletely performed, or not documented 212 18.5% ABO and/or Rh 55 4.8% Antigen screen 51 4.4% Antibody screen or identification 47 4.1% Compatibility 31 2.7% Distribution of product that did not meet specifications 54 4.7% Outdated product 23 2.0% Product in which instrument QC, calibration, or validation was unacceptable, incomplete, not performed or not documented 21 1.8% Shipping and storage 47 4.1% Temperature not recorded or unacceptable upon return, unit redistributed 19 1.7% Stored at incorrect temperature 13 1.1% No documentation that product was shipped or stored at appropriate temperature 12 1.0%
Note: All QC & distribution reports are not included in this table.

28
Of the 1,956 reports (Table 7) submitted by transfusion services, 440 (22.5%) reports involved labeling deviations or unexpected events (Table 20).
• The number of these reports increased 4% (FY15-424). • The number of reports involving the crossmatch, tie tag, or transfusion record labeled
with incorrect or missing information increased from 359 in FY15 to 372 in FY16. • The number of reports involving the unit labeled with incorrect or missing information
was similar to the number of reports submitted the previous year (64 in FY15 compared to 67 in FY16).
Most Frequent BPD Reports - Labeling From Transfusion Services
Table 20 LABELING (LA) 440 # Reports % of Total (LA) Crossmatch tag, tie tag or transfusion record incorrect or missing information 372 84.5% Crossmatch tags or transfused records switched, both units intended for the same patient 110 25.0% Recipient identification incorrect or missing 96 21.8% Crossmatch tag or tie tag missing or attached to incorrect unit 34 7.7% Product type or code incorrect or missing 25 5.7%
Unit, lot, or pool number incorrect or missing 23 5.2%
Expiration date or time extended or missing 18 4.1%
Labels applied to blood unit or product incorrect or missing information 67 15.2% Extended or missing expiration date or time 34 7.7%
Product type/code and expiration date incorrect or missing 12 2.7% Note: All labeling reports are not included in this table.
29
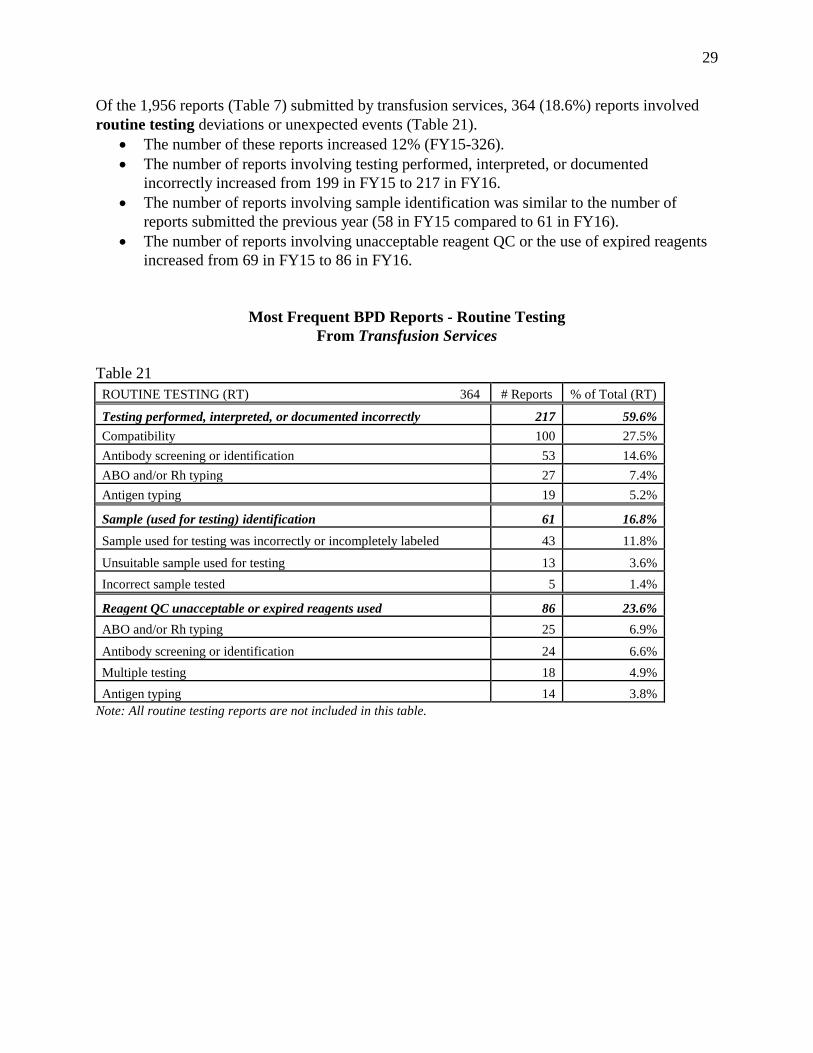
Of the 1,956 reports (Table 7) submitted by transfusion services, 364 (18.6%) reports involved routine testing deviations or unexpected events (Table 21).
• The number of these reports increased 12% (FY15-326). • The number of reports involving testing performed, interpreted, or documented
incorrectly increased from 199 in FY15 to 217 in FY16. • The number of reports involving sample identification was similar to the number of
reports submitted the previous year (58 in FY15 compared to 61 in FY16). • The number of reports involving unacceptable reagent QC or the use of expired reagents
increased from 69 in FY15 to 86 in FY16.
Most Frequent BPD Reports - Routine Testing From Transfusion Services
Table 21 ROUTINE TESTING (RT) 364 # Reports % of Total (RT)
Testing performed, interpreted, or documented incorrectly 217 59.6% Compatibility 100 27.5% Antibody screening or identification 53 14.6% ABO and/or Rh typing 27 7.4% Antigen typing 19 5.2%
Sample (used for testing) identification 61 16.8% Sample used for testing was incorrectly or incompletely labeled 43 11.8%
Unsuitable sample used for testing 13 3.6% Incorrect sample tested 5 1.4%
Reagent QC unacceptable or expired reagents used 86 23.6% ABO and/or Rh typing 25 6.9%
Antibody screening or identification 24 6.6% Multiple testing 18 4.9% Antigen typing 14 3.8%
Note: All routine testing reports are not included in this table.

30
D. Most Frequent BPD Reports Submitted by Source Plasma Establishments Of the 26,124 reports (Table 7) submitted by Source Plasma establishments, 22,314 (85.4%) involved post donation information (Table 22).
• The number of these reports increased 18% (FY15-18,942). • The number of reports in which a donor or third party provided subsequent information
related to high risk behavior or history increased 16% (FY15-17,710). o The number of reports in which the donor had a history of a tattoo and/or piercing
increased 9% (FY15-12,975). o The number of reports in which the donor subsequently tested positive on a drug
screen increased 71% (FY15-925). o The number of reports in which the donor had a history of incarceration increased
41% (FY15-844). o The number of reports in which the donor had intimate contact with risk for
hepatitis (Hepatitis C or Hepatitis B) increased 25% (FY15-859). Hepatitis C: FY15-666; FY16-668 Hepatitis B: FY15-193; FY16-407
o The number of reports in which a donor or third party provided subsequent information related to testing by another facility increased 51% (FY15-1,122). The majority of these reports involved a donor tested positive by another facility, but the specific testing was unknown (FY15-1,116).
Most Frequent BPD Reports - Post Donation Information From Source Plasma Establishments
Table 22 POST DONATION INFORMATION (PD) 22,314 # Reports % of Total (PD)
Behavior/History 20,512 91.9% Donor received tattoo and/or piercing 14,115 63.3% Positive drug screen 1,581 7.1% Incarcerated 1,187 5.3% Intimate contact with risk for a relevant transfusion-transmitted infection - HCV 668 3.0% IV drug use 497 2.2% Intimate contact with risk for a relevant transfusion-transmitted infection - HBV 407 1.8%
Testing* 1,690 7.6% Tested reactive at another center, specific testing unknown 1,681 7.5%
Illness 99 0.4%
Post donation diagnosis or symptoms of HCV, or reactive test for HCV 36 0.2% Post donation diagnosis or symptoms of HIV, or reactive test for HIV 29 0.1% Post donation illness (not hepatitis, HIV, HTLV-I, STD, cancer, or cold/flu related) 23 0.1%
*Includes testing positive for viral marker prior to donation at another location Note: All post donation information reports are not included in this table.

31
Of the 26,124 reports (Table 7) submitted by Source Plasma establishments, 2,795 (10.7%) reports involved miscellaneous deviations or unexpected events (Table 23).
• The number of these reports increased 11% (FY15-2,520). • The number of reports in which distributed products were collected from a donor who
subsequently tested confirmed positive for HCV increased 8% (FY15-1,677). • The number of reports in which distributed products were collected from a donor who
subsequently tested confirmed positive for HBV increased 17% (FY15- 508). • The number of reports in which distributed products were collected from a donor who
subsequently tested confirmed positive for HIV increased 24% (FY15-316).
Most Frequent BPD Reports - Miscellaneous From Source Plasma Establishments
Table 23 MISCELLANEOUS (MI) 2,795 # Reports % of Total (MI)
Lookback; subsequent unit tested confirmed positive for: 2,795 100% HCV 1,806 64.6% HBV 593 21.2% HIV 391 14.0% Multiple markers 5 0.2%
Note: All miscellaneous reports are not included in this table.
32
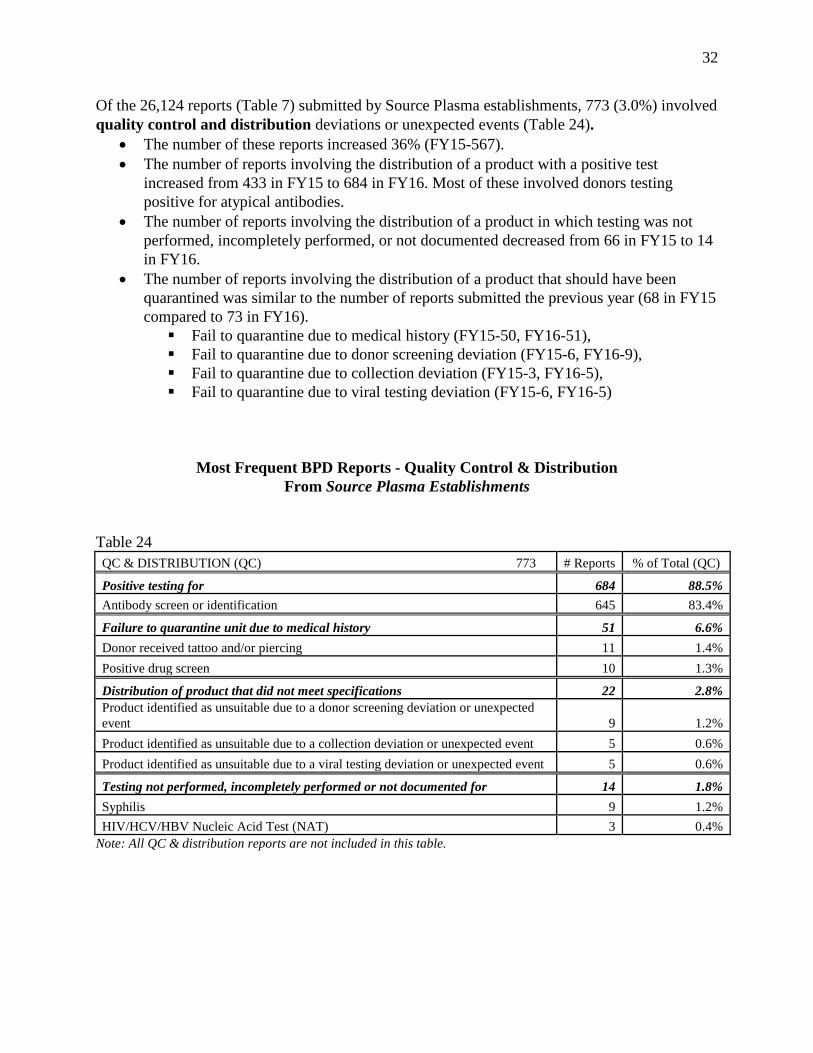
Of the 26,124 reports (Table 7) submitted by Source Plasma establishments, 773 (3.0%) involved quality control and distribution deviations or unexpected events (Table 24).
• The number of these reports increased 36% (FY15-567). • The number of reports involving the distribution of a product with a positive test
increased from 433 in FY15 to 684 in FY16. Most of these involved donors testing positive for atypical antibodies.
• The number of reports involving the distribution of a product in which testing was not performed, incompletely performed, or not documented decreased from 66 in FY15 to 14 in FY16.
• The number of reports involving the distribution of a product that should have been quarantined was similar to the number of reports submitted the previous year (68 in FY15 compared to 73 in FY16). Fail to quarantine due to medical history (FY15-50, FY16-51), Fail to quarantine due to donor screening deviation (FY15-6, FY16-9), Fail to quarantine due to collection deviation (FY15-3, FY16-5), Fail to quarantine due to viral testing deviation (FY15-6, FY16-5)
Most Frequent BPD Reports - Quality Control & Distribution From Source Plasma Establishments
Table 24 QC & DISTRIBUTION (QC) 773 # Reports % of Total (QC)
Positive testing for 684 88.5% Antibody screen or identification 645 83.4%
Failure to quarantine unit due to medical history 51 6.6% Donor received tattoo and/or piercing 11 1.4% Positive drug screen 10 1.3%
Distribution of product that did not meet specifications 22 2.8% Product identified as unsuitable due to a donor screening deviation or unexpected event 9 1.2% Product identified as unsuitable due to a collection deviation or unexpected event 5 0.6% Product identified as unsuitable due to a viral testing deviation or unexpected event 5 0.6%
Testing not performed, incompletely performed or not documented for 14 1.8% Syphilis 9 1.2% HIV/HCV/HBV Nucleic Acid Test (NAT) 3 0.4%
Note: All QC & distribution reports are not included in this table.
33
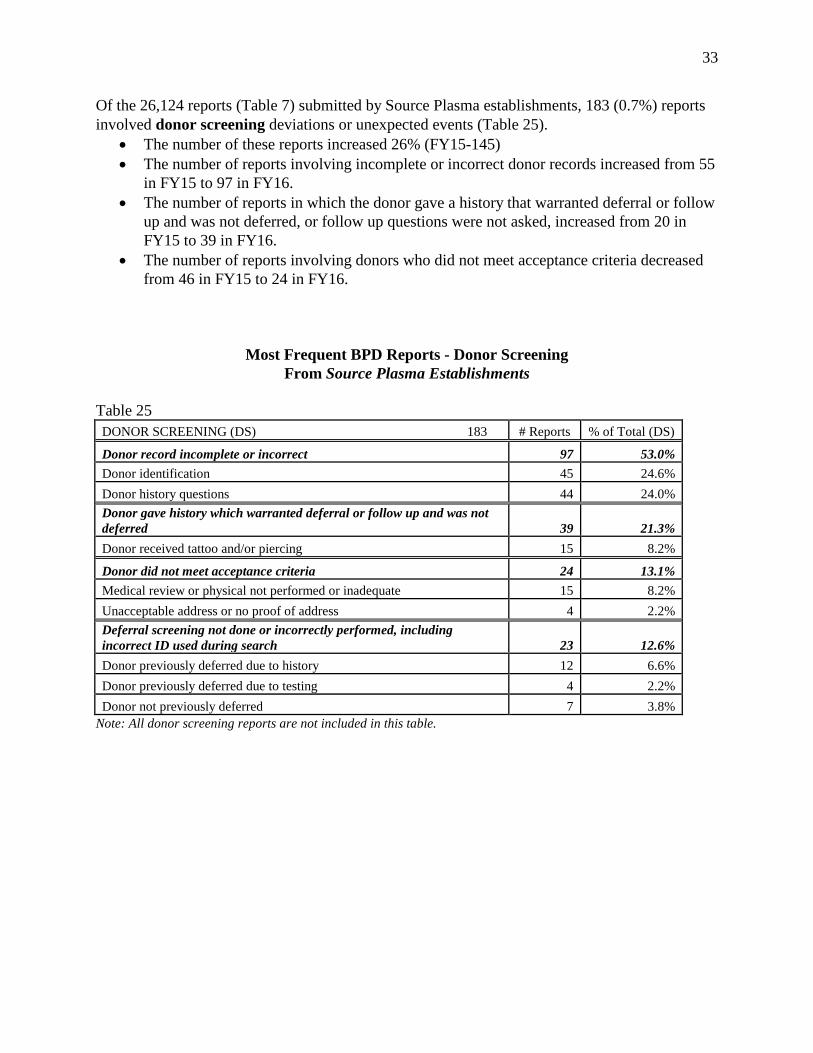
Of the 26,124 reports (Table 7) submitted by Source Plasma establishments, 183 (0.7%) reports involved donor screening deviations or unexpected events (Table 25).
• The number of these reports increased 26% (FY15-145) • The number of reports involving incomplete or incorrect donor records increased from 55
in FY15 to 97 in FY16. • The number of reports in which the donor gave a history that warranted deferral or follow
up and was not deferred, or follow up questions were not asked, increased from 20 in FY15 to 39 in FY16.
• The number of reports involving donors who did not meet acceptance criteria decreased from 46 in FY15 to 24 in FY16.
Most Frequent BPD Reports - Donor Screening From Source Plasma Establishments
Table 25 DONOR SCREENING (DS) 183 # Reports % of Total (DS)
Donor record incomplete or incorrect 97 53.0% Donor identification 45 24.6% Donor history questions 44 24.0% Donor gave history which warranted deferral or follow up and was not deferred 39 21.3% Donor received tattoo and/or piercing 15 8.2%
Donor did not meet acceptance criteria 24 13.1% Medical review or physical not performed or inadequate 15 8.2% Unacceptable address or no proof of address 4 2.2% Deferral screening not done or incorrectly performed, including incorrect ID used during search 23 12.6% Donor previously deferred due to history 12 6.6% Donor previously deferred due to testing 4 2.2% Donor not previously deferred 7 3.8%
Note: All donor screening reports are not included in this table.

34
III. BPD Reports Submitted by Licensed Manufacturers of Biological Products Other Than Blood and Blood Components (Licensed Non-Blood) Licensed non-blood manufacturers submitted 93 more reports in FY16 than in the previous fiscal year (FY15-558) (Table 2). The number of reports submitted in FY16 by licensed non-blood manufacturers is displayed in Table 26.
• Allergenic manufacturers submitted seven more reports (FY15-82) (Table 5). o The number of reports involving product not meeting specifications was similar to
the number of reports submitted the previous year (69 in FY15 compared to 71 in FY16). The majority (73%) related to precipitate discovered in allergenic extracts, which was similar to the number of reports submitted the previous year (61 in FY15 compared to 65 in FY16).
• Blood derivative manufacturers submitted 11 more reports (FY15-123) (Table 5). o The number of reports related to product specifications increased from 35 in FY15
to 57 in FY16. The number of reports involving product specification not met for
appearance was similar to the number of reports submitted the previous year (11 in FY15 compared to eight in FY16).
The number of reports involving the specification of a component packaged with a final product not met was similar to the number of reports submitted the previous year (17 in FY15 compared to 14 in FY16).
o The number of reports related to process controls decreased from 27 in FY15 to 18 in FY16. The number of reports related to process/procedures not performed or
performed incorrectly was the same as the previous year (FY15-14). The number of reports in which manufacturing or processing was
performed using incorrect parameters decreased from 11 in FY15 to two in FY16.
• Licensed in-vitro diagnostic manufacturers submitted 33 more reports (FY15-111) (Table 5).
o The number of reports related to the product specifications increased from 66 in FY15 to 97 in FY16. The number of reports related to unexpected reactions in testing increased
from 43 in FY15 to 61 in FY16. The number of reports related to leaking vial or container due to loose or
unsecure closures was similar to the number of reports submitted the previous year (11 in FY15 compared to 15 in FY16).
o The number of reports related to quality control and distribution increased from 20 in FY15 to 29 in FY16. The number of reports related to the consignee receiving products upside down or sideways within the shipping container increased from seven in FY15 to 15 in FY16.

35
• Vaccine manufacturers submitted 42 more reports (FY15-223) (Table 5). o The number of reports involving product specifications increased from 74 in
FY15 to 103 in FY16. The number of reports involving product not meeting specifications
increased from 47 in FY15 to 68 in FY16. Most of these were related to appearance (FY15-37, FY16-44).
The number of reports involving stability failures increased from 21 in FY15 to 28 in FY16. Most of these were related to potency (FY15-8, FY16-10).
o The number of reports involving quality control and distribution increased from 30 in FY15 to 46 in FY16. The number of reports involving broken or cracked vials increased from
23 in FY15 to 35 in FY16. o The number of reports involving process controls increased from 20 in FY15 to
40 in FY16. The number of reports involving equipment cleaning procedures increased
from 1 in FY15 to 12 in FY16. o The number of reports involving testing decreased from 43 in FY15 to 21 in
FY16. Most of these were related to stability testing performed incorrectly or not performed (FY15-30, FY16-13).
• Licensed HCT/P manufacturers (351 HCT/Ps) submitted the same number of reports as the previous year (FY15-19) (Table 5).
o The number of reports related to the labeling controls increased from eight in FY15 to 14 in FY16. Most of these involved the product labeled with the incorrect recipient identification (FY15-5, FY16-12).
o The number of reports involving product specifications decreased from eight in FY15 to two in FY16.
o There were two report submitted by HPC, Cord Blood manufacturers, which involved a labeling deviation and a testing deviation.
Total BPD Reports by Manufacturing System Licensed Non-Blood Establishments
FY16 Table 26
Manufacturing System Allergenic Blood
Derivative In Vitro
Diagnostic Vaccine 351
HCT/P TOTAL Product Specifications 71 57 97 103 2 330 50.7% Quality Control & Distribution 1 18 29 46 0 94 14.4% Process Controls 2 18 4 40 0 64 9.8% Labeling 11 11 4 17 14 57 8.8% Testing 4 13 6 21 3 47 7.2% Incoming Material 0 15 3 13 0 31 4.8% Miscellaneous 0 2 1 25 0 28 4.3%
Total 89 134 144 265 19 651 100%

36
IV. HCT/P Deviation Reports Submitted by Manufacturers of 361 HCT/Ps
The deviation reporting requirement for HCT/Ps regulated solely under section 361 of the PHS Act and 21 CFR Part 1271 became effective on May 25, 2005. HCT/Ps means articles containing or consisting of human cells or tissues that are intended for implantation, transplantation, infusion, or transfer into a human recipient. Examples of HCT/Ps include, but are not limited to, bone, ligament, skin, dura mater, heart valve, cornea, hematopoietic stem/progenitor cells derived from peripheral and cord blood, manipulated autologous chondrocytes, epithelial cells on a synthetic matrix, and semen or other reproductive tissue5 [21 CFR 1271.3(d)]. An HCT/P is regulated solely under Section 361 of the PHS Act and the regulations under 21 CFR Part 1271 if it meets all of the following criteria under 21 CFR 1271.10(a):
(1) The HCT/P is minimally manipulated; (2) The HCT/P is intended for homologous use only, as reflected by the labeling, advertising,
or other indications of the manufacturer’s objective intent; (3) The manufacture of the HCT/P does not involve the combination of the cells or tissues
with another article, except for water, crystalloids, or a sterilizing, preserving, or storage agent, provided that the addition of water, crystalloids, or the sterilizing, preserving, or storage agent does not raise new clinical safety concerns with respect to the HCT/P; AND
(4) Either: i) The HCT/P does not have a systemic effect and is not dependent upon the
metabolic activity of living cells for its primary function; OR ii) The HCT/P has a systemic effect or is dependent upon the metabolic activity of
living cells for its primary function, AND: (a) Is for autologous use; (b) Is for allogeneic use in a first or second-degree relative; OR (c) Is for reproductive use.
The following is a summary of HCT/P deviation reports submitted by manufacturers of 361 HCT/Ps during FY16. The summary does not provide individual product type specifics, but only by cellular (e.g., hematopoietic stem/progenitor cells) or tissue (e.g., skin, musculoskeletal, cornea) products.
5 HCT/P Deviation reporting applies to nonreproductive HCT/Ps.

37
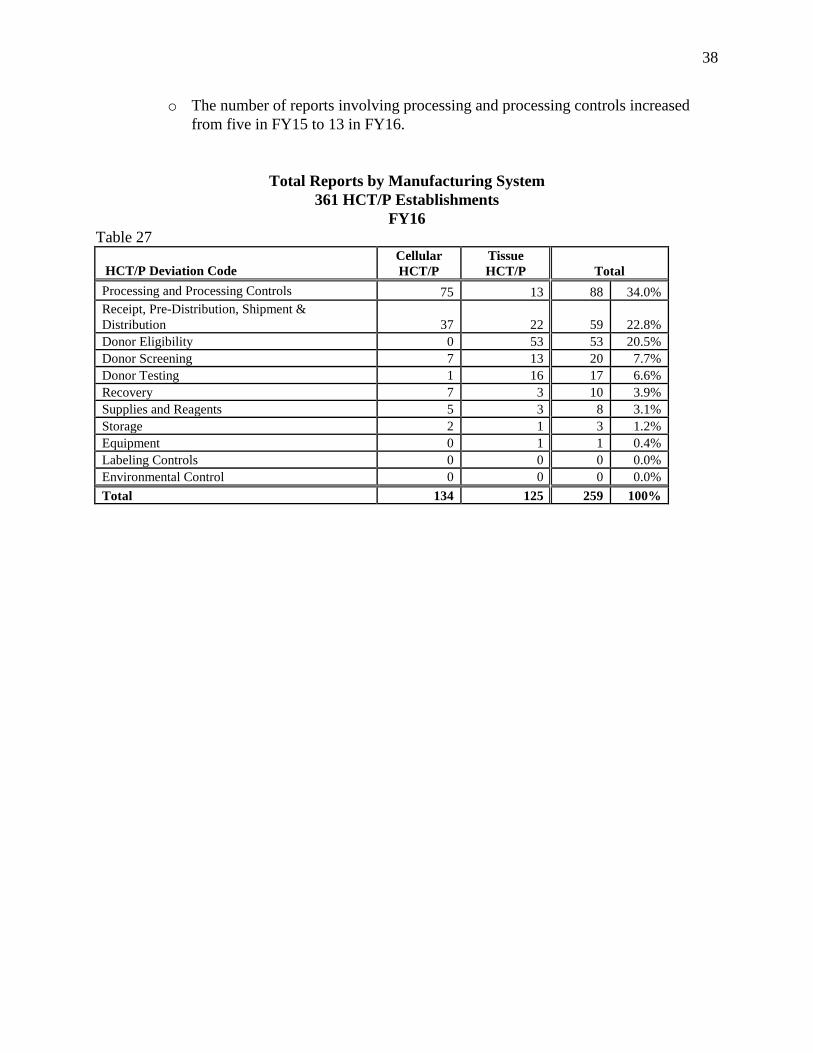
Manufacturers of 361 HCT/Ps submitted three more reports in FY16 than in the previous fiscal year (FY15-256) (Table 2). The number of reports submitted in FY16 by manufacturers of 361 HCT/Ps is displayed in Table 27.
• The same number of reports involving cellular HCT/Ps was submitted this fiscal year as compared to the previous fiscal year (FY15-134) (Table 6).
o The number of reports involving processing and process controls was similar to the number of reports submitted the previous year (71 in FY15 compared to 75 in FY16). The number of reports involving contamination or potential contamination during processing was similar to the number of reports submitted the previous year (71 in FY15 compared to 73 in FY16).
o The number of reports involving receipt, pre-distribution, shipment and distribution decreased from 48 in FY15 to 37 in FY16. The number of reports involving distribution of product that was contaminated or potentially contaminated decreased from 44 in FY15 to 31 in FY16.
• There were three more reports involving tissue HCT/Ps submitted than in the previous fiscal year (FY15-122, FY16-125) (Table 6).
o The number of reports involving donor eligibility increased from 33 in FY15 to 53 in FY16. There were 19 fewer reports involving the acceptance of ineligible donors
(FY15-33, FY16-52). In FY16, 47 of these reports involved risk factors, clinical or physical evidence identified.
o The number of reports involving donor screening decreased from 35 in FY15 to 13 in FY16. The number of reports in which the donor medical history interview was
not performed or performed incorrectly decreased from 27 in FY15 to seven in FY16.
o The number of reports involving donor testing was similar to the number of reports submitted the previous year (15 in FY15 compared to 16 in FY16). The number of reports involving unacceptable samples used for testing
was the same as the number of reports submitted the previous year (FY15-11).
• Four of these reports involved samples that did not meet requirements in test kit package insert.
• Nine of these reports involved samples collected from donors who were incorrectly evaluated or not evaluated for plasma dilution.
The number of reports in which testing was not performed or performed incorrectly were similar to the number of reports submitted the previous year (four in FY15 compared to three in FY16). There were two reports involving testing for syphilis and one report involving testing for HBV.
o The number of reports involving receipt, pre-distribution, shipment and distribution was similar to the number of reports submitted the previous year (21 in FY15 compared to 22 in FY16). The number of reports involving inappropriate shipping conditions related
to packaging decreased from 16 in FY15 to 10 in FY16.
38
o The number of reports involving processing and processing controls increased from five in FY15 to 13 in FY16.
Total Reports by Manufacturing System 361 HCT/P Establishments
FY16 Table 27
HCT/P Deviation Code Cellular HCT/P
Tissue HCT/P Total
Processing and Processing Controls 75 13 88 34.0% Receipt, Pre-Distribution, Shipment & Distribution 37 22 59 22.8% Donor Eligibility 0 53 53 20.5% Donor Screening 7 13 20 7.7% Donor Testing 1 16 17 6.6% Recovery 7 3 10 3.9% Supplies and Reagents 5 3 8 3.1% Storage 2 1 3 1.2% Equipment 0 1 1 0.4% Labeling Controls 0 0 0 0.0% Environmental Control 0 0 0 0.0% Total 134 125 259 100%
39
V. Attachments 1 – Table-Number of BPD Reports by Type of Blood and Source Plasma Establishment 2 – List of BPD Codes for Blood and Source Plasma Establishments 3 – Table-Number of BPD Reports by Type of Licensed Non-Blood Establishment 4 – List of BPD Codes for Licensed Non-Blood Establishments 5 – Table-Number of HCT/P Deviation Reports by Type of 361 HCT/P Establishment 6 – List of HCT/P Deviation Codes for 361 HCT/P Establishments 7 – List of Tables in Annual Summary Report VI. References
1. Guidance for Industry - Biological Product Deviation Reporting for Blood and Plasma Establishments 10/18/2006 http://www.fda.gov/BiologicsBloodVaccines/GuidanceComplianceRegulatoryInformation/Guidances/Blood/ucm073455.htm
2. Guidance for Industry - Biological Product Deviation Reporting for Licensed
Manufacturers of Biological Products Other than Blood and Blood Components 10/18/2006 http://www.fda.gov/BiologicsBloodVaccines/GuidanceComplianceRegulatoryInformation/Guidances/General/ucm163893.htm
3. Draft Guidance for Industry - Deviation Reporting for Human Cells, Tissues, and Cellular
and Tissue-Based Products Regulated Solely Under Section 361 of the Public Health Service Act and 21 CFR Part 1271 12/2015 http://www.fda.gov/downloads/BiologicsBloodVaccines/GuidanceComplianceRegulatoryInformation/Guidances/Tissue/UCM478826.pdf