Embed Size (px)
Citation preview

Beloit Public School USD #273 Beloit
i
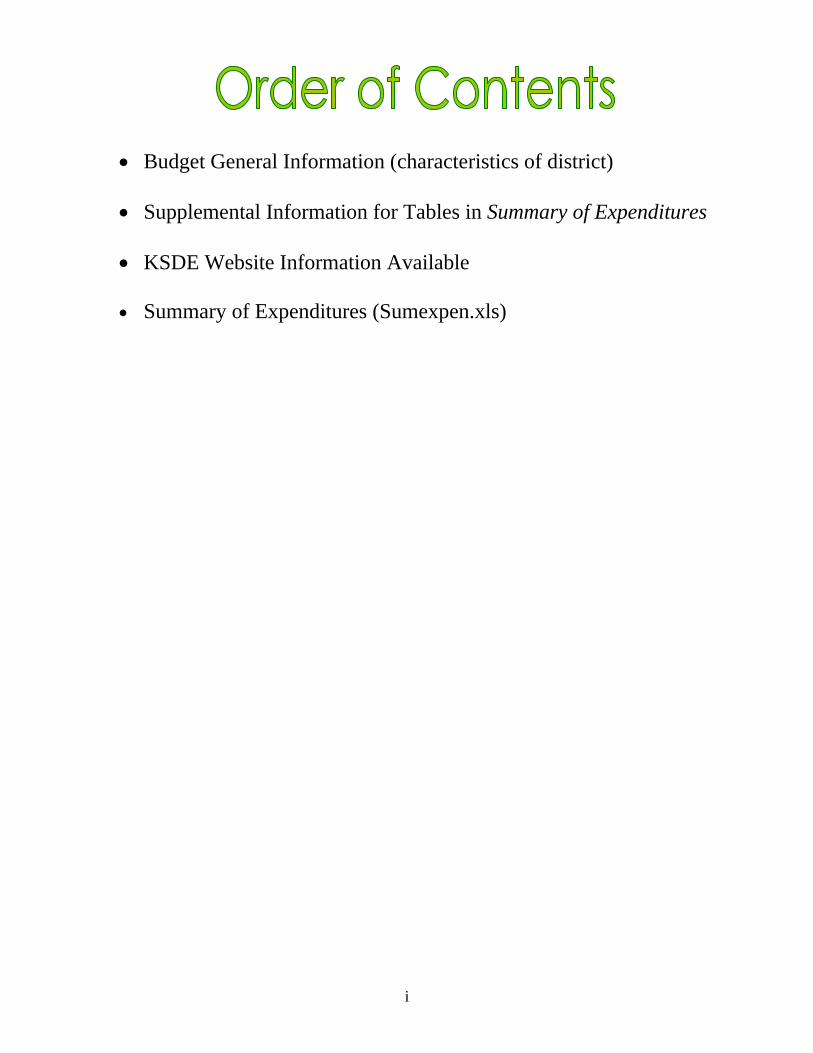
• Budget General Information (characteristics of district)
• Supplemental Information for Tables in Summary of Expenditures
• KSDE Website Information Available
• Summary of Expenditures (Sumexpen.xls)
1
2008-2009 Budget General Information USD #: 273 The public schools of USD 273 base their educational programs on those principles necessary to prepare students for responsible citizenship. As such, the schools recognize that our complex, changing society demands that educational programs continue to provide a sound, basic education. Realizing that students vary in aptitude and interest, the educational program will provide for the development of general knowledge while addressing individual needs and desires. All students will have an equal opportunity to pursue and acquire an education. The District’s Mission Statement includes: “The students of USD 273 will be given the opportunity to become: (1) academically functional; (2) aware of important cultural heritages, traditions, and lifestyles; (3) aware of vocational opportunities; (4) conscious of the importance of good health and a positive self-image; and (5) aware of the fine arts.” Unified School District Number 273 encompasses 433 square miles of North Central Kansas. The central office of USD 273 provides support for the district's administrators, instructors, and classified staff in meeting the educational goals established for students. Support service staff is available to provide school health services, counseling, remedial instruction, tutoring, and a full continuum of special education services to assist students in taking advantage of the sound, basic education provided in each school.
Through a system of program evaluation, development, and re-assessment, the curriculum is continually updated to meet the challenges of the future. This system operates on a five-year cycle with textbooks and other resources selected after the curriculum review process. Administrators, teachers, and classified employees have available a comprehensive staff development program which is approved by the Kansas State Department of Education. Those staff members having a "Professional Development Plan" receive credit for training they receive to enhance their job skills.
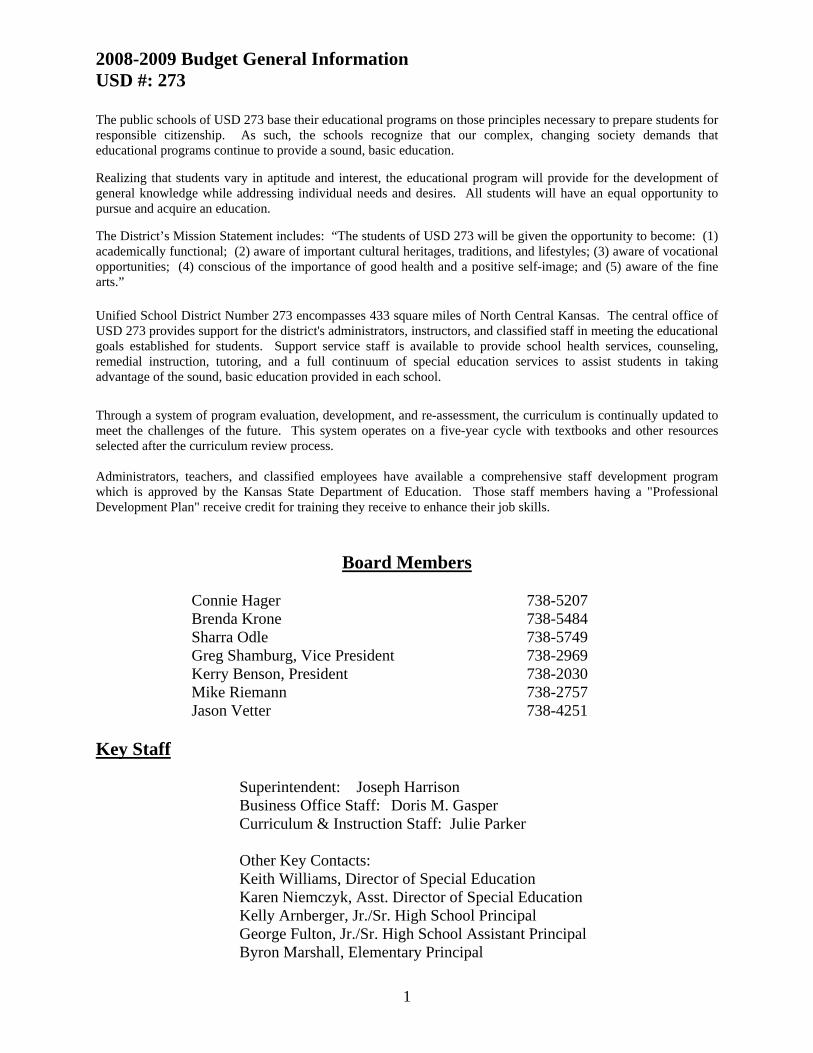
Board Members
Connie Hager 738-5207 Brenda Krone 738-5484 Sharra Odle 738-5749 Greg Shamburg, Vice President 738-2969 Kerry Benson, President 738-2030 Mike Riemann 738-2757 Jason Vetter 738-4251 Key Staff
Superintendent: Joseph Harrison Business Office Staff: Doris M. Gasper Curriculum & Instruction Staff: Julie Parker
Other Key Contacts: Keith Williams, Director of Special Education Karen Niemczyk, Asst. Director of Special Education Kelly Arnberger, Jr./Sr. High School Principal George Fulton, Jr./Sr. High School Assistant Principal Byron Marshall, Elementary Principal
2
The District’s Accomplishments and Challenges Accomplishments: On the 2008 Kansas State Reading Assessment, the Beloit Elementary School and the Jr./Sr. High School students both made adequate yearly progress (AYP). Ninety-seven percent of the Beloit Elementary School students achieved the “meets standard” or above performance category, while eighty-seven percent of the Jr./Sr. High School students achieved the “meets standard” or above performance category. Preliminary scores show that standard of excellence was earned by USD 273 students in grades 4, 5, 6, 7, 8 and 11. On the 2008 Kansas State Math Assessment, the Beloit Elementary School students and the Jr./Sr. High School students both made adequate yearly progress (AYP). Ninety-six percent of the Beloit Elementary School students achieved the “meets standard” or above performance category, while seventy-two percent of the Jr./Sr. High School students achieved the “meets standard” or above performance category. Preliminary scores show that standard of excellence was earned by elementary students in grades 3, 4, 5, and 6. On the 2007 Kansas State Writing Assessment, 11th graders at the Beloit Jr./Sr. High School met the standard of excellence in writing. On the 2005 Kansas State Writing Assessment, Beloit Elementary School students scored at the standard of excellence and had 100% of the students at proficient or above. Beloit Jr./Sr. High School eighth grade students scored ninety percent proficient or above and eleventh grade students scored ninety-five percent proficient or above. On the 2005 Kansas State Science Assessment, Beloit Elementary School had seventy-six percent of the fourth grade students at proficient or above. Sixty-two percent of the seventh grade scored proficient or above and fifty-two percent of the tenth grade scored proficient or above. On the 2005 Kansas State Social Studies Assessment, Beloit Elementary School had eighty-four percent of the sixth grade students at proficient or above. Forty-eight percent of the eighth grade scored proficient or above and fifty-five percent of the eleventh grade scored proficient or above. The district had not yet received scores for the 2008 science and social studies assessments. The district has increased graduation requirements and included a “Service Education” component as a means of fostering volunteerism. Advanced Placement courses in Calculus, History and Spanish were initiated in the 2002-2003 school year. Advanced Placement Chemistry and European World History were added in the 2004-2005 school year. Students successfully completed the AP exams at the end of the year. College credits are awarded based upon the student’s scores on a comprehensive final exam. At the junior high level, a foreign language survey course is in place. The course introduces students to French, German and Spanish. The junior high also augments its curriculum by adding an organization and study skills class for seventh graders. The Teacher Cadet Program is in place to provide juniors and seniors an opportunity to receive training and experience teaching in a variety of classroom settings. Twelve students successfully completed the program.

3
Challenges: Declining enrollment has affected the Beloit schools as it has throughout the state. The budget was developed in 2005 with an estimated 755 pupils. In 2007-08, our audited enrollment figures count only 704.8 students. That fact will possibly force future cuts in staff and services at all levels. The replacement of retired teachers and administrators continues to be a challenge for the district. With teacher shortages being reported throughout the state and the nation, the district will have difficulty finding qualified replacements. Increasing health insurance costs have limited the district’s ability to keep salaries competitive, further restricting the recruitment and retention of teachers.
Pawnee Mental Health Services and the Beloit Special Education Cooperative and USD 273 once operated an alternative educational placement for students who have difficulty performing in a traditional school environment. Pawnee Mental Health abandoned this partnership for the 2008-09 school year. The Behavior Academy for Youth opened in November of 2003. It will change its name this year and continue to operate under the sole leadership of the Beloit Special Education Cooperative.

4
Supplemental Information for the Following Tables 1. Summary of Total Expenditures by Function (All Funds) 2. Summary of General Fund Expenditures by Function 3. Summary of Supplemental General Fund Expenditures by Function 4. Summary of General and Supplemental General Fund Expenditures by Function 5. Summary of Special Education Fund by Function 6. Instruction Expenditures (1000) 7. Student and Instructional Support Expenditures (2100 & 2200) 8. General Administration Expenditures (2300) 9. School Administration Expenditures (2400) 10. Operations and Maintenance Expenditures (2600) 11. Other Costs (2500 & 2900: Other Supplemental Services) (3000: Non-Instruction Services) 12. Capital Improvements (4000) 13. Debt Services (5000) 14. Miscellaneous Information Unencumbered Cash Balance by Fund 15. Reserve Funds Unencumbered Cash Balance 16. Other Information - FTE 17. Miscellaneous Information Mill Rates by Fund 18. Other Information – Assessed Valuation and Bonded Indebtedness Note: The FTE (full time equivalency) used in this report to calculate the “Amount Per Pupil” is defined as following: Enrollment (FTE) includes the enrollment of the district used for state aid and budget authority, and all other preschool enrollment and kindergarten students attending full time.

5
KSDE Website Information Available K-12 Statistics (Building, District or State Totals) http://www.ksde.org/Default.aspx?tabid=223
• Attendance / Enrollment Reports • Staff Reports • Graduates / Dropouts Reports • Crime / Violence Reports
School Finance Reports and Publications http://www.ksde.org/Default.aspx?tabid=1870
• Certified Personnel • Enrollment • Dropouts • Graduates • Salary Reports
Kansas Building Report Card (listed on the right under Data Portal sections) http://www.ksde.org/Default.aspx?tabid=229
• Attendance Rate • Graduation Rate • Dropout Rate • School Violence • Assessments
o Reading o Mathematics o Writing
• Graduates Passing Adv. Science Courses • Graduates Passing Adv. Math Courses
USD# 273
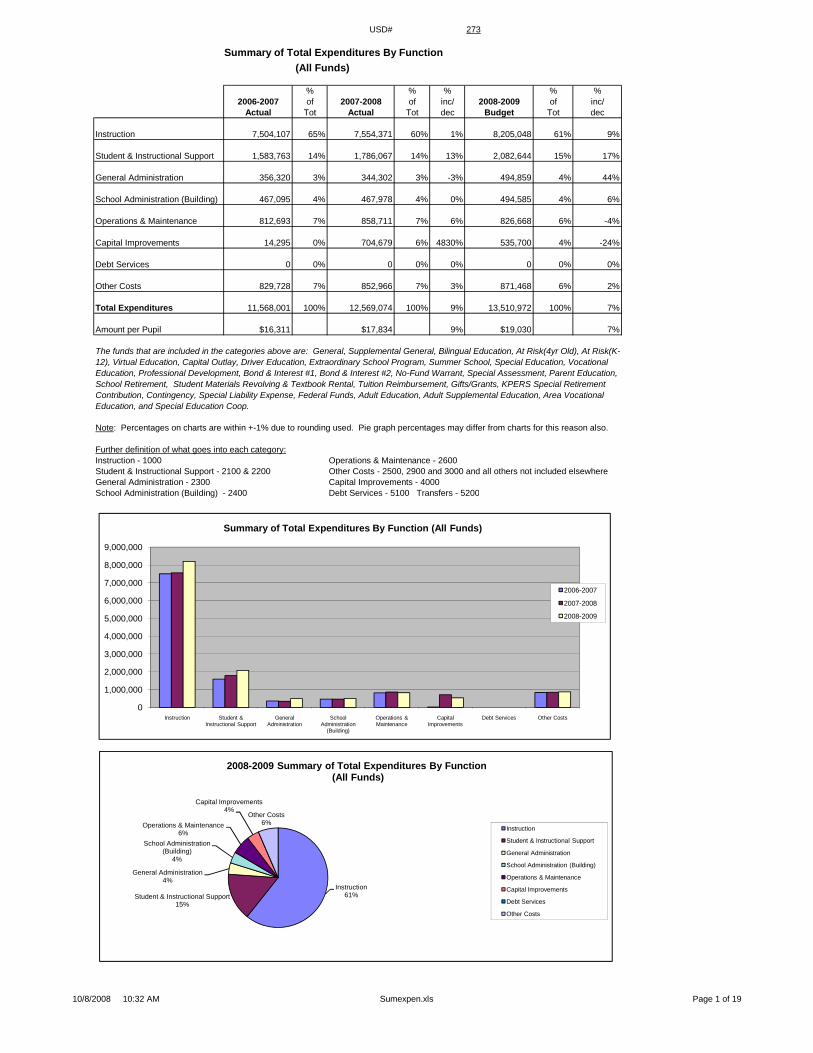
Summary of Total Expenditures By Function(All Funds)
% % % % %2006-2007 of 2007-2008 of inc/ 2008-2009 of inc/
Actual Tot Actual Tot dec Budget Tot dec
Instruction 7,504,107 65% 7,554,371 60% 1% 8,205,048 61% 9%
Student & Instructional Support 1,583,763 14% 1,786,067 14% 13% 2,082,644 15% 17%
General Administration 356,320 3% 344,302 3% -3% 494,859 4% 44%
School Administration (Building) 467,095 4% 467,978 4% 0% 494,585 4% 6%
Operations & Maintenance 812,693 7% 858,711 7% 6% 826,668 6% -4%
Capital Improvements 14,295 0% 704,679 6% 4830% 535,700 4% -24%
Debt Services 0 0% 0 0% 0% 0 0% 0%
Other Costs 829,728 7% 852,966 7% 3% 871,468 6% 2%
Total Expenditures 11,568,001 100% 12,569,074 100% 9% 13,510,972 100% 7%
Amount per Pupil $16,311 $17,834 9% $19,030 7%
Note: Percentages on charts are within +-1% due to rounding used. Pie graph percentages may differ from charts for this reason also.
Further definition of what goes into each category:Instruction - 1000 Operations & Maintenance - 2600Student & Instructional Support - 2100 & 2200 Other Costs - 2500, 2900 and 3000 and all others not included elsewhereGeneral Administration - 2300 Capital Improvements - 4000School Administration (Building) 2400 Debt Services 5100 Transfers 5200
The funds that are included in the categories above are: General, Supplemental General, Bilingual Education, At Risk(4yr Old), At Risk(K-12), Virtual Education, Capital Outlay, Driver Education, Extraordinary School Program, Summer School, Special Education, Vocational Education, Professional Development, Bond & Interest #1, Bond & Interest #2, No-Fund Warrant, Special Assessment, Parent Education, School Retirement, Student Materials Revolving & Textbook Rental, Tuition Reimbursement, Gifts/Grants, KPERS Special Retirement Contribution, Contingency, Special Liability Expense, Federal Funds, Adult Education, Adult Supplemental Education, Area Vocational Education, and Special Education Coop.
School Administration (Building) - 2400 Debt Services - 5100 Transfers - 5200
0
1,000,000
2,000,000
3,000,000
4,000,000
5,000,000
6,000,000
7,000,000
8,000,000
9,000,000
Instruction Student & Instructional Support
General Administration
School Administration
(Building)
Operations & Maintenance
Capital Improvements
Debt Services Other Costs
Summary of Total Expenditures By Function (All Funds)
2006-2007
2007-2008
2008-2009
Instruction61%Student & Instructional Support
15%
General Administration4%
School Administration (Building)
4%
Operations & Maintenance6%
Capital Improvements4%
Other Costs6%
2008-2009 Summary of Total Expenditures By Function(All Funds)
Instruction
Student & Instructional Support
General Administration
School Administration (Building)
Operations & Maintenance
Capital Improvements
Debt Services
Other Costs
10/8/2008 10:32 AM Sumexpen.xls Page 1 of 19

USD# 273
Summary of General Expendituresby Function
% % % % %2006-2007 of 2007-2008 of inc/ 2008-2009 of inc/
Actual Tot Actual Tot dec Budget Tot dec
Instruction 2,693,404 66% 2,786,379 68% 3% 2,937,437 72% 5%
Student & Instructional Support 151,360 4% 405 0% -100% 0 0% -100%
General Administration 157,311 4% 162,385 4% 3% 161,412 4% -1%
School Administration (Building) 444,158 11% 441,745 11% -1% 444,340 11% 1%
Operations & Maintenance 407,954 10% 460,875 11% 13% 325,148 8% -29%
Capital Improvements 0 0% 0 0% 0% 0 0% 0%
Other Costs 219,563 5% 226,733 6% 3% 234,179 6% 3%
Total Expenditures 4,073,750 100% 4,078,522 100% 0% 4,102,516 100% 1%
Amount per Pupil $5,744 $5,787 1% $5,778 0%
The Summary of General Fund Expenditures chart information comes from pages 6-13 and only uses the 'General Fund' line items.
2,000,000
2,500,000
3,000,000
3,500,000
Summary of General Fund Expendituresby Function
2006-2007
2007 2008
0
500,000
1,000,000
1,500,000
Instruction Student & Instructional
Support
General Administration
School Administration
(Building)
Operations & Maintenance
Capital Improvements
Other Costs
2007-2008
2008-2009
Instruction71%
General Administration4%
School Administration (Building)
11%
Operations & Maintenance8%
Other Costs6%
2008-2009 Summary of General Fund Expendituresby Function
Instruction
Student & Instructional Support
General Administration
School Administration (Building)
Operations & Maintenance
Capital Improvements
Other Costs
10/8/2008 10:32 AM Sumexpen.xls Page 2 of 19
USD# 273
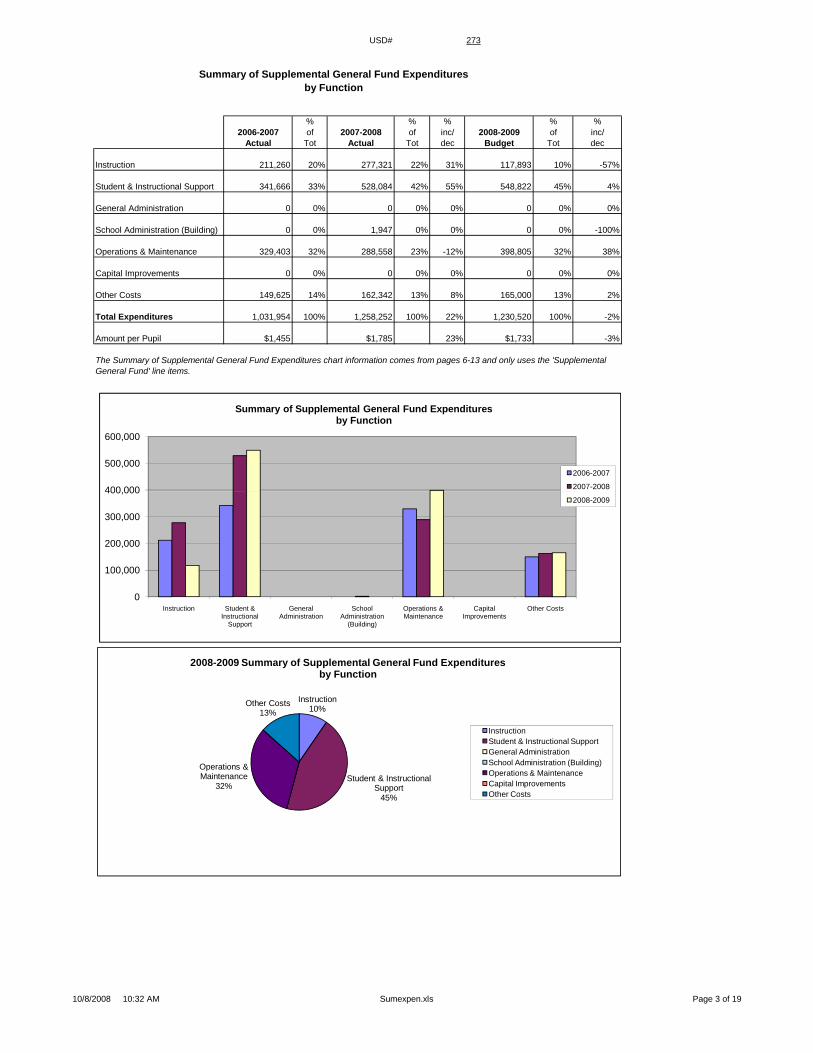
Summary of Supplemental General Fund Expendituresby Function
% % % % %2006-2007 of 2007-2008 of inc/ 2008-2009 of inc/
Actual Tot Actual Tot dec Budget Tot dec
Instruction 211,260 20% 277,321 22% 31% 117,893 10% -57%
Student & Instructional Support 341,666 33% 528,084 42% 55% 548,822 45% 4%
General Administration 0 0% 0 0% 0% 0 0% 0%
School Administration (Building) 0 0% 1,947 0% 0% 0 0% -100%
Operations & Maintenance 329,403 32% 288,558 23% -12% 398,805 32% 38%
Capital Improvements 0 0% 0 0% 0% 0 0% 0%
Other Costs 149,625 14% 162,342 13% 8% 165,000 13% 2%
Total Expenditures 1,031,954 100% 1,258,252 100% 22% 1,230,520 100% -2%
Amount per Pupil $1,455 $1,785 23% $1,733 -3%
The Summary of Supplemental General Fund Expenditures chart information comes from pages 6-13 and only uses the 'Supplemental General Fund' line items.
400 000
500,000
600,000
Summary of Supplemental General Fund Expendituresby Function
2006-2007
2007-2008
Instruction10%
Student & Instructional Support
45%
Operations & Maintenance
32%
Other Costs13%
2008-2009 Summary of Supplemental General Fund Expendituresby Function
InstructionStudent & Instructional SupportGeneral AdministrationSchool Administration (Building)Operations & MaintenanceCapital ImprovementsOther Costs
0
100,000
200,000
300,000
400,000
Instruction Student & Instructional
Support
General Administration
School Administration
(Building)
Operations & Maintenance
Capital Improvements
Other Costs
2008-2009
10/8/2008 10:32 AM Sumexpen.xls Page 3 of 19

USD# 273Summary of General and Supplemental General Fund
Expenditures by Function
% % % % %2006-2007 of 2007-2008 of inc/ 2008-2009 of inc/
Actual Tot Actual Tot dec Budget Tot dec
Instruction 2,904,664 57% 3,063,700 57% 5% 3,055,330 57% 0%
Student & Instructional Support 493,026 10% 528,489 10% 7% 548,822 10% 4%
General Administration 157,311 3% 162,385 3% 3% 161,412 3% -1%
School Administration (Building) 444,158 9% 443,692 8% 0% 444,340 8% 0%
Operations & Maintenance 737,357 14% 749,433 14% 2% 723,953 14% -3%
Capital Improvements 0 0% 0 0% 0% 0 0% 0%
Other Costs 369,188 7% 389,075 7% 5% 399,179 7% 3%
Total Expenditures 5,105,704 100% 5,336,774 100% 5% 5,333,036 100% 0%
Amount per Pupil $7,199 $7,572 5% $7,511 -1%
The Summary of General and Supplemental General Fund Expenditures chart information comes from pages 6-13 and adds togetherthe 'General Fund' and 'Supplemental General Fund' line items.
1,500,000
2,000,000
2,500,000
3,000,000
3,500,000
Summary of General and Supplemental General FundExpenditures by Function
2006-2007
2007-2008
2008-2009
0
500,000
1,000,000
1,500,000
Instruction Student & Instructional
Support
General Administration
School Administration
(Building)
Operations & Maintenance
Capital Improvements
Other Costs
Instruction57%
Student & Instructional Support
10%
General Administration3%
School Administration (Building)
8%
Operations & Maintenance14%
Other Costs8%
2008-2009 Summary of General and Supplemental General Fund Expenditures by Function
Instruction
Student & Instructional Support
General Administration
School Administration (Building)
Operations & Maintenance
Capital Improvements
Other Costs
10/8/2008 10:32 AM Sumexpen.xls Page 4 of 19

USD# 273
Summary of Special Education Fundby Function
% % % % %2006-2007 of 2007-2008 of inc/ 2008-2009 of inc/
Actual Tot Actual Tot dec Budget Tot dec
Instruction 1,152,386 100% 990,151 100% -14% 1,173,000 100% 18%
Student & Instructional Support 0 0% 0 0% 0% 0 0% 0%
General Administration 135 0% 0 0% -100% 0 0% 0%
School Administration (Building) 0 0% 0 0% 0% 0 0% 0%
Operations & Maintenance 0 0% 0 0% 0% 0 0% 0%
Capital Improvements 0 0% 0 0% 0% 0 0% 0%
Other Costs 0 0% 0 0% 0% 0 0% 0%
Total Expenditures 1,152,521 100% 990,151 100% -14% 1,173,000 100% 18%
Amount per Pupil $1,625 $1,405 -14% $1,652 18%
The Summary of Special Education Fund Expenditures chart information comes from pages 6-13 and only uses the 'Special Education Fund'line items. (Total expenditures excludes Special Ed Coop Fund because it would include expenditures for all schools participating in the Coop.)
800,000
1,000,000
1,200,000
1,400,000
Summary of Special Education Fund Expendituresby Function
2006-2007
2007 2008
0
200,000
400,000
600,000
Instruction Student & Instructional
Support
General Administration
School Administration
(Building)
Operations & Maintenance
Capital Improvements
Other Costs
2007-2008
2008-2009
Instruction100%
2008-2009 Summary of Special Education Fundby Function
Instruction
Student & Instructional Support
General Administration
School Administration (Building)
Operations & Maintenance
Capital Improvements
Other Costs
10/8/2008 10:32 AM Sumexpen.xls Page 5 of 19

USD# 273Instruction Expenditures (1000)
% %2006-2007 2007-2008 inc/ 2008-2009 inc/
Actual Actual dec Budget dec
General 2,693,404 2,786,379 3% 2,937,437 5%Federal Funds 165,604 158,725 -4% 158,771 0%Supplemental General 211,260 277,321 31% 117,893 -57%At Risk (4yr Old) 105,562 110,840 5% 115,827 4%At Risk (K-12) 208,462 272,558 31% 287,258 5%Bilingual Education 1,086 2,199 102% 2,000 -9%Virtual Education 0Capital Outlay 100,180 114,354 14% 90,080 -21%Driver Education 14,344 13,137 -8% 17,930 36%Declining Enrollment 0 0 0% 0 0%Extraordinary School Program 0 0 0% 0 0%Food Service 0 0 0% 0 0%Professional Development 0 0 0% 0 0%Parent Education Program 0 0 0% 0 0%Summer School 0 0 0% 0 0%Special Education 1,152,386 990,151 -14% 1,173,000 18%Cost of Living 0 0 0% 0 0%Vocational Education 359,629 332,018 -8% 340,000 2%Gifts/Grants 0 0 0% 0 0%Special Liability 0 0 0% 0 0%School Retirement 0 0 0% 0 0%Extraordinary Growth Facilities 0 0 0% 0 0%Special Reserve 0 0 0%KPERS Spec. Ret. Contribution 294,328 333,900 13% 387,130 16%Contingency Reserve 0 0 0%Text Book & Student Material 0 0 0%Bond & Interest #1 0 0 0% 0 0%Bond & Interest #2 0 0 0% 0 0%No-Fund Warrant 0 0 0% 0 0%Special Assessment 0 0 0% 0 0%Temporary Note 0 0 0% 0 0%
SUBTOTAL 5,306,245 5,391,582 2% 5,627,326 4%Enrollment (FTE)* 709.2 704.8 -1% 710.0 1%Amount per Pupil 7,482 7,650 2% 7,926 4%p p , , ,
Adult Education 0 0 0% 0 0%Adult Supplemental Education 0 0 0% 0 0%Area Vocational School 0 0 0% 0 0%Tuition Reimbursement 0 0 0% 0 0%Special Education Coop 2,197,862 2,162,789 -2% 2,577,722 19%TOTAL 7,504,107 7,554,371 1% 8,205,048 9%
NOTE: Gifts/Grants includes private grants and grants from nonfederal sources.
Amount per pupil excludes the following funds: Area Vocational School, Adult Education, Adult Supplemental Education,Special Education Coop and Tuition Reimbursement.
*E ll t (FTE) i l d th ll t f th di t i t d f t t id d b d t th it d ll th h l ll t
0
1,000,000
2,000,000
3,000,000
4,000,000
5,000,000
6,000,000
7,000,000
8,000,000
9,000,000
2006-2007 2007-2008 2008-2009
Instruction Expenditures
0
500,000
1,000,000
1,500,000
2,000,000
2,500,000
3,000,000
3,500,000
2006-2007 2007-2008 2008-2009
Instruction Expenditures
General
Supplemental General
Special Education
*Enrollment (FTE) includes the enrollment of the district used for state aid and budget authority, and all other preschool enrollmentand kindergarten students attending full time.10/8/2008 10:32 AM Sumexpen.xls Page 6 of 19
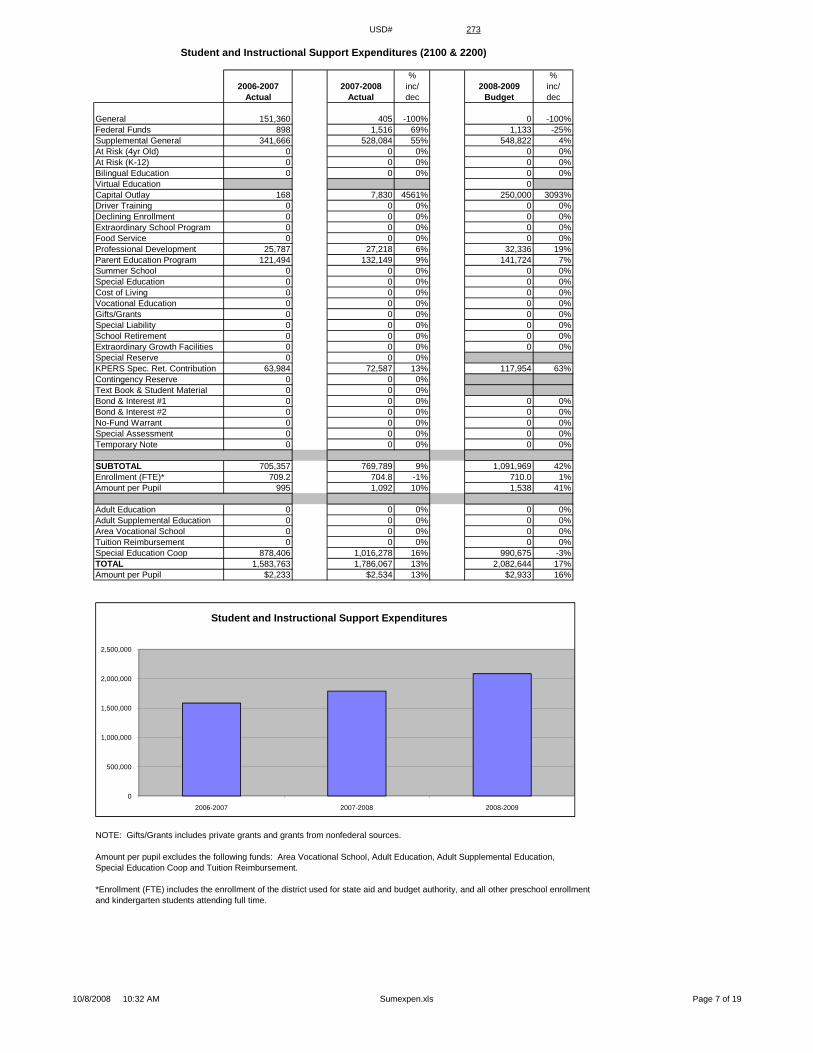
USD# 273
Student and Instructional Support Expenditures (2100 & 2200)
% %2006-2007 2007-2008 inc/ 2008-2009 inc/
Actual Actual dec Budget dec
General 151,360 405 -100% 0 -100%Federal Funds 898 1,516 69% 1,133 -25%Supplemental General 341,666 528,084 55% 548,822 4%At Risk (4yr Old) 0 0 0% 0 0%At Risk (K-12) 0 0 0% 0 0%Bilingual Education 0 0 0% 0 0%Virtual Education 0Capital Outlay 168 7,830 4561% 250,000 3093%Driver Training 0 0 0% 0 0%Declining Enrollment 0 0 0% 0 0%Extraordinary School Program 0 0 0% 0 0%Food Service 0 0 0% 0 0%Professional Development 25,787 27,218 6% 32,336 19%Parent Education Program 121,494 132,149 9% 141,724 7%Summer School 0 0 0% 0 0%Special Education 0 0 0% 0 0%Cost of Living 0 0 0% 0 0%Vocational Education 0 0 0% 0 0%Gifts/Grants 0 0 0% 0 0%Special Liability 0 0 0% 0 0%School Retirement 0 0 0% 0 0%Extraordinary Growth Facilities 0 0 0% 0 0%Special Reserve 0 0 0%KPERS Spec. Ret. Contribution 63,984 72,587 13% 117,954 63%Contingency Reserve 0 0 0%Text Book & Student Material 0 0 0%Bond & Interest #1 0 0 0% 0 0%Bond & Interest #2 0 0 0% 0 0%No-Fund Warrant 0 0 0% 0 0%Special Assessment 0 0 0% 0 0%Temporary Note 0 0 0% 0 0%
SUBTOTAL 705,357 769,789 9% 1,091,969 42%Enrollment (FTE)* 709.2 704.8 -1% 710.0 1%Amount per Pupil 995 1,092 10% 1,538 41%p p , ,
Adult Education 0 0 0% 0 0%Adult Supplemental Education 0 0 0% 0 0%Area Vocational School 0 0 0% 0 0%Tuition Reimbursement 0 0 0% 0 0%Special Education Coop 878,406 1,016,278 16% 990,675 -3%TOTAL 1,583,763 1,786,067 13% 2,082,644 17%Amount per Pupil $2,233 $2,534 13% $2,933 16%
NOTE: Gifts/Grants includes private grants and grants from nonfederal sources.
Amount per pupil excludes the following funds: Area Vocational School, Adult Education, Adult Supplemental Education,Special Education Coop and Tuition Reimbursement.
*Enrollment (FTE) includes the enrollment of the district used for state aid and budget authority, and all other preschool enrollmentand kindergarten students attending full time.
0
500,000
1,000,000
1,500,000
2,000,000
2,500,000
2006-2007 2007-2008 2008-2009
Student and Instructional Support Expenditures
10/8/2008 10:32 AM Sumexpen.xls Page 7 of 19
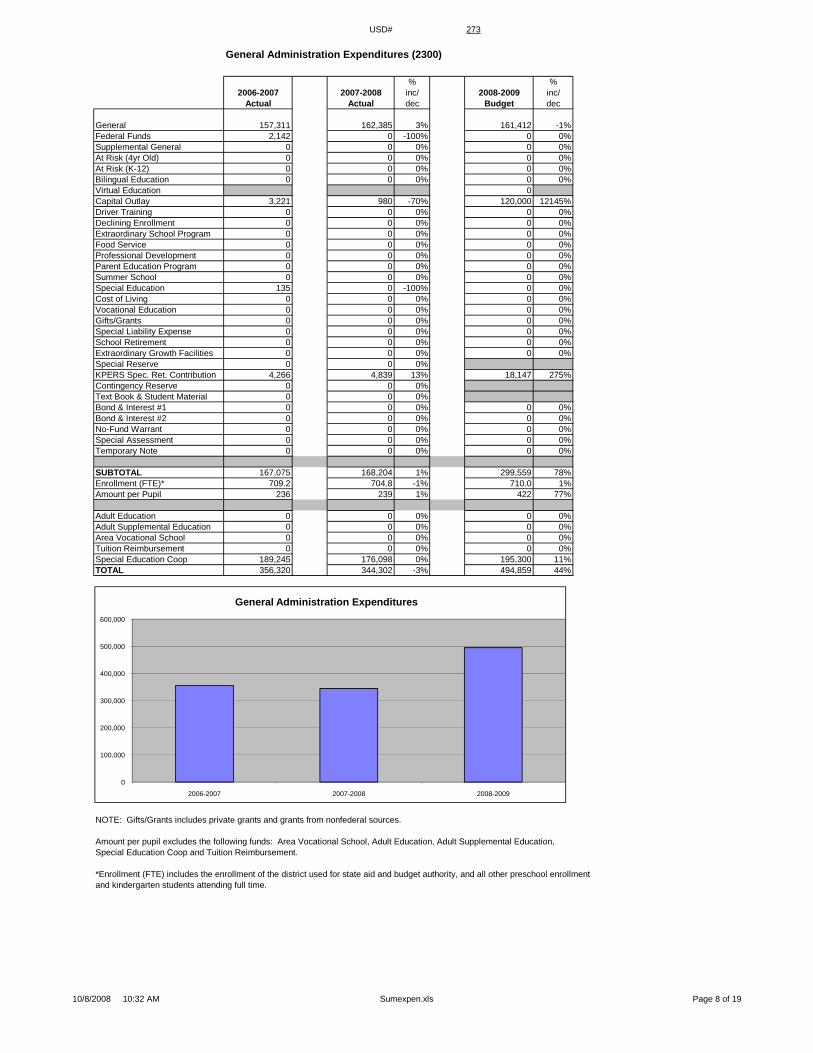
USD# 273
General Administration Expenditures (2300)
% %2006-2007 2007-2008 inc/ 2008-2009 inc/
Actual Actual dec Budget dec
General 157,311 162,385 3% 161,412 -1%Federal Funds 2,142 0 -100% 0 0%Supplemental General 0 0 0% 0 0%At Risk (4yr Old) 0 0 0% 0 0%At Risk (K-12) 0 0 0% 0 0%Bilingual Education 0 0 0% 0 0%Virtual Education 0Capital Outlay 3,221 980 -70% 120,000 12145%Driver Training 0 0 0% 0 0%Declining Enrollment 0 0 0% 0 0%Extraordinary School Program 0 0 0% 0 0%Food Service 0 0 0% 0 0%Professional Development 0 0 0% 0 0%Parent Education Program 0 0 0% 0 0%Summer School 0 0 0% 0 0%Special Education 135 0 -100% 0 0%Cost of Living 0 0 0% 0 0%Vocational Education 0 0 0% 0 0%Gifts/Grants 0 0 0% 0 0%Special Liability Expense 0 0 0% 0 0%School Retirement 0 0 0% 0 0%Extraordinary Growth Facilities 0 0 0% 0 0%Special Reserve 0 0 0%KPERS Spec. Ret. Contribution 4,266 4,839 13% 18,147 275%Contingency Reserve 0 0 0%Text Book & Student Material 0 0 0%Bond & Interest #1 0 0 0% 0 0%Bond & Interest #2 0 0 0% 0 0%No-Fund Warrant 0 0 0% 0 0%Special Assessment 0 0 0% 0 0%Temporary Note 0 0 0% 0 0%
SUBTOTAL 167,075 168,204 1% 299,559 78%Enrollment (FTE)* 709.2 704.8 -1% 710.0 1%A t P il 236 239 1% 422 77%Amount per Pupil 236 239 1% 422 77%
Adult Education 0 0 0% 0 0%Adult Supplemental Education 0 0 0% 0 0%Area Vocational School 0 0 0% 0 0%Tuition Reimbursement 0 0 0% 0 0%Special Education Coop 189,245 176,098 0% 195,300 11%TOTAL 356,320 344,302 -3% 494,859 44%
NOTE: Gifts/Grants includes private grants and grants from nonfederal sources.
Amount per pupil excludes the following funds: Area Vocational School, Adult Education, Adult Supplemental Education,Special Education Coop and Tuition Reimbursement.
*Enrollment (FTE) includes the enrollment of the district used for state aid and budget authority, and all other preschool enrollmentand kindergarten students attending full time.
0
100,000
200,000
300,000
400,000
500,000
600,000
2006-2007 2007-2008 2008-2009
General Administration Expenditures
10/8/2008 10:32 AM Sumexpen.xls Page 8 of 19

USD# 273
School Administration Expenditures (2400)
% %2006-2007 2007-2008 inc/ 2008-2009 inc/
Actual Actual dec Budget dec
General 444,158 441,745 -1% 444,340 1%Federal Funds 0 0 0% 0 0%Supplemental General 0 1,947 0% 0 -100%At Risk (4yr Old) 0 0 0% 0 0%At Risk (K-12) 0 0 0% 0 0%Bilingual Education 0 0 0% 0 0%Virtual Education 0Capital Outlay 1,609 90 -94% 20,000 22122%Driver Training 0 0 0% 0 0%Declining Enrollment 0 0 0% 0 0%Extraordinary School Program 0 0 0% 0 0%Food Service 0 0 0% 0 0%Professional Development 0 0 0% 0 0%Parent Education Program 0 0 0% 0 0%Summer School 0 0 0% 0 0%Special Education 0 0 0% 0 0%Cost of Living 0 0 0% 0 0%Vocational Education 0 0 0% 0 0%Gifts/Grants 0 0 0% 0 0%Special Liability Expense 0 0 0% 0 0%School Retirement 0 0 0% 0 0%Extraordinary Growth Facilities 0 0 0% 0 0%Special Reserve 0 0 0%KPERS Spec. Ret. Contribution 21,328 24,196 13% 30,245 25%Contingency Reserve 0 0 0%Text Book & Student Material 0 0 0%Bond & Interest #1 0 0 0% 0 0%Bond & Interest #2 0 0 0% 0 0%No-Fund Warrant 0 0 0% 0 0%Special Assessment 0 0 0% 0 0%Temporary Note 0 0 0% 0 0%
SUBTOTAL 467,095 467,978 0% 494,585 6%Enrollment (FTE)* 709.2 704.8 -1% 710.0 1%A t P il 659 664 1% 697 5%Amount per Pupil 659 664 1% 697 5%
Adult Education 0 0 0% 0 0%Adult Supplemental Education 0 0 0% 0 0%Area Vocational School 0 0 0% 0 0%Tuition Reimbursement 0 0 0% 0 0%Special Education Coop 0 0 0% 0 0%TOTAL 467,095 467,978 0% 494,585 6%
NOTE: Gifts/Grants includes private grants and grants from nonfederal sources.
Amount per pupil excludes the following funds: Area Vocational School, Adult Education, Adult Supplemental Education,Special Education Coop and Tuition Reimbursement.
*Enrollment (FTE) includes the enrollment of the district used for state aid and budget authority, and all other preschool enrollmentand kindergarten students attending full time.
0
100,000
200,000
300,000
400,000
500,000
600,000
2006-2007 2007-2008 2008-2009
School Administration Expenditures
10/8/2008 10:32 AM Sumexpen.xls Page 9 of 19
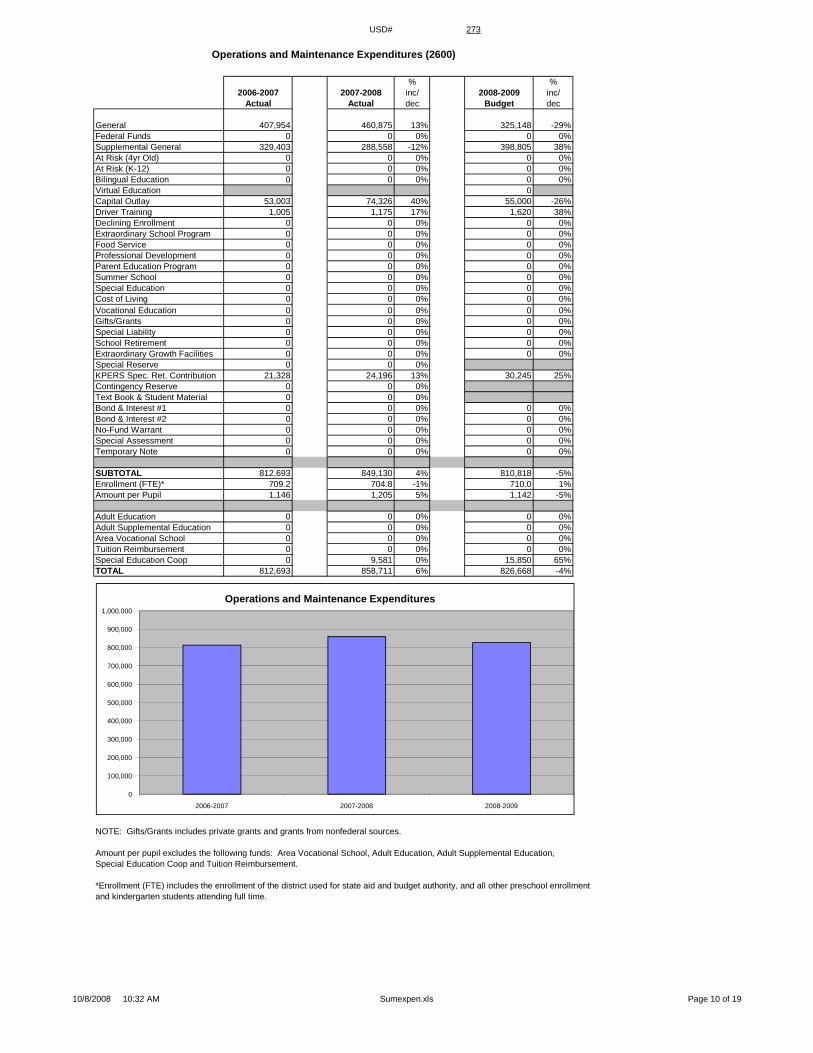
USD# 273
Operations and Maintenance Expenditures (2600)
% %2006-2007 2007-2008 inc/ 2008-2009 inc/
Actual Actual dec Budget dec
General 407,954 460,875 13% 325,148 -29%Federal Funds 0 0 0% 0 0%Supplemental General 329,403 288,558 -12% 398,805 38%At Risk (4yr Old) 0 0 0% 0 0%At Risk (K-12) 0 0 0% 0 0%Bilingual Education 0 0 0% 0 0%Virtual Education 0Capital Outlay 53,003 74,326 40% 55,000 -26%Driver Training 1,005 1,175 17% 1,620 38%Declining Enrollment 0 0 0% 0 0%Extraordinary School Program 0 0 0% 0 0%Food Service 0 0 0% 0 0%Professional Development 0 0 0% 0 0%Parent Education Program 0 0 0% 0 0%Summer School 0 0 0% 0 0%Special Education 0 0 0% 0 0%Cost of Living 0 0 0% 0 0%Vocational Education 0 0 0% 0 0%Gifts/Grants 0 0 0% 0 0%Special Liability 0 0 0% 0 0%School Retirement 0 0 0% 0 0%Extraordinary Growth Facilities 0 0 0% 0 0%Special Reserve 0 0 0%KPERS Spec. Ret. Contribution 21,328 24,196 13% 30,245 25%Contingency Reserve 0 0 0%Text Book & Student Material 0 0 0%Bond & Interest #1 0 0 0% 0 0%Bond & Interest #2 0 0 0% 0 0%No-Fund Warrant 0 0 0% 0 0%Special Assessment 0 0 0% 0 0%Temporary Note 0 0 0% 0 0%
SUBTOTAL 812,693 849,130 4% 810,818 -5%Enrollment (FTE)* 709.2 704.8 -1% 710.0 1%A t P il 1 146 1 205 5% 1 142 5%Amount per Pupil 1,146 1,205 5% 1,142 -5%
Adult Education 0 0 0% 0 0%Adult Supplemental Education 0 0 0% 0 0%Area Vocational School 0 0 0% 0 0%Tuition Reimbursement 0 0 0% 0 0%Special Education Coop 0 9,581 0% 15,850 65%TOTAL 812,693 858,711 6% 826,668 -4%
NOTE: Gifts/Grants includes private grants and grants from nonfederal sources.
Amount per pupil excludes the following funds: Area Vocational School, Adult Education, Adult Supplemental Education,Special Education Coop and Tuition Reimbursement.
*Enrollment (FTE) includes the enrollment of the district used for state aid and budget authority, and all other preschool enrollmentand kindergarten students attending full time.
0
100,000
200,000
300,000
400,000
500,000
600,000
700,000
800,000
900,000
1,000,000
2006-2007 2007-2008 2008-2009
Operations and Maintenance Expenditures
10/8/2008 10:32 AM Sumexpen.xls Page 10 of 19
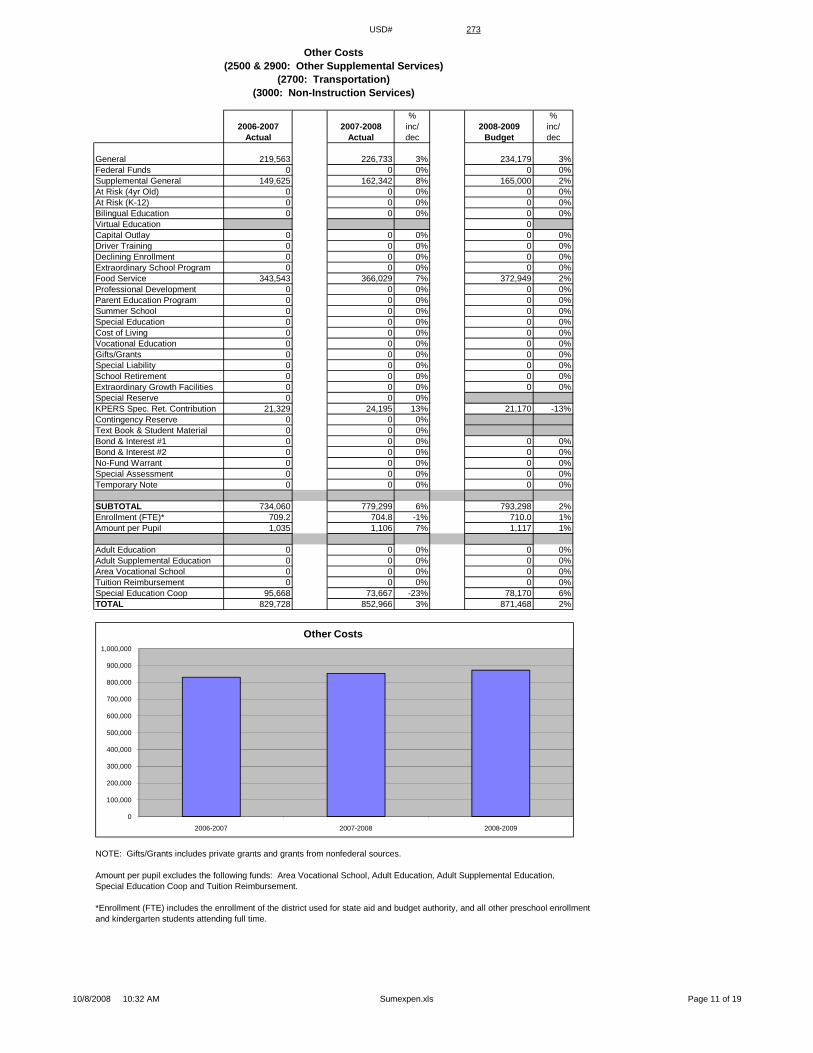
USD# 273
Other Costs(2500 & 2900: Other Supplemental Services)
(2700: Transportation)(3000: Non-Instruction Services)
% %2006-2007 2007-2008 inc/ 2008-2009 inc/
Actual Actual dec Budget dec
General 219,563 226,733 3% 234,179 3%Federal Funds 0 0 0% 0 0%Supplemental General 149,625 162,342 8% 165,000 2%At Risk (4yr Old) 0 0 0% 0 0%At Risk (K-12) 0 0 0% 0 0%Bilingual Education 0 0 0% 0 0%Virtual Education 0Capital Outlay 0 0 0% 0 0%Driver Training 0 0 0% 0 0%Declining Enrollment 0 0 0% 0 0%Extraordinary School Program 0 0 0% 0 0%Food Service 343,543 366,029 7% 372,949 2%Professional Development 0 0 0% 0 0%Parent Education Program 0 0 0% 0 0%Summer School 0 0 0% 0 0%Special Education 0 0 0% 0 0%Cost of Living 0 0 0% 0 0%Vocational Education 0 0 0% 0 0%Gifts/Grants 0 0 0% 0 0%Special Liability 0 0 0% 0 0%School Retirement 0 0 0% 0 0%Extraordinary Growth Facilities 0 0 0% 0 0%Special Reserve 0 0 0%KPERS Spec. Ret. Contribution 21,329 24,195 13% 21,170 -13%Contingency Reserve 0 0 0%Text Book & Student Material 0 0 0%Bond & Interest #1 0 0 0% 0 0%Bond & Interest #2 0 0 0% 0 0%No-Fund Warrant 0 0 0% 0 0%Special Assessment 0 0 0% 0 0%Temporary Note 0 0 0% 0 0%
SUBTOTAL 734,060 779,299 6% 793,298 2%Enrollment (FTE)* 709.2 704.8 -1% 710.0 1%Amount per Pupil 1,035 1,106 7% 1,117 1%
Adult Education 0 0 0% 0 0%Adult Supplemental Education 0 0 0% 0 0%Area Vocational School 0 0 0% 0 0%Tuition Reimbursement 0 0 0% 0 0%Special Education Coop 95,668 73,667 -23% 78,170 6%TOTAL 829,728 852,966 3% 871,468 2%
NOTE: Gifts/Grants includes private grants and grants from nonfederal sources.
Amount per pupil excludes the following funds: Area Vocational School, Adult Education, Adult Supplemental Education,Special Education Coop and Tuition Reimbursement.
*Enrollment (FTE) includes the enrollment of the district used for state aid and budget authority, and all other preschool enrollmentand kindergarten students attending full time.
0
100,000
200,000
300,000
400,000
500,000
600,000
700,000
800,000
900,000
1,000,000
2006-2007 2007-2008 2008-2009
Other Costs
10/8/2008 10:32 AM Sumexpen.xls Page 11 of 19
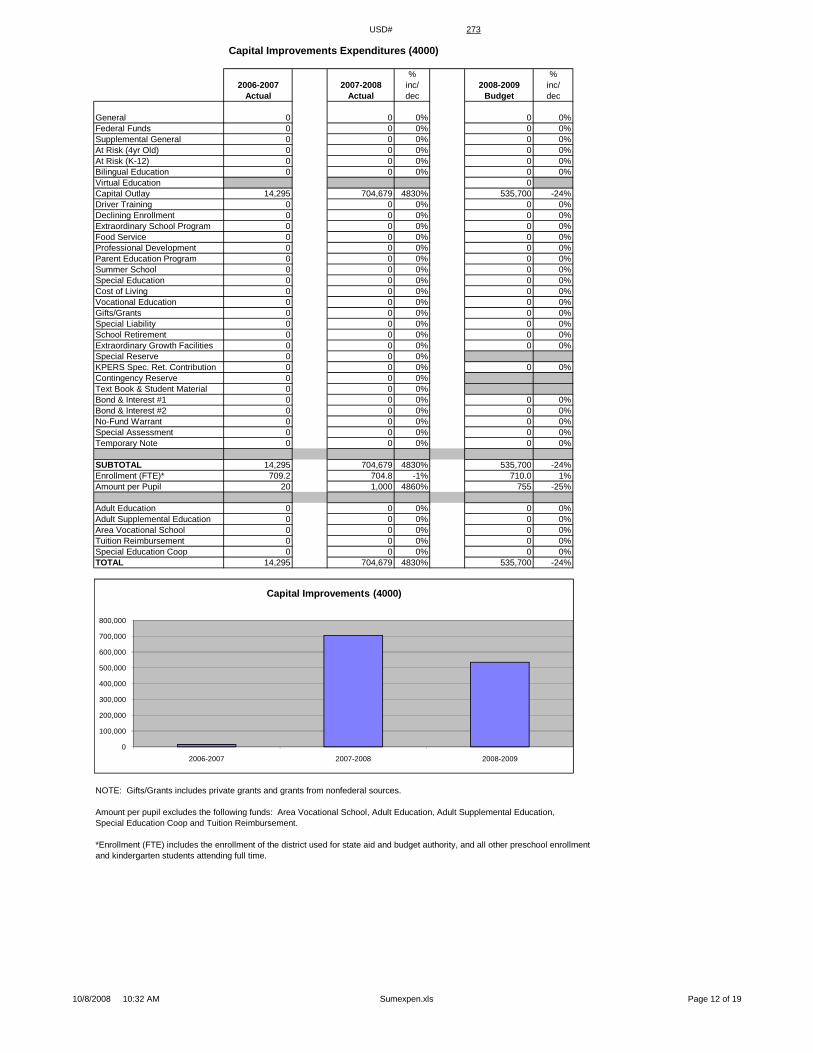
USD# 273
Capital Improvements Expenditures (4000)
% %2006-2007 2007-2008 inc/ 2008-2009 inc/
Actual Actual dec Budget dec
General 0 0 0% 0 0%Federal Funds 0 0 0% 0 0%Supplemental General 0 0 0% 0 0%At Risk (4yr Old) 0 0 0% 0 0%At Risk (K-12) 0 0 0% 0 0%Bilingual Education 0 0 0% 0 0%Virtual Education 0Capital Outlay 14,295 704,679 4830% 535,700 -24%Driver Training 0 0 0% 0 0%Declining Enrollment 0 0 0% 0 0%Extraordinary School Program 0 0 0% 0 0%Food Service 0 0 0% 0 0%Professional Development 0 0 0% 0 0%Parent Education Program 0 0 0% 0 0%Summer School 0 0 0% 0 0%Special Education 0 0 0% 0 0%Cost of Living 0 0 0% 0 0%Vocational Education 0 0 0% 0 0%Gifts/Grants 0 0 0% 0 0%Special Liability 0 0 0% 0 0%School Retirement 0 0 0% 0 0%Extraordinary Growth Facilities 0 0 0% 0 0%Special Reserve 0 0 0%KPERS Spec. Ret. Contribution 0 0 0% 0 0%Contingency Reserve 0 0 0%Text Book & Student Material 0 0 0%Bond & Interest #1 0 0 0% 0 0%Bond & Interest #2 0 0 0% 0 0%No-Fund Warrant 0 0 0% 0 0%Special Assessment 0 0 0% 0 0%Temporary Note 0 0 0% 0 0%
SUBTOTAL 14,295 704,679 4830% 535,700 -24%Enrollment (FTE)* 709.2 704.8 -1% 710.0 1%Amount per Pupil 20 1,000 4860% 755 -25%
Adult Education 0 0 0% 0 0%Adult Supplemental Education 0 0 0% 0 0%Area Vocational School 0 0 0% 0 0%Tuition Reimbursement 0 0 0% 0 0%Special Education Coop 0 0 0% 0 0%TOTAL 14,295 704,679 4830% 535,700 -24%
NOTE: Gifts/Grants includes private grants and grants from nonfederal sources.
Amount per pupil excludes the following funds: Area Vocational School, Adult Education, Adult Supplemental Education,Special Education Coop and Tuition Reimbursement.
*Enrollment (FTE) includes the enrollment of the district used for state aid and budget authority, and all other preschool enrollmentand kindergarten students attending full time.
0
100,000
200,000
300,000
400,000
500,000
600,000
700,000
800,000
2006-2007 2007-2008 2008-2009
Capital Improvements (4000)
10/8/2008 10:32 AM Sumexpen.xls Page 12 of 19
USD# 273
Debt Services Expenditures (5100)
% %2006-2007 2007-2008 inc/ 2008-2009 inc/
Actual Actual dec Budget dec
General 0 0 0% 0 0%Federal Funds 0 0 0% 0 0%Supplemental General 0 0 0% 0 0%At Risk (4yr Old) 0 0 0% 0 0%At Risk (K-12) 0 0 0% 0 0%Bilingual Education 0 0 0% 0 0%Virtual Education 0Capital Outlay 0 0 0% 0 0%Driver Training 0 0 0% 0 0%Declining Enrollment 0 0 0% 0 0%Extraordinary School Program 0 0 0% 0 0%Food Service 0 0 0% 0 0%Professional Development 0 0 0% 0 0%Parent Education Program 0 0 0% 0 0%Summer School 0 0 0% 0 0%Special Education 0 0 0% 0 0%Cost of Living 0 0 0% 0 0%Vocational Education 0 0 0% 0 0%Gifts/Grants 0 0 0% 0 0%Special Liability 0 0 0% 0 0%School Retirement 0 0 0% 0 0%Extraordinary Growth Facilities 0 0 0% 0 0%Special Reserve 0 0 0%KPERS Spec. Ret. Contribution 0 0 0% 0 0%Contingency Reserve 0 0 0%Text Book & Student Material 0 0 0%Bond & Interest #1 0 0 0% 0 0%Bond & Interest #2 0 0 0% 0 0%No-Fund Warrant 0 0 0% 0 0%Special Assessment 0 0 0% 0 0%Temporary Note 0 0 0% 0 0%
SUBTOTAL 0 0 0% 0 0%Enrollment (FTE)* 709.2 704.8 -1% 710.0 1%A t P il 0 0 0% 0 0%Amount per Pupil 0 0 0% 0 0%
Adult Education 0 0 0% 0 0%Adult Supplemental Education 0 0 0% 0 0%Area Vocational School 0 0 0% 0 0%Tuition Reimbursement 0 0 0% 0 0%Special Education Coop 0 0 0% 0 0%TOTAL 0 0 0% 0 0%
NOTE: Gifts/Grants includes private grants and grants from nonfederal sources.
Amount per pupil excludes the following funds: Area Vocational School, Adult Education, Adult Supplemental Education,Special Education Coop and Tuition Reimbursement.
*Enrollment (FTE) includes the enrollment of the district used for state aid and budget authority, and all other preschool enrollmentand kindergarten students attending full time.
00000111111
2006-2007 2007-2008 2008-2009
Debt Services (5100)
10/8/2008 10:32 AM Sumexpen.xls Page 13 of 19
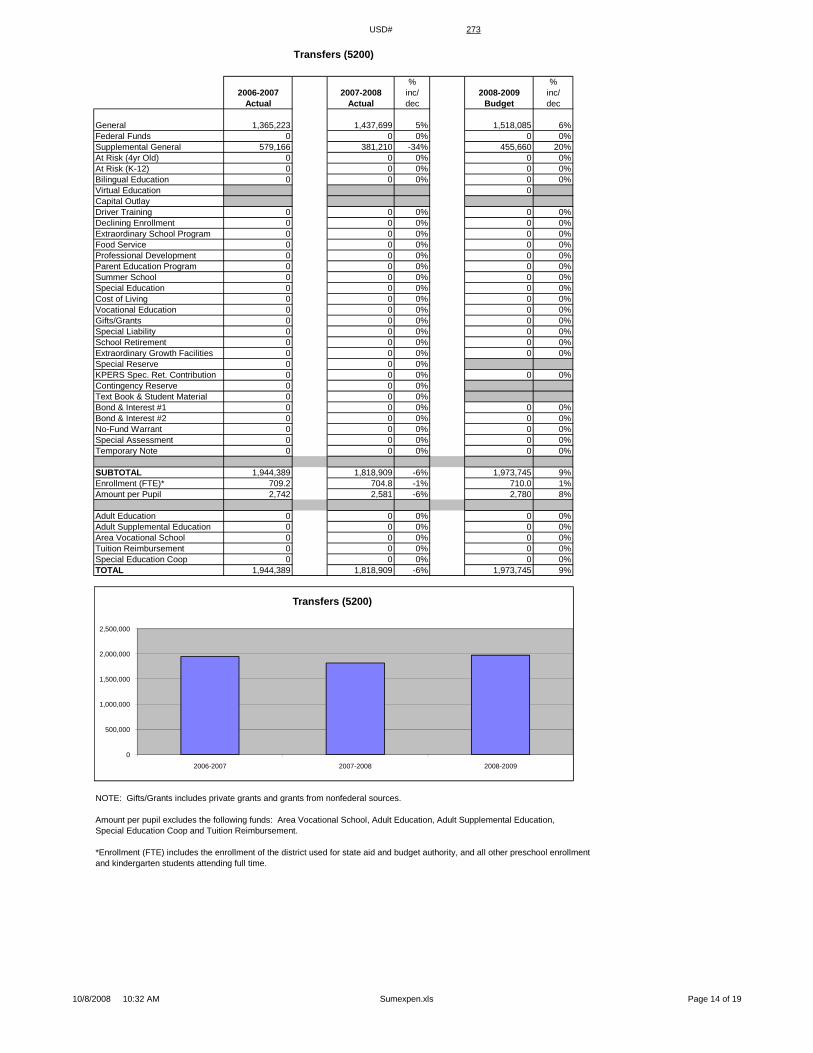
USD# 273
Transfers (5200)
% %2006-2007 2007-2008 inc/ 2008-2009 inc/
Actual Actual dec Budget dec
General 1,365,223 1,437,699 5% 1,518,085 6%Federal Funds 0 0 0% 0 0%Supplemental General 579,166 381,210 -34% 455,660 20%At Risk (4yr Old) 0 0 0% 0 0%At Risk (K-12) 0 0 0% 0 0%Bilingual Education 0 0 0% 0 0%Virtual Education 0Capital OutlayDriver Training 0 0 0% 0 0%Declining Enrollment 0 0 0% 0 0%Extraordinary School Program 0 0 0% 0 0%Food Service 0 0 0% 0 0%Professional Development 0 0 0% 0 0%Parent Education Program 0 0 0% 0 0%Summer School 0 0 0% 0 0%Special Education 0 0 0% 0 0%Cost of Living 0 0 0% 0 0%Vocational Education 0 0 0% 0 0%Gifts/Grants 0 0 0% 0 0%Special Liability 0 0 0% 0 0%School Retirement 0 0 0% 0 0%Extraordinary Growth Facilities 0 0 0% 0 0%Special Reserve 0 0 0%KPERS Spec. Ret. Contribution 0 0 0% 0 0%Contingency Reserve 0 0 0%Text Book & Student Material 0 0 0%Bond & Interest #1 0 0 0% 0 0%Bond & Interest #2 0 0 0% 0 0%No-Fund Warrant 0 0 0% 0 0%Special Assessment 0 0 0% 0 0%Temporary Note 0 0 0% 0 0%
SUBTOTAL 1,944,389 1,818,909 -6% 1,973,745 9%Enrollment (FTE)* 709.2 704.8 -1% 710.0 1%A t P il 2 742 2 581 6% 2 780 8%Amount per Pupil 2,742 2,581 -6% 2,780 8%
Adult Education 0 0 0% 0 0%Adult Supplemental Education 0 0 0% 0 0%Area Vocational School 0 0 0% 0 0%Tuition Reimbursement 0 0 0% 0 0%Special Education Coop 0 0 0% 0 0%TOTAL 1,944,389 1,818,909 -6% 1,973,745 9%
NOTE: Gifts/Grants includes private grants and grants from nonfederal sources.
Amount per pupil excludes the following funds: Area Vocational School, Adult Education, Adult Supplemental Education,Special Education Coop and Tuition Reimbursement.
*Enrollment (FTE) includes the enrollment of the district used for state aid and budget authority, and all other preschool enrollmentand kindergarten students attending full time.
0
500,000
1,000,000
1,500,000
2,000,000
2,500,000
2006-2007 2007-2008 2008-2009
Transfers (5200)
10/8/2008 10:32 AM Sumexpen.xls Page 14 of 19

USD# 273Miscellaneous Information
Unencumbered Cash Balance by Fund
July 1, 2006 July 1, 2007 July 1, 2008General 0 0 0Federal Funds 15,136 8,499 5,784Supplemental General 77,724 76,543 84,336At Risk (4yr Old) 0 0 0At Risk (K-12) 0 0 0Bilingual Education 0 0 0Virtual Education 0Capital Outlay 794,300 1,200,485 754,553Driver Training 11,920 14,338 18,341Declining Enrollment 0 0 0Extraordinary School Program 0 0 0Food Service 26,823 20,486 31,349Professional Development 260 0 2,336Parent Education Program 3,037 9,218 5,057Summer School 0 0 0Special Education 12,817 38,739 83,996Cost of Living 0 0Vocational Education 11,259 0 0Gifts/Grants 0 0 0Special Liability 0 0 0School Retirement 0 0 0Extraordinary Growth Facilities 0 0 0Special Reserve 155,995 427,998KPERS Spec. Ret. Contribution 0 0 0Contingency Reserve 231,130 231,130Text Book & Student Material 0 0Bond & Interest 1 0 0 0Bond & Interest 2 0 0 0No Fund Warrant 0 0 0Special Assessment 0 0 0Temporary Note 0 0 0
SUBTOTAL 1,340,401 2,027,436 985,752Enrollment (FTE)* 709.2 704.8 710.0Amount per Pupil 1,890 2,877 1,388
Adult Education 0 0 0Adult Supplemental Education 0 0 0Area Vocational School 0 0 0Tuition Reimbursement 0 0 0Special Education Coop 549,345 988,805 706,897TOTAL 1,889,746 3,016,241 1,692,649
NOTE: Gifts/Grants includes private grants and grants from nonfederal sources.
Amount per pupil excludes the following funds: Area Vocational School, Adult Education, Adult Supplemental Education,Special Education Coop and Tuition Reimbursement.
*Enrollment (FTE) includes the enrollment of the district used for state aid and budget authority, and all other preschool enrollmentand kindergarten students attending full time.
0
500,000
1,000,000
1,500,000
2,000,000
2,500,000
3,000,000
3,500,000
July 1, 2006 July 1, 2007 July 1, 2008
Unencumbered Cash Balances by Fund
10/8/2008 10:32 AM Sumexpen.xls Page 15 of 19
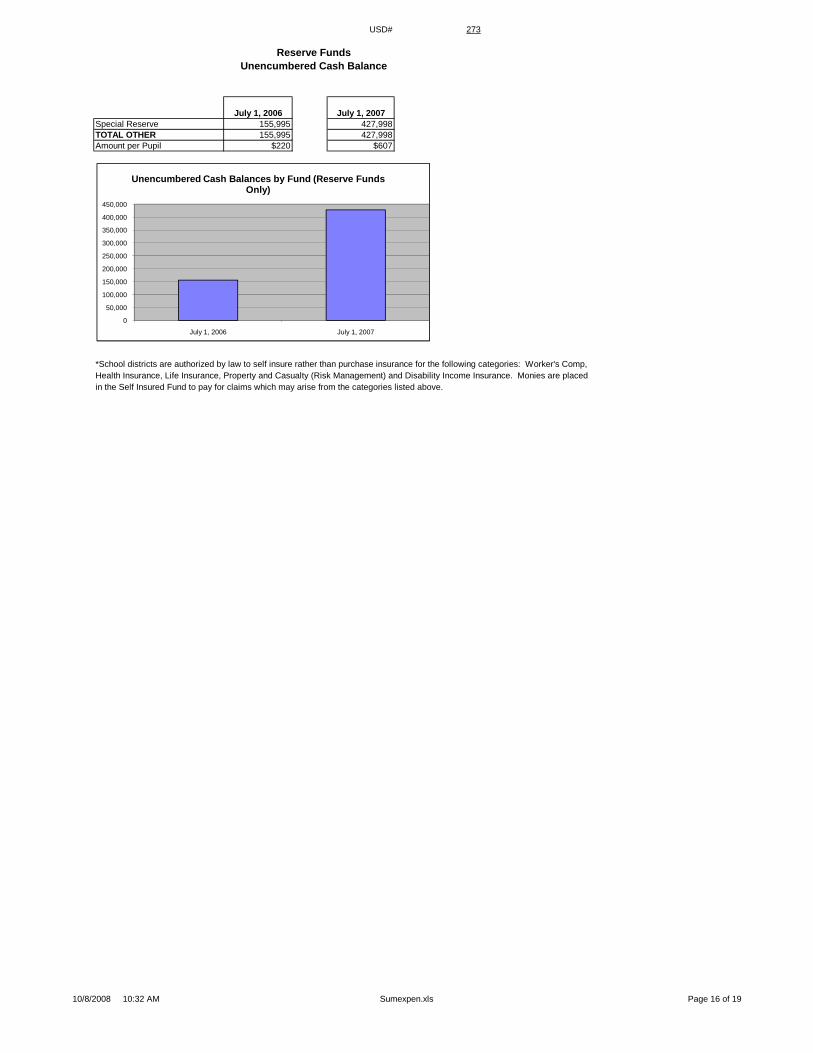
USD# 273
Reserve FundsUnencumbered Cash Balance
July 1, 2006 July 1, 2007Special Reserve 155,995 427,998TOTAL OTHER 155,995 427,998Amount per Pupil $220 $607
*School districts are authorized by law to self insure rather than purchase insurance for the following categories: Worker's Comp,Health Insurance, Life Insurance, Property and Casualty (Risk Management) and Disability Income Insurance. Monies are placedin the Self Insured Fund to pay for claims which may arise from the categories listed above.
0
50,000
100,000
150,000
200,000
250,000
300,000
350,000
400,000
450,000
July 1, 2006 July 1, 2007
Unencumbered Cash Balances by Fund (Reserve Funds Only)
10/8/2008 10:32 AM Sumexpen.xls Page 16 of 19
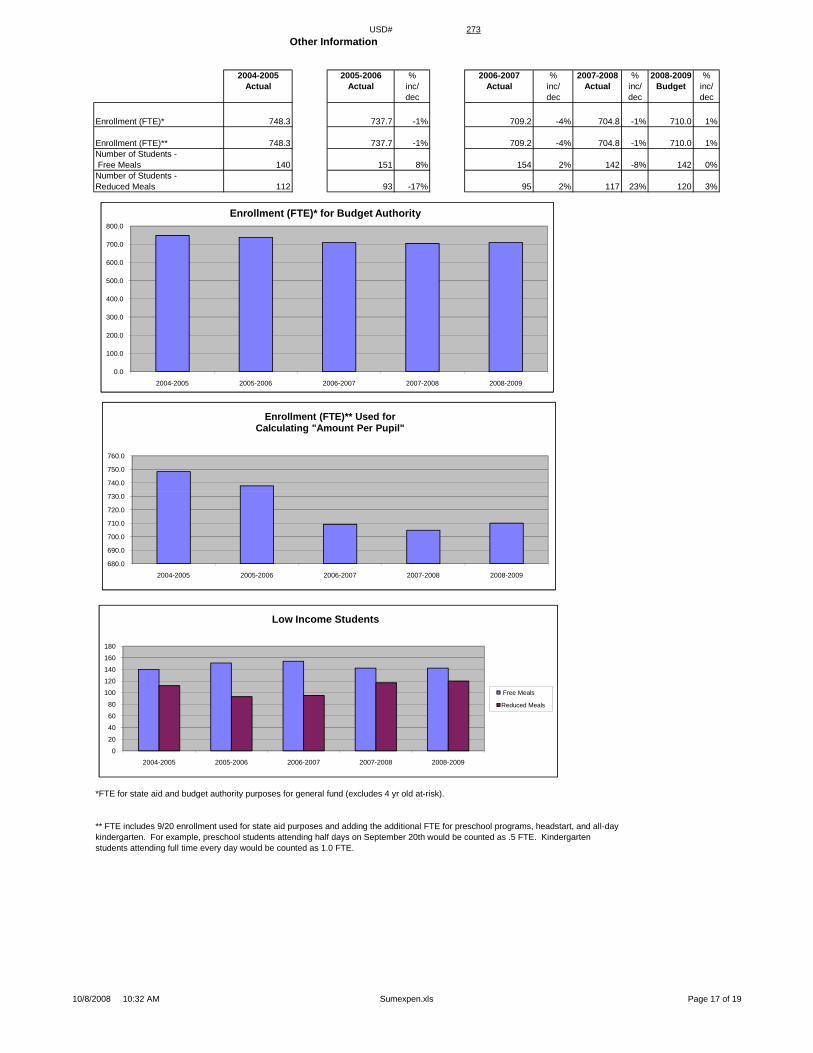
USD# 273Other Information
2004-2005 2005-2006 % 2006-2007 % 2007-2008 % 2008-2009 %Actual Actual inc/ Actual inc/ Actual inc/ Budget inc/
dec dec dec dec
Enrollment (FTE)* 748.3 737.7 -1% 709.2 -4% 704.8 -1% 710.0 1%
Enrollment (FTE)** 748.3 737.7 -1% 709.2 -4% 704.8 -1% 710.0 1%Number of Students - Free Meals 140 151 8% 154 2% 142 -8% 142 0%Number of Students - Reduced Meals 112 93 -17% 95 2% 117 23% 120 3%
0.0
100.0
200.0
300.0
400.0
500.0
600.0
700.0
800.0
2004-2005 2005-2006 2006-2007 2007-2008 2008-2009
Enrollment (FTE)* for Budget Authority
740.0
750.0
760.0
Enrollment (FTE)** Used for Calculating "Amount Per Pupil"
*FTE for state aid and budget authority purposes for general fund (excludes 4 yr old at-risk).
** FTE includes 9/20 enrollment used for state aid purposes and adding the additional FTE for preschool programs, headstart, and all-daykindergarten. For example, preschool students attending half days on September 20th would be counted as .5 FTE. Kindergartenstudents attending full time every day would be counted as 1.0 FTE.
0
20
40
60
80
100
120
140
160
180
2004-2005 2005-2006 2006-2007 2007-2008 2008-2009
Low Income Students
Free Meals
Reduced Meals
680.0
690.0
700.0
710.0
720.0
730.0
2004-2005 2005-2006 2006-2007 2007-2008 2008-2009
10/8/2008 10:32 AM Sumexpen.xls Page 17 of 19

USD# 273
Miscellaneous InformationMill Rates by Fund
2006-2007 2007-2008 2008-2009Actual Actual Budget
General 20.000 20.000 20.000Supplemental General 22.570 22.290 21.874Adult Education 0.000 0.000 0.000Capital Outlay 6.010 5.840 6.000Declining Enrollment 0.000 0.000 0.000Cost of Living 0.000 0.000 0.000Special Liability 0.000 0.000 0.000School Retirement 0.000 0.000 0.000Extraordinary Growth Facilities 0.000 0.000 0.000Bond & Interest 1 0.000 0.000 0.000Bond & Interest 2 0.000 0.000 0.000No Fund Warrant 0.000 0.000 0.000Special Assessment 0.000 0.000 0.000Temporary Note 0.000 0.000 0.000TOTAL USD 48.580 48.130 47.874Historical Museum 0.000 0.000 0.000Public Library Board 0.000 0.000 0.000Public Library Brd & Emp Benf 0.000 0.000 0.000Recreation Commission 0.000 0.000 0.000Recreation Commission Employee Benefit 0.000 0.000 0.000TOTAL OTHER 0.000 0.000 0.000
20.000
30.000
40.000
50.000
60.000
Total USD Mill Rates
General42%
Supplemental General46%
Capital Outlay12%
2008-2009 Miscellaneous InformationMill Rates by Fund (Total USD)
General
Supplemental General
Adult Education
Capital Outlay
Special Liability
School Retirement
Declining Enrollment
Cost of Living
Bond & Interest 1
Bond & Interest 2
Extraordinary Growth Facilities
No Fund Warrant
Special Assessment
Temporary Note
0.000
10.000
0 000
2006-2007 2007-2008 2008-2009
10/8/2008 10:32 AM Sumexpen.xls Page 18 of 19

USD# 273Other Information
2006-2007 2007-2008 2008-2009Actual Actual Budget
Assessed Valuation $40,108,664 $39,638,050 $39,603,357
Bonded Indebtedness $0 $0 $0
$0
$5,000,000
$10,000,000
$15,000,000
$20,000,000
$25,000,000
$30,000,000
$35,000,000
$40,000,000
$45,000,000
2006-2007 2007-2008 2008-2009
Assessed Valuation
$0
$0
$0
$0
$1
$1
$1
$1
$1
$1
Bonded Indebtedness
$0
$0
2006-2007 2007-2008 2008-2009
10/8/2008 10:32 AM Sumexpen.xls Page 19 of 19